

The Evolution and Factors Affecting the Distribution Industry in Poverty-Stricken Counties of Henan Province, China

School of Logistics and Transportation, Central South University of Forestry and Technology, Changsha 410004, China
*
Author to whom correspondence should be addressed.
Sustainability 2023, 15(7), 6302; https://doi.org/10.3390/su15076302
Submission received: 20 January 2023
/
Revised: 25 March 2023
/
Accepted: 26 March 2023
/
Published: 6 April 2023
(This article belongs to the Special Issue Bridging the Rural-Urban Divide: Towards Universally Sustainable Regional Economic Development)
Abstract
:Under the background of rural revitalization and domestic and international double circulation, vigorously developing the rural distribution industry is an important measure needed to accelerate the process of urban–rural integration, and to enhance the effect of poverty alleviation. In this study, 36 poverty-stricken counties in the southeast of Henan Province, China were selected as research objects; the evolution characteristics and factors influencing the counties’ distribution industries and their development were studied, using the modified gravity model, exploratory spatial data analysis, and a spatial econometric model. The overall scale of the county-level distribution industry in the poverty-stricken areas of southeast Henan expanded, but regional development was uneven, and a spatial pattern of “high in the northeast–low in the southwest” was demonstrated. Meanwhile, the development of the distribution industry in the counties of the district had a circular spatial trend of “agglomeration–diffusion–agglomeration”, with a significant local spatial polarization effect. In addition, the technology level, market demand, population size, and industrial structure adjustment had positive spatial spillover effects on the development of counties’ distribution industries, while labor and capital exerted negative spatial spillover effects. On this basis, to promote the interactive development of the distribution industry and rural economic growth and further accelerate the process of urban–rural integration, we should continually optimize the spatial layout of the distribution industry, improve the construction of county-level circulation infrastructure, and boost new circulation formats and models.
1. Introduction
With the rapid progress of industrialization and urbanization, the gap between urban and rural areas is widening. Rural decline has become an important issue that all countries need to face together [1]. China has created a new model that integrates poverty alleviation with rural revitalization, in terms of rural poverty alleviation, development, and revitalization. However, pressing questions remain about how to consolidate the existing achievements of poverty alleviation and to prevent rural households from regressing to poverty, especially in continuously poverty-stricken areas [2]. Exploring the development status of relevant industries in poverty-stricken areas before 2020 during the critical period of poverty alleviation is of great practical significance for the subsequent sustainable development of them. It can also provide experience and a reference for poverty alleviation in poverty-stricken areas in other countries.
In the stage of the new development of the continuous promotion of rural revitalization, counties (the county, as one of the administrative divisions in China, is under the jurisdiction of prefecture level cities, regions, autonomous prefectures, leagues, and municipalities directly under the Central Government, or directly under the jurisdiction of provinces. The functions of a county’s government focus on the countryside), as an indispensable part of promoting the integrated economic development of urban and rural areas, play an important role as space carriers to connect cities, serve villages, and promote rural urbanization and modernization. Taking the county as a carrier is an important engine for rural revitalization under the new development pattern, a key link for poverty alleviation, and an important carrier for further promoting new rural modernization, coordinating the implementation of the rural revitalization strategy, and achieving high-quality development in terms of urban–rural integration.
The distribution industry includes wholesale and retail, logistics, accommodation and catering, etc. The existing literature mostly analyzes the distribution industry from the dimensions of several aspects, such as wholesale and retail, logistics, accommodation and catering [3,4,5]. However, no research has been found from the entire distribution industry. It is related to the current indicators selected in the research. This study selected the total retail sales of social consumer goods that can reflect the comprehensive level of the distribution industry, and analyzed the distribution industry of 36 poverty-stricken counties in Henan more comprehensively.
Academic circles have long been evaluating the development and efficiency of the distribution industry [6], and generally believe that the distribution industry not only directly affects economic growth [7], but also significantly promotes poverty alleviation through spillover effects [8]. It plays an important role in promoting employment, accelerating the optimization and upgrading of industrial structures, and consolidating the effect of poverty alleviation [9,10]. Establishing a modern circulation system is more important to eliminate domestic big-cycle blockages. It is an important task to promote the new development pattern of international and domestic double circulation, especially in a county, which is the bridge between a city and village.
In summary, domestic and foreign research on the development of the distribution industry and its influencing factors mainly focuses on national, provincial, or prefecture-level cities; little research has been undertaken with reference to individual counties. The research into typical contiguous poverty-relief areas has been sparse, and the analysis of industrial spatial dependence and spatial heterogeneity has been insufficient. In the post-poverty-alleviation era, the consolidation of poverty alleviation achievements in poverty alleviation areas is faced with the problem of imbalance and inadequacy [11], and the imbalance of the spatial structure of urban and rural commercial circulation has become aggravated [12]. Moreover, the quantitative analysis of the internal mechanism and factors influencing this problem remains insufficient, and there is a lack of relevant empirical research based on spatial structure. Few achievements have been made in discussing rural revitalization from the perspective of revitalizing the distribution industry.
Based on this, from the perspective of spatial research, attention was focused on the space–time dynamic characteristics and spatial differences in the development of the distribution industry in 36 poverty-stricken counties in Henan; practical policy measures were recommended, with a view to providing a reference for releasing the economic effects of the distribution industry, and boosting rural revitalization.
2. Literature Review
2.1. Distribution Industry and Poverty Alleviation
Poverty is a challenge facing all countries: promoting development, narrowing the gap between urban and rural areas, eliminating poverty, and achieving common prosperity are ideals that mankind is constantly pursuing [13]. Under the background of rural economic development and urban–rural integration, the distribution industry and urbanization poverty alleviation have a synergistic effect [14]. The development of the distribution industry can significantly promote rural poverty reduction, mainly through an economic development effect, industrial structure adjustment effect, employment growth effect, and vertical integration of the supply chain [15]. The effect of developing the distribution industry on poverty reduction is achieved through the path of economic growth, which has direct effects, while it has both direct and indirect effects on the adjustment of income distribution [16].
The distribution industry discussed herein does not have a unified definition, so the most important retail industry was selected to analyze the research of other scholars. It is necessary to develop small retail industries, which can play a positive role in poverty alleviation, and promote rural economic development [17]. Moreover, e-commerce can help boost the stagnant rural economy and alleviate poverty in rural China and beyond [18]. The balanced combination of food, other retail stores, and the catering industry can promote sound commercial circulation and ensure the good development of a town [19]. Commercialization has a positive influence on poverty alleviation, and the retail market and local market are the current sales channels [20], especially in poverty-stricken areas.
2.2. County Economy and Rural Development
A county’s economy can promote rural revitalization from three aspects, urban–rural integration, effective governance, and green development; all of them have the same development goal and good coupling relationship in practice [21]. In promoting the implementation of targeted poverty alleviation policies, the accuracy of measures from multiple perspectives must be improved on the basis of economic development, thus ensuring the realization of the 2020 poverty reduction goal, laying a solid foundation for rural revitalization, and building a moderately prosperous society in a holistic manner [22]. The development of digital inclusive finance can help alleviate the problems of the “three rural areas”, and contribute to rural revitalization [23]. China’s county economy and rural development have experienced a long-term evolution, from inhibition to rapid and unbalanced development, and then to sound interaction. The economic spillover between counties and villages and the driving role of county economy in rural development have gradually become prominent [24].
Developing the digital potential of rural areas was found to be critical to the future of rural businesses, rural communities, and the UK economy as a whole, according to Pattanapong et al. 2022 [25]. To solve important social problems and achieve changes in rural economic development, the government should be supported to ensure that sustainable rural development strategies are formulated under the conditions of economic growth and social transformation [26]. E-commerce brings opportunities to people living in rural and remote areas, and is an effective way in which to improve living standards and reduce poverty [27].
3. Study Area and Data Sources
3.1. Study Area
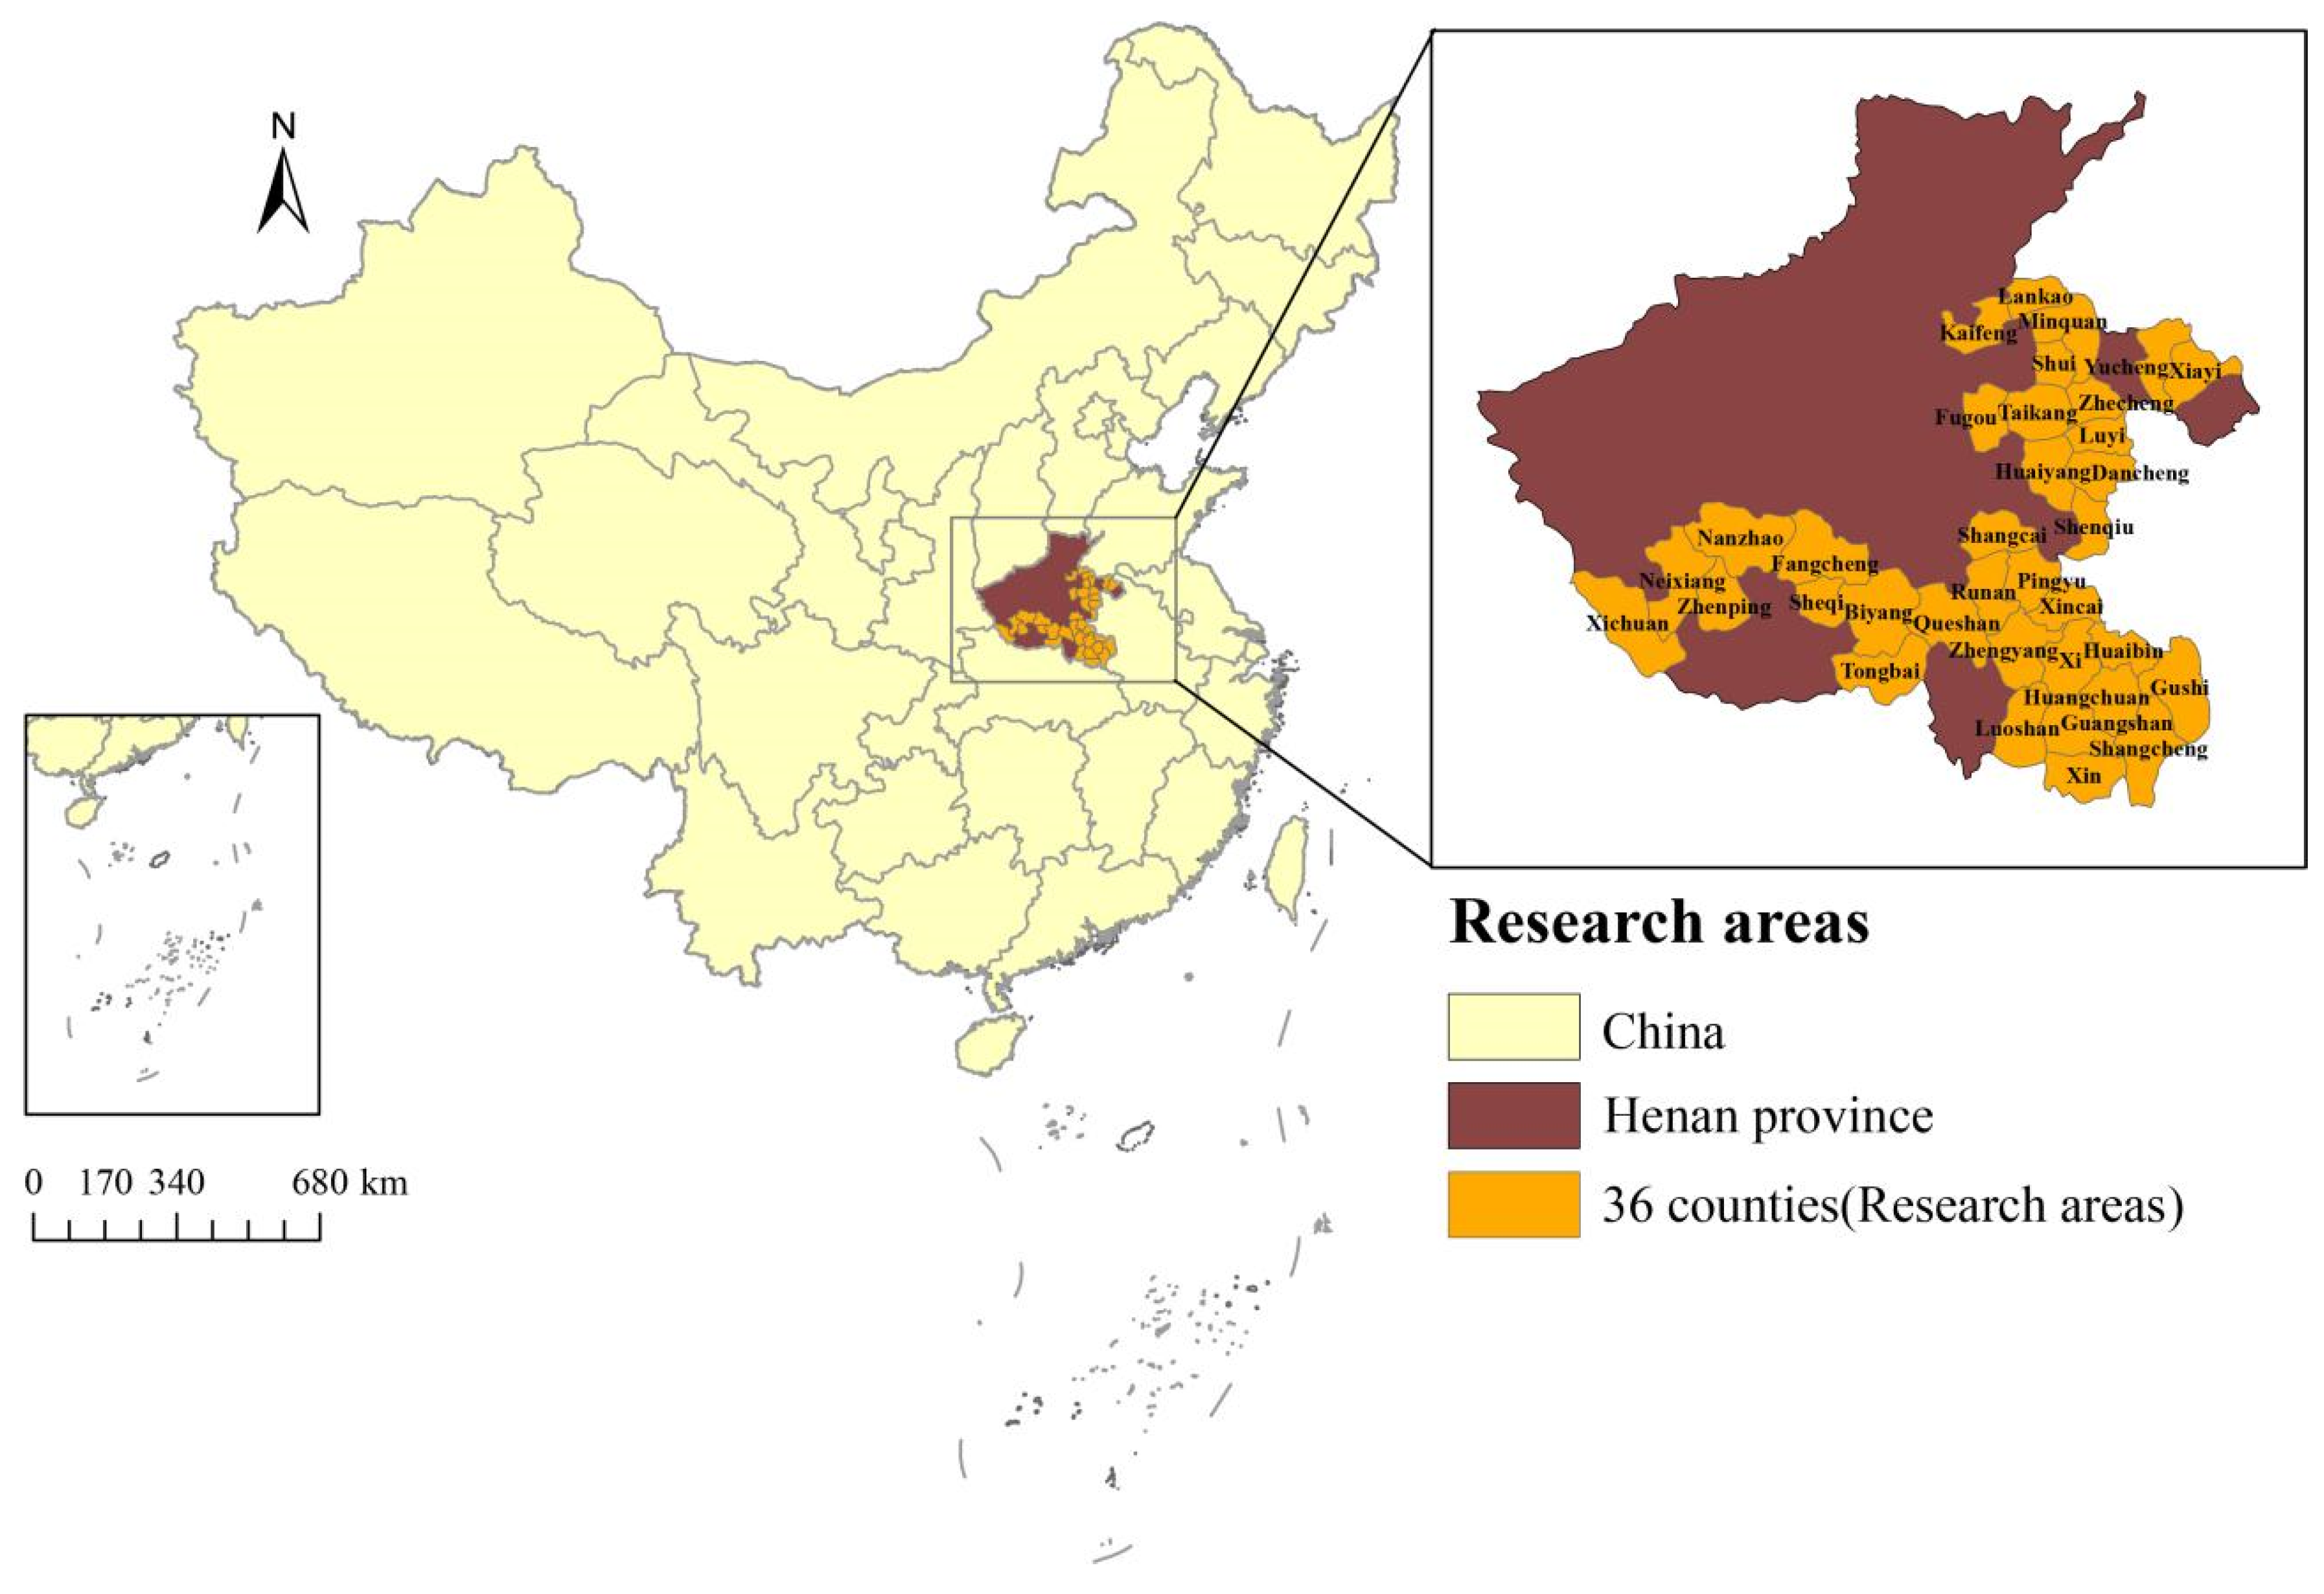
Henan is the province with the largest rural population in China, and its poverty-stricken counties are mainly concentrated in the eastern and southern regions. Its distribution industry, including wholesale, retail and logistics industries, can be relatively developed. Exploring the space–time development of the distribution industry and its influencing factors in this region is of great significance to promoting rural revitalization, and consolidating the effect of poverty alleviation. On the other hand, the urbanization of the county economy in China is still in its infancy; the starting point of digitization and informatization is relatively low, and data resource managers lack autonomy, resulting in incomplete data statistics such as yearbooks, and a paucity of relevant research. Therefore, this study focused on 36 poverty-stricken counties in the eastern and southern regions of Henan (Figure 1).
3.2. Data Sources
The Three-Year Action Plan for Poverty Alleviation by the Agricultural Industry in Henan Province (2018–2020) mentioned that the eastern and southern areas of Henan cover 36 poverty-stricken counties (cities and districts) under the jurisdiction of Kaifeng, Nanyang, Shangqiu, Xinyang, Zhoukou, and Zhumadian, with a total area of 59,700 km2, accounting for 67.9% of the 53 poverty-stricken counties in Henan. In 2020, the total retail sales of social consumer goods in 36 counties amounted to 56.07 billion dollars, accounting for only 17.60% of the province’s total. The distribution industry in this region is in a less well-developed position compared with other regions in the province. Therefore, it was necessary to study the spatial–temporal development of the distribution industry in this region and its influencing factors, in order to promote rural revitalization and consolidate the effect of poverty alleviation.
The data used in this paper were sourced mainly from the EPS global data statistics platform: (http://olap.epsnet.com.cn/data-resource.html, accessed on 9 November 2022) and the Statistical Yearbook of Henan Province (2010–2021). Individual missing data should be supplemented by interpolation.
4. Methods
4.1. Modified Gravitational Model
To determine the characteristics of the spatial connection network of the distribution industry in counties, this research drew on the practices of relevant scholars, and took the counties (cities and districts) in the region as the nodes of the spatial network. The gravitational model was used to explore the size of the spatial connection between the network nodes measured by the gravitational intensity of the distribution industry in the counties in the research region and their surrounding areas. Here, the gravity model was modified using the time cost distance of road travel between the counties. The specific calculation formula is as follows:
where represents the degree of connectivity of distribution economy between region i and region j; P and V denote the total population and the development level of the county distribution industry in different regions; represents the GDP per capita; denotes the actual distance from i to j; is the connection volume of the distribution economy in region i.
4.2. Exploratory Spatial Data Analysis
To begin with, global spatial autocorrelation was used to test whether the development of a county’s distribution industry had spatial autocorrelation. If the Global Moran’s I-index was significantly regular, it indicated that the county had spatial agglomeration characteristics. Then, the local index was adopted to identify high values (hot spots) and low values (cold spots) in clustered areas of the distribution industry development in different regions, and comprehensively reveal the spatial characteristics of the development of a county’s distribution industry.
4.3. Spatial Measurement Analysis
Based on the setting of classical C-D production function, labor, capital, technical level, market demand, industrial structure, population size, and other factors were introduced into the model, and spatial lag (SAR), spatial error (SEM), and spatial Dubin panel (SDM) data models were established as follows:
where i denotes 36 counties; t represents time; y is the level of development of the distribution industry in each county; k, l, c represent capital, labor, and technical level, respectively; ts represents industrial structure; pcw denotes market demand factors; pop represents population size; ~ are coefficients of the selected explanatory variables, , denotes a random error term; represents the spatial weight matrix; in Equation (5) is the vector composed of the explanatory variables in Equation (3); refers to spatial autoregressive coefficient; represents the spatial error coefficient; is the regression coefficient influenced by itself and other independent variables; represents the space weight matrix, neighbor matrices established based on the “rook” principle (W1). The weight matrix of geographic distance was established using the reciprocal of the geographical distance between the two places (W2); the traffic distance matrix was constructed with 100 km as the distance threshold, with reference to Anselin et al. [28] (W3); represents individual effects; refers to temporal effects.
5. Results
5.1. Analysis of Distribution Industry Evolution in Poverty-Stricken Counties in Southeast Henan
5.1.1. Overall Analysis of the Spatial Characteristics of County Distribution Industry
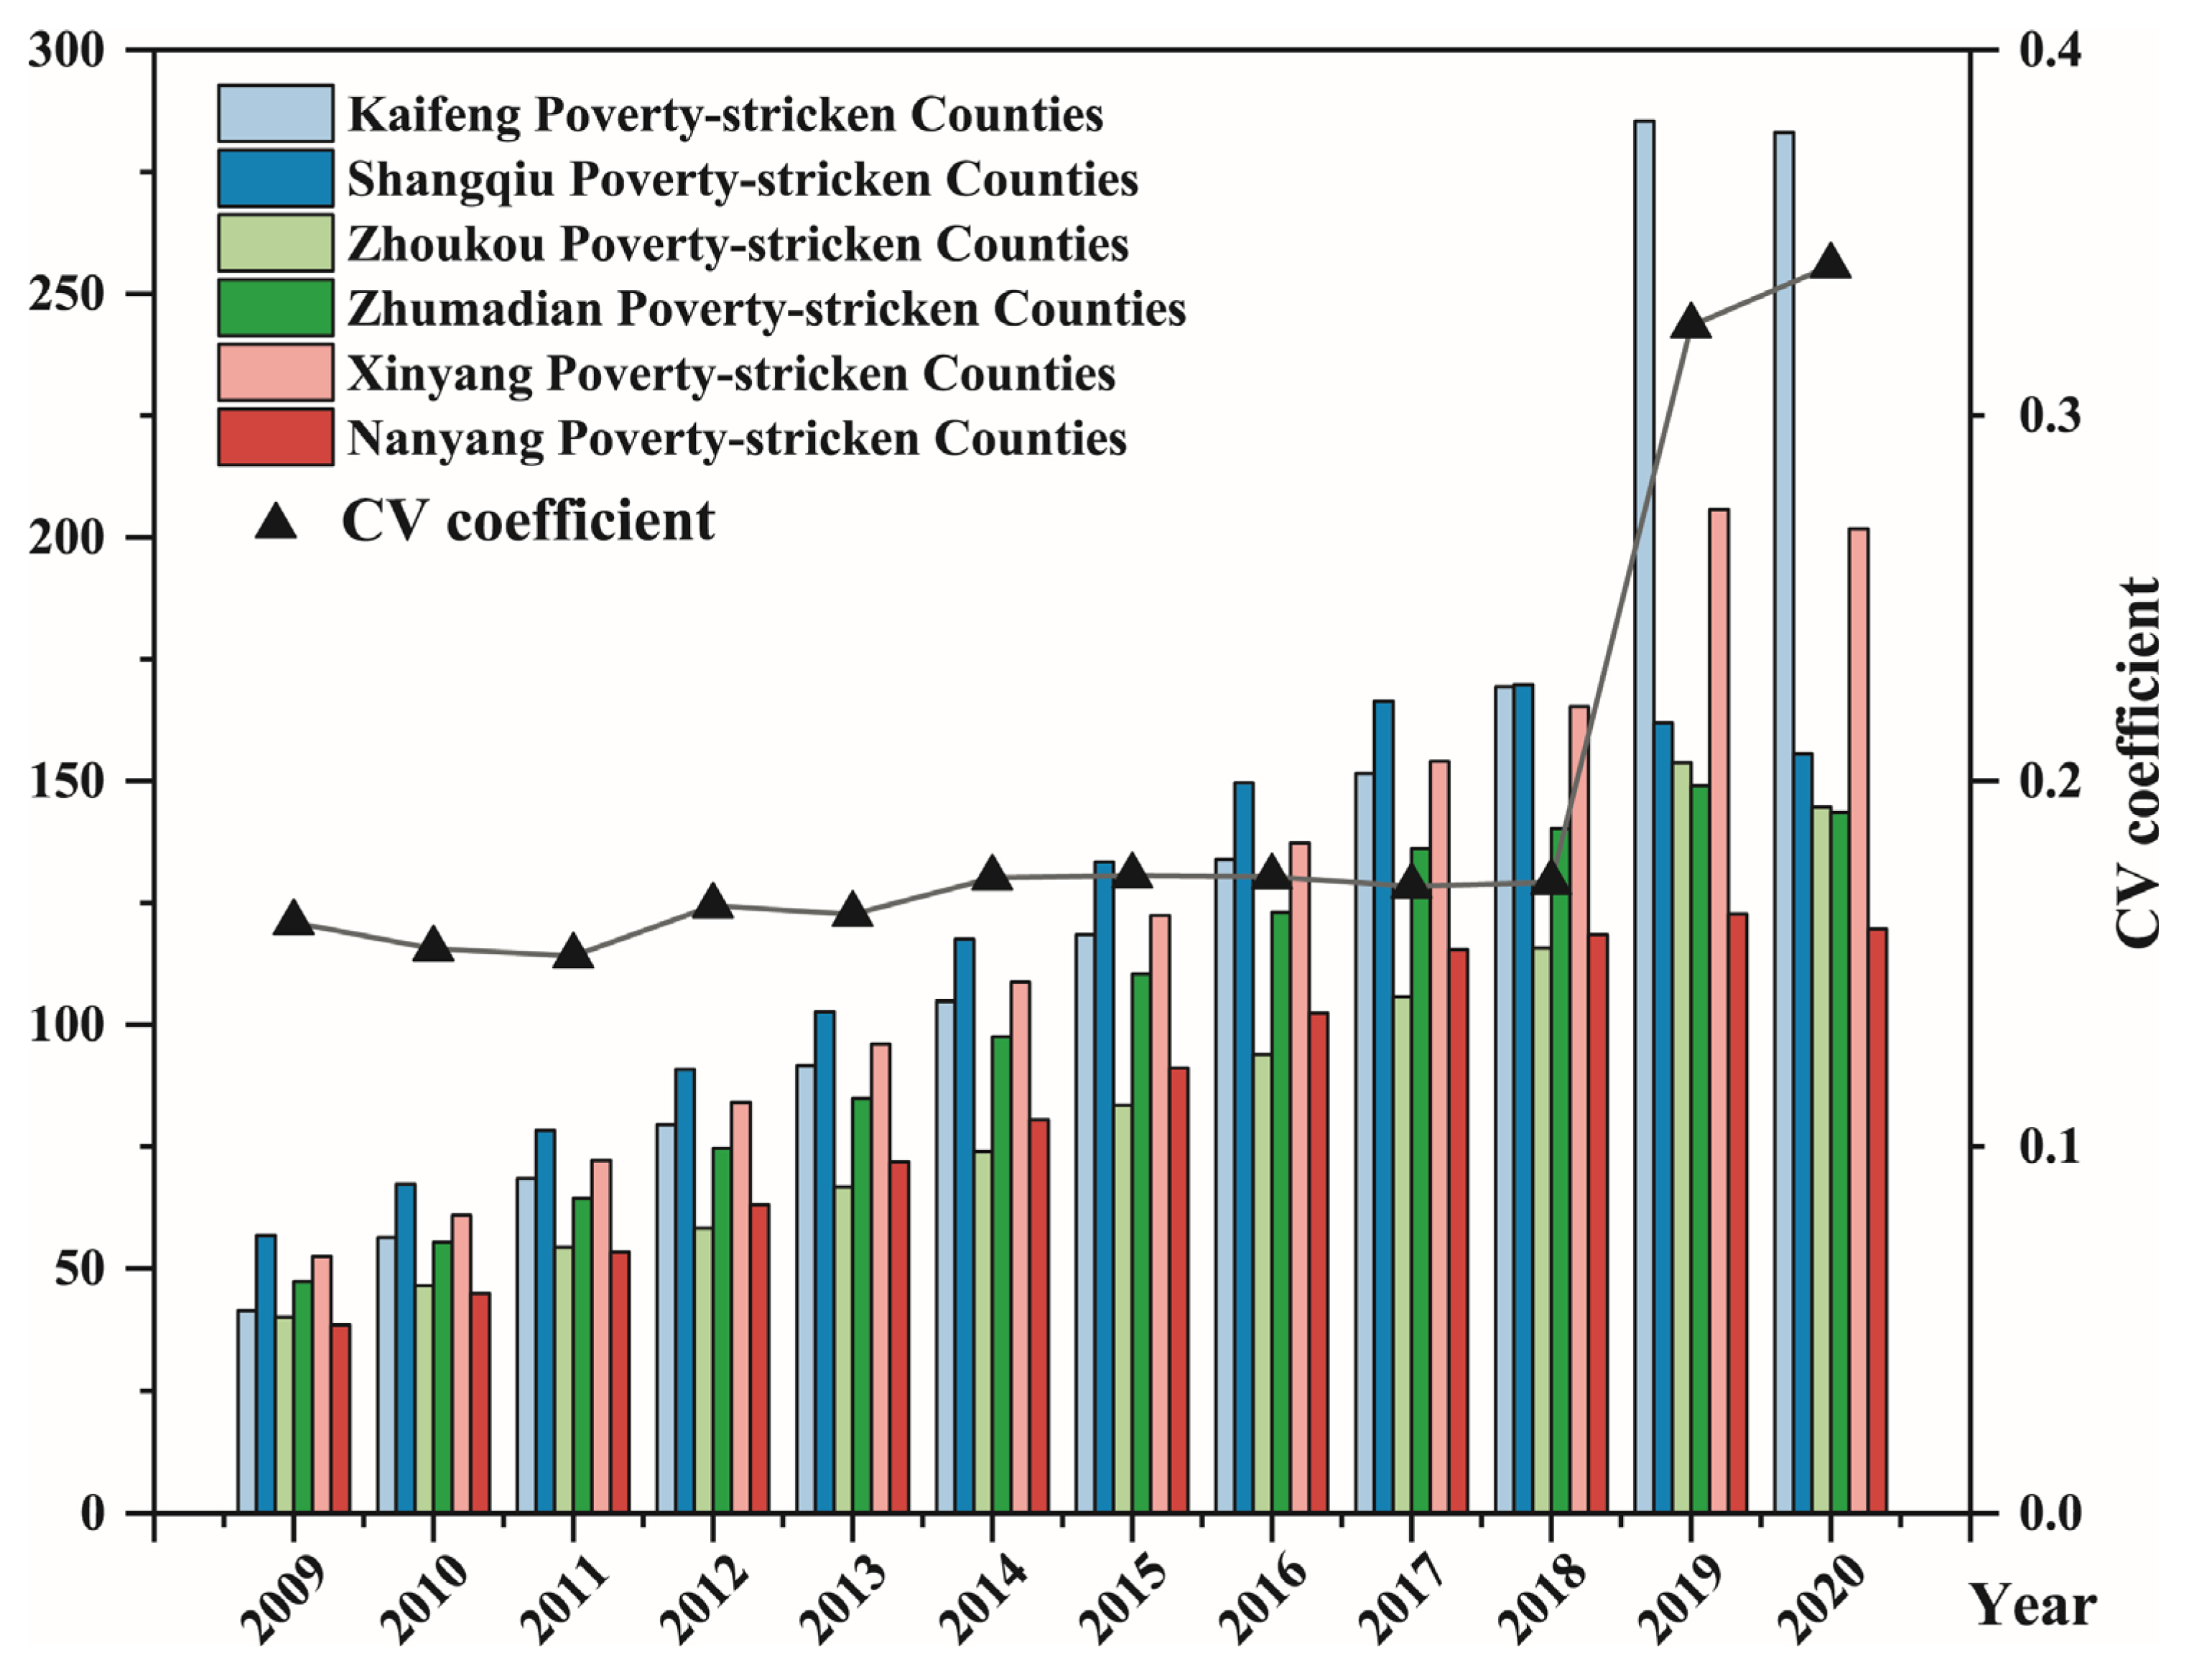
Based on the availability and continuity of data, this research took the total retail sales of consumer goods as the measurement index of the development level of the distribution industry, and plotted the timing characteristics of the development of the county’s distribution industry in the area (Figure 2). Meanwhile, the spatial development trend of county distribution industries was studied through the coefficient of variation CV (the ratio of the standard deviation to the mean average).
As shown in Figure 2, from 2009 to 2020, the average total retail sales of social consumer goods in the region showed a rising trend. The total retail sales of social consumer goods increased by 3.9 times, the total GDP increased by 2.97 times, and the average annual growth rate of the distribution industry was 10.22%, which was significantly higher than the rate of growth of GDP. The urban population increased from 9,821,300 in 2017 to 10,674,700 in 2020, with an average population growth rate of 2.32%. This shows that in recent years, due to the development of e-commerce, smart retail, and other emerging forms of business, the consumer market continued to sink, the rural market demand expanded further, and the distribution industry was also being well developed in the region, becoming an important industrial cornerstone in the promotion of the growth of the county-based economy. In Figure 2, by comparing the development of the distribution industry in each sector, it was found that there was a large regional heterogeneity in the development of the distribution industry in counties of the region, which was specifically reflected in the following order: Shangqiu poverty-stricken counties > Xinyang poverty-stricken counties > Kaifeng poverty-stricken counties > Zhumadian poverty-stricken counties > Nanyang poverty-stricken counties > Zhoukou poverty-stricken counties. The growth rate of Kaifeng poverty-stricken counties was significantly higher than those of the poverty-stricken counties overall, especially in 2019. In addition, the coefficient of variation CV showed that there would be a sharp upward trend in 2018–2020, indicating that there was regional imbalance in the development of counties’ distribution industries. The homogeneous industrial competition among counties and even surrounding regions in the region intensified, and the deviation of various resource centers led to the expansion of industrial development differences.
5.1.2. Analysis of the Spatial Evolution of County Distribution Industry
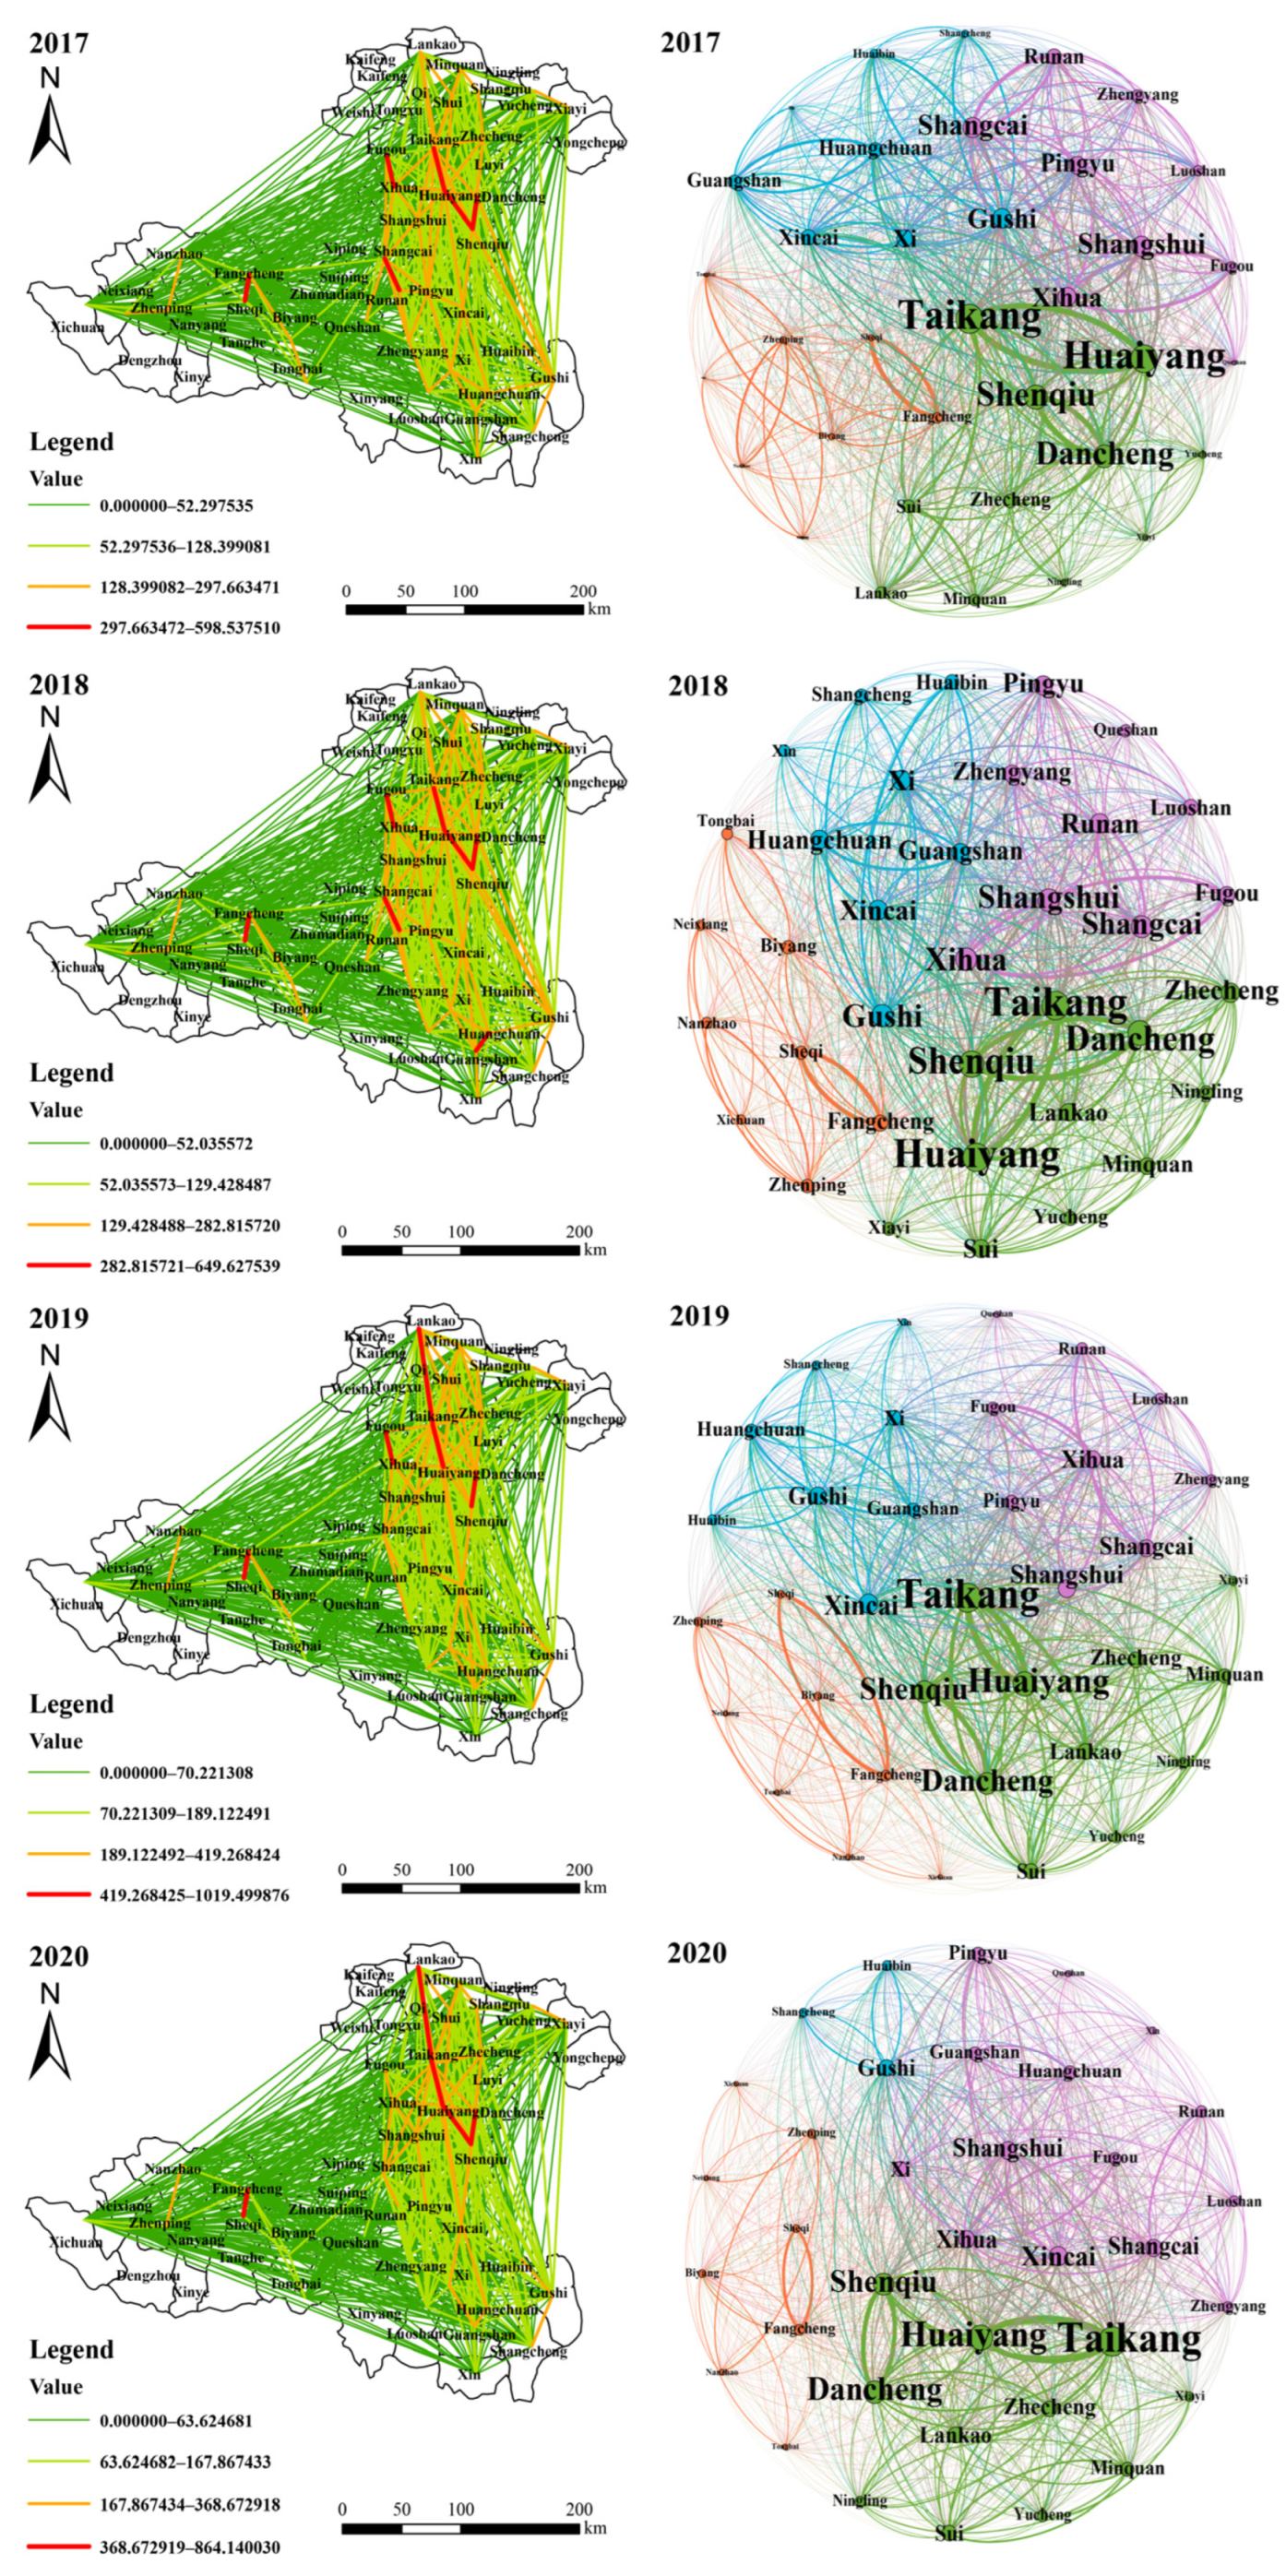
(1) Analysis of spatial connectivity and their patterns. Formula (1) was used to calculate the connectivity of distribution economy of each county in the area, and ArcGIS software was employed to obtain the spatial distribution pattern of the distribution economies in four periods (2017, 2018, 2019, and 2020; Figure 3). Figure 3 indicates that from 2017 to 2020, the connectivity of the distribution economy in the region showed a good development trend over time, and the spatial connectivity of the county-based distribution economy formed an obvious network center, with the “Tai Huai Shen” (Taikang County, Huaiyang County, and Shenqiu County) town cluster as its backbone. From 2017 to 2020, the average connectivity of distribution economies in poverty-stricken counties in southeast Henan was 50.96, 53.73, 62.41, and 64.15, respectively.
In 2017, a total of 10 counties, including Taikang, Huaiyang, Shenqiu, and Dancheng, had strong connecting channels. The regional connectivity was weak (in general). The density and intensity of the connectivity in the eastern region were significantly higher than those in other regions. In 2018, thanks to the acceleration of the construction process of “The Integration of Huangchuan and Guangshan Counties”, the distribution economic ties between Huangchuan County and Guangshan County were significantly enhanced, the growth pole of central towns was strengthened, a strong connectivity channel was added between the two, and the connectivity with surrounding towns also changed from a general to medium network. Shenqiu County continued to give play to its traditional industrial foundation advantages and regional transportation advantages, and its network structure developed steadily. In 2019, there were 410 connection lines exceeding the average level of strength, 852 weak connection channels, 317 general connection channels, 84 moderate connection channels, and 8 strong connection channels. The distribution industry had significant spatial differentiation characteristics. In 2020, by virtue of convenient traffic conditions, the connectivity of the distribution economy between Taikang and Huaiyang counties still ranked first, with a degree of connectivity of 1019.5, which was 1.7 times stronger than its degree of connectivity in 2017. With the implementation of the Urban and Rural Master Plan of Taikang County (2016–2030) and other plans, the connectivity between Taikang County and its surrounding cities and towns was significantly enhanced, so that the distribution economic connectivity of Zhoukou poverty-stricken counties where it is located was significantly higher than that of other regions.
As shown in the network diagram in Figure 3, four regions with agglomeration advantages were divided according to the connectivity of the distribution economies of 36 counties (respectively expressed in four different colors), and the four regions were closely related. Among them, Taikang, Shenqiu, Huaiyang, and Dancheng counties had prominent connectivity, significant leading advantages, and prominent roles of central cities and towns, which can play a leading role in driving the coordinated development of border cities and towns.
Formula (2) was used to calculate the total amount of distribution economic links of each county in the region, from 2009 to 2020 (Figure 4).
The results show that Fangcheng County and Minquan County are the regional central towns of Nanyang poverty-stricken counties and Shangqiu poverty-stricken counties, respectively. With the continuous promotion of policies, such as the Three-Year Action Plan for Striving for a Precise Poverty Eradication Campaign (2018–2020), the central urban functions of Shenqiu County, Dancheng County, and Taikang County were significantly enhanced over time. Relying on the advantages of distribution industry clustering, branding and scale, the total amount of distribution economic links of Taikang County always ranked first in the four periods. Due to its underdeveloped transportation infrastructure, Xichuan County ranked at the bottom across all time periods.
In summary, the total amount of distribution economic links among counties in the region is on the rise. Taikang County and Xichuan County are the strongest and weakest poles of the overall distribution economic links, respectively, and this has not changed over time. Due to the differences in geography, transportation, economy, and other conditions, there is a large gap in the total amount of distribution economic links between counties. Relying on the rapid development of the shipping industry, Zhoukou’s poverty-stricken counties were significantly higher than those in other regions, and the volume of distribution economic linkage in a few regions accounted for nearly 30% of the total number of linkages in the research region, with little fluctuation over time. Most counties had more than 1% of the total number of links in the distribution economy, while only Xichuan County consistently accounted for less than 1% over the years.
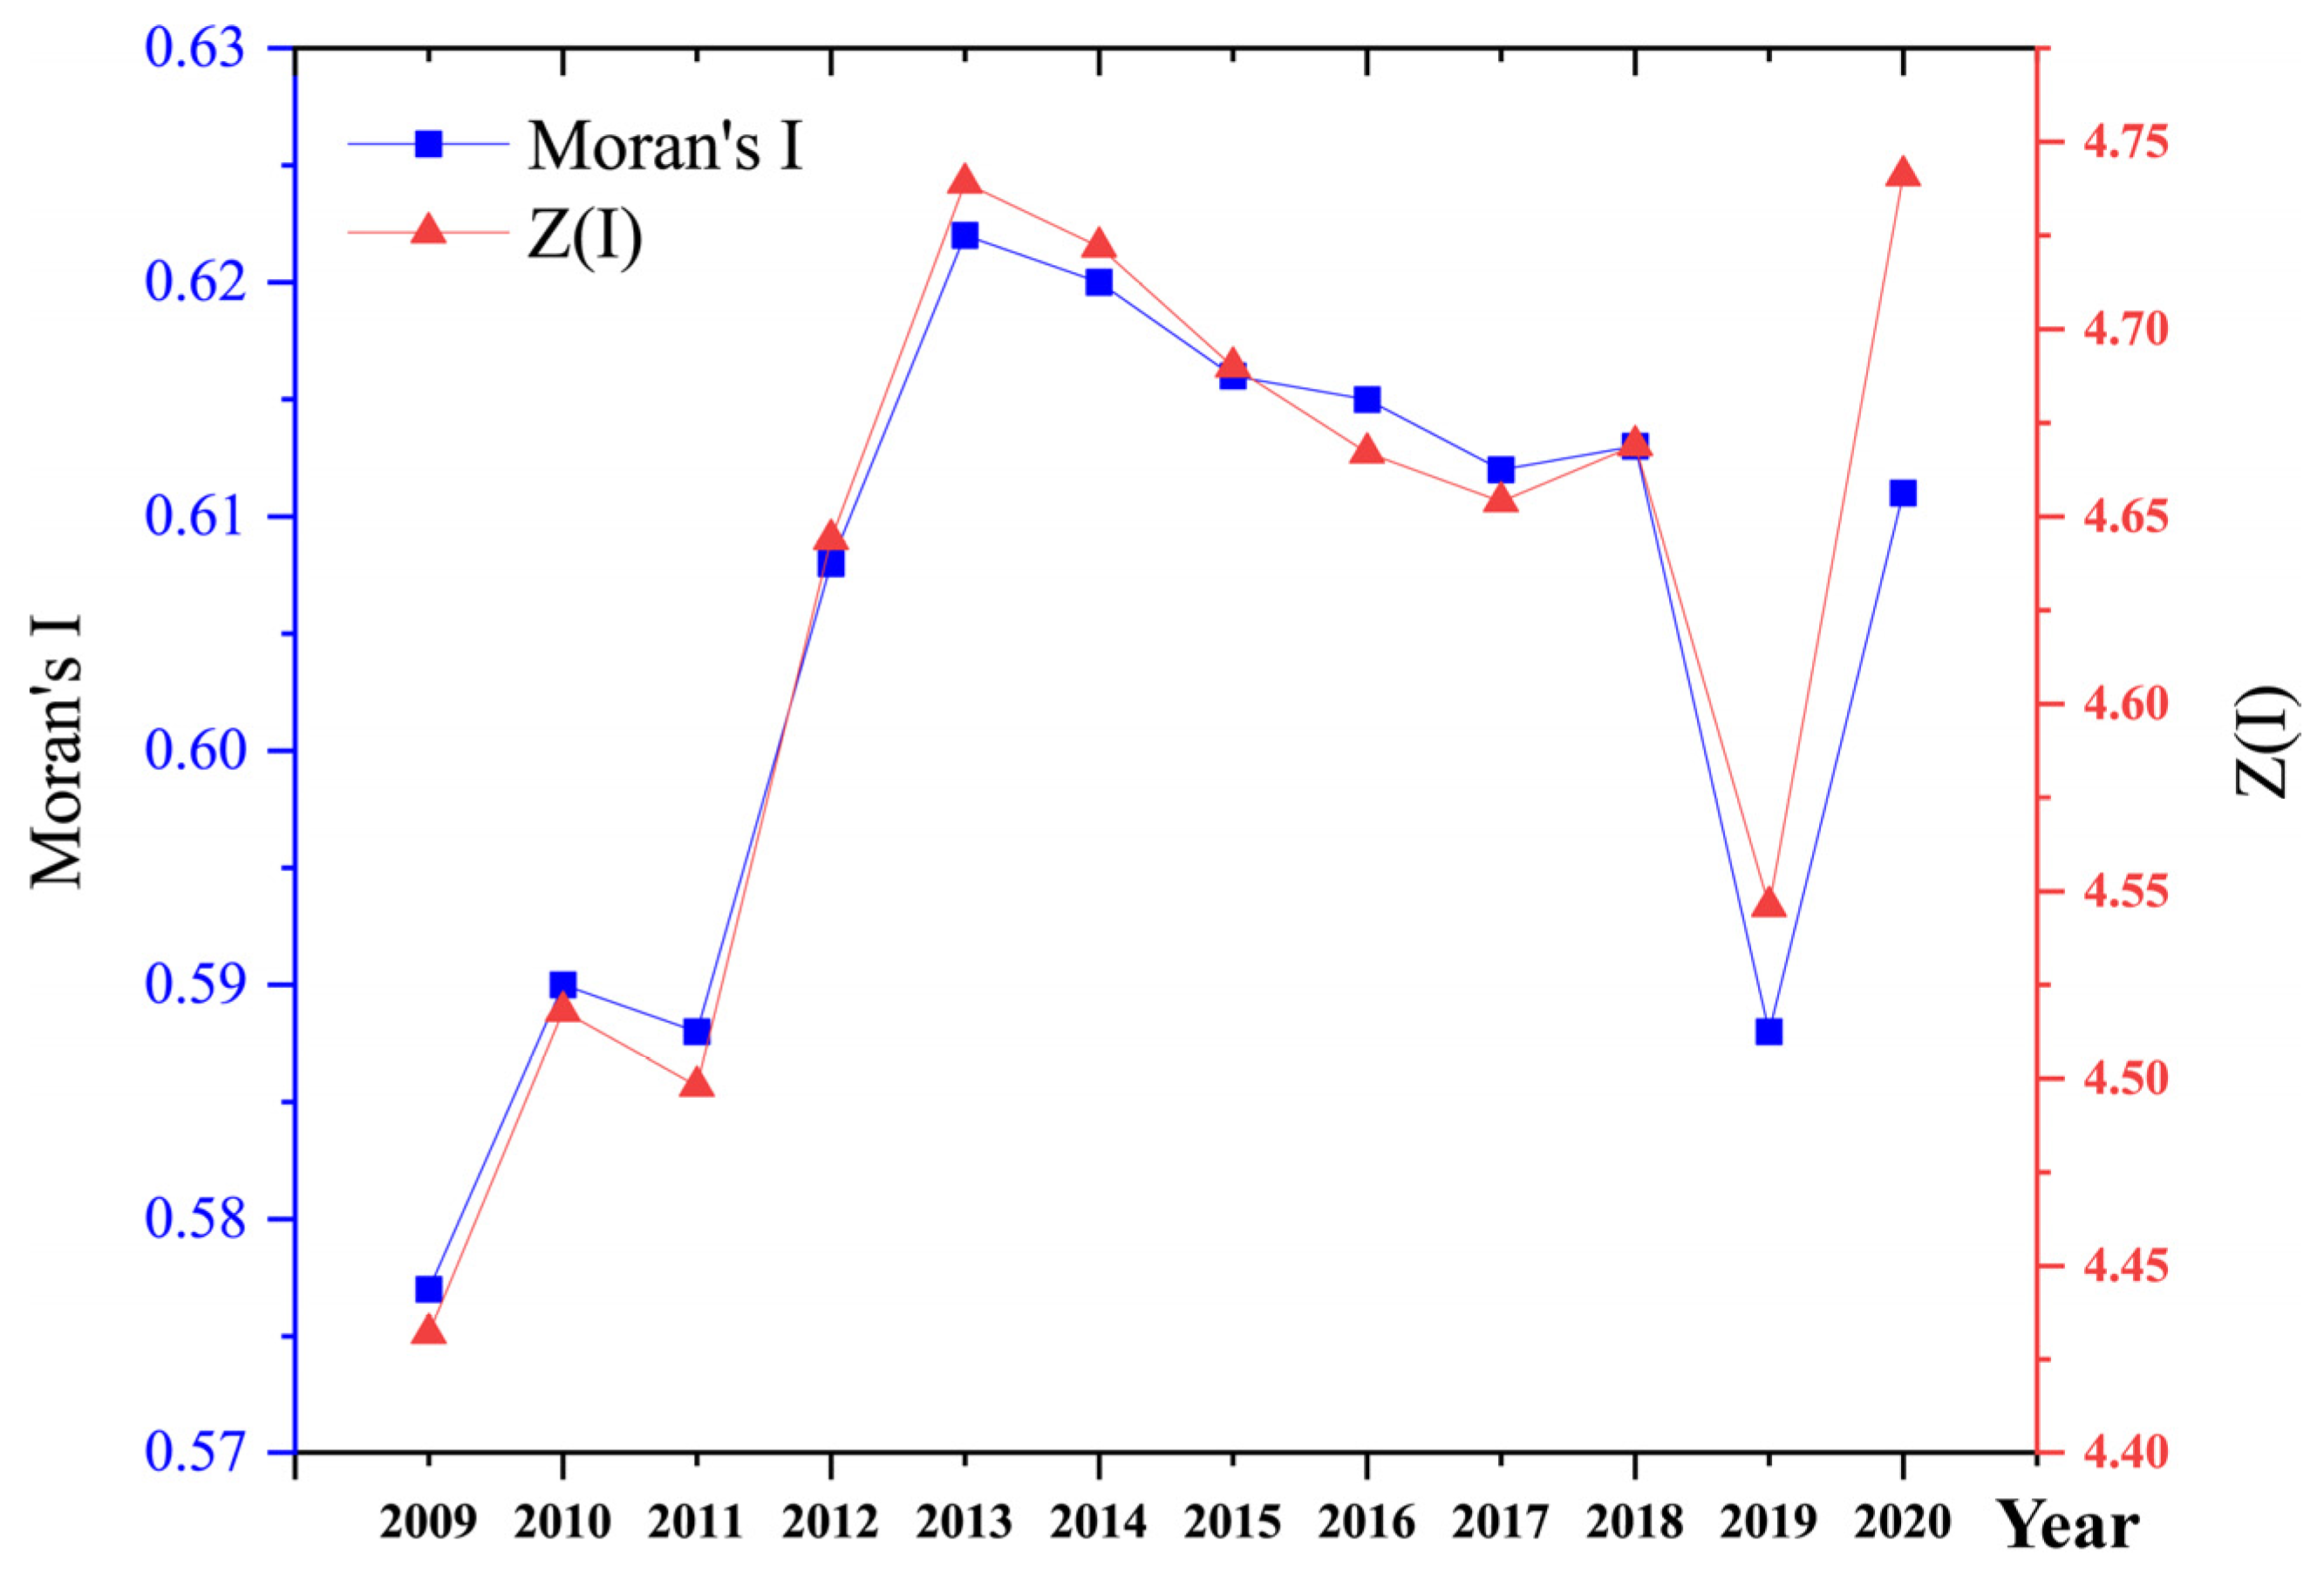
(2) Analysis of the spatial evolution features. Using the global Moran’s I, the spatial autocorrelation of distribution industry in 36 counties in the region from 2009 to 2020 was evaluated (Figure 5).
The results show that the Moran’s I and Z-values of the distribution industries in the counties within the region were both positive (at the 1% significance level). This implies that the development of the distribution industry in the region had a positive spatial autocorrelation, and the agglomeration effect was obvious. In general, the global Moran’s I-value experienced a fluctuation process of “up–down–up” from 2009 to 2020, rising from 0.577 in 2009, to 0.611 in 2020, indicating that the distribution industry in the counties of the region had a circular spatial trend of “agglomeration—diffusion—agglomeration”, and there was a spatial spillover effect in the development of the distribution industry. Thanks to the gradual improvement of the distribution industry system in Henan, the distribution industry cluster effect in central cities and towns was brought into play. In particular, the country vigorously promoted the construction of counties with commercial distribution industry characteristics, driving the development of counties with a low level of development for their distribution industries, leading to a downward trend in the global Moran’s I-value. Therefore, to accelerate the development of counties’ distribution industries, governments should continue to promote the construction of modern systems of the distribution industry, gradually improve the spatial connectivity of each urban circle, accelerate the integration process, and narrow the development differences between the area and the “The Integration of Zhengzhou and Xuchang Cities”, “The Integration of Zhengzhou and Jiaozuo Cities”, and other regions.
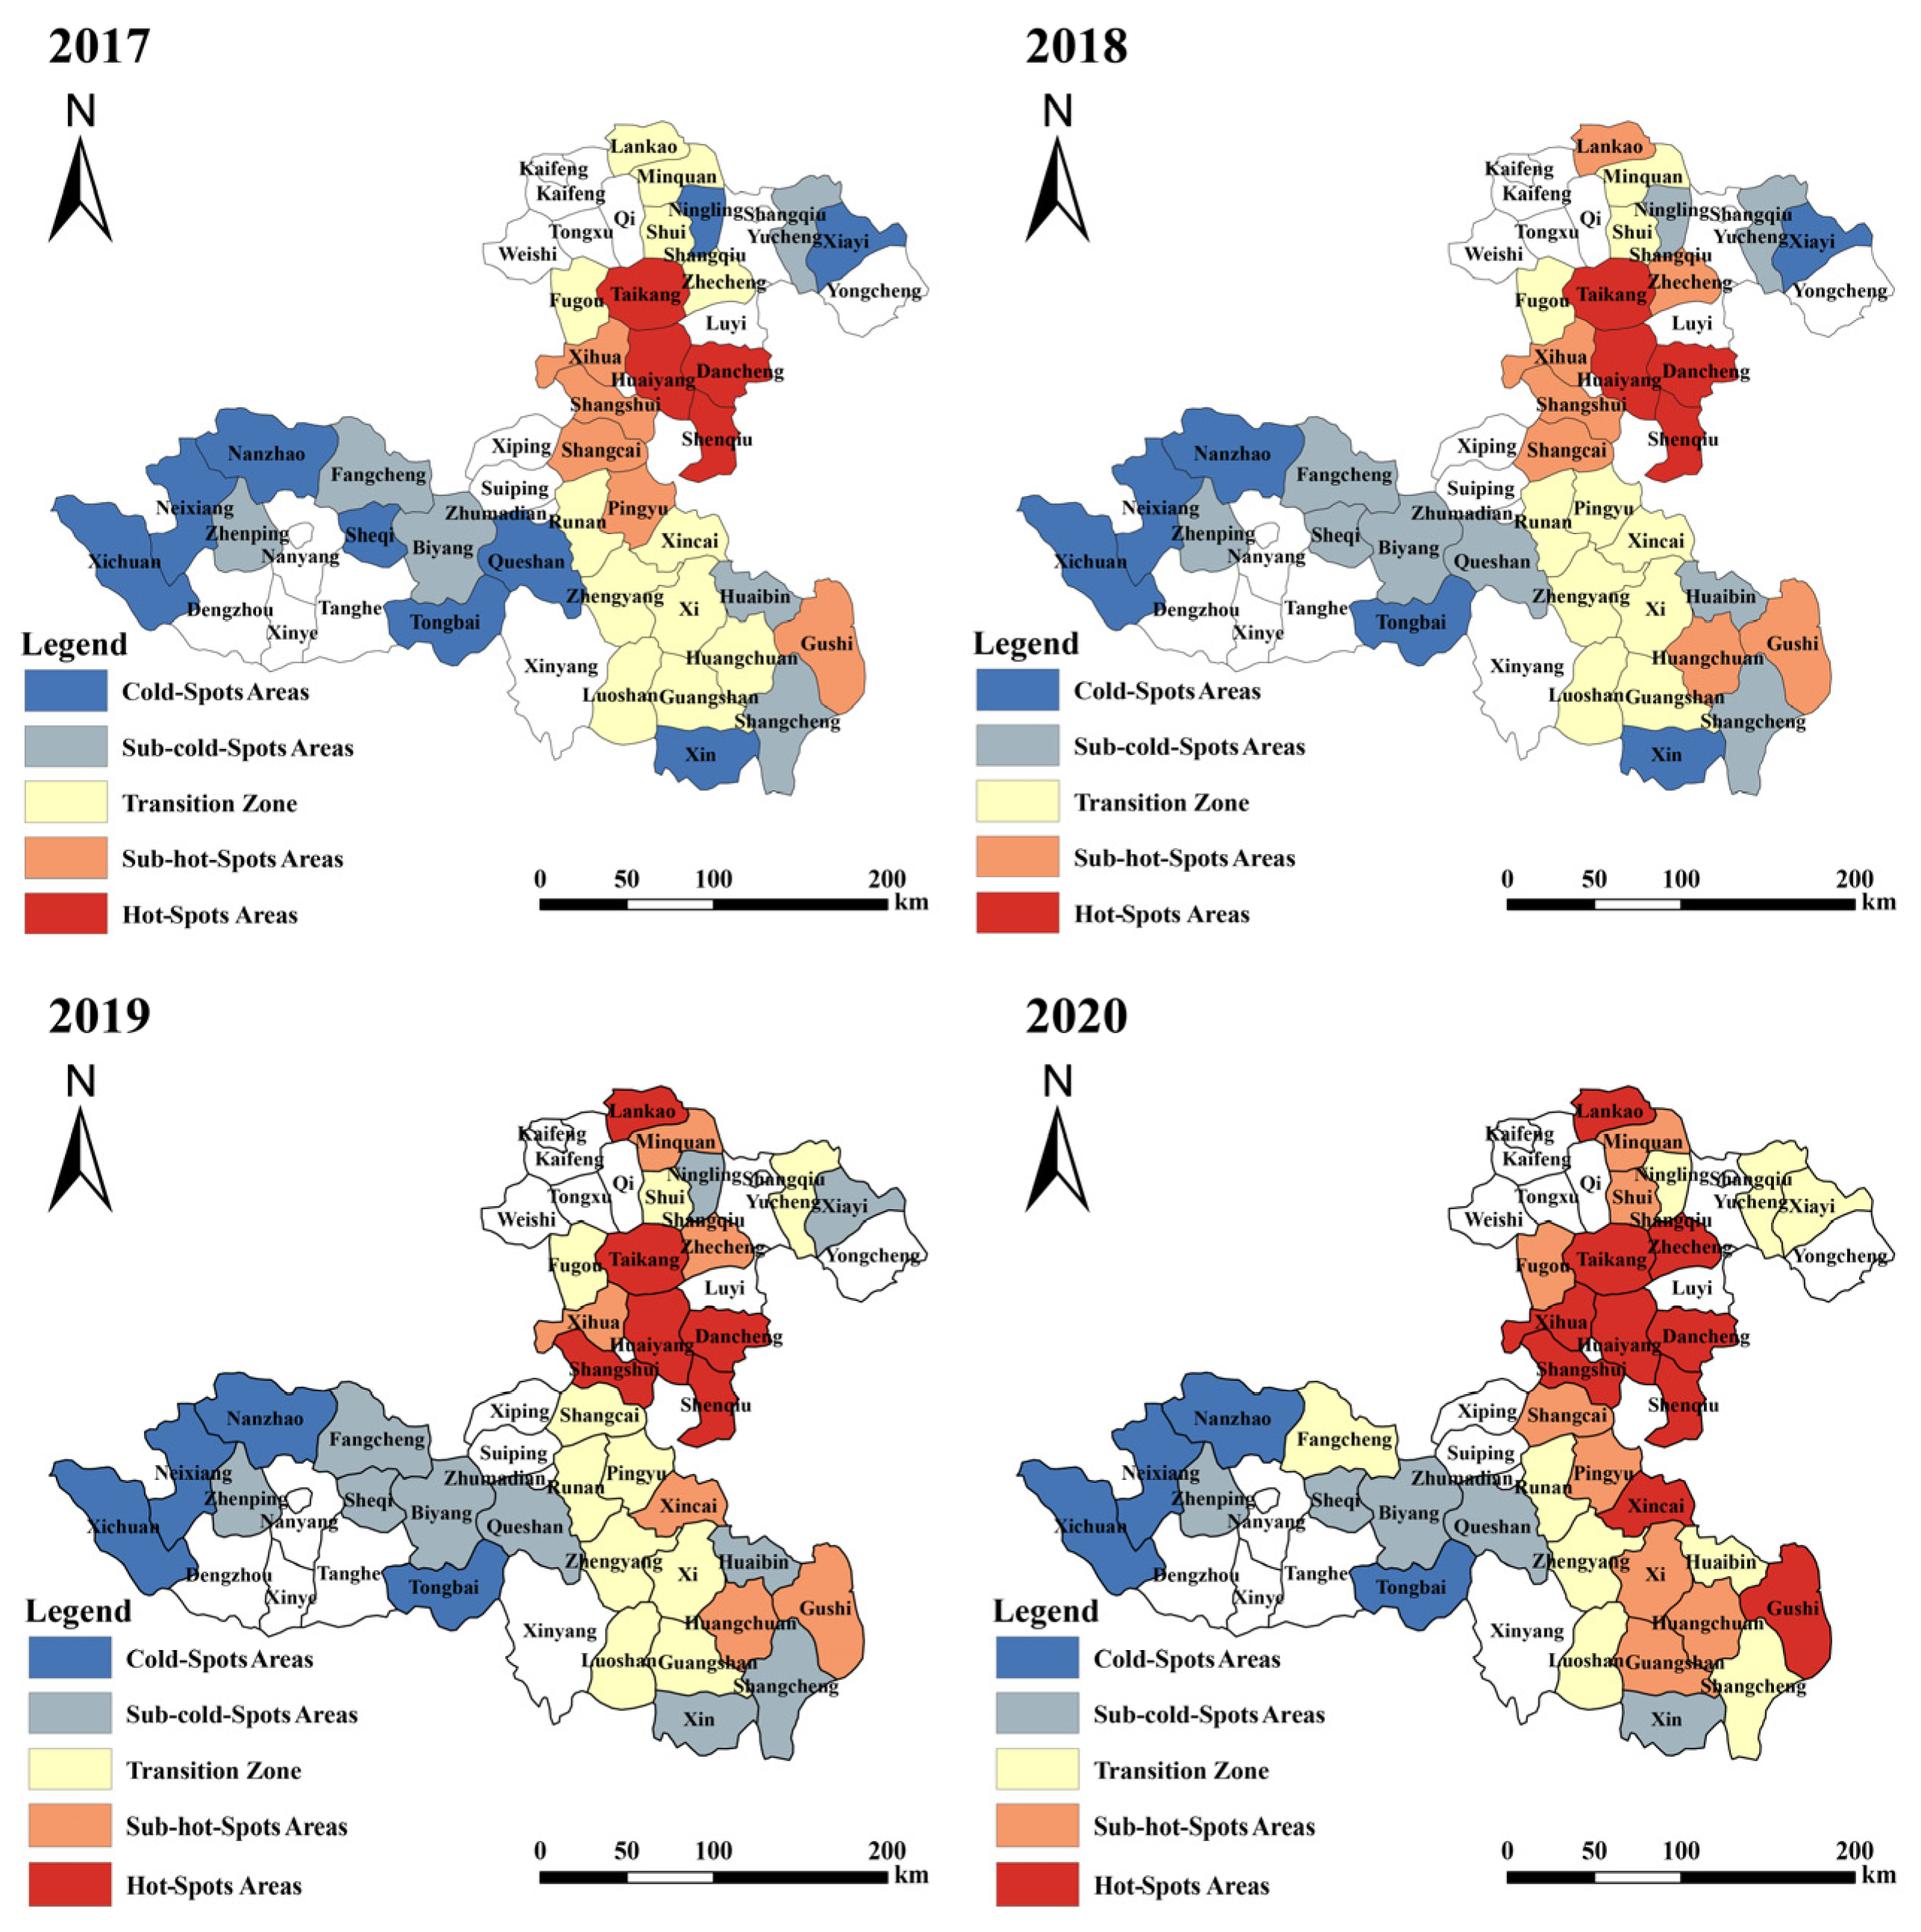
To further reveal the local spatial characteristics of the development of the distribution industry in the area, the local G* index is used to divide the hot- and cold-spot areas of distribution industry development into five categories (Figure 6). In 2017, the hot- and sub-hot-spot areas of distribution industry development accounted for about 25% of the total area of interest, and were mainly concentrated in the central region, while cold-spot clusters were formed around the “Xi-Nan-Tong” (Xichuan County, Nanzhao County, and Tongbai County) town circle in the west. In 2018, there was no major change in the regional distribution of cold- and hot-spot areas, mainly in northern Lankao County and Zhecheng County from the transition zone to the sub-hot-spot area, and Ningling County from the cold-spot area to the sub-cold-spot area. In the south, Huangchuan County changed from the transition zone to the sub-hot-spot area. In the west, Sheqi County and Queshan County changed from a cold-spot area to a sub-cold-spot area. In 2019, the spatial pattern of distribution industry development of “hot spots in the east and cold spots in the west” was solidified, and the contiguous “sub-hot-spot area” gathering area tended to be scattered. This finding implies that the local agglomeration in the inland region of the area weakened, and the development of the distribution industry tended to be scattered. In 2020, the hot-spot area and sub-hot-spot area of distribution industry development increased to 50% of the total proportion of the research area, and in the eastern region it took on a vertical distribution, indicating that the eastern region of the county experienced distribution industry development to maintain a substantial increase in quality and speed of this momentum. On the other hand, Xichuan County, Neixiang County, Nanzhao County, and Tongbai County remained in the cold-spot area. This indicates that the level of development of the distribution industry in these four counties is still backward, that there is a lack of economic strength, low-end industrial levels, short distribution industry chains, and other issues.
The difference in the ability of the distribution industry to enhance, and the speed of development, led to degradation of the cold- and hot-spot areas in some counties in the poverty-stricken areas of southeast Henan. The main manifestation was that three counties showed a small degradation: Shangcai County, Huangchuan County, and Pingyu County degraded from being a sub-hot-spot area to a transition zone. It is worth noting that in 2020, the poverty-stricken counties in Nanyang poverty-stricken counties formed a large area of cold-spot and sub-cold-spot clusters. The overall regional “high in the northeast—low in the southwest” trend of county distribution industry development was highlighted, which may be because county town construction accelerated. On the one hand, the radiation-driven role of the central town was given better play, and could drive the surrounding counties in the development of the circulatory industry, so that the overall regional development of the distribution industry tended to a paradigm of spatially dispersed clustering. On the other hand, the snowball effect of rural revitalization gradually became significant, and the infrastructure construction and fixed asset investment of highway transportation and communication tilted to the counties with high levels of development of their distribution industries, which made the difference in resource endowment between developed areas and less developed areas in the area continue to enlarge, and the difference in distribution economies between the east and west gradually increase.
5.2. Analysis of Factors Influencing the County Distribution Industry
5.2.1. Analysis of Influencing Factors
As a leading and basic industry of the national economy, the distribution industry is important for fostering new dynamics and maximizing consumption potential in the stage of high-quality development of an economy. With reference to existing studies and considering the availability of data, based on the intermediary status of the distribution industry and theories related to industrial organization, the factors influencing the distribution industry were mainly discussed in terms of intra-industry factors (labor force, capital, and technological level) and inter-industry factors (market demand, population size, and industrial structure).
To tackle the problem of model heteroskedasticity, all of the indicators were logarithmically treated in this research. The meanings of variable indicators, general descriptive statistics, and multicollinearity tests of each influencing factor are summarized in Table 1.
5.2.2. Empirical Results Analysis
Based on the discriminant criterion, spatial correlation tests, including Lagrange Multiplier (LM)-Lag and robust LM-Lag tests, and the LM-Error and robust LM-Error tests, were performed on ordinary static panel regressions to determine the type of spatial effects to select the model form. As can be seen from Table 2, the LM-Lag test and the robust LM-Lag test did not pass the 10% significance test, while the LM-Error test and the robust LM-Error test passed the 1% significance test. This indicates that the selected sample had a spatial error effect, so the preliminary judgment of selecting the spatial error model was reasonable.
Next, according to the Hausman Test results, the SAR and SEM models with random effects were selected, and the SDM model passed the test at the 1% significance level, and fixed effects were selected therein. In the present research, the SDM model significance was the smallest among the choices of spatial econometric models, so the SDM model was the most ideal in terms of the goodness of fit. In summary, the SDM (fe) model was chosen as more appropriate. Secondly, the use of LR test yielded indicator values of 24.22 and 32.32, which rejected the original hypothesis at the 1% level of significance.
To sum up, Dubin’s spatial fixed-effects model should be used to examine the spatial spillover effects of the development of the distribution industry in the district counties.
In Table 3, labor force, industrial structure, market demand, and population size all positively promoted the development of the distribution industry; in descending order of influence, industrial structure, population size, market demand, labor force, i.e., the increase in the proportion of tertiary industries, expansion of the urban population, the expansion of market demand, and the increase in labor force reduced the spatial difference in the development of the distribution industry, and urban fixed asset investment was negatively related to the spatial differences of the distribution industry.
In addition, the spatial lag terms of technology level, market demand, industrial structure, and population size were positive, further indicating that the spatial difference in distribution industries in counties of the area was influenced by multiple factors pertaining to neighboring cities themselves and the external environment. The spatial lag term of capital factors was significantly negative, which may have been due to the concentrated impoverished counties areas generally having small-scale development, their relatively closed transportation systems, and the concentrations of inter-city populations, industries and capital in central towns such as Taikang and other counties. The formation of a spatial polarization effect promoted development of local distribution industries, but also squeezed the resource elements of neighboring areas, which is detrimental to the optimization and upgrading of industrial structure, and inhibits the development of the distribution industry in surrounding areas.
Due to differences in economic development levels and location conditions, the comprehensive utilization efficiency of capital has significant potential for improving and smoothing the orderly and free flow of factors; improving the efficiency of resource allocation will be key to alleviating the imbalance of the spatial structure of the distribution industry.
To further estimate the spatial spillover effect of the development of the distribution industry in the counties of the region, partial derivative methods were used to decompose the spatial effect into spatial direct effects and spatial spillover effects (Table 4).
- (1)
- From the perspective of direct effects, the regression coefficients of market demand, population size, and industrial structure adjustment were positive and passed the significance test, indicating that they play a role in promoting the development of the county distribution industry. From the perspective of indirect effects, only the regression coefficient of market demand was positive and passed the significance test at the level of 1%. Market demand can not only promote the development of local urbanization, but can also significantly promote the urbanization of neighboring areas.
It is worth noting that the labor force and capital showed negative spatial spillover, among which the direct effect of the labor force was positive, indicating that full use of the labor force can promote the development of the distribution industry in this region; however, governments should further consider how to promote the development of the distribution industry in this region, while driving the development of surrounding counties. The capital factor not only exerted a negative effect on the development of local distribution industry, but it also had a restraining effect on the circulation development of surrounding counties. The new first-tier big cities represented by Zhengzhou City had a “siphon effect” because of their high concentration of high-quality medical care, education, and infrastructure resources, which attracted high-quality human capital from relatively underdeveloped areas, such as southeast Henan, to transfer to these areas. This is not conducive to the development of the distribution industry in neighboring areas.
- (2)
- The spatial spillover effect of each factor on the development of the county distribution industry was greater than those of direct effects. The overflow of traditional basic elements will affect improvements in the development levels of distribution industries in neighboring counties. Table 4 indicates that the indirect effects of labor, capital, population size, market demand, and other factors on the development of county distribution industry were greater than those of direct effects, and accounted for most of the overall spatial effect, which is also the main reason for the high spatial spillover effect in the development of the county distribution industry in poverty-stricken counties in Henan. Specifically, the indirect effect of each factor accounted for 80.01%, while the direct effect only accounted for 19.99%, indicating that the marginal effect brought about by the change in one factor exerted a greater influence on surrounding counties than on itself.
6. Conclusions and Suggestions
6.1. Conclusions
Firstly, from 2009 to 2020, the overall scale of the county distribution industry in poverty-stricken southeast areas of Henan expanded, but the development of the distribution industry among poverty-stricken county sectors showed greater regional heterogeneity. The sharp upward trend in the coefficient of variation CV in 2018–2020 indicates that there was regional imbalance in the development of the county distribution industry.
Secondly, the degree of connectivity (quantity) of the distribution economy increased over time, and the radiation driving effect of the regional central towns of Shenqiu, Dancheng, and Taikang increased. The overall distribution economic network was characterized by “the strongest pole (Taikang) and the weakest pole (Xichuan)”, but the polarization therein was not effectively eased.
Thirdly, the development of the distribution industry in this region had a positive spatial autocorrelation and obvious agglomeration effect. It also presented a circular spatial trend of “agglomeration–diffusion–agglomeration”, with significant local spatial polarization. In contrast, the county-level distribution industry in Wulingshan District of Hunan Province only showed a spatial trend of agglomeration in the same period [29]. This was due to the different construction progress and perfection of the distribution industry system, which affected the extent of the distribution industry agglomeration effect in the central county.
Fourthly, the spatial development pattern of the distribution industry with “hot spots in the east and cold spots in the west” was formed, however, due to the difference in the enhancement capacity and rate of development of the distribution industry; hence, the degradation of cold- and hot-spot areas in some counties in the poverty-stricken areas of southeast Henan occurred.
Lastly, the spatial spillover effect of each factor on the development of the county distribution industry was greater than the direct effect. The decomposition found that the county distribution industry in the area was still driven by traditional factors such as labor. The externalities such as market demand began to appear, but the positive spatial externalities of labor and capital on the development of the distribution industry needed to be explored. In Yang’s research [5], the spillover effect and integration promotion of the distribution industry efficiency in the Greater Bay Area of Guangdong, Hong Kong, and Macao mainly depend on policy guidance and regional location advantages. This is related to the particularity of the research object.
6.2. Suggestions
This analysis shows that there is a significant spatial imbalance in the development of the county distribution industry in the poverty-stricken areas of southeast Henan. Taking the revitalization of the county distribution industry as a breakthrough, this research attempts to solve the imbalance of the spatial structure of the county distribution industry, which objectively requires the following:
- (1)
- Full use of the spatial spillover effect of the county-level distribution industry to guide the transfer of some circulation functions in the transaction-intensive areas to surrounding areas. On the one hand, expanding the radiation influence of central counties (such as Taikang) and driving the development of the distribution industry in surrounding counties will be made. On the other hand, smoothing the orderly and free flow of capital and other factors that drive industrial agglomeration in the region, alleviating the imbalance of the spatial structure of the distribution industry, and the coordinated development of the distribution industry in the region, are suggested.
- (2)
- Continuous optimization of the spatial layout of the distribution industry, giving full play to the gathering function of counties in regions such as Shenqiu. The links between urban circles such as the “Tai-Huai-Shen” (Taikang County, Huaiyang County, and Shenqiu County) urban circle and the “Shang-Ru-Ping” (Shangcai County, Runan County, and Pingyu County) urban circle should be constantly strengthened by taking advantage of the logistical node construction of national logistics hubs, and the central cities along key transportation routes. Governments should actively integrate their policies into the paradigm of regional cooperation in a larger scope, such as Sanmenxia Town Circle and Puyang Town Circle, taking counties as the carrier to promote urban–rural integration to reduce poverty.
- (3)
- A province with a large agricultural population such as Henan, whose vulnerable areas mainly rely on traditional basic elements such as labor and land, should constantly improve the construction of county transportation, communications, and other circulation infrastructures. Meanwhile, attracting high-quality talent to flow across regions, encouraging and supporting large circulation enterprises and e-commerce platforms to establish multi-level service points, and promoting the comprehensive development of the distribution industry in vulnerable areas, are suggested.
- (4)
- For other developing countries, it is deemed necessary to develop the rural distribution industry vigorously, promote the interactive development of the distribution industry and rural economic growth, and strengthen the guidance of the development direction of the rural distribution industry, especially the logistics industry, so that these measures can play a vital and positive role in accelerating the process of urban–rural integration.
6.3. Limitations
- (1)
- Among the articles that can be compared in the current research scope, the research objects were mostly manifest at the provincial and municipal levels, so the conclusions in this study are different from those in the past, and the specific reasons for the differences need to be further explored in future research.
- (2)
- Due to limitations of the insufficient sample size, we will expand the sample size and continue to conduct in-depth research in the future, in order to provide broader, more rational, and effective suggestions for rural revitalization and urban–rural integration in China and other developing countries.
Author Contributions
Conceptualization, Y.C., Y.X. and Y.H.; methodology, Y.C., Y.X. and Y.H.; software, Y.C., Y.X. and S.L.; validation, Y.C. and Y.H.; formal analysis, Y.C.; writing—original draft preparation, Y.C. and Y.X.; writing—review and editing, Y.C., Y.X. and Y.H.; visualization, S.L. All authors have read and agreed to the published version of the manuscript.
Funding
This research was funded by the Key Project of Scientific Research of Department of Education of Hunan Province [21A0156].
Institutional Review Board Statement
Not applicable.
Informed Consent Statement
Not applicable.
Data Availability Statement
The data were sourced mainly from the EPS global data statistics platform: (http://olap.epsnet.com.cn/data-resource.html, accessed on 9 November 2022) and the Statistical Yearbook of Henan Province (2010–2021). All of the data can be obtained by email from the corresponding author.
Conflicts of Interest
The authors declare no conflict of interest.
References
- Woods, M. Rural, 1st ed.; Routledge: London, UK, 2010. [Google Scholar] [CrossRef]
- Li, X.F.; Liu, J.Q.; Jia, J.; Yang, H. Relationship between multifunctionality and rural sustainable development: Insights from 129 counties of the Sichuan Province, China. Chin. J. Popul. Resour. Environ. 2022, 20, 285–294. [Google Scholar] [CrossRef]
- Deng, Y.Y. Research on the spatial agglomeration and spillover effect of commercial circulation industry. J. Commer. Econ. 2019, 24, 17–20. [Google Scholar]
- Liu, S.W.; Zhou, H.Y. Spatial Econometric Analysis of the Impact of Population Urbanization and Land Urbanization on the Output Efficiency of General Industry. Econ. Geogr. 2016, 36, 51–59. [Google Scholar] [CrossRef]
- Yang, S.Q. Spatial distribution and evolution trend of circulation industry efficiency in the Greater Bay Area of Guangdong, Hong Kong and Macao. J. Commer. Econ. 2023, 4, 180–183. [Google Scholar]
- Inklaar, R.; Timmer, M.P. Accounting for growth in retail trade: An international productivity comparison. J. Product. Anal. 2008, 29, 23–31. [Google Scholar] [CrossRef] [Green Version]
- Kuusi, T. The dynamics of ICT adaptation and the productivity gaps across advanced nations. J. Product. Anal. 2015, 44, 175–188. [Google Scholar] [CrossRef]
- Alhaji, B.M.; Rusmawati, S.; Shaufique, F.S. Urban poverty, inequality and industry in Nigeria. Int. J. Dev. Issues 2015, 14, 249–263. [Google Scholar] [CrossRef]
- Cao, J. Research on Relevancy between Circulation Industry and National Economy Based on Canonical Correlation Analysis. In Proceedings of the 2010 International Conference on Internet Technology and Applications, Wuhan, China, 20–22 August 2010. [Google Scholar] [CrossRef]
- Ruch, J.E.; Trindade, V. Ethnic Chinese networks in international trade. Rev. Econ. Stat. 2002, 84, 116–130. [Google Scholar] [CrossRef] [Green Version]
- Zhang, Q.; Kong, M. China’s Poverty Reduction Goals and Strategic Priorities during the Fourteenth Five Year Plan Period. Reform 2019, 11, 117–125. [Google Scholar]
- Liu, S.W. Thoughts on Optimizing the Spatial Structure of China’s Circulation Industry and Promoting the Release of Consumption Potential. Hunan Soc. Sci. 2019, 3, 90–95. [Google Scholar]
- Liu, Y.S.; Liu, J.L.; Zhou, Y. Spatio-temporal patterns of rural poverty in China and targeted poverty alleviation strategies. J. Rural Stud. 2017, 52, 66–75. [Google Scholar] [CrossRef]
- Chen, C.; Woods, M.; Chen, J.; Liu, Y.; Gao, J. Globalization, state intervention, local action and rural locality reconstitution—A case study from rural China. Habitat Int. 2019, 93, 102052. [Google Scholar] [CrossRef]
- Peng, C.; Ma, B.; Zhang, C. Poverty alleviation through e-commerce: Village involvement and demonstration policies in rural China. J. Integr. Agric. 2021, 20, 998–1011. [Google Scholar] [CrossRef]
- Zheng, L. Research on the Poverty Reduction Effect of the Development of Modern Circulation Industry—Based on the data of 20 national-level poverty-stricken counties. Sci. Technol. Dev. 2020, 16, 909–915. [Google Scholar]
- Mboma, L.M. Small and medium enterprises (SMEs) and poverty alleviation in Africa: “Developing the small-scale retail sector, a break through to poverty alleviation; the case of Tanzania. Bus. Manag. Rev. 1999, 6, 82–100. [Google Scholar]
- Li Anthony, H.F. E-commerce and Taobao Villages. A Promise for China’s Rural Development? China Perspect. 2017, 2017, 57–62. [Google Scholar]
- Zehner, K. Problems and Perspectives of Retail Development in Villages. The Example of Northern Emsland [Probleme und Perspektiven der Einzelhandelsund Zentrenentwicklung. Das nördliche Emsland als Beispiel]. Geogr. Rundsch. 2021, 73. Available online: https://kns.cnki.net/kcms/detail/detail.aspx?FileName=XQSPC6FF858A61895AC3195F4F6765D7E917&DbName=GARJ2021_2 (accessed on 11 November 2022).
- Bannor, R.K.; Oppong-Kyeremeh, H.; Kyire, S.K.; Aryee, H.N.; Amponsah, H. Market participation of urban agriculture producers and its impact on poverty: Evidence from Ghana. Sustain. Futur. 2022, 4, 100099. [Google Scholar] [CrossRef]
- Long, X.Y.; Guo, Y.K. Research on the function evolution and driving mechanism of rural homestead in Luxian County under the “Rural Revitalization”. Procedia Comput. Sci. 2022, 199, 969–976. [Google Scholar] [CrossRef]
- Zhou, Y.; Guo, L.; Liu, Y.S. Land consolidation boosting poverty alleviation in China: Theory and practice. Land Use Policy 2019, 82, 339–348. [Google Scholar] [CrossRef]
- Xiong, M.Z.; Fan, J.J.; Li, W.Q.; Sheng, X.B.T. Can China’s digital inclusive finance help rural revitalization? A perspective based on rural economic development and income disparity. Front. Environ. Sci. 2022, 10, 985620. [Google Scholar] [CrossRef]
- Si, L.J.; Cao, H.Y. County economy promotes high-quality rural revitalization: Historical evolution, dual logic and realization path. Wuhan Univ. J. (Philos. Soc. Sci.) 2022, 75, 165–174. [Google Scholar] [CrossRef]
- Pattanapong, T.; Beth, C.; Menelaos, G. How can rural businesses thrive in the digital economy? A UK perspective. Heliyon 2022, 8, e10745. [Google Scholar] [CrossRef]
- Kuol, W.M. Examining the Dimensions of Rural Economic Development in South Sudan. J. Trend Sci. Res. Dev. 2021, 5, 844–850. [Google Scholar]
- Haji, K. E-commerce development in rural and remote areas of BRICS countries. J. Integr. Agric. 2021, 20, 979–997. [Google Scholar] [CrossRef]
- Anselin, L. Lagrange Multiplier Test Diagnostics for Spatial Dependence and Spatial Heterogeneity. Geogr. Anal. 1988, 20, 1–17. [Google Scholar] [CrossRef]
- Yang, S.G.; Wang, L. Evolutionary characteristics and influencing factors of county circulation industry development in Wulingshan District, Hunan Province. Econ. Geogr. 2022, 42, 127–134, 175. [Google Scholar] [CrossRef]
Figure 1.
Research areas.

Figure 2.
Average changes of county distribution industries in poverty-stricken counties in southeast Henan, from 2009 to 2020.
Figure 2.
Average changes of county distribution industries in poverty-stricken counties in southeast Henan, from 2009 to 2020.

Figure 3.
From 2017 to 2020, the county distribution economic ties in poverty-stricken counties in southeast Henan.
Figure 3.
From 2017 to 2020, the county distribution economic ties in poverty-stricken counties in southeast Henan.

Figure 4.
Total distribution economic links of all counties, from 2009 to 2020.

Figure 5.
Global Moran’s I-values and Z-values of the development of county distribution industry in the poverty-stricken counties of southeast Henan, from 2009 to 2020.
Figure 5.
Global Moran’s I-values and Z-values of the development of county distribution industry in the poverty-stricken counties of southeast Henan, from 2009 to 2020.

Figure 6.
Analysis of spatial cold- and hot-spot areas of county distribution industries in poverty-stricken counties of southeast Henan, from 2017 to 2020.
Figure 6.
Analysis of spatial cold- and hot-spot areas of county distribution industries in poverty-stricken counties of southeast Henan, from 2017 to 2020.


Table 1.
Definitions of variable indicators and their descriptive analysis.
| Variables | Indicator Meaning | Average Value | Standard Error | Minimum Value | Maximum Value | |
|---|---|---|---|---|---|---|
| Labor force | lnl | Number of urban workers in employment/10,000 persons | 1.579322 | 0.3471638 | 0.9593119 | 2.292353 |
| Capital | lnk | Urban fixed assets investment/dollars | 7782.2554 | 0.274005 | 6767.8847 | 8770.7222 |
| Technology level | lnc | Urbanization rate | 3.709204 | 0.095793 | 3.499047 | 4.038479 |
| Market demand | lnpcw | GDP per capita/dollars | 1.4874 | 0.2119023 | 1.4221 | 1.5666 |
| Population size | lnpop | Urban population size/10,000 persons | 3.326823 | 0.272147 | 2.600747 | 3.900903 |
| Industrial structure | lnts | Industrial structure (The added value of the secondary and tertiary industries accounted for GDP) | −0.2188733 | 0.04175 | −0.3342544 | −0.124961 |
| Distribution industry | lny | Total retail sales of social consumer goods/dollars | 19,656.469 | 0.340808 | 18,523.8477 | 20,906.7408 |
Table 2.
The LM test results.
| Test Statistic | Statistic | p Value |
|---|---|---|
| LM-Lag test | 0.015 | 0.903 |
| Robust LM-Lag test | 3.459 | 0.063 |
| LM-Error test | 7.041 | 0.008 |
| Robust LM-Error test | 10.485 | 0.001 |
Table 3.
Spatial model estimation results.
| Variable Name | SAR | SEM | SDM |
|---|---|---|---|
| lnl | 0.0860038 (0.193) | 0.0930781 (0.164) | 0.0632679 (0.341) |
| lnk | −0.2131324 (0.115) | −0.196103 (0.147) | −0.3939616 *** (0.006) |
| lnc | −0.8712609 *** (0.006) | −0.9790145 *** (0.004) | −0.8773962 ** (0.015) |
| lnpcw | 0.5429566 *** (0.001) | 0.5301683 *** (0.003) | 0.5510523 *** (0.001) |
| lnpop | 1.033034 *** (0.000) | 1.036328 *** (0.000) | 1.034052 *** (0.000) |
| lnts | 2.353436 *** (0.001) | 2.392801 *** (0.001) | 2.39602 *** (0.000) |
| Wxlnl | −0.410083 (0.491) | ||
| Wxlnk | −2.627436 *** (0.006) | ||
| Wxlnc | 0.8317909 (0.672) | ||
| Wxlnpcw | 2.30572 * (0.098) | ||
| Wxlnpop | 3.072486 ** (0.017) | ||
| Wxlnts | 5.78348 (0.255) | ||
| Rho | 0.6550508 *** (0.3749233) | 0.1114098 (0.701) | |
| Lambda | 0.5454428 *** (0.007) | ||
| 0.0087218 *** | 0.0093386 *** | 0.0076047 *** | |
| LogL | 134.8068 | 130.7560 | 146.9154 |
| LR test | 24.22 *** | 32.32 *** |
Note: *, **, and *** represent the 10%, 5%, and 1% levels of significance, respectively, with the p-values indicated in parentheses.
Table 4.
Spatial effect decomposition results of influencing factors in the county distribution industry.
Table 4.
Spatial effect decomposition results of influencing factors in the county distribution industry.
| Variable | Direct Effects | Indirect Effects | Total Effect |
|---|---|---|---|
| lnl | 0.0615809 (0.0834596) | −0.5178611 (1.670664) | −0.4562802 (1.726365) |
| lnk | −0.4211736 *** (0.1491227) | −3.303293 (2.386669) | −3.724467 (2.467771) |
| lnc | −0.8840999 ** (0.3452434) | 0.9825256 (2.36664) | 0.0984257 (2.342554) |
| lnpcw | 0.575743 *** (0.1633536) | 2.832458 (1.956246) | 3.408201 * (2.017749) |
| lnpop | 1.082119 *** (0.2331324) | 3.840239 * (2.235334) | 4.922359 ** (2.236587) |
| lnts | 2.428329 *** (0.7090812) | 7.546157 (11.46039) | 9.974486 (11.7198) |
| Proportion | 19.99% | 80.08% | - |
Note: *, **, and *** represent 10%, 5%, and 1% levels of significance, respectively.
Disclaimer/Publisher’s Note: The statements, opinions and data contained in all publications are solely those of the individual author(s) and contributor(s) and not of MDPI and/or the editor(s). MDPI and/or the editor(s) disclaim responsibility for any injury to people or property resulting from any ideas, methods, instructions or products referred to in the content. |
© 2023 by the authors. Licensee MDPI, Basel, Switzerland. This article is an open access article distributed under the terms and conditions of the Creative Commons Attribution (CC BY) license (https://creativecommons.org/licenses/by/4.0/).
Share and Cite
MDPI and ACS Style
Chen, Y.; Xu, Y.; Li, S.; Huang, Y. The Evolution and Factors Affecting the Distribution Industry in Poverty-Stricken Counties of Henan Province, China. Sustainability 2023, 15, 6302. https://doi.org/10.3390/su15076302
AMA Style
Chen Y, Xu Y, Li S, Huang Y. The Evolution and Factors Affecting the Distribution Industry in Poverty-Stricken Counties of Henan Province, China. Sustainability. 2023; 15(7):6302. https://doi.org/10.3390/su15076302
Chicago/Turabian StyleChen, Yiwei, Yuhuan Xu, Sijin Li, and Yin Huang. 2023. "The Evolution and Factors Affecting the Distribution Industry in Poverty-Stricken Counties of Henan Province, China" Sustainability 15, no. 7: 6302. https://doi.org/10.3390/su15076302
Note that from the first issue of 2016, this journal uses article numbers instead of page numbers. See further details here.