
Study on Early Identification of Landslide Perilous Rocks Based on Multi-Dynamics Parameters


College of Geosciences and Engineering, North China University of Water Resources and Electric Power, Zhengzhou 450046, China
*
Authors to whom correspondence should be addressed.
Sustainability 2023, 15(7), 6296; https://doi.org/10.3390/su15076296
Submission received: 3 March 2023
/
Revised: 30 March 2023
/
Accepted: 3 April 2023
/
Published: 6 April 2023
(This article belongs to the Special Issue Risk Assessment of Landslides Based on Multi-source Data and Machine Learning)
Abstract
:The dynamics parameters cause sudden change during the damage of the structural plane of landslide perilous rocks, and these can be easily accessed. Therefore the changes in dynamics parameters can effectively achieve early identification, stability evaluation, and monitoring and pre-alarming of the perilous rocks. Seven kinds of dynamic indexes, such as pulse indicator, margin index, the center of gravity frequency, root mean square frequency, impact energy, relative energy of the first frequency band, and damping ratio, are introduced and the early identification of landslide perilous rock is achieved based on the support vector machines (SVM) model, improved by particle swarm optimization algorithm. A laser vibrometer collected seven dynamic indexes of two rock masses on the reservoir bank slope in Baihebao Reservoir, China. Based on the particle group optimization algorithm optimization support vector (PSO–SVM) perilous rocks recognition model, and seven dynamic indicators, the stability of two rock masses was recognized with high efficiency and accuracy. The identification results were consistent with the landslide perilous rock identification results based on natural vibration frequency, and the results verify the accuracy of the PSO–SVM perilous rocks identification model. The results show that the sensitivity order of each identification index is: root mean square frequency > margin index > relative energy of the first frequency band > center of gravity frequency > impact energy > pulse indicator > damping ratio. The accuracy of the multi-dynamics parameters landslide perilous rock mass identification model can be improved by selecting appropriate dynamic indexes with good sensitivity. The research results have high theoretical significance and application value for early identification of landslide perilous rocks, stability evaluation, and safety monitoring, and early warning.
1. Introduction
There are enormous rock slopes in China. The rock blocks on the slope have poor stability under the action of human or natural factors and bring about a huge social impact, causing instability and damage, directly threatening people’s lives and property and engineering construction. Most of the existing monitoring and early warning of landslide perilous rocks is employed by judging their damage by monitoring displacement and stress-strain. Many scholars at home and abroad have studied the early identification of landslide perilous rocks, stability evaluation and monitoring, and early warning, and have achieved substantial achievements. There are four methods for studying the stability of wedges at home and abroad: the limit equilibrium method, limit analysis, numerical simulation, and the mathematical model method. Feng Shuren et al. [1] proposed a 3D limit equilibrium method to evaluate the stability of a slope. Xie Mowen et al. [2] combined the limit equilibrium method and geographic information system to realize the stability calculation of rock mass in three dimensions. Based on the yield rule and residual deformation, Li Dazhong [3] proposed the mesh self-adaptation and cone optimization algorithm based on the finite element method limit analysis of Mohr–Coulomb material. The finite element algorithm grid can adaptively find the sliding surface of rock mass and greatly improve the calculation accuracy. Zheng Huifeng et al. [4] established a nonlinear programming model for solving the upper limit solution of the slope strength reserve safety coefficient by means of the discrete computation region of block element method and the Mohr–Coulomb yield condition, associated flow rule, velocity boundary condition, and virtual work principle of the block system on the structural surface. The correctness of the method is verified by comparing the upper limit analysis results of the block element method with the rigid body limit equilibrium method. Zhangl et al. [5] adopted FLAC-3D to analyze the stability of slope rock mass to realize the stability evaluation and application of slope rock mass. Based on fracture mechanics and damage mechanics, Tang Hongmei [6] and others established a calculation method for the collapse time of perilous rock mass and preliminarily verified the effectiveness of this method through calculation examples. D Liu [7] employed the fuzzy mathematics method for the comprehensive evaluation of the multiple indicators of the rock slope. The results showed that the stability of the slope could be evaluated more comprehensively, and the field observation values had a good consistency. Xie Quanmin et al. [8] took the grey clustering spatial prediction method based on neural networks for rock mass slope stability, and it can accurately predict the stability of rock mass slope. M. Freyssines and D. Hantz [9] analyzed the destruction mechanism of the high and steep slope rock mass through the rock mass collapse disaster in the sedimentary area; Youssef [10] and others analyzed the stability of the rock mass slope next to the cliff road and found the area where the rock mass collapse is likely to slide; Royán [11] and others used ground laser radar to carry out long-term spatiotemporal deformation analysis and monitoring of the rock mass slope, increasing the understanding of the characteristics of rock mass damage precursors. These studies provided a good idea for the identification and accurate judgment of landslide perilous rocks but still had some limitations. Because the sudden failure of landslide perilous rock shows no obvious displacement, the accuracy and timeliness of existing methods for evaluating and monitoring the stability of landslide perilous rock are low.
Due to the sudden change of dynamics parameters in the process of damage to the structural plane of perilous rocks, dynamics parameters are easy to obtain. Therefore, based on the change of dynamics parameters, early identification, stability evaluation and monitoring, and early warning of landslide perilous rock can be realized efficiently and accurately. Y. Du et al. [12] used laser Doppler vibration measurement to identify perilous rocks, which reveals that when the rock mass stability changes, its dynamic indicators can reflect the damage of perilous rocks. A. L. Strom and O. Korup [13] believed that the destruction process of perilous rock is a dynamic process; Huo Leichen [14] and others concluded that the time and frequency domains of the object will change significantly after the injury. Du Yan et al. [15] concluded that the bonding degree between perilous rock and bedrock reduced and the natural frequency of sliding type perilous rock decreased correspondingly; Xu Qiang [16] and others found that the rock mass was not only affected by bad geological structure but also by activities such as human mining and natural disturbance such as karst for a long time. Jia Yanchang [17] and others obtained through experiments that the natural vibration frequency of perilous rock decreases with the reducing bonding area. The stability of perilous rock is closely related to its dynamic indexes (amplitude, natural vibration frequency, damping ratio, etc.). When the perilous rock structural plane of the landslide is damaged, its dynamic index will change accordingly, which has a reference value for monitoring the perilous rock collapse. Zhang Xiaoyong [18] and others established a quantitative relationship between the natural frequency and the crack depth at the rear edge of the perilous rock. Valentin [19] and others obtained different dynamic parameters (natural vibration frequency, amplitude, etc.) by analyzing the spectrum of monitoring signals, and realized the characterization of unstable rock mass by dynamic indicators. A large number of research results show that the dynamic indexes of perilous rock will change accordingly from stability to instability. According to the changes in these dynamic indicators, the stability of perilous rock can be predicted to a certain extent.
The essence of a perilous rock collapse is the damage to the structural plane, and the dynamic characteristics of the perilous rock will change to a certain extent from stability to instability. Displacement monitoring is the main method for monitoring the stability of perilous rock. However, the instability and destruction of landslide perilous rock blocks are usually characterized as sudden in time. In addition to the internal factors such as rock mass strength and structural plane damage, it is also related to many external factors such as rainfall and earthquakes. Before the failure occurs, there is no obvious displacement, so the effect of conventional and single displacement monitoring is not obvious. At the same time, monitoring is costly and difficult to widely employ. Since the perilous rock is a complicated structure, factors from external disasters and internal main controls lead to its damage [20], in this way, the perilous rock needs more indicators to make a more comprehensive evaluation. Du Yan [21] and other rock mass collapse disaster early warning ideas based on the identification of damage precursors in the separation stage have obtained an early monitoring and early warning index system based on a trinity of dynamic indicators, static indicators, and environmental quantity indicators. Jia Yanchang [22] and others calculated the bonding area between the perilous rock block and the parent rock by real-time monitoring of the natural vibration frequency of the perilous rock block and realized its stability accurately and quickly. Zhao Chen [23] and others introduced the concept of mutual approximation entropy and extended it to three dimensions, and realized the quantitative analysis of particle trajectories, which provided a new research idea for the early warning of perilous rock damage identification and collapse. As computer technology advances, support vector machines (SVM) and some hybrid algorithms have been applied to slope stability analysis in recent years and have achieved satisfactory results. Huo Leichen [24] and others realized accurate quantitative analysis of perilous rock by particle group optimization algorithm optimization support vector (PSO–SVM) based on a variety of dynamic indicators. Hong Yong [25] and others obtained the slope stability evaluation by PSO–SVM algorithm. Compared with the SVM model optimized by other methods, the PSO–SVM model has higher classification accuracy and stronger prediction ability. Zhou [26] established the PSO–SVM coupling model to predict the displacement of the Bazimen landslide in the Three Gorges Reservoir area, and the predicted value accorded with the actual value. These theories and technologies have promoted the development of early collapse monitoring and early warning of perilous rock to a certain extent and also provided a new idea for the monitoring of early collapse damage of perilous rock. The basis of a variety of dynamic indexes to evaluate the stability of perilous rocks provides important technical support for monitoring the unstable and destructed perilous rocks.
In comparison with the disadvantages including single dynamics parameters perilous rock stability evaluation and early identification method, the early identification method of perilous rock with multiple dynamic parameters has certain advantages. The identification method of perilous rock based on a multi-level dynamic index can collect more dynamics monitoring information, so it can identify the perilous rock more accurately compared with other identification methods with a single index. This paper takes landslide perilous rock as the research object, by extracting multiple dynamic parameters from it and using the PSO–SVM algorithm, to achieve rapid and accurate prediction. Using the PSO–SVM algorithm to analyze the sensitivity degree of multi-dynamic parameters can obtain the dynamic indexes with good sensitivity, and improve the accuracy and efficiency of the algorithm prediction. A final example shows the reliability of the algorithm. And, the technical method not only enriches the current identification indexes of perilous rock dynamics but also provides technical support for better identification of bad geological hazards, thereby effectively guiding the accurate and efficient implementation of collapse disaster prevention and mitigation.
2. Methods
2.1. Dynamic Characteristic Indexes of Perilous Rock
The dynamic indexes of perilous rock mainly include natural vibration frequency, damping ratio, particle trajectory, etc. The dynamic indexes of the rock mass can be divided into four kinds, namely, time domain dynamic index, frequency domain dynamic index, energy index, and modal index [27]. The vibration waveform and spectrum can extract easily accessible indexes, including the time domain, frequency domain, and some energy indicators. In this paper, seven kinds of dynamic evaluation indexes are used to carry out the initial identification of perilous rocks.
2.1.1. Pulse Indicator
The pulse indicators can be obtained from time domain signals, and the formula is as follow:
In Formula (1), refers to the pulse indicator; refers to peak value; refers to the effective value.
2.1.2. Margin Index
The margin index can be obtained from time domain signals, and the formula is as follow:
In Formula (2), refers to the margin index; refers to square root amplitude. The smaller the margin index is, the worse the stability of the rock mass.
2.1.3. Center of Gravity Frequency
The center of gravity frequency can be obtained from the spectrum graph, and the formula is as follows:
In Formula (3), is the center of gravity frequency; f is the frequency; and p(f) is the amplitude corresponding to the frequency. If the center of gravity frequency decreases, the rock mass is likely to be damaged.
2.1.4. Root Mean Square Frequency
The root mean square frequency can be obtained from the spectrum graph, using the following formula:
In Formula (4), is the root mean square frequency, is the frequency, and p(f) is the amplitude corresponding to the frequency. If the root mean square frequency drops, the rock mass is likely to be damaged and the shift to be perilous.
2.1.5. Impact Energy
Based on the vibration waveform graph, the impact energy of rock mass can be obtained, and the calculation formula is as follows:
In Formula (5), is the impact energy; c is the conversion coefficient, and the conversion coefficient is the inverse of the maximum steepness indicator; is kinetic energy; is the steepness indicator, and is the absolute average.
2.1.6. Relative Energy of the First Frequency Band
Based on the vibration waveform graph, the relative energy index of the first frequency band of the rock mass can be obtained, and the calculation formula is as follows:
In Formula (7), is the relative energy of the first frequency band; is the bandwidth of the first frequency band; and is the bandwidth of the whole frequency domain. When the relative energy of the first frequency band is larger, the rock mass vibration frequency shifts to low frequency, and it indicates that rock mass damage occurs and stability decreases.
2.1.7. Damping Ratio
The damping ratio is one of the commonly used dynamic characteristic parameters of the structure of an object to express the ability of the structure to impede its motion, and the formula is as follow:
In Formula (8), is the damping ratio of the system; is the system has a damped vibration frequency; f is the system’s undamped vibration frequency. The change of damping can judge the degree of damage to the structural surface of dangerous rock masses on the slope to some extent.
As a landslide perilous rock is a complex structure, the damage is affected by a variety of factors, and it is necessary to use a variety of indicators to make a more comprehensive evaluation of the critical rock body. By collecting seven indicators of landslide perilous rock, the PSO–SVM algorithm is used to predict the landslide perilous rock, which can better achieve the accurate identification of the landslide perilous rock compared with other single indicator identification methods.
3. Results
3.1. Identification Model of PSO–SVM Perilous Rock
Through the optimized SVM model by the PSO algorithm, seven dynamic indexes of perilous rock are analyzed by using the optimized SVM model, and the stability state of perilous rock is predicted by using the trained PSO–SVM model [23]. The identification process of the perilous rock based on the PSO–SVM model is as follows:
- Obtain seven dynamic indexes of perilous rock by measuring pulse indicator, margin index, center of gravity frequency, root mean square frequency, impact energy, damping ratio, and relative energy of the first frequency band. Normalize the dataset. Normalization is required before classification and learning sample sets and test sample sets are created;
- Then define the search range of the parameters, and set the population size, the number of iterations, and the upper and lower limits of the parameters;
- Determine an adaptation function and calculate the adaptation value of an individual. In addition, calculate the mean square error (MSE) and the square correlation coefficient. The closer the MSE is to 0, the more accurate the prediction is, and the square correlation coefficient closer is to 1, the higher the correlation between the two, indicating that the prediction effect is more accurate;
- Update the position and velocity of the particles. The current individual best-fit values for the particles are found as previously described and compared with the individual historical fit values and the globally best values, if the current fit value is better, save it, otherwise, the search continues;
- Stop the guidelines. Stop running the program after the adaptation value or the number of iterations has been met;
- Predict the perilous rock stability, using the optimized SVM parameters to establish the perilous rock identification model, an output result of 1 is a stable rock mass, and an output result of 2 is an unstable rock mass.
3.2. PSO–SVM Model Training Sample Set and Test Sample Set
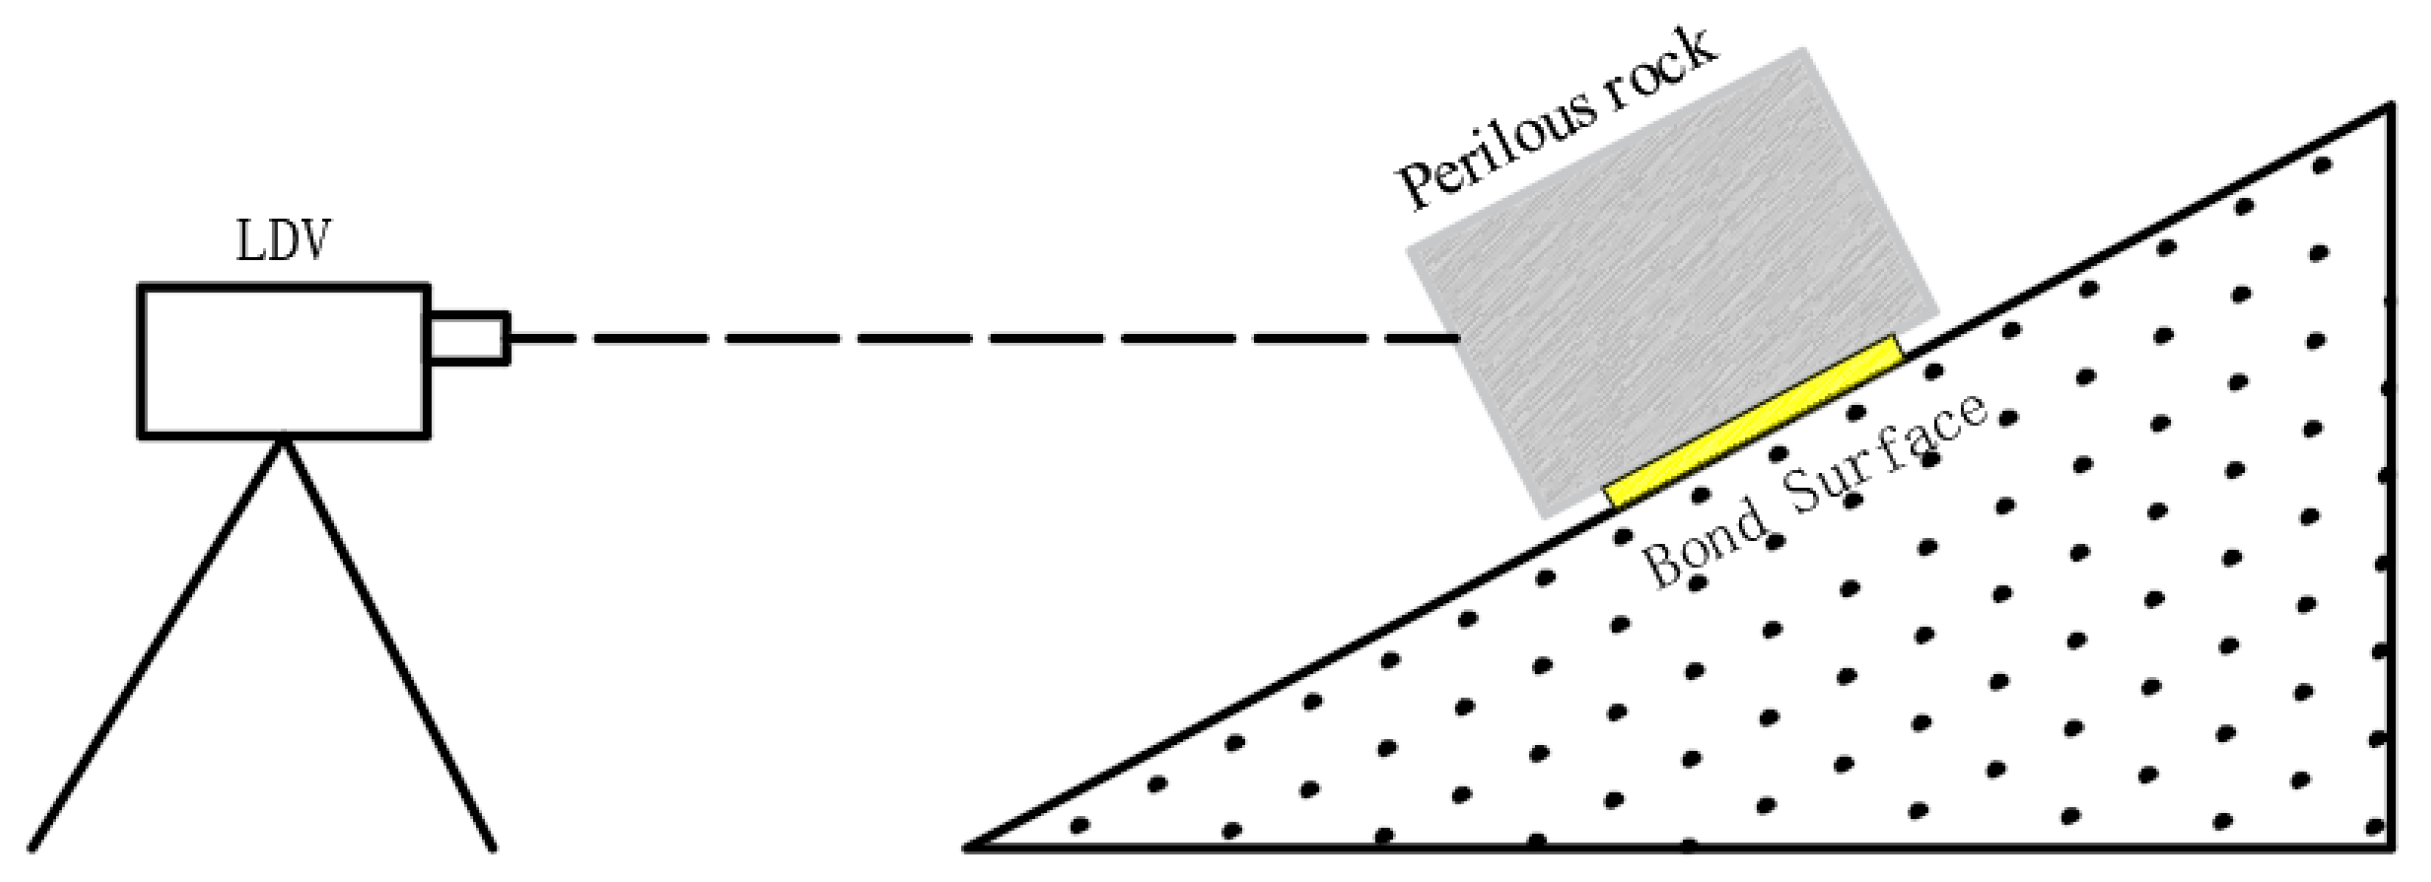
To analyze the difference in the dynamic indexes of the stable rock mass and the perilous rock mass, 20 groups of rock blocks with the same specifications and different degrees of stability (each group of test perilous rock model has a different bonding area with the base) are set up in this experiment, and the experimental principle of the model is shown in Figure 1. In the experiment, a UD100-type laser Doppler vibration detector (LDV) is used to monitor the vibration of 20 groups of rock masses remotely. The vibration waveform of rock masses can be obtained by the laser Doppler vibration detector, and then the frequency spectrum can be obtained by using a fast Fourier transform (FFT). Finally, after filtering the interference of environmental vibration and white noise, seven dynamic indicators such as pulse index, the center of gravity frequency, and impact energy of these 20 groups of rock masses can be obtained. These seven dynamic indicators are used as input vectors for the PSO–SVM model and the degree of stability is used as output vectors, where 1 represents a stable rock mass and 2 represents a perilous rock mass, and 10 groups are randomly used as training sample sets, as shown in Table 1, and another 10 groups are used as test sample sets, as shown in Table 1.
Table 3 below is the evaluation index of the prediction results of the three models. From the table, the SVM algorithm optimized by the particle swarm optimization algorithm is used to analyze the seven dynamic characteristic parameters, enjoying the best prediction effect, with the mean square error of 0.004983 and the square of correlation coefficient = 0.99562. The PSO–SVM model consisting of pulse index, margin index, center of gravity frequency, and average square frequency has the second-best prediction effect, with mean square error MSE = 0.007109 and correlation coefficient square = 0.96293. The PSO–SVM model consisting of pulse index and margin index has the worst prediction effect, with mean square error MSE = 0.104653 and correlation coefficient square = 0.72391. Therefore, by obtaining multiple dynamics parameters of rock mass, the recognition effect of the perilous rock mass can be effectively improved.
3.3. Engineering Applications
Baihebao Reservoir is an important water source in Beijing. The actual control area of the reservoir is 2.66 * square meters and the storage capacity is 0.9060 * cubic meters. The reservoir is composed of a dam, spillway, diversion and sand discharge tunnel, water transport tunnel, and other buildings. The dam is 294 m long and 42.1 m high. It is the first clay-inclined wall dam in Beijing to be mechanically cabled. The riverbed and the rocks on both sides are tuff breccia, sandy conglomerate, and limestone, and the seismic fortification intensity is 8. Due to the excavation of the reservoir construction, the rock slope is formed, and the rock stability of the slope seriously threatens the safety of the reservoir building.
3.3.1. Perilous Rock Recognition Based on PSO–SVM Model
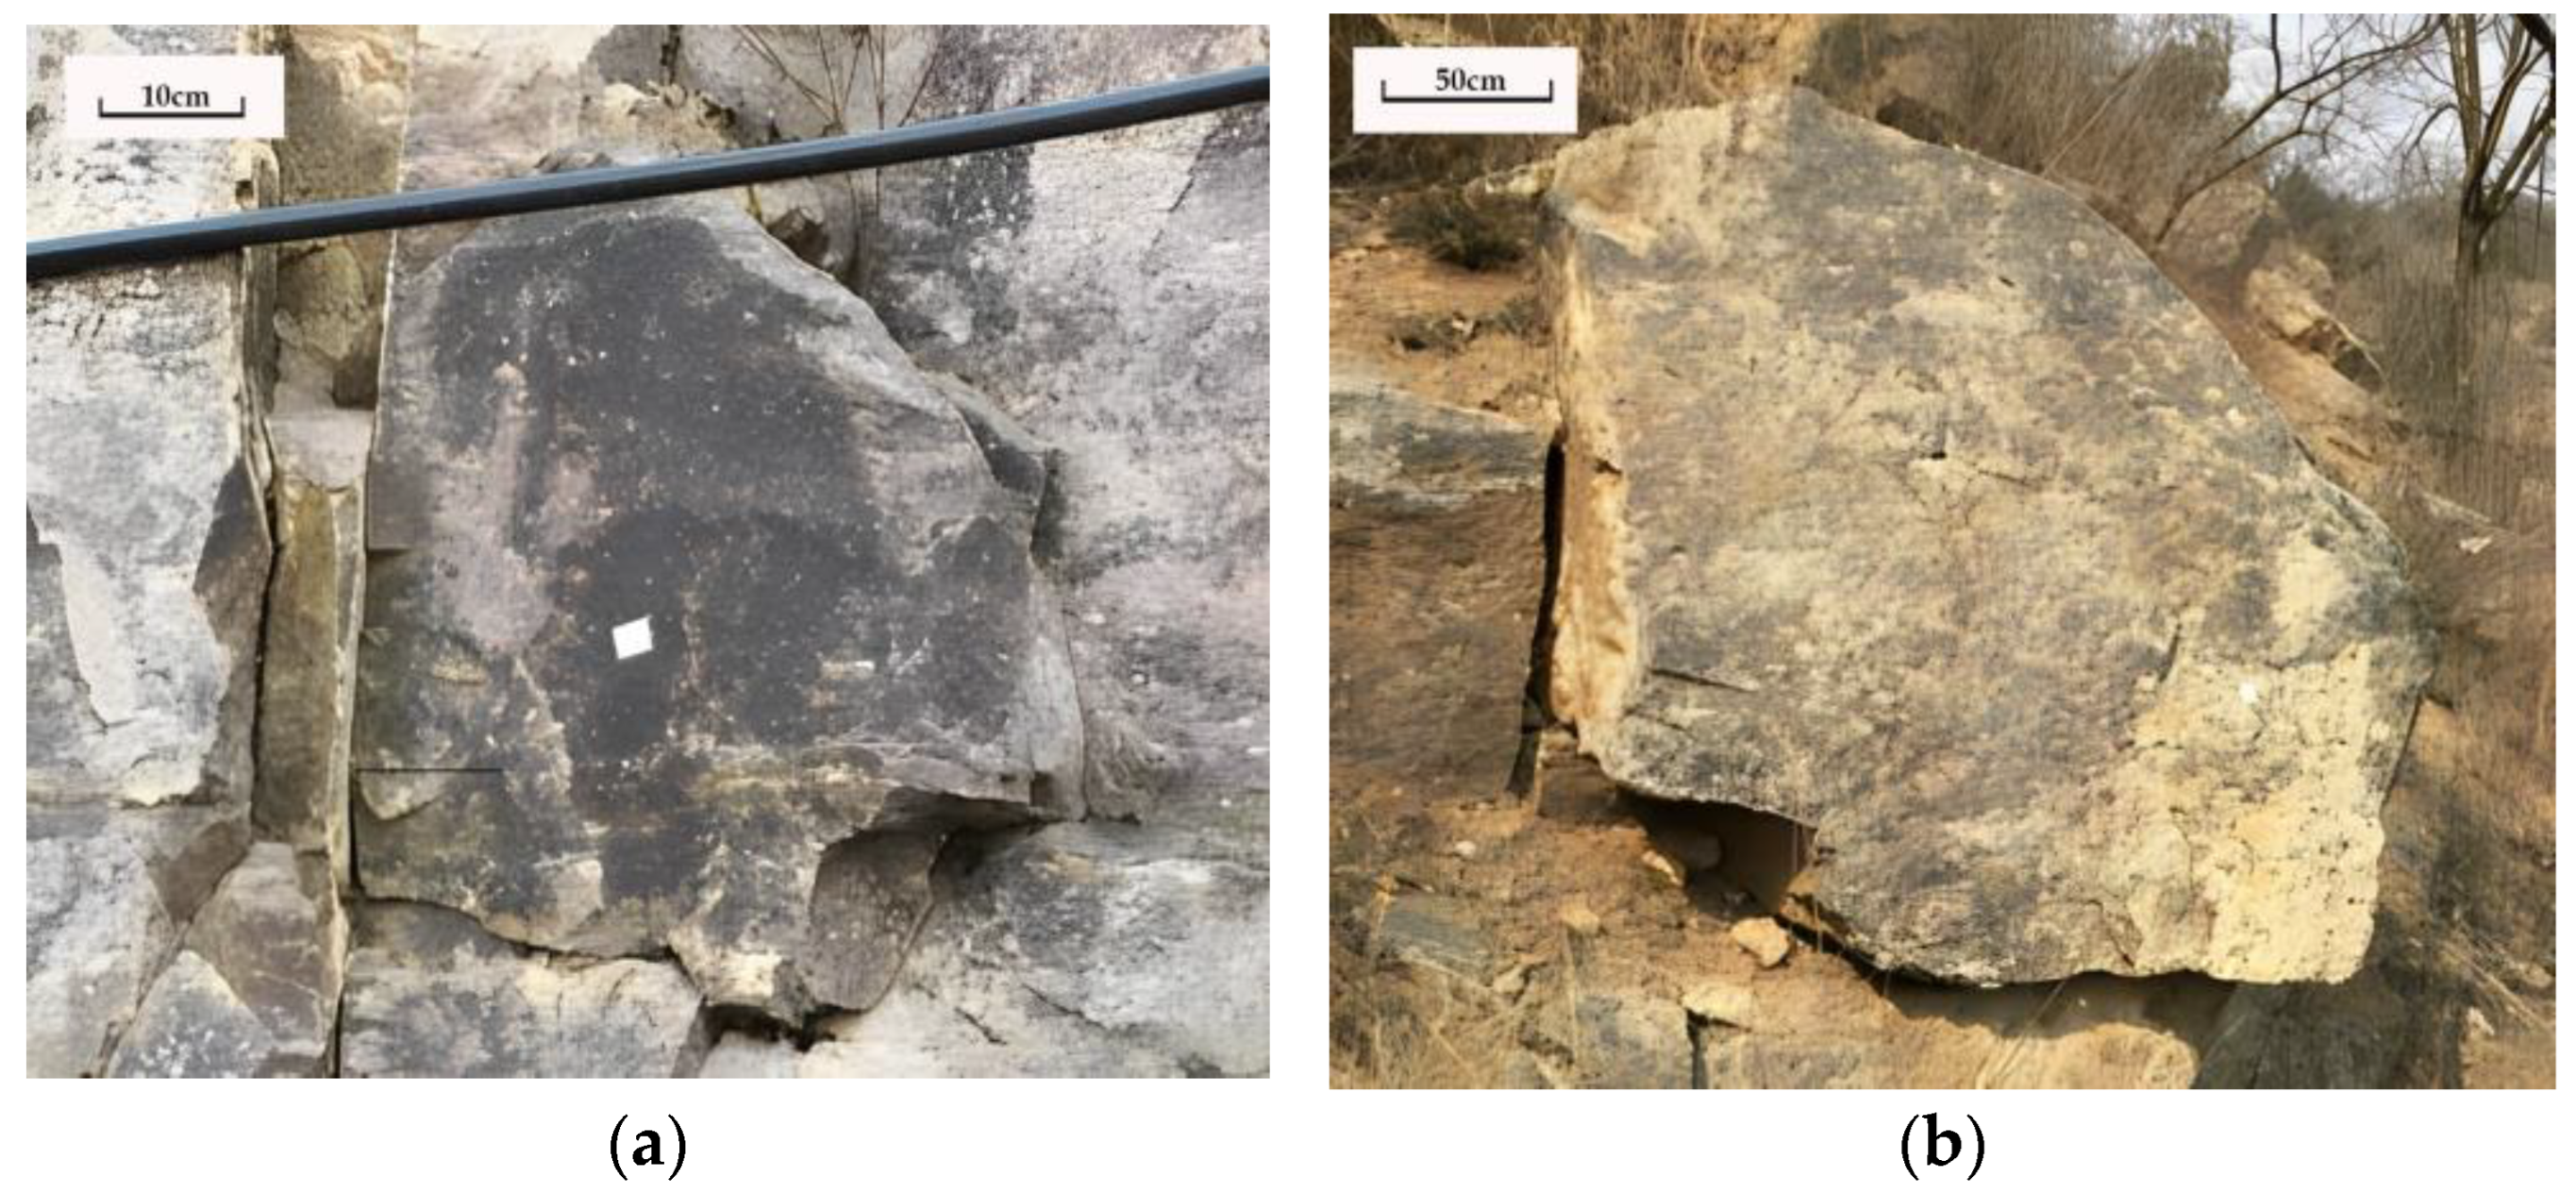
The PSO–SVM model is adopted to quickly identify two perilous rock blocks of bank slope around Baihebao reservoir. Doppler laser vibrometer is used to monitor the slope as a whole. Two slope perilous rock blocks are selected as shown in Figure 2.
Dynamics parameters measurement is carried out on slope perilous rock block by adopting a Doppler laser vibrometer on site. The time-domain map is obtained through repeated measurement, and the spectrum map is obtained by FFT transformation on the time-domain signal. Seven indexes of pulse indicator, margin index, center of gravity frequency, mean square frequency, impact energy, relative energy of the first frequency band, and damping ratio of two perilous rock blocks are calculated according to the vibration waveform map and spectrum map. Table 4 shows the characteristic parameters of two rock blocks. PSO–SVM model prediction results show that both blocks are in stable condition.
3.3.2. Perilous Rock Identification Based on Natural Vibration Frequency
Identify two perilous rock blocks around the reservoir in Baihebao based on the method of natural vibration frequency. According to the relationship between natural vibration frequency and safety factor, the formula is as follows:
- Perilous rock identification model based on natural vibration frequency.
Relationship between natural vibration frequency and stability (safety factor):
In Formula (9), K is the safety factor (no unit); V is the fissure water pressure (kN); P is the Vibration load (kN); W is the self-weight of slope perilous rock block (kN); S is the bonding area (); H is the bonding surface thickness (m). M is the slope mass of perilous rock (kg); f is the natural vibration frequency of the non-damping system (Hz); α is the slip surface inclination (); c is the bonding surface cohesion (); φ is the friction angle of the bonding surface (); E is the elastic modulus ().
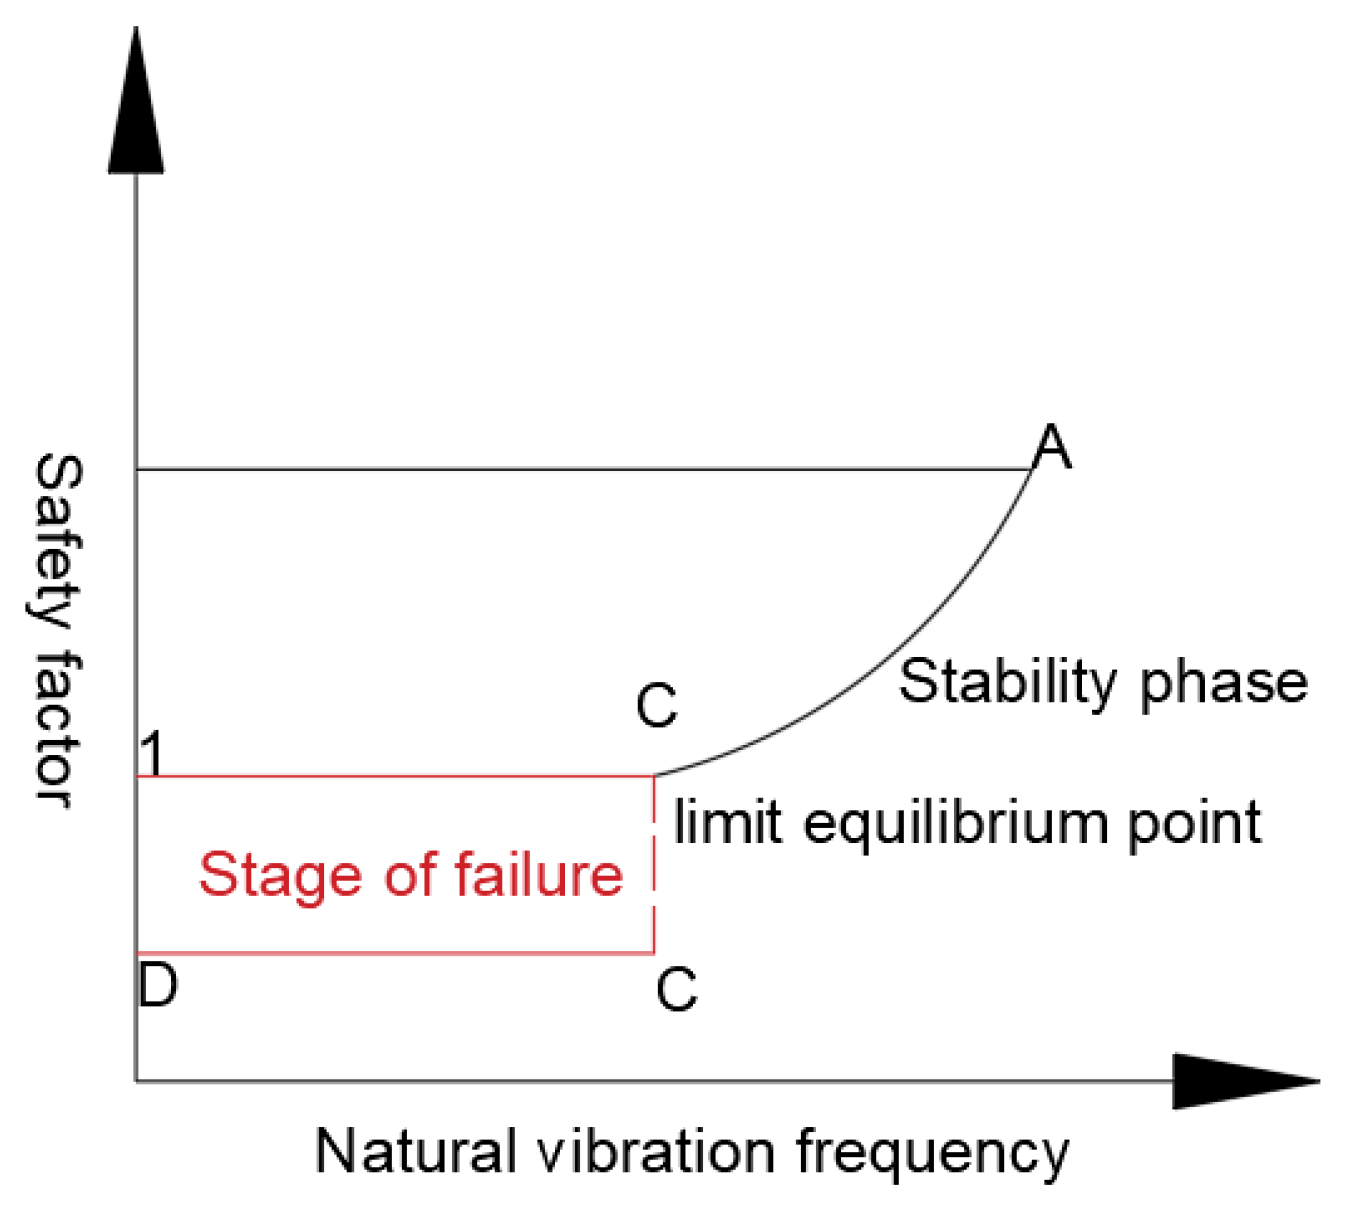
According to Formula (8), when the mass of slope perilous rock block, elastic model, inclination angle, internal friction angle, cohesion, and fissure water pressure remain unchanged, the relation between the safety factor of proton-type slope perilous rock block and natural vibration frequency is obtained by combining the destruction process of slope perilous rock block, as shown in Figure 3.
- 2.
- Identification result of perilous rock stability based on natural vibration frequency. Table 5 shows the parameters of the two rock blocks.
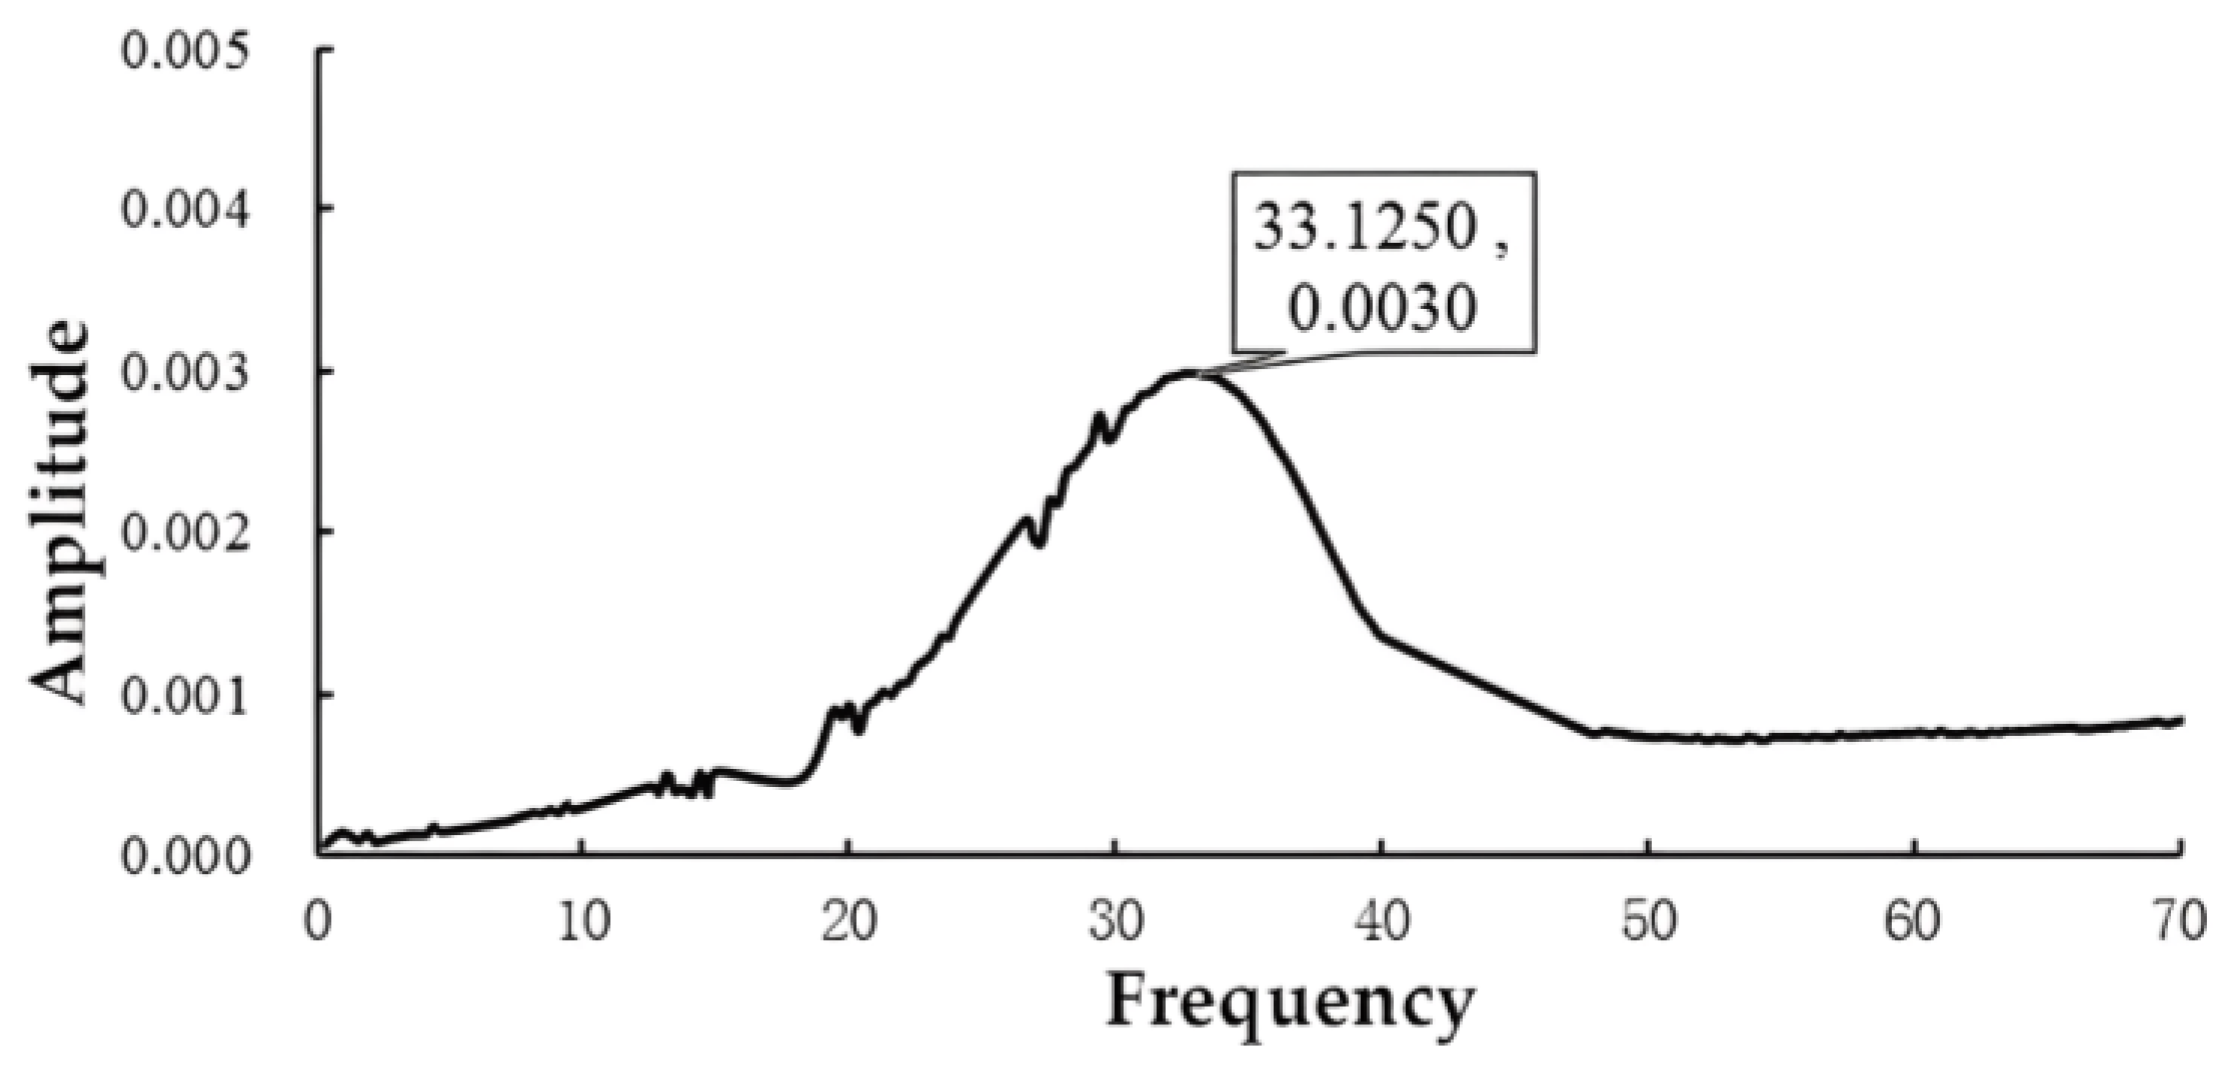
The frequency domain diagram is obtained by a laser vibrometer following the hammer excitation of the rock mass No.1. And it can be seen from Figure 3 that the natural vibration frequency of No.1 rock mass is 33.125 Hz.
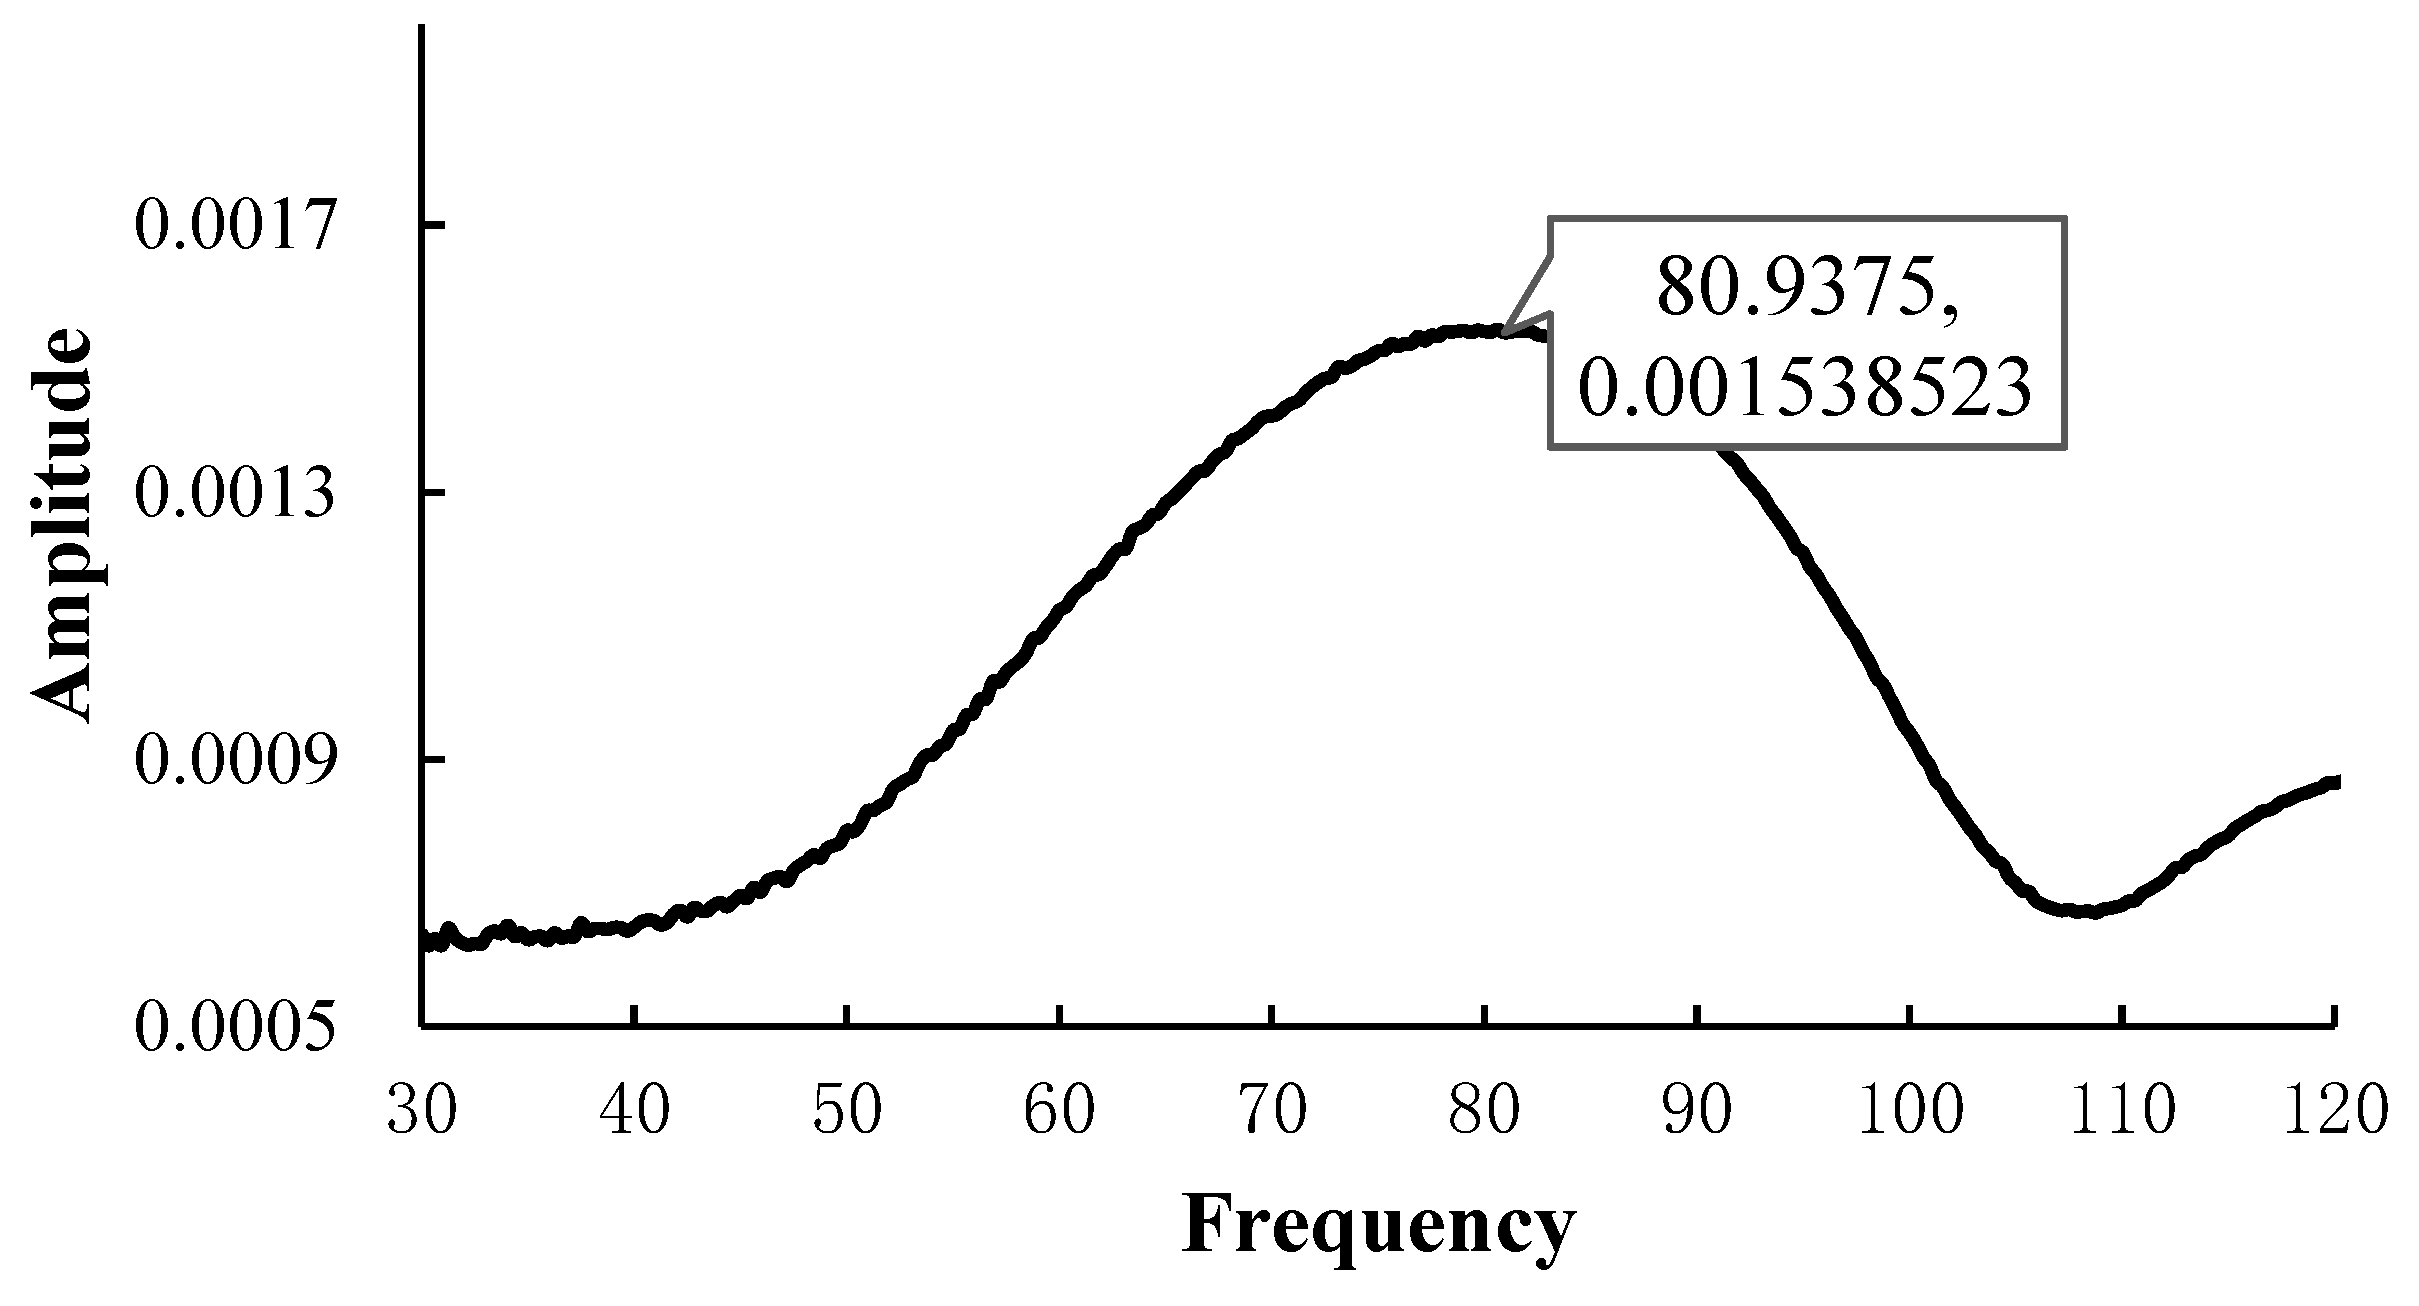
The frequency domain diagram obtained by laser vibrometer under hammer excitation of No.2 perilous rock block can be seen from Figure 4 and Figure 5 that the natural vibration frequency of No.2 perilous rock block is 80.938 Hz.
The mechanical parameters and natural vibration frequencies of the two rock blocks are brought into the model, and the safety factors of the two perilous rocks are obtained as shown in Table 6 below:
3.4. Comparison Discussion of Calculation Results
The PSO–SVM model is used to predict the two perilous rocks, and the prediction results show that the two perilous rocks are stable. Based on the natural vibration frequency, the two perilous rocks are also in a stable state. The identification results based on the natural vibration frequency are consistent with the identification results based on the PSO–SVM model, indicating that the prediction results of the PSO–SVM model are correct. Based on the PSO–SVM model, the stability identification of perilous rock is carried out by analyzing multiple dynamic indexes, and the method is accurate and easy to operate. The technology also provides better support for the identification of perilous rock stability, can be well applied to the identification and prediction of perilous rock stability, and provides guidance for disaster prevention and mitigation work.
4. Discussion
Many kinds of dynamic indexes can be used for the identification of perilous rock mass, but their sensitivity differs much. Therefore, analyzing the sensitivity degree of different dynamic characteristic parameters, selecting the identification index with the best sensitivity degree, and carrying out comprehensive analysis and application can improve the prediction accuracy of the perilous rock mass identification method based on multi-dynamics parameters. Therefore, this paper employs the PSO–SVM algorithm in the sensitivity analysis of multiple dynamics parameters. The sensitivity analysis flow of dynamic indicators based on the PSO–SVM algorithm is as follows:
- Obtain the dynamic characteristic parameter data of seven kinds of perilous rock mass and carry out normalization;
- Adopt the principle of a single variable, removing one index from each set of data, sequentially removing pulse index, margin index, center of gravity frequency, mean square frequency, relative energy of the first frequency band, impact energy, damping ratio, and re-establish a new PSO–SVM model respectively recorded as models 1 to 7;
- Run the program to calculate the MSE and square correlation coefficient of seven models respectively;
- Synthetically analyze and evaluate the MSE and indexes and obtain the sensitivity degree of various dynamics parameters to the identification of perilous rock mass. If an indicator is removed and the MSE is moderately large and moderately small, it indicates a good sensitivity and vice versa.
Table 7 is the sensitivity ranking of each indicator. It can be seen from Table 7 that the prediction effect of the five-index model with the average square frequency removed is the worst, with the mean square error MSE = 0.038191 and the square correlation coefficient = 0.89211, indicating that the sensitivity degree of the average square frequency is the best, and the effect of the five-index model with the pulse frequency removed is the greatest; the prediction effect of the five-index model with the pulse frequency removed is the best, indicating that the sensitivity degree of the pulse index is poor, and the influence degree of the pulse index on the prediction effect is the least. The sensitivity degree of each identification index can be ranked as from Table 7: mean square frequency > margin index > relative energy of the first frequency band > center of gravity frequency > impact energy > pulse indicator > damping ratio. The result can provide the basic test data for the risk evaluation model of perilous rock mass based on multi-data analysis, and the dynamic index with the best sensitivity can be selected by this method, to improve the prediction efficiency and accuracy based on multi-dynamics parameters of perilous rock mass identification model.
5. Conclusions
- Based on the pulse indicator, margin index, the center of gravity frequency, root mean square frequency, impact energy, relative energy of the first frequency band, and damping ratio, the learning sample and test sample sets are established. In addition, the early identification model of the PSO–SVM perilous rock is constructed when the SVM model is improved by the particle swarm optimization algorithm;
- The PSO–SVM model is adopted to quickly identify two perilous rock blocks around the reservoir in Baihebao, and the identification results are consistent with that of landslide perilous rock masses based on natural vibration frequency, indicating that its identification model based on PSO–SVM is accurate and feasible. The example proves that the PSO–SVM model can accurately and efficiently realize early identification of landslide perilous rocks, stability evaluation, safety monitoring, and early warning. It has high theoretical significance and application value.
- The results show that the sensitivity order of each identification index is mean square frequency > margin index > relative energy of the first frequency band > center of gravity frequency > impact energy > pulse indicator > damping ratio. Selecting appropriate dynamic indexes with good sensitivity can improve the accuracy of the landslide perilous rock mass identification model based on multi-dynamics parameters.
Author Contributions
Conceptualization, Y.J. and T.J.; methodology, Y.J.; software, Z.L.; validation, Y.J., S.W. and G.S.; formal analysis, Z.L.; investigation, Y.J.; resources, T.J.; data curation, Z.L.; writing—original draft preparation, Z.L.; writing—review and editing, Y.J.; visualization, S.W.; supervision, G.S. and Y.L.; project administration, Y.J.; funding acquisition, Y.J. All authors have read and agreed to the published version of the manuscript.
Funding
This research was funded by the National Natural Science Foundation of China (No. U1704243) and the Natural Science Foundation granted by the Department of Education, Anhui Province (No. KJ2020A0235).
Institutional Review Board Statement
Not applicable.
Informed Consent Statement
Not applicable.
Data Availability Statement
Not applicable.
Conflicts of Interest
The authors declare no conflict of interest.
References
- Fengn, S.; Feng, D.; Ge, X.; Gu, X. 3D limit equilibrium method for slope stability and its application. Chin. J. Geotech. Eng. 1999, 21, 657–661. [Google Scholar]
- Xie, M.W.; Cai, M.F.; Esaki, T. GIS-based three-dimensional slope stability limit equilibrium method and application. Rock Soil Mech. 2006, 27, 117–122. (In Chinese) [Google Scholar]
- LI, D.Z.; Zheng, R.M.; Wang, J.A.; Yang, Y.; Li, N. Application of finite-element-based limit analysis with mesh adaptation in geotechnical engineering. Chin. J. Geotech. Eng. 2013, 35, 922–929. [Google Scholar]
- Zheng, H.; Chen, S.; Wu, G. Upper bound limit method for stability analysis of rock slopes by block element method. Rock Soil Mech. 2008, 29, 323–327. (In Chinese) [Google Scholar]
- Zhang, L.J.; Hu, Z.J.; Lei, J. Application of FLAC-3D to stability analysis of slope rock mass. Rock Soil Mech. 2005, 26, 61–64. (In Chinese) [Google Scholar]
- Tang, H.M.; Wang, L.F.; Chen, H.K.; Xian, X.F. Collapse sequence of perilous rock on cliffs with soft foundation. Chin. J. Geotech. Eng. 2010, 32, 205–210. [Google Scholar]
- Liu, D.; Tham, L.G.; Lee, P.; Tsui, Y.; Wang, Y. Stability of Rock Slope and Fuzzy Comprehensive Evaluation Method. Chin. J. Rock Mech. Eng. 1999, 18, 170–175. [Google Scholar]
- Xie, Q.; Xia, Y.; Zhu, R. A method of grey cluster spatial prediction of rock-mass slope stability based on artificial neural network and its application. J. Catastrophology 2001, 16, 2–7. (In Chinese) [Google Scholar] [CrossRef]
- Frayssines, M.; Hantz, D. Modelling and Back-Analysing Failures in Steep Limestone Cliffs. Int. J. Rock Mech. Min. Sci. 2009, 46, 1115–1123. [Google Scholar] [CrossRef] [Green Version]
- Youssef, A.M.; Maerz, N.H.; Al-Otaibi, A.A. Stability of Rock Slopes along Raidah Escarpment Road, Asir Area, Kingdom of Saudi Arabia. J. Geogr. Geol. 2012, 4, 48. [Google Scholar] [CrossRef]
- Royán, M.J.; Abellán, A.; Jaboyedoff, M.; Vilaplana, J.M.; Calvet, J. Spatio-Temporal Analysis of Rockfall Pre-Failure Deformation Using Terrestrial LiDAR. Landslides 2014, 11, 697–709. [Google Scholar] [CrossRef]
- Du, Y.; Lu, Y.; Xie, M.; Jia, J. A New Attempt for Early Warning of Unstable Rocks Based on Vibration Parameters. Bull. Eng. Geol. Environ. 2020, 79, 4363–4368. [Google Scholar] [CrossRef]
- Strom, A.L.; Korup, O. Extremely Large Rockslides and Rock Avalanches in the Tien Shan Mountains, Kyrgyzstan. Landslides 2006, 3, 125–136. [Google Scholar] [CrossRef]
- Huo, L.; Du, Y.; Xie, M.; Zhang, X.; Jia, B.; Cong, X. Unstable rock mass identification method based on time and frequency domain dynamic parameters. Chin. J. Rock Mech. Eng. 2021, 40, 3156–3162. [Google Scholar]
- Du, Y.; Xie, M.; Jiang, J.; Li, B.; Gao, H. Methods for determining early warning indices Based on natural frequency monitoring. Rock Soil Mech. 2015, 36, 2284–2290. (In Chinese) [Google Scholar]
- Xu, Q.; Huang, R.; Yin, Y.; Hou, S.; Dong, X.; Fan, X.; Tang, M. The Jiweishan Landslide of June 5, 2009 in Wulong, ChongQing:Characteristics and Failure Mechanism. J. Eng. Geol. 2009, 17, 433–444. (In Chinese) [Google Scholar]
- Jia, Y.; Xie, M. Study on Stability Model of Slope Dangerous Rock Mass Based on Dynamic Characteristics; University of Science and Technology Beijing: Beijing, China, 2018. [Google Scholar]
- Zhang, X.; Xie, M.; Zhang, L.; Du, Y.; Liu, W.; Gao, S. Study on calculation model of stability coefficient of falling dangerous rock mass based on natural frequency. Chin. J. Rock Mech. Eng. 2023, 42, 585–593. [Google Scholar] [CrossRef]
- Valentin, J.; Capron, A.; Jongmans, D.; Baillet, L.; Bottelin, P.; Donze, F.V.; Larose, É.; Mangeney, A. The Dynamic Response of Prone-to-Fall Columns to Ambient Vibrations: Comparison between Measurements and Numerical Modelling. Geophys. J. Int. 2017, 208, 1058–1076. [Google Scholar] [CrossRef]
- Du, Y.; Xie, M.; Jiang, Y.; Chen, C.; Jia, B.; Huo, L. Review on the Formation Mechanism and Early Warning of Rock Collapse. Metal Mine 2021, 50, 106–119. (In Chinese) [Google Scholar]
- Du, Y.; Xie, M.; Jiang, Y.; Liu, W.; Liu, R.; Liu, Q. Research progress on dynamic monitoring index for early warning of rock collapse. Chin. J. Eng. 2019, 41, 427–435. [Google Scholar]
- Jia, Y.; Xie, M.; Chang, S.; Lv, F. A model for evaluation of stability of sliding- and falling-type dangerous rock blocks based on natural vibration frequency. Rock Soil Mech. 2017, 38, 2149–2156. [Google Scholar]
- Zhao, C.; Xie, M.; Liu, W.; Lu, G. Research on Damage Identification of Dangerous Rock Mass Based on Particle Trajectory. Metal Mine 2022, 550, 66–71. (In Chinese) [Google Scholar]
- Huo, L.; Du, Y.; Xie, M.; Liu, W.; Zhang, X.; Jia, B.; Cong, X. Unstable rock mass identification method based on multi-level dynamic parameters. Chin. J. Rock Mech. Eng. 2022, 41, 3124–3131. [Google Scholar]
- Hong, Y.; Shao, Z.; Ma, L. Application of a Support Vector Machine for Analysis and Prediction of Slope Stability. J. Shenyang Jianzhu Univ. (Nat. Sci.) 2017, 33, 1004–1010. [Google Scholar]
- Zhou, C.; Yin, K.; Cao, Y.; Ahmed, B. Application of Time Series Analysis and PSO–SVM Model in Predicting the Bazimen Landslide in the Three Gorges Reservoir, China. Eng. Geol. 2016, 204, 108–120. [Google Scholar] [CrossRef]
- Du, Y.; Huo, L.; Xie, M.; Jiang, Y.; Jia, B.; Cong, X. Monitoring and early warning experiment of rock collapse. Chin. J. Theor. Appl. Mech. 2021, 53, 1212–1221. [Google Scholar] [CrossRef]
Figure 1.
Schematic view of the model experiment.

Figure 2.
Slope perilous rock blocks. (a) No.1 perilous rock block; (b) No.2 perilous rock block.

Figure 3.
A schematic diagram between the safety factor and natural vibration frequency of slope perilous rock block with spring proton vibration.
Figure 3.
A schematic diagram between the safety factor and natural vibration frequency of slope perilous rock block with spring proton vibration.

Figure 4.
Frequency domain diagram of rock block No.1.

Figure 5.
Frequency domain diagram of rock block No.2.


Table 1.
Training samples.
| Number | Bonding Area | Stabilization | |||||||
|---|---|---|---|---|---|---|---|---|---|
| 1 | 0.0225 | 4.43 | 6.65 | 255.83 | 292.71 | 0.03 | 0.0198 | 0.0212 | 1 |
| 2 | 0.02025 | 4.24 | 6.42 | 251.33 | 296.66 | 0.02 | 0.0401 | 0.0238 | 1 |
| 3 | 0.018 | 3.51 | 5.22 | 245.63 | 281.66 | 0.03 | 0.0049 | 0.0329 | 1 |
| 4 | 0.01575 | 3.35 | 4.99 | 246.37 | 295.63 | 0.03 | 0.0215 | 0.0392 | 1 |
| 5 | 0.0135 | 3.49 | 5.32 | 251.05 | 289.83 | 0.02 | 0.0079 | 0.0413 | 1 |
| 6 | 0.01125 | 2.62 | 3.49 | 139.53 | 211.35 | 0.19 | 0.0091 | 0.0588 | 2 |
| 7 | 0.009 | 2.21 | 2.86 | 130.65 | 204.53 | 0.22 | 0.0103 | 0.0634 | 2 |
| 8 | 0.00675 | 1.98 | 2.33 | 79.63 | 150.31 | 0.41 | 0.012 | 0.0785 | 2 |
| 9 | 0.0045 | 2.04 | 2.53 | 82.74 | 156.53 | 0.39 | 0.0239 | 0.0798 | 2 |
| 10 | 0.00225 | 1.59 | 1.65 | 75.55 | 147.83 | 0.41 | 0.019 | 0.0831 | 2 |
Table 2.
Testing samples.
| Number | Bonding Area | Stabilization | |||||||
|---|---|---|---|---|---|---|---|---|---|
| 1 | 0.01 | 3.52 | 5.33 | 245.38 | 281.63 | 0.02 | 0.0092 | 0.0128 | 1 |
| 2 | 0.009 | 3.51 | 5.35 | 239.33 | 283.63 | 0.03 | 0.0082 | 0.0225 | 1 |
| 3 | 0.008 | 3.32 | 4.97 | 258.32 | 295.63 | 0.03 | 0.0125 | 0.0289 | 1 |
| 4 | 0.007 | 3.49 | 5.53 | 239.48 | 288.63 | 0.03 | 0.0101 | 0.0327 | 1 |
| 5 | 0.006 | 3.01 | 4.52 | 251.01 | 286.32 | 0.03 | 0.0102 | 0.0471 | 1 |
| 6 | 0.005 | 2.56 | 3.38 | 133.29 | 206.56 | 0.18 | 0.0068 | 0.0543 | 2 |
| 7 | 0.004 | 2.53 | 3.47 | 109.45 | 188.26 | 0.23 | 0.0076 | 0.0641 | 2 |
| 8 | 0.003 | 1.93 | 2.36 | 102.49 | 182.79 | 0.36 | 0.019 | 0.0711 | 2 |
| 9 | 0.002 | 1.75 | 1.69 | 72.16 | 152.63 | 0.49 | 0.022 | 0.0795 | 2 |
| 10 | 0.001 | 1.86 | 1.72 | 88.34 | 162.35 | 0.41 | 0.0502 | 0.0867 | 2 |
Table 3.
Evaluation results.
| Methods | Identify Indicators | MSE | |
|---|---|---|---|
| Time Domain Indicators | 0.104653 | 0.72391 | |
| Time and frequency domain indicators | 0.007109 | 0.96293 | |
| Multi-dynamic characteristic parameters | 0.004983 | 0.99562 |
Table 4.
Characteristic parameters of two rock blocks.
| Number | |||||||
|---|---|---|---|---|---|---|---|
| 1 | 2.01 | 2.05 | 110.43 | 202.78 | 72.65 | 0.15 | 0.0820 |
| 2 | 0.804 | 0.811 | 65.85 | 92.23 | 3065.61 | 0.33 | 0.0931 |
Table 5.
Parameters of the two rock blocks.
| Number | Elastic Modulus | Quality | Bond Surface Thickness | Width | Length | C | c | |
|---|---|---|---|---|---|---|---|---|
| 1 | 200 | 90° | 189 | 0.05 | 0.5 | 0.2 | 15.0 | 5.0 |
| 2 | 200 | 30° | 5197.5 | 0.1 | 2.5 | 1.1 | 15.0 | 5.0 |
Table 6.
Calculation results of stability of perilous rock blocks.
| Number | Bonding Area | Stability Factor | Stability |
|---|---|---|---|
| 1 | 0.020 | 1.40 | stable |
| 2 | 1.008 | 22.06 | stable |
Table 7.
Sensitivity ranking.
| Number | Index | MSE | Sensitivity Ranking | |
|---|---|---|---|---|
| 1 | 0.005456 | 0.96392 | 6 | |
| 2 | 0.048325 | 0.91231 | 2 | |
| 3 | 0.009031 | 0.96032 | 4 | |
| 4 | 0.038191 | 0.89211 | 1 | |
| 5 | 0.008635 | 0.96710 | 3 | |
| 6 | 0.007261 | 0.96893 | 5 | |
| 7 | ξ | 0.004091 | 0.97151 | 7 |
Disclaimer/Publisher’s Note: The statements, opinions and data contained in all publications are solely those of the individual author(s) and contributor(s) and not of MDPI and/or the editor(s). MDPI and/or the editor(s) disclaim responsibility for any injury to people or property resulting from any ideas, methods, instructions or products referred to in the content. |
© 2023 by the authors. Licensee MDPI, Basel, Switzerland. This article is an open access article distributed under the terms and conditions of the Creative Commons Attribution (CC BY) license (https://creativecommons.org/licenses/by/4.0/).
Share and Cite
MDPI and ACS Style
Jia, Y.; Li, Z.; Jiang, T.; Li, Y.; Wang, S.; Song, G. Study on Early Identification of Landslide Perilous Rocks Based on Multi-Dynamics Parameters. Sustainability 2023, 15, 6296. https://doi.org/10.3390/su15076296
AMA Style
Jia Y, Li Z, Jiang T, Li Y, Wang S, Song G. Study on Early Identification of Landslide Perilous Rocks Based on Multi-Dynamics Parameters. Sustainability. 2023; 15(7):6296. https://doi.org/10.3390/su15076296
Chicago/Turabian StyleJia, Yanchang, Zhanhui Li, Tong Jiang, Yan Li, Shaokai Wang, and Guihao Song. 2023. "Study on Early Identification of Landslide Perilous Rocks Based on Multi-Dynamics Parameters" Sustainability 15, no. 7: 6296. https://doi.org/10.3390/su15076296
Note that from the first issue of 2016, this journal uses article numbers instead of page numbers. See further details here.