

Rhizosphere Acidification Determines Phosphorus Availability in Calcareous Soil and Influences Faba Bean (Vicia faba) Tolerance to P Deficiency


Abstract
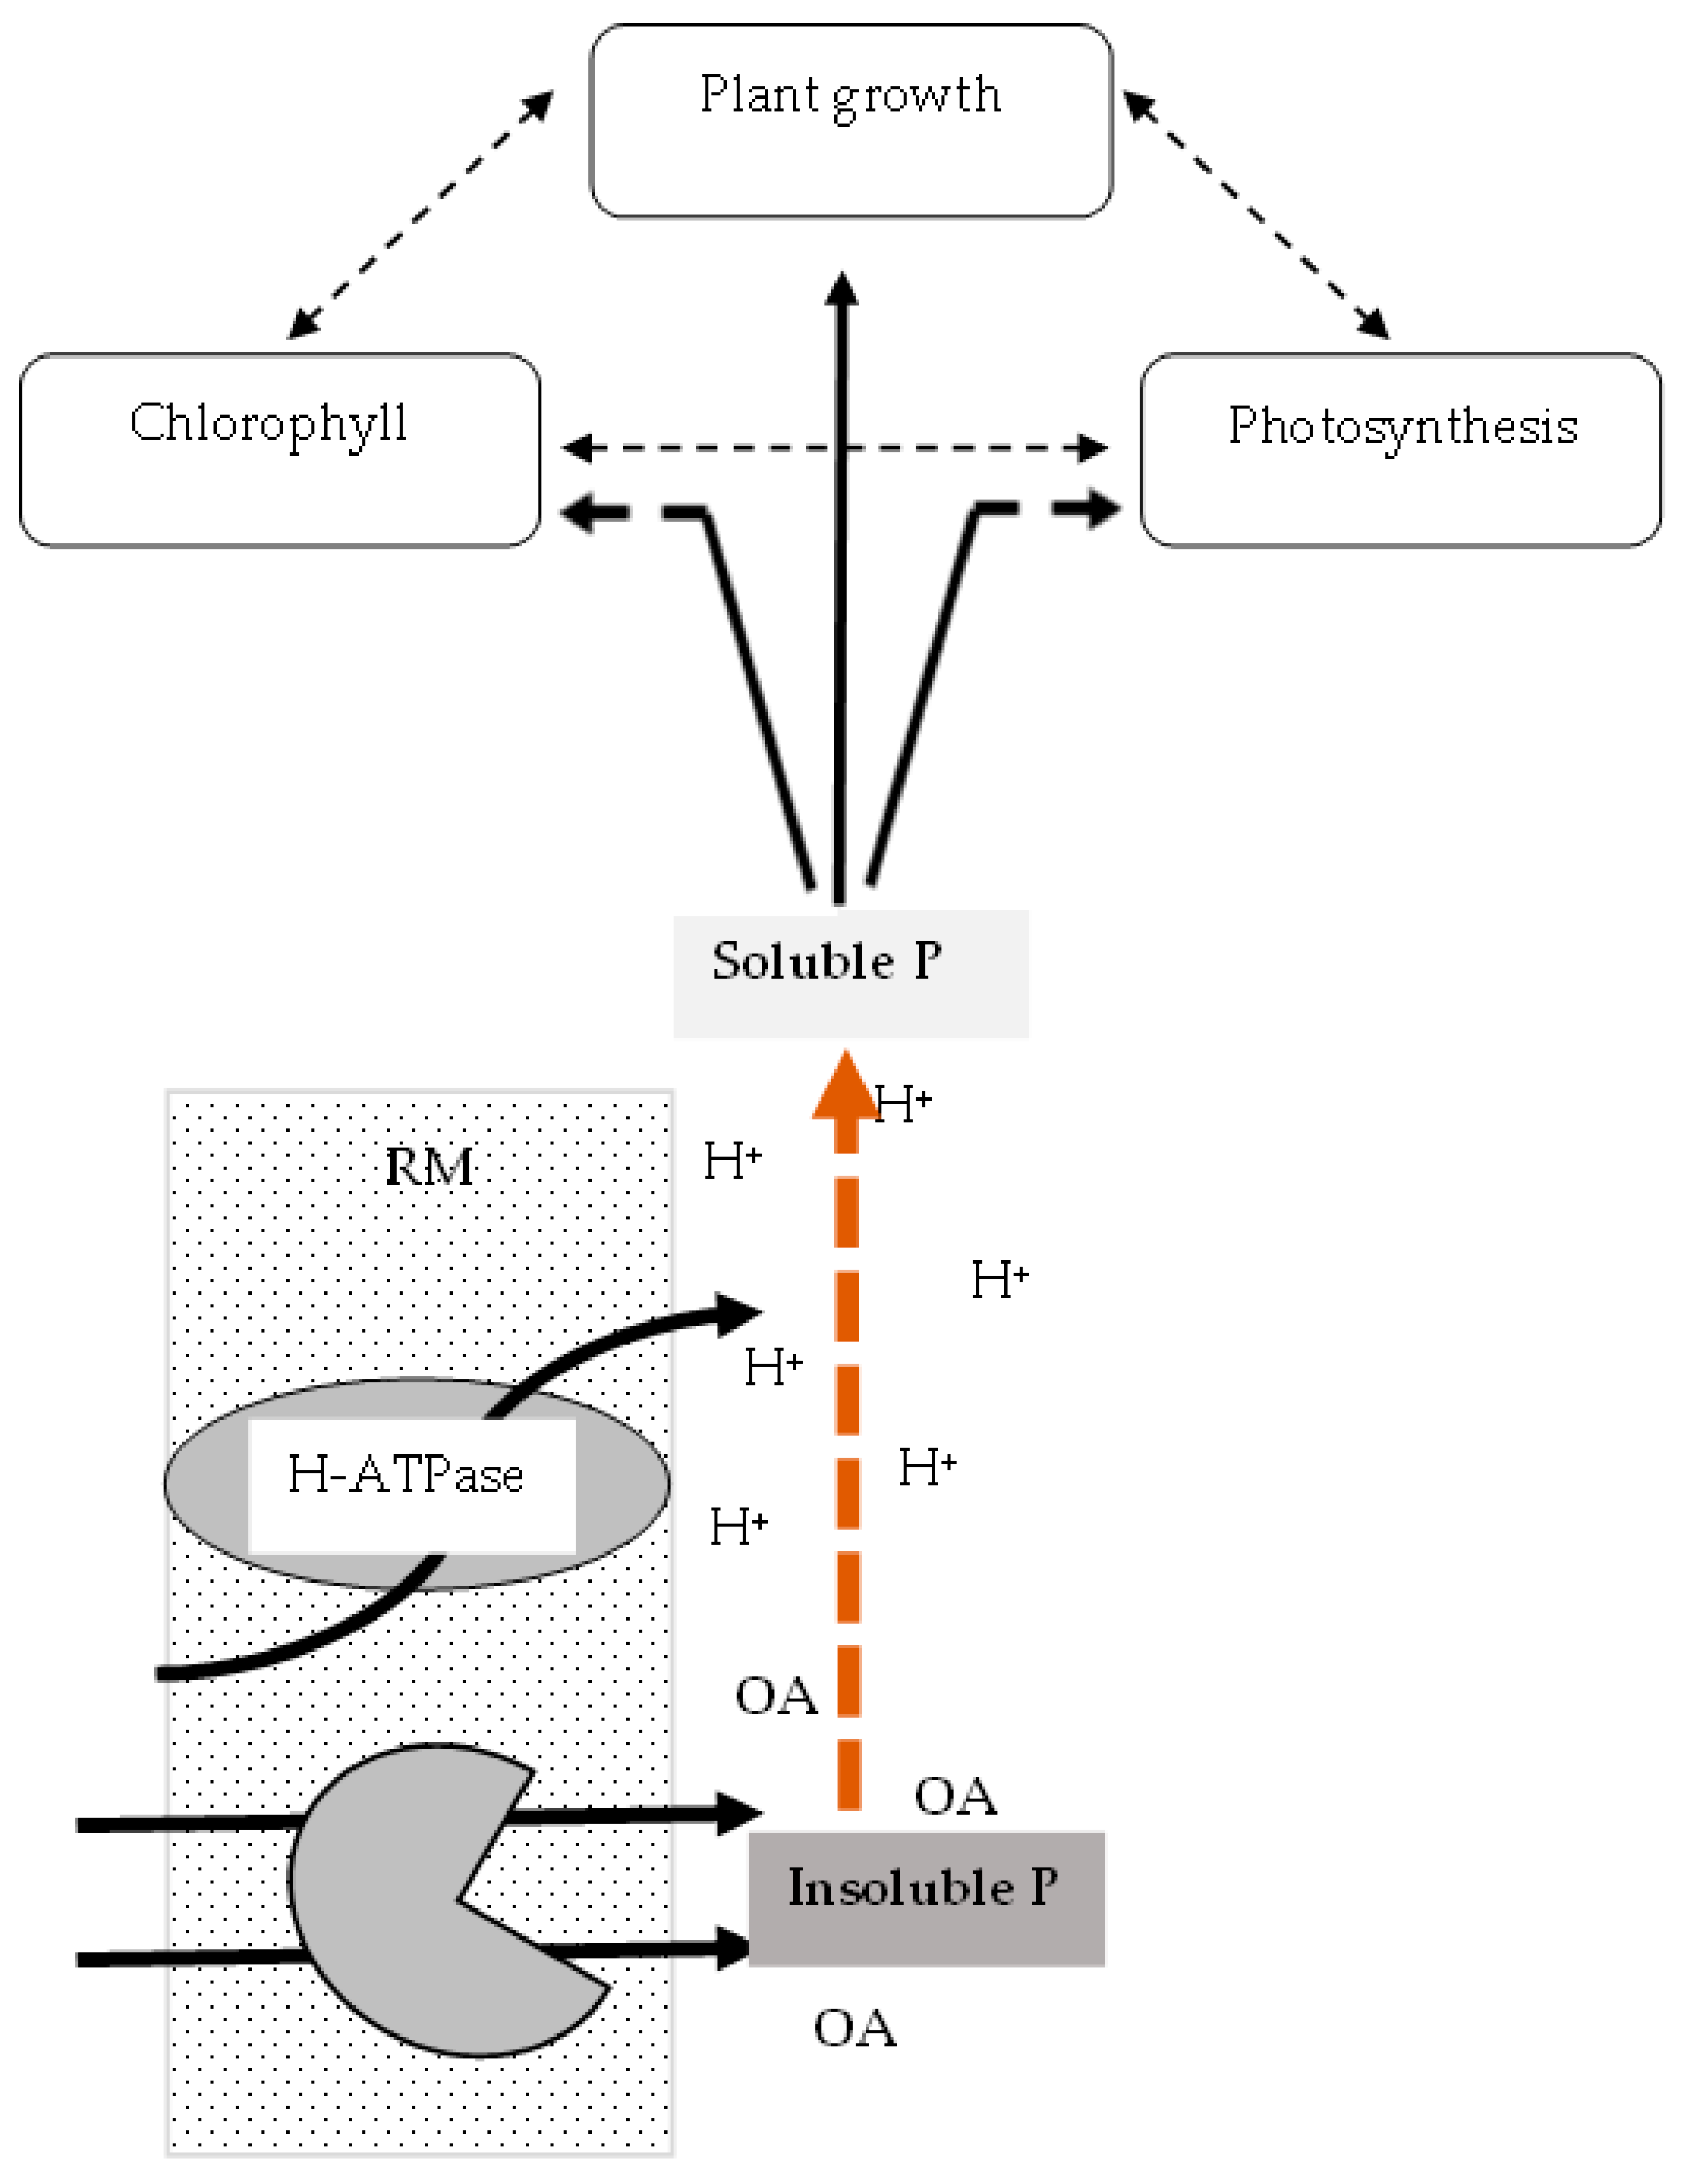
:1. Introduction
2. Materials and Methods
2.1. Plant Materials and Experimental Design
2.2. SPAD Index
2.3. Gas Exchange
2.4. Phosphorus Analysis
2.5. Rhizosphere Acidification Capacity
2.6. Analysis Criteria
2.7. Statistical Analyses
3. Results
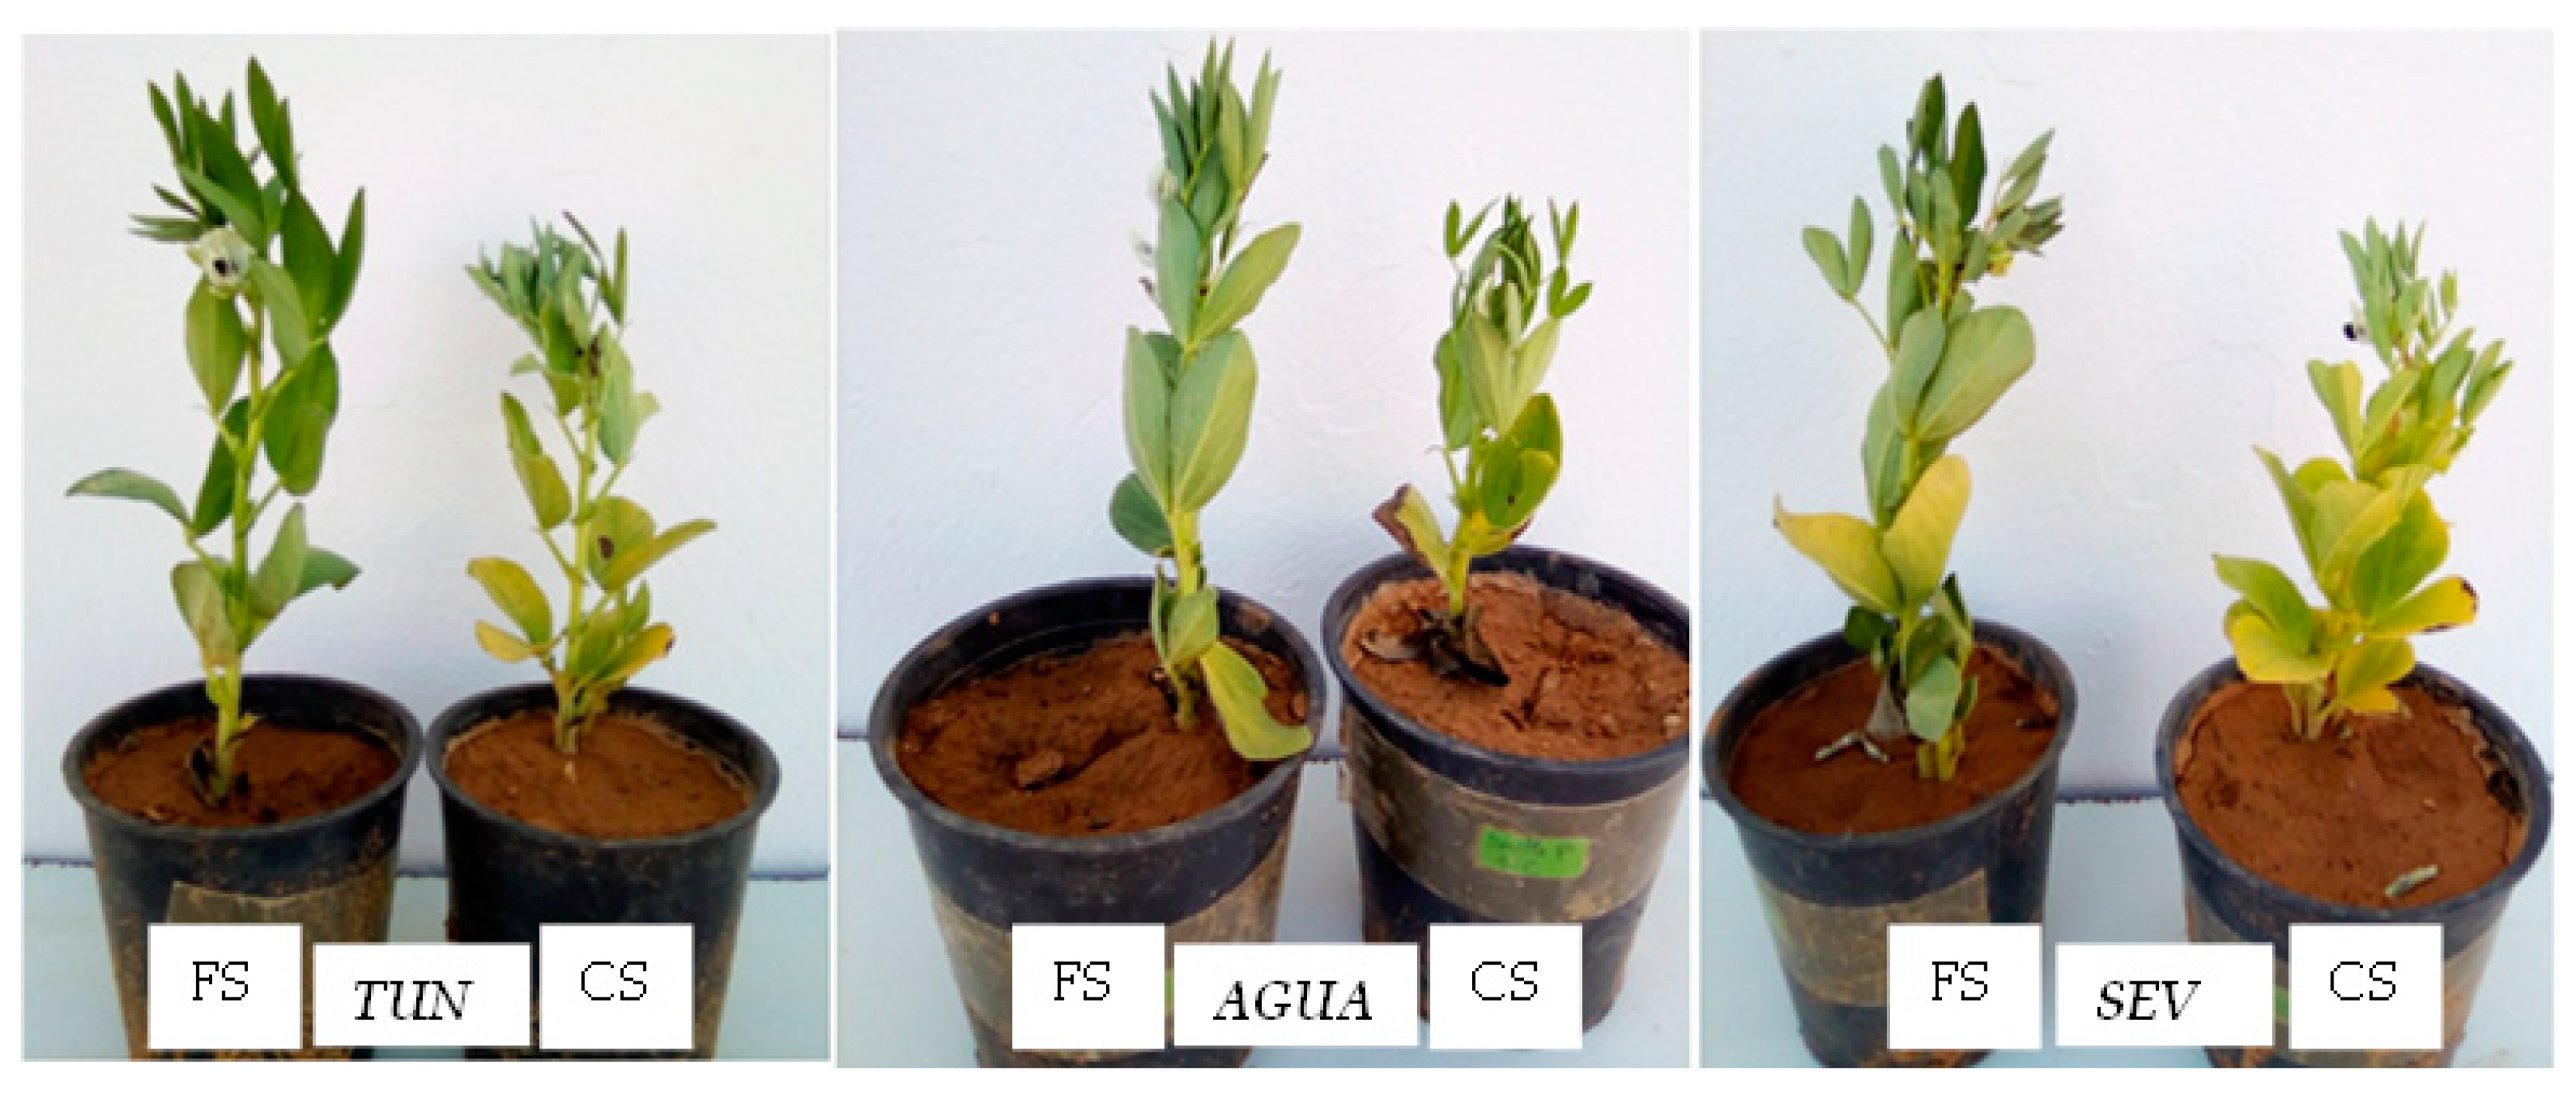
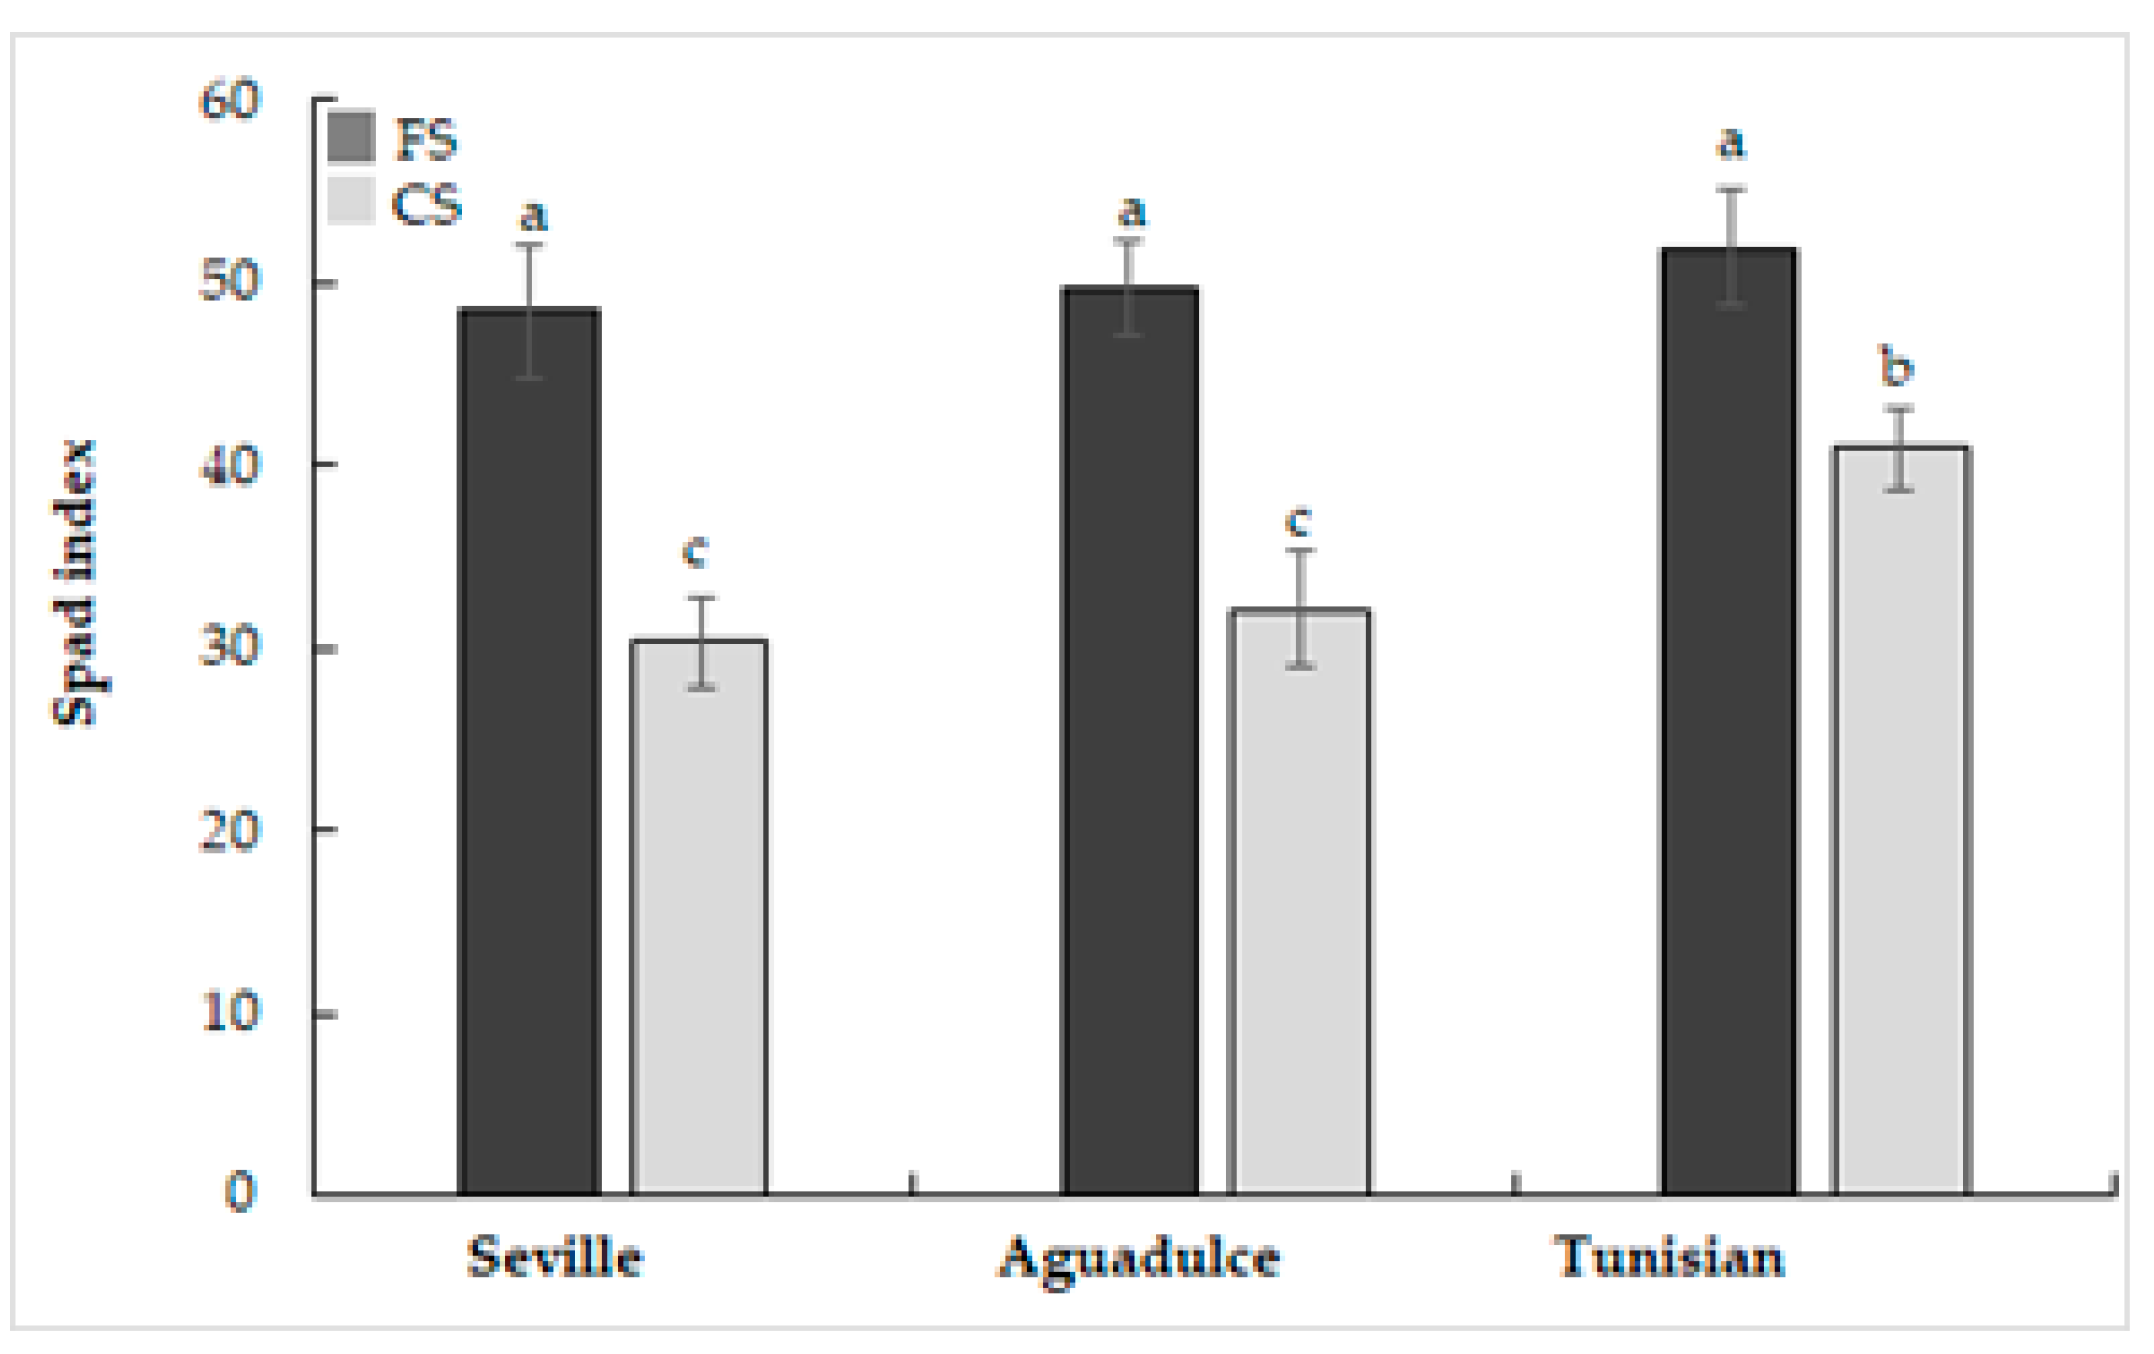
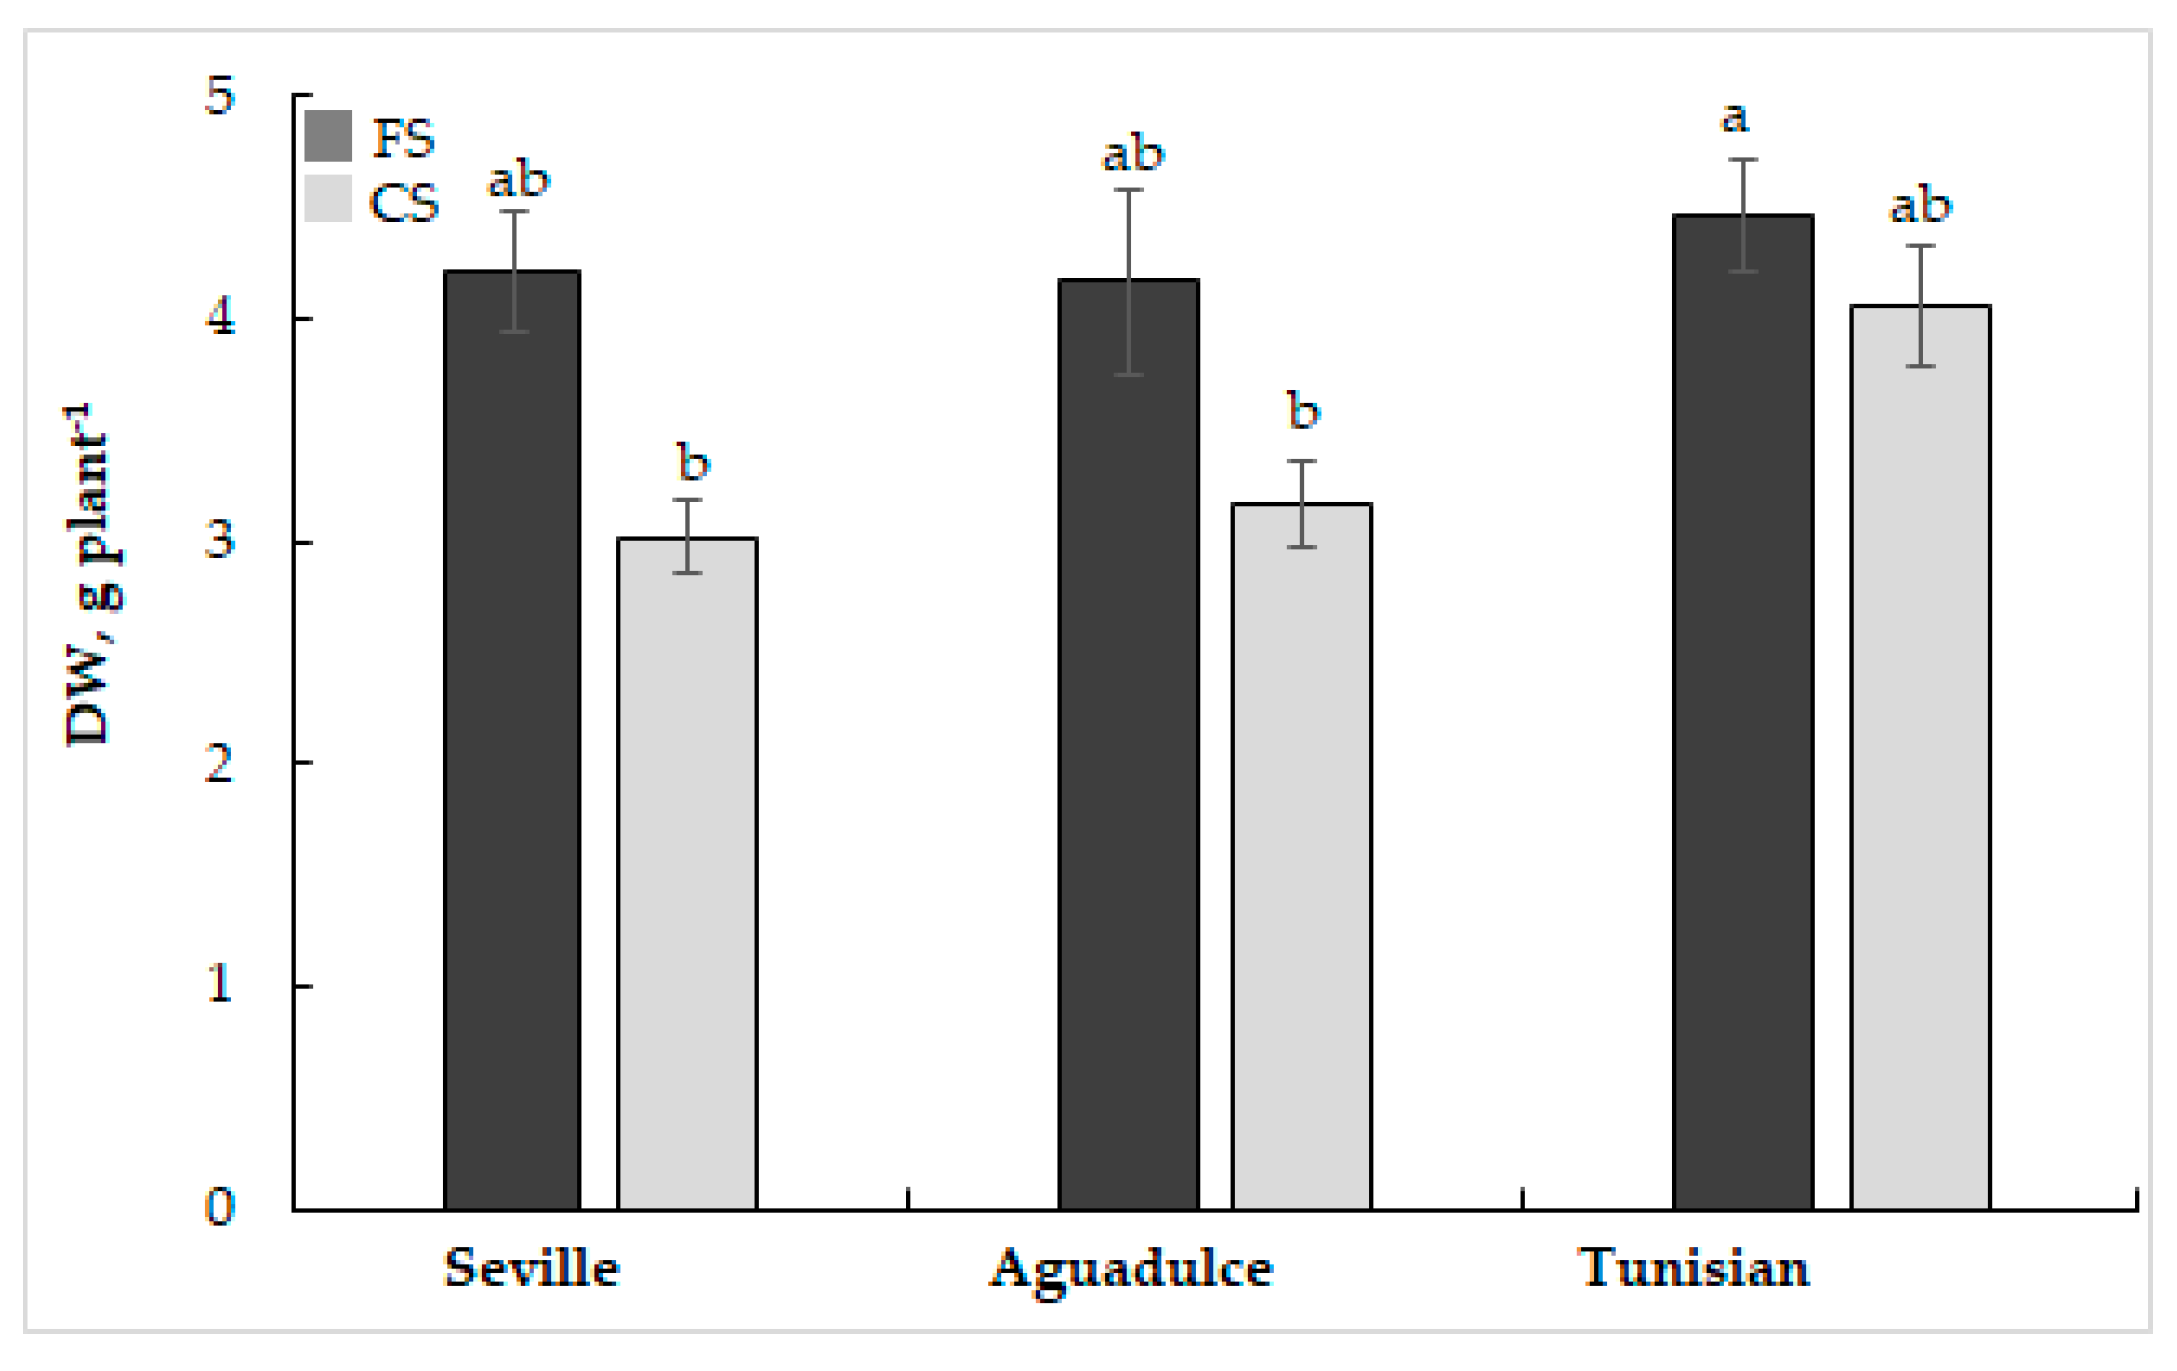
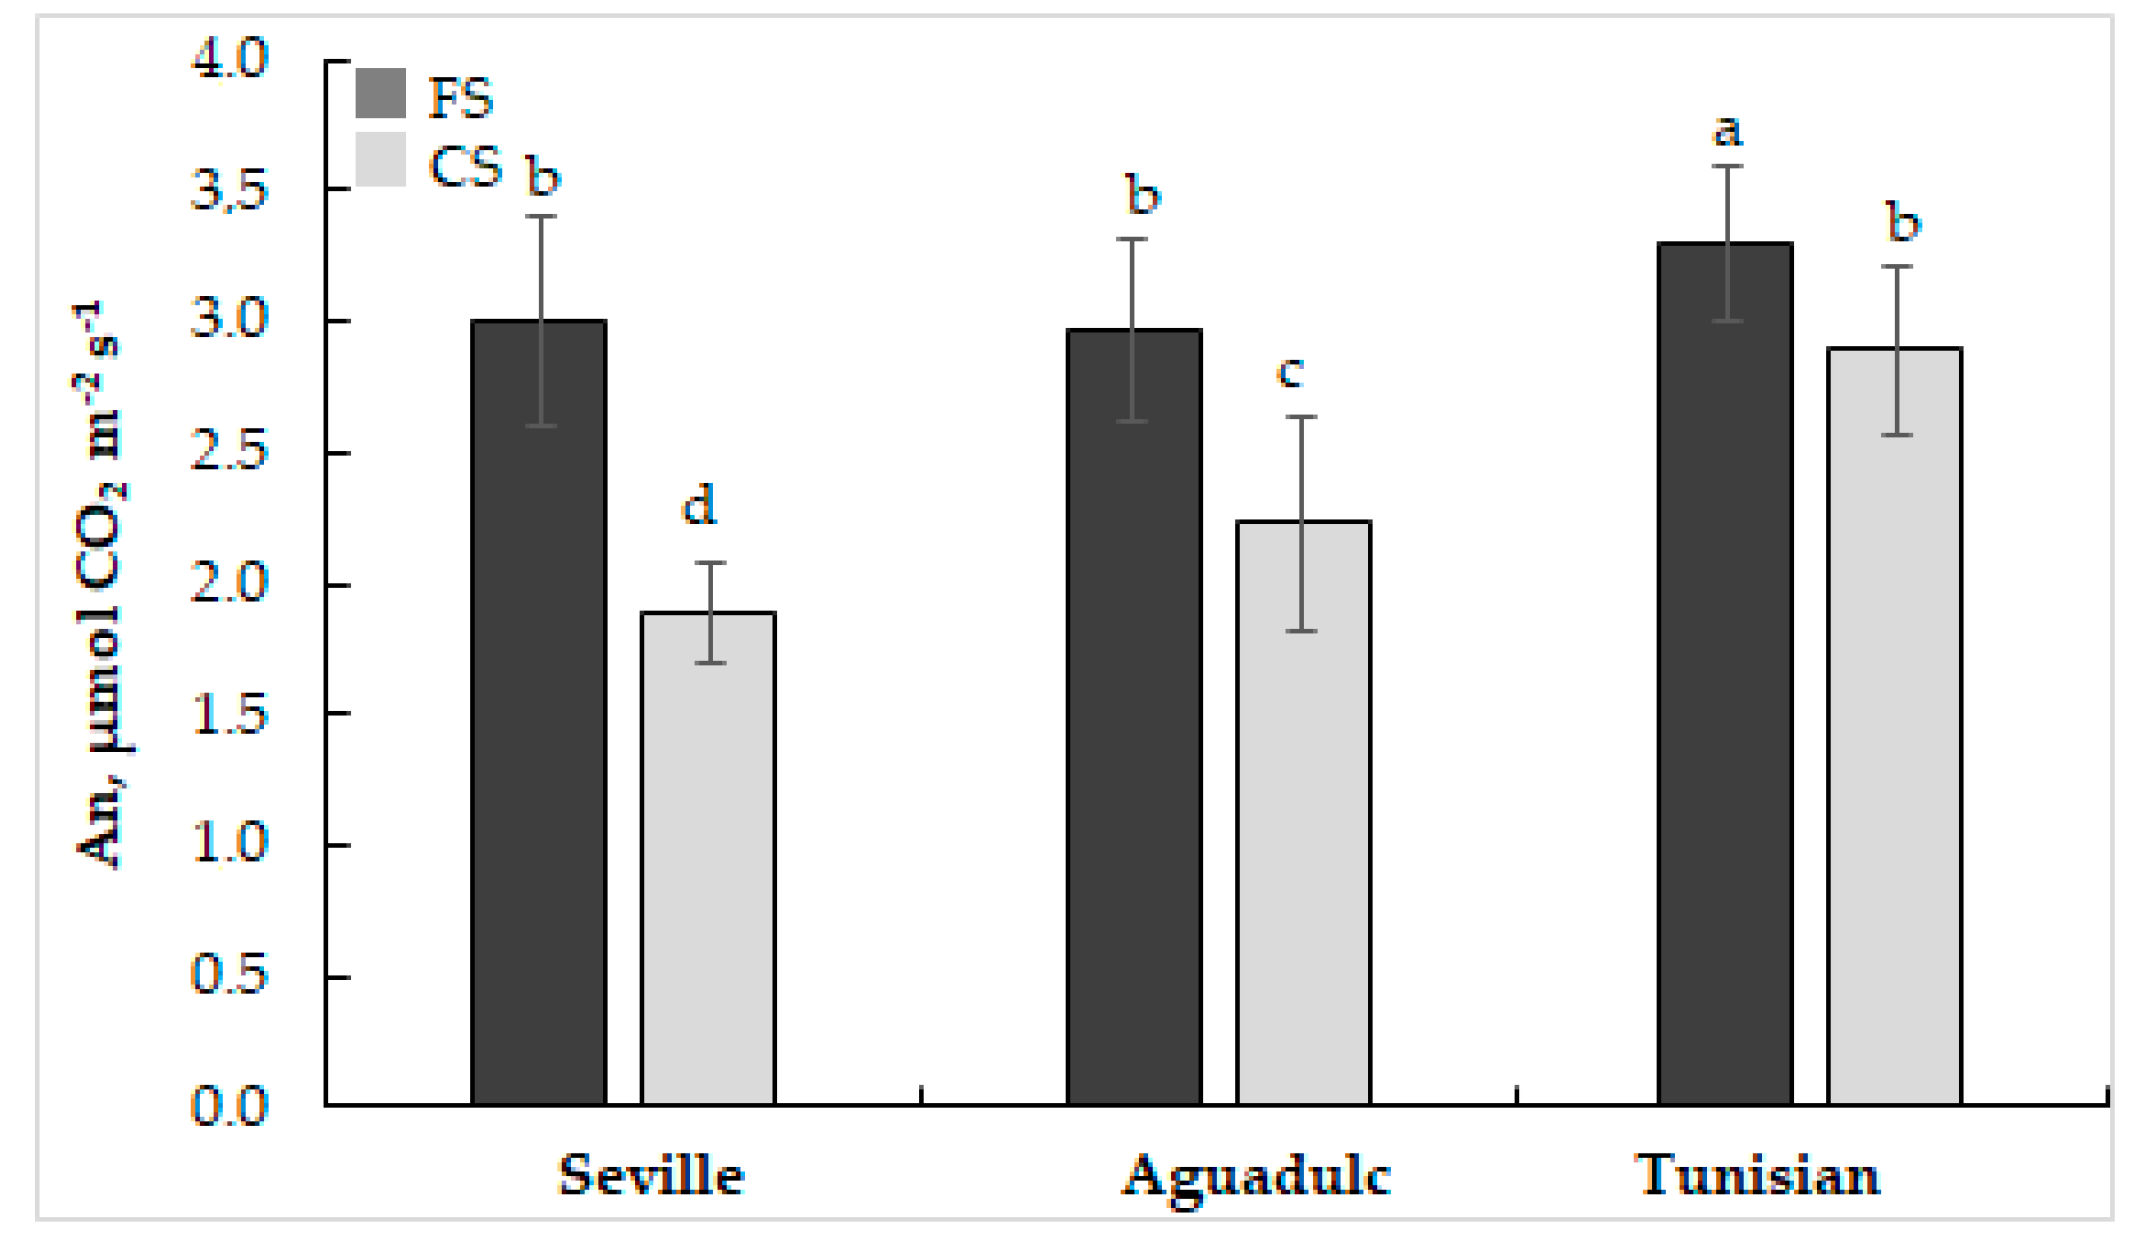
3.1. Phenotyping, Growth, and Photosynthesis
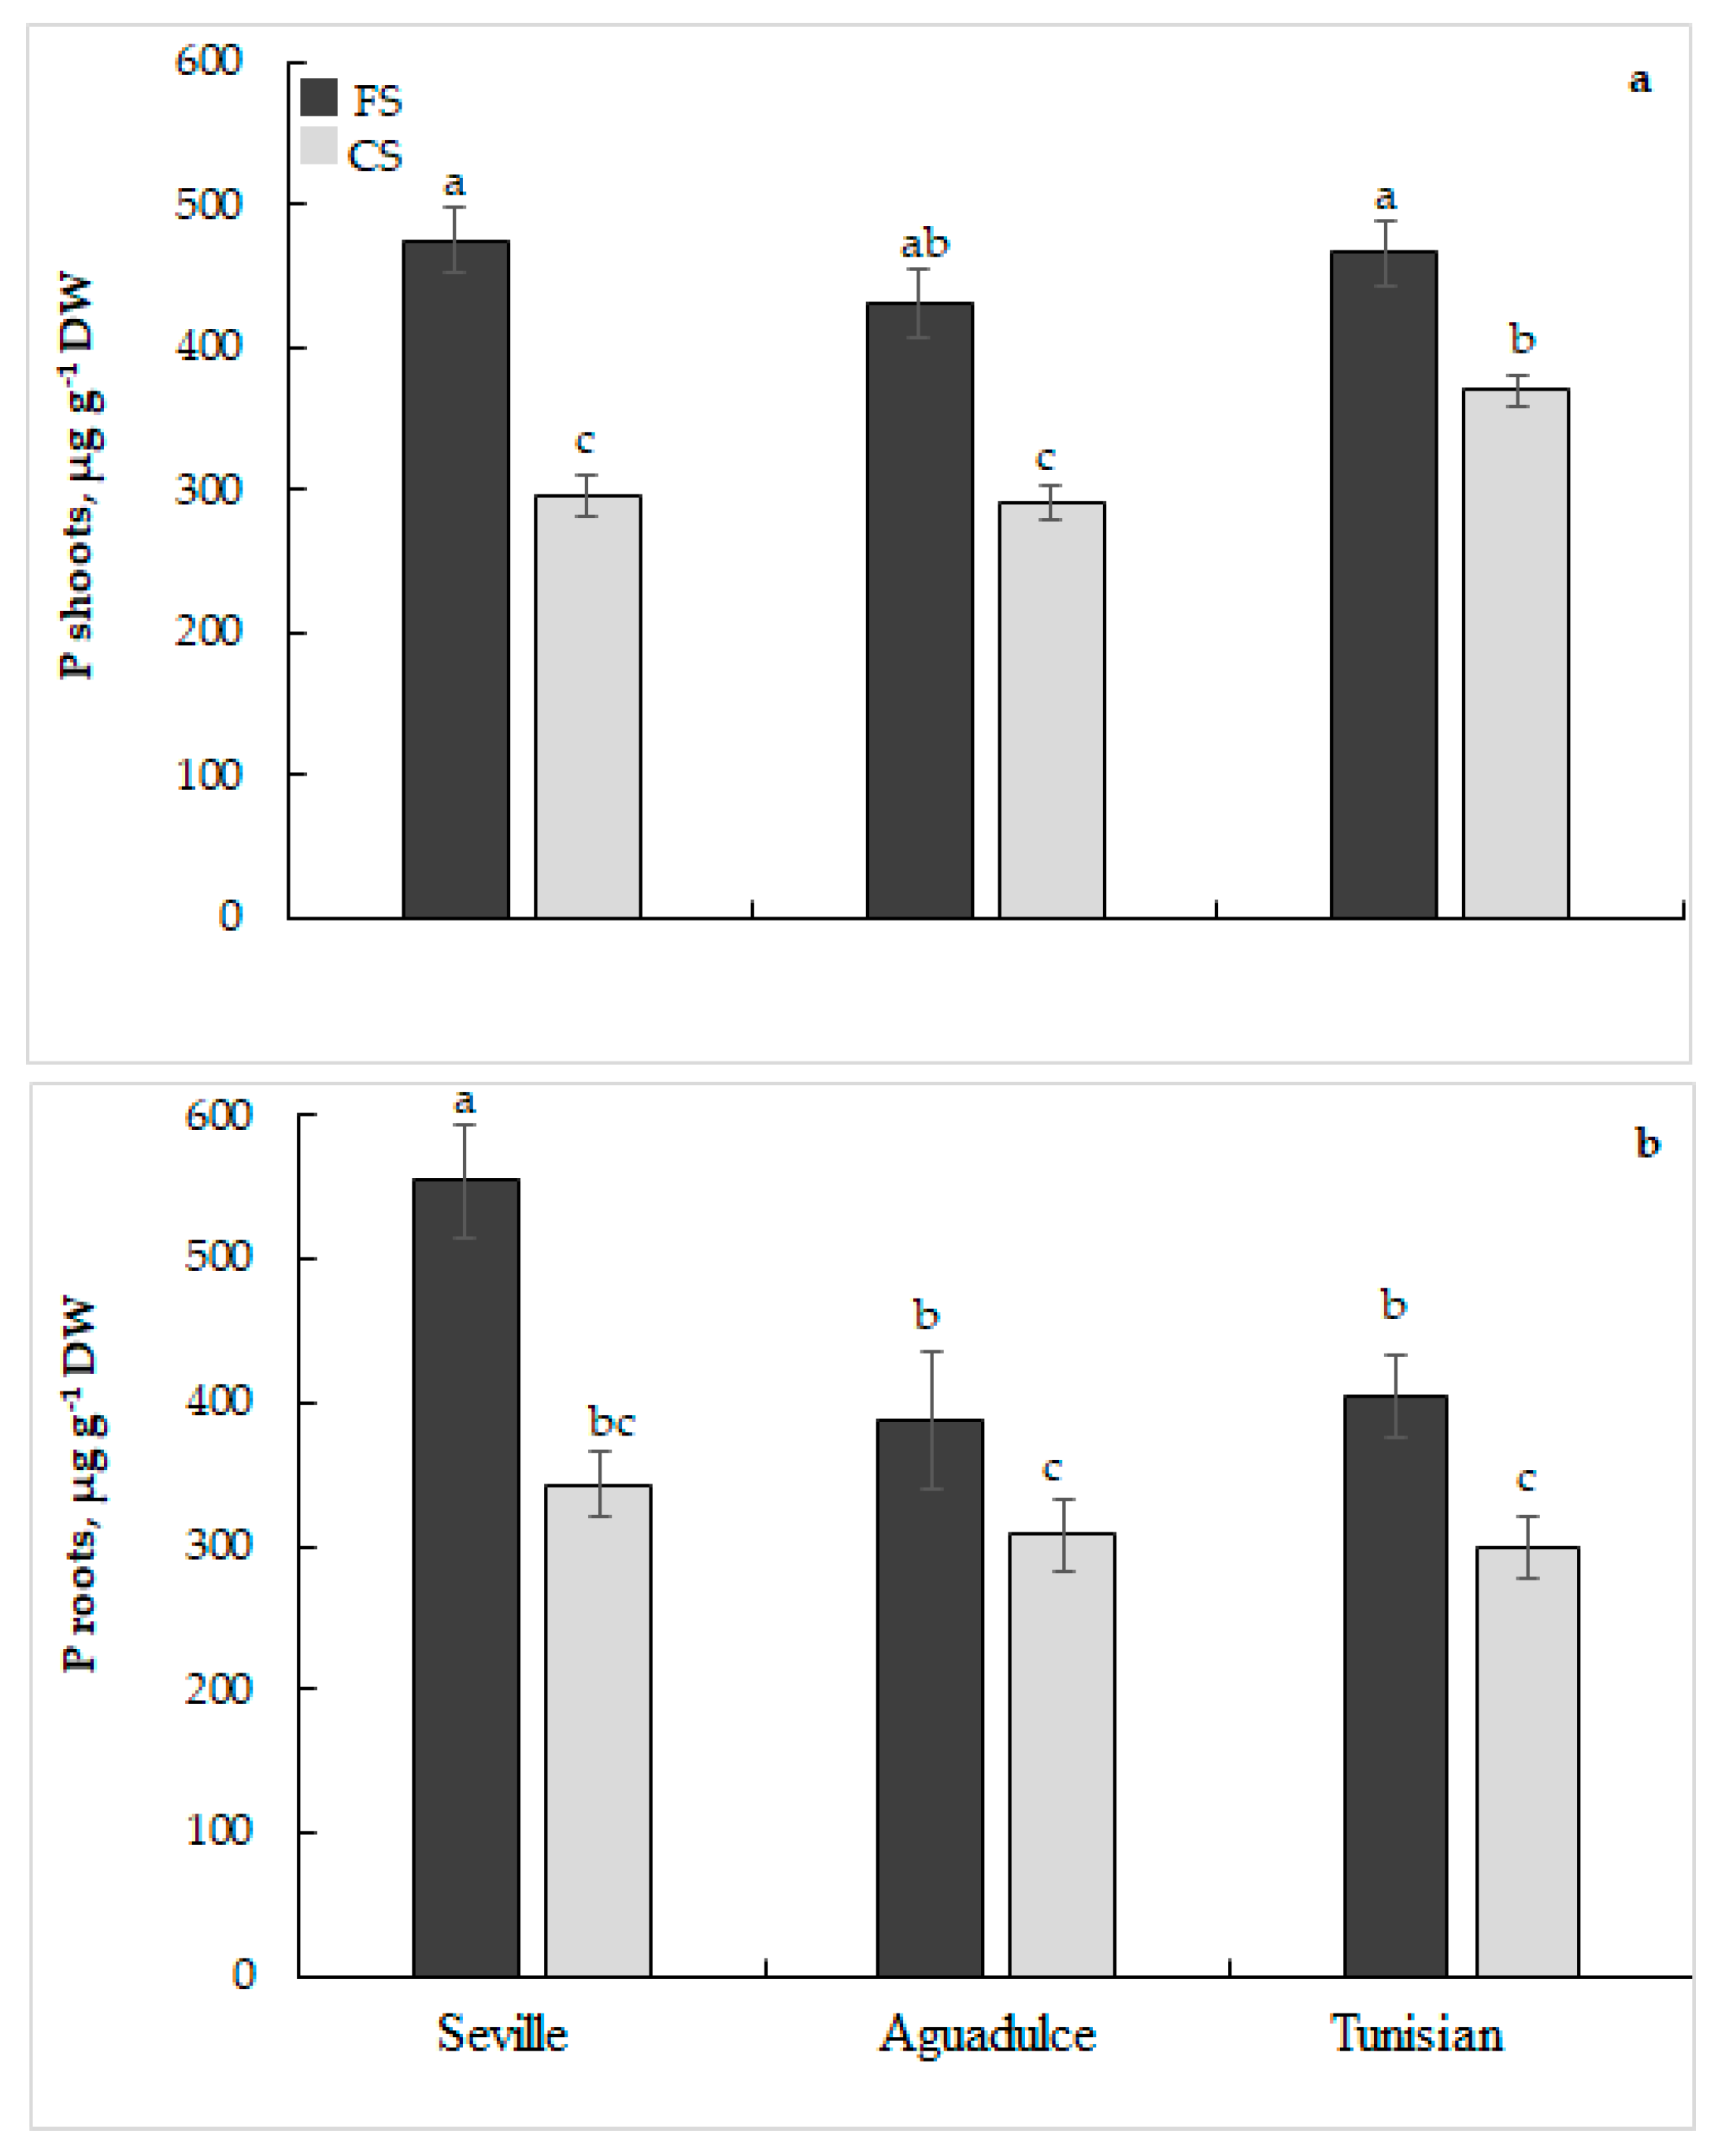
3.2. Phosphorus Uptake and Use
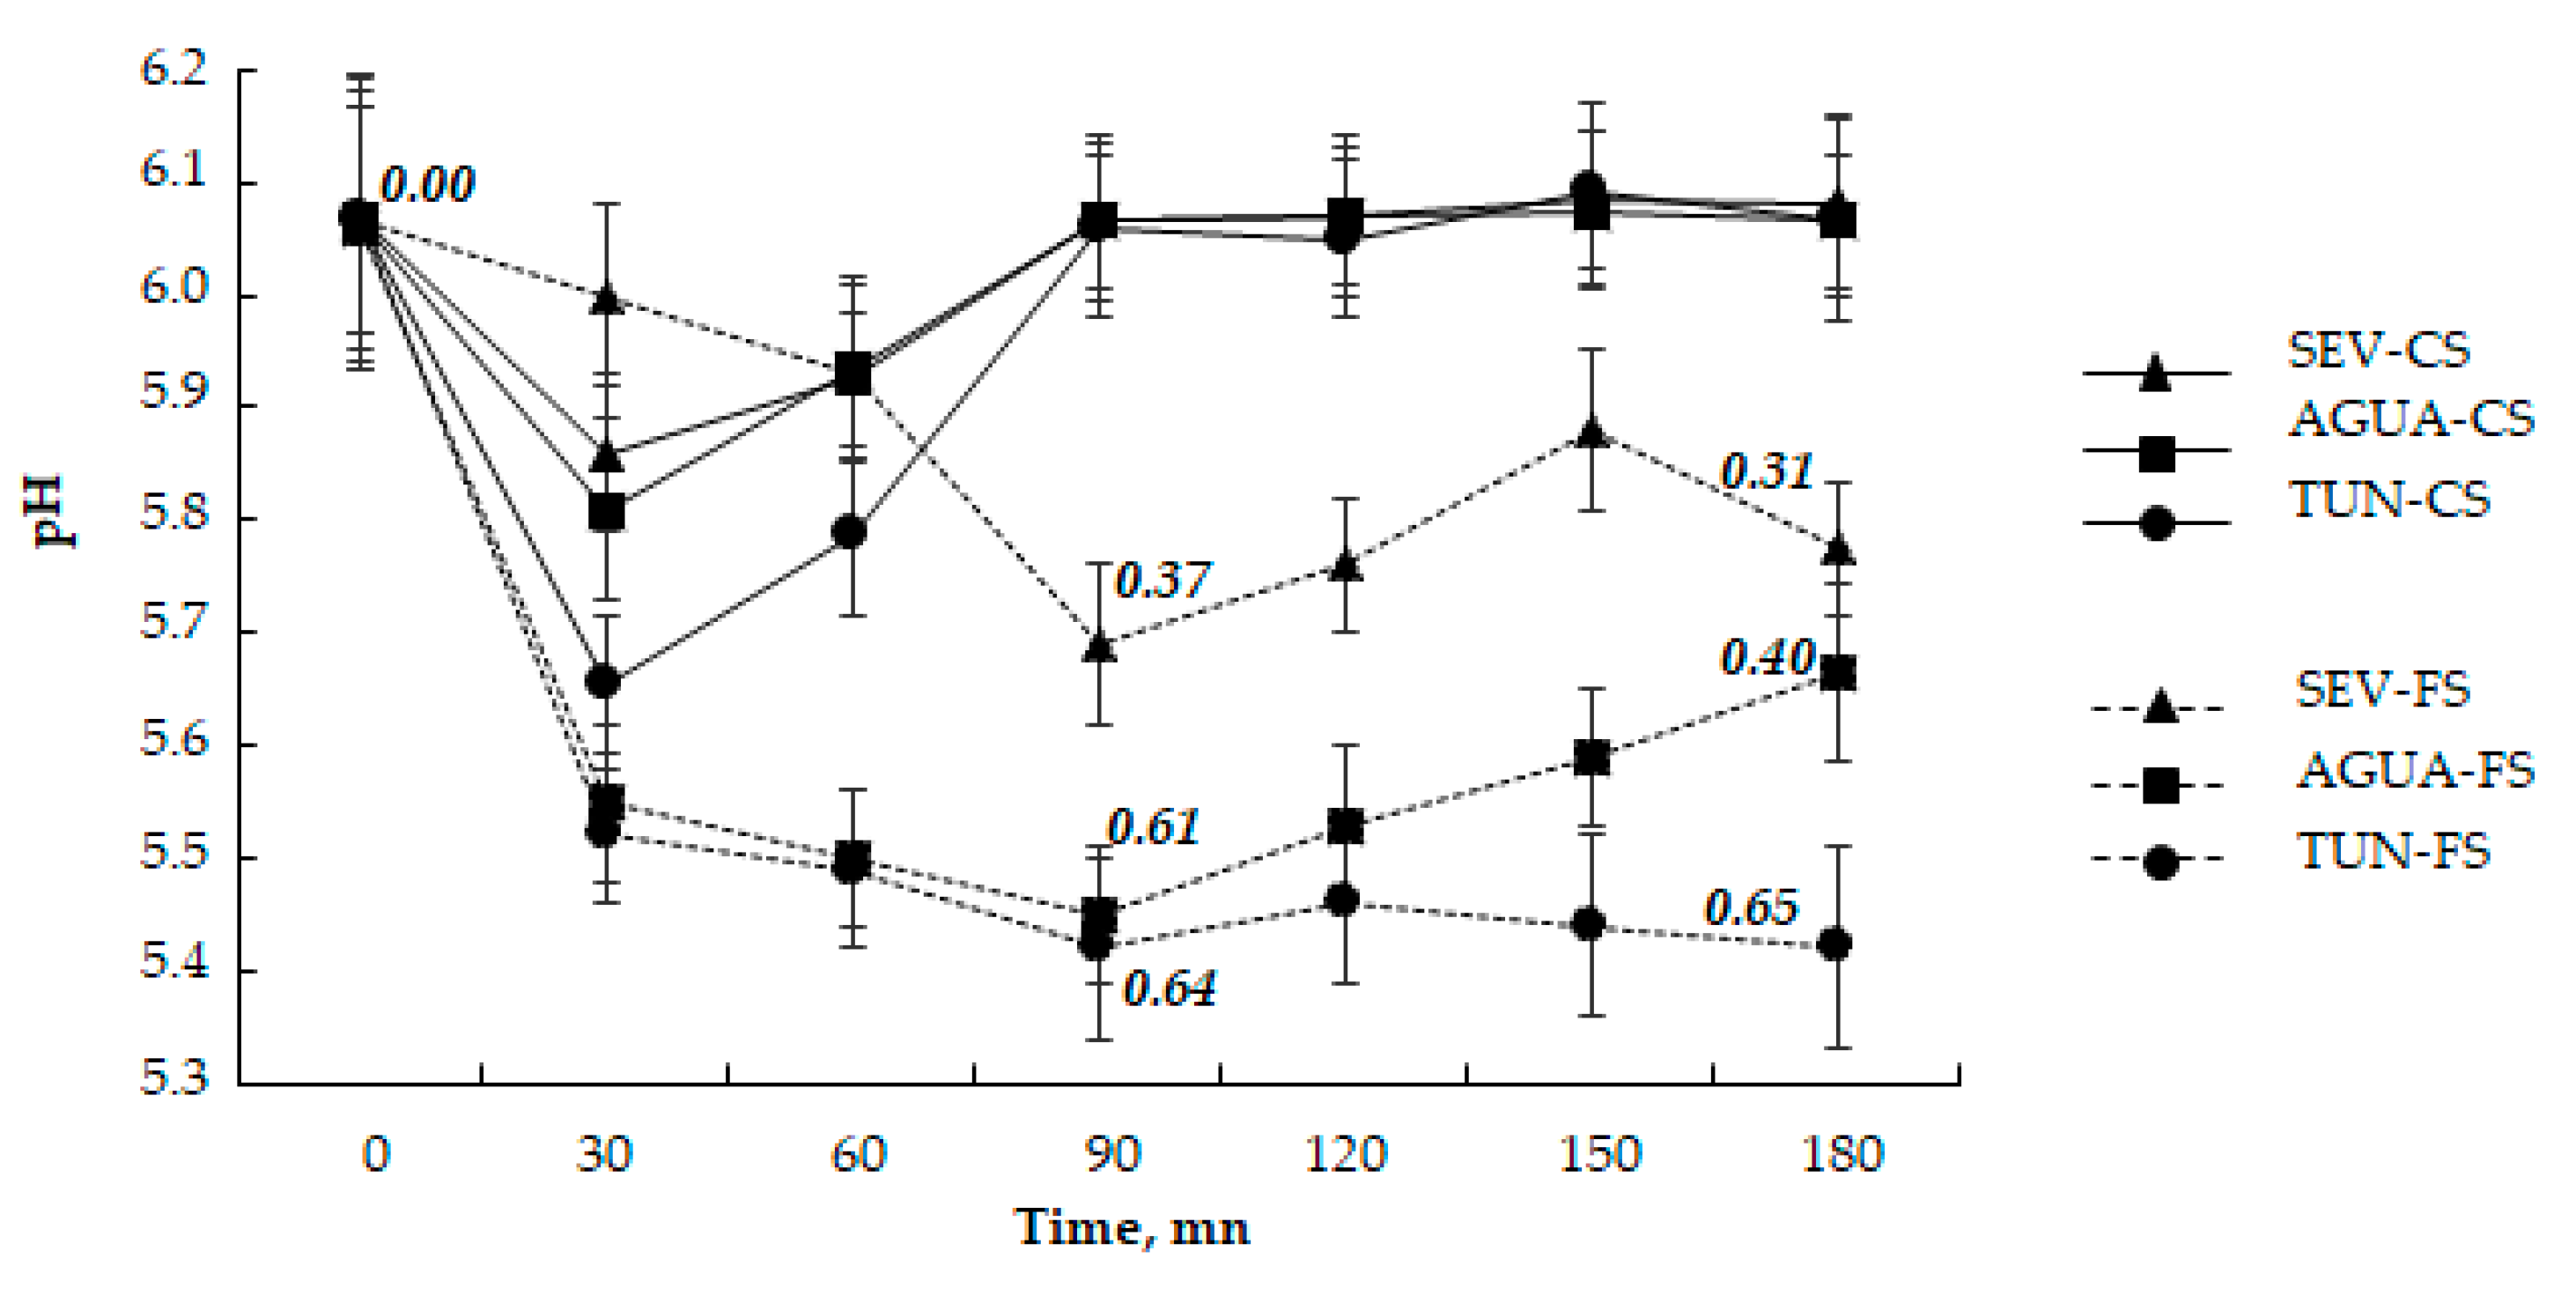
3.3. Acidification Capacity
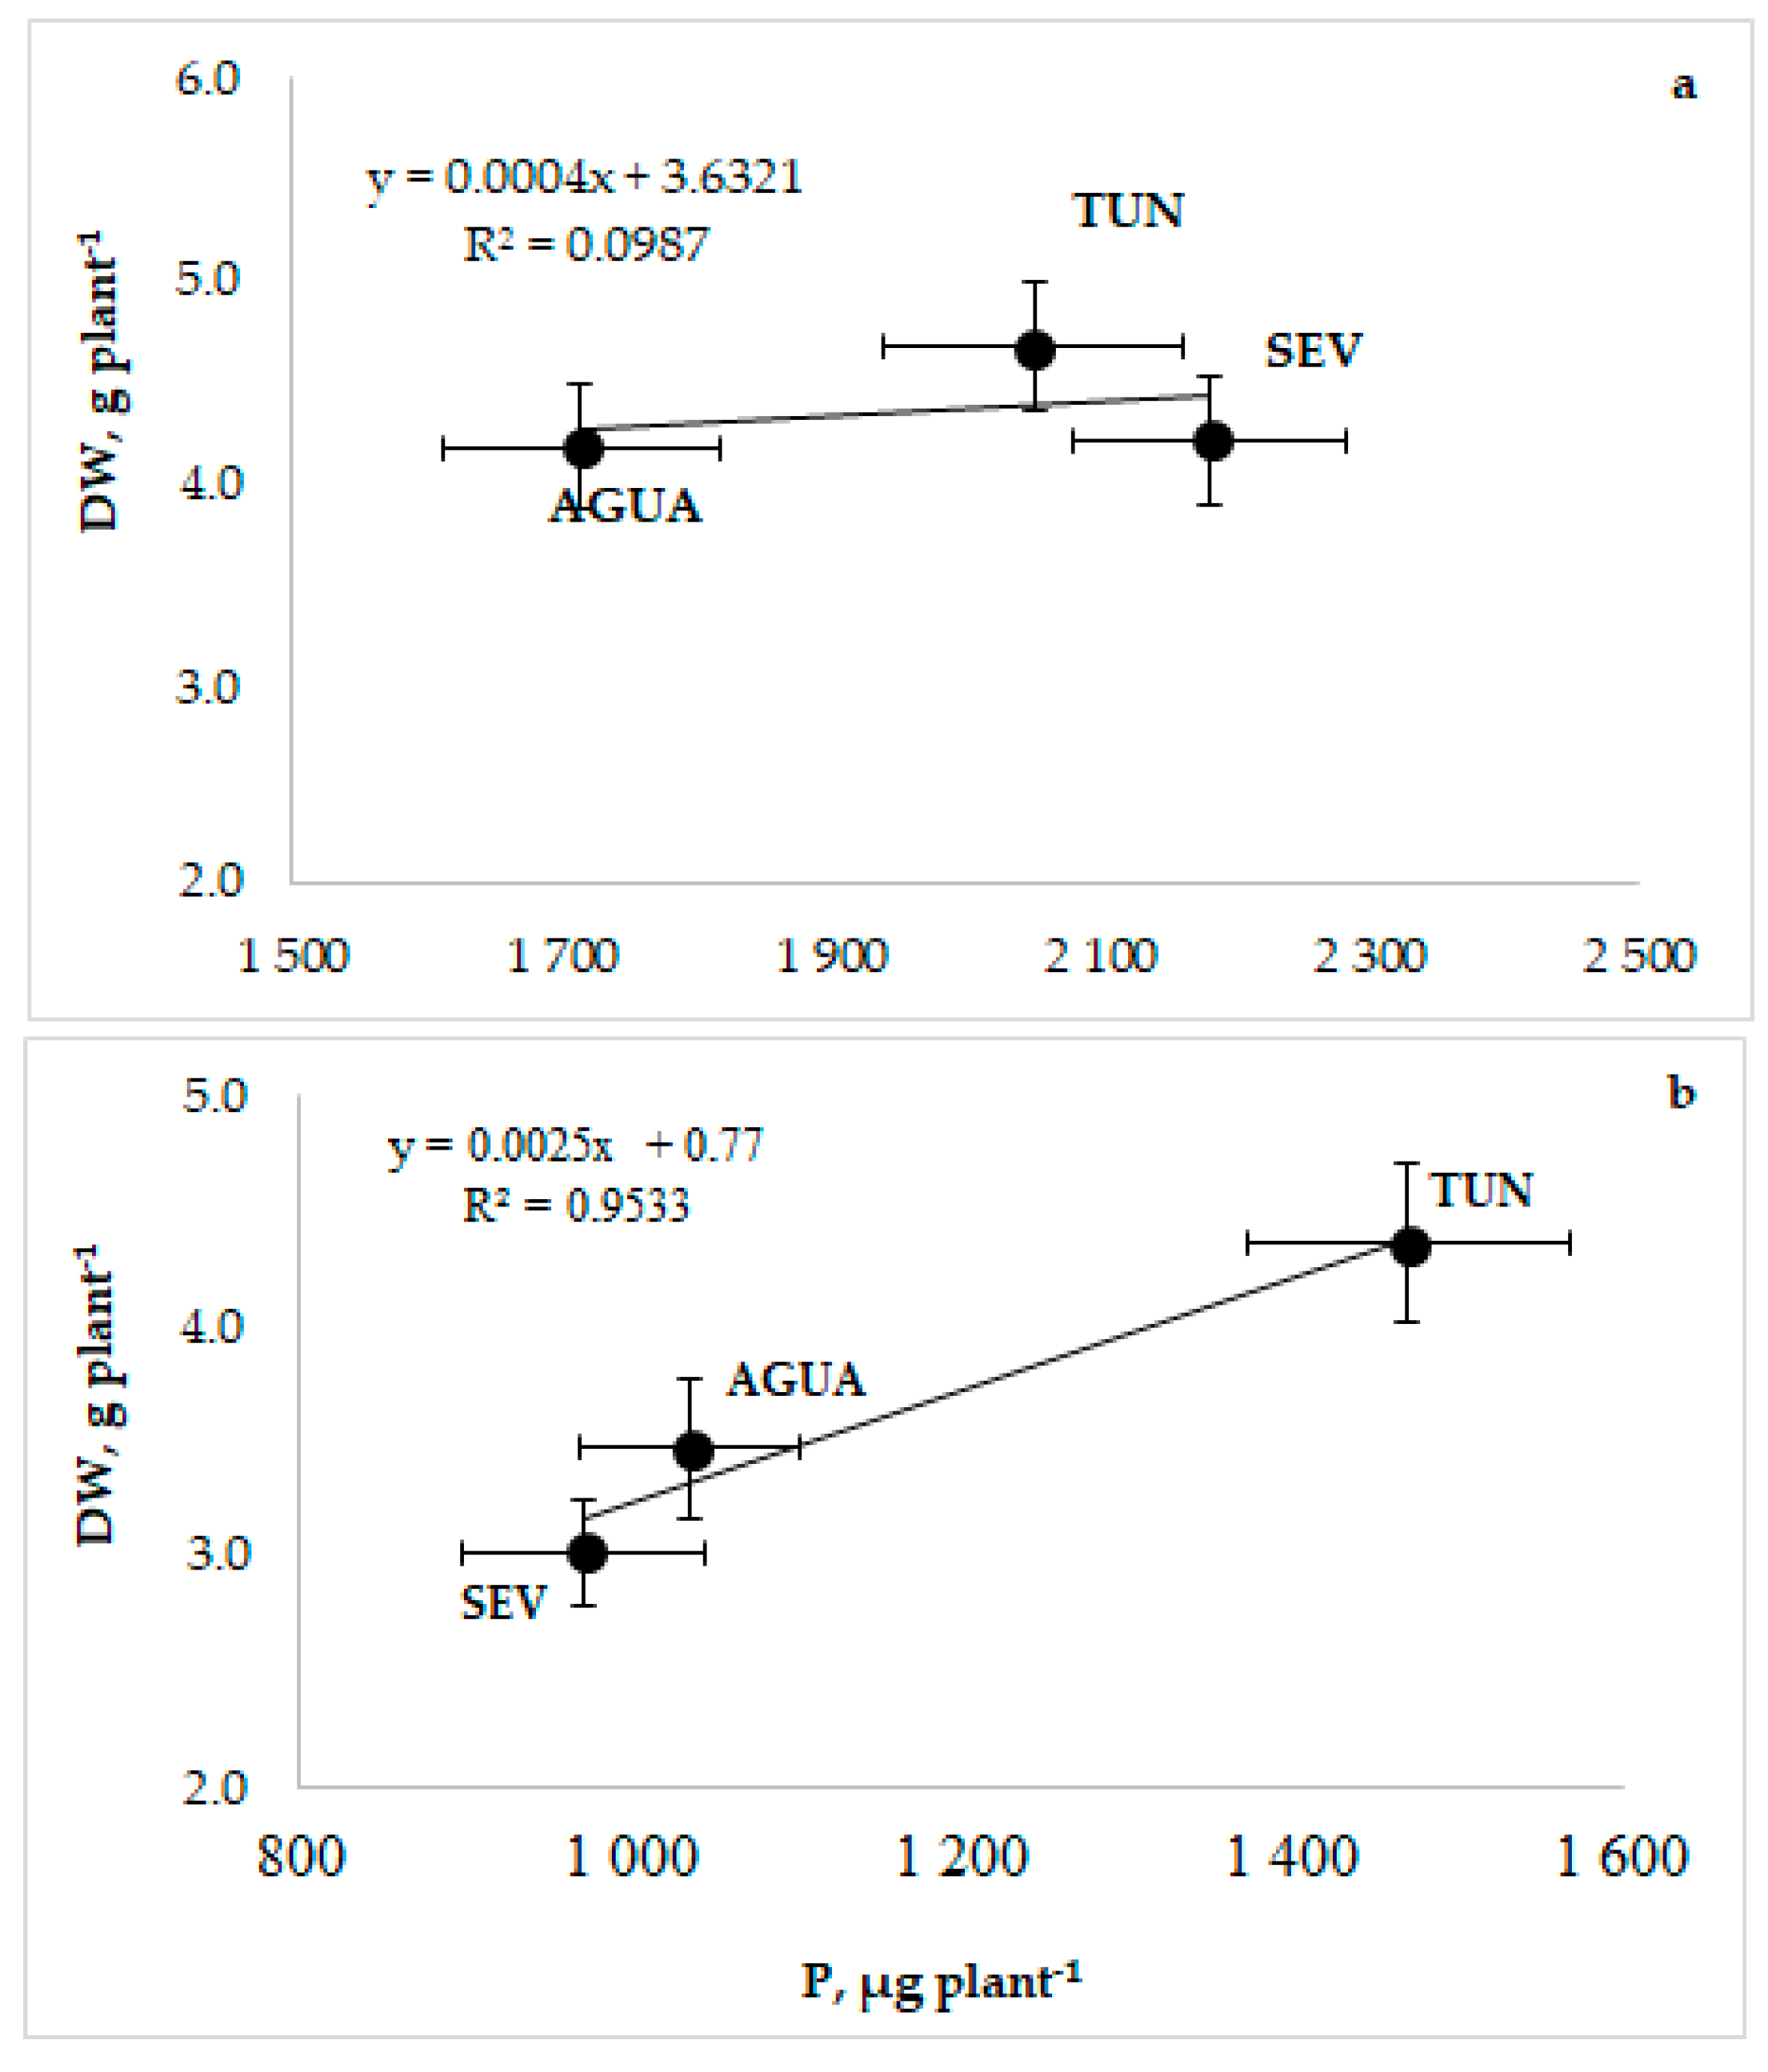
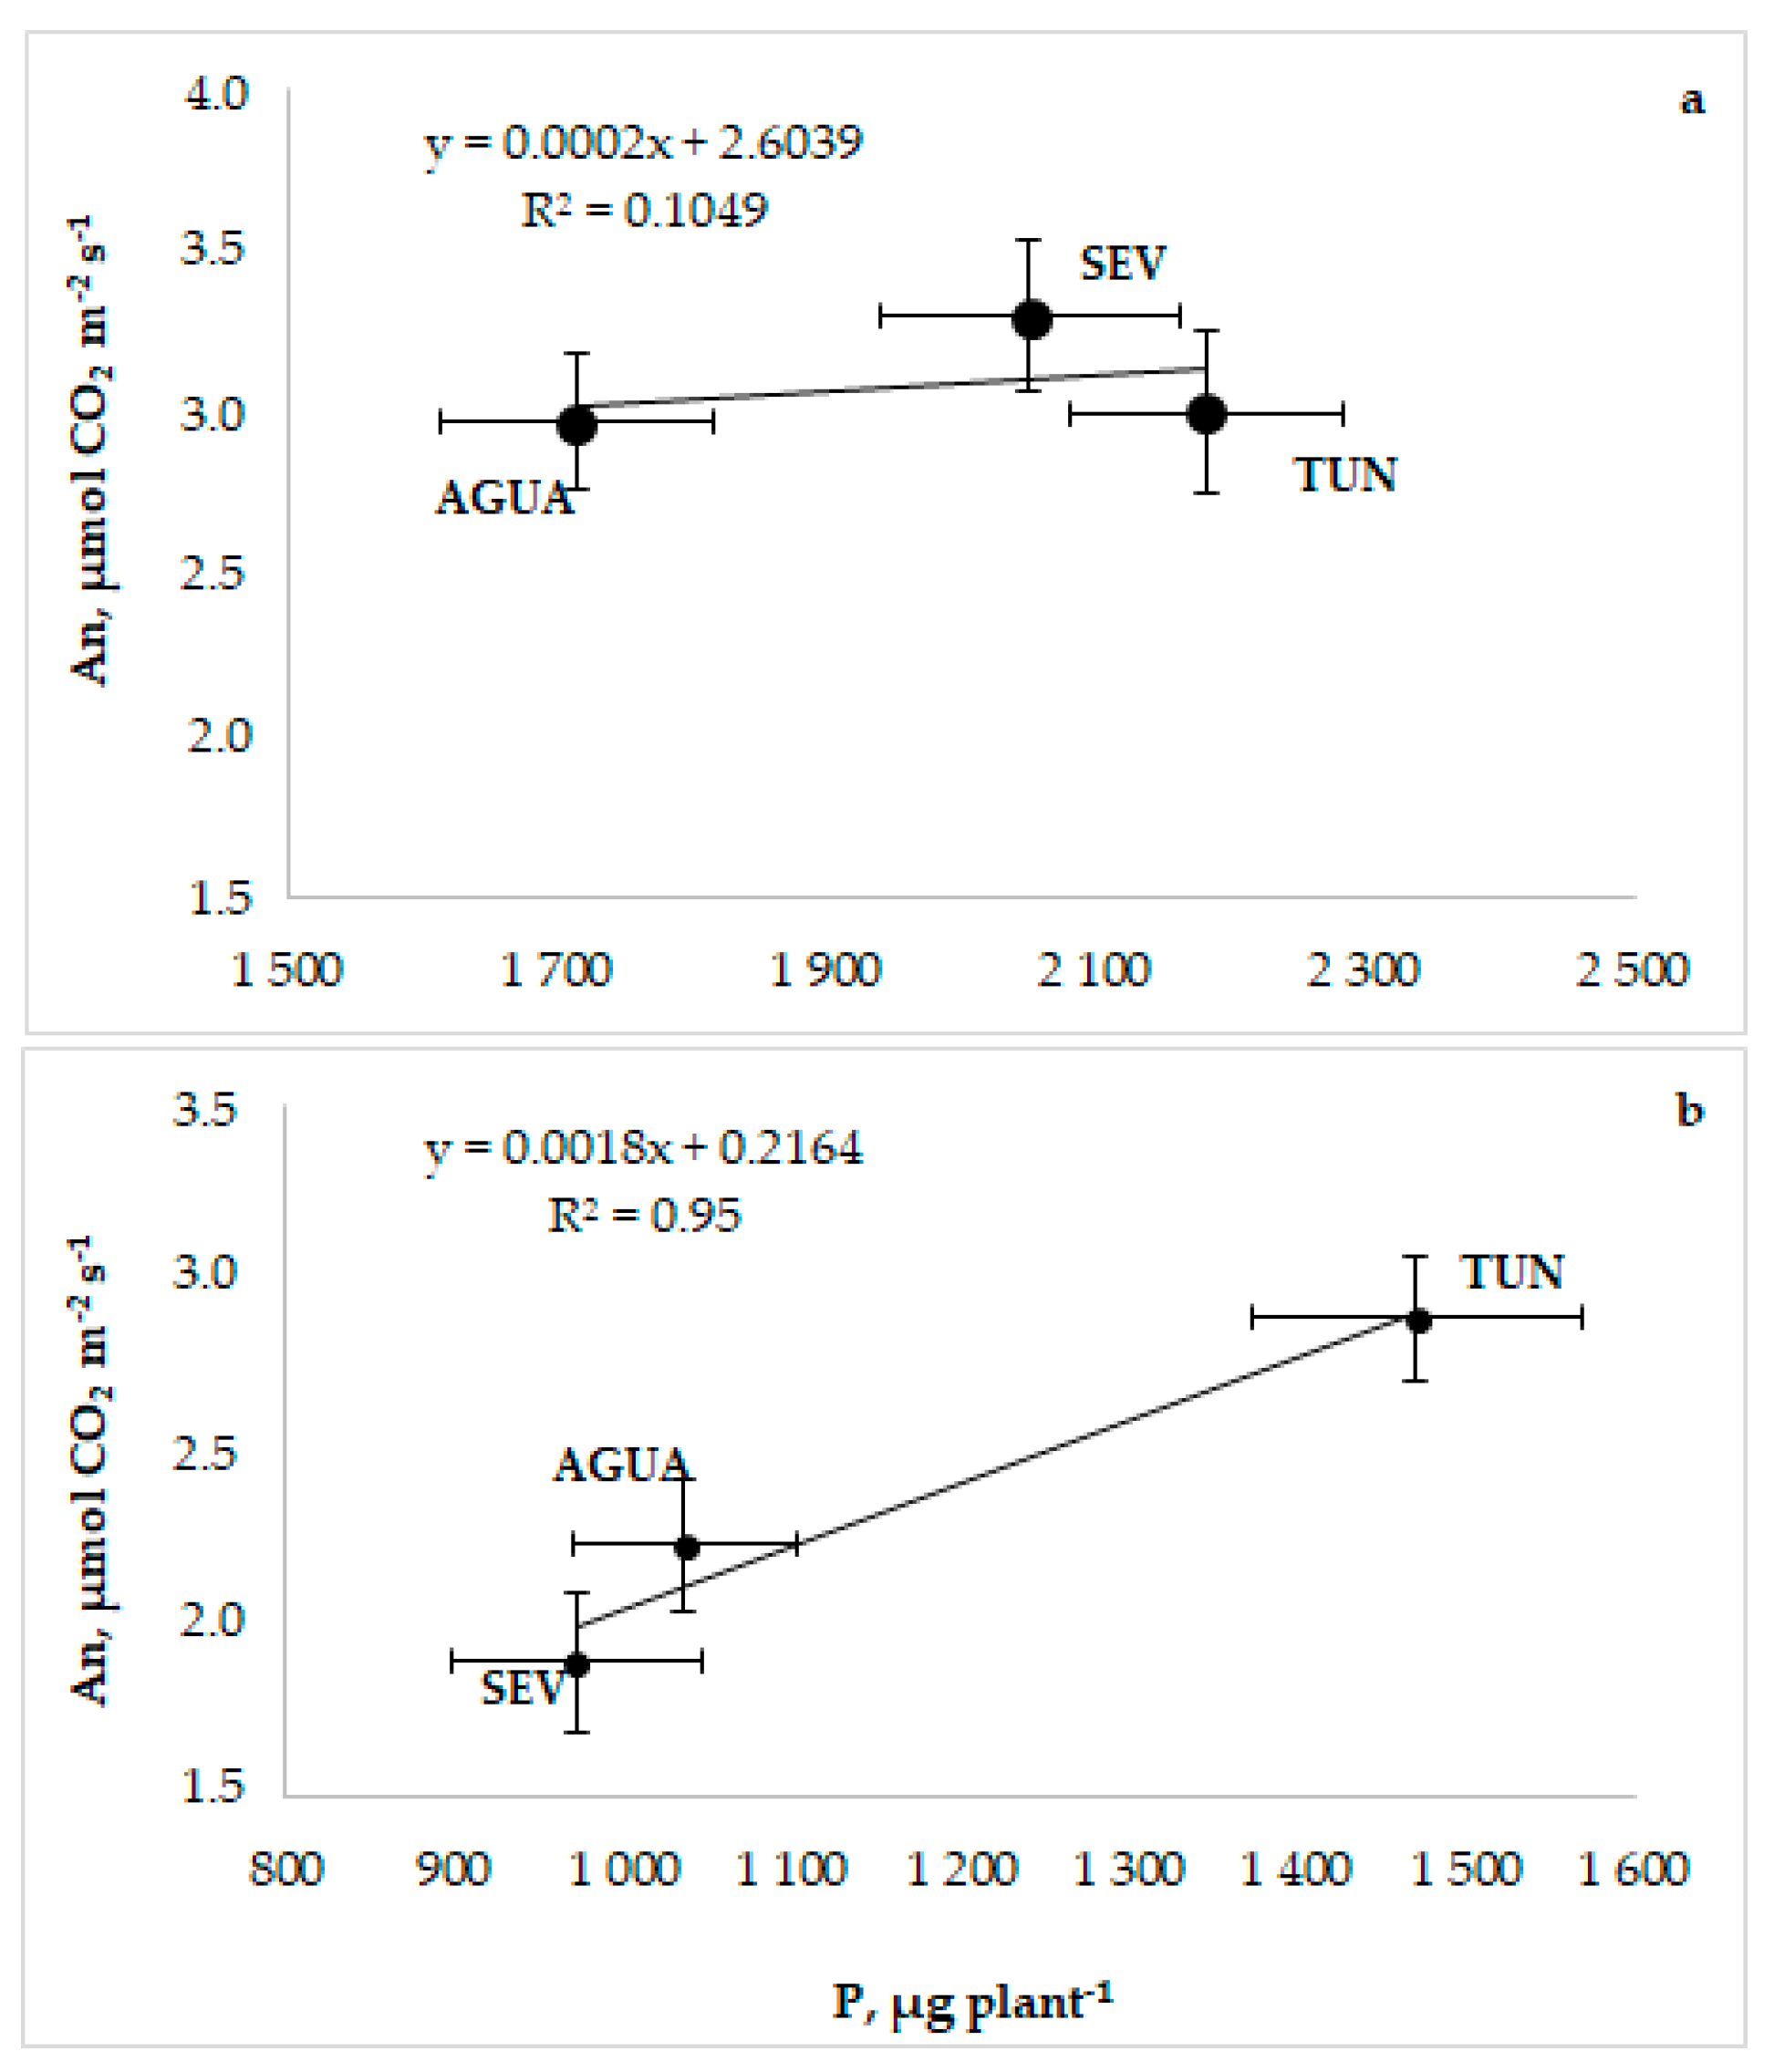
3.4. Physiological Relationships and Traits Interdependence
4. Discussion
5. Conclusions
Author Contributions
Funding
Informed Consent Statement
Data Availability Statement
Acknowledgments
Conflicts of Interest
References
- Blake, L.; Mercik, S.; Koerschens, M.; Moskal, S.; Poulton, P.R.; Goulding, K.W.T.; Weigel, A.; Powlson, D.S. Phosphorus content in soil, uptake by plants and balance in three European long-term field experiments. Nutr. Cycl. Agroecosyst. 2000, 56, 263–275. [Google Scholar] [CrossRef]
- Kamh, M.; Horst, W.J.; Amer, F.; Mostafa, H.; Maier, P. Mobilization of soil and fertilizer phosphate by cover crops. Plant Soil 1999, 211, 19–27. [Google Scholar] [CrossRef]
- Schachtman, D.P.; Reid, R.J.; Ayling, S.M. Phosphorus uptake by plants: From soil to cell. Plant Physiol. 1998, 116, 447–453. [Google Scholar] [CrossRef] [PubMed] [Green Version]
- Ma, X.; Liu, Y.; Shen, W.; Kuzyakov, Y. Phosphatase activity and acidification in lupine and maize rhizosphere depend on phosphorus availability and root properties: Coupling zymography with planar optodes. Appl. Soil Ecol. 2021, 167, 104029. [Google Scholar] [CrossRef]
- Marschner, H. Mineral Nutrition of Higher Plants, 2nd ed.; Academic Press: Cambridge, MA, USA, 1995. [Google Scholar]
- Mtimet, N.; Guégan, S.; Durand, L.; Mathot, A.G.; Venaille, L.; Leguérinel, I.; Controller, L.; Couvert, O. Effect of pH on Thermoanaerobacterium thermosaccharolyticum DSM 571 growth, spore heat resistance and recovery. Food Microbiol. 2016, 55, 64–72. [Google Scholar] [CrossRef]
- Hagin, J.; Tucker, B. Fertilization of dryland and irrigated soils. Springer Sci. Rev. 2012, 22, 1–2. [Google Scholar]
- Leytem, A.; Mikkelsen, R. The nature of phosphorus in calcareous soils. Better Crops 2005, 89, 11–13. [Google Scholar]
- Weyers, E.; Strawn, D.G.; Peak, D.; Moore, A.; Baker, L.; Cade-Menun, B. Phosphorus speciation in calcareous soils following annual dairy manure amendments. Soil Sci. Soc. Am. J. 2016, 80, 1531–1542. [Google Scholar] [CrossRef] [Green Version]
- Khan, H.; Ali Akbar, W.; Shah, Z.; Ur Rahim, H.; Taj, A.; Alatalo, J.M. Coupling phosphate-solubilizing bacteria (PSB) with inorganic phosphorus fertilizer improves mungbean (Vigna radiata) phosphorus acquisition, nitrogen fixation, and yield in alkaline-calcareous soil. Helyion 2022, 8, e09081. [Google Scholar] [CrossRef]
- Anter, F.; Hilal, M.H.; El-Damaty, A.H.A. Chemical and biological approach towards the definition of calcareous soils. Plant Soil 1973, 39, 479–486. [Google Scholar] [CrossRef]
- Akanji, M.A.; Ahmad, M.; Al-Wabel, M.I.; Al-Farraj, A.S.F. Soil Phosphorus Fractionation and Bio-Availability in a Calcareous Soil as Affected by Conocarpus Waste Biochar and Its Acidified Derivative. Agriculture 2022, 12, 2157. [Google Scholar] [CrossRef]
- DeLuca, T.H.; Gundale, M.J.; MacKenzie, M.D.; Jones, D.L. Biochar Effects on Soil Nutrient Transformations. In Biochar for Environmental Management, 2nd ed.; Science, Technology and Implementation; Lehmann, J., Joseph, S., Eds.; Routledge: London, UK, 2015; pp. 453–486. [Google Scholar]
- Aras, S.; Arıkan, Ş.; İpek, M.; Eşitken, A.; Pırlak, L.; Dönmez, M.; Turan, M. Plant growth promoting rhizobacteria enhanced organic leaf acids, FC-R activity, and Fe nutrition of apple under lime soil conditions. Acta Physiol. Plant. 2018, 40, 1–8. [Google Scholar] [CrossRef]
- López-Millán, A.F.; Morales, F.; Andaluz, S.; Gogorcena, Y.; Abadıa, A.; Rivas, J.D.L.; Abadıa, J. Responses of sugar beet roots to iron deficiency. Changes in carbon assimilation and oxygen use. Plant Physiol. 2000, 124, 885–898. [Google Scholar] [CrossRef] [Green Version]
- Wahba, M.M.; Fawkia, L.; Zaghloul, A. Management of calcareous soils in arid soil in arid regions. Int. J. Environ. Pollut. Environ. Model. 2019, 2, 248–258. [Google Scholar]
- Yaakob, M.A.; Mohamed, R.M.S.R.; Al-Gheethi, A.; Ravishankar, G.A.; Ambati, R.R. Influence of nitrogen and phosphorus on microalgal growth, biomass, lipid, and fatty acid production: An overview. Cells 2021, 10, 393. [Google Scholar] [CrossRef] [PubMed]
- Poirier, Y.; Jaskolowski, A.; Clua, J. Phosphate acquisition and metabolism in plants. Curr. Biol. 2022, 32, 623–629. [Google Scholar] [CrossRef] [PubMed]
- Netzer, F.; Pozzi, L.; Dubbert, D.; Herschbach, C. Improved photosynthesis and poplar growth during nitrogen fertilization are accompanied by phosphorus depletion, indicating phosphorus remobilization from older stem tissues. J. Exp. Bot. 2019, 162, 421–432. [Google Scholar] [CrossRef]
- Hassan, W.; Bashir, S.; Hanif, S.; Sher, A.; Sattar, A.; Wasaya, A.; Atif, H.; Hussain, M. Phosphorus solubilizing bacteria and growth and productivity of mung bean (Vigna radiata). Pak. J. Bot. 2017, 49, 331–336. [Google Scholar]
- Noor, I.; Sohail, H.; Hasanuzzaman, M.; Hussain, S.; Li, G.; Liu, J. Phosphorus confers tolerance against manganese toxicity in Prunus persica by reducing oxidative stress and improving chloroplast ultrastructure. Chemosphere 2022, 291, 132–999. [Google Scholar] [CrossRef]
- Bouain, N.; Krouk, G.; Lacombe, B.; Rouached, H. Getting to the root of plant mineral nutrition: Combinatorial nutrient stresses reveal emergent properties. Trends Plant Sci. 2019, 24, 542–552. [Google Scholar] [CrossRef]
- Xu, H.; Hassan, M.A.; Sun, D.; Wu, Z.; Jiang, G.; Liu, B.B.; Ni, Q.; Yang, W.; Fang, H.; Li, J.; et al. Effects of low-temperature stress on source-sink organs in wheat and phosphorus mitigation strategies. Front. Plant Sci. 2022, 13, 807–844. [Google Scholar] [CrossRef]
- Huang, H.Y.; Lin, Y.C.D.; Li, J.; Huang, K.Y.; Shrestha, S.; Hong, H.C.; Tang, Y.; Chen, Y.-G.; Jin, C.-N.; Yu, Y.; et al. miRTarBase: Updates to the experimentally validated microRNA–target interaction database. Nucleic Acids Res. 2020, 48, 148–154. [Google Scholar] [CrossRef] [Green Version]
- Ding, W.; Clode, P.L.; Lambers, H. Effects of pH and bicarbonate on the nutrient status and growth of three Lupinus species. Plant Soil 2020, 447, 9–28. [Google Scholar] [CrossRef]
- Ouled Youssef, I.; Krouma, A. Functional dissection of magnesium nutrition and use efficiency in common bean. Agron. J. 2021, 113, 261–269. [Google Scholar] [CrossRef]
- Lugli, L.F.; Andersen, K.M.; Aragão, L.E.O.C.; Cordeiro, A.L.; Cunha, H.F.V.; Fuchslueger, L.; Meir, P.; Mercado, L.M.; Oblitas, E.; Quesada, C.A.; et al. Multiple phosphorus acquisition strategies adopted by fine roots in low-fertility soils in Central Amazonia. Plant Soil 2020, 450, 49–63. [Google Scholar] [CrossRef] [Green Version]
- Reichert, T.; Rammig, A.; Fuchslueger, L.; Lugli, L.F.; Quesada, C.A.; Fleischer, K. Plant phosphorus-use and -acquisition strategies in Amazonia. New Phytol. 2022, 234, 1126–1143. [Google Scholar] [CrossRef] [PubMed]
- Kulmann, M.S.S.; Stefanello, L.O.S.; Schwalbert, R.A.; Berghetti, L.P.; Araujo, M.M.; Piccin, R.; Gatiboni, L.C.; Tiecher, T.; Ferreira, P.A.A.; Brunetto, G. Effects of phosphorus fertilizer application on phosphorus fractions in different organs of Cordia trichotoma. J. For. Res. 2021, 32, 725–732. [Google Scholar] [CrossRef]
- Lucena, C.; Romera, F.J.; García, M.J.; Alcántara, E.; Pérez-Vicente, R. Ethylene participates in the regulation of Fe deficiency responses in Strategy I plants and in rice. Front. Plant Sci. 2015, 6, 1056. [Google Scholar] [CrossRef] [Green Version]
- Song, L.; Liu, D. Ethylene and plant responses to phosphate deficiency. Front. Plant Sci. 2015, 6, 796. [Google Scholar] [CrossRef] [Green Version]
- Neumann, G. The role of ethylene in plant adaptations for phosphate acquisition in soils–a review. Front. Plant Sci. 2016, 6, 1224. [Google Scholar] [CrossRef] [Green Version]
- Plassard, C. Lack of phosphorus reserves and remobilization in grey poplar (Populus × canescens): An exception among deciduous tree species? Tree Physiol. 2018, 38, 1–5. [Google Scholar] [CrossRef] [PubMed] [Green Version]
- Batten, D.S.; Belongia, M.T. The recent decline in agricultural exports: Is the exchange rate the culprit? Fed. Reserve Bank St. Louis Rev. 1984, 66, 5–14. [Google Scholar] [CrossRef] [Green Version]
- Gahoonia, T.S.; Nielsen, N.E. Variation in acquisition of soil phosphorus among wheat and barley genotypes. Plant Soil 1996, 178, 223–230. [Google Scholar] [CrossRef]
- Jones, P.D.; Briffa, K.R. Global surface air temperature variations during the twentieth century: Part 1, spatial, temporal and seasonal details. Holocene 1992, 2, 165–179. [Google Scholar] [CrossRef]
- Rosa, O.S.; Camargo, C.E.O. Wheat Breeding for Better Efficiency in Phosphorus Use. In Proceedings of the International Conference on Wheat for the Nontraditional Warm Areas, Foz Do Iguaçu, Brazil, 29 July–3 August 1990. [Google Scholar]
- Tang, C.; Robson, A.D.; Dilworth, M.J. The role of iron in nodulation and nitrogen fixation in Lupinus angustifolius L. New Phytol. 1990, 114, 173–182. [Google Scholar] [CrossRef] [Green Version]
- Morales, F.; Abadía, A.; Belkhodja, R.; Abadía, J. Iron deficiency-induced changes in the photosynthetic pigment composition of field-grown pear (Pyrus communis L) leaves. Plant Cell Environ. 1994, 17, 1153–1160. [Google Scholar] [CrossRef]
- Fleury, P.; Leclerc, M. Colorimetric estimation of phosphorus by the nitro-vanado molybdic method of Misson. Its interest in biochemistry. Bull. Soc. Chim. Biol. 1943, 25, 201–205. [Google Scholar]
- Vizzotto, G.; Pinton, R.; Bomben, C.; Cesco, S.; Varanini, Z.; Costa, G. Iron reduction in iron-stressed plants of Actinidia deliciosa genotypes: Involvement of PM Fe (lll)-Chelate reductase and H+-ATPase activity. J. Plant Nutr. 1999, 22, 479–488. [Google Scholar] [CrossRef]
- Ferhi, J.; Gharsalli, M.; Abdelly, C.; Krouma, A. Potential of the physiological response of pea plants (Pisum sativum L.) to iron deficiency (direct or lime-induced). Biosci. J. 2017, 33, 1208–1218. [Google Scholar] [CrossRef]
- Roriz, M.; Carvalho, S.M.; Vasconcelos, M.W. High relative air humidity influencesmineral accumulation and growth iniron-deficient soybean plants. Front. Plant Sci. 2014, 5, 726. [Google Scholar] [CrossRef]
- Vasconcelos, M.W.; Grusak, M.A. Morpho-physiological parameters affecting iron deficiency chlorosis in soybean (Glycine max L.). Plant Soil 2014, 374, 161–172. [Google Scholar] [CrossRef] [Green Version]
- Ramaekers, L.; Remans, R.; Rao, I.M.; Blair, M.W.; Vanderleyden, J. Strategies for improving phosphorus acquisition efficiency of crop plants. Field Crops Res. 2010, 117, 169–176. [Google Scholar] [CrossRef]
- Yang, B.; Kallio, H. Composition and physiological effects of sea buckthorn (Hippophae) lipids. Trends Food Sci. Technol. 2002, 13, 160–167. [Google Scholar] [CrossRef]
- von Wandruszka, R. Phosphorus retention in calcareous soils and the effect of organic Matter on its mobility. Geochem. Trans. 2006, 7, 6. [Google Scholar] [CrossRef] [PubMed] [Green Version]
- Mortvedt, J.J. Correcting iron deficiencies in annual and perennial plants: Present technologies and prospects. Plant Soil 1991, 130, 273–279. [Google Scholar] [CrossRef]
- Chen, C.; Meile, C.; Wilmoth, J.; Barcellos, D.; Thompson, A. Influence of pO2 on iron redox cycling and anaerobic organic carbon mineralization in a humid tropical forest soil. Environ. Sci. Technol. 2018, 52, 7709–7719. [Google Scholar] [CrossRef]
- López-Bucio, J.S.; Salmerón-Barrera, G.J.; Ravelo-Ortega, G.; Raya-González, J.; León, P.; Cruz, H.R.; Guevara-García, A.A. Mitogen-activated protein kinase 6 integrates phosphate and iron responses for indeterminate root growth in Arabidopsis thaliana. Physiol. Plant. 2019, 250, 1177–1189. [Google Scholar] [CrossRef]
- Antonangelo, J.A.; Firmano, R.F.; Zhang, H.; Colzato, M.; Abdala, D.B.; Carvalho, H.W.P.; de Oliveira Junior, A.; Alleoni, L.R.F. Phosphorus speciation by P-XANES in an Oxisol under long-term no-till cultivation. Geoderma 2020, 377, 114580. [Google Scholar] [CrossRef]
- Fan, B.; Ding, J.; Fenton, O.; Daly, K.; Chen, Q. Understanding phosphate sorption characteristics of mineral amendments in relation to stabilising high legacy P calcareous soil. Environ. Pollut. 2020, 261, 114175. [Google Scholar] [CrossRef]
- Gu, C.; Dam, T.; Hart, S.C.; Turner, B.L.; Chadwick, O.A.; Berhe, A.A.; Hu, Y.; Zhu, M. Quantifying uncertainties in sequential chemical extraction of soil phosphorus using XANES spectroscopy. Environ. Sci. Technol. 2020, 54, 2257–2267. [Google Scholar] [CrossRef]
- Taiz, L.; Zeiger, E. Plant Physiology, 3rd ed.; Sinauer Associates Inc.: Sunderland, MA, USA, 2002. [Google Scholar]
- Condron, L.; Goh, K. Effects of long-term phosphatic fertilizer applications on amounts and forms of phosphorus in soils under irrigated pasture in New Zealand. J. Soil Sci. 1989, 40, 383–395. [Google Scholar] [CrossRef]
- Sato, S.; Solomon, D.; Hyland, C.; Ketterings, Q.M.; Lehmann, J. Phosphorus speciation in manure and manure-amended soils using XANES spectroscopy. Environ. Sci. Technol. 2005, 39, 7485–7491. [Google Scholar] [CrossRef] [PubMed]
- Ryan, P.; Delhaize, E.; Jones, D. Function and mechanism of organic anion exudation from plant roots. Ann. Rev. Plant. Biol. 2001, 52, 527–560. [Google Scholar] [CrossRef] [PubMed]
- Hinsinger, P.; Plassard, C.; Tang, C.; Jaillard, B. Origins of root-mediated pH changes in the rhizosphere and their responses to environmental constraints: A review. Plant Soil 2003, 248, 43–59. [Google Scholar] [CrossRef]
- Ahmed, N.; Basit, A.; Bashir, S.; Bibi, I.; Haider, Z.; Ali, M.A.; Aslam, Z.; Aon, M.; Alotaibi, S.S.; El-Shehawi, A.M.; et al. Effect of acidified biochar on soil phosphorus availability and fertilizer use efficiency of maize (Zea mays L.). J. King Saud Univ. Sci. 2021, 33, 101635. [Google Scholar] [CrossRef]
- Atkinson, C.J.; Fitzgerald, J.D.; Hipps, N.A. Potential mechanisms for achieving agricultural benefits from biochar application to temperate soils: A review. Plant Soil 2010, 337, 1–18. [Google Scholar] [CrossRef]


| Parameters | FS | CS |
|---|---|---|
| pH | 7.03 | 10.05 |
| Organic Matter (%) | 1.33 | 0.59 |
| Active lime (%) | 5.0 | 11.3 |
| Total carbonates (%) | 6.48 | 28.3 |
| Fe (%) | 0.51 | 0.469 |
| K (%) | 1.125 | 0.663 |
| Mg (%) | 0.599 | 0.661 |
| N (%) | 0.71 | 0.45 |
| C (%) | 0.59 | 0.22 |
| P (%) | 0.153 | 0.212 |
| SEV | AGUA | TUN | |
|---|---|---|---|
| SI-spad | −37.5 a ± 2.8 | −35.5 a ± 3.2 | −21.1 b ± 1.9 |
| SI-DW | −28.3 a ± 1.9 | −16.8 b ± 1.3 | −6.6 c ± 4.6 |
| SI-An | −37.0 a ± 2.9 | −24.9 b ± 2.1 | −12.4 c ± 1.1 |
| SI-P | −55.4 a ± 4.1 | −42.1 b ± 3.2 | −28.3 c ± 1.9 |
| SEV | AGUA | TUN | ||||
|---|---|---|---|---|---|---|
| FS | CS | FS | CS | FS | CS | |
| QP | 2181.96 a ± 121 | 972.11 f ± 67.7 | 1714.5 c ± 101.7 | 1036.2 e ± 89.2 | 2050.57 b ± 123.9 | 1470.66 d ± 99.6 |
| PUE-An | 6.31 d ± 0.51 | 6.37 d ± 0.57 | 6.89 bc ± 0.50 | 6.77 c ± 0.59 | 7.08 b ± 0.62 | 8.36 a ± 0.63 |
| PUE-DW | 7.55 f ± 0.53 | 8.83 e ± 0.66 | 9.67 d ± 0.79 | 11.23 b ± 0.95 | 10.23 c ± 0.84 | 11.80 a ± 0.94 |
| PT | 41 c ± 3.11 | 41 c ± 3.32 | 52 b ± 3.67 | 49 bc ± 4.02 | 59 a ± 3.98 | 59 a ± 4.14 |
Disclaimer/Publisher’s Note: The statements, opinions and data contained in all publications are solely those of the individual author(s) and contributor(s) and not of MDPI and/or the editor(s). MDPI and/or the editor(s) disclaim responsibility for any injury to people or property resulting from any ideas, methods, instructions or products referred to in the content. |
© 2023 by the authors. Licensee MDPI, Basel, Switzerland. This article is an open access article distributed under the terms and conditions of the Creative Commons Attribution (CC BY) license (https://creativecommons.org/licenses/by/4.0/).
Share and Cite
Baccari, B.; Krouma, A. Rhizosphere Acidification Determines Phosphorus Availability in Calcareous Soil and Influences Faba Bean (Vicia faba) Tolerance to P Deficiency. Sustainability 2023, 15, 6203. https://doi.org/10.3390/su15076203
Baccari B, Krouma A. Rhizosphere Acidification Determines Phosphorus Availability in Calcareous Soil and Influences Faba Bean (Vicia faba) Tolerance to P Deficiency. Sustainability. 2023; 15(7):6203. https://doi.org/10.3390/su15076203
Chicago/Turabian StyleBaccari, Basma, and Abdelmajid Krouma. 2023. "Rhizosphere Acidification Determines Phosphorus Availability in Calcareous Soil and Influences Faba Bean (Vicia faba) Tolerance to P Deficiency" Sustainability 15, no. 7: 6203. https://doi.org/10.3390/su15076203