Article

Multi-Source Information Fusion Technology and Its Application in Smart Distribution Power System

1
Department of Electrical and Information Engineering, Hunan Institute of Technology, Hengyang 421002, China
2
Department of Electrical and Information Engineering, Hunan University, Changsha 410006, China
*
Author to whom correspondence should be addressed.
Sustainability 2023, 15(7), 6170; https://doi.org/10.3390/su15076170
Submission received: 3 January 2023 / Revised: 7 March 2023 / Accepted: 31 March 2023 / Published: 3 April 2023

Abstract

:
Compared to traditional measurement devices, the micro-synchrophasor measurement unit (D-PMU or μPMU) in the distribution power system has great differences in data acquisition frequency, data format, data dimension, time-stamped information, etc. Hence, it is imperative to research the integration mechanism of heterogeneous data from multiple sources. Based on the analysis of the current technology of multi-source information fusion, this paper proposes a novel approach, which considers two aspects: the interoperability of multi-source data and the real-time processing of large-scale streaming data. To solve the problem of data interoperability, we have modified the model of D-PMU data and established a unified information model. Meanwhile, an advanced distributed processing technology has been deployed to solve the problem of real-time processing of streaming data. Based on this approach, a smart distribution power system wide-area measurement and control station can be established, and the correctness and practicality of the proposed method are verified by an on-field project.

1. Introduction

With the construction of smart grid, more and more measurement terminals are deployed in the distribution power system, such as the micro-synchrophasor measurement unit (D-PMU) and advanced measurement infrastructure (AMI) units. These devices together with the traditional SCADA system constitute a new hybrid measurement and control system in the distribution grid. On the other hand, due to the widespread access of distributed renewable energy and electric vehicles to the distribution power system, it is necessary to predict the output of renewable energy and manage the charging of electric vehicles, so that the data of inverters, weather stations, and charging piles become very important. All these data are varied in time, space, frequency, dimension, and format, so it is necessary to study the multi-source information fusion mechanism in the distribution grid [1,2,3,4,5].
The smart grid contains various types of data, and different types of data are very different in format and frequency. Traditional SCADA system measurement devices, such as switching station terminal equipment (DTU), feeder terminal equipment (FTU), and distribution transformer terminal equipment (TTU), have a data collection frequency of several seconds to several minutes, while the new D-PMU’s acquisition frequency reaches 30–60 times per second. In terms of accuracy, the relative error of voltage and current amplitude measurement of D-PMU is less than 0.2%, the frequency measurement error is less than 0.005 Hz, and the phase angle error is less than 0.05°, which are much higher than traditional measurement equipment. Due to the deployment of the time synchronization module, the data collected by D-PMU have time stamp information, and the timing error is less than 50 us. However, unlike the large-scale deployment of PMUs in the wide area measurement system (WAMS) for the transmission power system, the application of D-PMU devices is still in its infancy around the world. Therefore, solving the problem of the coexistence of the legacy of SCADA system data and newly emerged D-PMU data is vital for realizing a monitorable and controllable distribution power system [6].
From the perspective of the load side, a large number of AMI smart meters is installed on the user side to collect electricity consumption data, and the data transmission interval is typically once every 5 min. The fusion of such marketing data will greatly improve the accuracy for some advanced applications, such as load forecasting, state estimation, and power theft prevention. At the same time, as loads of distributed photovoltaics are connected, it is necessary to control the micro grid power fluctuation of photovoltaic grid-connected points, so meteorological data and photovoltaic data need to be obtained. For fault diagnosis and location applications, in addition to the D-PMU data, the fault recording data of several cycles before and after the fault and the topology information of the network are also needed. Therefore, whether it is for state estimation, fault location, or coordinated control, the support of multi-source data is required. Only by establishing a multi-source data fusion platform can the wide-area measurement and control room can be effectively supported for the distribution power grid [7,8].
The concept and preliminary theory of information fusion were first proposed by Professor Y. Bar-Shalom, a famous system scientist at the University of Connecticut (Connecticut), in the 1970s, and then, the US military research institute discovered that the probabilistic interconnection filtering of multiple continuous sonar signals can improve the detection accuracy of the local fleet position, and developed a number of practical military information fusion systems, such as a multi-sensor multi-platform tracking intelligence related processing system, a marine surveillance fusion expert system, a radar and ESM intelligence correlation system, etc. [9,10,11].
Since the beginning of this century, with the substantial improvement of intelligent terminal data collection capabilities and network communication capabilities, the multi-source information fusion for the power industry has received widespread attention. The China Southern Power Grid took the lead in building an information integration platform for integrated marketing and distribution in China. The distribution grid integration model of “substation-10 kV feeder-distribution transformer-low-voltage line-power customer” has preliminarily realized the power supply reliability management, customer outage time statistics, the rapid power recovery management, the intensive management of distribution power system dispatching, etc. The system has achieved considerable economic benefits in multiple business links, such as line loss management. Although the integrated information integration platform has realized the initial integration of the six major systems with the large-scale application of smart meters and the explosive growth of power distribution and consumption data brought about by the lean management of the power grid, the basic data are still heterogeneous. There are inherent deficiencies, such as low integration of data sources, serious shortage of massive data throughput, and low ability to process flawed data, while deep mining, knowledge discovery, and comprehensive utilization of large-scale data value are in their infancy [12,13].
The State Grid Corporation of China has carried out the construction of the urban distribution power system demonstration project in Tianjin. This project has realized the integration of intelligent power distribution equipment, communication systems, advanced measurement systems, information support platforms and self-healing control systems. The whole network data integration platform of the distribution power system was established, and an interactive application was carried out. The basis of this demonstration project construction is to integrate information systems to form a standard distribution power system information interaction system, realize the interaction of various real-time data, static data, and graphic data among various business systems, and eliminate information islands [14].
The National Renewable Energy Laboratory (NREL) investigates the requirements for the multi-source data for the integration of renewable energy. It states the input data for integration studies may include the renewable energy resource data, load data, forecast and forecast error data, as well as the wind and solar equipment characteristics data and conventional fleet characteristics data.
There are many studies that propose the use of multi-source fusion data to improve the advanced application of the power grid. Study [15] analyzed state estimation using PMU measurement data and SCADA data, and demonstrated that, compared with the traditional state estimation using only SCADA data, adding PMU data can simplify the Jacobian matrix, speed up the state estimation speed, and improve the estimation efficiency. Study [16] further proposes to use D-PMU, AMI and SCADA data to estimate the hybrid state of the distribution power system, and AMI data is used to replace the traditional pseudo-measurement data obtained through load forecasting. Study [17] proposes an interturn short circuit fault diagnosis method in rotor windings based on multi-source information fusion. Study [18] uses fused data to control power fluctuations at grid-connected points. Through theoretical analysis and measured data, it is verified that compared with a single data source, using fused data can more accurately control power fluctuations at grid-connected points. However, in these studies, the specific data fusion method is not described, but the fused data are directly used, so it is necessary to analyze the method of multi-source data fusion, especially for the emerging D-PMU data.
This paper studies the method and technical route of multi-source information fusion in a distribution power system. Through the analysis of the general multi-source information fusion model, combined with the characteristics of distribution power system data, the D-PMU data are modeled in accordance with the IEC 61850 standard, and a unified information model is proposed. The method is applied to a distribution power system wide-area measurement and control station. It is worth noting that this paper is based mostly on actual engineering to explain the method and technical route of the multi-source data fusion of the distribution power system including D-PMU, rather than detailing the specific fusion algorithm. The novelty of this paper can be summarized as follows:
  • The D-PMU data are modified to comply with the international standards, which is the common information model (CIM). In this paper, the attributes of the classes of the D-PMU data are extended. When extending the model, all the contents of the original model are retained to ensure that the original standard model is a subset of the extended model;
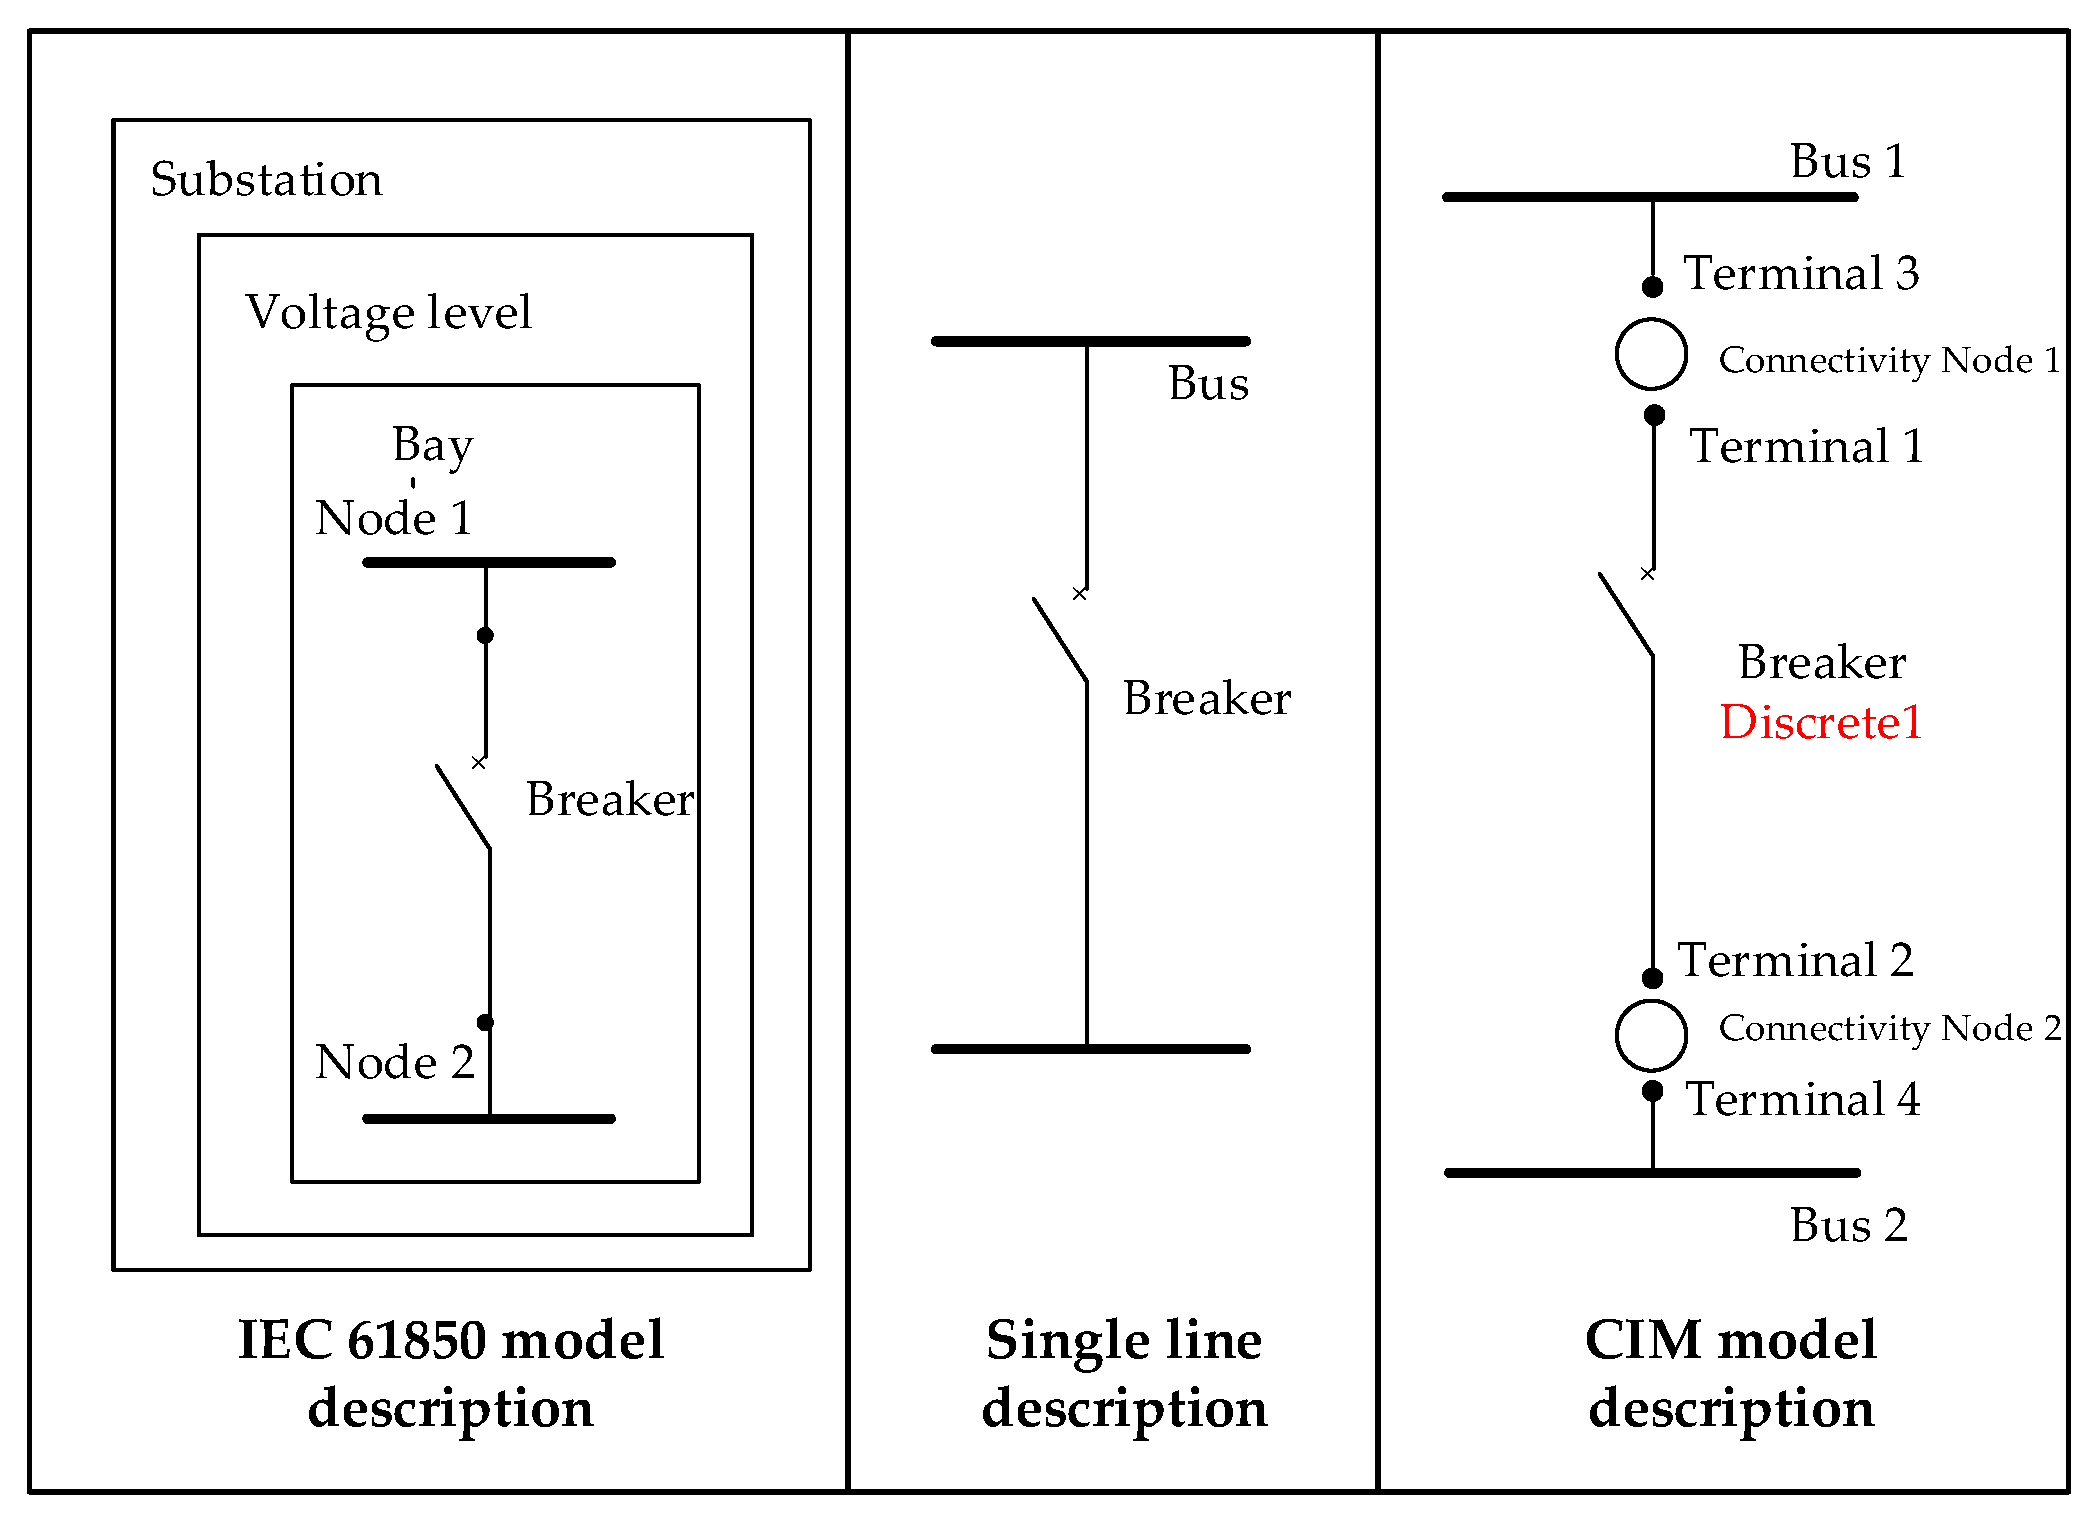
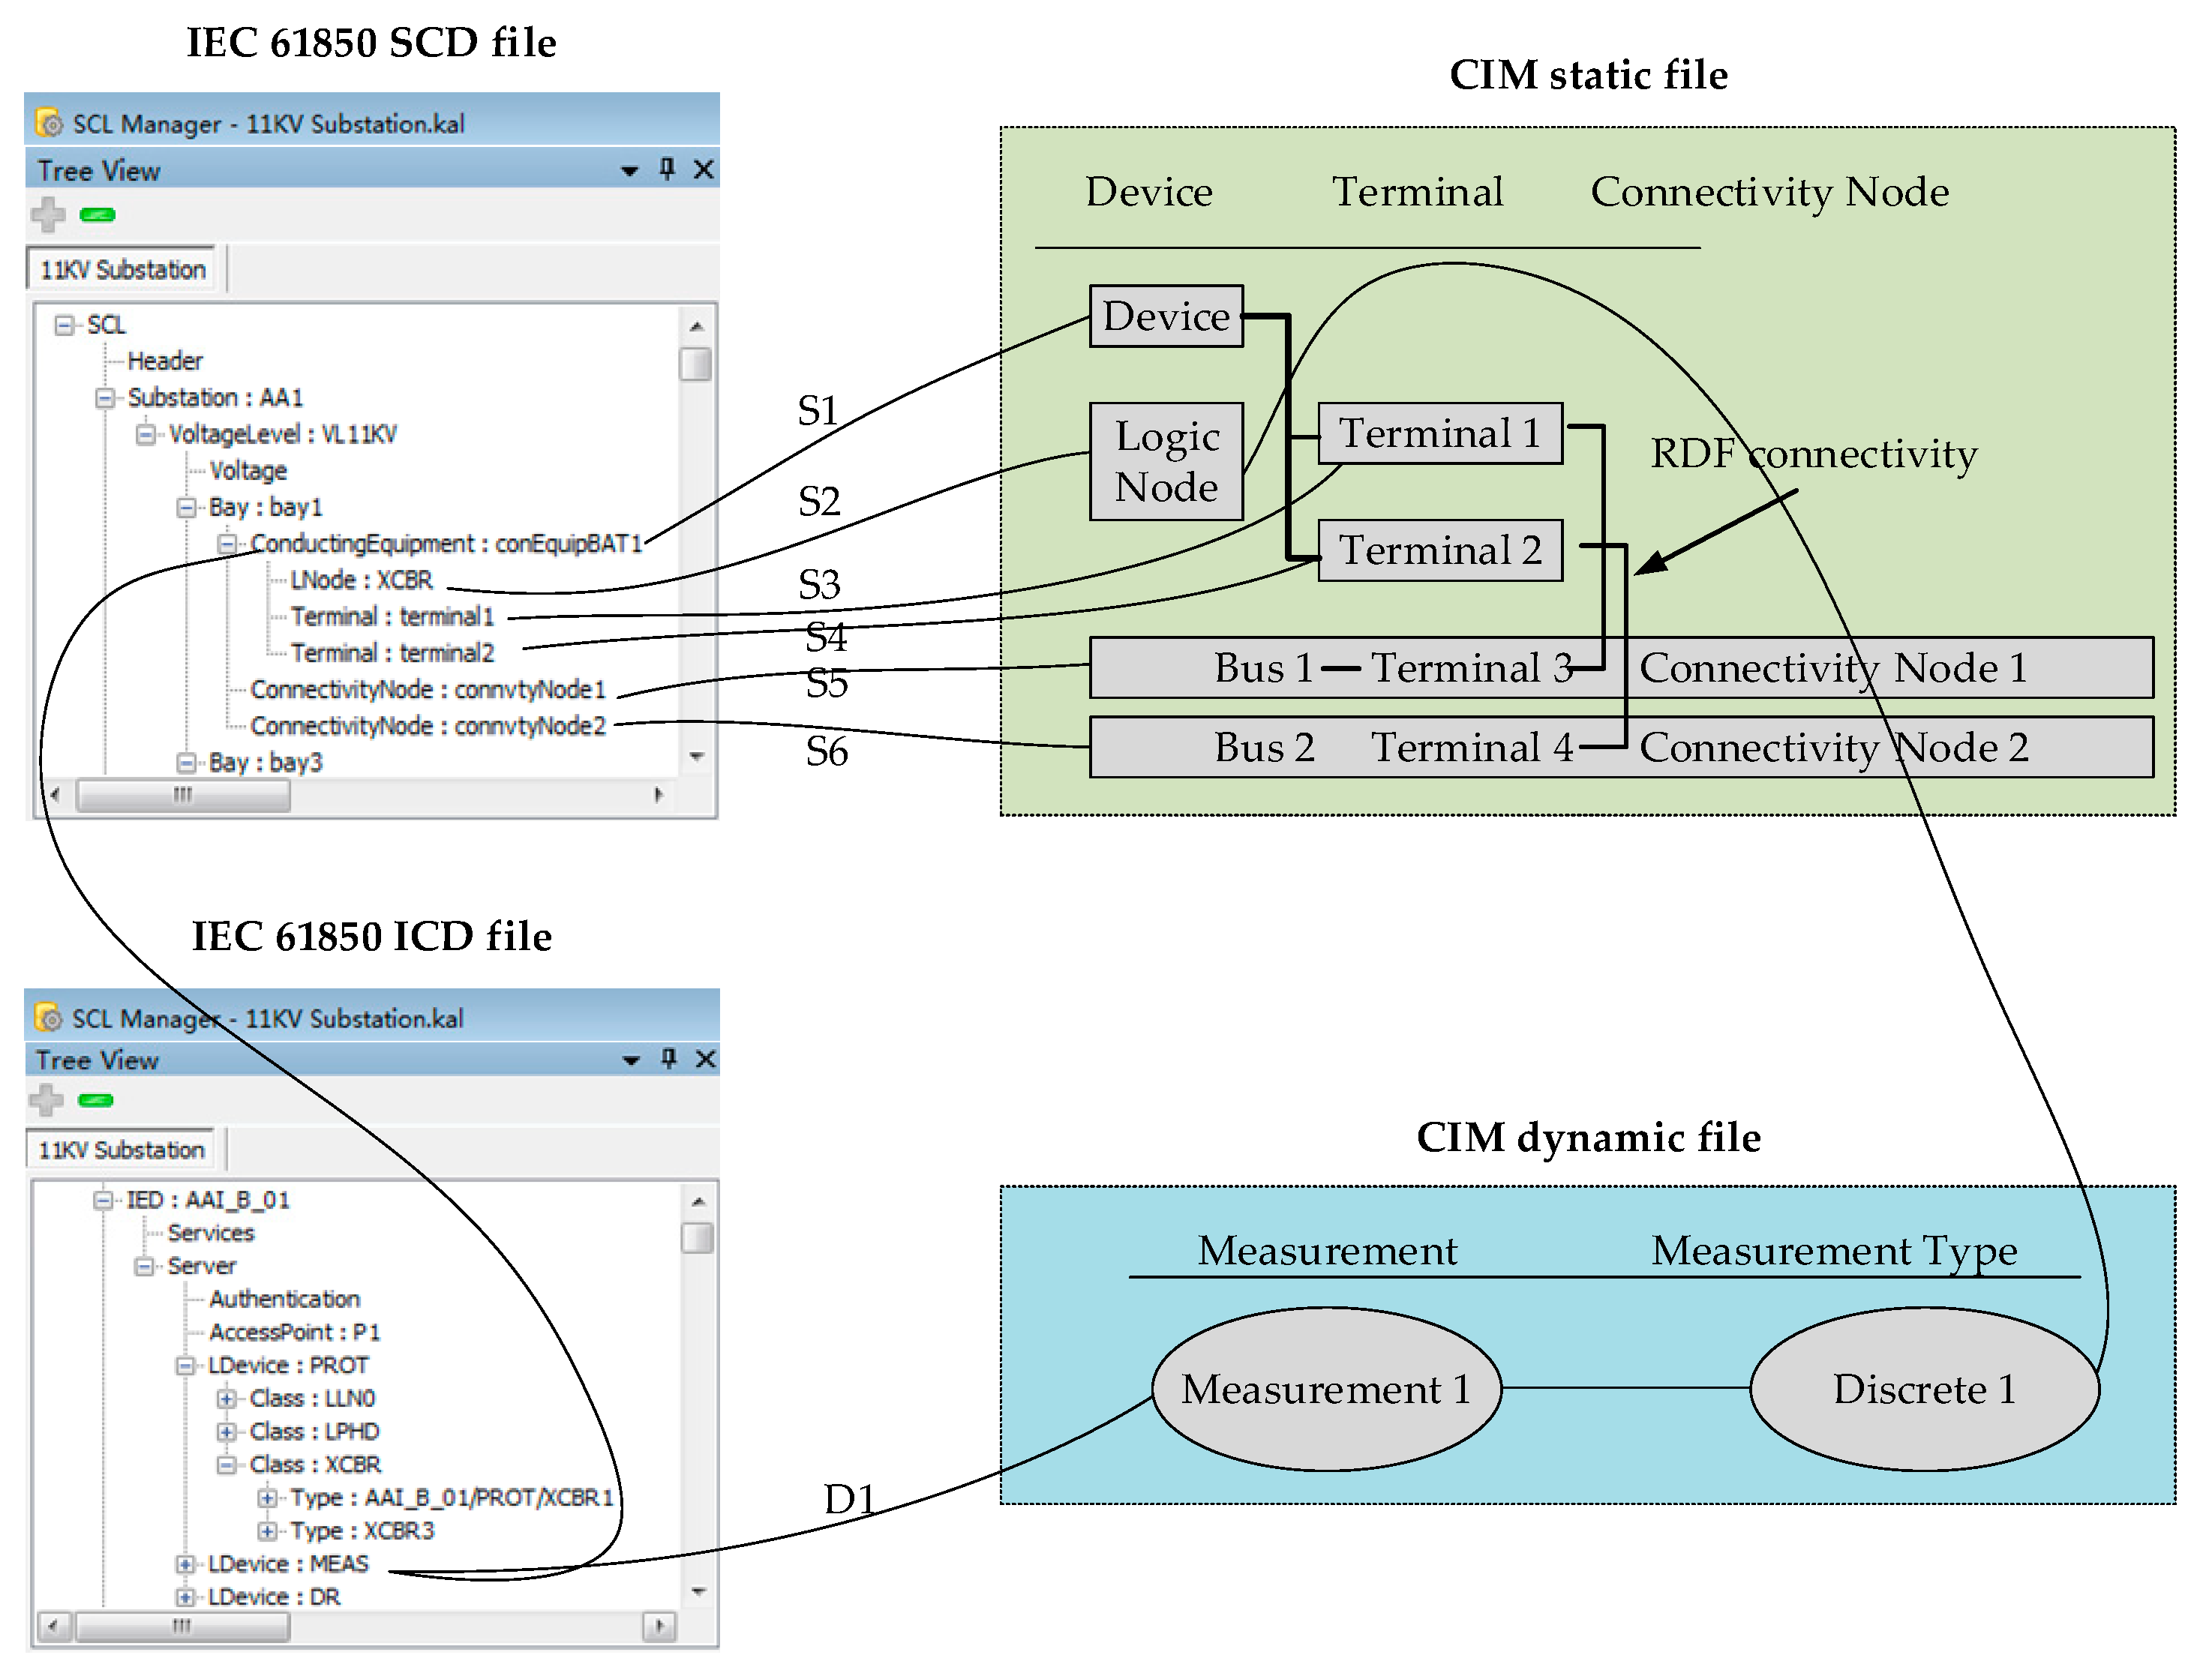
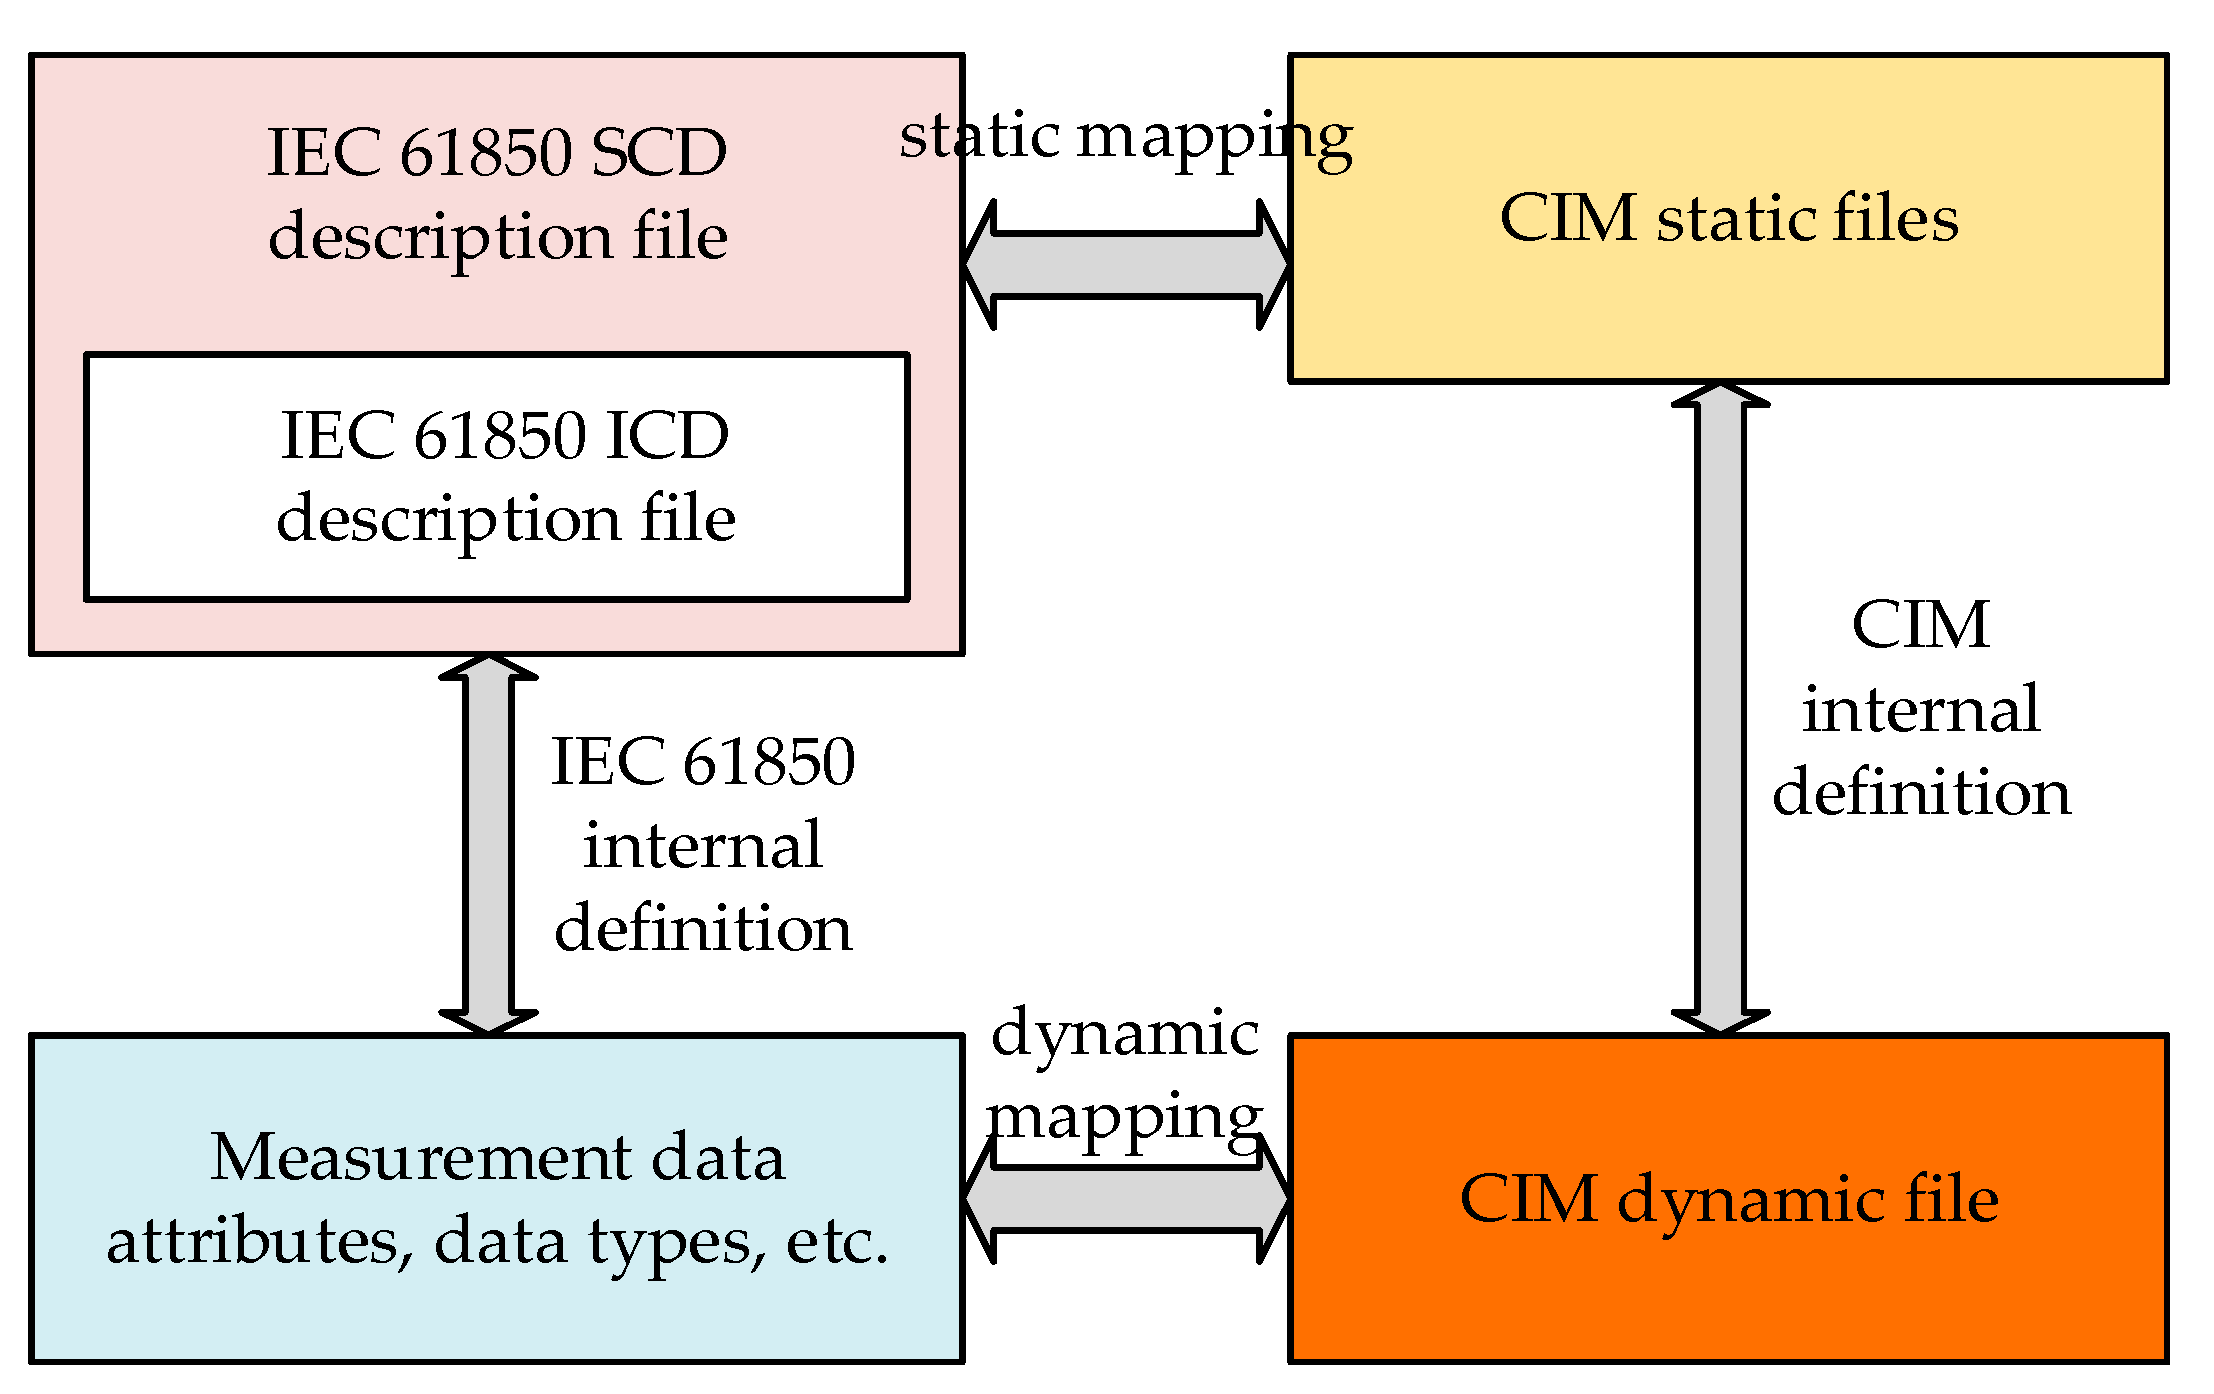
  • A unified information model (UIM) is proposed. The “SCL Manager” developed by Kalki Company is used to establish the SCD and ICD files of the IEC 61850 model, the static file and the dynamic file of the CIM model. The corresponding relations between the elements of IEC 61850 and CIM are elaborated using a network with two busbars and one circuit breaker;
  • A multi-source data fusion platform architecture is proposed and verified on a field project. Based on the proposed method, a distribution power system wide-area measurement and control platform was developed. Due to the adoption of the distributed Spark stream data processing architecture, the number of D-PMUs that the platform can support is >1000, and the access measurement point scale is ≥50,000 measurement points (10-ms refresh).

2. A Novel Technical Route

Most of the information systems of the distribution power system are developed based on the business needs of each department, so there are multiple platforms with different structures, and the data content, data format, and data calling methods are different, resulting in scattered information and resources, and forming serious heterogeneous information islands. In addition, the coverage area of the distribution power system is large, and the measurement devices are scattered in different locations, which brings spatial complexity. Meanwhile the data collection frequency of each measurement device is inconsistent, and the time-scale information is uncertain, which brings time complexity. In recent years, there have been some studies on the fusion of multi-source data, such as the alignment of time-scale data and non-time-scale data, the interpolation of coarse-grained data and fine-grained data and the analysis of data spatial correlation [19,20,21]. However, the information fusion of the newly emerging D-PMU data has not been reported. With the addition of the new D-PMU measurement, the following two key problems need to be solved in the multi-source data fusion of the distribution power system:
(1)
Interoperability issues. For example, how the SCADA, EMS and BMS systems that follow the IEC 61970-301 (CIM) protocol interact with the substation integrated automation system that follows the IEC 61850 protocol and the IED devices installed below it for data and model interaction.
(2)
The problem of real-time processing of large-scale streaming data. Assuming that 100 sets of D-PMU devices are installed, the amount of data collected every day will reach about 60 GB, and this is only a small part of the measurement of the smart distribution power system. D-PMU data is streaming data, which is different from traditional batch data processing methods. Therefore, it is very important to develop a multi-source data fusion platform suitable for the real-time processing of streaming big data.
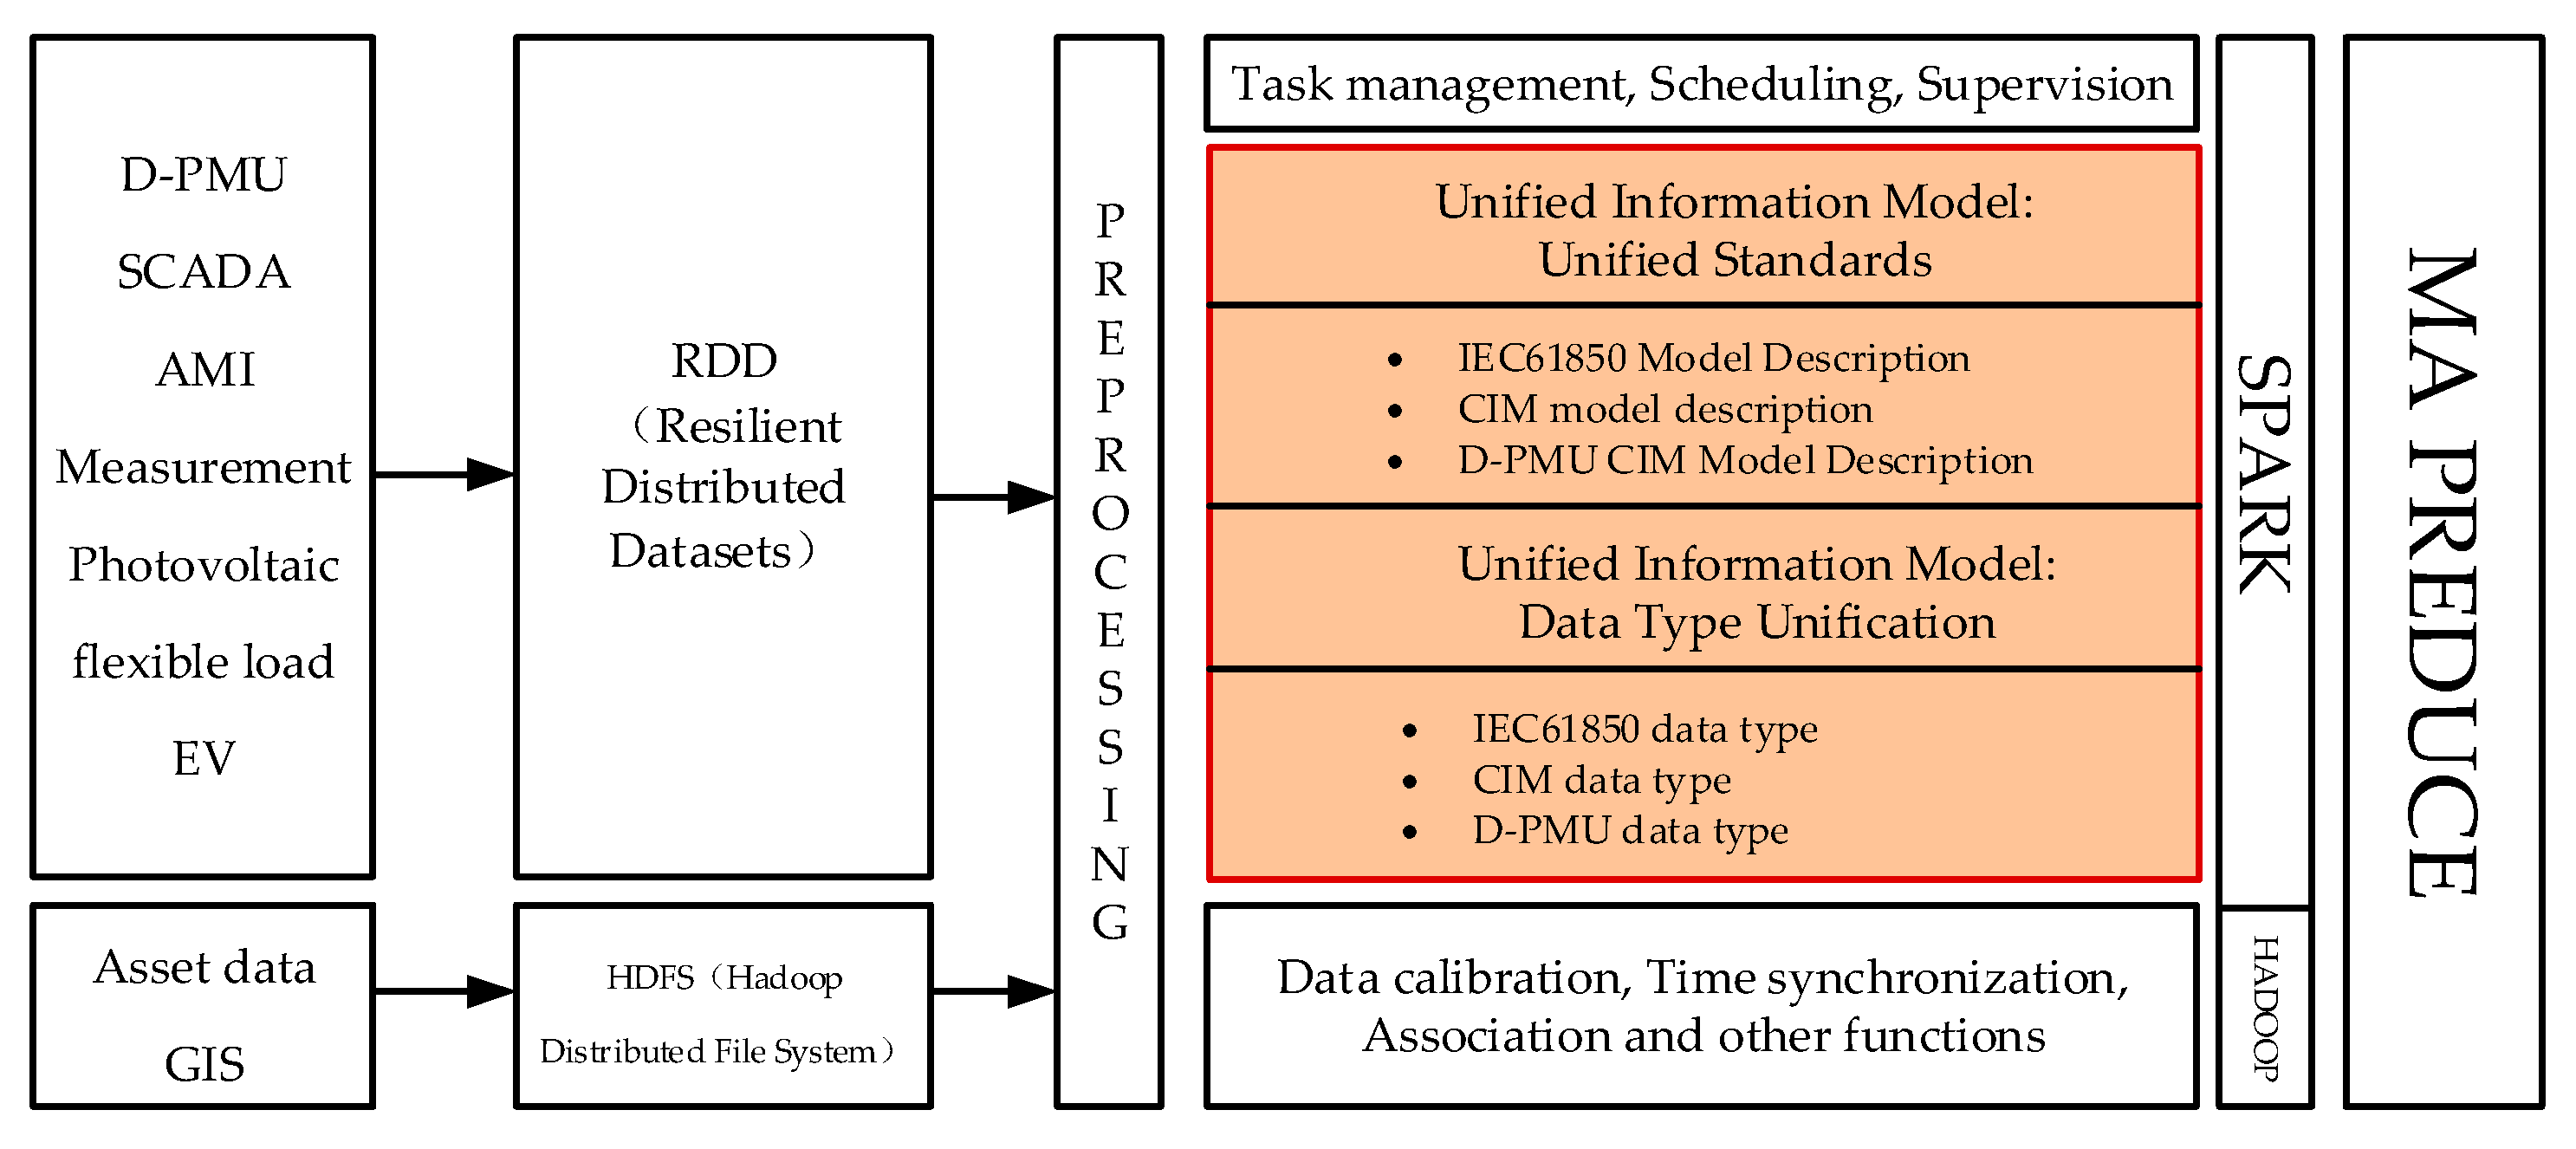
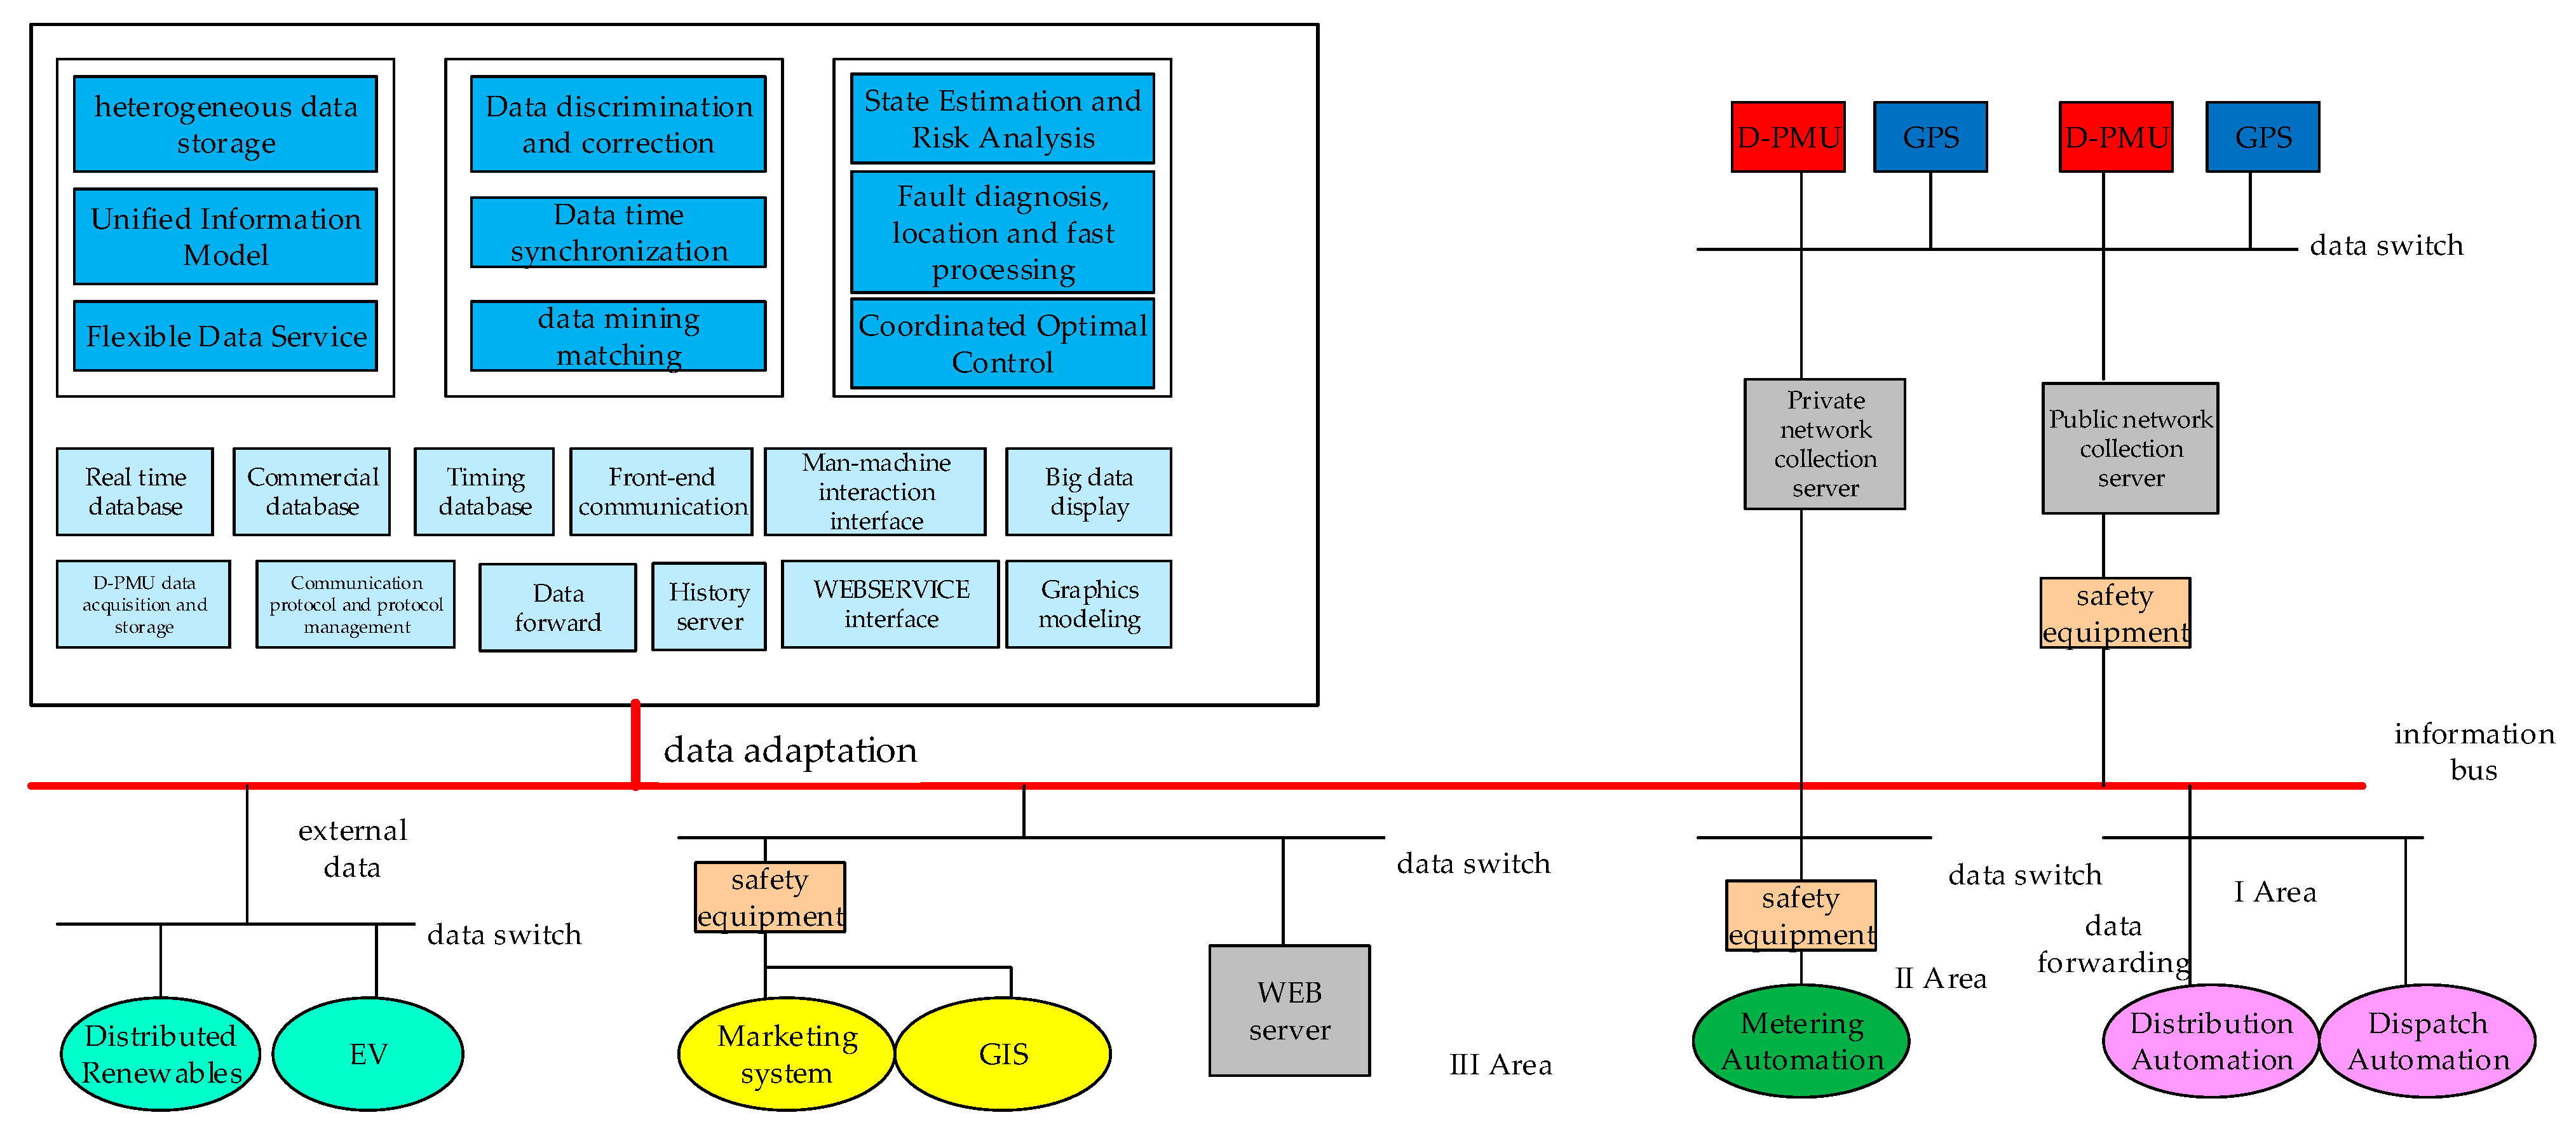
Figure 1 shows the multi-source information fusion model of distribution power system proposed in this paper. The functional part and structural part of this model are designed simultaneously.
Distribution power system data can be mainly divided into dynamic measurement data and static equipment or topology data. In the model shown in Figure 1, the Spark architecture is used for the fusion processing of streaming data, and the Hadoop architecture is used for the fusion processing of batch data. The difference between the two is that streaming computing is needed to perform real-time data calculation directly in memory after online data arrives, and the intermediate results of the calculation will also be cached in memory, so that high-density data can be processed quickly.
The batch processing model stores static data in the HDFS (Hadoop distributed data system) first, and then, processes the static data offline. The dynamic measurement data first enters the RDD (resilient distributed data set) unique to the Spark architecture, and the static data enters the HDFS. Afterwards, the preprocess begins, and then, the unified information model is used to unify the model description and data types stipulated by each standard. There are also some functional modules for data calibration, time synchronization and association. The entire information fusion process adopts the idea of MapReduce for parallel processing.

3. Model Modification for D-PMU Data

To solve the compatibility and interoperability problems between different information models and communication protocols in the power grid, the International Electrotechnical Commission has proposed a number of standards and specifications in the past ten years, among which the IEC61968-301 (CIM) and IEC61850 standards are two standards generally recognized by the industry. The former is aimed at the data interaction of power control centers, such as SCADA (supervisory control and data acquisition), EMS (energy management system) and DMS (distribution power system management system), while the latter is aimed at the field of smart substation interoperability issues [22,23]. With the emergence of a new type of micro-synchrophasor measurement unit (D-PMU) for distribution power systems, it is necessary to analyze its model, and then, integrate the two models of CIM and IEC61850.
D-PMU physically consists of six main parts: the GPS receiving module, time synchronization module, A/D conversion module, filtering module, phasor estimation module and control module [
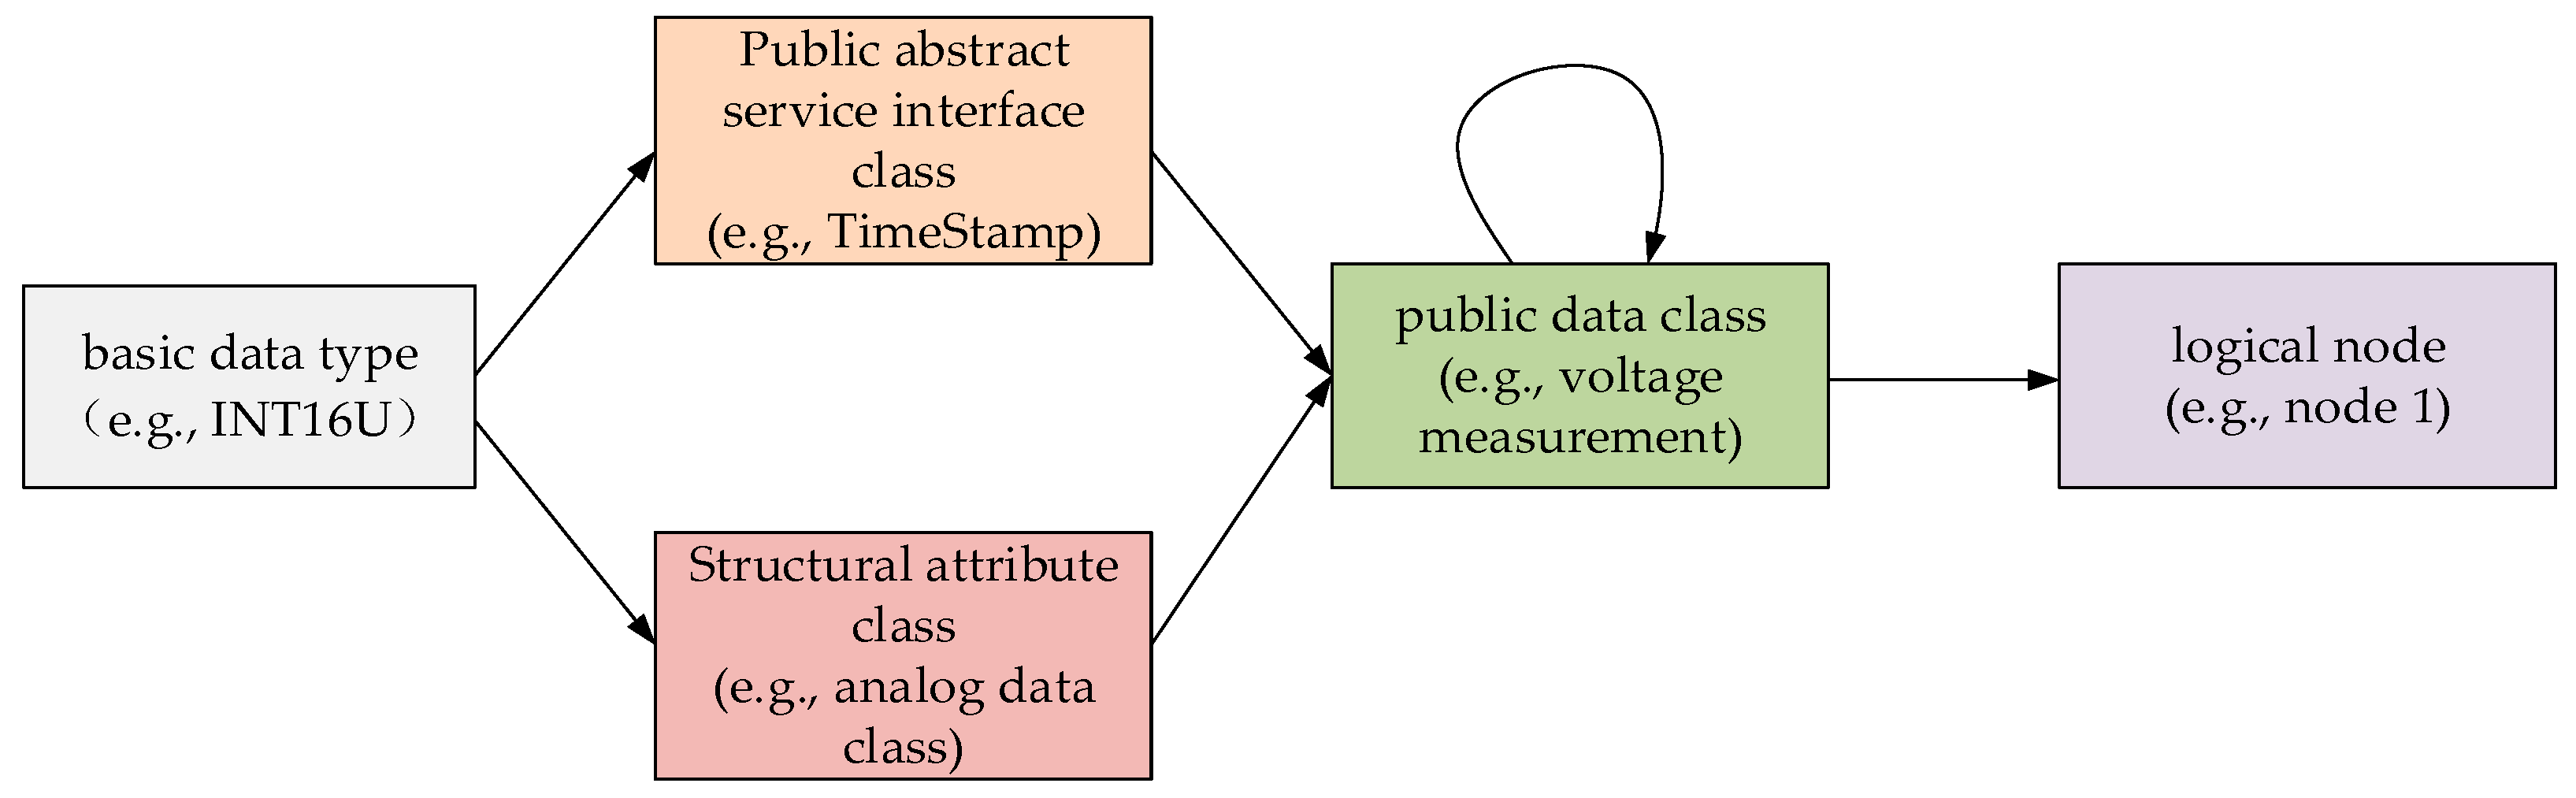
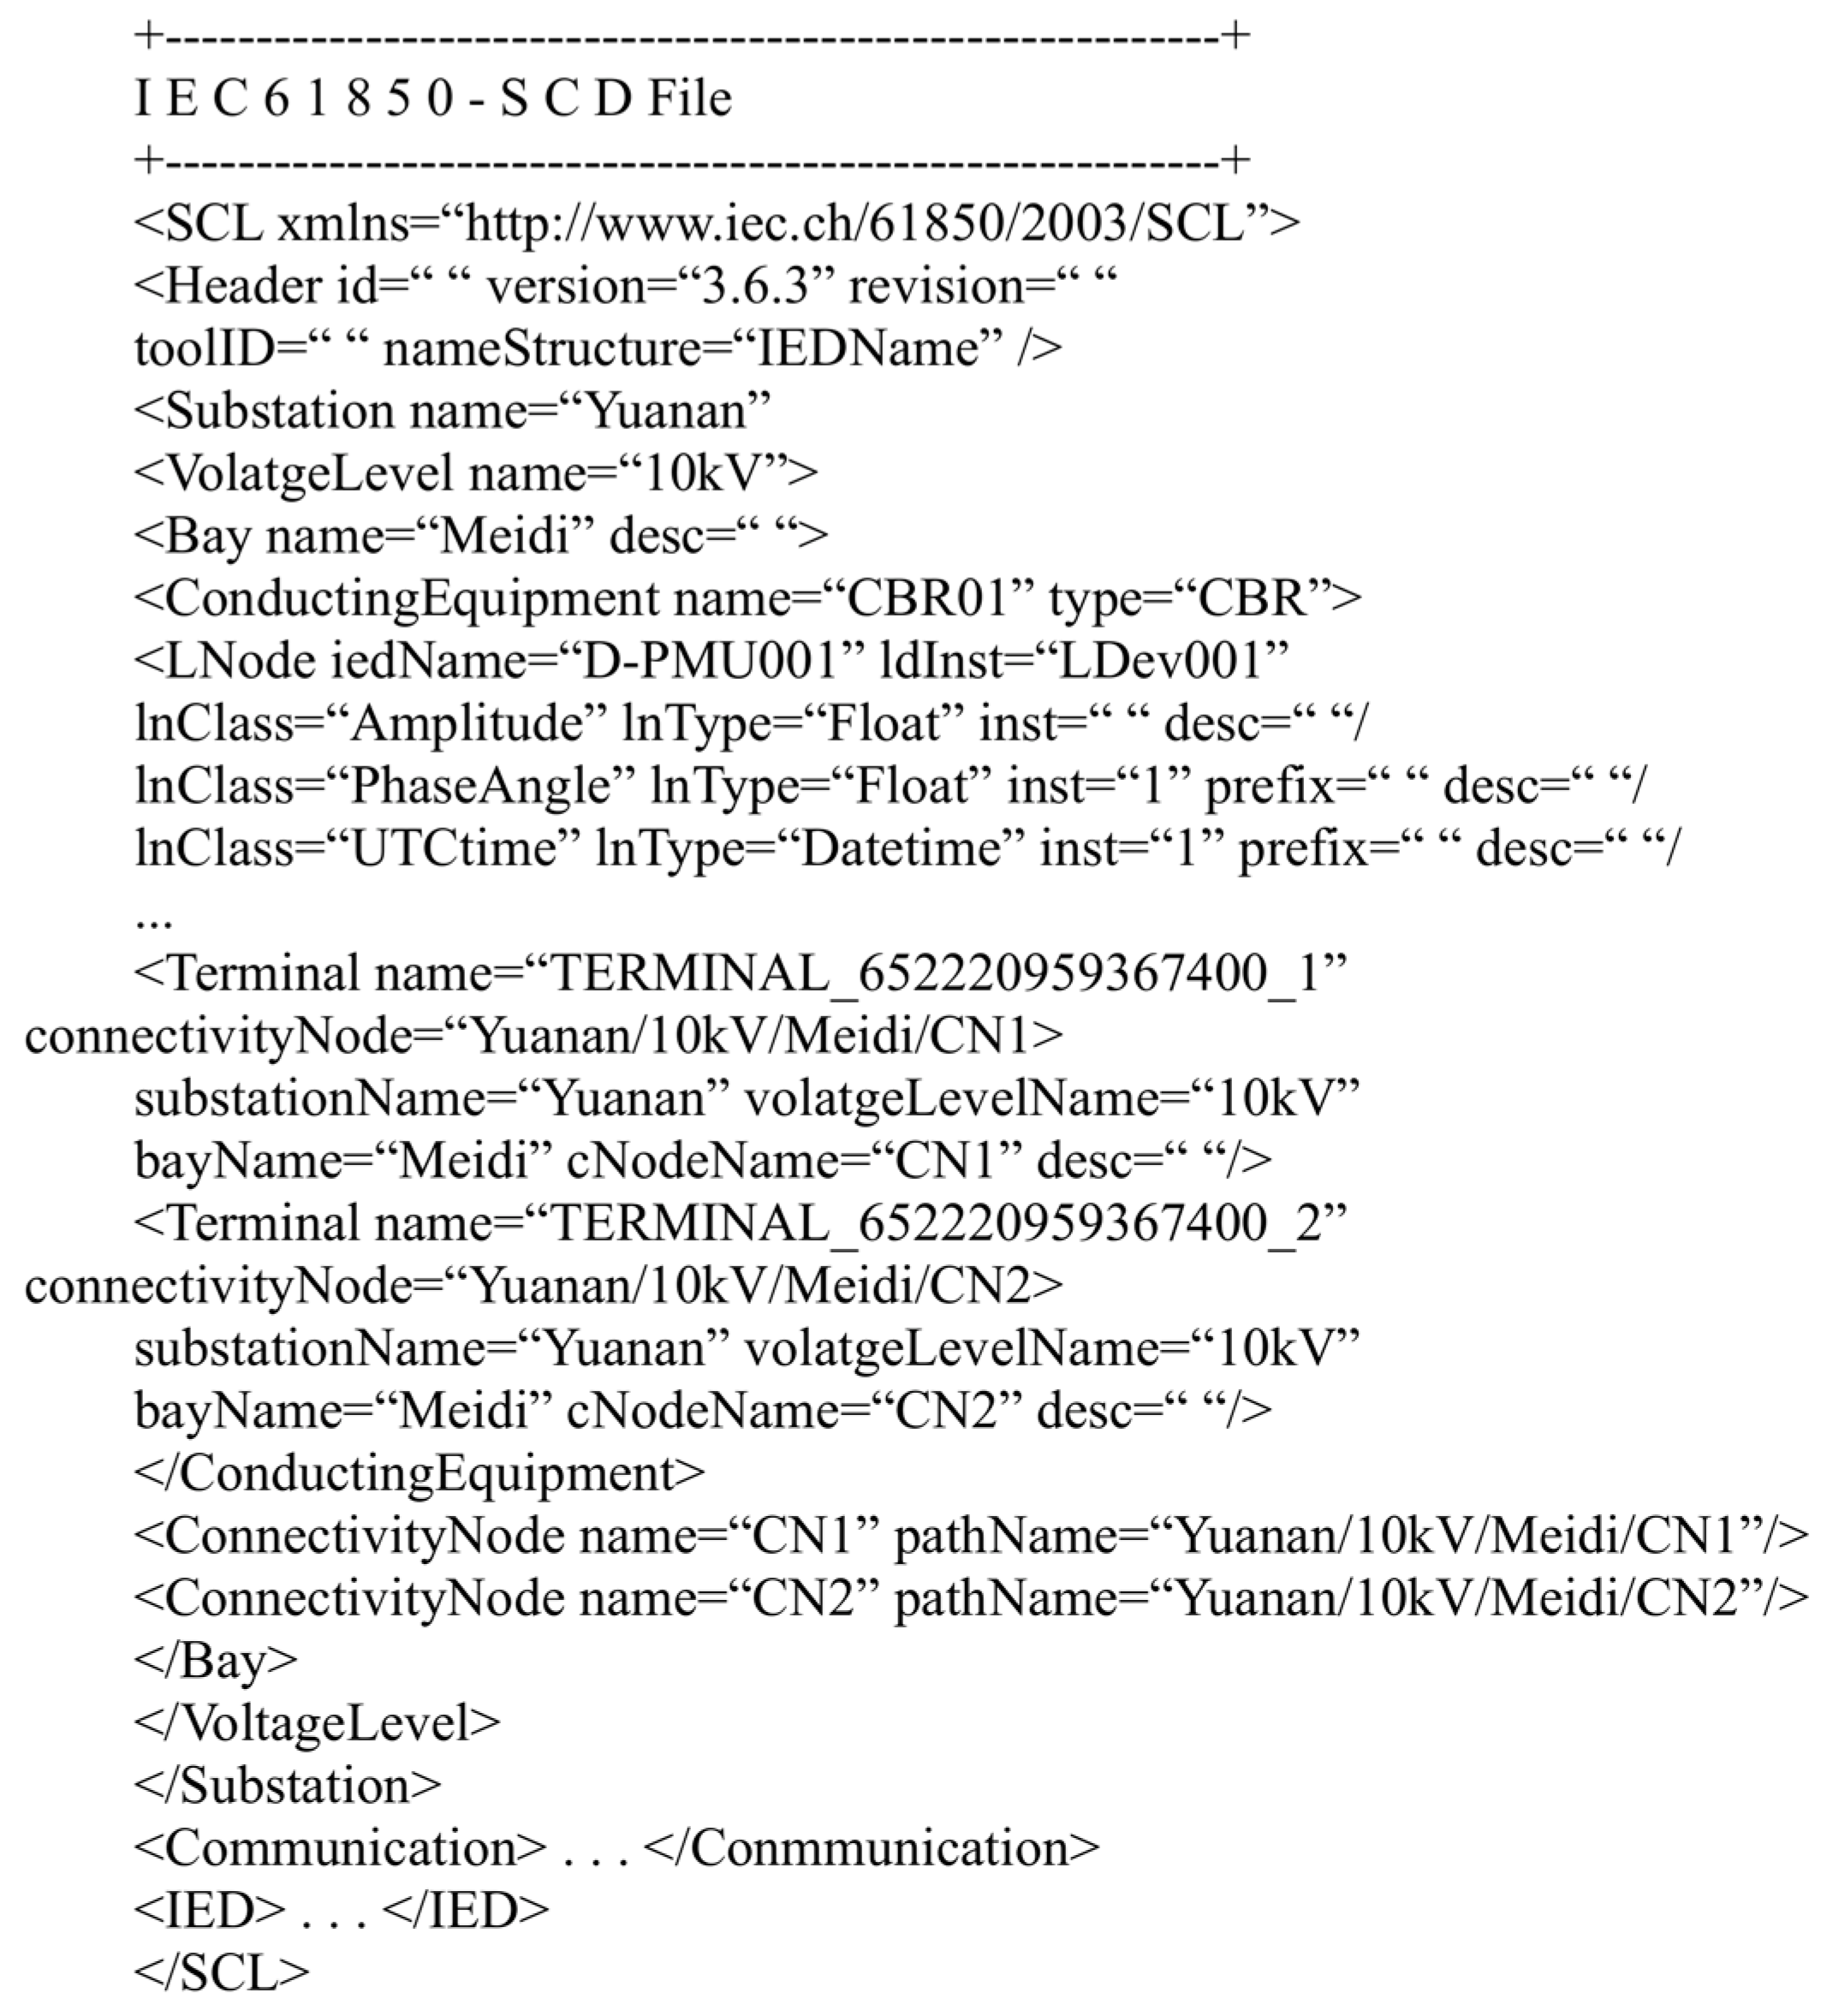
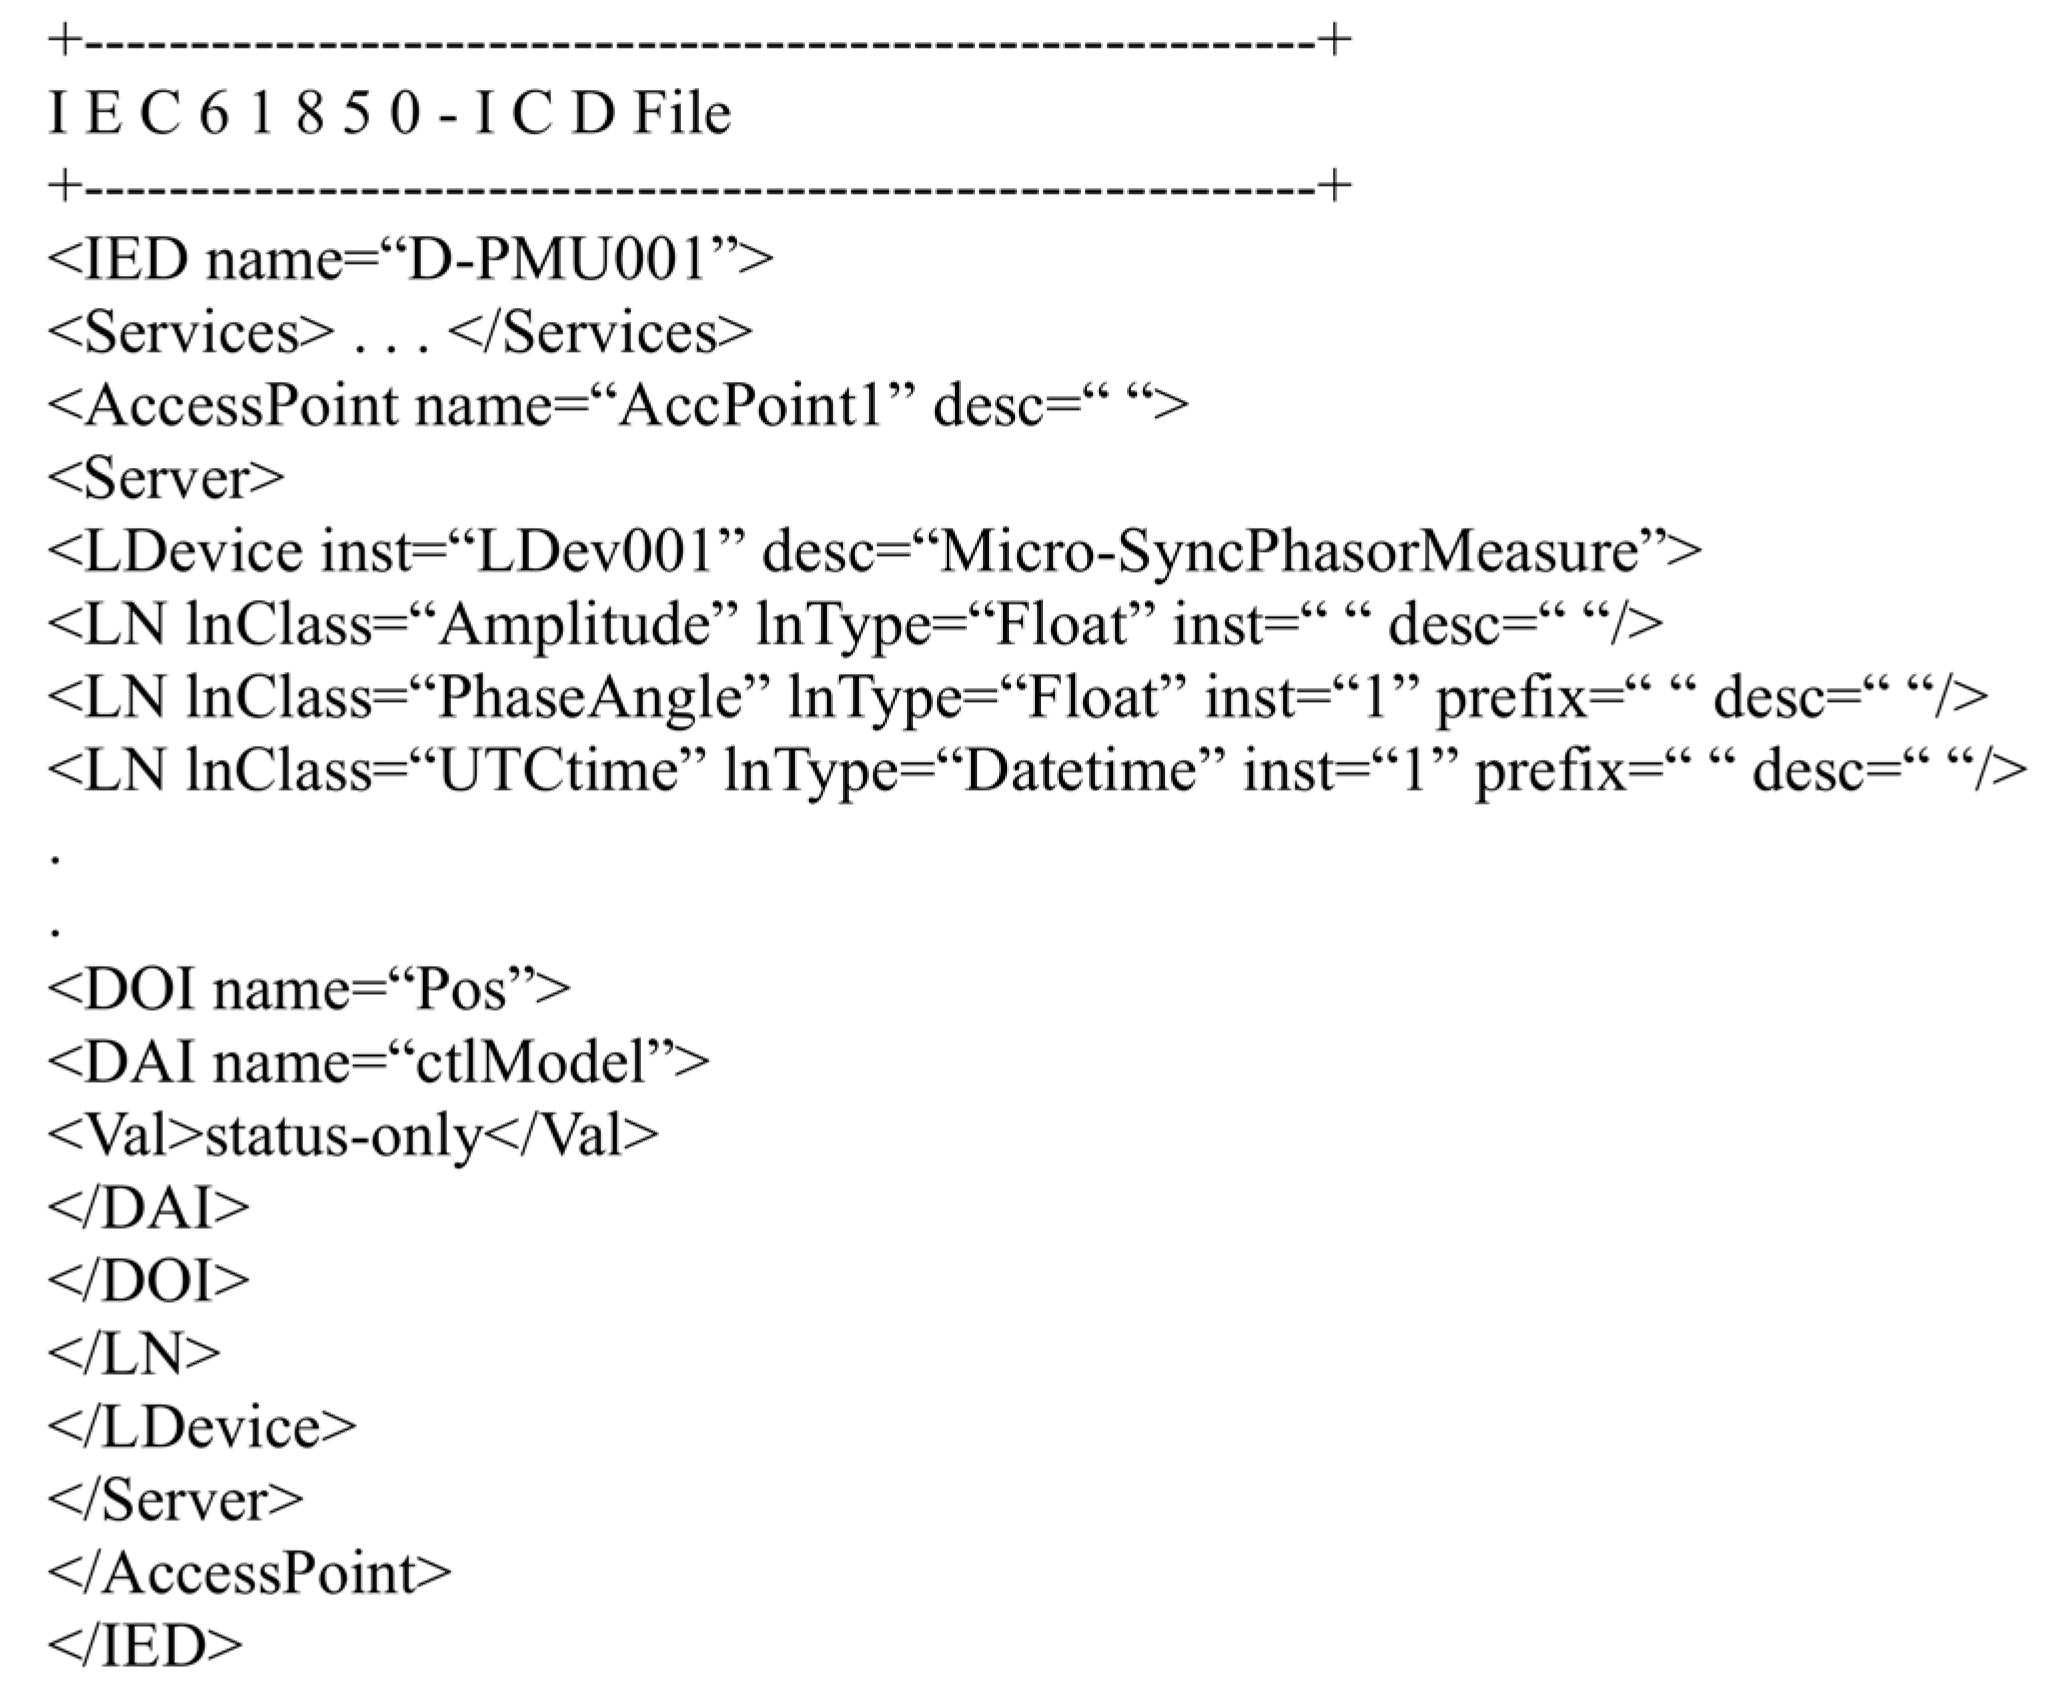
24]. Its design conforms to the IEC 61850 specification, so we build its IEC 61850 model. The IEC 61850 model consists of two parts: the ICD (IED capability description) and SCD (substation configuration description).The IEC 61850 Part 6 defines the extensible markup language (XML) architecture of the ICD, including logical nodes (LD), common data types (CDC), data attributes (DA) and enumerations (Enums), which form a tree structure. The SCD file description provides the structure and information of the substation and includes all the IEDs in the substation [25]. Appendix A gives a sample of the ICD and SCD markup extension language (XML) description of the D-PMU. The attributes and data types of attributes of each module of D-PMU are modified as follows:
(1)
Sampling device
The sampling device (Sampling) inherits from Core: Measurement, and is associated with the synchronous clock module. Its basic function is to collect data and upload it in real time. The synchronous sampling pulse generated by the clock synchronization unit controls the sampling rate to obtain synchronous data. The attributes obtained by this class through inheritance are detailed in its parent class, measurement, and the extended attributes are shown in Table 1.
(2)
Communication link
Communication link (CommunicationLink) inherits from Core: Equipment. The synchronous sampling frequency of the device is about 25.6 KHz, and the number of sampling points per cycle reaches 512. In order not to cause data blockage, it is necessary to set up the communication module so that the cached data at the front end of the processor can be transmitted to the back end for data calculation in time. For details of the properties obtained by this class through inheritance, see its parent class, equipment, and the extended properties are shown in Table 2.
(3)
Phasor calculation unit
The phasor calculation unit (PhasorMeter) inherits from Core: Measurement and implements core functions, such as data reception, time stamp, synchrophasor calculation and upload server. Its specific functions include buffering the data of different channels in their respective buffer areas to realize data differentiation, analyzing GPS time information and status information, using a phasor estimation algorithm to calculate the voltage/current phase angle and the real-time uploading of calculated data. The attributes obtained by this class through inheritance are detailed in its parent class, measurement, and its extended attributes are shown in Table 3.
(4)
Clock synchronization unit
The clock synchronization unit (TimeSynchronization) inherits from Core: Equipment, and is used to generate the synchronous sampling pulses required for data acquisition and provide a high-precision synchronous clock source for each acquisition terminal. The clocks of all synchronization vector acquisition units are synchronized to a master clock, namely the GPS timing clock. PPS is a square wave signal with a frequency of 1 Hz sent by GPS, which provides the basic time synchronization second pulse for the ground timing system, and the rising edge of the pulse is synchronized with the international standard time UTC. The clock synchronization unit also converts the international standard time (UTC) into local time and multiplies the second pulse signal sent by GPS into the required synchronous sampling clock signal. The synchronous clock processing module sends the processed time and synchronous pulse information to the phasor measurement module. The extended attributes are shown in Table 4.
(5)
Time-keeping module
The time-keeping module (TimeKeeping) inherits from Core: Equipment. When the GPS receiving module detects that the satellite signal is interrupted through the status analysis function, the time-keeping module replaces the synchronous satellite, generates a local pulse signal PPS that is strictly synchronized and in phase with the satellite lock, and corrects the time caused by the satellite out of sync Error. This PPS can last for about 6 h. If no GPS locking signal is detected for more than 6 h, the local clock will fail, and an alarm signal will be generated. The extended attributes are shown in Table 5.

4. Unified Information Model

4.1. Unification of Standards

IEC 61850 contains two description files. Similarly, the CIM model also contains two files: the CIM static file and CIM dynamic file. The former includes various equipment and network topology information, such as circuit breakers, buses, generators, loads, etc. When the system increases or decreases devices, the data in this file also changes accordingly, so CIM static files usually represent the latest network topology information [26,27]. Network topologies between different power companies can be exchanged through CIM static files. Different from the tree structure of the SCD file, the CIM static file is a flat structure, and the connection relationship between each device is represented by RDF ID. The CIM dynamic file contains all real-time measurement data and the timestamp information of the data [28]. All this static and dynamic information are described by XML/RDF files.
In order to illustrate the difference between the IEC 61850 model and the CIM model, a simple two-node system with a circuit breaker is used as an example. Figure 2 shows three representations of a system with two busbars and one circuit breaker. The middle is the single-line diagram of the system, the left side is the structural diagram using the IEC 61850 model, and the right side is the structural diagram using the CIM model.
It can be seen in the figure that the two standards have obvious differences when describing the unified system, as shown in:
(1)
The SCD file of the IEC 61850 has a tree structure, while the static file of the CIM is a flat structure, and each device, terminal, and connection node is connected through the RDF ID (resource description file ID);
(2)
The dynamic file of the CIM is associated with the static file through “Discrete1” in the figure, while the dynamic data of IEC 61850 is represented by the path. For example, the opening and closing information of the circuit breaker in Figure 2 can be expressed as “IED1/XCBR2$ST$Pos$stVal”;
(3)
There is no one-to-one correspondence between the elements in the IEC 61850 model and the CIM model, or elements with the same name have different meanings. For example, in the IEC 61850 model expression, there is no description of the busbar, but the connection node (Connectivity Node) is used to represent the busbar (Busbar). However, in the CIM model, a connection node is an abstract structure used to represent the direct connection relationship of terminals.
As shown in Figure 3, the “SCL Manager” developed by Kalki to establish the SCD and ICD files of the IEC 61850 model are used; the static file and the dynamic file of the CIM model for the system are shown in Figure 2. In Figure 3, the corresponding relationship of each file element is indicated by connecting lines.
In Figure 3, S1–S6 represent the mapping between static files, and D1 represents the mapping between dynamic measurements. S1 represents the mapping between circuit breaker elements in the two models; S2 represents the correspondence between the logical nodes in the SCD file and “Descrete1” in the CIM static file; S3 and S4 represent the same representation of the terminal in the two models; S5 and S6 means that in the IEC 61850 model expression, there is no description of the busbar, but the connection node (Connectivity Node) is used to represent the busbar (Busbar). However, in the CIM model, a connection node is an abstract structure used to represent the connection relationship between terminals. Therefore, the connection nodes of IEC 61850 correspond to the three parts of connection nodes, bus terminals and bus elements in the CIM model. D1 represents the mapping between measurement data, provided that the other mappings mentioned above have been completed.
Figure 4 illustrates the mapping relationship between IEC 61850 and the four description files in the CIM protocol. On the left is the IEC 61850 protocol, and on the right is the CIM protocol. Mappings between documents within the specification are indicated by vertical arrows and are defined when the standard is designed. Mappings between different protocols are indicated by horizontal arrows. The mapping between files in Figure 4 can also be extended to the mapping between the internal components of each file. For example, the IED device in the SCD description file can be associated with the static and dynamic description files in the CIM model through RDF ID.

4.2. Unification of Data Types

Since IEC 61850 and CIM standards are applicable to different fields and the two standards are independent, there is a big difference in the definition of data types. Only by solving the data matching relationship between the two models can data fusion and interaction be carried out [29,30].
The IEC 61850 standard defines three data types: basic data classes, abstract service interface classes (ACSI) and structural attribute classes [31,32]. Basic data types include integer, Boolean, floating point, character, enumerated and currency types. Among them, the integer type is divided into eight types according to the length and sign of the data. For example, INT16 represents a signed 16-byte integer type. The abstract service interface class is used to support IEC 61850 communication applications, including time stamp, entry time, physical communication address, etc. A structural attribute class is defined by a basic data class and an abstract service class as the attribute type of common data class (CDC).
The relationship between the three data types defined by the IEC 61850 standard is shown in Figure 5. In the figure, a logical node (LD) is composed of CDC attributes, and CDC is composed of ACSI types containing time stamps and structural attribute classes containing analog data values, and CDCs can also contain other CDCs. Both abstract service interface types and structural property types are ultimately defined by base data classes.
There are four types of data contained in the CIM model: original class, compound class, enumeration class and special data type. The primitive class defines basic data types, including Boolean, decimal, floating point, integer, character, date, time, etc. Composite class is the combination of original class, enumeration class and unique data class. CIM uses composite class to define time interval. The unique data type (CIMDatatypes), which contains attributes such as value, unit, multiplier, etc., is a data type unique to CIM.

5. Actual System Verification

Based on the unified model proposed above, a distribution power system wide-area measurement and control platform was developed. Figure 6 shows the overall architecture of the platform. Static data and dynamic data enter the platform database through the information bus, and the two modules of panoramic information integration and multi-dimensional data analysis realize the cleaning, correlation, and fusion of heterogeneous data, and then, provide them for advanced applications. Due to the adoption of the distributed Spark stream data processing architecture, the number of D-PMUs that the platform can support is >1000, and the access measurement point scale is ≥50,000 measurement points (10-ms refresh).

5.1. Multi-Source Data Fusion Process

The original automation station in the demonstration area is mainly based on the power distribution SCADA system. In the first phase of the project, 28 D-PMU equipment and several AMR acquisition devices are arranged. Taking the three feeder networks F2, F5 and F9 under the 1# main transformer of the 110 kV Yuan’an substation as the verification object, the network topology is shown in Figure 7.
The original power distribution SCADA system uses CIM model equipment and network for modeling, while the newly connected D-PMU, AMI and other equipment conform to the IEC 61850 model. Therefore, the original CIM model is mapped to the new IEC 61850 model, and the data types are corresponding, extended and modified.
The ASE 61850 Suite modeling development tool that was developed by Kalkitech and used to build a topology model that conforms to the IEC 61850 standard for the topology is shown in Figure 8. After the topology model is established, the ASE 61850 Suite tool will automatically generate tree-structured SCD files and ICD files describing the static configuration and dynamic measurement of the system, which are equivalent to the static files and dynamic files in the CIM model [33]. The ICD (IED capability description) file and the SCD (substation configuration description) file are two parts of the IEC 61850 model. IEC 61850 Part 6 defines the extensible markup language (XML) architecture of the ICD, including logical nodes (LD), public data type (CDC), data attribute (DA) and enumeration (Enums), this information form a tree structure. The SCD file description provides the structure and information of the substation and includes all the IEDs in the substation.

5.2. Results

Based on the unified modeling, all sub-systems, including distribution automation, distributed power control, D-PMU, etc., convert the private data format into a standard one and establish mapping relations with a time-series database, real-time database, historical database and columnar database. The result of converting a D-PMU data fragment into a standard format is as follows: Sustainability 15 06170 i001
Table 6 shows the impact of data fusion on advanced applications (state estimation, fault detection and fault location) and data access speed. It can be seen in the comparison results that after multi-source data fusion, the accuracy of state estimation, fault location and fault detection can be improved. The time-series database and columnar database have replaced the previous single relational database, so that the database refresh speed, data query and access efficiency have also been improved. Therefore, the fast tracking and identification of distribution power system transients and dynamic processes can be realized.

6. Challenges and Prospects

Based on the characteristics of distribution power system data, this paper proposes a new idea of multi-source information fusion in the distribution power system and verifies it through actual demonstration project. In terms of structure, the proposed fusion model adopts Spark architecture to process stream data, which solves the bottleneck of high-frequency data stream processing; in terms of function, it adopts a unified information model to unify the two types of data specifications and performs a new type of D-PMU data model modification. At present, compared with other fields, the theoretical and practical research of multi-source information fusion in distribution power system is still in its infancy, and there are mainly difficulties and challenges in the following two aspects:
(1)
The problem of deep data fusion. Compared with simple information fusion for the purpose of data interaction, deep fusion should also realize the mining of hidden relationships between various data and the extraction of feature data, involving principal component analysis (PCA), singular value decomposition, and other complex algorithms. Machine learning and data mining are effective methods to solve deep data fusion [34,35];
(2)
Data security issues. The power system has extremely high security requirements. In recent years, the power grid has been repeatedly attacked by data manipulation, which has also sounded the alarm for the management and operation personnel of the power system. The data of the multi-source information fusion system come from various subsystems or acquisition devices, so they are vulnerable to attacks, and once an attack occurs, it will have a huge impact on the distribution power system [36,37,38].
With the introduction of models and concepts such as the energy internet and “Internet + Electricity”, the degree of informatization of the power system will increase, and it will also bring new opportunities for the development of the power system, mainly reflected in the following aspects.
(1)
Application of big data technology in information fusion. In recent years, big data technology has developed rapidly in many fields, such as commerce, medical care, and aviation, and power data are increasingly showing the characteristics of big data. Therefore, using big data thinking to carry out data fusion and analysis will promote the development of distribution power systems [39,40,41];
(2)
Machine learning and artificial intelligence. Artificial intelligence can solve the problem of inaccurate and uncertain information. The fusion method based on expert system and artificial neural network has been applied to some data fusion applications in the military field. At the heart of artificial intelligence, machine learning (ML) is the study of how to improve the performance of specific algorithms through empirical learning. Deep data fusion will be facilitated by machine learning and artificial intelligence [42,43,44].

7. Conclusions

In this paper, through the analysis of the general multi-source information fusion model, based on the characteristics of distribution power system data, the micro-synchrophasor measurement device has been modeled, a unified information model is proposed, and the data types are mapped. Structurally, this model uses a distributed architecture to process streaming data, and functionally establishes a unified information model to convert models and map data structures defined by different protocols. The proposed technical route has been verified through a demonstration project. Finally, this paper analyzes the challenges and opportunities that lie ahead and proposes that big data technology and artificial intelligence may become important means for future information fusion.

Author Contributions

Conceptualization, methodology, X.H.; software, validation, X.H. and H.D.; data curation, manuscript review and revision, W.Y. and W.L. All authors have read and agreed to the published version of the manuscript.

Funding

This research was funded by Key project of Hunan Provincial Department of Education, grant number 22A0632, Hunan Provincial Natural Science Foundation Provincial and Municipal Joint Project, and Innovation and Entrepreneurship Training Program for College Students in Hunan Province, grant number S202211528042.

Institutional Review Board Statement

Not applicable.

Informed Consent Statement

Not applicable.

Data Availability Statement

The data presented in this study are available on request from the corresponding author. The data are not publicly available due to project data restriction.

Conflicts of Interest

The authors declare no conflict of interest.

Abbreviations

D-PMUmicro-synchrophasor measurement unit
AMIadvanced measurement infrastructure
SCADAsupervisory control and data acquisition
DTUdistribution terminal unit
FTUfeeder terminal unit
TTUtransformer terminal equipment
WAMSwide area measurement system
EMSenergy management system
BMSbuilding management system
CIMcommon information model
SPARKApache Spark, a multi-language engine for executing stream data
HDFSHadoop distributed file system
RDDresilient distributed data set
EVelectric vehicle
SCDsubstation configuration description
ICDIED capability description
XMLextensible markup language
CDCcommon data types
RDFresource description file

Appendix A

Figure A1. The XML description of SCD file.
Sustainability 15 06170 g0a1
Figure A2. The XML description of ICD file.
Sustainability 15 06170 g0a2

References

  1. Liu, Y.; Wu, L.; Li, J. D-PMU based applications for emerging active distribution systems: A review. Electr. Power Syst. Res. 2020, 179, 106063. [Google Scholar] [CrossRef]
  2. Ahmed, M.M.; Amjad, M.; Qureshi, M.A.; Imran, K.; Haider, Z.M.; Khan, M.O. A Critical review of state-of-the-art optimal PMU placement techniques. Energies 2022, 15, 2125. [Google Scholar] [CrossRef]
  3. Ge, L.; Liu, H.; Yan, J.; Zhu, X.; Zhang, S.; Li, Y. Optimal integrated energy system planning with dg uncertainty affine model and carbon emissions charges. IEEE Trans. Sustain. Energy 2022, 13, 905–918. [Google Scholar] [CrossRef]
  4. Ghamisi, P.; Rasti, B.; Yokoya, N.; Wang, Q.; Hofle, B.; Bruzzone, L.; Bovolo, F.; Chi, M.; Anders, K.; Gloaguen, R.; et al. Multisource and multitemporal data fusion in remote sensing: A comprehensive review of the state of the art. IEEE Geosci. Remote Sens. Mag. 2019, 7, 6–39. [Google Scholar] [CrossRef] [Green Version]
  5. Mohandes, B.; El Moursi, M.S.; Hatziargyriou, N.; El Khatib, S. A review of power system flexibility with high penetration of renewables. IEEE Trans. Power Syst. 2019, 34, 3140–3155. [Google Scholar] [CrossRef]
  6. Shahsavari, A.; Farajollahi, M.; Stewart, E.M.; Cortez, E.; Mohsenian-Rad, H. Situational awareness in distribution grid using micro-PMU data: A machine learning approach. IEEE Trans. Smart Grid 2019, 10, 6167–6177. [Google Scholar] [CrossRef] [Green Version]
  7. Gu, D.; Gao, Y.; Chen, K.; Shi, J.; Li, Y.; Cao, Y. Electricity theft detection in ami with low false positive rate based on deep learning and evolutionary algorithm. IEEE Trans. Power Syst. 2022, 37, 4568–4578. [Google Scholar] [CrossRef]
  8. Huang, M.; Wei, Z.; Sun, G.; Zang, H. Hybrid state estimation for distribution systems with ami and scada measurements. IEEE Access 2019, 7, 120350–120359. [Google Scholar] [CrossRef]
  9. Hall, D.L.; Llinas, J. Handbook of Multisensor data fusion. Artech House Radar Libr. 2008, 39, 180–184. [Google Scholar]
  10. Hall, D.L.; Llinas, J. An introduction to multisensor data fusion. In Proceedings of the IEEE International Symposium on Circuits and Systems, Phoenix-Scottsdale, AZ, USA, 26–29 May 2002; Volume 6, pp. 537–540. [Google Scholar]
  11. Mitchell, H.B. Multi-Sensor Data Fusion; Artech House: London, UK, 1990; pp. 25–42. [Google Scholar]
  12. Ge, L.; Li, Y.; Li, Y.; Yan, J.; Sun, Y. Smart distribution network situation awareness for high-quality operation and maintenance: A brief review. Energies 2022, 15, 828. [Google Scholar] [CrossRef]
  13. Cao, B.; Yan, Y.; Wang, Y.; Liu, X.; Lin, J.C.-W.; Sangaiah, A.K.; Lv, Z. A Multiobjective Intelligent Decision-Making Method for Multistage Placement of PMU in Power Grid Enterprises; IEEE Transactions on Industrial Informatics: Piscataway, NJ, USA, 2022; pp. 1–9. [Google Scholar]
  14. Luo, L.; Wu, Z.; Gu, W.; Huang, H.; Gao, S.; Han, J. Coordinated allocation of distributed generation resources and electric vehicle charging stations in distribution systems with vehicle-to-grid interaction. Energy 2019, 192, 116631. [Google Scholar] [CrossRef]
  15. Zhao, J.; Netto, M.; Mili, L. A Robust Iterated Extended Kalman Filter for Power System Dynamic State Estimation. IEEE Trans. Power Syst. 2016, 32, 3205–3216. [Google Scholar] [CrossRef]
  16. Moshtagh, S.; Rahmani, M. Robust hybrid state estimation for power systems utilizing Phasor measurements units. Electr. Power Syst. Res. 2021, 196, 107195. [Google Scholar] [CrossRef]
  17. Ma, M.; He, P.; Li, Y.; Li, H.; Jiang, M.; Wu, Y. Fault diagnosis method based on multi-source information fusion for weak interturn short circuit in synchronous condensers. IET Electr. Power Appl. 2021, 15, 1245–1260. [Google Scholar] [CrossRef]
  18. Wang, J.; Peng, J.; Duan, J.; Liu, Z.; Yuan, S.; Chao, Q. Control strategy for suppressing power fluctuation of equivalent load in Microgrids based on demand-side reservation and response. Autom. Electr. Power Syst. 2017, 41, 69–77. [Google Scholar]
  19. Zhang, P.; Li, T.; Wang, G.; Luo, C.; Chen, H.; Zhang, J.; Wang, D.; Yu, Z. Multi-source information fusion based on rough set theory: A review. Inf. Fusion 2020, 68, 85–117. [Google Scholar] [CrossRef]
  20. Chen, F.; Yuan, Z.; Huang, Y. Multi-source data fusion for aspect-level sentiment classification. Knowl. Based Syst. 2020, 187, 104831. [Google Scholar] [CrossRef]
  21. Wang, H.; Deng, X.; Jiang, W.; Geng, J. A new belief divergence measure for Dempster–Shafer theory based on belief and plausibility function and its application in multi-source data fusion. Eng. Appl. Artif. Intell. 2021, 97, 104030. [Google Scholar] [CrossRef]
  22. Kaneda, K.; Tamura, S.; Fujiyama, N.; Arata, Y.; Ito, H. IEC61850 based Substation Automation System. In Proceedings of the Joint International Conference on Power System Technology & IEEE Power India Conference, New Delhi, India, 12–15 October 2008. [Google Scholar]
  23. Latisko, G.; Bhati, D.; Landenberger, V. Application of IEC61970 and IEC61968 at KCP&L Smart Grid demonstration project. In Proceedings of the Innovative Smart Grid Technologies Conference, Washington, DC, USA, 19–22 February 2014. [Google Scholar]
  24. Luo, C.C.; Liu, C.W. Design and implementation of dual time synchronization signal for Micro Phasor Measurement Unit (μPMU). In Proceedings of the Instrumentation and Measurement Technology Conference Proceedings, Taipei, Taiwan, 23–26 May 2016; pp. 1–6. [Google Scholar]
  25. IEEE P1/d600; IEEE Unapproved Draft Standard for Exchanging Information between Networks Implementing IEC 61850 and IEEE Std 1815(TM) (Distributed Network Protocol—DNP3). IEEE: Piscataway, NJ, USA, 2015.
  26. Martin, K.E. Synchrophasors in the IEEE C37.118 and IEC 61850; IEEE: Piscataway, NJ, USA, 2010; pp. 1–8. [Google Scholar]
  27. Ozansoy, C.R.; Zayegh, A.; Kalam, A. The Application-View model of the International Standard IEC 61850. IEEE Trans. Power Deliv. 2009, 24, 1132–1139. [Google Scholar] [CrossRef]
  28. Huang, H.; Gao, Z.; Dai, J.; Wang, Y.; Shan, X.; Zhai, M.; Liu, G.; Wang, W. Power grid modeling and topology analysis based on graph database conforming with CIM/E. In Proceedings of PURPLE MOUNTAIN FORUM 2019-International Forum on Smart Grid Protection and Control 2020, 1st ed.; Springer: Singapore; pp. 575–591.
  29. Chen, S.; Ebe, F.; Morris, J.; Lorenz, H.; Kondzialka, C.; Heilscher, G. Implementation and Test of an IEC 61850-Based Automation Framework for the Automated Data Model Integration of DES (ADMID) into DSO SCADA. Energies 2022, 15, 1552. [Google Scholar] [CrossRef]
  30. Tightiz, L.; Yang, H. A comprehensive review on iot protocols’ features in smart grid communication. Energies 2020, 13, 2762. [Google Scholar] [CrossRef]
  31. Aftab, M.A.; Hussain, S.S.; Ali, I.; Ustun, T.S. IEC 61850 based substation automation system: A survey. Int. J. Electr. Power Energy Syst. 2020, 120, 106008. [Google Scholar] [CrossRef]
  32. Bojović, D.; Obradović, N.; Kurjakov, N. Improving operational efficiency and reducing costs in distribution utility with the use of IEC 61850 communication protocol. In Proceedings of the 2022 IEEE PES Innovative Smart Grid Technologies Conference Europe (ISGT-Europe), Novi Sad, Serbia, 10–12 October 2022; pp. 1–5. [Google Scholar]
  33. Available online: https://npti.gov.in/sites/default/files/events_documents/IEC-61850%20handout-A4_rev02.pdf (accessed on 2 January 2023).
  34. Diez-Olivan, A.; Del Ser, J.; Galar, D.; Sierra, B. Data fusion and machine learning for industrial prognosis: Trends and perspectives towards Industry 4.0. Inf. Fusion 2018, 50, 92–111. [Google Scholar] [CrossRef]
  35. Gao, J.; Li, P.; Chen, Z.; Zhang, J. A survey on deep learning for multimodal data fusion. Neural Comput. 2020, 32, 829–864. [Google Scholar] [CrossRef] [PubMed]
  36. Lin, L.; Chen, C.; Wei, B.; Li, H.; Shi, J.; Zhang, J.; Huang, N. Residential electricity load scenario prediction based on transferable flow generation model. J. Electr. Eng. Technol. 2022, 18, 99–109. [Google Scholar] [CrossRef]
  37. Ren, C.; Xu, Y. A fully data-driven method based on generative adversarial networks for power system dynamic security assessment with missing data. IEEE Trans. Power Syst. 2019, 34, 5044–5052. [Google Scholar] [CrossRef]
  38. Liu, S.; You, S.; Yin, H.; Lin, Z.; Liu, Y.; Yao, W.; Sundaresh, L. Model-free data authentication for cyber security in power systems. IEEE Trans. Smart Grid 2020, 11, 4565–4568. [Google Scholar] [CrossRef]
  39. Zhang, C.; Yang, Z.; He, X.; Deng, L. Multimodal intelligence: Representation learning, information fusion, and applications. IEEE J. Sel. Top. Signal Process. 2020, 14, 478–493. [Google Scholar] [CrossRef] [Green Version]
  40. Pan, Y.; Zhang, L.; Wu, X.; Skibniewski, M.J. Multi-classifier information fusion in risk analysis. Inf. Fusion 2020, 60, 121–136. [Google Scholar] [CrossRef]
  41. Ding, W.; Jing, X.; Yan, Z.; Yang, L.T. A survey on data fusion in internet of things: Towards secure and privacy-preserving fusion. Inf. Fusion 2019, 51, 129–144. [Google Scholar] [CrossRef]
  42. Zhang, L.; Liu, D.; Cai, G.; Lyu, L.; Koh, L.H.; Wang, T. An optimal dispatch model for virtual power plant that incorporates carbon trading and green certificate trading. Int. J. Electr. Power Energy Syst. 2023, 14, 108558. [Google Scholar] [CrossRef]
  43. Cheng, L.; Yu, T. A new generation of AI: A review and perspective on machine learning technologies applied to smart energy and electric power systems. Int. J. Energy Res. 2019, 43, 1928–1973. [Google Scholar] [CrossRef]
  44. Ibrahim, M.S.; Dong, W.; Yang, Q. Machine learning driven smart electric power systems: Current trends and new perspectives. Appl. Energy 2020, 272, 115237. [Google Scholar] [CrossRef]
Figure 1. Multi-source information fusion model for distribution grid.
Sustainability 15 06170 g001
Figure 2. The model description comparison of two standards.
Sustainability 15 06170 g002
Figure 3. The corresponding relations between the elements of IEC 61850 and CIM.
Sustainability 15 06170 g003
Figure 4. Mapping relations between IEC 61850 and CIM.
Sustainability 15 06170 g004
Figure 5. Data type structure of IEC 61850 standard.
Sustainability 15 06170 g005
Figure 6. The structure of D-WAMS.
Sustainability 15 06170 g006
Figure 7. The network topology of Yuan’an substation.
Sustainability 15 06170 g007
Figure 8. The IEC 61850 network topology of F2.
Sustainability 15 06170 g008
Table 1. The extended attributes of Sampling.
Class NameAttributes
Meas: SamplingSyncSamplingClock
Meas: SamplingSamplingRate
Table 2. The extended attributes of CommunicationLink.
Class NameAttributes
Core: CommunicationComType
Core: CommunicationComDevice
Table 3. The extended attributes of PhasorMeter.
Class NameAttributes
Meas: ProcessorDataPartiton
Meas: ProcessorDataTransferRate
Meas: ProcessorGPSTimeInfor
Meas: ProcessorGPSStatusInfor
Meas: ProcessorPhaseAngle
Meas: ProcessorTimeStamp
Table 4. The extended attributes of TimeSynchronization.
Class NameAttributes
Core: TimeSyncReceiveMode
Core: TimeSyncReceiveChannel
Core: TimeSyncReceivingSensitivity
Core: TimeSyncPositioningAccuracy
Core: TimeSyncUCT (Datetime)
Core: TimeSyncTimeTransfer
Core: TimeSyncPulseTransfer
Core: TimeSyncSyncSamplingPulse
Table 5. The extended attributes of TimeKeeping.
Class NameAttributes
Core: TimeKeepingGPSMonitorigInfor
Core: TimeKeepingSyncSamplingSwitching
Core: TimeKeepingSyncSamplingPulse
Core: TimeKeepingAlarm
Table 6. Comparison before and after multi-data fusion.
Comparison ContentBefore FusionAfter Fusion
State estimation accuracy≤94%≥98%
Fault detection accuracy≤96%≥99%
Fault location accuracy≤0.4 km≤0.2 km
Data query latency≈2 s<100 ms
Disclaimer/Publisher’s Note: The statements, opinions and data contained in all publications are solely those of the individual author(s) and contributor(s) and not of MDPI and/or the editor(s). MDPI and/or the editor(s) disclaim responsibility for any injury to people or property resulting from any ideas, methods, instructions or products referred to in the content.

