
A Contemporary Review on Deep Learning Models for Drought Prediction
 ,
,  ,
,  ,
,  ,
,
Abstract
:1. Introduction
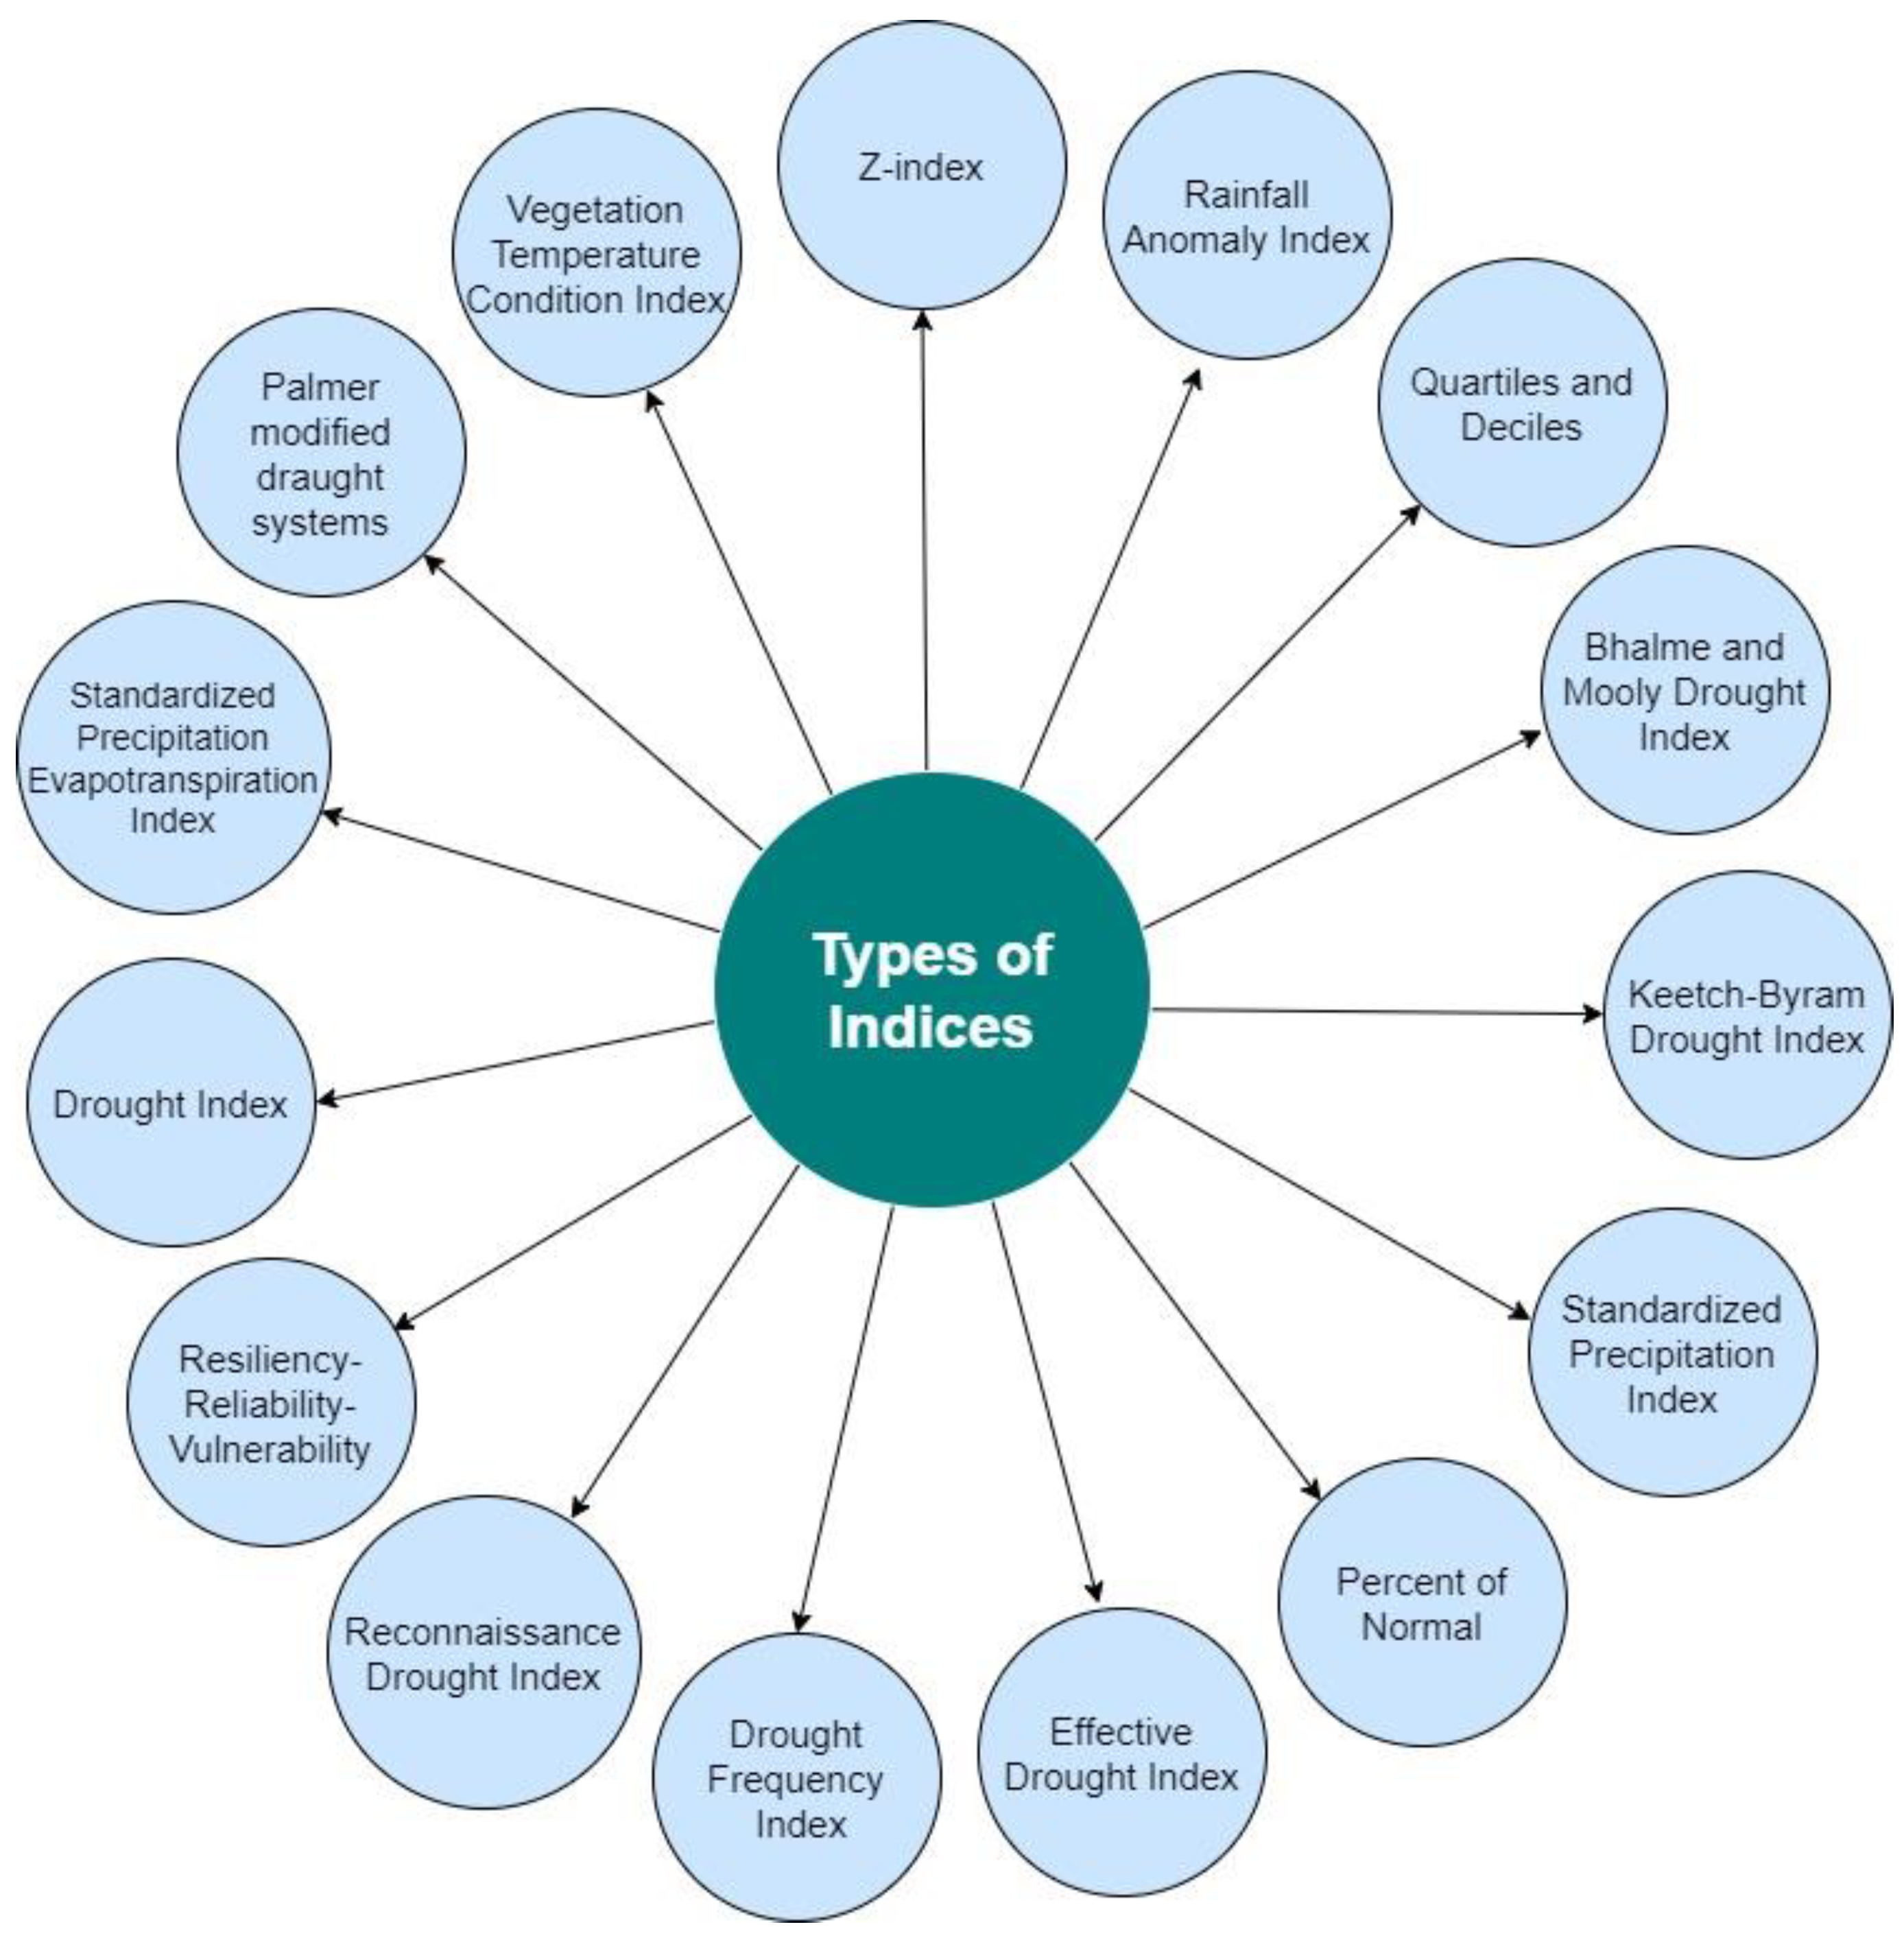
- Z-index [1].
- Rainfall Anomaly Index (RAI) [1].
- Quartiles and Deciles [1].
- Bhalme and Mooly Drought Index [1].
- Standardized Precipitation Index (SPI).
- Effective Drought Index (EDI) [1].
- Drought Frequency Index (DFI) [1].
- Reconnaissance Drought Index (RDI) [1].
- Resiliency-Reliability-Vulnerability (RRV) [1].
- Palmer modified draught systems (PMDI) [1].
1.1. Rationale of This Work
1.2. Key Contributions of This Work
- This is the first attempt at a systematic review of deep learning-based drought prediction models to the authors’ knowledge.
- This review presents information for all deep learning model case studies implemented in various regions globally for drought forecasting.
- The review accumulates the indices used in drought monitoring and lists the drought categories.
- A brief discussion of the latest developments and the various deep learning algorithms used in hybrid drought forecasting models are included.
- The common disadvantages of deep learning algorithms are discussed.
- Based on the available literature, various parameters for effective drought predictions are discussed for accurate drought forecasting.
- The open challenges and the future directions for drought forecasting are also discussed.
1.3. Intended Audience
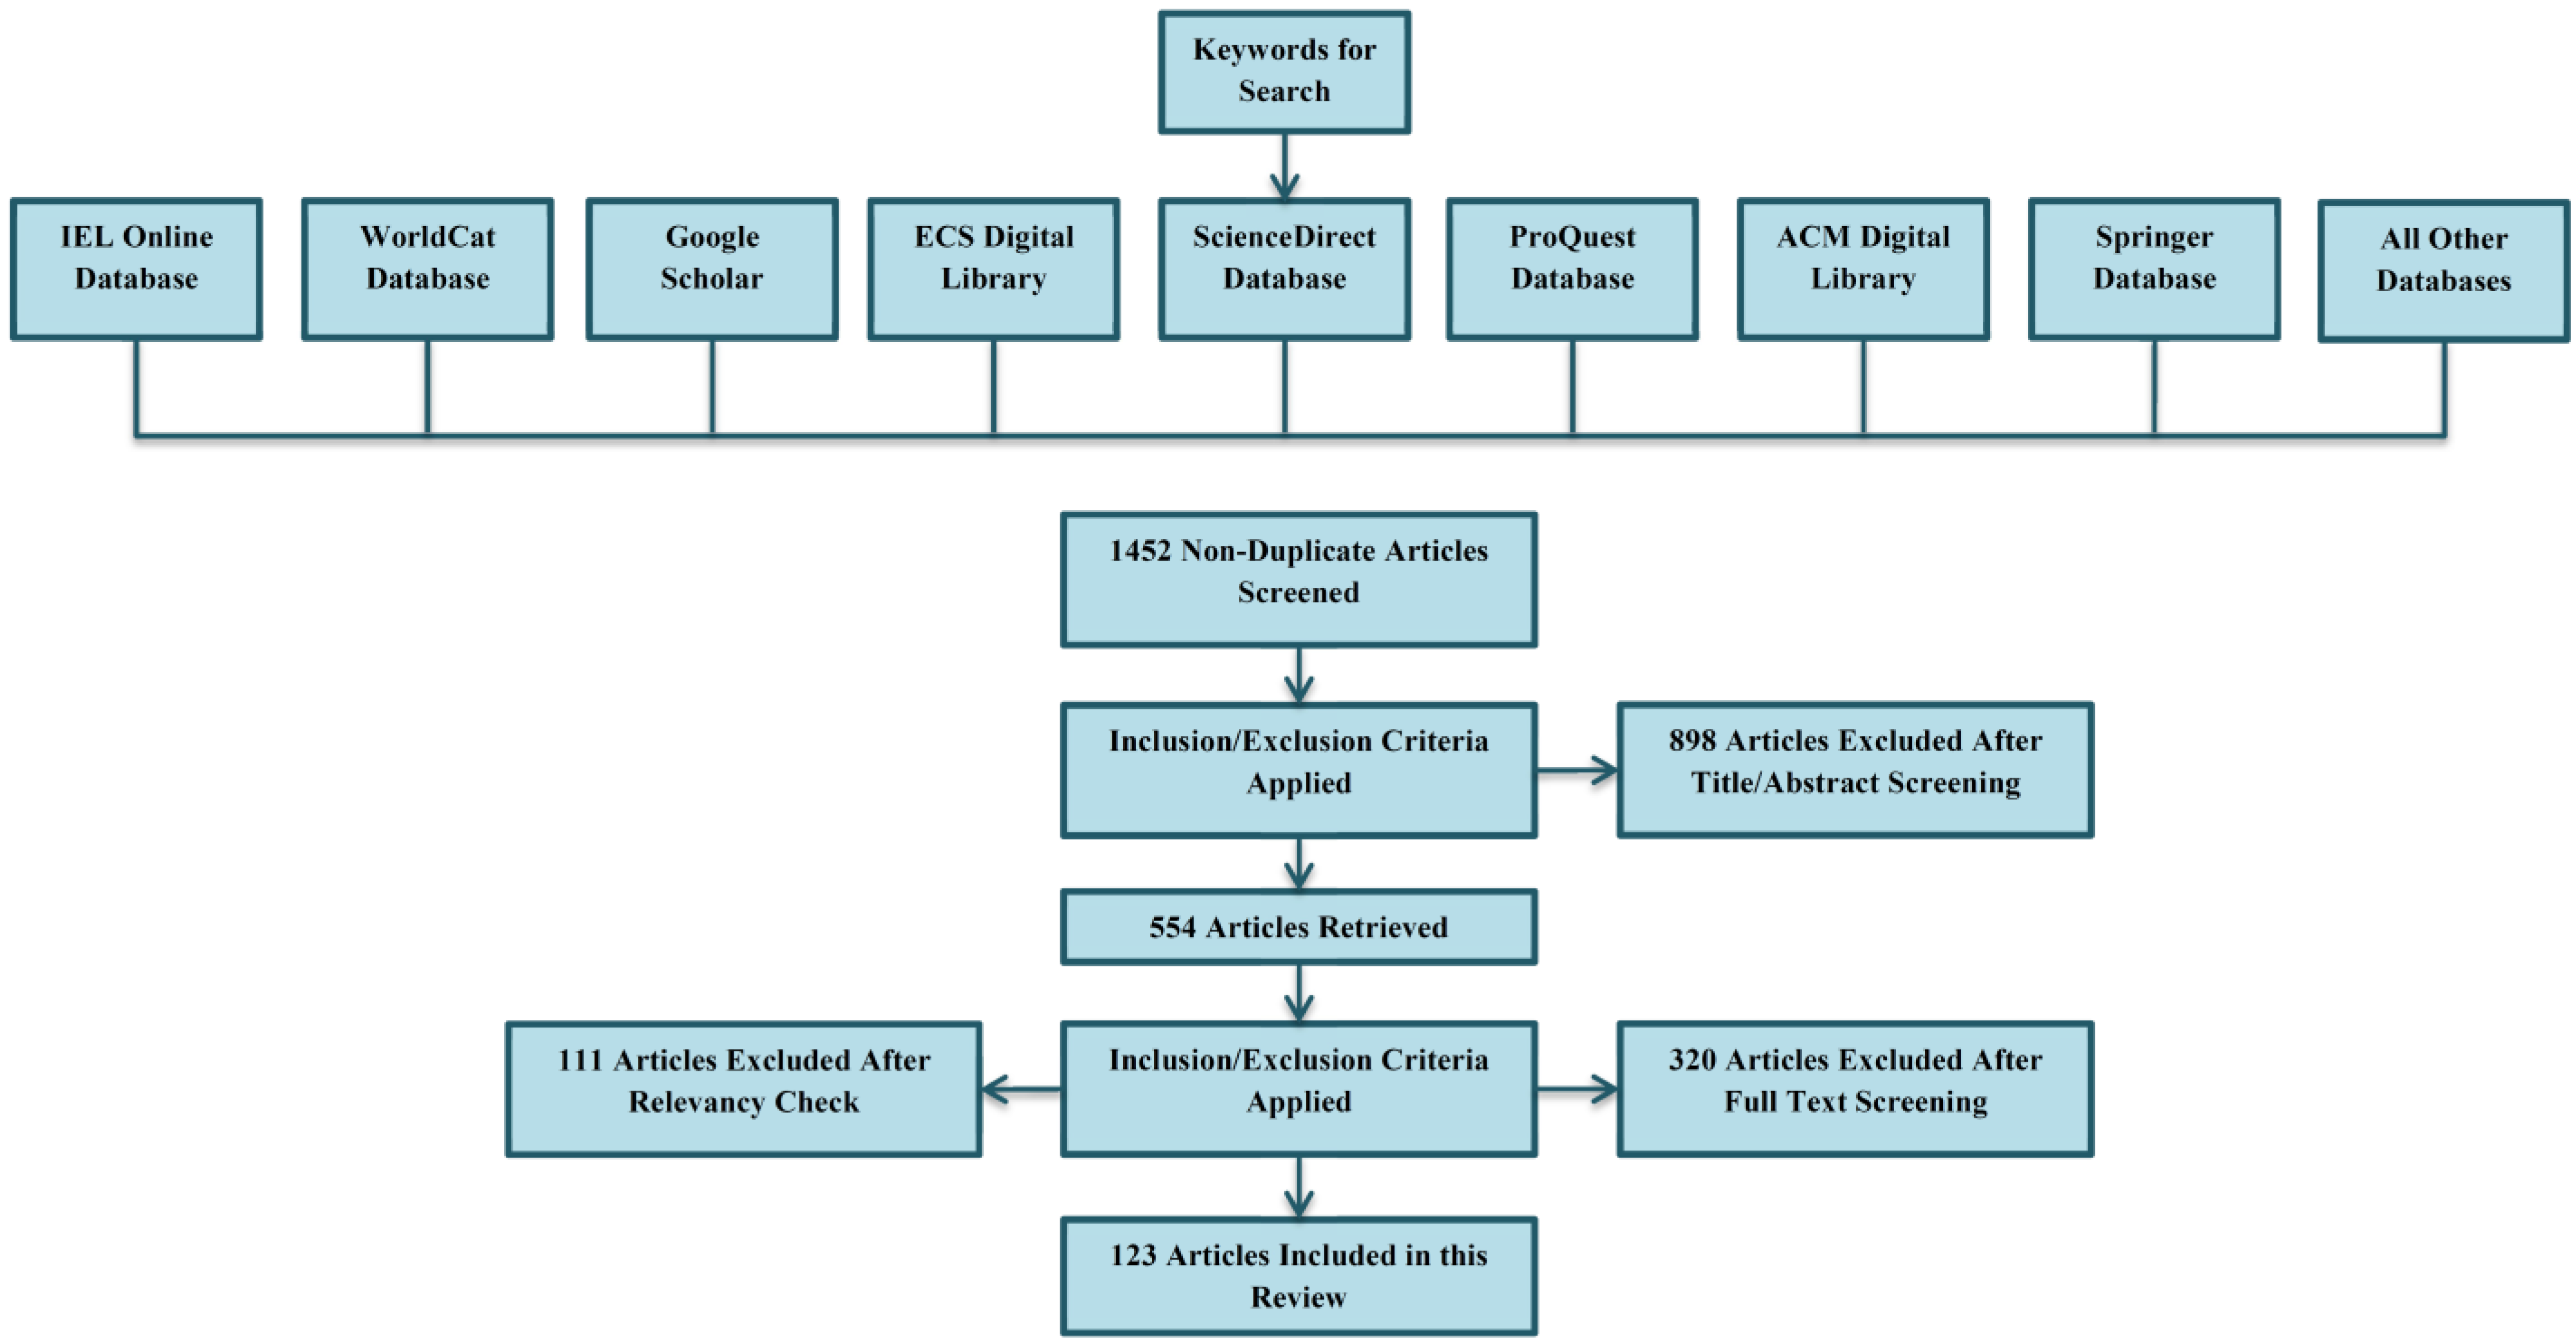
1.4. Survey Methodology
1.4.1. Search Strategy, Keyword Selection and Databases
1.4.2. Inclusion Criteria
1.4.3. Exclusion Criteria
1.4.4. Results
1.5. Survey Structure
2. Current Gaps in the Studies
- Incorporating more data sources: By using a combination of meteorological, hydrological, and remotely sensed data, models can be trained to better understand the complex relationships between precipitation, evapotranspiration, and soil moisture. This can improve the accuracy of drought predictions.
- Utilizing advanced deep learning techniques: Convolutional Neural Networks (CNNs) and Recurrent Neural Networks (RNNs) are powerful deep learning techniques that can be used to analyze large amounts of data and extract important features. These techniques can be used to improve the long-term forecasting capabilities of drought prediction models.
- Incorporating traditional methods: Combining traditional methods such as statistical and physics-based models with deep learning techniques can enhance the performance of drought prediction models. By combining the strengths of both methods, models can become more robust and accurate.
- Developing a consistent evaluation framework: It is important to develop a consistent evaluation framework to accurately evaluate the performance of drought prediction models. This will allow for a more accurate comparison of different models and help to identify the strengths and weaknesses of each approach.
- Exploring the use of transfer learning and domain adaptation techniques: Transfer learning and domain adaptation techniques can be used to improve the generalization ability of drought prediction models. These techniques can help models adapt to new regions or climates, making them more useful in a wider range of applications.
- Utilizing alternative data sources: Alternative data sources such as remote sensing can be used to address the data scarcity issue. This can help to improve the performance of drought prediction models in regions where ground-based measurements are limited.
3. Drought Categories and Drought Information Systems
3.1. Drought Categories
3.1.1. Meteorological Drought
3.1.2. Agricultural Drought
3.1.3. Hydrological Drought
3.1.4. Socioeconomic Drought
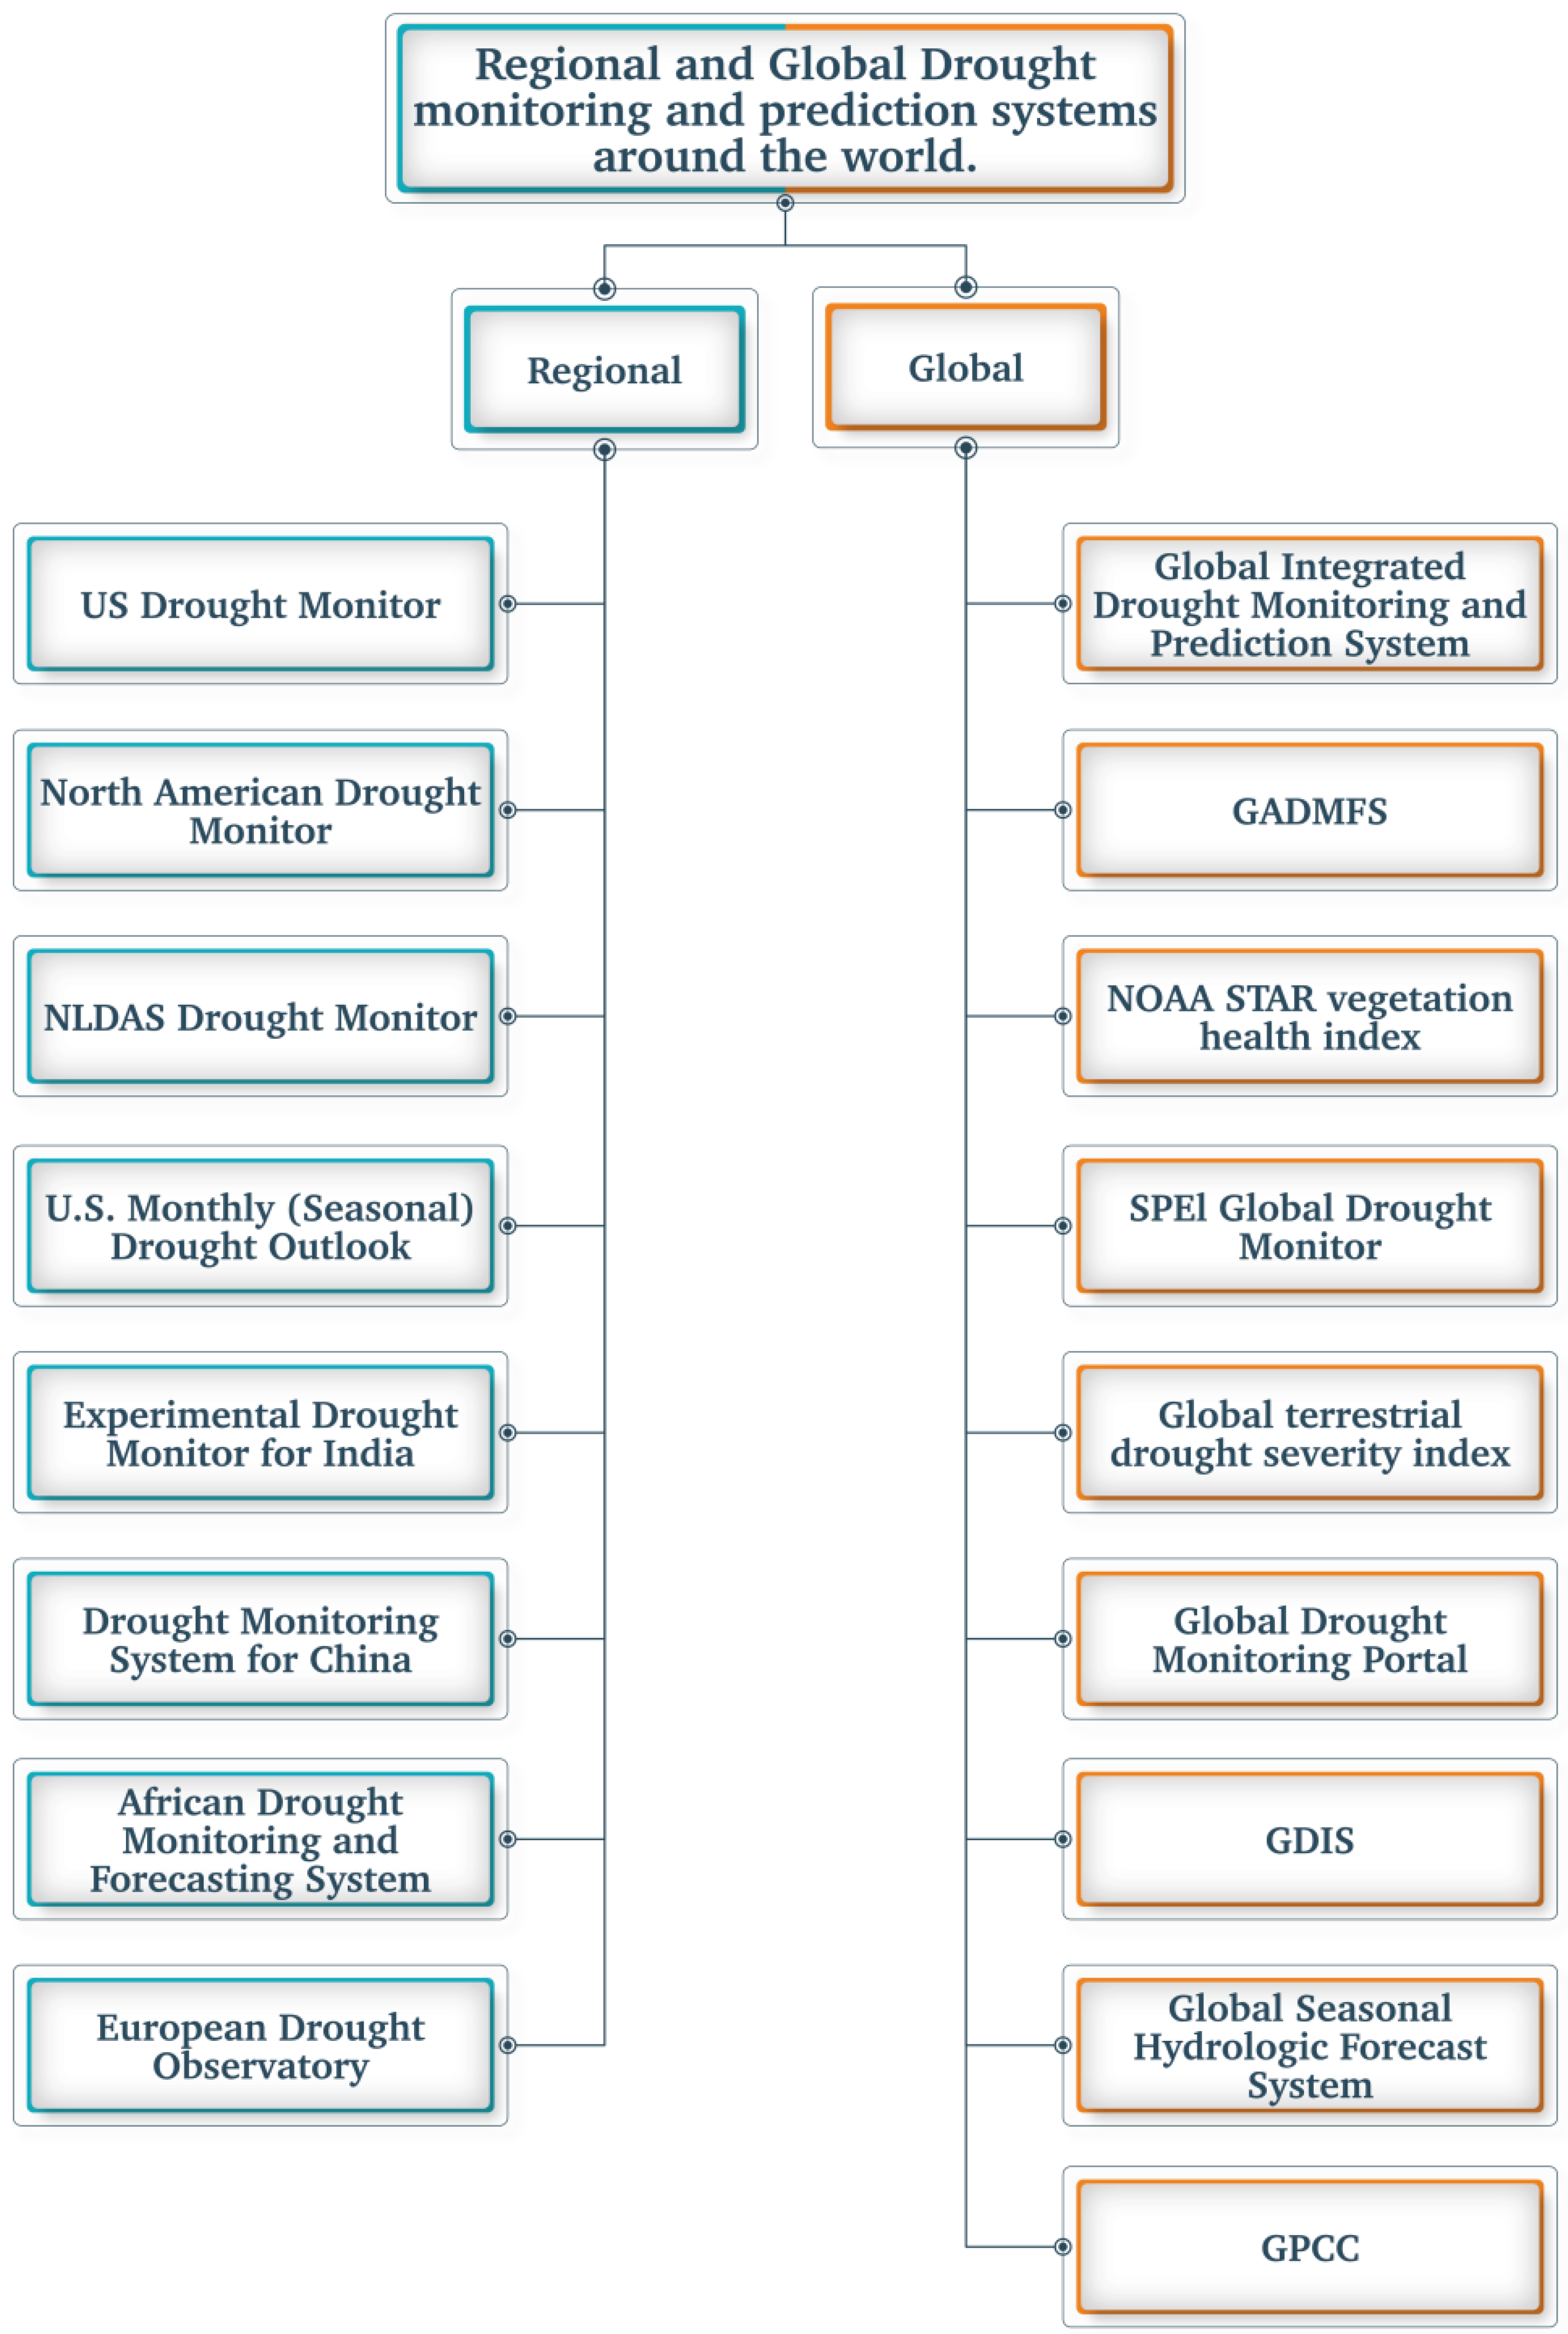
3.2. Drought Information Systems
3.2.1. Regional Drought Information Systems
3.2.2. Global Drought Information Systems
4. Types of Preprocessing
- Data cleaning: In data cleaning, all data inconsistencies, such as the empty or extreme values in various features, are replaced with the average values of the same variables or the null value, respectively. It also involves checking for outliers and inconsistencies in the data. This step is crucial to ensuring the quality of the data used for forecasting.
- Data normalization: This process involves adjusting the values of the data to a common scale. It can include rescaling the data so that it has a specific range, such as between 0 and 1, or standardizing the data so that it has a mean of zero and standard deviation of one. This step is important in drought forecasting as it allows the model to effectively process data from different variables and sources, such as precipitation, evapotranspiration, and soil moisture.
- Time series data preparation: For time series data, it is necessary to decompose time series data into its seasonality, trend, and residual to be able to feed it into deep learning algorithms. This step is crucial to extract meaningful information from the time series data.
- Data splitting: This involves dividing the data into training, validation, and test sets. The training set is used to train the model, the validation set is used to tune the model parameters, and the test set is used to evaluate the performance of the model.
- Reshaping the data: This involves reshaping the data into the appropriate format for the deep learning algorithm. This may include reshaping the data into a 2D or 3D array, depending on the type of algorithm being used. This step is crucial to ensuring that the data is compatible with the model being used.
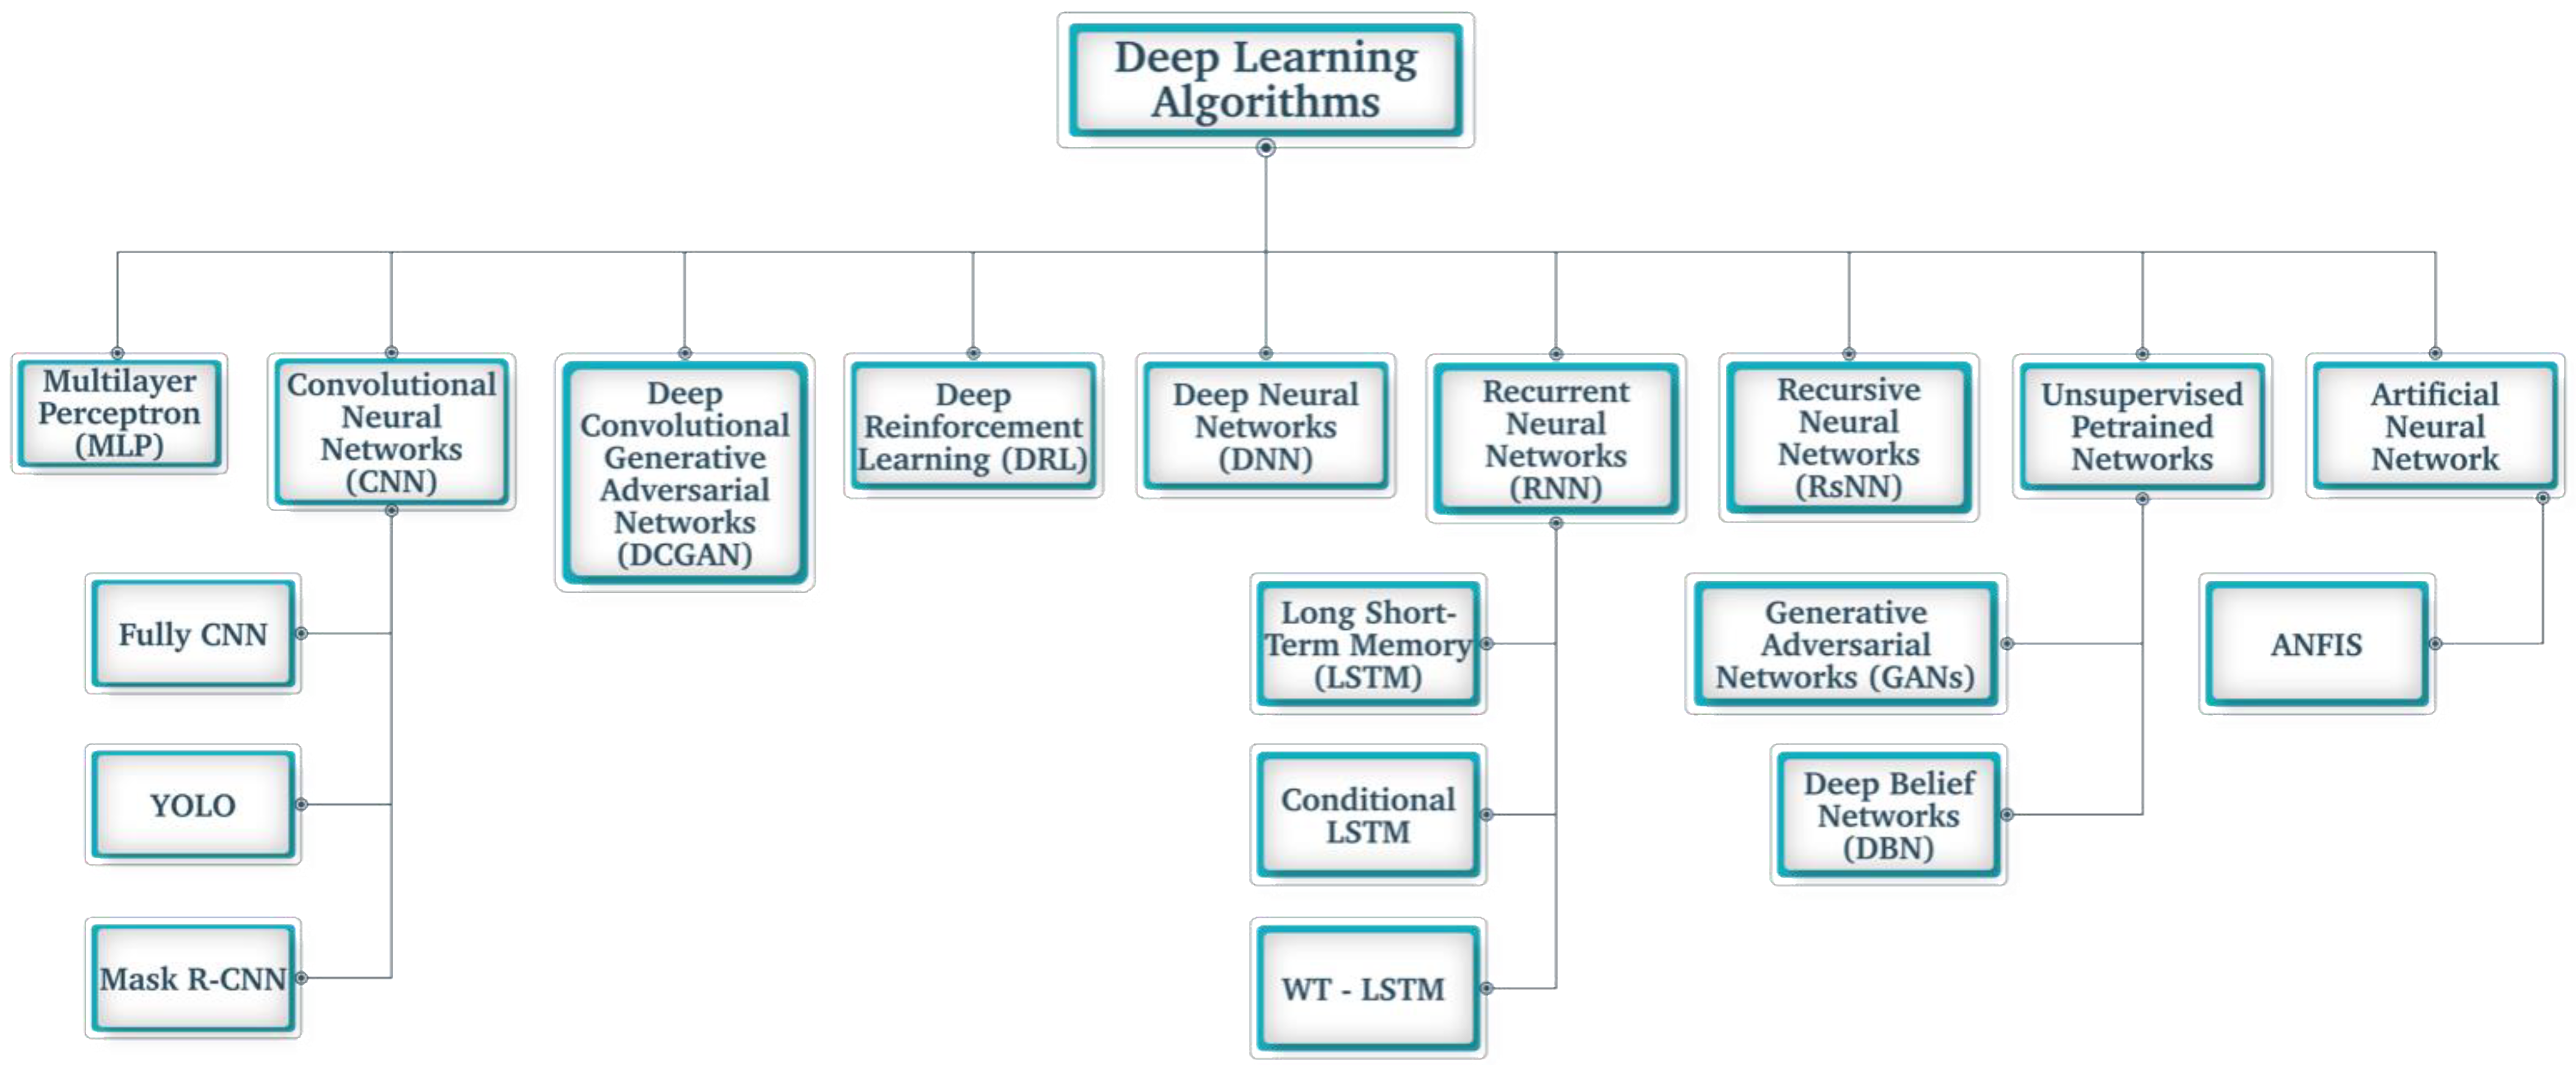
5. Deep Learning Models for Drought Prediction
5.1. Drought Forecasting Using ANNs
5.2. Drought Forecasting Using CNNs
5.3. Drought Forecasting Using RNNs
5.4. Drought Forecasting Using Deep Belief Neural Networks
5.5. Drought Forecasting Using GANs
5.6. Drought Forecasting Using Hyrbid Models
6. Common Disadvantages
- Artificial Neural Networks—It is an algorithm that imitates the brain’s neural structure. The most sought-after algorithm in ANN is the MLP and the backpropagation learning methods. The fundamental issue with Artificial Neural Networks is that they have a very high potential to learn the data from the given dataset, but they take up a substantial amount of time for processing, and there is no supervision in the internal hidden layers of the Neural Network; moreover, ANN cannot represent knowledge [82]. ANN requires processors with identical making ready strength, keeping with their design. Thus, the acknowledgment of the hardware is reliant [86,103].
- Fuzzy Interface System (FIS)—Output is determined by the classification of input with the help of fuzzy theory. Although FIS can represent the knowledge, it has a major drawback: its inability to manifest results from the pattern and alter as per the parameter or environmental needs and changes [82].
- WNN—It was noted from the results that Wavelet neural network prediction results are not up to the mark. There is a lack of clarity in texture, and it has low precision.
- RBM: Huge preparation information required, does not encode the position and direction of the item. Preparing is more troublesome as it is hard to work out the Energy angle work. Disc calculation utilized in RBMs is not just as natural as the backpropagation calculation. Weight Adjustment is complex. The scanty grid is effectively compressible by not removing the zero/invalid components, requiring less memory space. Additionally, just the non-zero components must be processed. Henceforth, computational speed increases. One of the hindrances of autoencoders lies in how they could become incapable in case mistakes are available in the primary layers [3,11,17,22,23,24].
- DT—It cannot efficiently accommodate outliers or any missing values in the dataset. When the quantity of non-correlated values is substantial, then the accuracy of DT decreases [114].
- LSTM: LSTMs (Long Short-Term Memory) are inclined to overfitting, and it is hard to apply the dropout calculation to control this issue. Random Forest necessitates computational power and assets as it constructs various trees and joins their yields. It also takes a long time to prepare because it joins many choice trees to determine the class [9,12,13,14,16,25,26].
- CNN: Firstly, CNNs require a large amount of data for training, which can be challenging to obtain for drought forecasting due to the limited availability of data in certain regions. Additionally, CNNs may not be suitable for capturing long-term dependencies in time-series data, which is crucial for drought forecasting as the impact of drought can be felt for extended periods. Finally, CNNs may struggle with handling missing or incomplete data, which is common in drought monitoring.
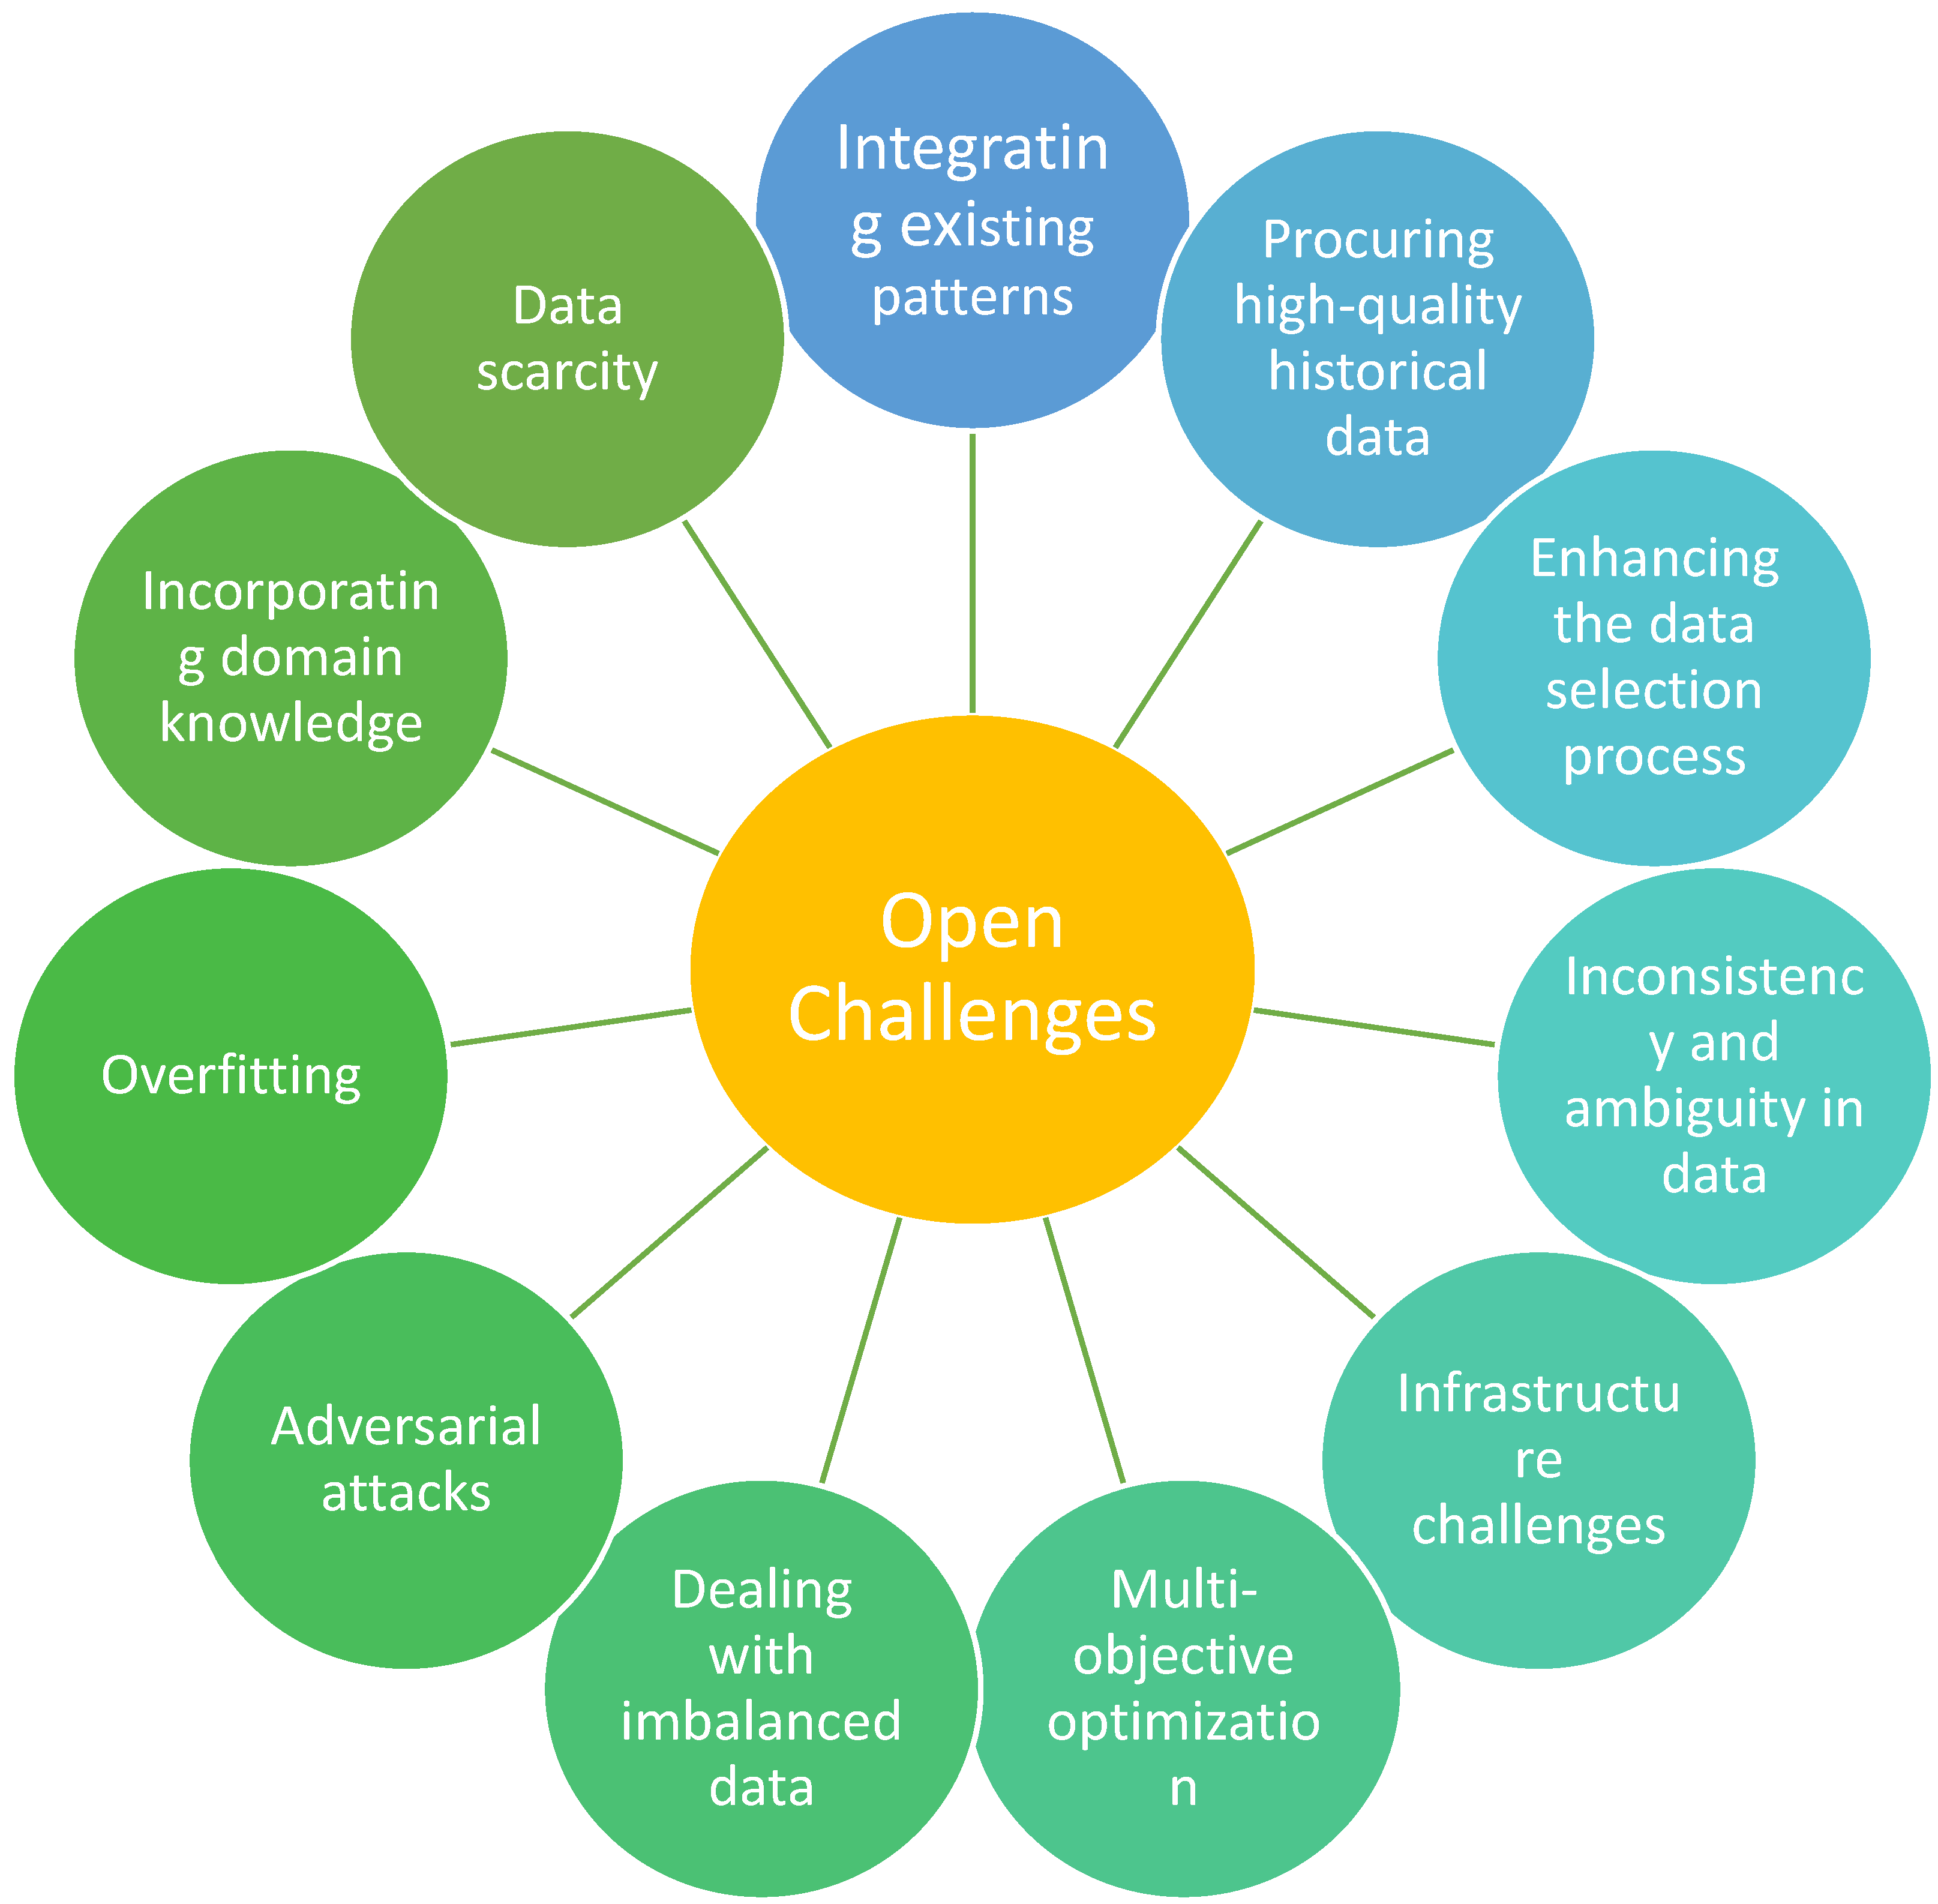
7. Open Challenges—Deep Learning-Based Drought Prediction
- Integrating existing patterns from regional drought patterns in different areas and developing a universal system for drought prediction.
- Procuring a significant amount of high-quality historical data from high resolution monitoring systems to conduct a study and develop a deep learning model and test it.
- Enhancing the data selection process from the various environmental and meteorological factors and selecting the most suitable indices for forecasting.
- Inconsistency and ambiguity in data that need real-time processing are major challenges. Most models are built on pre-existing data, but have not been tested in real-time conditions, which is a major concern.
- Infrastructure challenges, and the storage and management of a heavy volume of data are not cost-effective, and it further needs to be transmitted, which incurs a combined hefty amount. It also has major security concerns, as data is usually taken from government-based data centers set up in drought-prone regions.
- Multi-objective optimization and optimization algorithms used are important challenges that should be worked upon in future works.
- Dealing with imbalanced data: Drought datasets are often imbalanced, meaning that the majority of the data points represent non-drought conditions. Deep learning models trained on imbalanced datasets can result in poor performance on drought prediction.
- Adversarial attacks: Deep learning models are vulnerable to adversarial noise, where small, intentional perturbations to the input data can cause the model to misclassify or make incorrect predictions.
- Overfitting: Overfitting occurs when the deep learning model becomes too complex and starts to memorize the training data rather than learn the underlying patterns. This can result in poor generalization to new data and reduced performance on drought forecasting.
- Incorporating domain knowledge: Drought forecasting is a complex problem that requires domain knowledge of the physical processes involved. Deep learning models may struggle to incorporate such knowledge into their predictions.
- Data scarcity: Drought datasets are often limited in size, which can make it challenging to train deep learning models effectively. Developing techniques to address this challenge is an ongoing area of research.
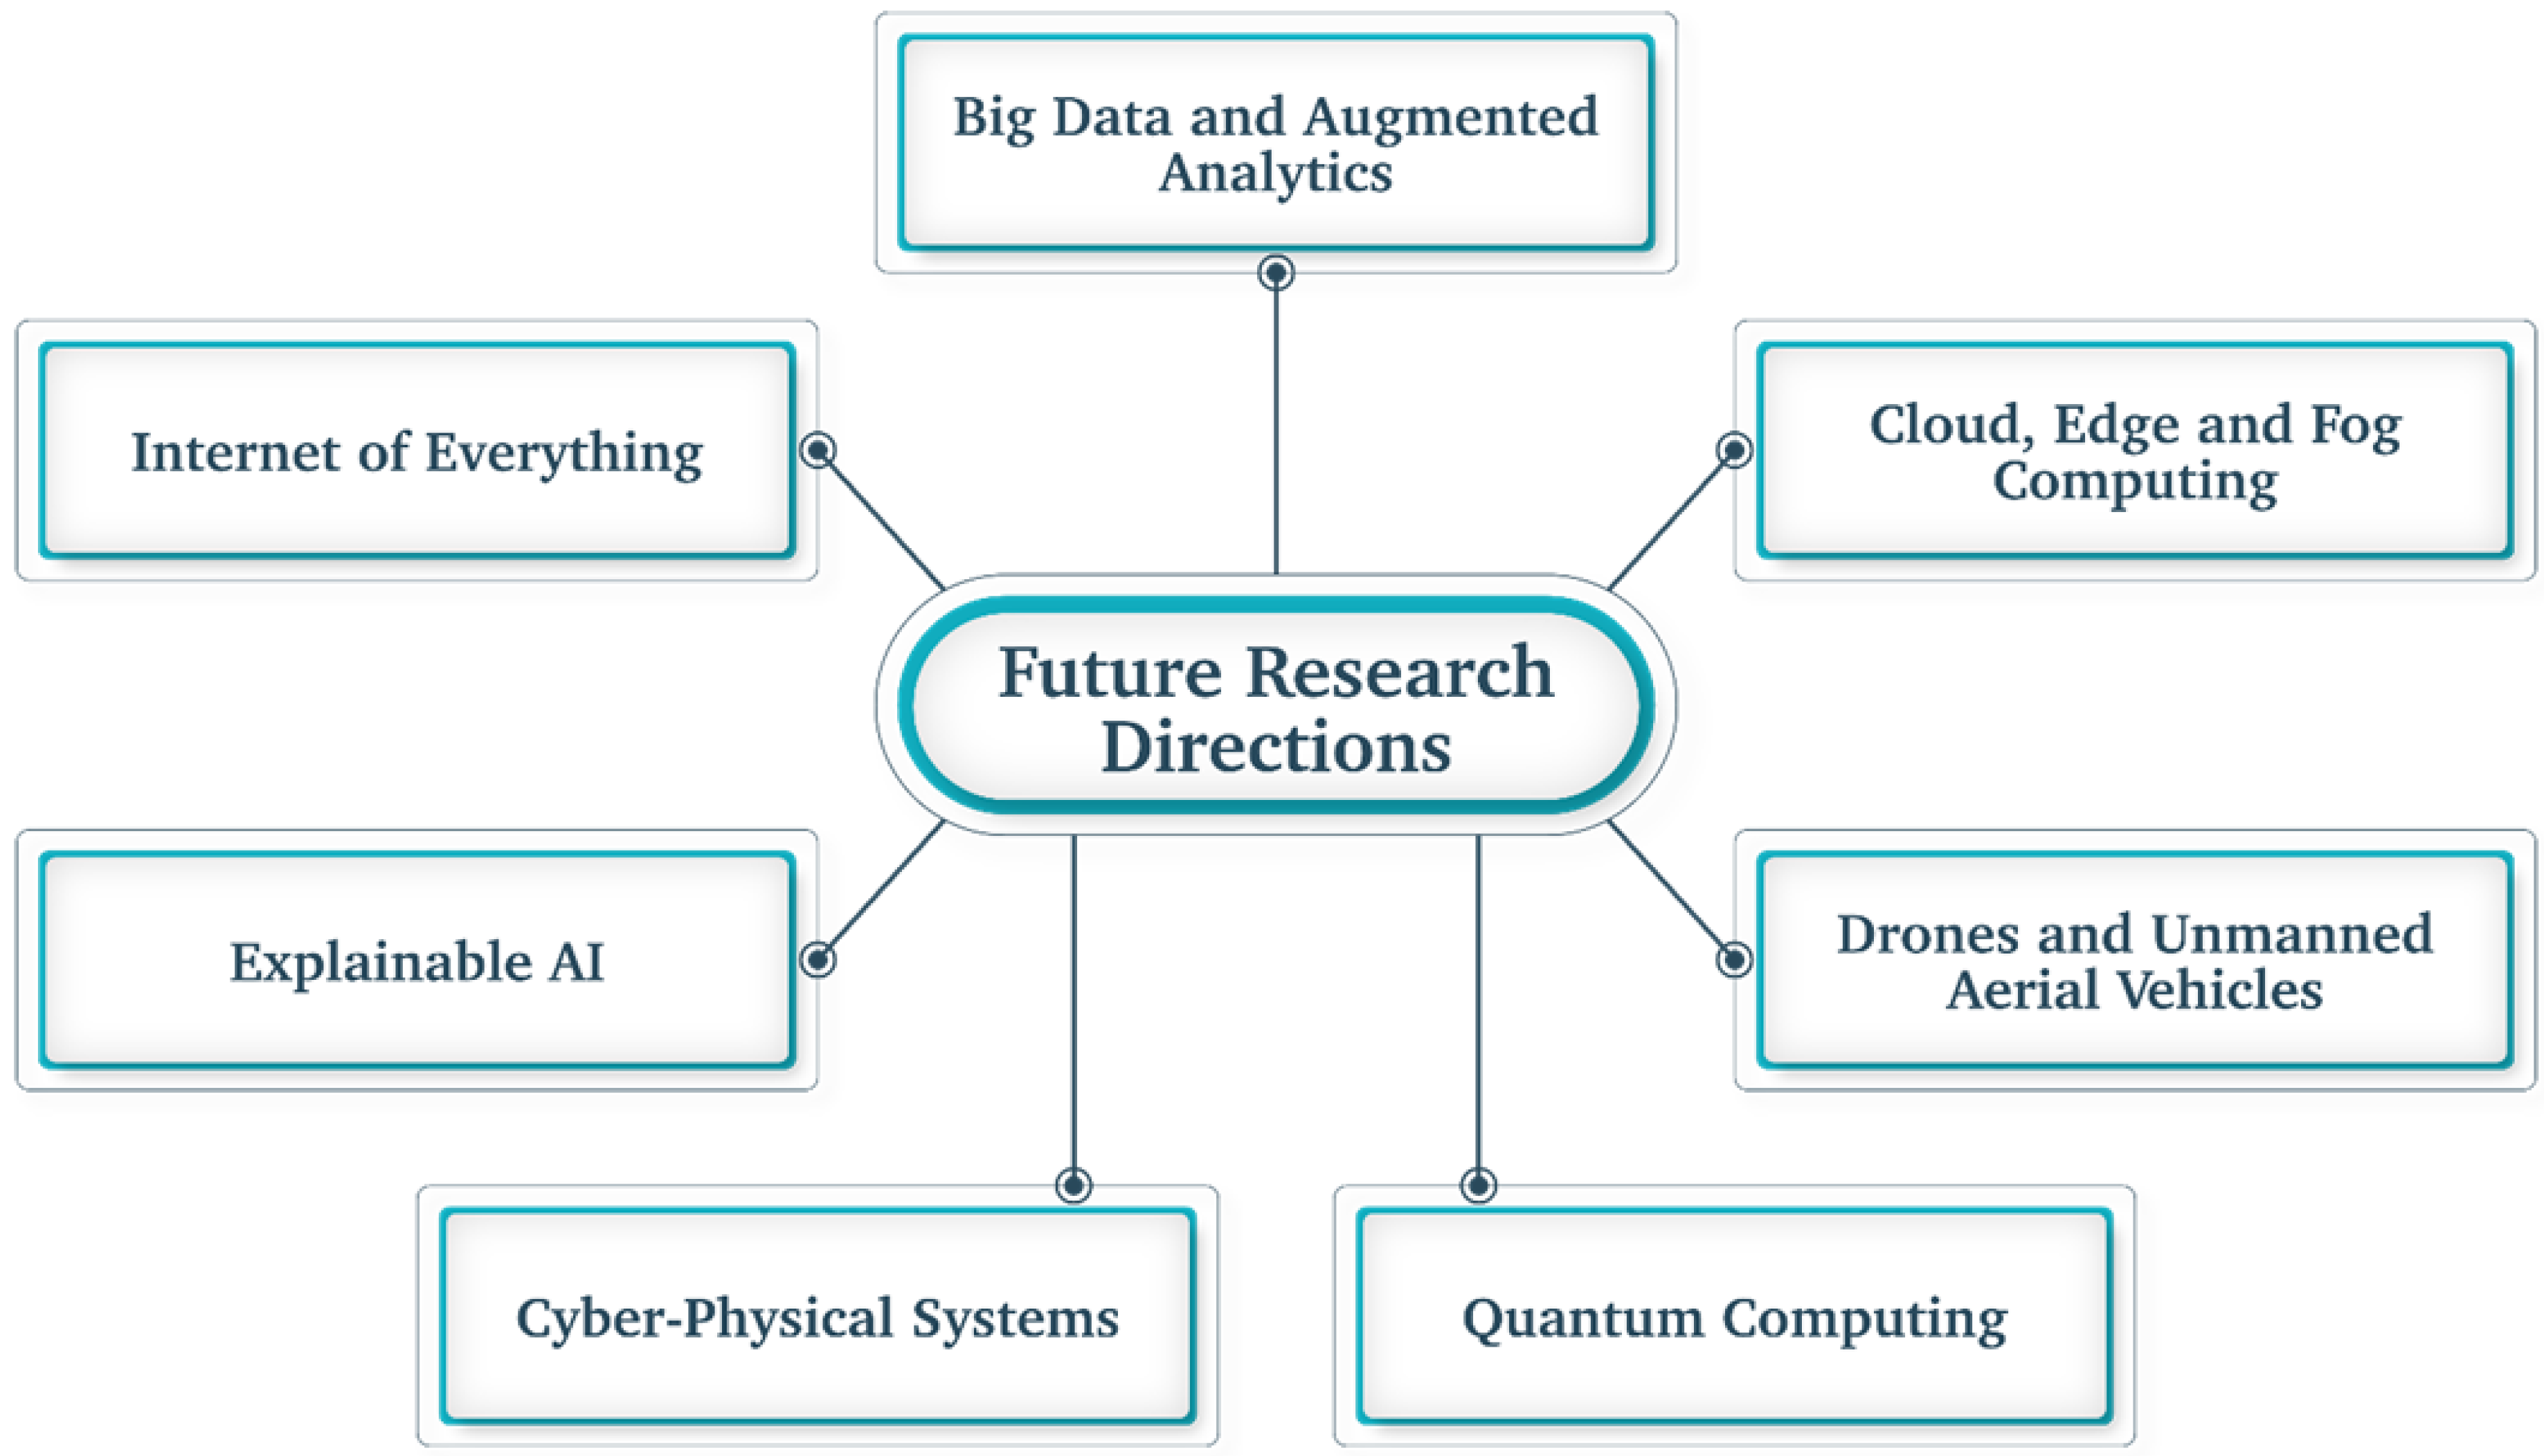
8. Future Research Directions
8.1. Explainable AI
8.2. Internet of Everything (IoE)
8.3. Big Data and Augmented Analytics
8.4. Cloud, Edge, and Fog Computing
8.5. Drones and Unmanned Aerial Vehicles
8.6. Cyber-Physical Systems
9. Conclusions
- The Bayesian inference and Gradient descent are used to optimize the GPR and LSTM, but in [2] GPLSTM-S1, which has these optimizations and statistically has superior performance, it is not stable and hence is not suitable to correct the predicted target via the post-processing technique. Hence, GPLSTM-S2 is more suitable as it is stable and obtains an effective drought warning at its semi-stochastic alternating gradient descent optimization.
- The most optimum method of finding features for focusing a model for drought prediction using the environmental features is by picking and implementing with the help of the Akaike Information Criterion, whichever value is relatively the smallest.
- Over and under-sampling can handle data imbalance handling, which facilitates loss computation. Another method could be the penalizing algorithms [79].
- The ARIMA model from [80] can be chosen by combining the autocorrelation coefficient and partial autocorrelation coefficient.
- MO-OLS is a hybrid algorithm on the existing OLS algorithm introduced in [76] that improved the performance of models using the standard OLS or even LR algorithms.
Author Contributions
Funding
Institutional Review Board Statement
Informed Consent Statement
Data Availability Statement
Conflicts of Interest
Abbreviations
| Abbreviations | Full Form |
| ANN | Artificial Neural Network |
| CNN | Convolution Neural Network |
| RNN | Recurrent Neural Network |
| GDFS | Global Drought Information System |
| MLP | Multi-Layer Perceptron |
| SVR | Support Vector Regression |
| SVM | Support Vector Machines |
| DT | Decision Trees |
| MARS | Multivariate Adaptive Regression Spline |
| GPCC | Global Precipitation Climatology Centre |
| NOAA STAR | National Oceanic and Atmospheric Administration Satellite Applications and Research |
| SPEI | Standardized Precipitation Evapotranspiration Index |
| NLDAS | multi-institution North American Land Data Assimilation System |
| LSTM | Long Short-Term Memory |
| DNN | Deep Neural Network |
| CV | Computer Vision |
| DCNN | Deep Convolution Neural Network |
| DGAN | Deep Generative Adversarial Network |
| ANFIS | Adaptive Neuro-Fuzzy Inference System or Adaptive Network-Based Fuzzy Inference System |
| WNN | Wavelet Neural Network |
| SSO | Spherical Self-Organizing Neural Network |
| BBO | Biogeography Based Optimization Neural Network |
| RF | Random Forest |
| ARIMA | Autoregressive Integrated Moving Average |
| NFIS-WPM | Neural Fuzzy Inference System-Based Weather Prediction Model |
| WANN | Weightless Artificial Neural Network |
| BNN | Binarized Neural Network |
| TOPSIS | Technique for Order Performance by Similarity to Ideal Solution |
| YOLO | You Only Look Once |
| CART | Classification and Regression Trees |
| PDSI | Palmer Drought Severity Index |
| MO-OLS | Mean Order Ordinary Least Squares |
| DBN | Deep Belief Network |
| NMME | North American Multi-Model Ensemble |
| SPI | Standardized Precipitation Index |
| SSI | Showalter Stability Index |
| PDI | Perpendicular Dryness Index |
| MDPI | Modified Perpendicular Dryness Index |
| LST | Land Surface Temperature |
| NVDI | Normalized Difference Vegetation Index |
| VTCI | Vegetation Temperature Condition Index |
| CART | Classification and Regression Trees |
| NLDAS | Land Data Assimilation System |
| RAI | Rainfall Anomaly Index |
| KDBI | Keetch–Byram Drought Index |
| EDI | Effective Drought Index |
| DFI | Drought Frequency Index |
| RDI | Reconnaissance Drought Index |
| RRV | Resiliency-Reliability-Vulnerability |
| PMDI | Palmer modified draught systems |
| VTCI | Vegetation Temperature Condition Index |
| GPWv3 | Gridded Population of the World, Model 3 |
| EM-DAT | Emergency Events Database |
| GDP | Gross Domestic Product |
| GDIS | Global Drought Information Systems |
| ECMWF | European Centre for Medium-Range Weather Forecasts |
| R2 | Coefficient of Determination |
| RMSE | Root Mean Squared Error |
| MAE | Mean Absolute Error |
| RBF | Radial Basis Function |
| WNN | Wavelet Neural Networks |
| TD-CNN | Time Distributed Convolutional Neural Network |
| SSRCNN | Stacked Super-Resolution Convolutional Neural Network |
| MS-LapSRN | Multi-Scale Laplacian Pyramid Super-Resolution Network |
| RB | Relative Bias |
| XGB | Extreme Gradient Boost |
| LSTM | Long Short-Term Memory |
| MBE | Mean Bias Error |
| NSE | Nash–Sutcliffe model efficiency coefficient |
| ConvLSTM-SR | Convolutional LSTM SR |
| RBM | Restricted Boltzmann Machines |
| EMD | Empirical Mode Decomposition |
| IMFs | Intrinsic Mode Functions |
| DFA | detrended fluctuation analysis |
| GAN | Generative Adversarial Networks |
| LPIPS | Learned Perceptual Image Patch Similarity |
| IoU | Intersection over Union |
| FVPS | Flood Visualization Plausibility Score |
| BL | Broad Learning |
| CEEDMAN | Complete ensemble empirical mode decomposition adaptive noise |
| EMDDBN | Empirical Mode Decomposition-Deep Belief Network |
| SARIMA | Season AutoRegressive Integrated Moving Average |
| AR | AutoRegressive |
| MA | Moving Average |
| SRTM | Shuttle Radar Topography Mission |
| GPLSTM | Gaussian Process Regression, Hybrid |
| FIS | Fuzzy Interface System |
| IoE | Internet of Everything |
| IoT | Internet of Things |
| OLS | Ordinary Least Squares |
References
- Yaseen, Z.M.; Shahid, S. Drought index prediction using data intelligent analytic models: A review. In Intelligent Data Analytics for Decision-Support Systems in Hazard Mitigation; Springer: Singapore, 2021; pp. 1–27. [Google Scholar]
- Zhu, S.; Xu, Z.; Luo, X.; Liu, X.; Wang, R.; Zhang, M.; Huo, Z. Internal and external coupling of Gaussian mixture model and deep recurrent network for probabilistic drought forecasting. Int. J. Environ. Sci. Technol. 2020, 18, 1221–1236. [Google Scholar] [CrossRef]
- Houborg, R.; Rodell, M.; Lawrimore, J.; Li, B.; Reichle, R.; Heim, R.; Zaitchik, B.F. Using enhanced GRACE water storage data to improve drought detection by the US and North American Drought Monitors. In Proceedings of the 2010 IEEE International Geoscience and Remote Sensing Symposium, Honolulu, HI, USA, 5–30 July 2010; IEEE: New York, NY, USA, 2010; pp. 710–713. [Google Scholar]
- Chen, J.; Jin, Q.; Chao, J. Design of Deep Belief Networks for Short-Term Prediction of Drought Index Using Data in the Huaihe River Basin. Math. Probl. Eng. 2012, 2012, 235929. [Google Scholar] [CrossRef] [Green Version]
- Devyatova, E.V.; Antokhina, O.Y.; Antokhin, P.N.; Mordvinov, V.I.; Latysheva, I.V. Comparison of total cloud cover (ERA-Interim) and precipitation (GPCC) over Mongolia and southern part of Eastern Siberia in July. In Proceedings of the 25th International Symposium on Atmospheric and Ocean Optics: Atmospheric Physics, Novosibirsk, Russian, 30 June–5 July 2019; Federation International Society for Optics and Photonics: Bellingham, DC, USA, 2019; Volume 11208, pp. 1410–1414. [Google Scholar]
- Zhang, P.; Zhang, L.; Leung, H.; Wang, J.A. deep-learning based precipitation forecasting approach using multiple environmental factors. In Proceedings of the 2017 IEEE International Congress on Big Data (BigData Congress), Honolulu, HI, USA, 25–30 June 2017; IEEE: New York, NY, USA, 2010; pp. 193–200. [Google Scholar]
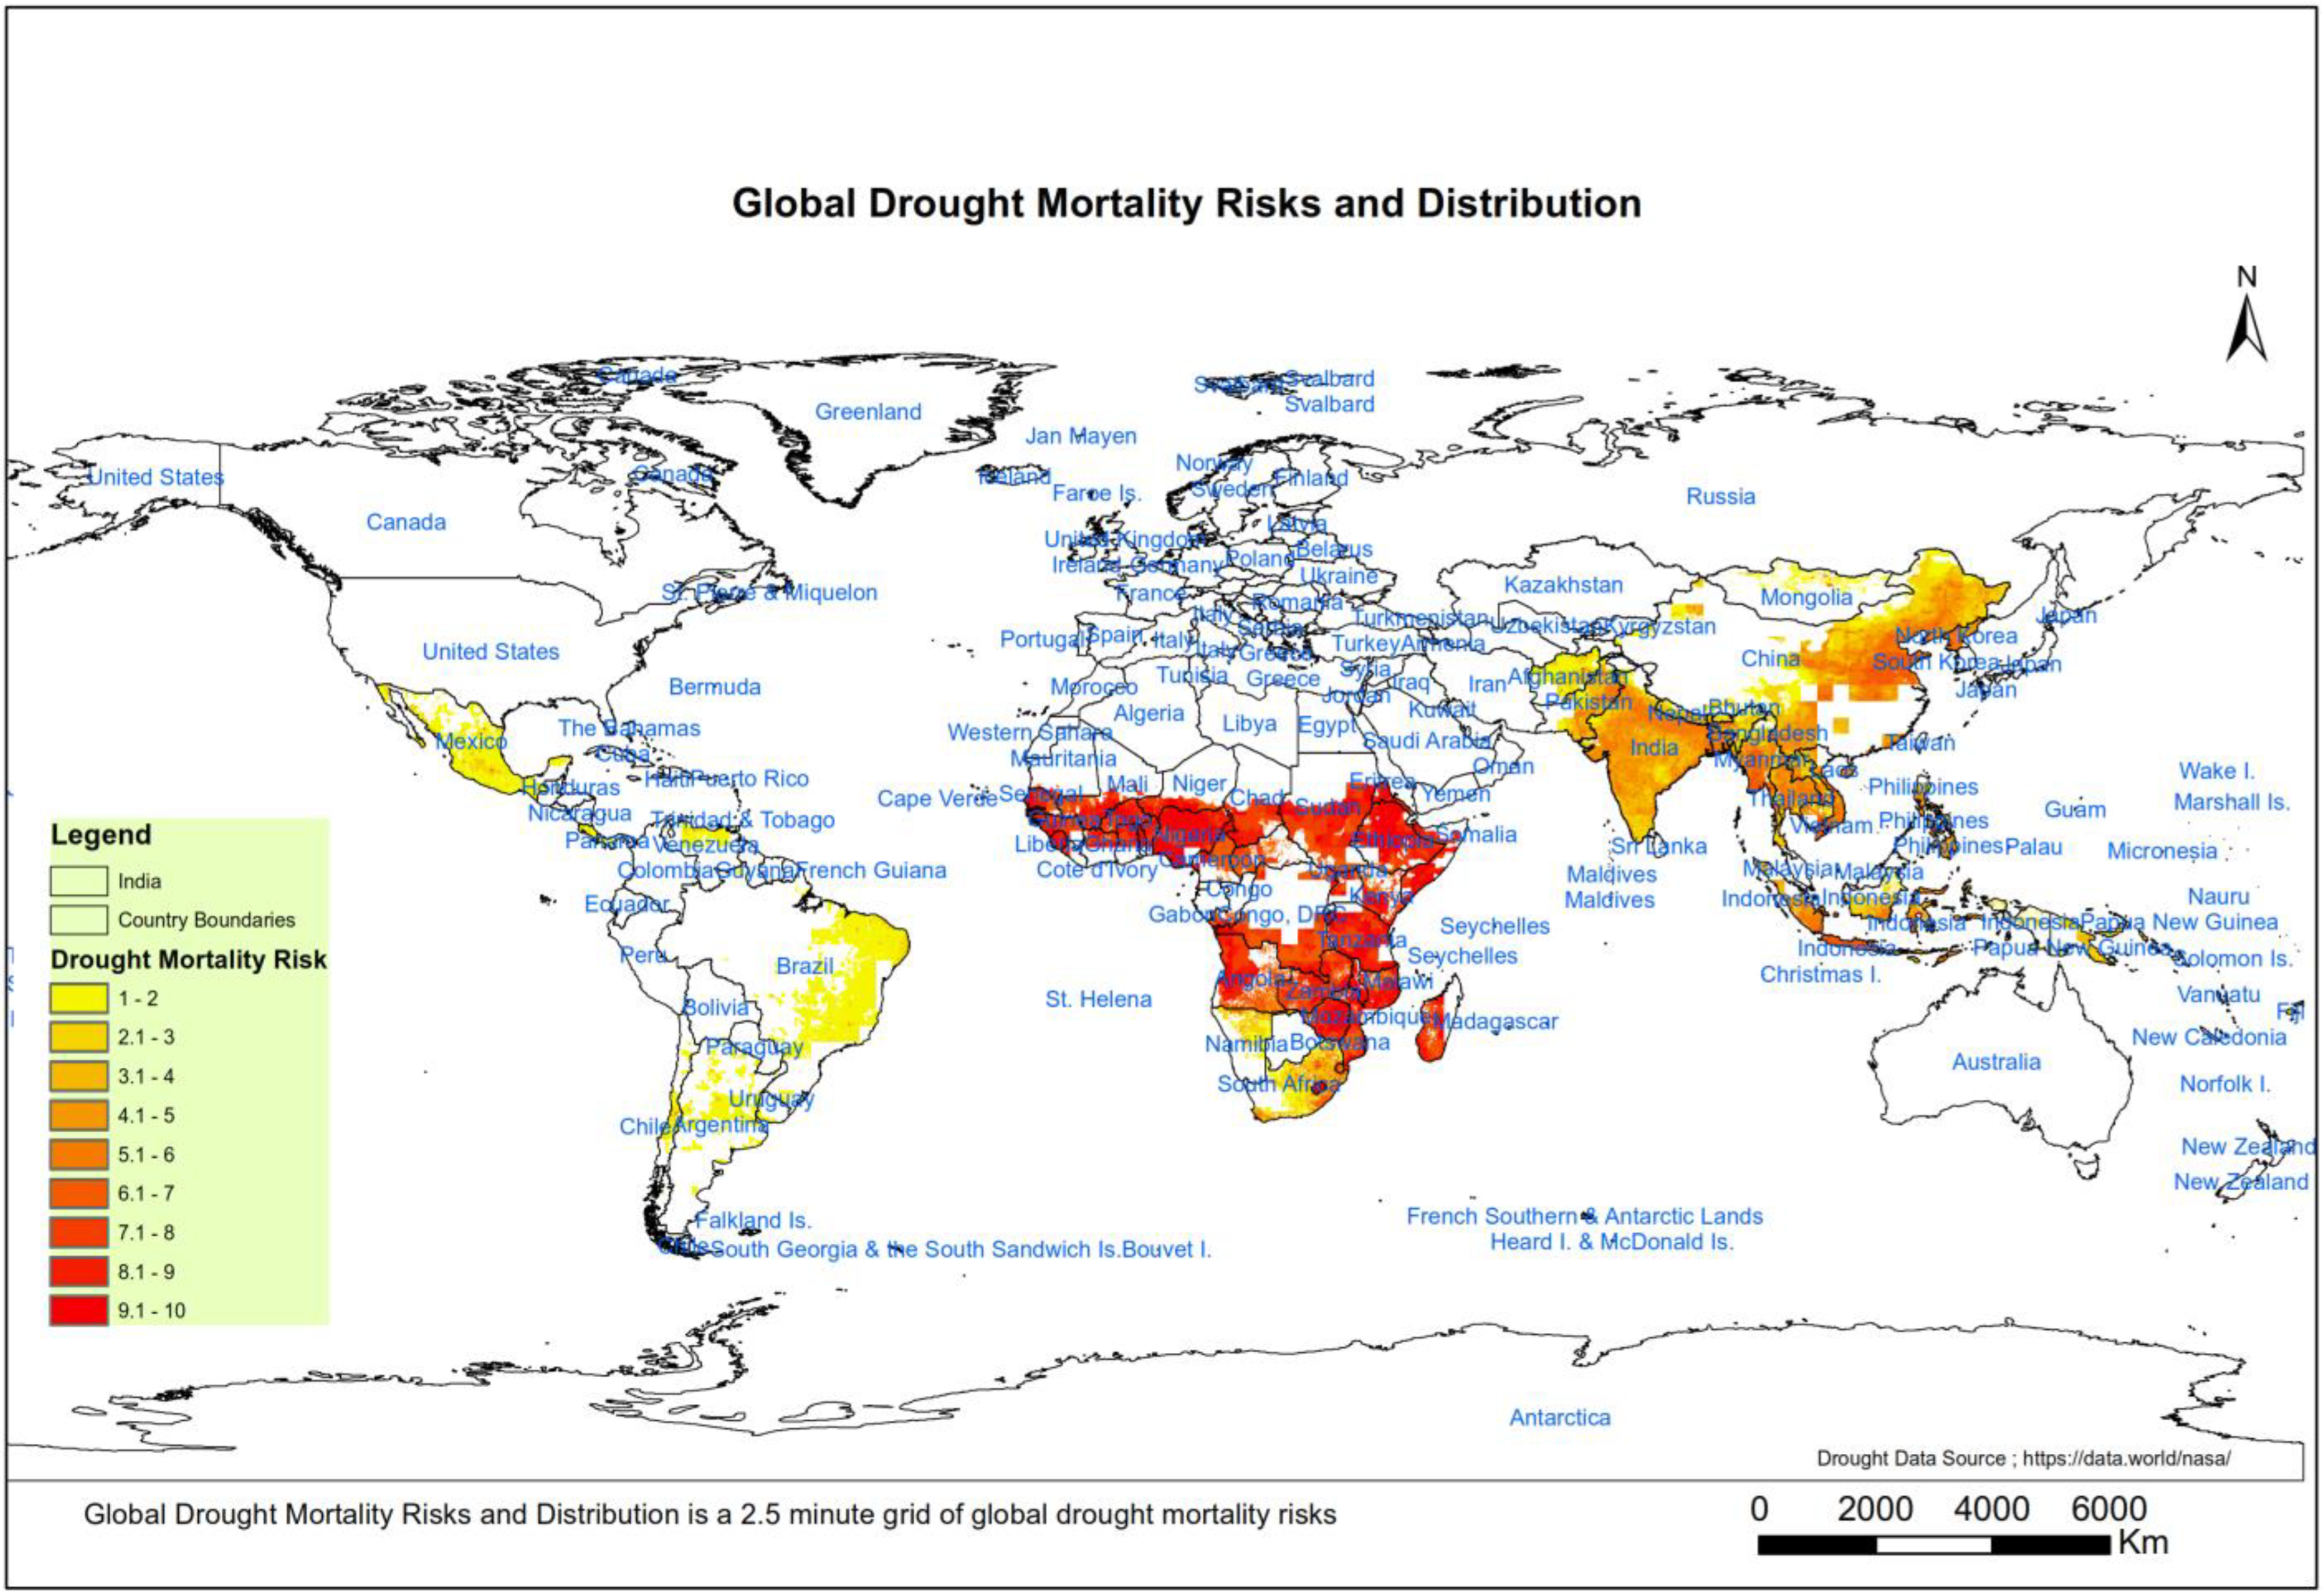
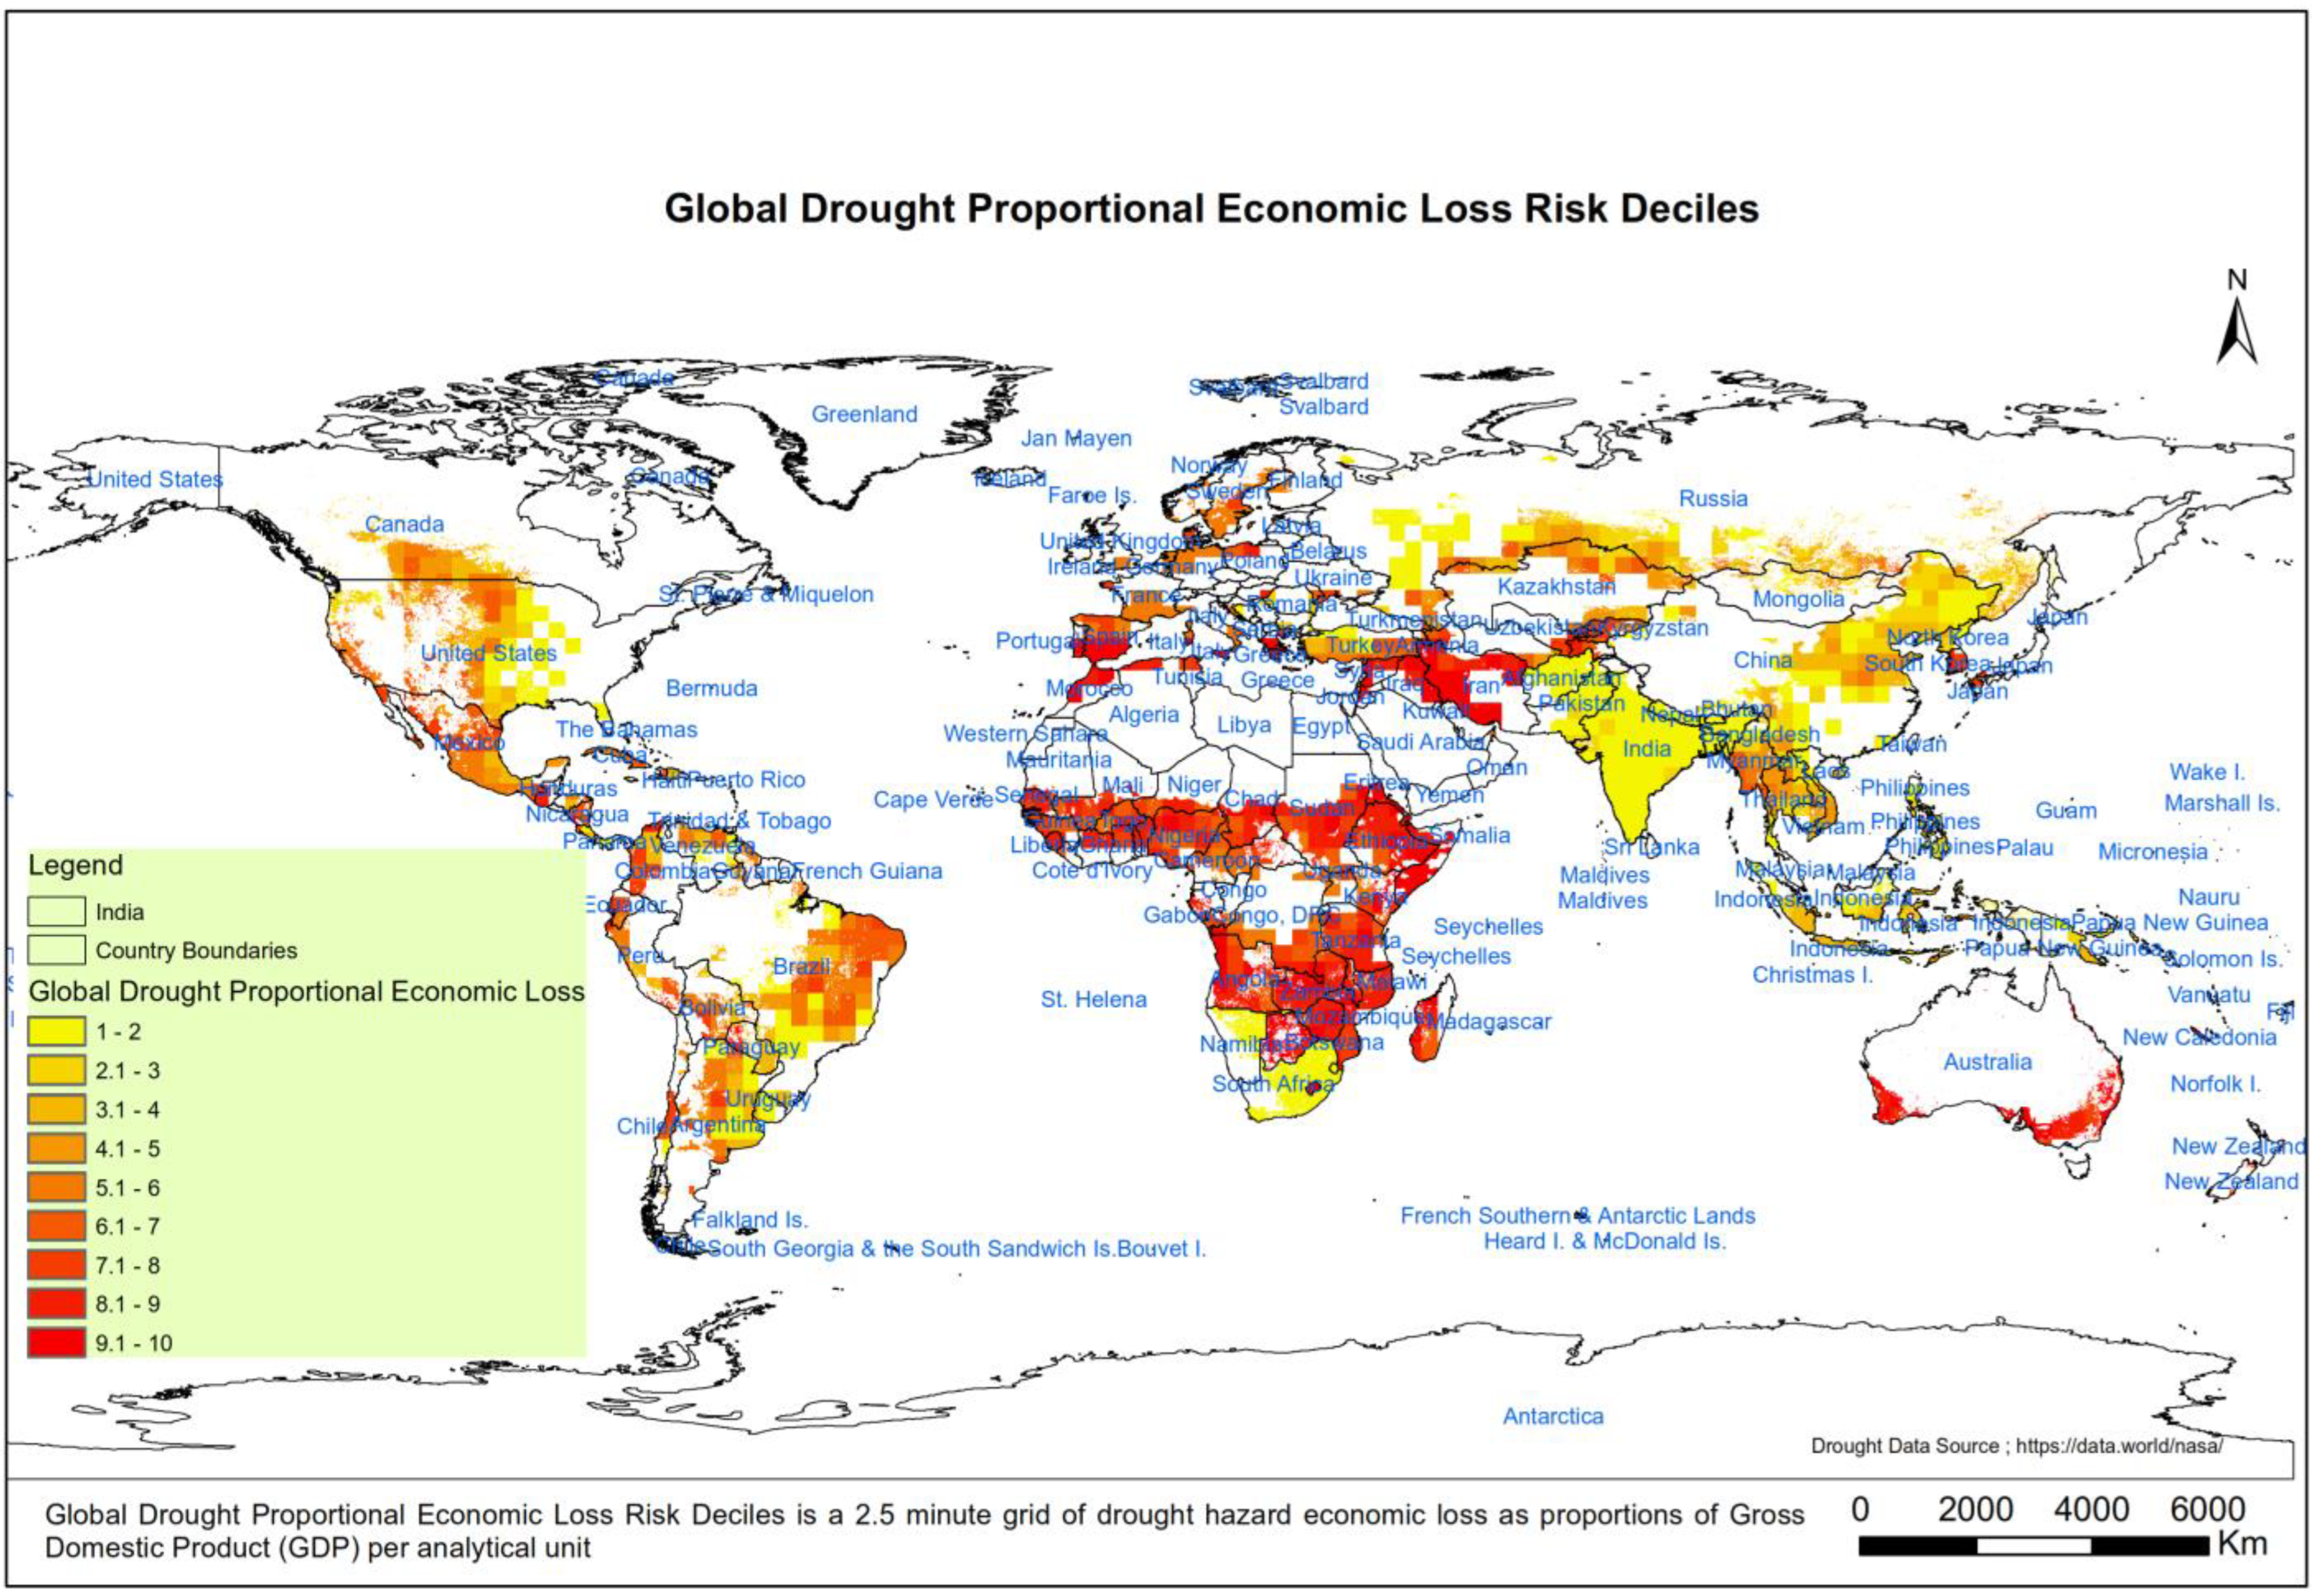
- Drought Proportional Economic Loss Risk Deciles. In Data and Applications Center (SEDAC); NASA Socioeconomic: Palisades, NY, USA; Available online: http://dx.doi.org/10.7927/H4MG7MDV (accessed on 18 January 2022).
- Dilley, M.; Chen, R.; Deichmann, U.; Lerner-Lam, A.; Arnold, M.; Agwe, J.; Buys, P.; Kjekstad, O.; Lyon, B.; Yetman, G. Natural Disaster Hotspots: A Global Risk Analysis; Disaster Risk Management Series No. 5; The World Bank: Washington, DC, USA, 2005; Available online: http://go.worldbank.org/PT8XJZW3K0 (accessed on 2 January 2023).
- Nabipour, N.; Dehghani, M.; Mosavi, A.; Shamshirband, S. Short-Term Hydrological Drought Forecasting Based on Different Nature-Inspired Optimization Algorithms Hybridized with Artificial Neural Networks. IEEE Access 2020, 8, 15210–15222. [Google Scholar] [CrossRef]
- Promping, T.; Tingsanchali, T. Meteorological Drought Hazard Assessment under Future Climate Change Projection for Agriculture Area in Songkhram River Basin, Thailand. In Proceedings of the 2020 International Conference and Utility Exhibition on Energy, Environment and Climate Change (ICUE), Pattaya, Thailand, 20–22 October 2020; IEEE: New York, NY, USA, 2020; pp. 1–7. [Google Scholar]
- Khan, M.I.; Maity, R. Hybrid Deep Learning Approach for Multi-Step-Ahead Daily Rainfall Prediction Using GCM Simulations. IEEE Access 2020, 8, 52774–52784. [Google Scholar] [CrossRef]
- Mokhtar, A.; Jalali, M.; He, H.; Al-Ansari, N.; Elbeltagi, A.; Alsafadi, K.; Abdo, H.G.; Sammen, S.S.; Gyasi-Agyei, Y.; Rodrigo-Comino, J. Estimation of SPEI Meteorological Drought Using Machine Learning Algorithms. IEEE Access 2021, 9, 65503–65523. [Google Scholar] [CrossRef]
- Fooladi, M.; Golmohammadi, M.H.; Safavi, H.R.; Singh, V.P. Fusion-based framework for meteorological drought modeling using remotely sensed datasets under climate change scenarios: Resilience, vulnerability, and frequency analysis. J. Environ. Manag. 2021, 297, 113283. [Google Scholar] [CrossRef] [PubMed]
- Kloos, S.; Yuan, Y.; Castelli, M.; Menzel, A. Agricultural Drought Detection with MODIS Based Vegetation Health Indices in Southeast Germany. Remote Sens. 2021, 13, 3907. [Google Scholar] [CrossRef]
- Zhang, Z.; Xu, W.; Shi, Z.; Qin, Q. Establishment of a Comprehensive Drought Monitoring Index Based on Multisource Remote Sensing Data and Agricultural Drought Monitoring. IEEE J. Sel. Top. Appl. Earth Obs. Remote Sens. 2021, 14, 2113–2126. [Google Scholar] [CrossRef]
- Sardar, V.S.; Ram, S.; Shrisha, S.; Sridharan, S. An Early Warning System for Agricultural Drought. In Proceedings of the 2020 IEEE International Conference on Electronics, Computing and Communication Technologies (CONECCT), Bangalore, India, 2–4 July 2020; IEEE: New York, NY, USA, 2020; pp. 1–7. [Google Scholar]
- Cui, A.; Li, J.; Zhou, Q.; Wu, G.; Li, Q. Hydrological drought measurement using GRACE terrestrial water storage anomaly. In Proceedings of the IGARSS 2019-2019 IEEE International Geoscience and Remote Sensing Symposium, Yokohama, Japan, 28 July–2 August 2019; IEEE: New York, NY, USA, 2019; pp. 9914–9917. [Google Scholar]
- Ravichandran, V.; Kantamaneni, K.; Periasamy, T.; Roy, P.D.; Killivalavan, J.; Sundar, S.; Chokkalingam, L.; Palanisamy, M. Monitoring of Multi-Aspect Drought Severity and Socio-Economic Status in the Semi-Arid Regions of Eastern Tamil Nadu, India. Water 2022, 14, 2049. [Google Scholar] [CrossRef]
- Ding, Y.; Gong, X.; Xing, Z.; Cai, H.; Zhou, Z.; Zhang, D.; Sun, P.; Shi, H. Attribution of meteorological, hydrological and agricultural drought propagation in different climatic regions of China. Agric. Water Manag. 2021, 255, 106996. [Google Scholar] [CrossRef]
- Frazier, A.G.; Giardina, C.P.; Giambelluca, T.W.; Brewington, L.; Chen, Y.-L.; Chu, P.-S.; Berio Fortini, L.; Hall, D.; Helweg, D.A.; Keener, V.W.; et al. A Century of Drought in Hawai‘i: Geospatial Analysis and Synthesis across Hydrological, Ecological, and Socioeconomic Scales. Sustainability 2022, 14, 12023. [Google Scholar] [CrossRef]
- Rosvold, E.L.; Buhaug, H. GDIS, a global dataset of geocoded disaster locations. Sci. Data 2021, 8, 61. [Google Scholar] [CrossRef] [PubMed]
- Sihananto, A.N.; Burhan, M.S.; Soebroto, A.A.; Mahmudy, W.F.; Ramdani, F.; Luthfi, A. Drought forecasting using ANFIS on tuban regency, Indonesia. In Proceedings of the 2017 International Conference on Sustainable Information Engineering and Technology (SIET), Batu, Indonesia, 24–25 November 2017; IEEE: New York, NY, USA, 2017; pp. 316–320. [Google Scholar]
- Guo, Y.; Huang, S.; Huang, Q.; Wang, H.; Wang, L.; Fang, W. Copulas-based bivariate socioeconomic drought dynamic risk assessment in a changing environment. J. Hydrol. 2019, 575, 1052–1064. [Google Scholar] [CrossRef]
- TishehZan, P.; Eslamian, S. Agricultural Drought: Organizational Perspectives. In Handbook of Drought and Water Scarcity; CRC Press: Boca Raton, FL, USA, 2017; pp. 91–108. [Google Scholar]
- Van Hoek, M.; Zhou, J.; Jia, L.; Lu, J.; Zheng, C.; Hu, G.; Menenti, M. A prototype web-based analysis platform for drought monitoring and early warning. Int. J. Digit. Earth 2019, 13, 817–831. [Google Scholar] [CrossRef]
- Park, S.-Y.; Sur, C.; Kim, J.-S.; Lee, J.-H. Evaluation of multi-sensor satellite data for monitoring different drought impacts. Stoch. Environ. Res. Risk Assess. 2018, 32, 2551–2563. [Google Scholar] [CrossRef]
- Lu, J.; Jia, L.; Zhou, J.; Zheng, C.; Hu, G. Adaptablity of Six Global Drought Indices Over China. In Proceedings of the IGARSS 2019–2019 IEEE International Geoscience and Remote Sensing Symposium, Yokohama, Japan, 28 July–2 August 2019; IEEE: New York, NY, USA, 2019; pp. 9922–9925. [Google Scholar]
- Amarnath, G.; Ghosh, S.; Alahacoon, N.; Nakada, T.; Rao, K.V.; Sikka, A. Regional Drought Monitoring for Managing Water Security in South Asia. In Multi-Hazard Early Warning and Disaster Risks; Springer: Cham, Switzerland, 2021; pp. 465–481. [Google Scholar]
- Dong, H.; Li, J.; Yuan, Y.; You, L.; Chen, C. A component-based system for agricultural drought monitoring by remote sensing. PLoS ONE 2017, 12, e0188687. [Google Scholar] [CrossRef] [Green Version]
- Amarnath, G.; Pani, P.; Alahacoon, N.; Chockalingam, J.; Mondal, S.; Matheswaran, K.; Smakhtin, V. Development of a System for Drought Monitoring and Assessment in South Asia. In Current Directions in Water Scarcity Research; Elsevier: Amsterdam, The Netherlands, 2019; Volume 2, pp. 133–163. [Google Scholar]
- Tu, X.; Wu, H.; Singh, V.P.; Chen, X.; Lin, K.; Xie, Y. Multivariate design of socioeconomic drought and impact of water reservoirs. J. Hydrol. 2018, 566, 192–204. [Google Scholar] [CrossRef]
- Hao, Z.; AghaKouchak, A.; Nakhjiri, N.; Farahmand, A. Global integrated drought monitoring and prediction system. Sci. Data 2014, 1, 140001. [Google Scholar] [CrossRef] [Green Version]
- Sun, Z.; Di, L. Intercomparison of Agricultural Drought Monitoring Products. In Proceedings of the 2021 9th International Conference on Agro-Geoinformatics (Agro-Geoinformatics), Shenzhen, China, 26–29 July 2021; IEEE: New York, NY, USA, 2021; pp. 1–5. [Google Scholar]
- Hao, Z.; Singh, V.P.; Xia, Y. Seasonal Drought Prediction: Advances, Challenges, and Future Prospects. Rev. Geophys. 2018, 56, 108–141. [Google Scholar] [CrossRef] [Green Version]
- KKuwayama, Y.; Thompson, A.; Bernknopf, R.; Zaitchik, B.; Vail, P. Estimating the Impact of Drought on Agriculture Using the U.S. Drought Monitor. Am. J. Agric. Econ. 2019, 101, 193–210. [Google Scholar] [CrossRef]
- Hao, Z.; Xia, Y.; Luo, L.; Singh, V.P.; Ouyang, W.; Hao, F. Toward a categorical drought prediction system based on U.S. Drought Monitor (USDM) and climate forecast. J. Hydrol. 2017, 551, 300–305. [Google Scholar] [CrossRef]
- Svoboda, M. The North American drought monitor: A continental approach. In Proceedings of the 2011 GEOSS Workshop XL-Managing Drought through Earth Observation, Sydney, Australia, 10 April 2011; IEEE: New York, NY, USA, 2011; pp. 1–22. [Google Scholar]
- Hao, Z.; Yuan, X.; Xia, Y.; Hao, F.; Singh, V.P. An Overview of Drought Monitoring and Prediction Systems at Regional and Global Scales. Bull. Am. Meteorol. Soc. 2017, 98, 1879–1896. [Google Scholar] [CrossRef]
- Mu, Q.; Zhao, M.; Kimball, J.S.; McDowell, N.G.; Running, S.W. A Remotely Sensed Global Terrestrial Drought Severity Index. Bull. Am. Meteorol. Soc. 2013, 94, 83–98. [Google Scholar] [CrossRef] [Green Version]
- Park, S.; Seo, E.; Kang, D.; Im, J.; Lee, M.-I. Prediction of Drought on Pentad Scale Using Remote Sensing Data and MJO Index through Random Forest over East Asia. Remote Sens. 2018, 10, 1811. [Google Scholar] [CrossRef] [Green Version]
- Wang, L.; Yuan, X. Two Types of Flash Drought and Their Connections with Seasonal Drought. Adv. Atmos. Sci. 2018, 35, 1478–1490. [Google Scholar] [CrossRef]
- Xia, Y. NCEP/NLDAS Seasonal Drought Prediction over the Continental US Using the Seasonal Forecast System Developed by Princeton University and University of Washington. In Proceedings of the 22nd Conference on Climate Variability and Change, Champaign, IL, USA, 17 January 2010. [Google Scholar]
- Hao, Z.; Hao, F.; Xia, Y.; Singh, V.P.; Hong, Y.; Shen, X.; Ouyang, W. A Statistical Method for Categorical Drought Prediction Based on NLDAS-2. J. Appl. Meteorol. Clim. 2016, 55, 1049–1061. [Google Scholar] [CrossRef]
- Xia, Y.; Ek, M.B.; Peters-Lidard, C.D.; Mocko, D.; Svoboda, M.; Sheffield, J.; Wood, E.F. Application of USDM statistics in NLDAS-2: Optimal blended NLDAS drought index over the continental United States. J. Geophys. Res. Atmos. 2014, 119, 2947–2965. [Google Scholar] [CrossRef]
- Zamora, R.A.; Zaitchik, B.F.; Rodell, M.; Getirana, A.; Kumar, S.; Arsenault, K.; Gutmann, E. Contribution of Meteorological Downscaling to Skill and Precision of Seasonal Drought Forecasts. J. Hydrometeorol. 2021, 228, 2009–2031. [Google Scholar] [CrossRef]
- Chen, L.G.; Gottschalck, J.; Hartman, A.; Miskus, D.; Tinker, R.; Artusa, A. Flash Drought Characteristics Based on U.S. Drought Monitor. Atmosphere 2019, 10, 498. [Google Scholar] [CrossRef] [Green Version]
- Dalezios, N.R.; Gobin, A.; Alfonso, A.M.T.; Eslamian, S. Agricultural Drought Indices: Combining Crop, Climate, and Soil Factors. In Handbook of Drought and Water Scarcity; CRC Press: Boca Raton, FL, USA, 2017; pp. 73–89. [Google Scholar]
- Klisch, A.; Atzberger, C. Operational Drought Monitoring in Kenya Using MODIS NDVI Time Series. Remote Sens. 2016, 8, 267. [Google Scholar] [CrossRef] [Green Version]
- van Ginkel, M.; Biradar, C. Drought Early Warning in Agri-Food Systems. Climate 2021, 9, 134. [Google Scholar] [CrossRef]
- Real-Rangel, R.A.; Pedrozo-Acuña, A.; Breña-Naranjo, J.A.; Alcocer-Yamanaka, V.H. A drought monitoring framework for data-scarce regions. J. Hydroinformatics 2019, 22, 170–185. [Google Scholar] [CrossRef]
- Courtright, A.B.; Prat, O.; Bilotta, R.; Leeper, R.; Nelson, B.R.; Ansari, S.; Lang, A. Developing an Interactive Global Drought Information Dashboard Using Remotely Sensed Near-Real Time Monitoring. In AGU Fall Meeting Abstracts; 2019; Volume 2019, p. NH53B-0808. Available online: https://ui.adsabs.harvard.edu/abs/2019AGUFMNH53B0808C/abstract (accessed on 21 February 2023).
- Heim, R.R.; Brewer, M.J.; Pulwarty, R.S.; Wilhite, D.A.; Hayes, M.J.; Sivakumar, M.V. Drought Early Warning and Information Systems. In Handbook of Drought and Water Scarcity; CRC Press: Boca Raton, FL, USA, 2017; pp. 305–321. [Google Scholar]
- Hoerling, M. Temperature and Drought: A Science Assessment by a Subgroup of the Drought Task Force. 2018. Available online: https://repository.library.noaa.gov/view/noaa/17720 (accessed on 21 January 2023).
- Pal, I.; Bhatt, M. Drought Risk Management and Governance in South-East Asian Perspectives. Drought Risk Manag. South South-East Asia 2020, 1, 1–20. [Google Scholar]
- Wang, H.; Zhong, P.-A.; Zsoter, E.; Prudhomme, C.; Pappenberger, F.; Xu, B. Regional Adaptability of Global and Regional Hydrological Forecast System. Water 2023, 15, 347. [Google Scholar] [CrossRef]
- Dalezios, N.R.; Eslamian, S. Drought Assessment and Management for heat WAVES Monitoring. In Handbook of Drought and Water Scarcity; CRC Press: Boca Raton, FL, USA, 2017; pp. 235–260. [Google Scholar]
- Emerton, R.; Zsoter, E.; Arnal, L.; Cloke, H.L.; Muraro, D.; Prudhomme, C.; Pappenberger, F. Developing a global operational seasonal hydro-meteorological forecasting system: GloFAS-Seasonal v1.0. Geosci. Model Dev. 2018, 11, 3327–3346. [Google Scholar] [CrossRef] [Green Version]
- Hao, Z.; Hao, F.; Xia, Y.; Singh, V.P.; Zhang, X. A monitoring and prediction system for compound dry and hot events. Environ. Res. Lett. 2019, 14, 114034. [Google Scholar] [CrossRef]
- Basheer, M.; Elagib, N.A. Performance of satellite-based and GPCC 7.0 rainfall products in an extremely data-scarce country in the Nile Basin. Atmos. Res. 2018, 215, 128–140. [Google Scholar] [CrossRef]
- Wang, G.; Zhang, P.; Liang, L.; Zhang, S. Evaluation of precipitation from CMORPH, GPCP-2, TRMM 3B43, GPCC, and ITPCAS with ground-based measurements in the Qinling-Daba Mountains, China. PLoS ONE 2017, 12, e0185147. [Google Scholar] [CrossRef] [Green Version]
- Wei, L.; Jiang, S.; Ren, L.; Yuan, F.; Zhang, L. Performance of Two Long-Term Satellite-Based and GPCC 8.0 precipitation products for drought monitoring over the Yellow River Basin in China. Sustainability 2019, 11, 4969. [Google Scholar] [CrossRef] [Green Version]
- Ababaei, B. Spatio-temporal variations of seven weather variables in Iran: Application of CRU TS and GPCC data sets. Irrig. Drain. 2020, 69, 164–185. [Google Scholar] [CrossRef]
- Paxian, A.; Ziese, M.; Kreienkamp, F.; Pankatz, K.; Brand, S.; Pasternack, A.; Früh, B. User-oriented global predictions of the GPCC drought index for the next decade. Meteorol. Z. 2019, 28, 3–21. [Google Scholar] [CrossRef]
- Xu, L.; Chen, N.; Zhang, X.; Chen, Z. An evaluation of statistical, NMME and hybrid models for drought prediction in China. J. Hydrol. 2018, 566, 235–249. [Google Scholar] [CrossRef] [Green Version]
- Chandrasekara, S.S.; Kwon, H.-H.; Vithanage, M.; Obeysekera, J.; Kim, T.-W. Drought in South Asia: A Review of Drought Assessment and Prediction in South Asian Countries. Atmosphere 2021, 12, 369. [Google Scholar] [CrossRef]
- Aadhar, S.; Mishra, V. High-resolution near real-time drought monitoring in South Asia. Sci. Data 2017, 4, 170145. [Google Scholar] [CrossRef] [Green Version]
- Pei, Z.; Fang, S.; Wang, L.; Yang, W. Comparative Analysis of Drought Indicated by the SPI and SPEI at Various Timescales in Inner Mongolia, China. Water 2020, 12, 1925. [Google Scholar] [CrossRef]
- Logan, W.; Sheffield, J.; Wood, E. Applications of the African Flood and Drought Monitor to Vector- and Water-Borne Disease, and to Human Well-Being. 2019. Available online: https://d197for5662m48.cloudfront.net/documents/publicationstatus/105688/preprint_pdf/2d9b7260c5f3fb5230bf9869e175f7ba.pdf (accessed on 21 February 2023).
- Brewer, M.J.; Heim, R.R., Jr. The Global Drought Monitor Portal. 2011. Available online: https://digitalcommons.unl.edu/droughtfacpub/55/ (accessed on 21 February 2023).
- Amani, A.; Sheffield, J.; Capdevilla, A.; Bila, M.; Fisher, C.; Pan, M.; Jimenez-Cisneros, B. Strengthening Flood and Drought Risk Management Tools for the Lake Chad Basin. In Climate Change and Water Resources in Africa; Springer International Publishing: Cham, Switzerland, 2021; pp. 387–405. [Google Scholar]
- Cammalleri, C.; Arias-Muñoz, C.; Barbosa, P.; de Jager, A.; Magni, D.; Masante, D.; Mazzeschi, M.; McCormick, N.; Naumann, G.; Spinoni, J.; et al. A revision of the Combined Drought Indicator (CDI) used in the European Drought Observatory (EDO). Nat. Hazards Earth Syst. Sci. 2021, 21, 481–495. [Google Scholar] [CrossRef]
- Koehler, J.; Dietz, A.J.; Zellner, P.; Baumhoer, C.A.; Dirscherl, M.; Cattani, L.; Vlahović, Ž.; Alasawedah, M.H.; Mayer, K.; Haslinger, K.; et al. Drought in Northern Italy: Long Earth Observation Time Series Reveal Snow Line Elevation to Be Several Hundred Meters Above Long-Term Average in 2022. Remote Sens. 2022, 14, 6091. [Google Scholar] [CrossRef]
- Eslami, A. Development of a Mathematical Model for Hydroclimatological Drought Forecasting. Ph.D. Thesis, Universiti Putra Malaysia, Selangor, Malaysia, 2012. [Google Scholar]
- Liu, Y.; Wang, L. Drought Prediction Method Based on an Improved CEEMDAN-QR-BL Model. IEEE Access 2021, 9, 6050–6062. [Google Scholar] [CrossRef]
- Russwurm, M.; Ali, M.; Zhu, X.X.; Gal, Y.; Korner, M. Model and Data Uncertainty for Satellite Time Series Forecasting with Deep Recurrent Models. In Proceedings of the IGARSS 2020–2020 IEEE International Geoscience and Remote Sensing Symposium, Waikoloa, HI, USA, 26 September 2020–2 October 2020; IEEE: New York, NY, USA, 2020; pp. 7025–7028. [Google Scholar] [CrossRef]
- Amandeep, K.; Sandeep, K. Sood—Deep learning based drought assessment and prediction framework. Ecol. Inform. 2020, 57, 101067. [Google Scholar]
- Mokhtari, R.; Akhoondzadeh, M. Data Fusion and Machine Learning Algorithms for Drought Forecasting Using Satellite Data. J. Earth Space Phys. 2021, 46, 231–246. [Google Scholar]
- Anbarasan, M.; Muthu, B.; Sivaparthipan, C.B.; Sundarasekar, R.; Kadry, S.; Krishnamoorthy, S.; Dasel, A.A. Antony Dasel—Detection of flood disaster system based on IoT, big data and convolutional deep neural network. Comput. Commun. 2020, 150, 150–157. [Google Scholar] [CrossRef]
- Belayneh, A.; Adamowski, J. Standard Precipitation Index Drought Forecasting Using Neural Networks, Wavelet Neural Networks, and Support Vector Regression. Appl. Comput. Intell. Soft Comput. 2012, 2012, 6. [Google Scholar] [CrossRef] [Green Version]
- Sutoyo, E.; Musnansyah, A. A Hybrid of Seasonal Autoregressive Integrated Moving Average (SARIMA) and Decision Tree for Drought Forecasting. In Proceedings of the International Conference on Engineering and Information Technology for Sustainable Industry, New York, NY, USA, 28–29 September 2020; pp. 1–6. [Google Scholar]
- Abirami, R.N.; Vincent, P.M.D.R.; Srinivasan, K.; Tariq, U.; Chang, C.-Y. Deep CNN and Deep GAN in Computational Visual Perception-Driven Image Analysis. Complexity 2021, 2021, 1–30. [Google Scholar] [CrossRef]
- Hong, D.; Hong, K.A. Drought forecasting using MLP neural networks. In Proceedings of the 2015 8th International Conference on u- and e-Service, Science and Technology (UNESST), Jeju, Republic of Korea, 25–28 November 2015; IEEE: New York, NY, USA, 2015; pp. 62–65. [Google Scholar]
- Miao, T. Research of Regional Drought Forecasting Based on Phase Space Reconstruction and Wavelet Neural Network Model. In Proceedings of the 2018 7th International Conference on Agro-Geoinformatics (Agro-Geoinformatics), Hangzhou, China, 6–9 August 2018; IEEE: New York, NY, USA; pp. 1–4. [Google Scholar]
- Sun, Z.; Di, L.; Fang, H.; Guo, L.; Yu, E.; Tang, J.; Sun, J. Advanced cyberinfrastructure for agricultural drought monitoring. In Proceedings of the 2019 8th International Conference on Agro-Geoinformatics (Agro-Geoinformatics), Istanbul, Turkey, 16–19 July 2019; IEEE: New York, NY, USA; pp. 1–5. [Google Scholar]
- Belayneh, A.; Adamowski, J.; Khalil, B. Short-term SPI drought forecasting in the Awash River Basin in Ethiopia using wavelet transforms and machine learning methods. Sustain. Water Resour. Manag. 2015, 2, 87–101. [Google Scholar]
- Okewu, E.; Misra, S.; Fernandez-Sanz, L.; Ayeni, F.; Mbarika, V.; Damasevicius, R. Deep Neural Networks for Curbing Climate Change-Induced Farmers-Herdsmen Clashes in a Sustainable Social Inclusion Initiative. Problemy Ekorozwoju. 2019, 2, 143–155. [Google Scholar]
- Habibie, I.; Ahamed, T.; Noguchi, R.; Shusuke, M. Deep Learning Algorithms to determine Drought prone Areas Using Remote Sensing and GIS. In Proceedings of the 2020 IEEE Asia-Pacific Conference on Geoscience, Electronics and Remote Sensing Technology (AGERS), Jakarta, Indonesia, 7–8 December 2020. [Google Scholar] [CrossRef]
- Agana, N. A Hybrid Deep Belief Network for Long Term Drought Prediction. In Proceedings of the Workshop on Mining Big Data in Climate and Environment (MBDCE 2017), 17th SIAM International Conference on Data Mining (SDM 2017), Houston, TX, USA, 27–29 April 2017. [Google Scholar]
- Ahamed, F.; Sarkar, O.; Matin, A. Instance Segmentation of Visible Cloud Images Based on Mask R-CNN Applying Transfer Learning Approach. In Proceedings of the 2020 2nd International Conference on Advanced Information and Communication Technology (ICAICT), Dhaka, Bangladesh, 28–29 November 2020; pp. 257–262. [Google Scholar] [CrossRef]
- Salman, A.G.; Kanigoro, B.; Heryadi, Y. Weather forecasting using deep learning techniques. In Proceedings of the 2015 International Conference on Advanced Computer Science and Information Systems (ICACSIS), Depok, Indonesia, 10–11 October 2015; pp. 281–285. [Google Scholar] [CrossRef]
- Chirayath, V.; Li, A.; Torres-Perez, J.; Segal-Rozenhaimer, M.; van den Bergh, J. NASA NeMO-Net—A Neural Multimodal Observation & Training Network for Marine Ecosystem Mapping at Diverse Spatiotemporal Scales. In Proceedings of the IGARSS 2020–2020 IEEE International Geoscience and Remote Sensing Symposium, Waikoloa, HI, USA, 26 September–2 October 2020; pp. 3633–3636. [Google Scholar] [CrossRef]
- Arteaga, B.; Diaz, M.; Jojoa, M. Deep Learning Applied to Forest Fire Detection. In Proceedings of the 2020 IEEE International Symposium on Signal Processing and Information Technology (ISSPIT), Louisville, KY, USA, 9–11 December 2020; pp. 1–6. [Google Scholar] [CrossRef]
- Chou, C.; Park, J.; Chou, E. Generating High-Resolution Climate Change Projections Using Super-Resolution Convolutional LSTM Neural Networks. In Proceedings of the 2021 13th International Conference on Advanced Computational Intelligence (ICACI), Chongqing, China, 14–16 May 2021; pp. 293–298. [Google Scholar] [CrossRef]
- Guo, Y.; Liu, Y.; Oerlemans, A.; Lao, S.; Wu, S.; Lew, M.S. Deep learning for visual understanding: A review. Neurocomputing 2016, 187, 27–48. [Google Scholar] [CrossRef]
- Dikshit, A.; Pradhan, B.; Alamri, A.M. Short-Term Spatio-Temporal Drought Forecasting Using Random Forests Model at New South Wales, Australia. Appl. Sci. 2020, 10, 4254. [Google Scholar] [CrossRef]
- Sa, V.; Sobhani, B. Modeling and Monitoring of Drought for forecasting it, to Reduce Natural hazards Atmosphere in western and north western part of Iran, Iran. Air Qual. Atmos. Health 2019, 12, 119–130. [Google Scholar]
- Agana, N.; Homaifar, A. A deep learning based approach for long-term drought prediction. SoutheastCon 2017, 2017, 1–8. [Google Scholar] [CrossRef]
- Dikshit, A.; Pradhan, B.; Alamri, A.M. Long lead time drought forecasting using lagged climate variables and a stacked long short-term memory model. Sci. Total. Environ. 2020, 755, 142638. [Google Scholar] [CrossRef]
- Dutta, R.; Aryal, J.; Das, A.; Kirkpatrick, J.B. Deep cognitive imaging systems enable estimation of continental-scale fire incidence from climate data. Sci. Rep. 2013, 3, 3188. [Google Scholar] [CrossRef] [Green Version]
- Harilal, N.; Singh, M.; Bhatia, U. Augmented Convolutional LSTMs for Generation of High-Resolution Climate Change Projections. IEEE Access 2021, 9, 25208–25218. [Google Scholar] [CrossRef]
- Norbert, A. Agana and Abdollah Homaifar—MD-Based Predictive Deep Belief Network for Time Series Prediction: An Application to Drought Forecasting. Hydrology 2018, 5, 18. [Google Scholar]
- Deepa, N.; Ganesan, K.; Srinivasan, K.; Chang, C.-Y. Realizing Sustainable Development via Modified Integrated Weighting MCDM Model for Ranking Agrarian Dataset. Sustainability 2019, 11, 6060. [Google Scholar] [CrossRef] [Green Version]
- Park, S.; Im, J.; Han, D.; Rhee, J. Short-Term Forecasting of Satellite-Based Drought Indices Using Their Temporal Patterns and Numerical Model Output. Remote. Sens. 2020, 12, 3499. [Google Scholar] [CrossRef]
- Felsche, E.; Ludwig, R. Applying machine learning for drought prediction using data from a large ensemble of climate simulations. Nat. Hazards Earth Syst. Sci. Discuss. 2021, 21, 3679–3691. [Google Scholar] [CrossRef]
- Dikshit, A.; Pradhan, B. Explainable AI in drought forecasting. Mach. Learn. Appl. 2021, 6, 100192. [Google Scholar] [CrossRef]
- Dikshit, A.; Pradhan, B.; Alamri, A.M. Pathways and challenges of the application of artificial intelligence to geohazards modelling. Gondwana Res. 2021, 100, 290–301. [Google Scholar] [CrossRef]
- Margaret, M.R.; Pavithra, L. Iot based Agriculture Drought Prediction using Chaotic Genetic Algorithm Integrated Intuitionist Fuzzy Subtractive Clustering. Int. J. Recent Technol. Eng. 2019, 8, 2303–2311. [Google Scholar] [CrossRef]
- Balti, H.; Ben Abbes, A.; Mellouli, N.; Farah, I.R.; Sang, Y.; Lamolle, M. A review of drought monitoring with big data: Issues, methods, challenges and research directions. Ecol. Inform. 2020, 60, 101136. [Google Scholar] [CrossRef]
- Maes, W.H.; Steppe, K. Perspectives for Remote Sensing with Unmanned Aerial Vehicles in Precision Agriculture. Trends Plant Sci. 2019, 24, 152–164. [Google Scholar] [CrossRef] [PubMed]
- Poonia, V.; Goyal, M.K.; Gupta, B.; Gupta, A.K.; Jha, S.; Das, J. Drought occurrence in Different River Basins of India and blockchain technology based framework for disaster management. J. Clean. Prod. 2021, 312, 127737. [Google Scholar] [CrossRef]
- Sundararajan, K.; Garg, L.; Srinivasan, K.; Bashir, A.K.; Kaliappan, J.; Ganapathy, G.P.; Meena, T. A contemporary review on drought modeling using machine learning approaches. CMES-Comput. Model. Eng. Sci. 2021, 128, 447–487. [Google Scholar] [CrossRef]
- GGanapathy, G.P.; Srinivasan, K.; Datta, D.; Chang, C.-Y.; Purohit, O.; Zaalishvili, V.; Burdzieva, O. Rainfall Forecasting Using Machine Learning Algorithms for Localized Events. Comput. Mater. Contin. 2022, 71, 6333–6350. [Google Scholar]
- Srinivasan, K.; Nema, A.; Huang, C.H.; Ho, T.Y. Weather Forecasting Application Using Web-Based Model-View-Whatever Framework. In Proceedings of the 2018 IEEE International Conference on Consumer Electronics-Taiwan (ICCE-TW), Taiwan, China, 19–21 May 2018; IEEE: New York, NY, USA, 2018; pp. 1–2. [Google Scholar]
- Joshi, V.R.; Srinivasan, K.; Manivannan, S.S. Intelligent Agricultural Farming System using Internet of Things. In Proceedings of the 2019 IEEE International Conference on Consumer Electronics-Taiwan (ICCE-TW), Yilan, Taiwan, 20–22 May 2019; IEEE: New York, NY, USA, 2019; pp. 1–2. [Google Scholar]
- Vincent, D.R.; Deepa, N.; Elavarasan, D.; Srinivasan, K.; Chauhdary, S.H.; Iwendi, C. Sensors Driven AI-Based Agriculture Recommendation Model for Assessing Land Suitability. Sensors 2019, 19, 3667. [Google Scholar] [CrossRef] [PubMed] [Green Version]
- Elavarasan, D.; Vincent P M, D.R.; Srinivasan, K.; Chang, C.-Y. A Hybrid CFS Filter and RF-RFE Wrapper-Based Feature Extraction for Enhanced Agricultural Crop Yield Prediction Modeling. Agriculture 2020, 10, 400. [Google Scholar] [CrossRef]
- Lütjens, B.; Leshchinskiy, B.; Requena-Mesa, C.; Chishtie, F.; Díaz-Rodriguez, N.; Boulais, O.; Raïssi, C. Physics-informed gans for coastal flood visualization. arXiv 2020, arXiv:2010.08103. [Google Scholar]
- Li, Q.; Hao, H.; Zhao, Y.; Geng, Q.; Liu, G.; Zhang, Y.; Yu, F. GANs-LSTM Model for Soil Temperature Estimation From Meteorological: A New Approach. IEEE Access 2020, 8, 59427–59443. [Google Scholar] [CrossRef]
- Chaudhari, S.; Sardar, V.; Rahul, D.S.; Chandan, M.; Shivakale, M.S.; Harini, K.R. Performance analysis of CNN, alexNet and VGGNet models for drought prediction using satellite images. In Proceedings of the 2021 Asian Conference on Innovation in Technology (ASIANCON), Pune, India, 27–29 August 2021. [Google Scholar]
- Dhyani, Y.; Pandya, R.J. Deep Learning Oriented Satellite Remote Sensing for Drought and Prediction in Agriculture. In Proceedings of the 2021 IEEE 18th India Council International Conference (INDICON), Guwahati, India, 19–21 December 2021; IEEE: New York, NY, USA, 2012; pp. 1–5. [Google Scholar]
- Sundararajan, K.; Srinivasan, K. Feature-Weighting-Based Prediction of Drought Occurrence via Two-Stage Particle Swarm Optimization. Sustainability 2023, 15, 929. [Google Scholar] [CrossRef]
- Baghbani, A.; Choudhury, T.; Costa, S.; Reiner, J. Application of artificial intelligence in geotechnical engineering: A state-of-the-art review. Earth-Sci. Rev. 2022, 228, 103991. [Google Scholar] [CrossRef]
- Zhang, W.; Gu, X.; Hong, L.; Han, L.; Wang, L. Comprehensive review of machine learning in geotechnical reliability analysis: Algorithms, applications and further challenges. Appl. Soft Comput. 2023, 136, 110066. [Google Scholar] [CrossRef]


| S.No | Drought Monitoring System | Reference/Website | Regional/Global | Indicator | Time Scale |
|---|---|---|---|---|---|
| 1. | Global Integrated Drought Monitoring and Prediction System | [22,23,24,25,26,27,28,29,30] | Global | SPI, SSI, MSDI | - |
| 2. | GADMFS | [31] | Global | - | - |
| 3. | US Drought Monitor | [31,32,33,34] | Regional | Category | Weekly |
| 4. | NOAA STAR vegetation health index | [3,31] | Global | VCI, TCI, VHI, NDVI | Weekly |
| 5. | North American Drought Monitor | [35,36] | Regional | Category | Monthly |
| 6. | SPEI Global Drought Monitor | [3] | Global | SPEI | Monthly |
| 7 | Global terrestrial drought severity Index | [39] | Global | DSI | 8-days |
| 8 | NLDAS Drought Monitor | [37,38,39,40,41,42,43,44] | Regional | SWE, Percentile of P |
|
| 9. | U.S. Monthly (Seasonal) Drought Outlook | [4] | Regional | Drought tendency |
|
| 10. | Global Drought Monitoring Portal | [45,46,47,48] | Global | SPI | Monthly |
| 11. | GDIS | [21,49,50,51,52,53,54] | Global | SWR | Monthly |
| 12. | Global Seasonal Hydrologic Forecast System | [3,55,56] | Global | Percentile of R and S | Monthly |
| 13. | GPCC | [57,58,59,60,61,62] | Global | GPCC-DI | Monthly |
| 14. | Experimental Drought Monitor for India | [5,63] | Regional | SPI, SPIE, SRI, | Monthly |
| 15. | Drought Monitoring System for China | [17,25,64,65] | Regional | SPI, SPIE, | Daily |
| 16. | African Drought Monitoring and Forecasting System | [66,67,68] | Regional | SPI, Drought category | Daily |
| 17. | European Drought Observatory | [69,70,71,72] | Regional | Drought category | Daily |
| Ref. | Deep Learning Model | Dataset | Study Area | Indices Used | Pros | Cons | Performance Evaluation Metrics |
|---|---|---|---|---|---|---|---|
| [73] | RNN | Data from stations around Iraq from 1950 to 2016 | Iraq | SPI6, SPI24 | Very low MSE and RMSE. | The paper uses an RNN whose performance can be improved by pre-training it with hybrid algorithms. | R2 = 1, MSE = 9.24 × 10⁻¹⁵, RMSE = 9.61 × 10⁻⁸ |
| [4] | Dynamic Models (Hybrid Model) | North China Plain, East Asian summer Monsoon, EI Niño-Southern Oscillation | China | SPI6 | The hybrid model slightly balances the statistical and dynamic models with a POD of 20% and a POF of 50%. | It is important to have an in-depth understanding of drought mechanisms, and it provides global and local modeling given the low PODs and high POFs in drought prediction. | RMSE = 0.7214 MAE = 0.6104 |
| [74] | Deep Belief Network consisting of two Restricted Boltzmann Machines | The Southwestern United States, with a total drainage area of 5400 km2 | Gunnison River Basin | Standardized Streamflow Index | Considering that the SVR model is implemented in addition to the DBN model, we might also use the DBN for pre-schooling and the SVR for the very last prediction in our destiny work. | However, its performance over the SVR was not as impressive. The DBN’s deep architecture cannot be fully utilized due to the lack of large sample sizes. | Feed Forward Back Propagation = −07367 |
| Cascade = 71.65 | |||||||
| Multi-Layer Perception = 85.61 | |||||||
| Time Delay = 88.21 | |||||||
| Recurrent = 92.77 | |||||||
| Radial Basis Function = 91.25 | |||||||
| Quantization = 75.95 | |||||||
| Elman = 94.72 | |||||||
| Probabilistic = 90.35 | |||||||
| Regression = 65.27 | |||||||
| [75] | LSTM | NCAR Community Earth System Model, from NASA’s Shuttle Radar Topography Mission (SRTM) | We recognize the significance of images transforming into applicable intensity, duration, and frequency curves for policymakers, stakeholders, and model planners. | We use the outputs from reanalysis records for auxiliary variables. Reanalysis datasets may not be used for the diverse consultant attention pathways (changed in CMIP6 using Shared Socioeconomic Pathways). Therefore, the ESM outputs from CMIP records have to be evaluated for downscaling. Decision day-by-day information is used because of the goal variable. | RMSE values | ||
| DJF = 2.38 | |||||||
| JJA = 12.78 | |||||||
| MAM = 4.03 | |||||||
| SON = 8.32 | |||||||
| [76] | DNN using MO-OLS | Corn-yield data | U.S.A. | Found to give more practical predictions when fared against DNNs without MO-OLS estimator. | When evaluating future yields under climate change, there is room to improve accuracy. | Out-of-pattern forecasting overall performance with 2006–2015 holdout: DNN-MSE = 0.103 DNN with MO-OLS-MSE = 0.065 | |
| [77] | MLP using Genetic Algorithm | Daily atmosphere temperature data | Kermanshah and Tabriz, Iran | This model outperformed three other NN models in comparison, demonstrating the influence of the GA algorithm. | The Wrapper method is employed for feature selection in the data preprocessing step, which, although efficient, is computationally expensive. | Tabriz— R2 = 0.946 RMSE—1.722 MAE = 1.391 | |
| Kermanshah—R2 = 0.971 RMSE = 1.77 MAE = 1.223 | |||||||
| [2] | LSTM, Gaussian Process Regression, Hybrid (GPLSTM-S1 and S2 model) | China Meteorological Science Data Sharing Service Network | Three-river headwater region, China | SPI | The two models were used for drought forecasting across eight stations of the THR region and successfully forecasted the SPI. They are useful for large regions. | The PLSTM-S1 has a good performance statistically, but is not stable. Hence, it is unsuitable for correcting predicted targets via postprocessing, and more input factors should be included. | GPLSTM-S2 scores for RMSE-0.76, MAE-0.62 RSE-0.70 |
| [79] | ANN, SVR, WNN | National Meteorological Services Agency is the data provider | Awash River Basin of Ethiopia | SPI-3 SPI-12 | ANN- manages non-linearity. Wavelet NN- handles non-stationary data well. | ANN- has limited capability in handling non-stationary data. WNN- has a constant change in the coefficient if the initial value is changed. | ANN- R2 = 0.9451, RMSE = 0.0610 and MAE = 0.0603 |
| WNN- R2 = 0.9534, RMSE = 0.0600 and MAE = 0.0536 | |||||||
| [80] | Classification and Regression Trees (CART) | Tegal, Central Java | Indonesia | KBDI | Focuses on temperature, humidity, and evaporation. | The accuracy could be further improved. | Accuracy = 0.913, Temperature data = 0.15, Humidity Data = 3.85, Rainfall Data = 8.61 |
| [81] | CV D-CNN RNN DNN D-GAN | Various Image datasets | NA | NA | D-CNN is more efficient and less computationally expensive. | Deep learning causes overfitting and the learning of unnecessary information. | NA |
| [82] | MLP NN | Selangor basin dataset | Selangor river basin, Malaysia | SPI-3 SPI-6 SPI-9 | Better for higher SPI. | Not suitable for Lower SPI. | SPI-3 R2 = 0.856, MAE = 0.46 RMSE = 0.56 |
| SPI-6 R2 = 0.92 MAE = 0.31 RMSE = 0.39 | |||||||
| SPI-9 R2 = 0.94, MAE = 0.28, RMSE = 0.34 | |||||||
| [6] | DBNPF | Dataset of Zunyi area of Guizhou Province | China | Environmental factors | Removes the local minima issue in NN, relatively more efficient than traditional methods. | Layer selection consumes more time. It has only been tested in a selected location, and the area has random data. | RMSE = 0.817 MAE = 0.494 |
| [22] | ANFIS | Tuban’s BPBD | Java, Indonesia | ANFIS performs better than ANN because ANFIS selects appropriate strong rules from past data, and ANFIS predicts the result faster than ANN. Hybrid ANN—Evolutionary Algorithm helps improve the quality of research or adds a hidden layer to ANN. | ANN from the learned knowledge cannot represent knowledge. FIS is not capable of inferring from a pattern. | ANN RMSE (Soko) = 0.09145 RMSE (Senori) = 0.1288 RMSE (Kerek) = 0.1194 | |
| ANFIS RMSE (Soko) = 0.01733 RMSE (Senori) = 0.01645 RMSE (Kerek) = 0.01714 | |||||||
| [83] | WNN | NOAA/AVHRR data from 2000 to 2009 | Guanzhong Plain, Shaanxi, China | PDI LST NDVI VTCI | None | Wavelet neural network prediction results are not up to the mark. There is a lack of clarity in texture, and it has low precision. | Errors reached the highest at 0.4 |
| [84] | GADMFS | The monitoring component gives global historical drought severity data | USA | NA | It is essential in acquiring, managing, and circulating draught information related to agricultural activities. | It can only be used by developed nations presently. | NA |
| [9] | ANN with GAO, SSA, BBO | Iran’s Water Resources Management Company | Dez Dam, Iran | SPI-1 SPI-3 SPI-6 SHDI-1 SHDI-3 | The hybridized model performed better than the ANN model, and among the optimization algorithms, PSO has the best performance in the optimization algorithms. | Black-box model, training is time-consuming. | Best Model SHDI1 R2 = 0.68 RMSE = 0.58 |
| SHDI3 R2 = 0.81 RMSE = 0.45 | |||||||
| SHDI6 R2 = 0.82 RMSE = 0.40 | |||||||
| [11] | MLP and SVR | India Meteorological Department | 12 cities in Maharashtra, India | 9 meteorological factors | The Multi-Layer Perceptron and one-dimensional Convolutional Neural Network, which forecasts rainfall 1–5 days prior for better evaluation. | The performance begins to fall slowly as the number of days for lead time increases. | Varying in various cities |
Disclaimer/Publisher’s Note: The statements, opinions and data contained in all publications are solely those of the individual author(s) and contributor(s) and not of MDPI and/or the editor(s). MDPI and/or the editor(s) disclaim responsibility for any injury to people or property resulting from any ideas, methods, instructions or products referred to in the content. |
© 2023 by the authors. Licensee MDPI, Basel, Switzerland. This article is an open access article distributed under the terms and conditions of the Creative Commons Attribution (CC BY) license (https://creativecommons.org/licenses/by/4.0/).
Share and Cite
Gyaneshwar, A.; Mishra, A.; Chadha, U.; Raj Vincent, P.M.D.; Rajinikanth, V.; Pattukandan Ganapathy, G.; Srinivasan, K. A Contemporary Review on Deep Learning Models for Drought Prediction. Sustainability 2023, 15, 6160. https://doi.org/10.3390/su15076160
Gyaneshwar A, Mishra A, Chadha U, Raj Vincent PMD, Rajinikanth V, Pattukandan Ganapathy G, Srinivasan K. A Contemporary Review on Deep Learning Models for Drought Prediction. Sustainability. 2023; 15(7):6160. https://doi.org/10.3390/su15076160
Chicago/Turabian StyleGyaneshwar, Amogh, Anirudh Mishra, Utkarsh Chadha, P. M. Durai Raj Vincent, Venkatesan Rajinikanth, Ganapathy Pattukandan Ganapathy, and Kathiravan Srinivasan. 2023. "A Contemporary Review on Deep Learning Models for Drought Prediction" Sustainability 15, no. 7: 6160. https://doi.org/10.3390/su15076160