Article

Using the Morgenstern–Price Method and Cloud Theory to Invert the Shear Strength Index of Tailings Dams and Reveal the Coupling Deformation and Failure Law under Extreme Rainfall

College of Environment and Resources, Xiangtan University, Xiangtan 411105, China
*
Author to whom correspondence should be addressed.
Sustainability 2023, 15(7), 6106; https://doi.org/10.3390/su15076106
Submission received: 21 February 2023 / Revised: 23 March 2023 / Accepted: 30 March 2023 / Published: 31 March 2023

Abstract

:
It is difficult to obtain reliable shear strength parameters for the stability analysis and evaluation of tailings dams in an unstable state. In this study, the sensitivity of the shear strength index to the safety factor of a tailings dam was evaluated. The cohesion C range of a tailings earth rock dam in an unstable state is determined by the safety factor, and the Morgenstern–Price method is used for inversion. During parameter inversion, uncertainty reasoning is established based on cloud theory, which overcomes the problem that the fuzziness and randomness of the quantitative cohesion value are transferred to the qualitative concept of the safety factor. The results show that the change in cohesion C has a greater influence on the safety factor Fs of the tailings dam, and the value of parameter inversion is 8.6901 kPa. The deformation and failure of tailings dams under extreme rainfall conditions are analyzed by using the modified cohesion C value. The dam toe becomes the main response area of plastic deformation and slowly expands to the interior, showing creep deformation. The displacement field gradually transfers from the accumulated tailings to the tailings dam with the flow direction, causing erosion damage. This study provides a new idea and method for parameter inversion of the shear strength index of tailings dams and provides a reference for the disaster prediction and prevention of tailings dams subjected to extreme rainfall.

1. Introduction

Tailings are a mixture that is difficult to manage and can pollute the environment [1]. Due to the unilateral consideration of economic benefits by mineral enterprises, most tailings have not been used sustainably, and China’s comprehensive utilization rate of tailings is only 37%. At present, the cumulative stacking volume of tailings in China has exceeded 19.5 billion tons; in contrast, due to concerns about sustainable development and accident prevention, there are currently fewer than 10,000 tailing sites in China, and most of them are “small” [2]. Therefore, the problem of stockpiling a large number of tailings is very prominent [3]. Considering safety and land use problems, the vast majority of small tailings ponds are often located in remote mountainous areas with few people. As one of the important environmental protection structures of tailings ponds, tailings dams usually surround the narrow valleys of steep slopes, covering the continuously accumulated tailings to prevent tailings from leaking out and polluting the environment [4]. Due to the unreasonable site selection, nonstandard designs, and poor meteorological conditions of small tailings ponds, the probability of tailings dam failure is high. Dam failure will not only cause irreversible toxic and harmful substances in the tailings to enter the surrounding environment but also break the sustainable state of the original environment of the tailings dam [5]. From the start of a mine to the end of production, a tailings dam undergoes changes [6]. Research has shown that the impact of rainfall accounts for approximately a quarter of the total number of tailings dam destabilization incidents [7]. This has caused many major accidents all over the world [8], including the Fenxinta mining tailings pond in Shanxi Province, China. The accident discharge capacity was 268,000 m3, which affected the office buildings, markets, and some residential buildings of the mining area about 500 m downstream, resulting in 277 deaths, 4 missing, and 33 injured, with direct economic losses of CNY 96.192 million [9]. In the red mud storage yard of the Ajkai alumina plant in southwest Hungary, 1,000,000 m3 of red mud leaked into at least 7 villages, resulting in 4 deaths, 3 missing, and more than 150 injured. Finally, red mud began to flow into the Danube River, and the spread of red mud along the river triggered panic in many European countries [9]. On 5 November 2015, the dam of the Fundão tailings pond in Minas Gerais, Brazil, collapsed. 45 million cubic meters of toxic sludge flowed into nearby rivers and oceans. The accident had a devastating impact on the local river basin. A total of 19 people died, and about 700 were homeless. The water source for hundreds of thousands of people has been polluted, and a large number of wild animals have died [10]. Therefore, the deformation and destruction of the tailings dam caused by rainfall seriously threaten the sustainable operation of the tailings pond and the life and property safety of the surrounding residents and staff [9,11,12]. Thus, this article further explores tailings dam stability and accident disaster control.
The determination of the shear strength index of tailings dams plays a key role in analyzing their stability [13,14]. Inversion analysis is a method that typically uses known or measurable parameter data to backwardly infer the unknown state parameters of a target [15]. Due to the interference of soil rock characteristics, sampling, tests, and other factors, the results of the shear strength parameters obtained from the test are not completely accurate; there is some ambiguity, and it is difficult to quantify the stability of tailings dams. Second, due to limited manpower and material resources, the shear strength parameters of the whole research area cannot be summarized uniformly by the on-site samples. Because shallow sliding has occurred in tailings dams, the safety coefficient range of a tailings dam is assumed, and the shear strength index of the potential sliding surface is inversely calculated. The parameter inversion method can comprehensively consider the influence of various geological factors and incorporate the lack of external factors into the back-calculation of shear strength parameters, making the stability analysis of tailings dams more realistic. It has become a trend to use the parameter inversion method to solve the shear strength index. Lin et al. used the rigorous and accurate Morgenstern–Price method to obtain the safety factors of slopes in different regions under the limit state and then obtained the shear strength index of different height regions through the parameter inversion method [16]. However, a single inversion method does not solve the problems of slope stability and parameter ambiguity and uncertainty. In tailings dam stability judgment, the method of using on-site observations and judgement is subjective and arbitrary and cannot classify all kinds of uncertainty and fuzzy characteristics [17]. Second, considering the fuzzy transfer between the qualitative concept of the tailings dam safety factor and the quantitative value of the shear strength parameter, it can be considered that the parameters to be inverted are uncertain [18,19]. The evaluation description of these characteristics is essentially an uncertain reasoning, which lays the foundation for real and reliable model parameters [20]. For uncertainty and fuzzy processing evaluation, Li et al. proposed the concept of cloud models [21]. This model can realize the mutual conversion between qualitative concepts and quantitative values. It not only effectively prevents the shift of fuzziness but also has a more powerful expression ability and adaptability to the uncertainty of a single type of inversion problem [22]. Wang et al. proposed a model of cloud theory combined with mathematical evaluation for various fuzzy and correlation indicators involved in slope stability evaluation, which better reflects the random fuzzy distribution characteristics of measured data in the interval and is more accurate than the one-dimensional normal model [23]. Wang et al. established a new comprehensive evaluation and inversion model based on normal cloud theory for tunnels in karst areas [24]. Through systematic analysis of multiple influencing factors for water inrush, it was found that the normal cloud model was more accurate and the risk classification of water inrush prediction was feasible. It can not only meet the requirements of tunnel engineering but also be extended to various applications. Yao et al. established a multi-level fuzzy evaluation index system [25]. The cloud model theory is introduced to improve the importance scale and membership degree involved in the evaluation process, and a multi-level fuzzy comprehensive evaluation method of landslide risk improved by the cloud model is proposed. The results show that the improved cloud model can solve the uncertainty problem in the process of landslide preparation and occurrence and provide an effective reference for the prevention of landslide disasters.
Therefore, it is necessary to further explore a new inversion method based on the combination of cloud theory and the Morgenstern–Price method to overcome the fuzziness and randomness of parameter indices.
The trend of global warming is obvious, and the rise in temperature promotes more water vapor in the air [26]. According to meteorological data statistics, the precipitation level in northern China in 2021 was the second highest in history, and the rainfall was robust and extreme. On 20 July alone, Zhengzhou’s one-hour rainfall reached 201.9 mm and broke the single-hour rainfall record of 2418 national meteorological stations in mainland China. In the future, the global average temperature may reach a higher level, and extreme rainfall may become more frequent and violent [27,28]. At present, the vast majority of tailings dam materials are banket and rockfill [29,30]. Although they have natural advantages, such as simple structures, easy-to-obtain raw materials, and convenient construction and maintenance, they can be affected by pressure from extreme rainfall at any time [31,32,33,34]. The rainwater seeps into the unsaturated rock and soil mass of the tailings dam, which accelerates the evolution of deformation and damage inside the rock and soil mass of the tailings dam [35,36]. This deformation destruction is not only difficult to observe accurately on site but also hides risks to the safe operation of the tailings dam and even the tailings [37]. Hu et al. used the instrumental sink and artificial simulation of natural rainfall as experimental methods to describe the process of destruction and destructive evolution of a tailings dam [38]. Their results showed that rainfall infiltration promotes internal erosion and leads to a reduction in the shear strength of the tailings materials so that the dam models move closer to liquefaction. They also found that the destruction of a tailings dam could be categorized as gradual destruction or sudden collapse. Xu et al. assessed the deformation damage of earth and rock dam slopes with vibration-induced fissures by rainfall and found that the adverse phenomenon of soil displacement on earth and rock dam slopes containing fissures was more pronounced in the rainfall condition, with steeper bumps at the shoulder of the slope and larger landslide accumulation areas due to rainfall erosion [39]. Tian et al. conducted model experiments of upstream-type tailings dam failure and found that the development of tailings earth and rock dam failure was mainly caused by longitudinal undercutting and horizontal expansion due to water erosion and observed the evolution of tailings dam failure and tailings seepage flow [40].
At present, the method of establishing a similar model experiment is generally used to study the deformation and failure of tailings dams subjected to extreme rainfall. However, due to the complex environment of the project and the poor accuracy of human control conditions, certain experimental results are inaccurate. Numerical simulation technology has been widely used in the field of engineering research [41,42]. It can better simulate the actual rainfall method and boundary conditions. The simulation results can more accurately reflect engineering practice. Qiu et al. used numerical simulation methods to study the slope infiltration characteristics under rainfall and observed that the transient saturation zone of a soil slope changes with the change in rainfall time [43]. The rainfall failure mode is shallow partial slope sliding, which is basically consistent with the slope sliding after actual rainfall. Khan et al. simulated the deformation and failure of accumulated coal gangue under long-term rainfall [44]. Their research showed that the maximum displacement and deformation occur near the slope top and gradually increase with rainfall, with the progressive displacement in the X direction making up the main contribution to the total displacement. Zhou et al. conducted a numerical simulation study of a rainfall-induced landslide of an earth and rock dam in Chongqing, and the results showed that the landslide accumulation of the earth and rock dam due to rainfall reacts violently under rainfall induction, and the occurrence of local collapse still exists after the landslide disaster, which can produce secondary landslides [45]. Wu et al. used numerical simulation to analyze a shallow loess dam slope landslide disaster in Sichuan Province in 2020 [46]. The study found that the minimum rainfall that caused the landslide disaster was 177.2 mm, and the infiltration of rainwater and ice and snow melt water was the main reason for inducing the dam slope landslide. In summation, most of the current studies have mainly focused on the stability of tailings dams under rainfall conditions, but the rules of coupling deformation and deformation for a tailings dam subjected to extreme rainfall need to be further revealed, especially for the tailings earth rock dams widely existing in remote mountainous areas. On the other hand, in view of the defects of field observations and the shortcomings of the Morgenstern–Price inversion analysis method, this paper attempts to propose a new uncertainty cloud reasoning model that combines the Morgenstern–Price method to effectively describe the uncertainty in its analysis and improve the accuracy of inversion results. It is expected to provide a theoretical reference for the sustainable operation of tailings dam environments in mountainous areas and the prediction of accident disasters [47,48].

2. Methodology

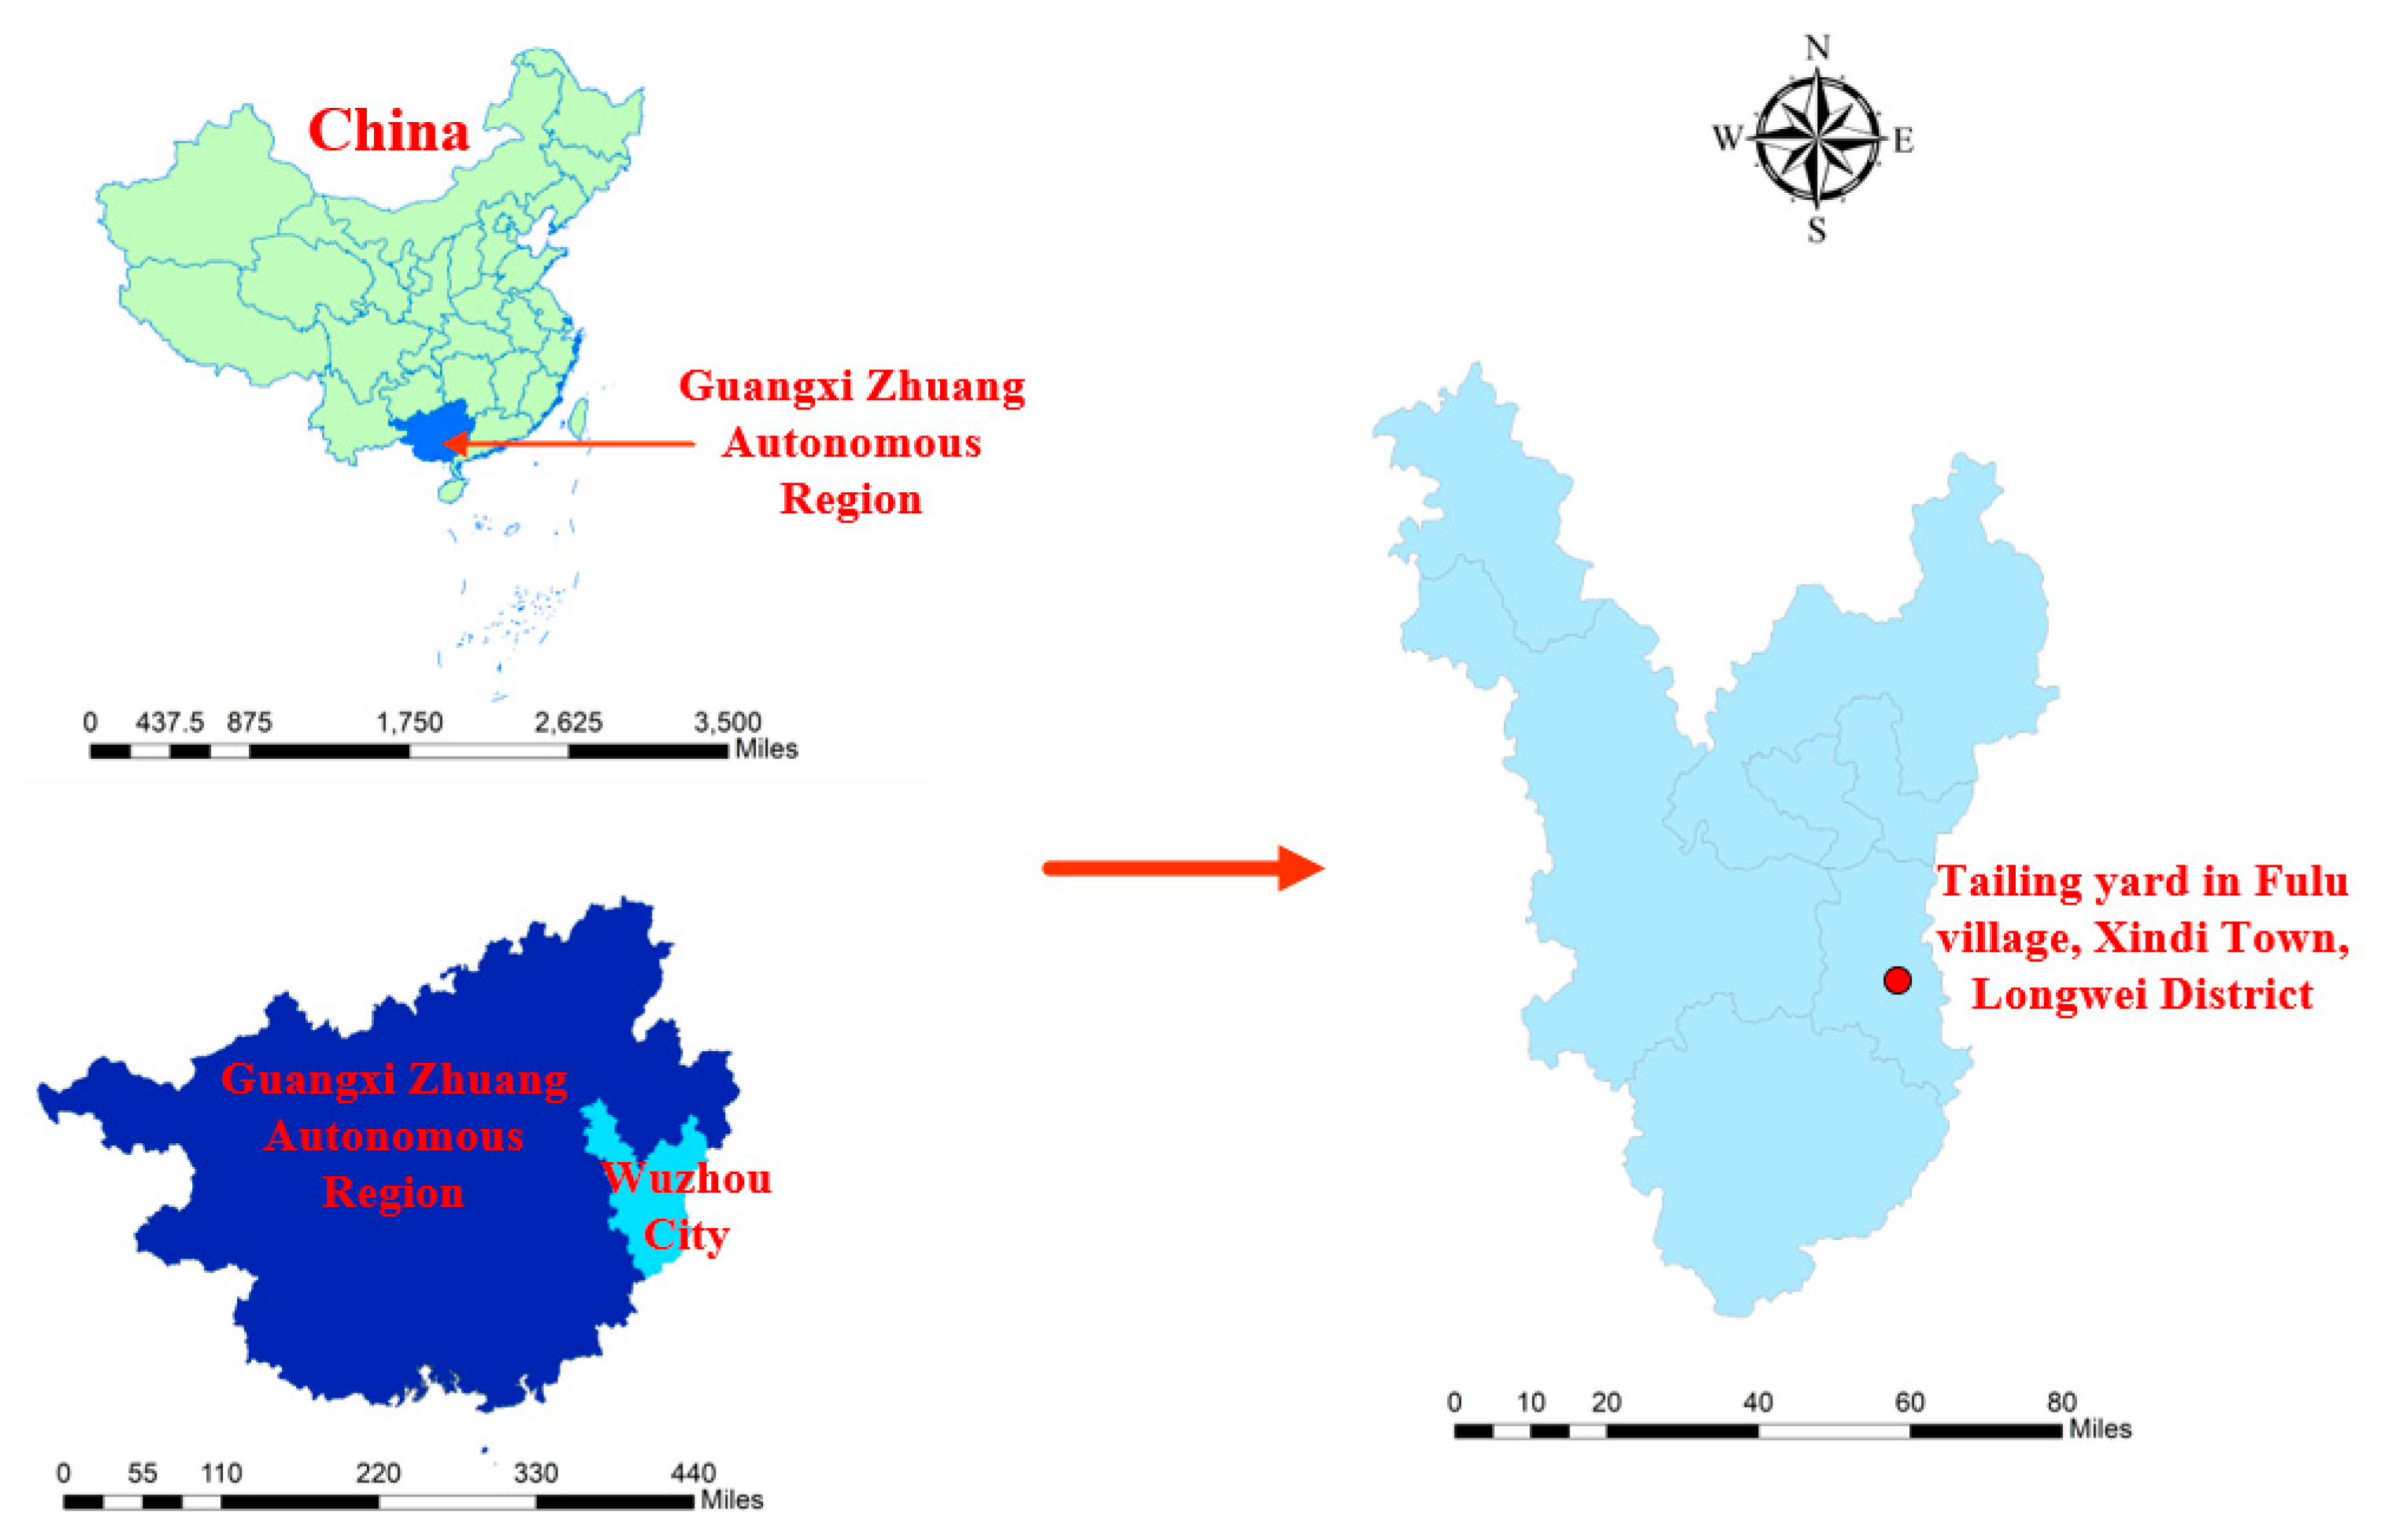
2.1. Engineering Background

2.1.1. Engineering Geological Conditions of the Tailings Stacking Field

The research site is located in Fulu Village, Xinji Town, Longxian District, Wuzhou City, Guangxi Zhuang Autonomous Region, China. The locations of the dry tailings stocking yard are shown in Figure 1. The study area is a low hilly landform with steep terrain and few nearby residents. The climate belt is subtropical, the climate is mild, and rainfall is abundant. The tailings yard is used to build a residue dam with soil and stones that surrounds the narrow groove valley in a north–south direction, and the tailings are piled up. The tailings are mainly quartz with small amounts of feldspar, calcite, and sericite.

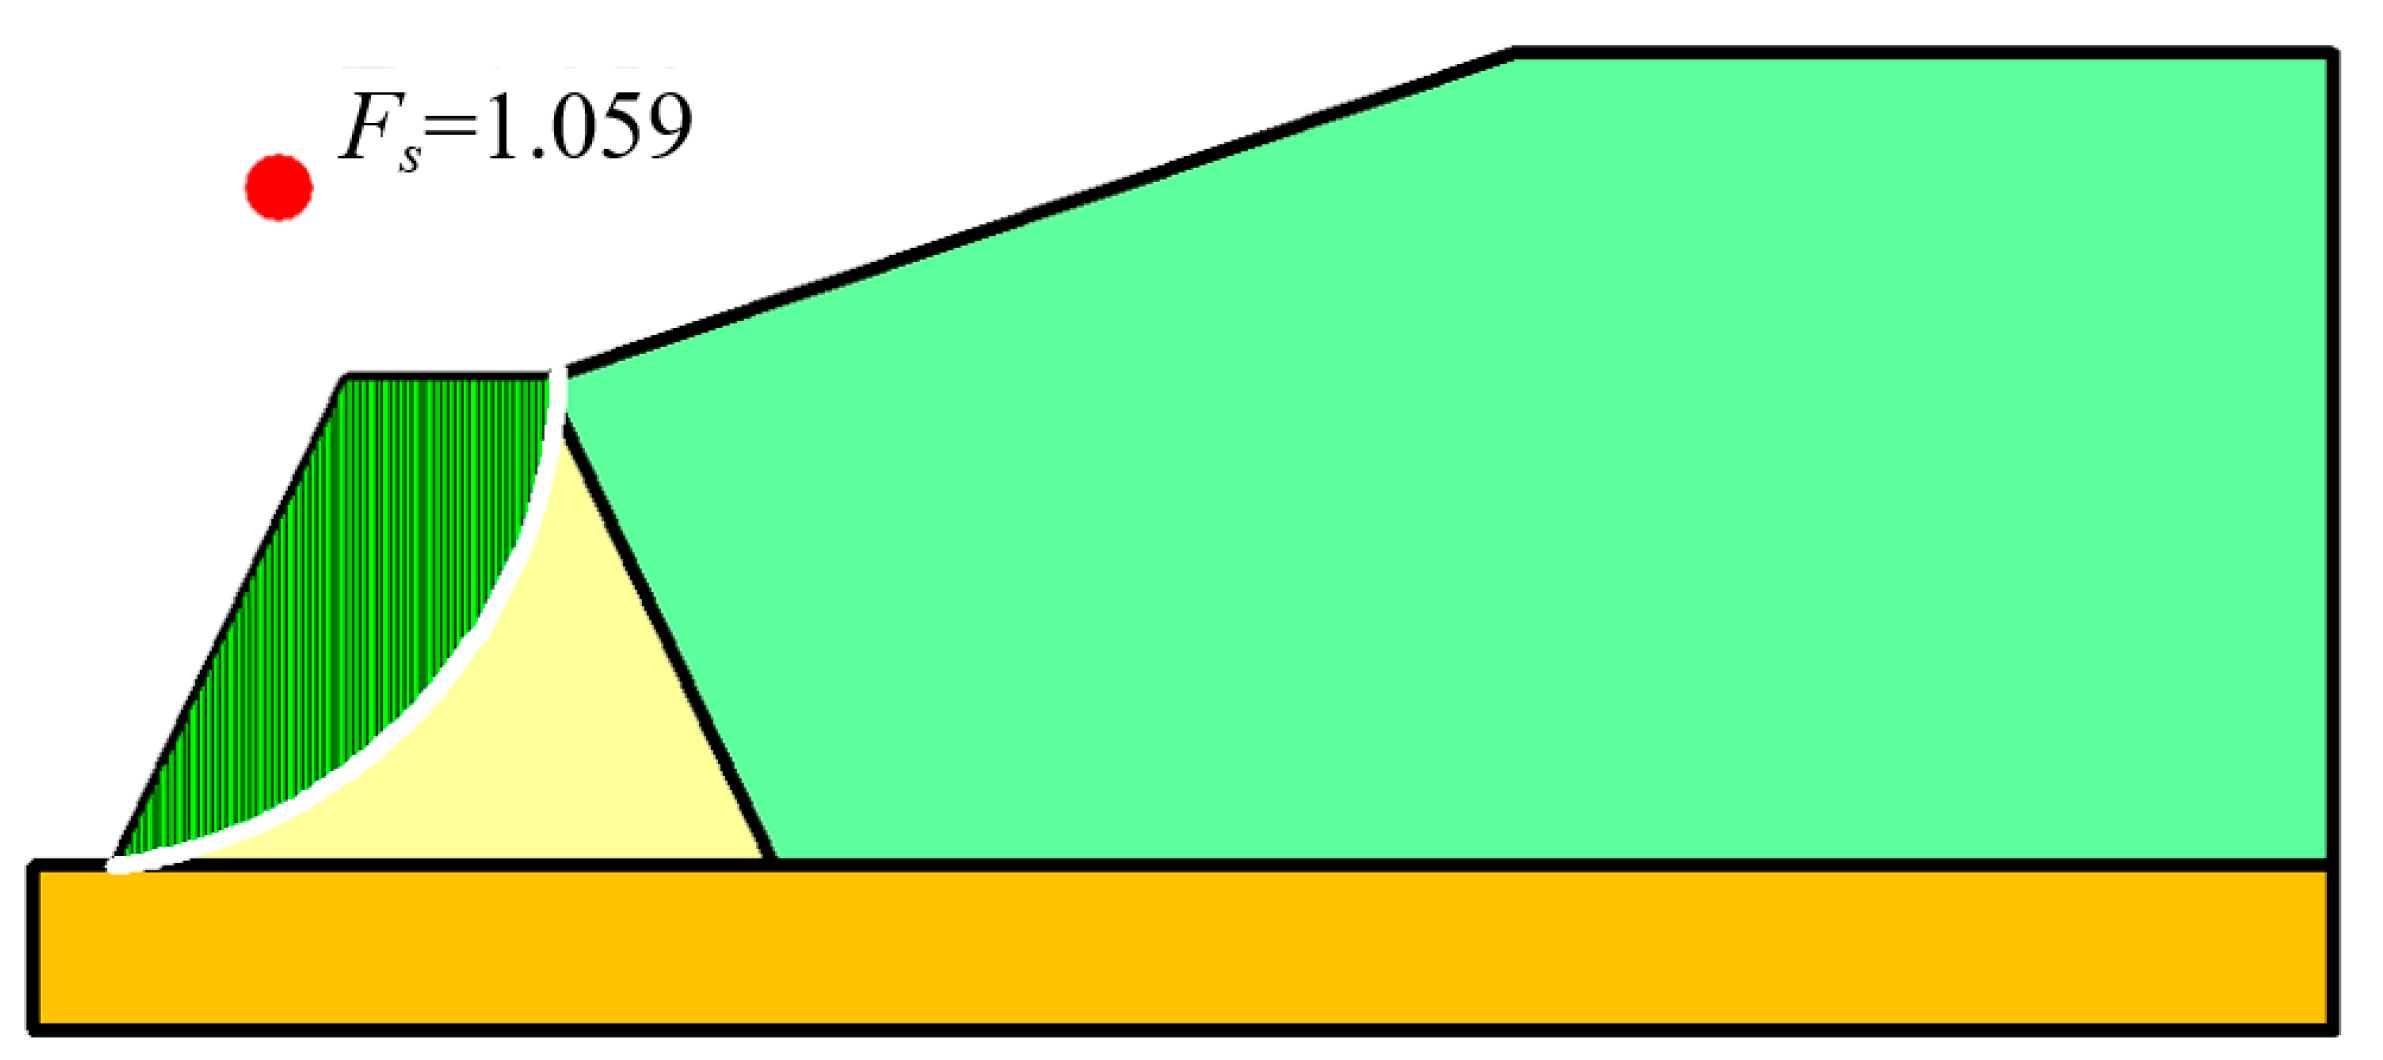
2.1.2. Judgement of the Unstable State of the Tailings Dam

Through field investigation, an overall stable tailings dam with a shallow slope-faced stacked gravel soil has shown signs of slippery soil, as shown in Figure 2. Considering that the tailings dam is in an unstable state, the shear strength parameters of the tailings dam may have changed; therefore, an inversion analysis of the shear strength parameters is needed.

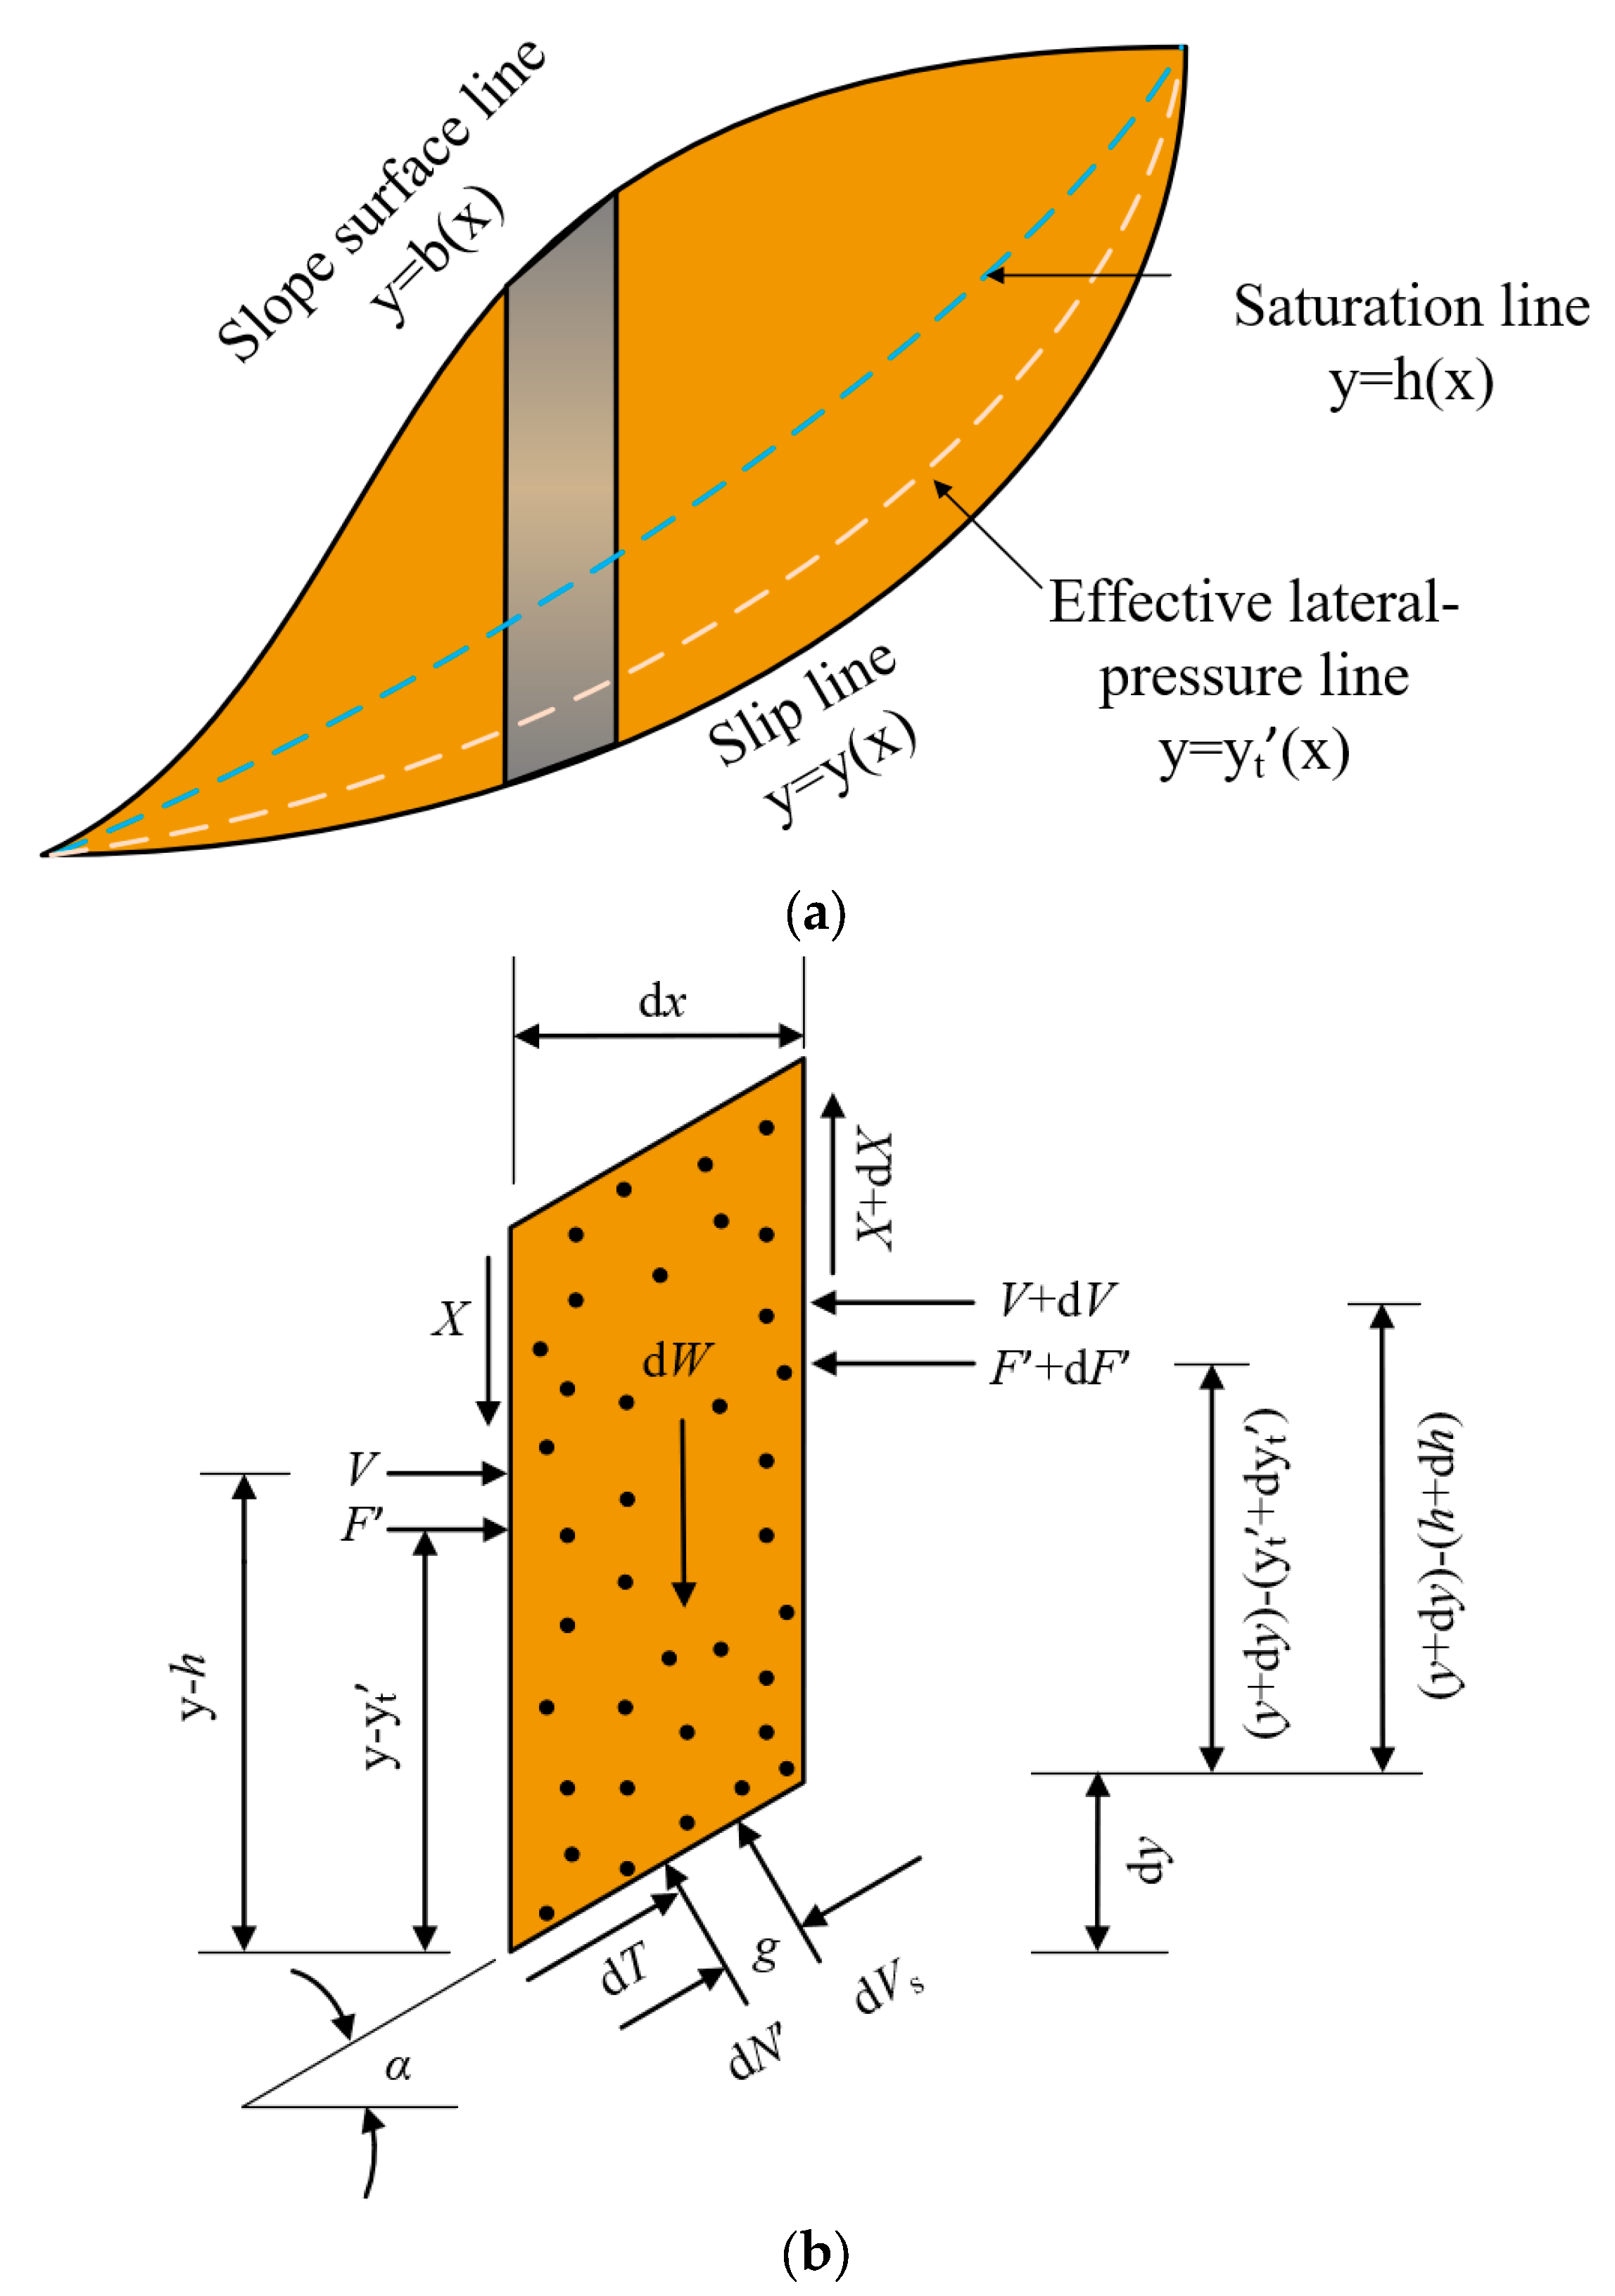
2.2. Morgenstern–Price Method
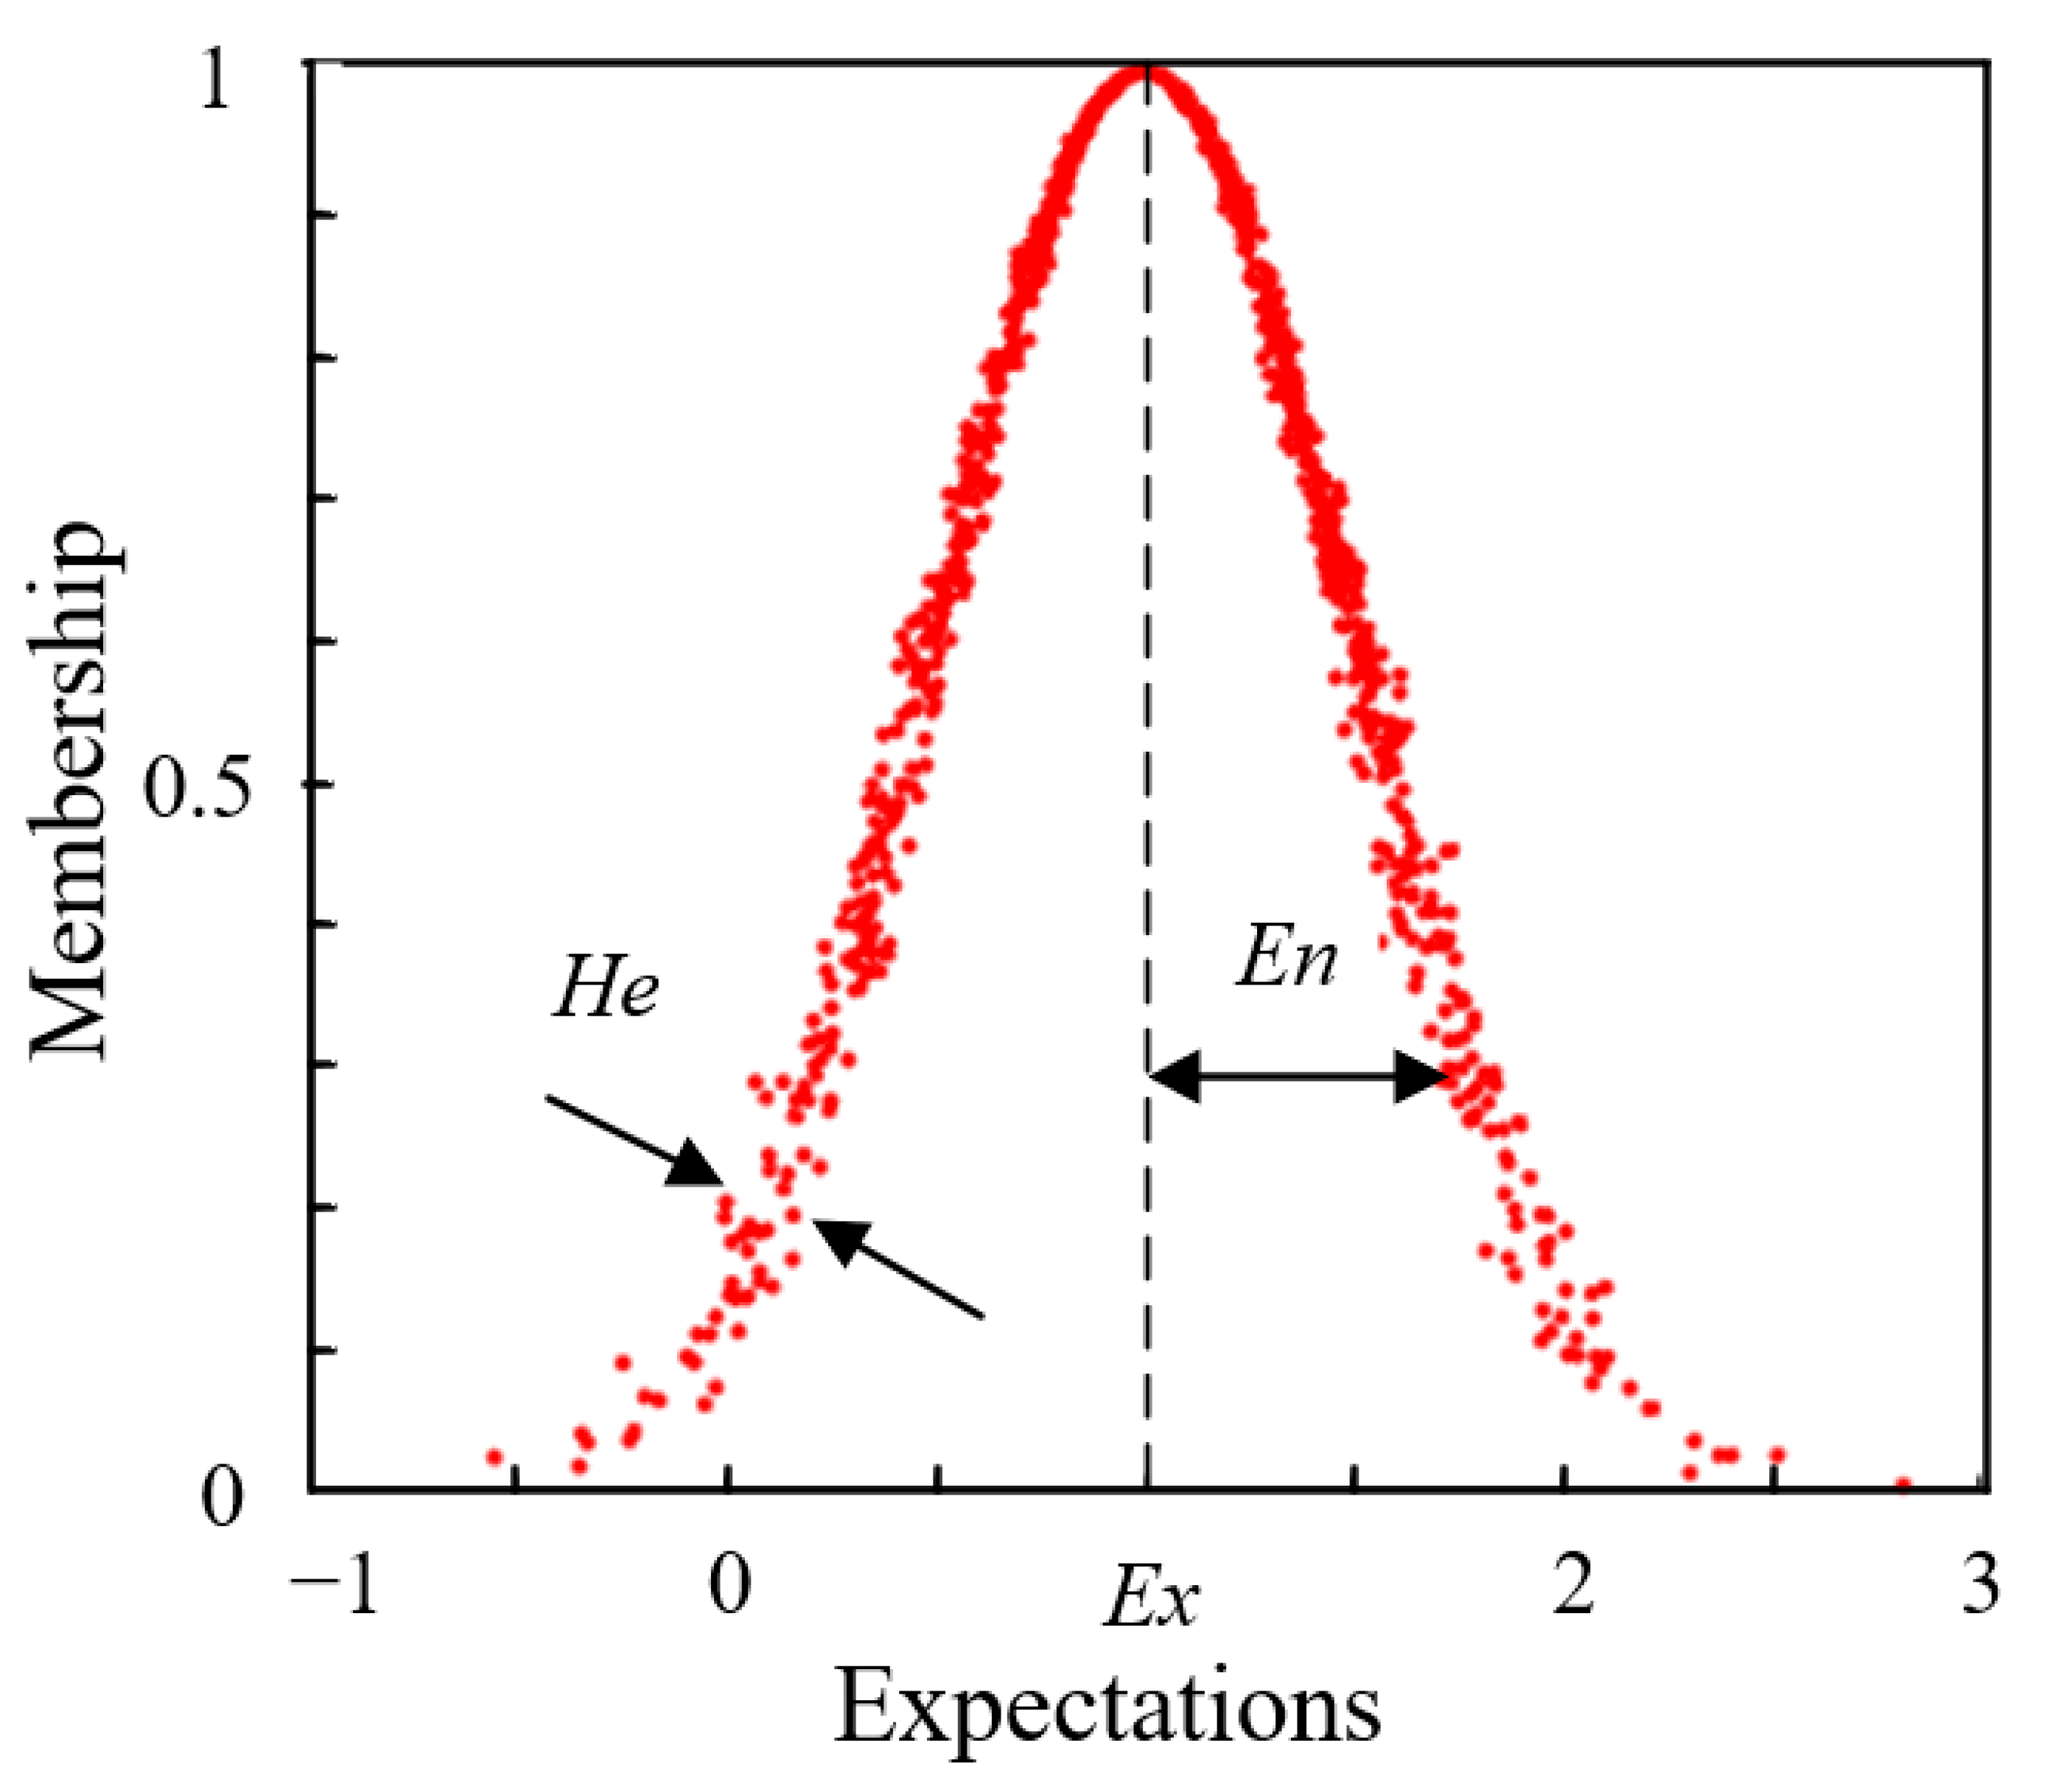
The Morgenstern–Price method simultaneously meets the differential equation form of forces and moments in balance [49]. It is a rigorous slope stability analysis method recognized by the international community. This method assumes a functional relationship between two adjacent soil bars normal to the interbar forces as a function of a pair of horizontal directional coordinates and then solves the problem based on the boundary conditions of the entire sliding soil body [50]. As shown in Figure 3a, the slope surface line is represented by the function y = b x ; the saturation line and effective lateral-pressure line are represented by y = h x and y = y t x ; y = y x indicates slip line.
Select any of the soil strips above the sliding surface for force analysis, as shown in Figure 3b, and use the total normal force to replace the effective normal force, as shown in Formula (1):
F = F + V
The location of the total normal stress point y t can be found from Formula (2):
F y t = F y t + V h
F and X must have functional relationships (3) about x :
X = λ f x F
where λ is an arbitrary constant.
For any soil strip, because Δ x can be taken as very small, y = b x ,     y = c x , y = y x and f x are basically a straight line within the soil strip. In each soil strip, there are Formulas (4)–(6):
y = A x + B
d W d x = z x + q
f = k x + m
where A ,   B ,   z ,   q ,   k , and m are any constants. This can be determined through geometric relationship conditions and f x type characteristics.
Take the distance between the force acting on the soil strip and the midpoint at the bottom of the soil strip and establish the differential equation of the moment of balance (7):
X = d d x F y t y d F d x
According to the definition of Mohr–Coulomb theory and the safety factor, the pore pressure ratio R u is added to establish the differential equations of force balance in the direction of the soil strip and bottom normal direction. The pore water pressure coefficient Ru is the ratio of the pore water pressure in the soil to the self-weight of the soil.
Combining the left and right boundary conditions of each differential soil strip, the Formula (7) is integrated from xr to xr + Δx intervals so that the normal inter-slice force F can be obtained from F1 to Fn one by one, and then the tangential inter-slice force X of each block can be obtained.
F r + 1 = 1 L + K Δ x F r L + N Δ x 2 2 + P Δ x
where
K = λ k t a n φ 1 F s + A
L = λ m t a n φ 1 F s + A + 1 A t a n φ 1 F s
N = z t a n φ 1 F s + A R u 1 + A 2 t a n φ 1 F s
P = C 1 F s 1 + A 2 + q t a n φ 1 F s + A R u 1 + A 2 t a n φ 1 F s
where φ 1 is the effective internal friction angle of the soil and C 1 is the effective internal agglomeration of the soil. It is worth mentioning that since there is no inter-slice force at the ends of the landslide mass, there must be F 0 = F n = 0 for the first and last soil strips F0 and Fn of the whole landslide mass.
Additionally, the moment on the side of the soil strip can be integrated by Formula (6) to obtain Formula (13):
M r + 1 = F r + 1 y y t r + 1 = x i x r + 1 X F d y d x d x
Moment Mn on the side of the last soil strip must also satisfy the following condition:
M n = x 0 x n X F d y d x d x = 0
To find the value of λ and F S that meets all the equilibrium equations, the values of λ and F S must be assumed first, and then the points are performed one by one to obtain   F n and M n until F n = 0 and M n = 0 . In the end, the security factor Fs can be obtained.

2.3. Cloud Theory

The cloud model theory was proposed by Chinese scholar Li Deyi and comprehensively combined the characteristics of uncertain numerical language [21]. It is a method used to describe the concept of uncertainty. Cloud models can combine the fuzziness and randomness of things, determine the degree of correlation between the confirmation, and form a mapping of quantitative values and qualitative concepts; the main applications of expectations (Ex), entropy (En), and hyperentropy (He) are used as a whole to represent a concept [51,52]. Expectations (Ex) are the center of gravity in the cloud image, which is the most representative digital feature. Entropy (En) describes the degree of vague concepts, representing the range of cloud droplets and the degree of discreteness; hyperentropy (He) is an uncertain measure for entropy (En), usually representing the thickness of the cloud [53]. The feature figure of the cloud model is shown in Figure 4.
The construction steps of the parameter inversion of the shear strength parameters of the tailings dam based on the uncertainty cloud theory are shown in Figure 5.

2.4. Rainfall Conditions

The short-term heavy precipitation has become an important early warning indicator of the rain disaster in China. Since 2022, in order to adapt to frequent short-term extreme rainfall weather and further improve the accuracy and standardization of rainfall early warning signals, meteorological departments at all levels in China will increase thunderstorm (storm) and gale early warning signals according to local actual conditions and incorporate 1 h rainfall intensity into rainstorm early warning signal standards. Therefore, the simulated rainfall time is set at 1 h. The rainfall intensity is calculated according to the Investigation and Calculation Chart of Rainstorm Runoff in the Guangxi Zhuang Autonomous Region (1984). According to the table, the maximum hourly point rainfall at the research site is H = 48 mm, and the hourly rainstorm parameter (CS/CV) is 1.92. Then, the hourly rainfall can be calculated using Formula (15):
i = H × C s C v = 48   mm h × 1.92 = 92.16   mm / h
This can be considered a severe rainstorm. As extreme rainfall is characterized by a short duration, high intensity, and strong locality, the rainfall duration is set at 1 h.

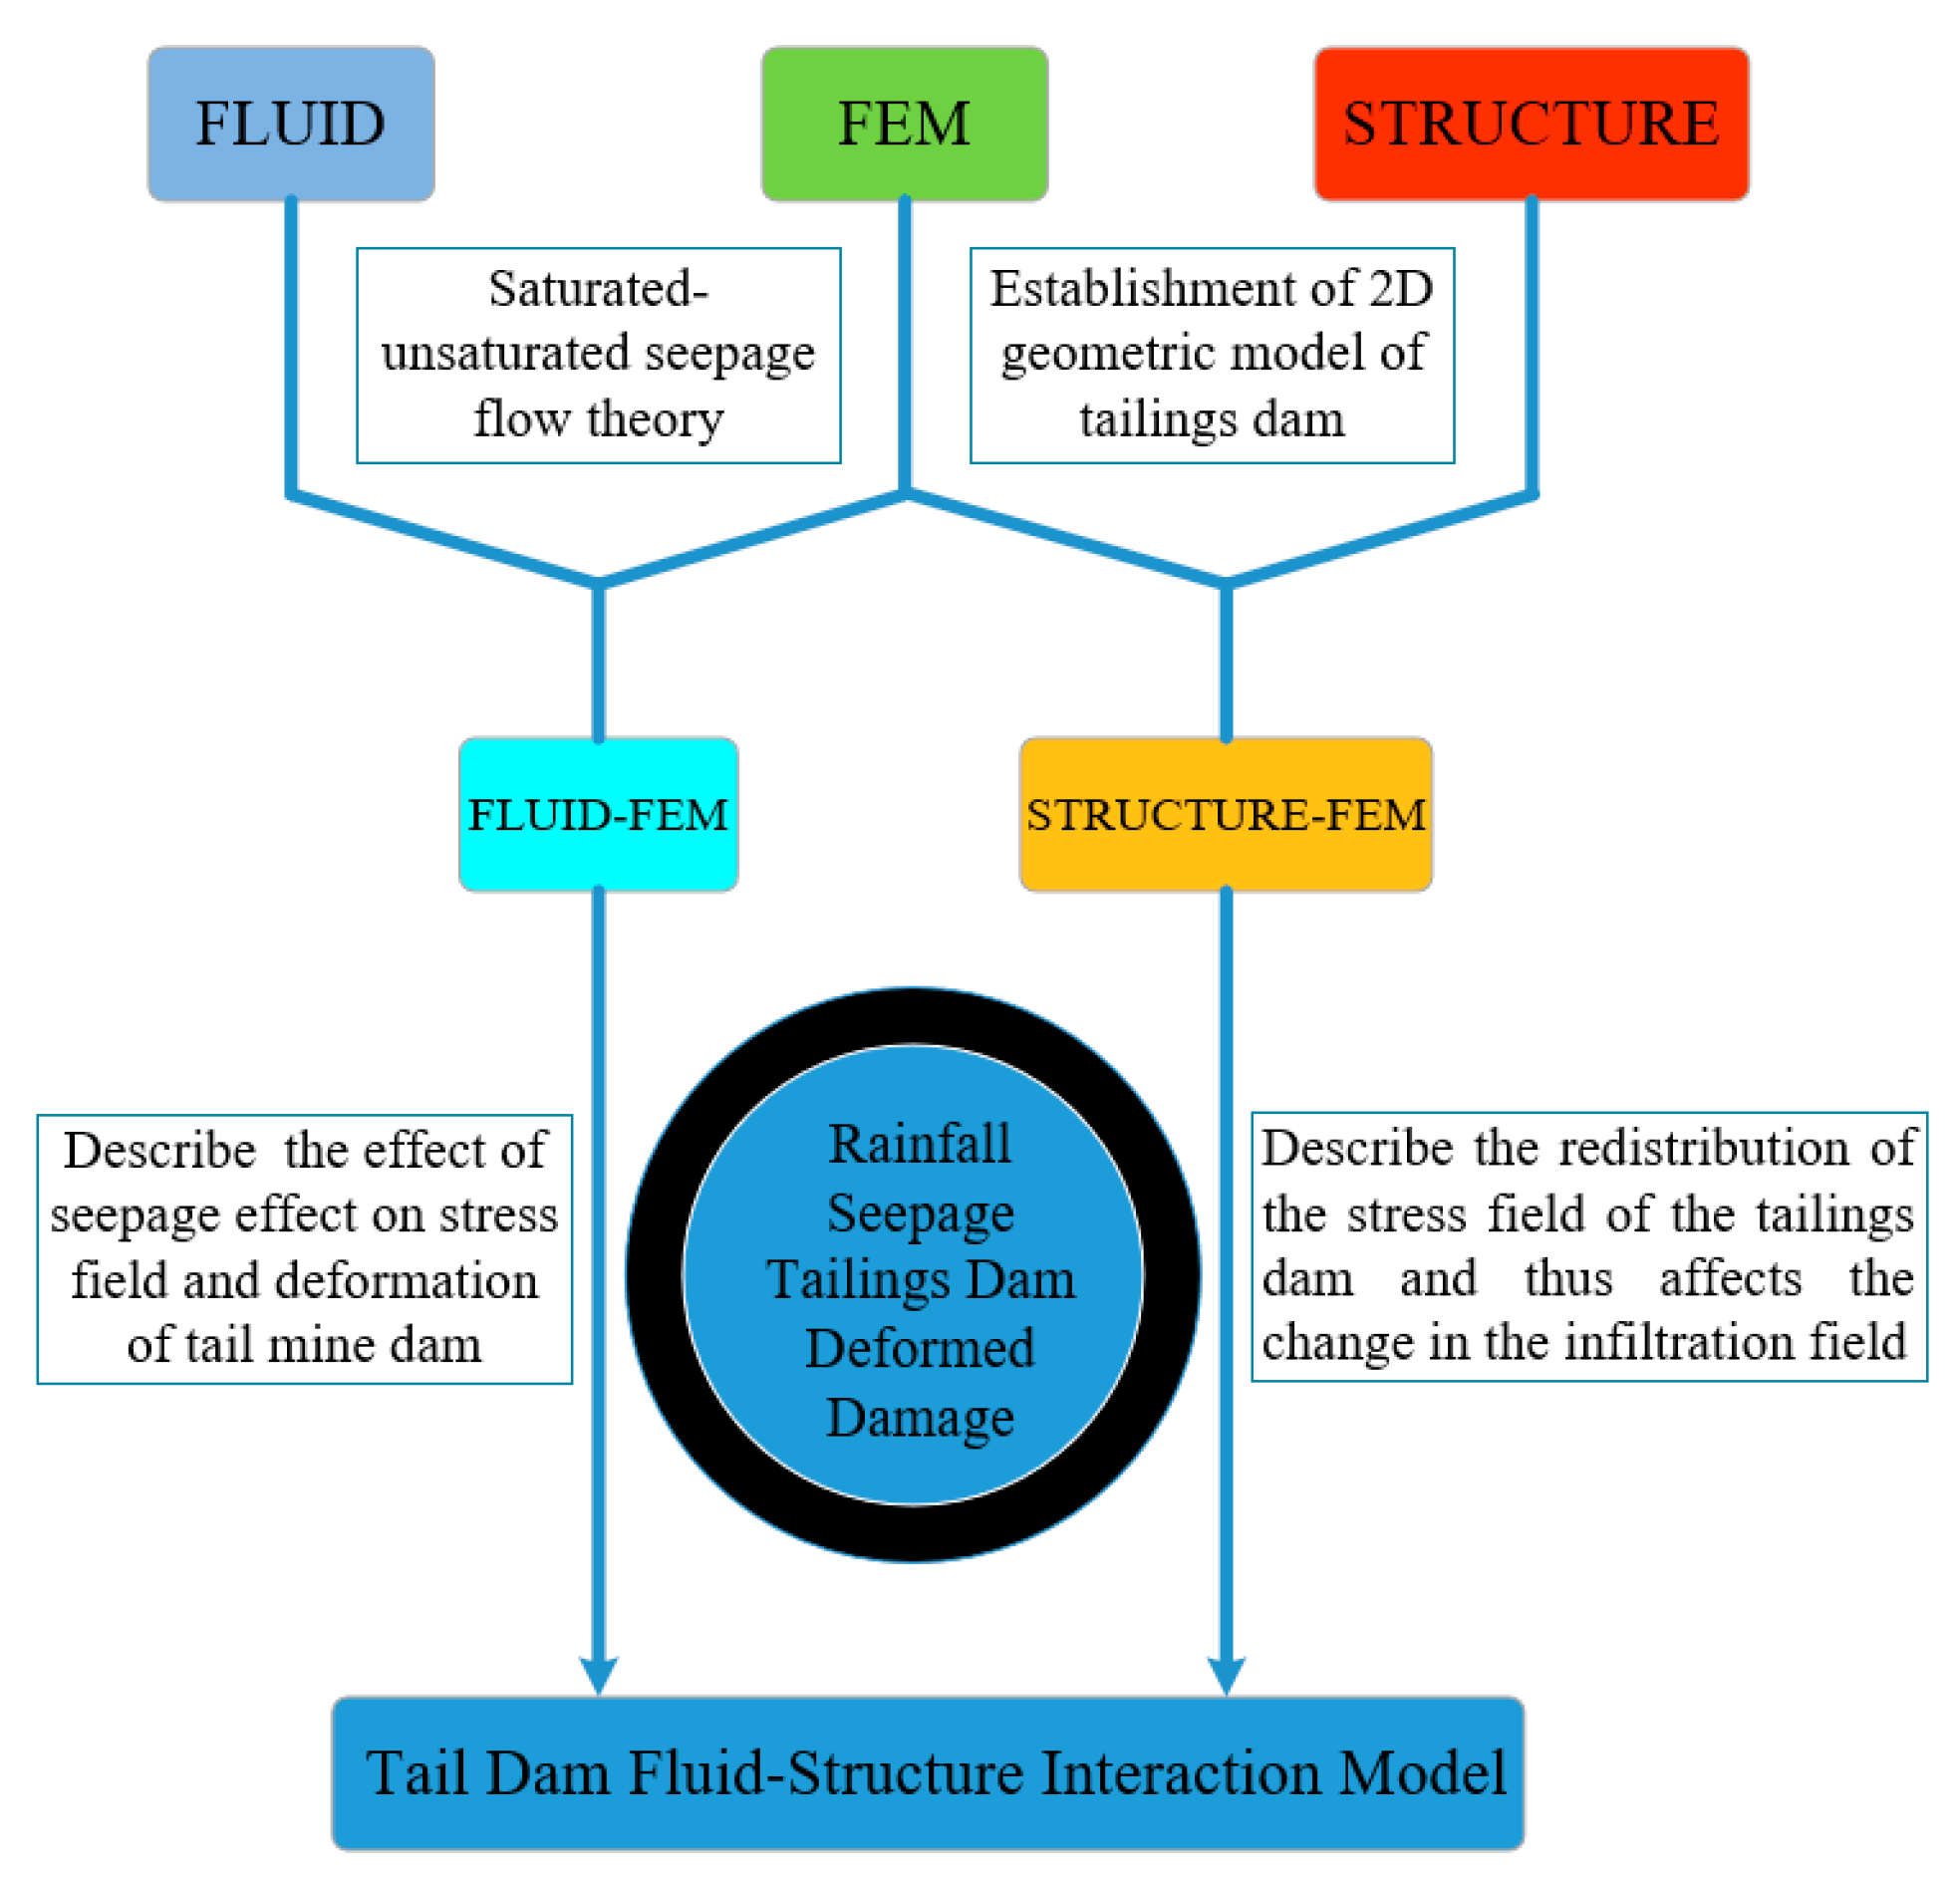
2.5. Theoretical Model Construction

Under rainfall conditions, the compression of solid particles and liquid water is not considered, and the Richard equation is used to describe the unsaturated flow of water in porous media, as shown in Formula (16):
Q m = ρ C m ρ g + S e S p t + g ρ K s μ k r p + ρ g D
p is pore pressure, Se is effective saturation, S is water storage coefficient, Cm is water capacity, ks is saturated permeability, µ is fluid dynamic viscosity, kr is relative permeability, ρ is fluid density, g is gravity acceleration, D is location head, and Qm is the mass source.
When considering the coupling effect of soil seepage and stress, the effect of solid deformation on pore seepage should be considered, such as in Formula (17), which affects the continuity equation of fluid flow in the form of volume strain [54]:
Q m = ρ C m ρ g + S e S p t + β ε v t + g ρ K s μ k r p + ρ g D
εv is the volume strain of the medium, and β is the Boit coefficient. The second item on the right in Formula (17) is the effect of deformation of soil particles on pore water seepage. This is the coupling term of stress and seepage. It is also the effect of stress on pore pressure.
In the fluid-structure coupling analysis, the effect of pore pressure on the stress should also be analyzed. The effective stress formula for unsaturated soil was usually used, as shown in Formula (18):
σ = σ u a + χ u a u w
σ is the total normal stress; σ’ is the effective stress; ua and uw are air pressure and water pressure, respectively; (uauw) is matrix suction; χ is the matrix suction coefficient, which is approximately equal to saturation.
Due to the static equilibrium relationship, the stress equation for soil mass is Formula (19):
σ i j , j + F i = 0
When the soil pore is filled with water, the pore pressure will reduce the effective stress between the soil particles; that is, in the unsaturated state, the increase in pore pressure will lead to a decrease in matrix suction, thus reducing the effective stress. In the saturated state, the increase in pore pressure directly leads to a decrease in the effective stress between particles. Therefore, the stress-strain constitutive equation of soil under pore water pressure is Formula (20):
σ i j = D i j k l ε k l β p δ i j
The second item on the right in Formula (5) is the effect of pore water pressure on the soil particle skeleton. That is, considering the seepage-stress coupling effect.
According to the theory of elasticity, the relationship between stress and displacement is given by Formula (21):
ε i j = 1 2 u i , j + u j , i
In Formulas (19)–(21), σij is the stress tensor, σ’ij is the effective stress tensor, Fi is the volume force, Dijkl is the elastic tensor, p is the pore water pressure, δij is the Kronecher sign, εij is the strain tensor, and ui is the solid displacement. The above describes the influence of seepage on the internal stress state of saturated-unsaturated soil due to the change in pore water pressure on the effective stress between soil particles.
Under rainfall conditions, the stress field and seepage field interact with each other, and the mechanical constitutive model of the tailings dam is also based on the fluid-structure coupling theory.
For the retention behavior of fluid in a rock and soil mass, the van Genuchten model built in COMSOL is selected. The van Genuchten equation describes the changes in hydropower conductivity and water volume. In the COMSOL software, it can be represented by Formulas (22) and (23).
C w = α m 1 m θ s θ r S e 1 m 1 S e 1 m m H p < 0 0   H p 0
K w = S e l 1 1 S e 1 m m 2 H p < 0 1   H p 0
where Cw is the volumetric specific humidity; Kw is the hydraulic conductivity; ɑ, m, and l are model fitting parameters; θs is the saturated water content; θr is the residual water content; and Se is the effective saturation. The modeling steps of the tailings dam fluid structure coupling model under extreme rainfall conditions are shown in Figure 6.

3. Results and Discussion

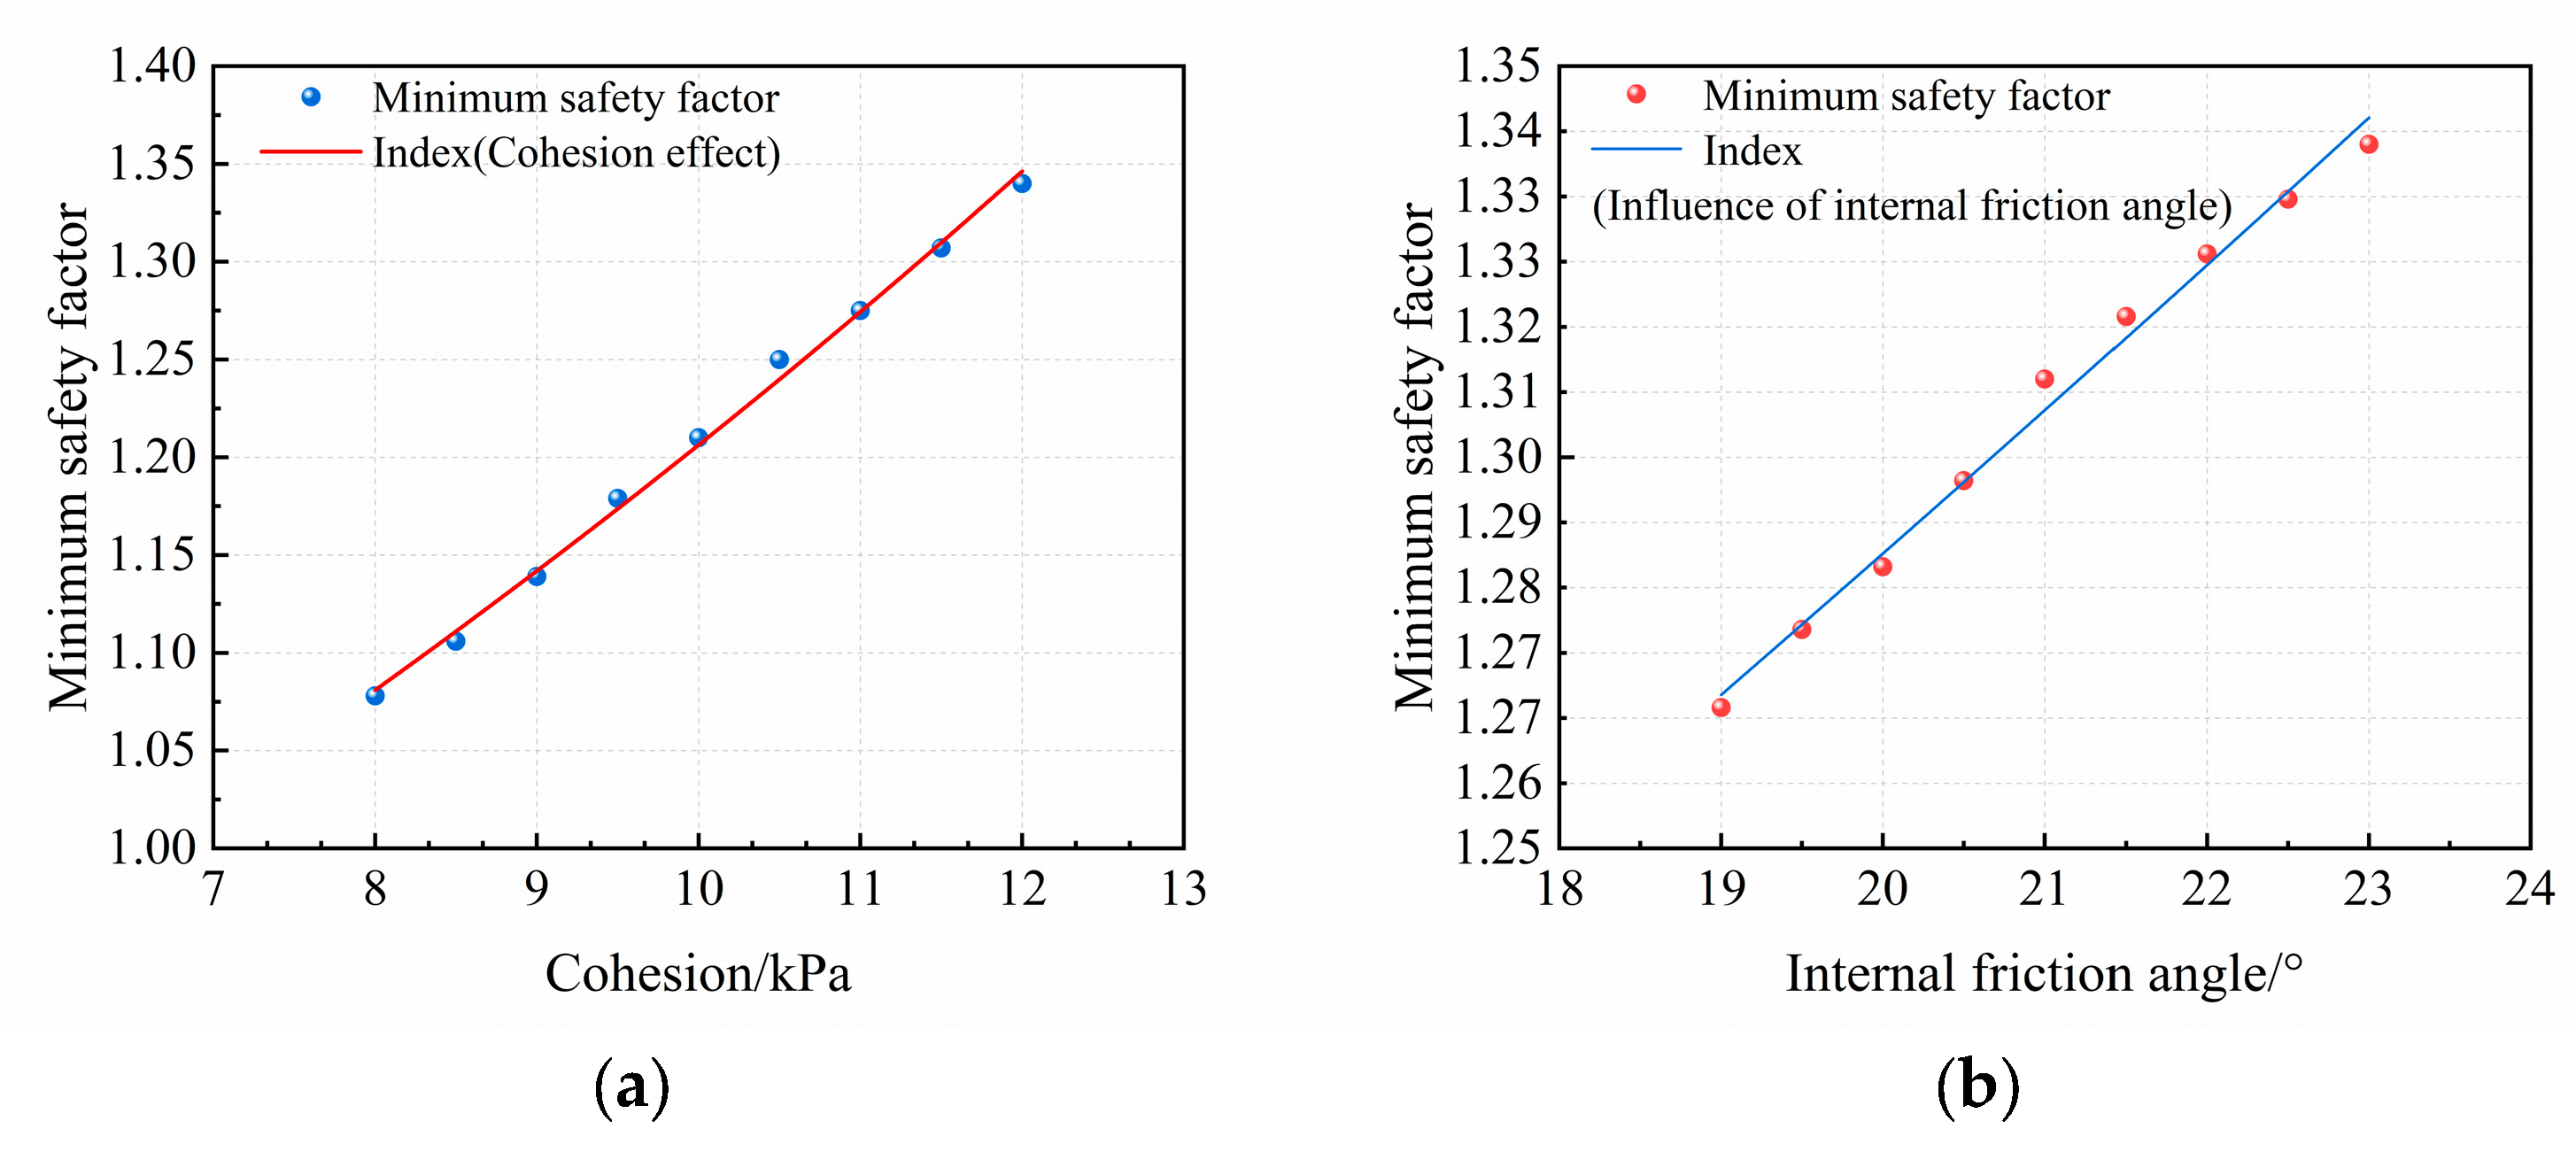
3.1. Sensitivity Analysis of Shear Strength Parameters for Tailings Dams

The main factors affecting the safety factor FS are cohesion C and internal friction angle φ. Therefore, the values of cohesion C and internal friction angle φ are changed to reflect the change in safety factor FS. Nine data points are used to conduct sensitivity analysis on the safety factor FS. In the analysis method, the value of fixed cohesion C remains unchanged, while the value of internal friction angle φ is fine-tuned to analyze its influence on the minimum safety factor Fs. Then, the value of the fixed internal friction angle φ remains unchanged, the value of cohesion C is fine-tuned, and its influence on the minimum safety factor Fs is analyzed. The fitting is shown in Figure 7.
As shown in Figure 7, the fitting degree is very high; the fitting degree of the influence curve of cohesion C is 0.99648, and the fitting degree of the influence curve of internal friction angle φ is 0.99145. The relationship between the cohesion C and the safety factor Fs is Fs = 0.69698e0.05486C, and the relationship between the internal friction angle φ and the safety factor Fs is Fs = 0.97086e0.01412φ. According to Figure 7, cohesion C and internal friction angle φ are positively related to the safety factor Fs of the tailings dam. However, the change in cohesion C leads to more changes in the safety factor Fs, so the influence of cohesion C on the safety factor Fs of the tailings dam is greater.
The Geostudio software Slope/W module is used to build a tailings accumulation model, and the Morgenstern–Price method is used to calculate the safety factor Fs. In the natural state φ = 21°, C = 8.6 kPa, the minimum safety factor Fs of the tailings dam is 1.050, and the tailings dam is in an unstable state; at φ = 21°, C = 7.8 kPa, the minimum safety factor Fs of the tailings dam is 1.000, and the tailings dam belongs to the limit equilibrium state; at φ = 21°, C = 9.4 kPa, the minimum safety factor Fs of the tailings dam is 1.103, and the tailings dam is in a stable state. Therefore, the fixed internal friction angle φ is 21°, and the cohesion C range is 7.8~9.4 kPa. The cohesion range is 7.8~9.4 kPa, with a median of 8.6 kPa. According to the cloud model theory, in order to simplify the calculation, divide the possible value range and divide an interval every 0.4 kPa. The expected values of each interval are 7.8, 8.2, 8.6, 9.0, and 9.4, respectively. These five values are within the cohesion range, including the internal boundary value and the median value. The interval distribution is average, which meets the demand of cloud theory computing.
For the uncertainty and fuzziness of the tailings dam cohesion C, the specific value of the cohesion C is determined by building a cloud theory model. Figure 8 shows the minimum safety factor and sliding surface of the tailings dam under different cohesion C values.

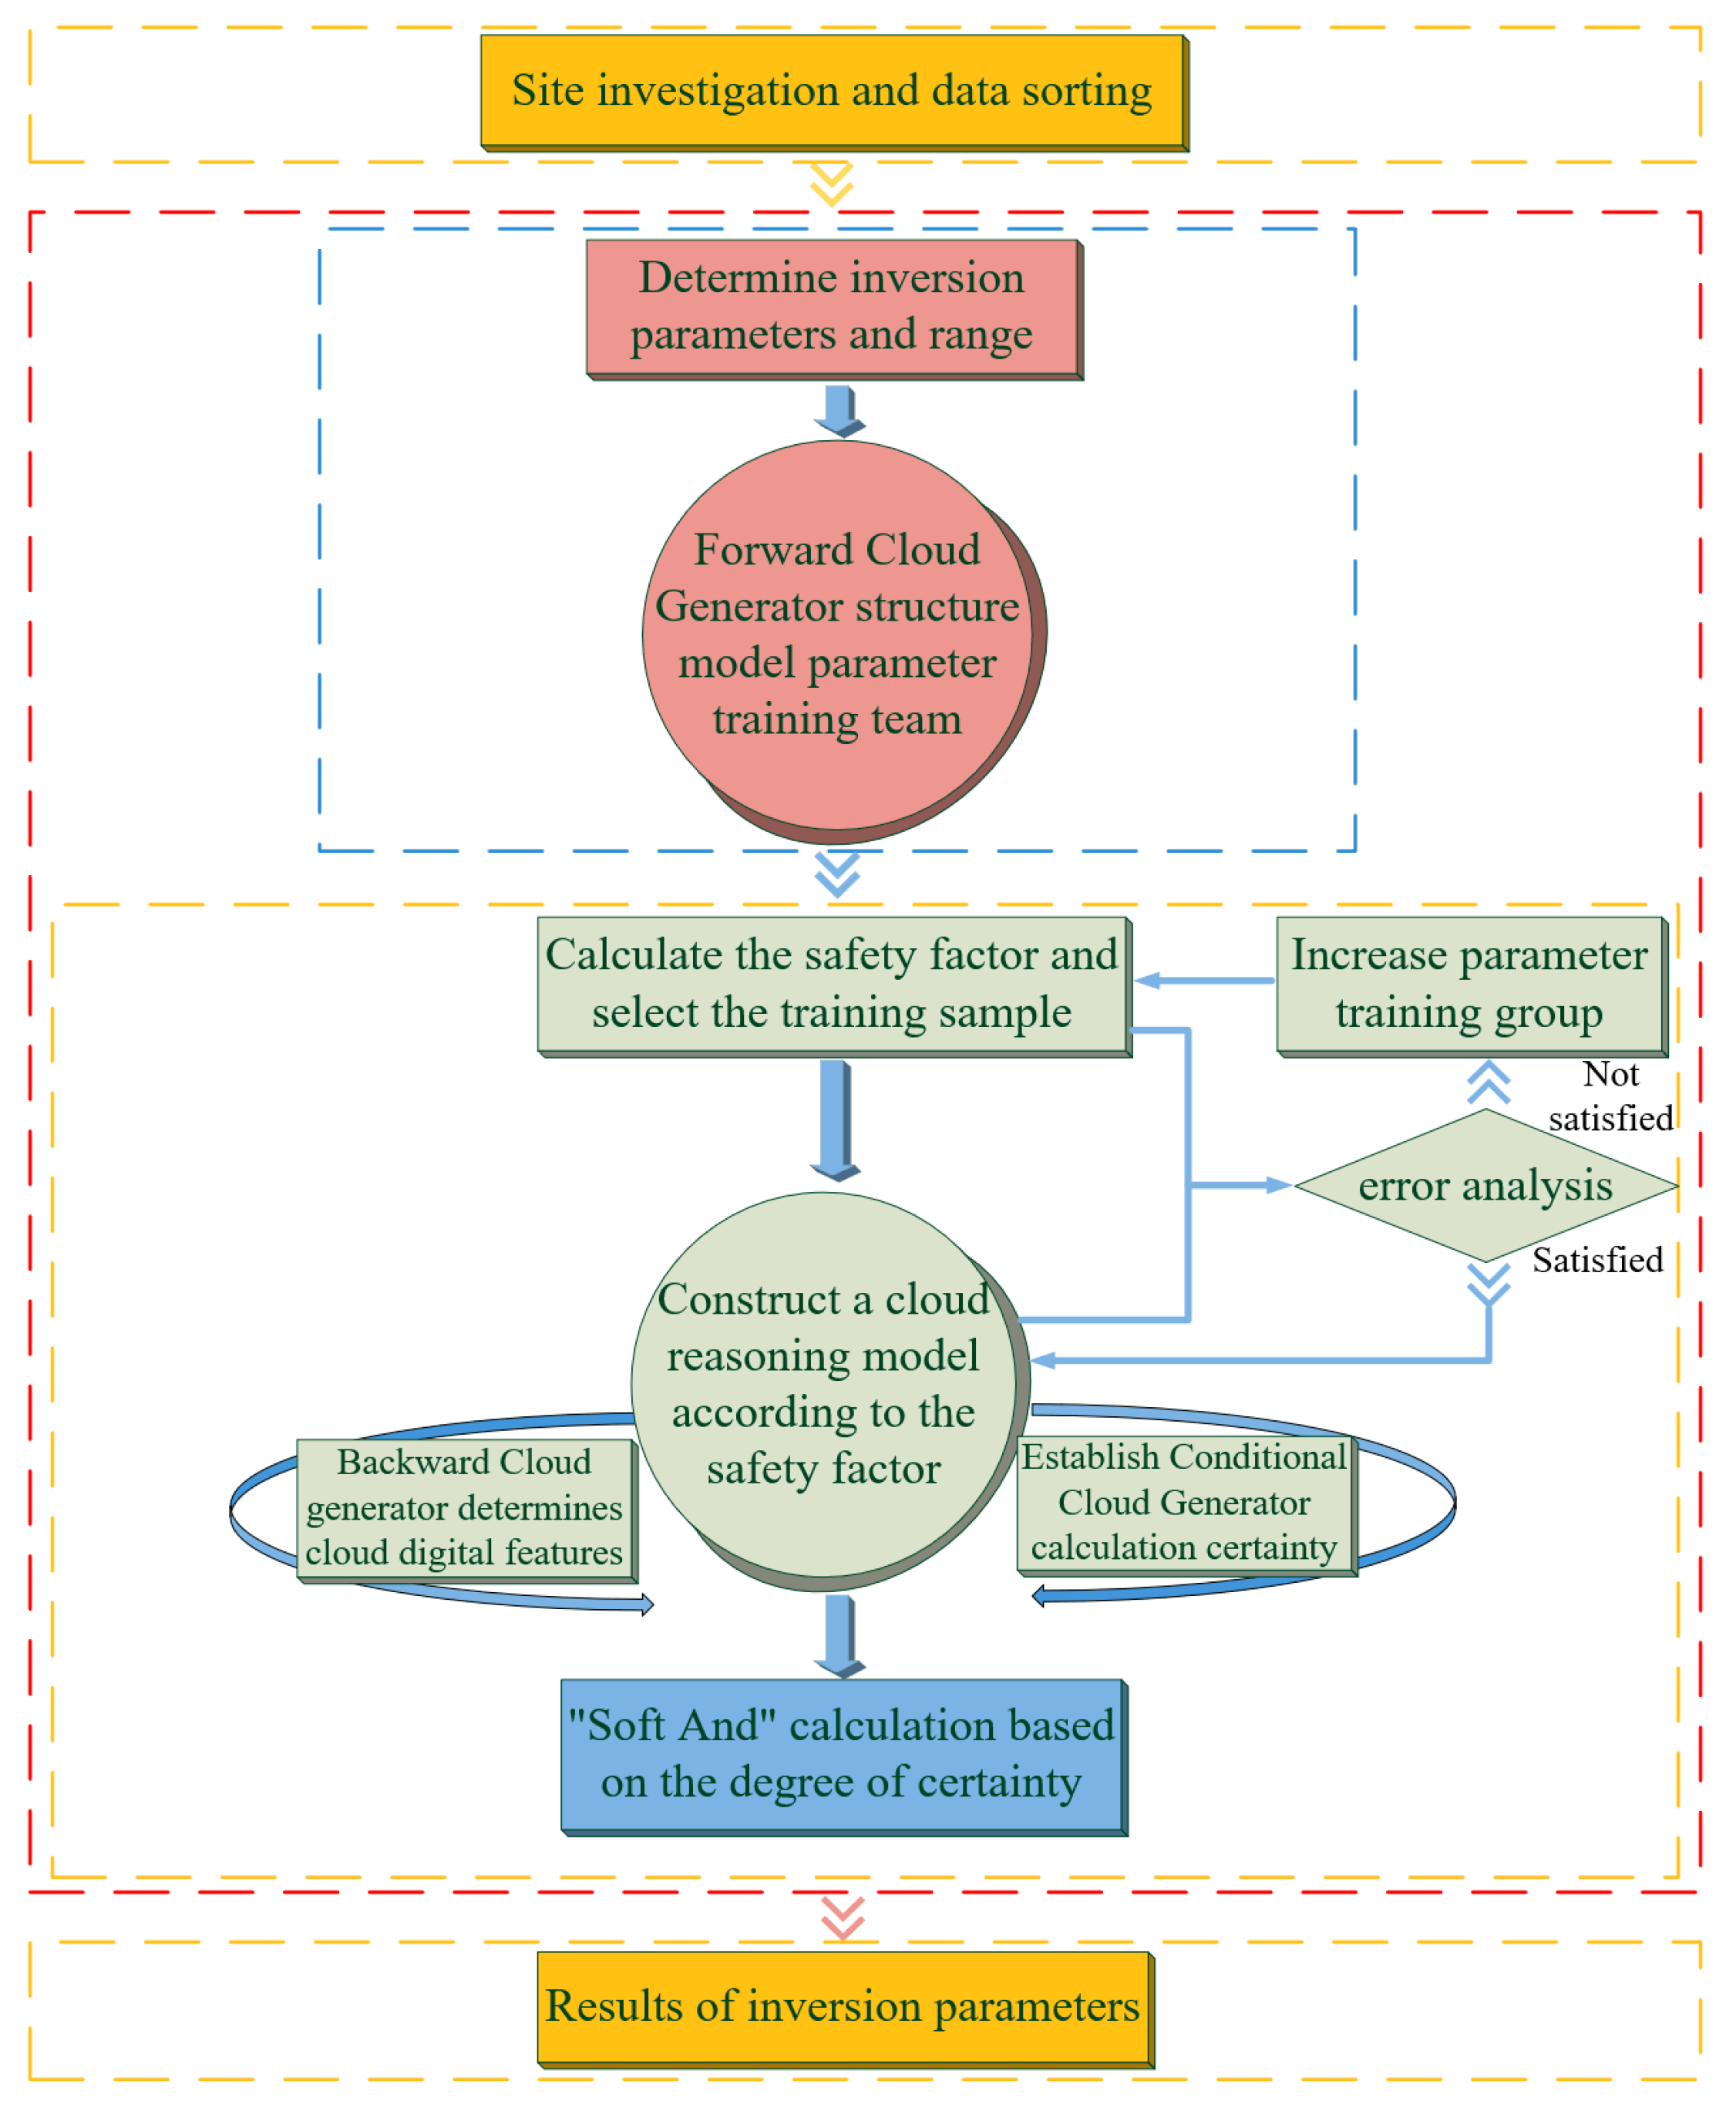
3.2. Theoretical Tailings Dam Cohesion Parameter Inversion Based on the Cloud Model

3.2.1. Select Parameter Range

The cloud model theory divides the cohesion C into one interval every 0.4, divided into five intervals, and the expectation Ex is the interval boundary value. Entropy En is (Exmax − Exmin) = 0.266. When 0 < He < En/3, the certainty of the cloud model is uncertain and distributed in a normal distribution [55]. According to the observation of the discrete cloud map, it is more appropriate to choose He = 0.0266. The forward cloud corresponding to the qualitative concepts of these five intervals is shown in Figure 9.

3.2.2. Selection of Training Samples and Calculation of Safety Factor

Eight training sample parameters were selected from the forward cloud map, and the safety factor was calculated. There are five intervals: 1c, 2c, 3c, 4c, and 5c. The expected values of each interval remain unchanged, i.e., Ex1C, Ex2C, Ex3C, Ex4C, and Ex5C. See Table 1, Table 2, Table 3, Table 4 and Table 5 for the calculation results of the safety factor Fs of cohesion C.

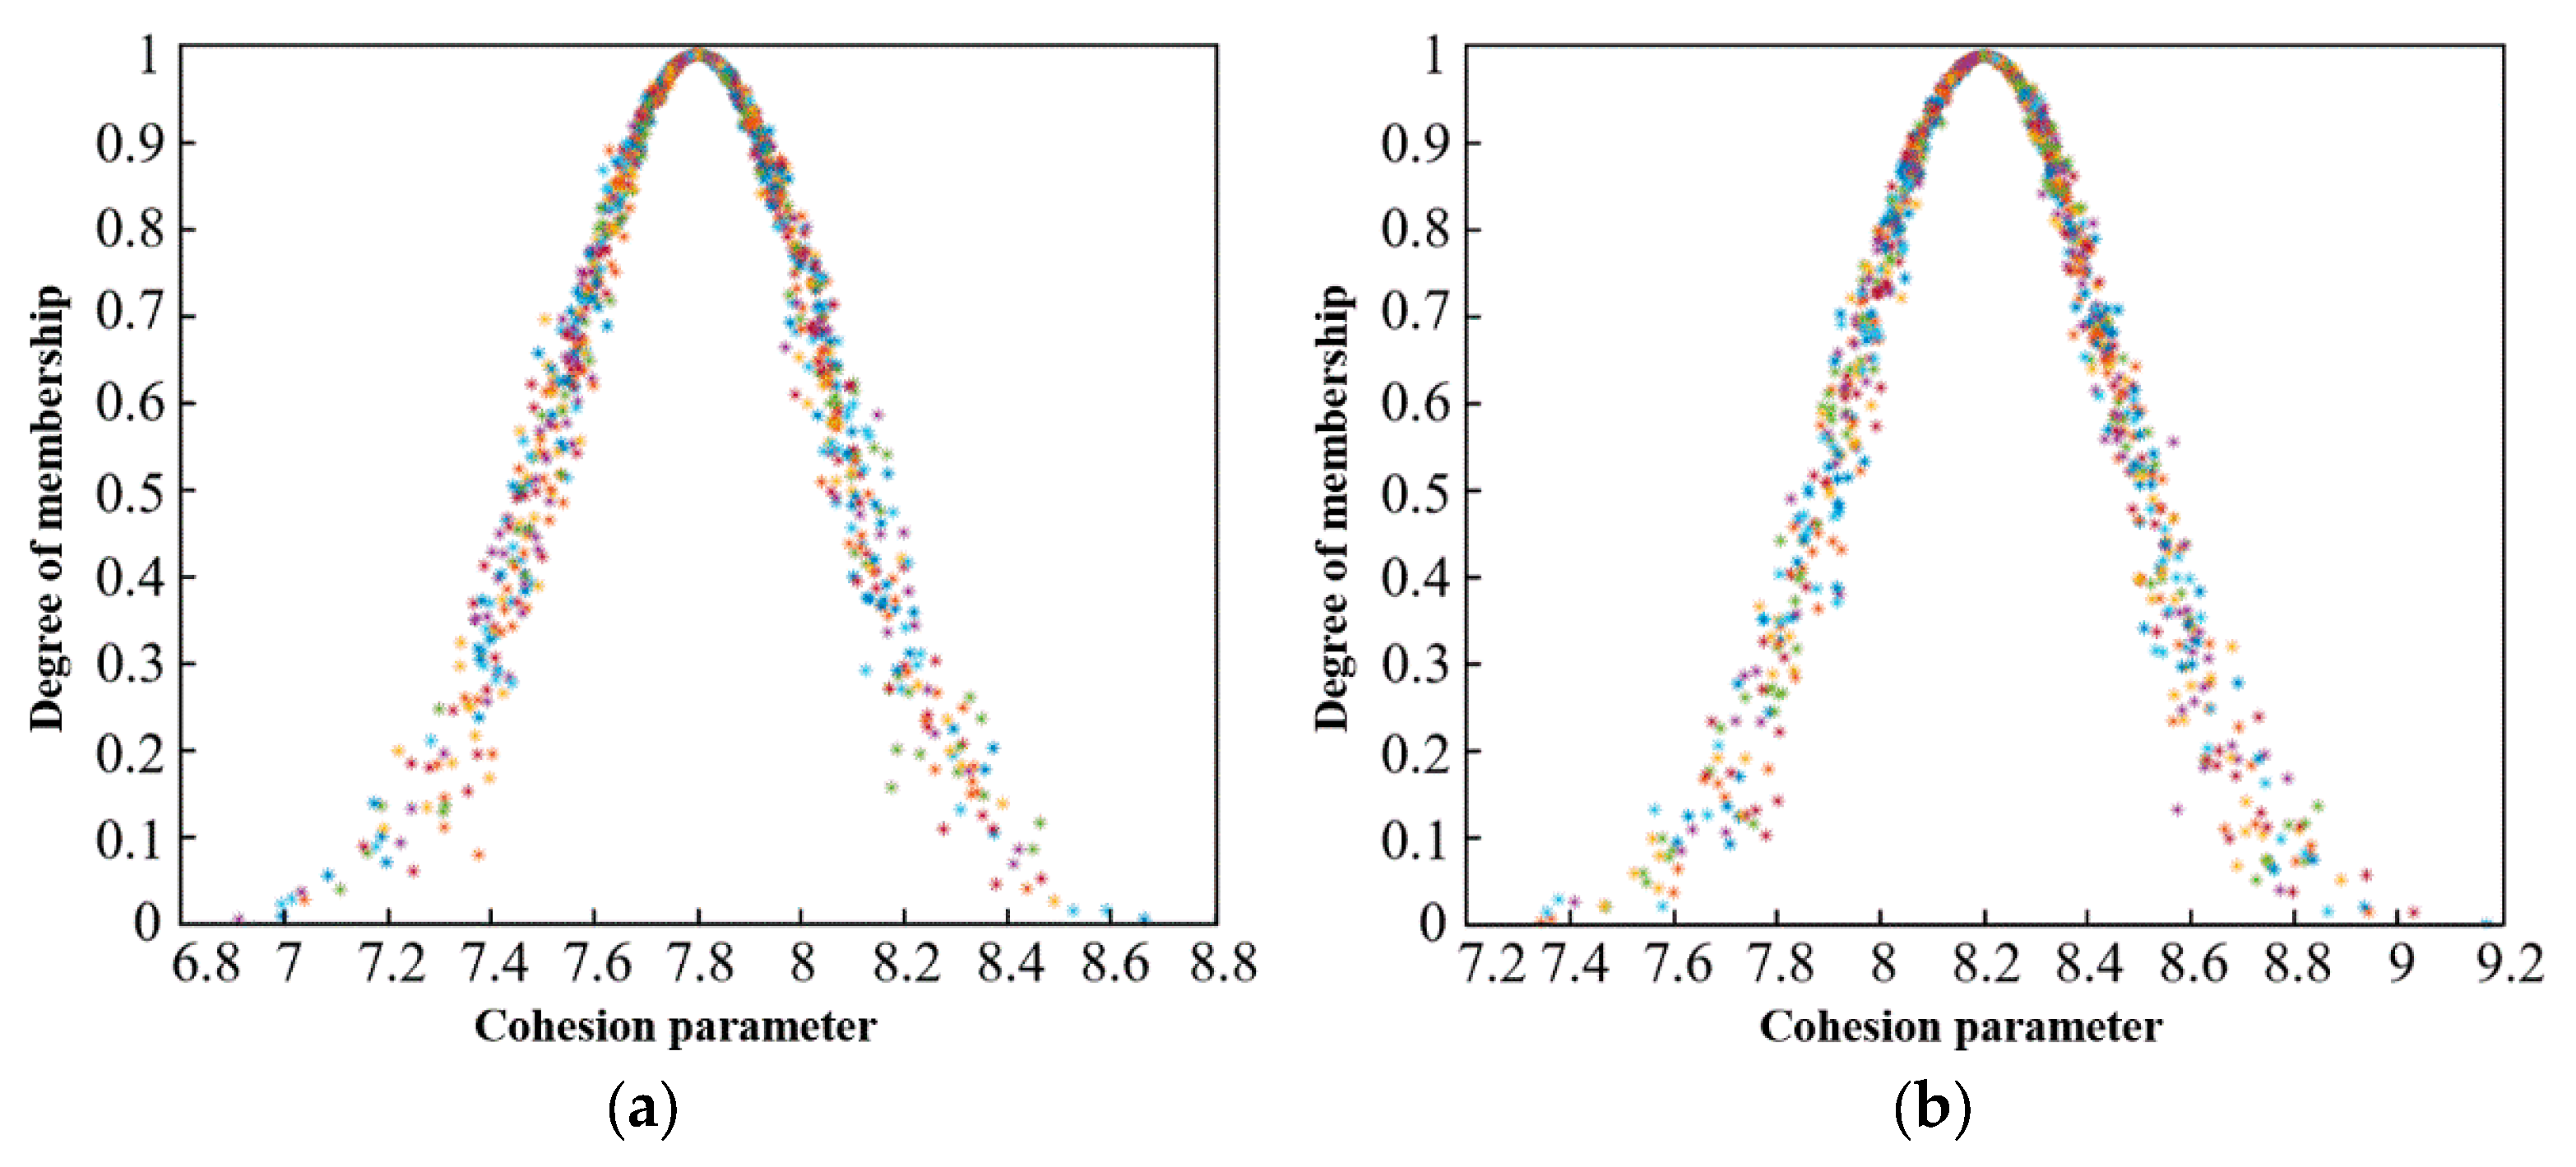
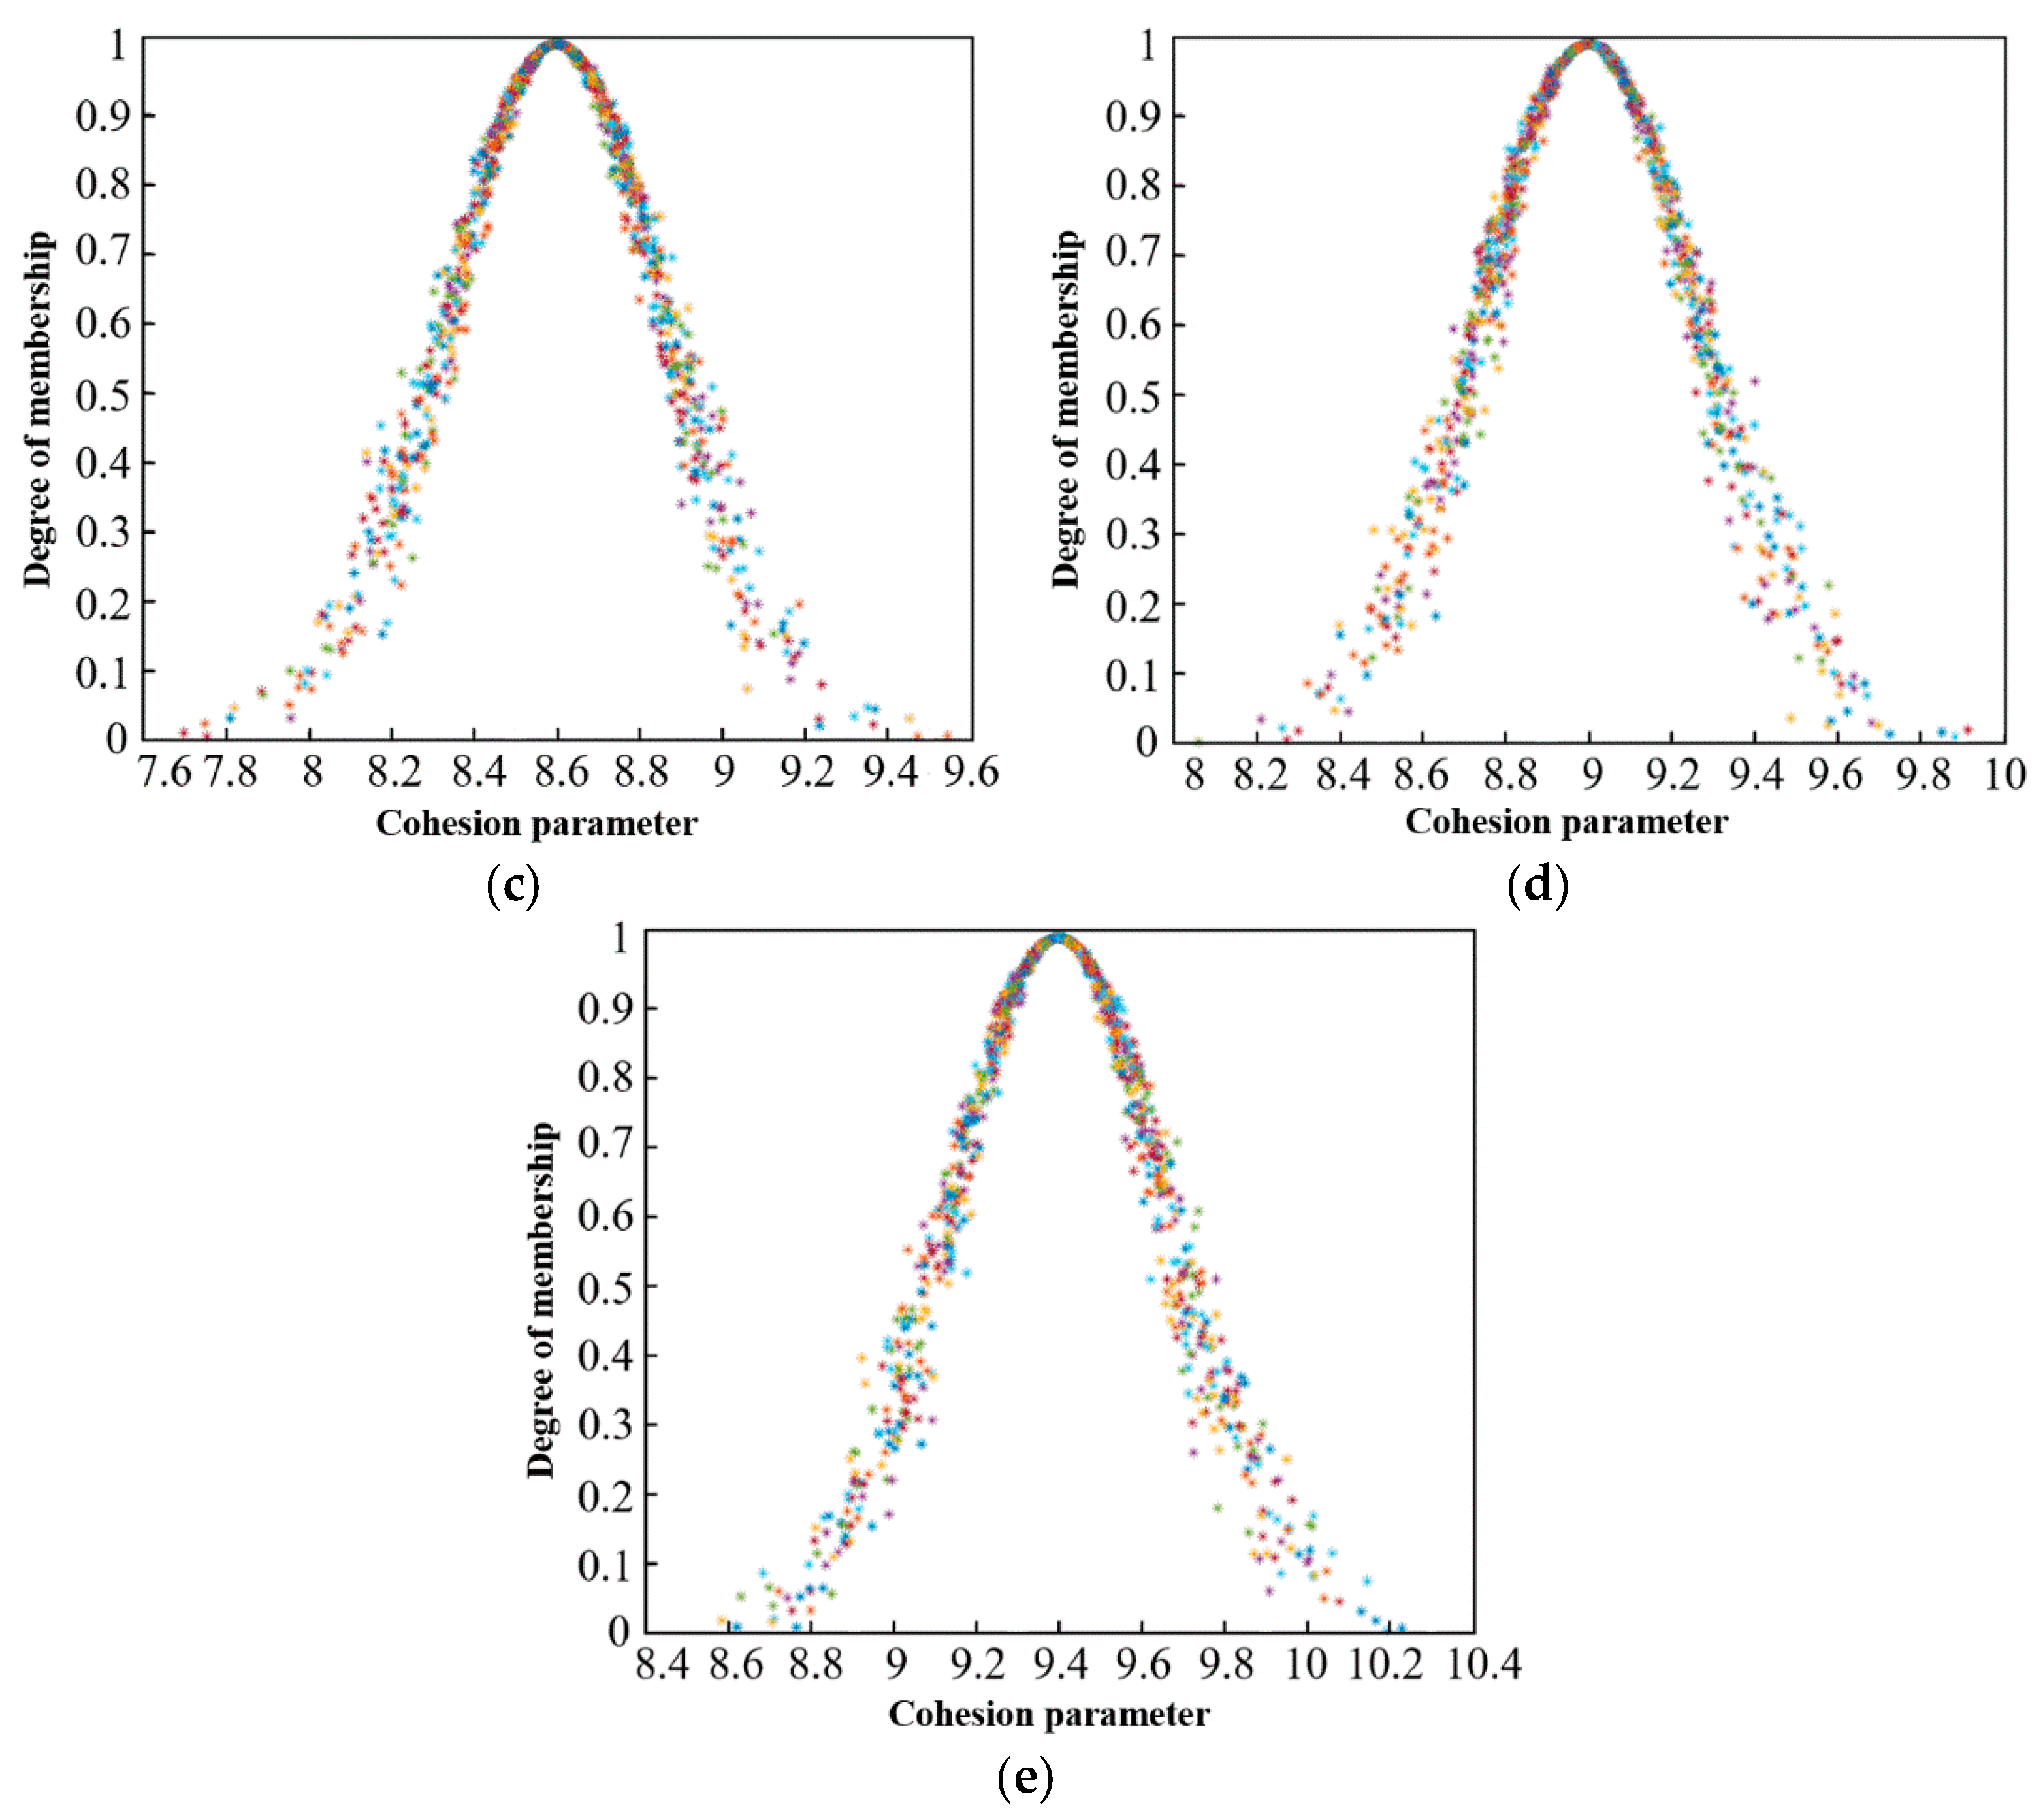
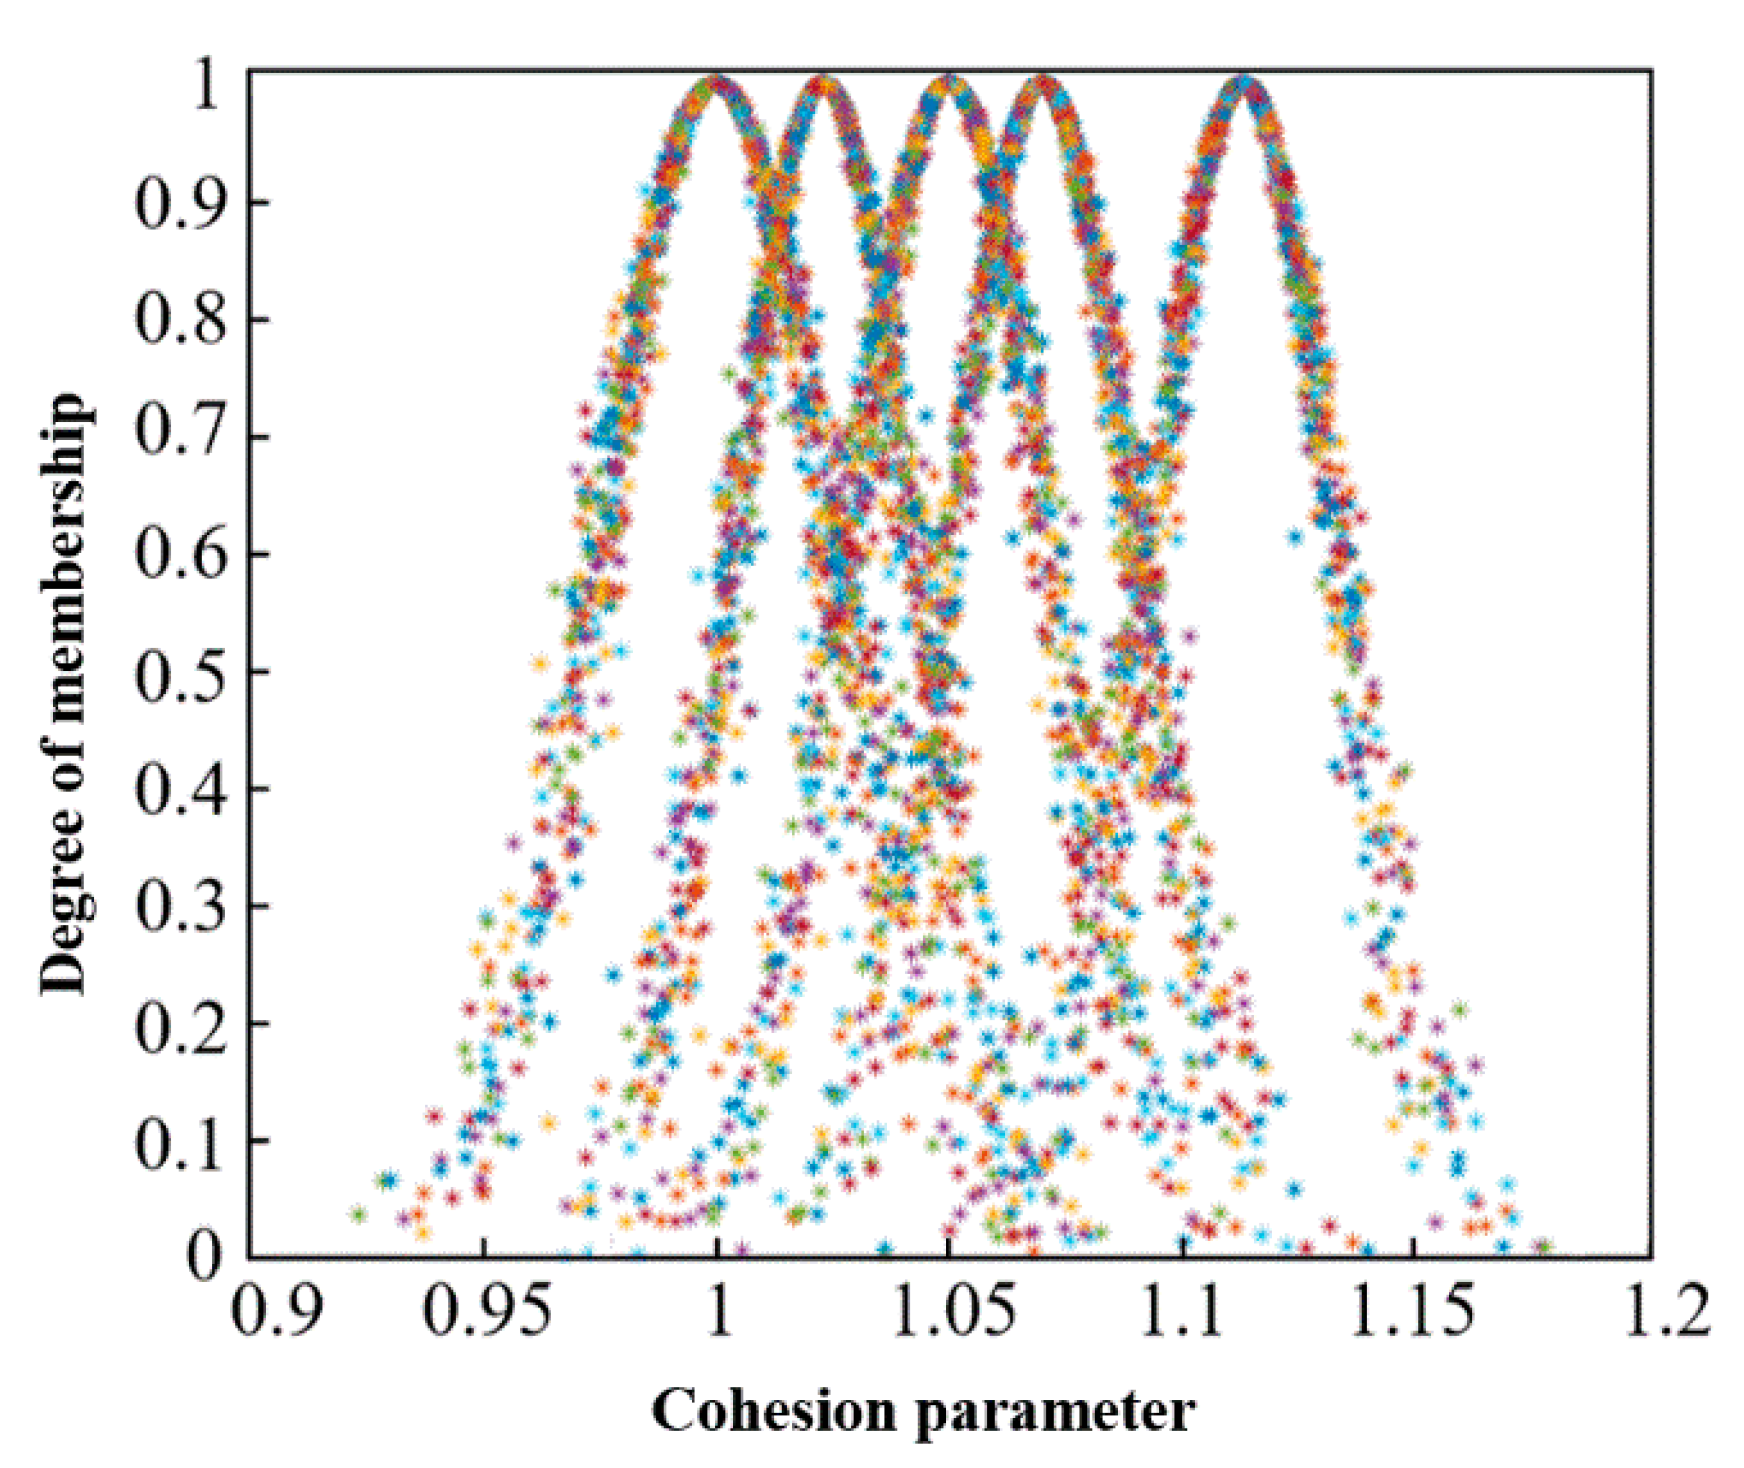
3.2.3. Uncertain Cloud Reasoning

The tailings dam cohesion C is used as a variable input in the security coefficient calculation, and the expectation Ex, entropy En, and hyperentropy He of the five intervals are shown in Table 6. Entropy En and hyperentropy He are obtained by using the reverse cloud generator and hyperentropy He must be adjusted according to the atomization properties and the “3En” principle.
For cohesion C, the qualitative concept cloud diagram of the safety factor corresponding to each parameter is obtained through the forward cloud generator, as shown in Figure 10.
The accuracy of the cloud reasoning model is also improved by a large number of typical corresponding relationships, and the inversion results also have more possibilities. The qualitative concepts of rule antecedent and rule consequent are established through the reverse cloud generator so that the rule antecedent and rule consequent qualitative concepts form special qualitative rules corresponding to each other. This qualitative concept can be represented by cloud digital features such as expectation Ex, entropy En, and hyperentropy He. For cohesion C, the cloud representation methods PREAc1 to PREAC5 of the qualitative concept of the former part of the safety factor Fs rule and the cloud representation methods POSTBc1 to POSTBC5 of the qualitative concept of the latter part of the cohesion C rule are established, respectively, as shown in Table 7.
When a safety factor is input, calculate the degree of certainty of qualitative concepts for each cloud rule antecedent. By using the “Soft And” calculation according to the degree of certainty, the rules are as follows:
(1)
If only one group of uncertainties is greater than 0, the output is directly generated by the inverse cloud generator;
(2)
If there are 2 degrees of certainty of confirmation (Ki and Ki+1) greater than 0, when using these 2 degrees of certainty to activate the corresponding rules consequent, select the 2 cloud droplets generated and cover these 2 cloud droplets with a virtual cloud. Then, the output method of cohesion C is Formula (24):
C = x 1 2 l n k 2 + x 2 2 l n k 1 2 l n k 1 + 2 l n k 2
(3)
When more than three uncertainties are greater than 0, the expectation Ex of the virtual cloud is generated directly by the inverse cloud generator, and the value of Ex is the output value of cohesion C.
According to the site investigation, the tailings dam is only understandable. When the safety factor of the calculation input is 1.050, the uncertainty of the five qualitative concepts of the rule antecedents is calculated, and the five uncertainties are greater than 0. The cohesion parameter is 8.6901 kPa when directly using the inverse cloud generator.

3.2.4. Verification of the Inversion Method of Strength Parameters

Because the tailings dam has produced shallow sliding, it is assumed that the stability coefficient Fs is 1.05. Calculate the cohesion C value and compare it with the cohesion C value after parameter inversion to verify the accuracy of the shear strength parameters obtained through parameter inversion. When the safety coefficient of the tailings dam is Fs = 1.05, the cohesive force C is 8.60 kPa, and the cohesion C value obtained by the parameter inversion calculation is 8.6901 kPa. Slope/W is used to build the slope model again. Figure 11 shows the established tailings dam model. As the tailings dam is in an unstable state, its safety factor is theoretically less than or equal to 1.050, but the safety factor set in the inversion process is 1.05, and the final safety factor is 1.059. Theoretically, the inversion will be slightly larger than the actual value, approximately 0.85% higher, with a small change and within the set safety factor of 1.000–1.100. Therefore, the shear strength parameters obtained by the inverse calculation method in this paper are reasonable and accurate. The calculation method is simple and practical and can provide important guidance for stability evaluation and engineering design of earth rock dams or slopes.

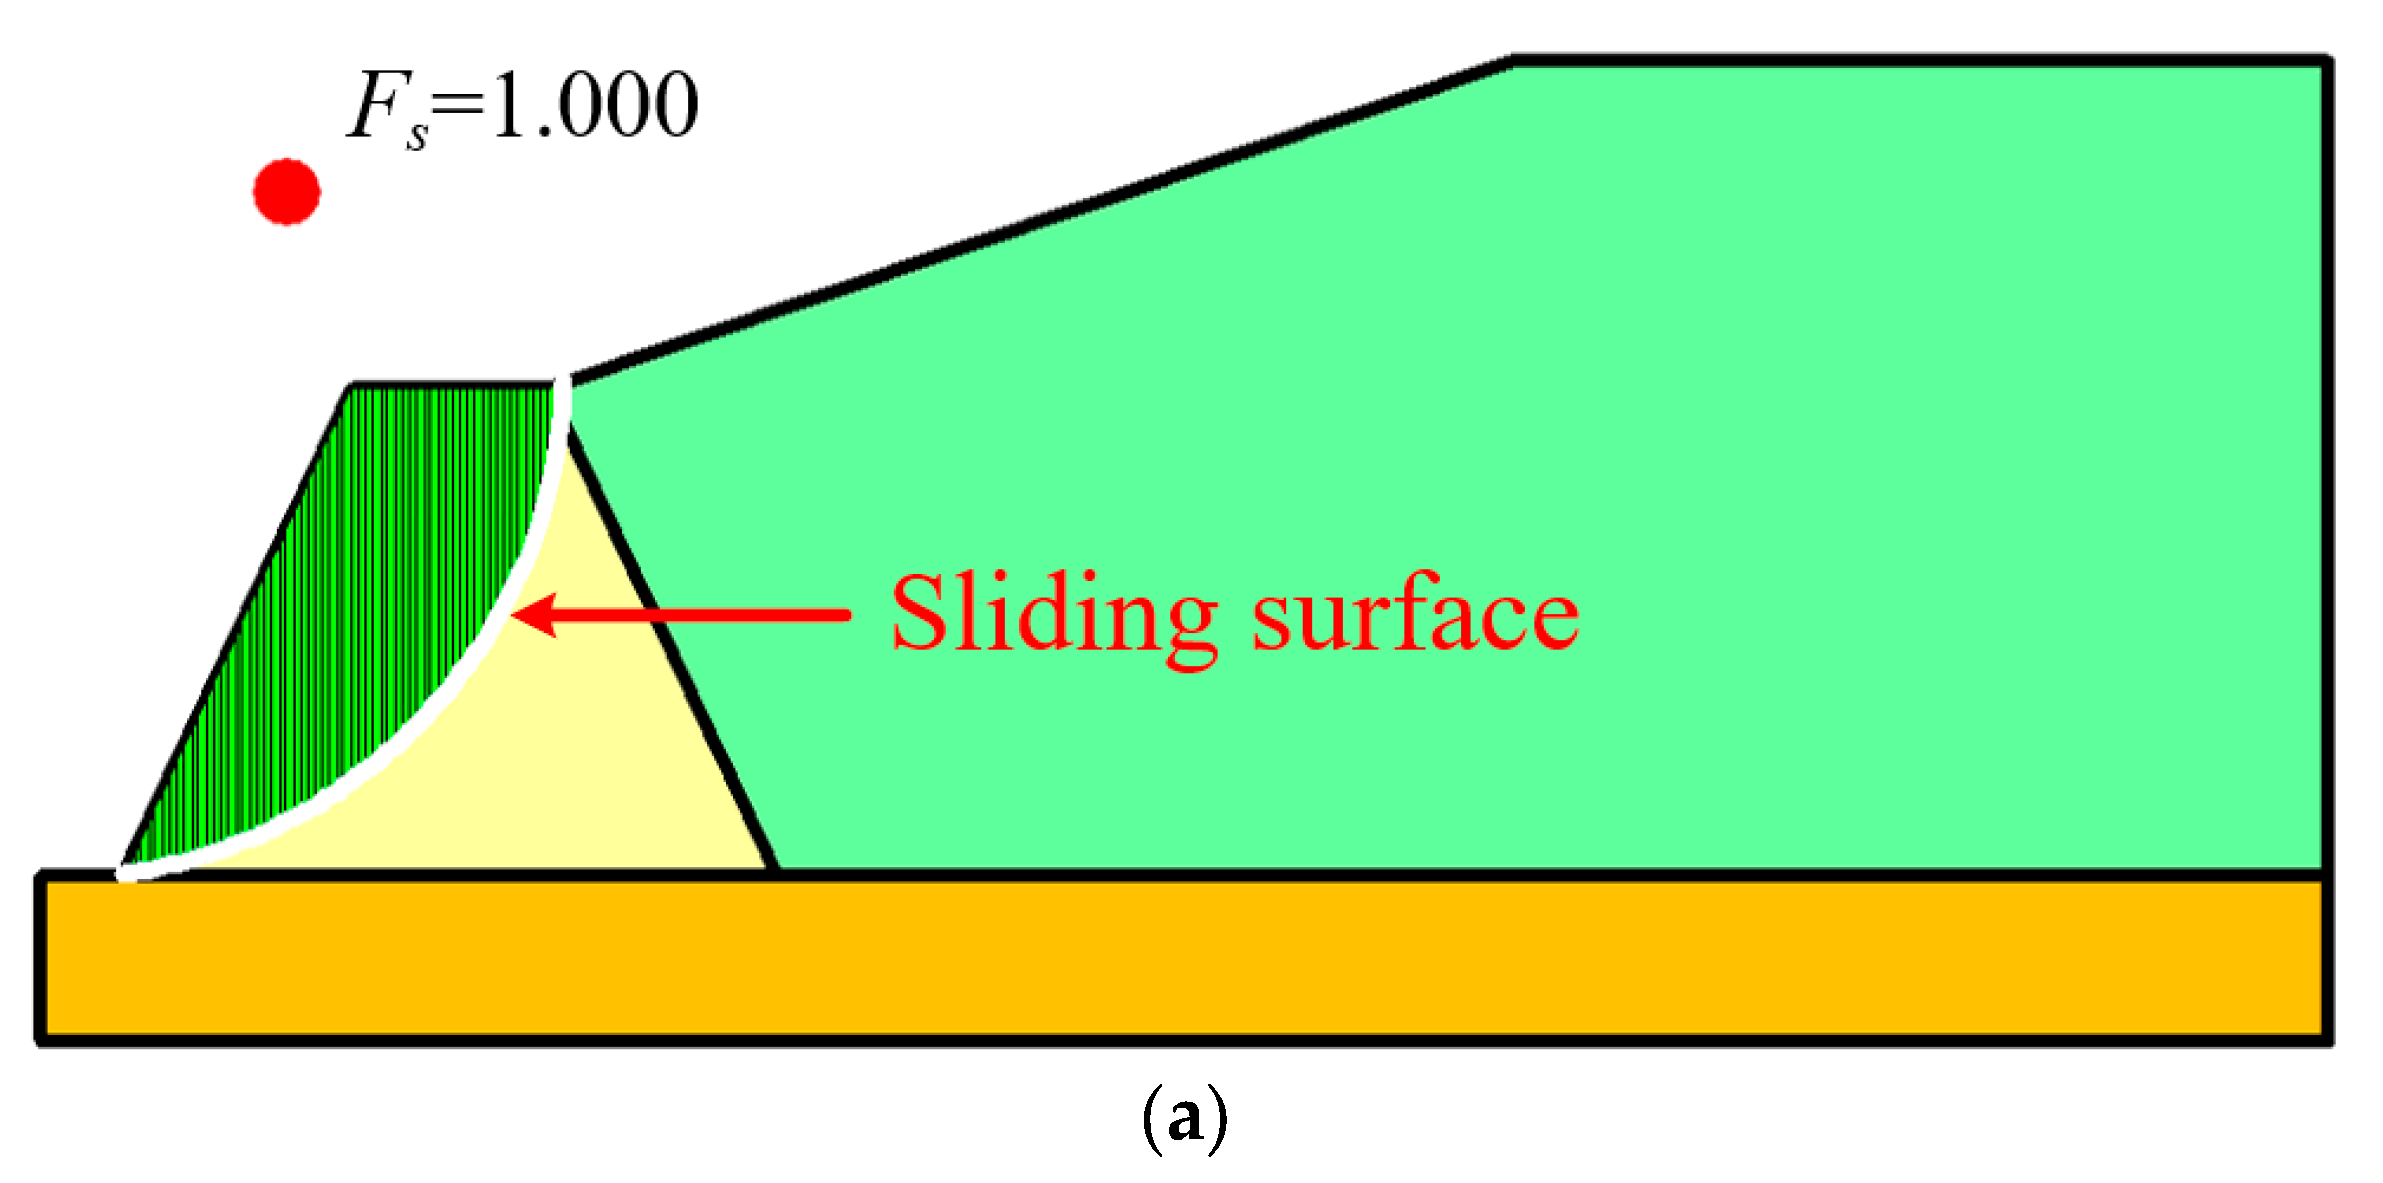
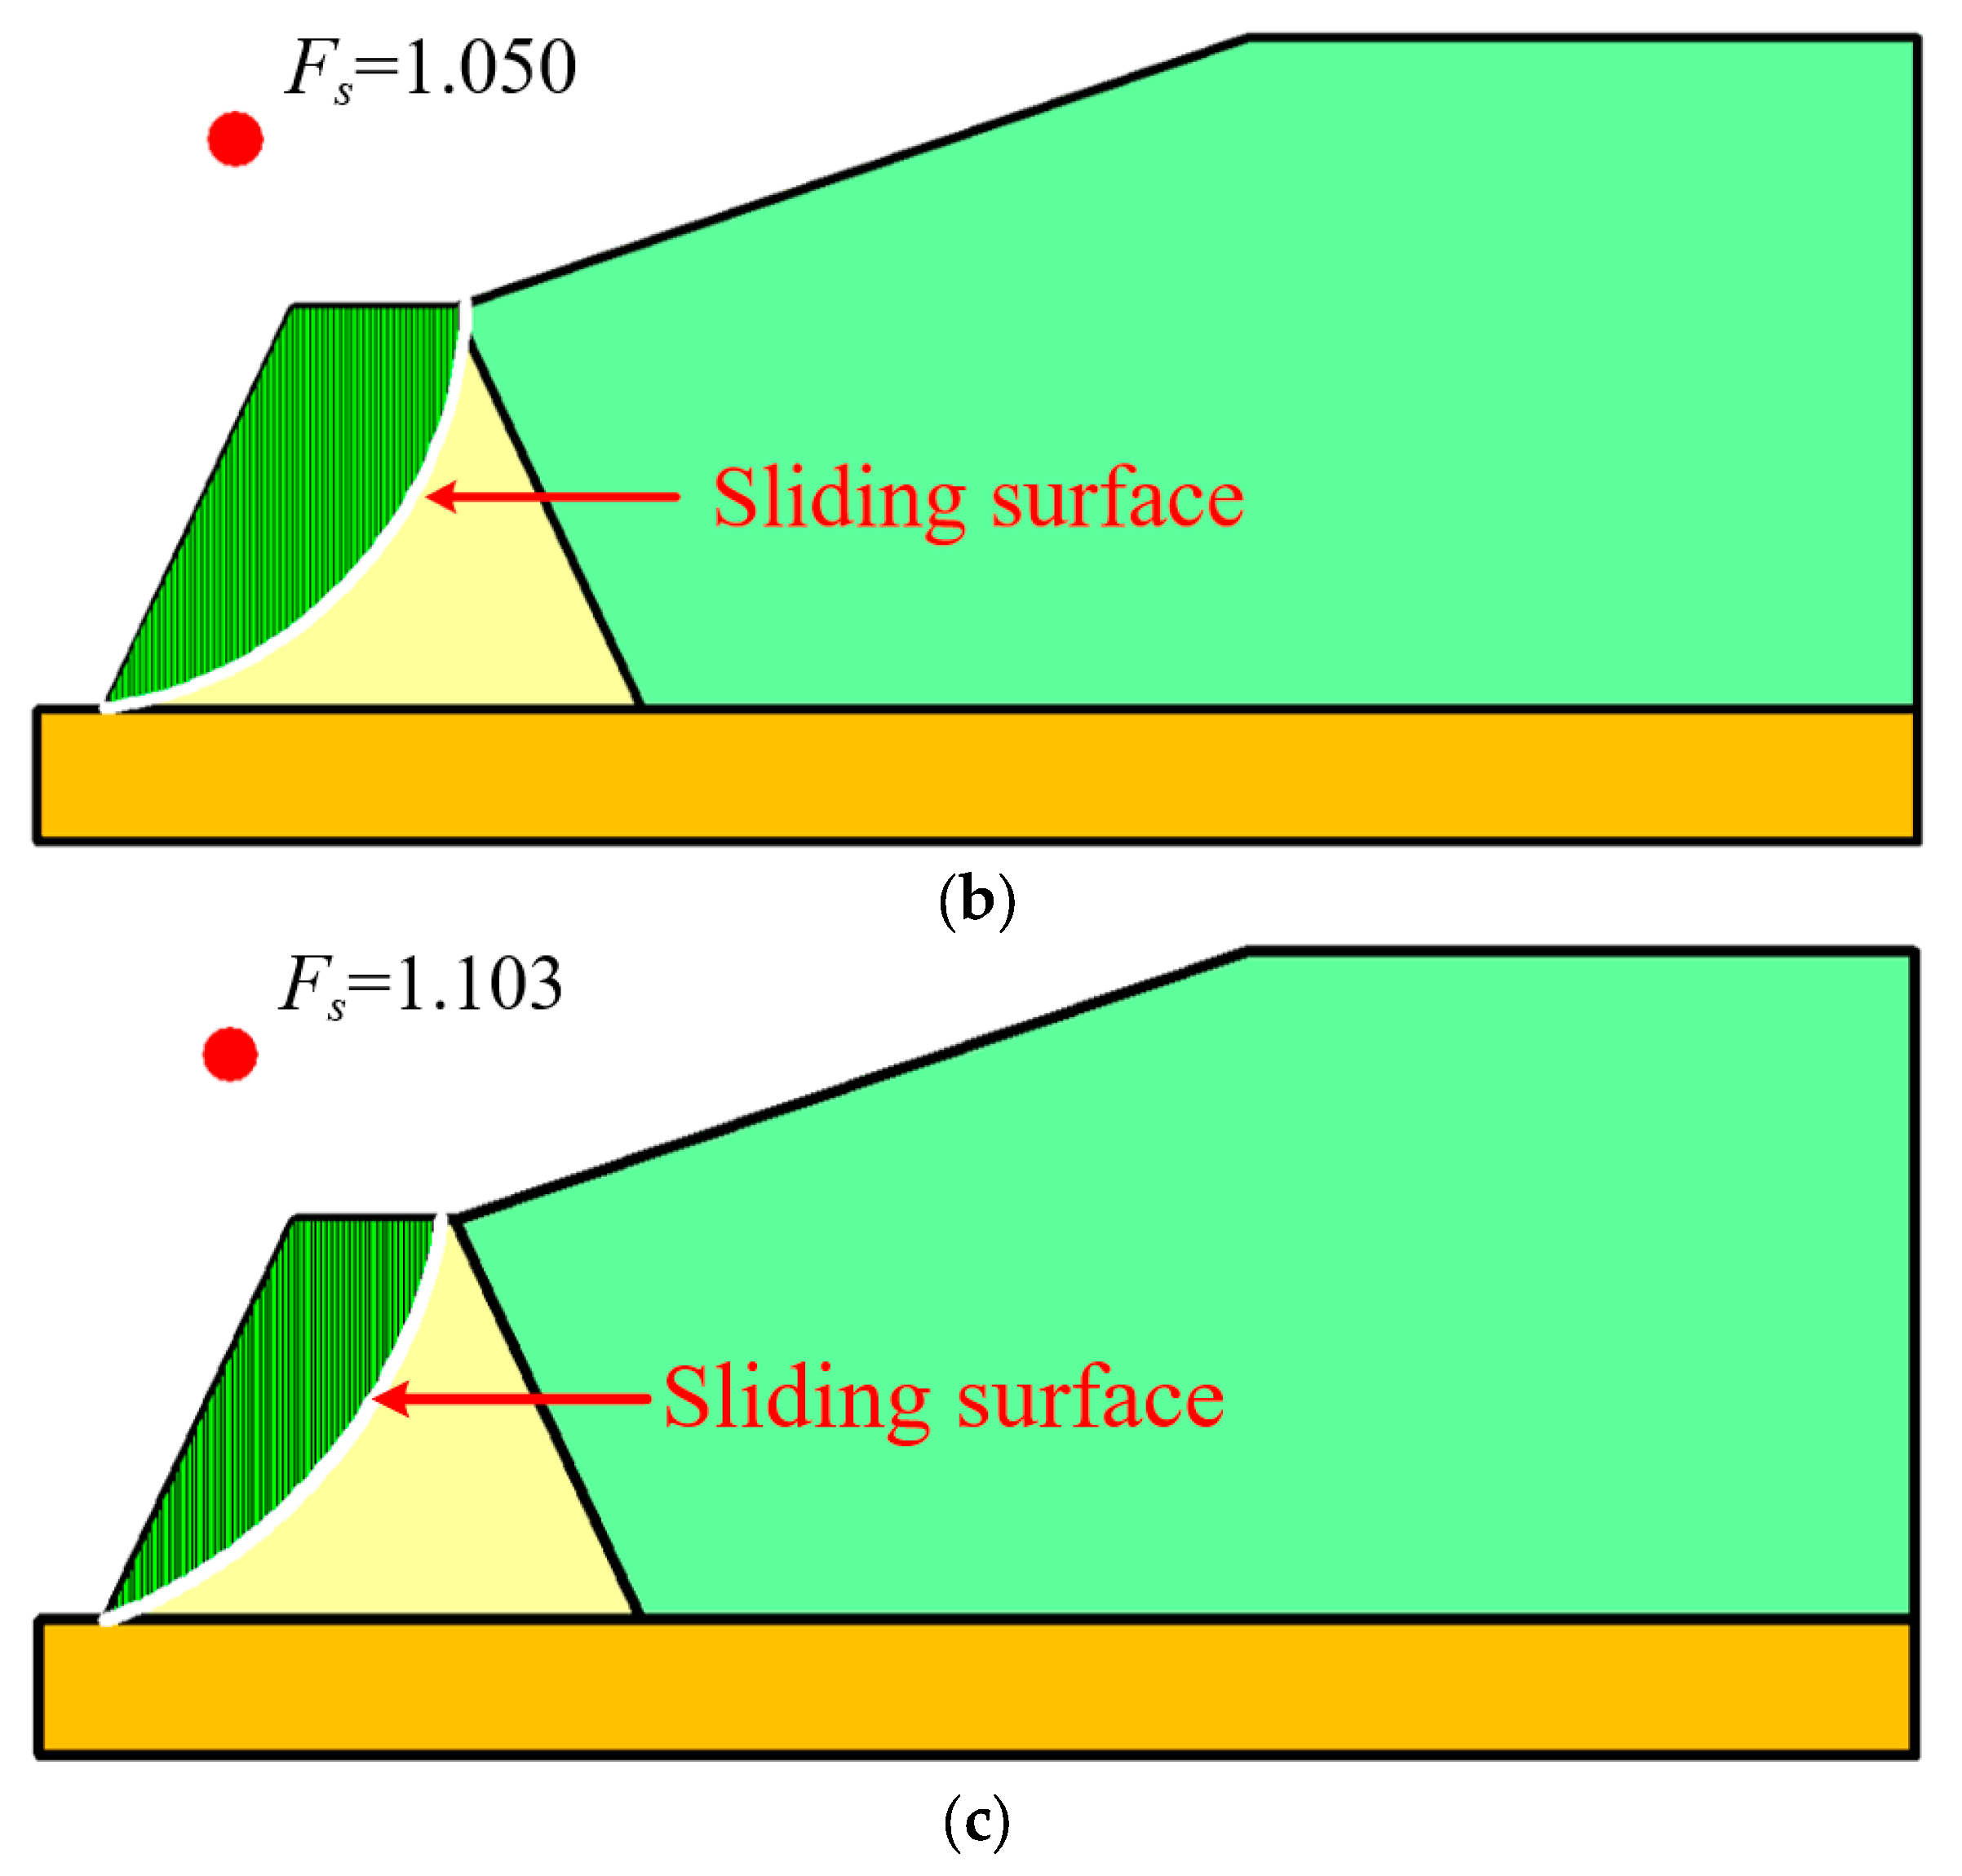
3.3. Analysis of the Deformation Destruction Characteristics of a Tail Mine Dam under Extreme Rainfall Conditions

In order to analyze the deformation and failure of the tailings dam under rainfall conditions, a fluid-structure coupling model of the tailings pond is established based on the finite element method, as shown in the figure. To simplify the operation, use CAD software to build the model, and then import it into COMSOL Multiphysics software for finite element calculation and analysis [56]. The tailings pond section is selected as the simulation object, with a length of 14 m, a height of 6 m, and an area of 68.8 m2.
In order to better simulate the deformation and failure characteristics of the tailings dam under short-term extreme rainfall conditions, the mechanical boundary conditions of the numerical model are set as follows: the upper part is set as a free boundary, the bottom is set as a fixed constraint, both sides of the dam body are supported by rollers, and the normal displacement is 0, but sliding can occur along this surface, and the rest are permeable boundaries except the bottom. The rainfall intensity is set at 92.16 mm/h, and the rainfall time is set to 1 h. Based on the above simulation conditions, a numerical model was established, as shown in the Figure 12. The mesh size of the numerical model was set to be extremely fine. Except for the mesh generator of the dam foundation, which is set to map, the rest were set to be free quadrilateral mesh [57,58]. The number of cells was 3207, the number of mesh vertices was 3345, and the minimum cell mass was 0.5523. The maximum cell size was 0.141 m, the minimum was 2.82 × 10⁻⁴ m, the maximum cell growth rate was 1.1, and the curvature factor was 0.2.
Considering the influence of compaction and other factors, and through investigation, research, and consulting relevant data, the variation range of the shear strength of earth rock dams is approximately 1/10. The earth-rock fill dam has been compacted to a high degree. In order to meet the actual situation of the project, the cohesion and internal friction angle parameters have been improved, so the value of cohesion C is approximately 9.56 kPa and the value of internal friction angle φ is 23.1°. The values of the other parameters of the tailings dam are shown in Table 8.
As shown in Figure 13 and Figure 14, the dam toe is the first place to appear and gives priority to the development of plastic strain at the beginning of rainfall, and the plastic strain area is only 0.0833 m2. At 0.05 h, the plastic strain area of the tailings dam suddenly increases, and a new plastic strain area appears inside with a total area of 0.2626 m2 and an irregular shape. After 1 h, the area of plastic strain is 0.2781 m2. The extreme rainfall intensity is greater than the seepage capacity of the tailings dam. The dam surface produces runoff, and the rainwater that fails to seep will gather at the dam toe. As a result, the footing on the outside of the tailings dam is gradually eroding. The increase in water content at the dam toe will generate pore water pressure. The rock and soil mass at the dam toe is humidified and softened and gradually develops into the tailings dam, creating a priority channel for the subsequent rainwater infiltration into the tailings dam, resulting in the formation of a free face at the dam toe and causing collapse and failure.
Figure 15 shows the displacement of the tailings dam for one hour of simulated rainfall. The displacement cloud map is introduced to study the displacement and changing trajectory of the tailings dam. At the beginning of rainfall, with the scouring and flow of rainwater, the stacking tailings and tailings dams generated similar displacement to the direction of the water flow, especially the displacement at the surface of the stacking tailings and dam abutment. After 0.05 h, the plastic strain caused by rainwater infiltration and overburden pressure and soil stress caused by runoff will cause serious damage to the dam toe area of the tailings dam, and the displacement will increase abruptly. Second, the continuous seepage and runoff of the rainwater also changed the infiltration field of the stack of tailings. The accumulation of input increased the bulk density of the stacking tailings and tailings dams, and the stress environment also changed. As a result, the tailings dams have a sliding force, and the displacement field gradually moves to the inside of the tailings dam. The overall displacement direction of the tailings dam is mainly in the X direction on the outer side and increases the displacement in the outer shallow layer, indicating that the outer dam surface is very likely to have gully erosion.
As shown in Figure 16, taking monitoring points M1 and M2 as examples, the process of determining the displacement change rate is divided into two stages: the fluctuation stage and the continuous growth stage. In the first stage, due to the initial stage of rainfall, mainly due to rainwater scouring, the tailings dam toe and abutment first exhibit a certain displacement, and the displacement growth rate increases until reaching peak point A. Subsequently, due to the increase in rainwater infiltration unit weight, the displacement growth rate of the tailings dam decreases slightly to the minimum value B. However, due to the strong scouring effect and the plastic strain caused by infiltration, the displacement change rate accelerates after 0.1 h. As the dam toe is the confluence of water flow, the decline stage of displacement is very short, but the change trend is similar as a whole. The persistence of rainfall and infiltration are the main reasons for the change in the displacement rate of tailings dams.
Due to rainwater infiltration and scouring, the dam toe and abutment are displaced first, forming the initial shallow sliding. The rock and soil particles on the dam surface will flow along with the rainwater runoff, which weakens the cementation ability of the rock and soil of the tailings dam. The long-term scouring action will lead to rill erosion on the outer dam surface of the tailings dam from top to bottom and then evolve into gully damage, leading to the instability of the tailings dam. Affected by short-term extreme rainfall, the maximum displacement is concentrated at the outer dam toe, followed by the dam abutment. The displacement tends to spread from the dam toe to the dam abutment. The plastic strain area is concentrated at the dam toe and continuously diffuses to the interior with time, seriously damaging the stability. At the beginning of a rainstorm, rainwater washes away dam abutments continuously, earth and rock are lost continuously, and deformation and destruction take place preferentially. With the development of rainfall, the dam foot becomes the rainwater collection area. After humidification and softening, the structural stability becomes worse, and plastic strain begins to appear. Finally, the entire dam surface is covered by deformation and destruction. The evolution law of deformation and destruction can be roughly divided into three stages: the natural state, surface erosion, and gully. The initial stage of rainfall is the key period of deformation, destruction, and development. With the increase in rainfall, the impact of deformation and destruction will increase. The above results also prove that, under the state of rainfall, the position of the dam toe and abutment are viewed as high-risk areas.

4. Conclusions

In this study, the Morgenstern–Price method combined with cloud theory is proposed to analyze the uncertainty of the shear strength index of tailings dams in an unstable state of field observations, and then the numerical simulation method is used to study the coupling deformation and failure law of tailings dams in extreme rainfall states. The study further expresses the uncertainty of the shear strength index through inverse analysis. The short-term extreme rainfall process can eliminate the interference of other environmental factors and comprehensively reveal the deformation and failure laws of tailings dams caused by rainfall. The conclusions are as follows:
(1)
The correlation between cohesion C and safety factor Fs is significant. The safety factor of a tailings dam is obtained by the Morgenstern–Price method, and the specific cohesion parameters are inversed by using cloud theory within the corresponding cohesion C range. The final calculation result is 8.6901 kPa, which overcomes the problem that the fuzziness and randomness of the quantitative cohesion value are transferred to the qualitative concept of the safety factor;
(2)
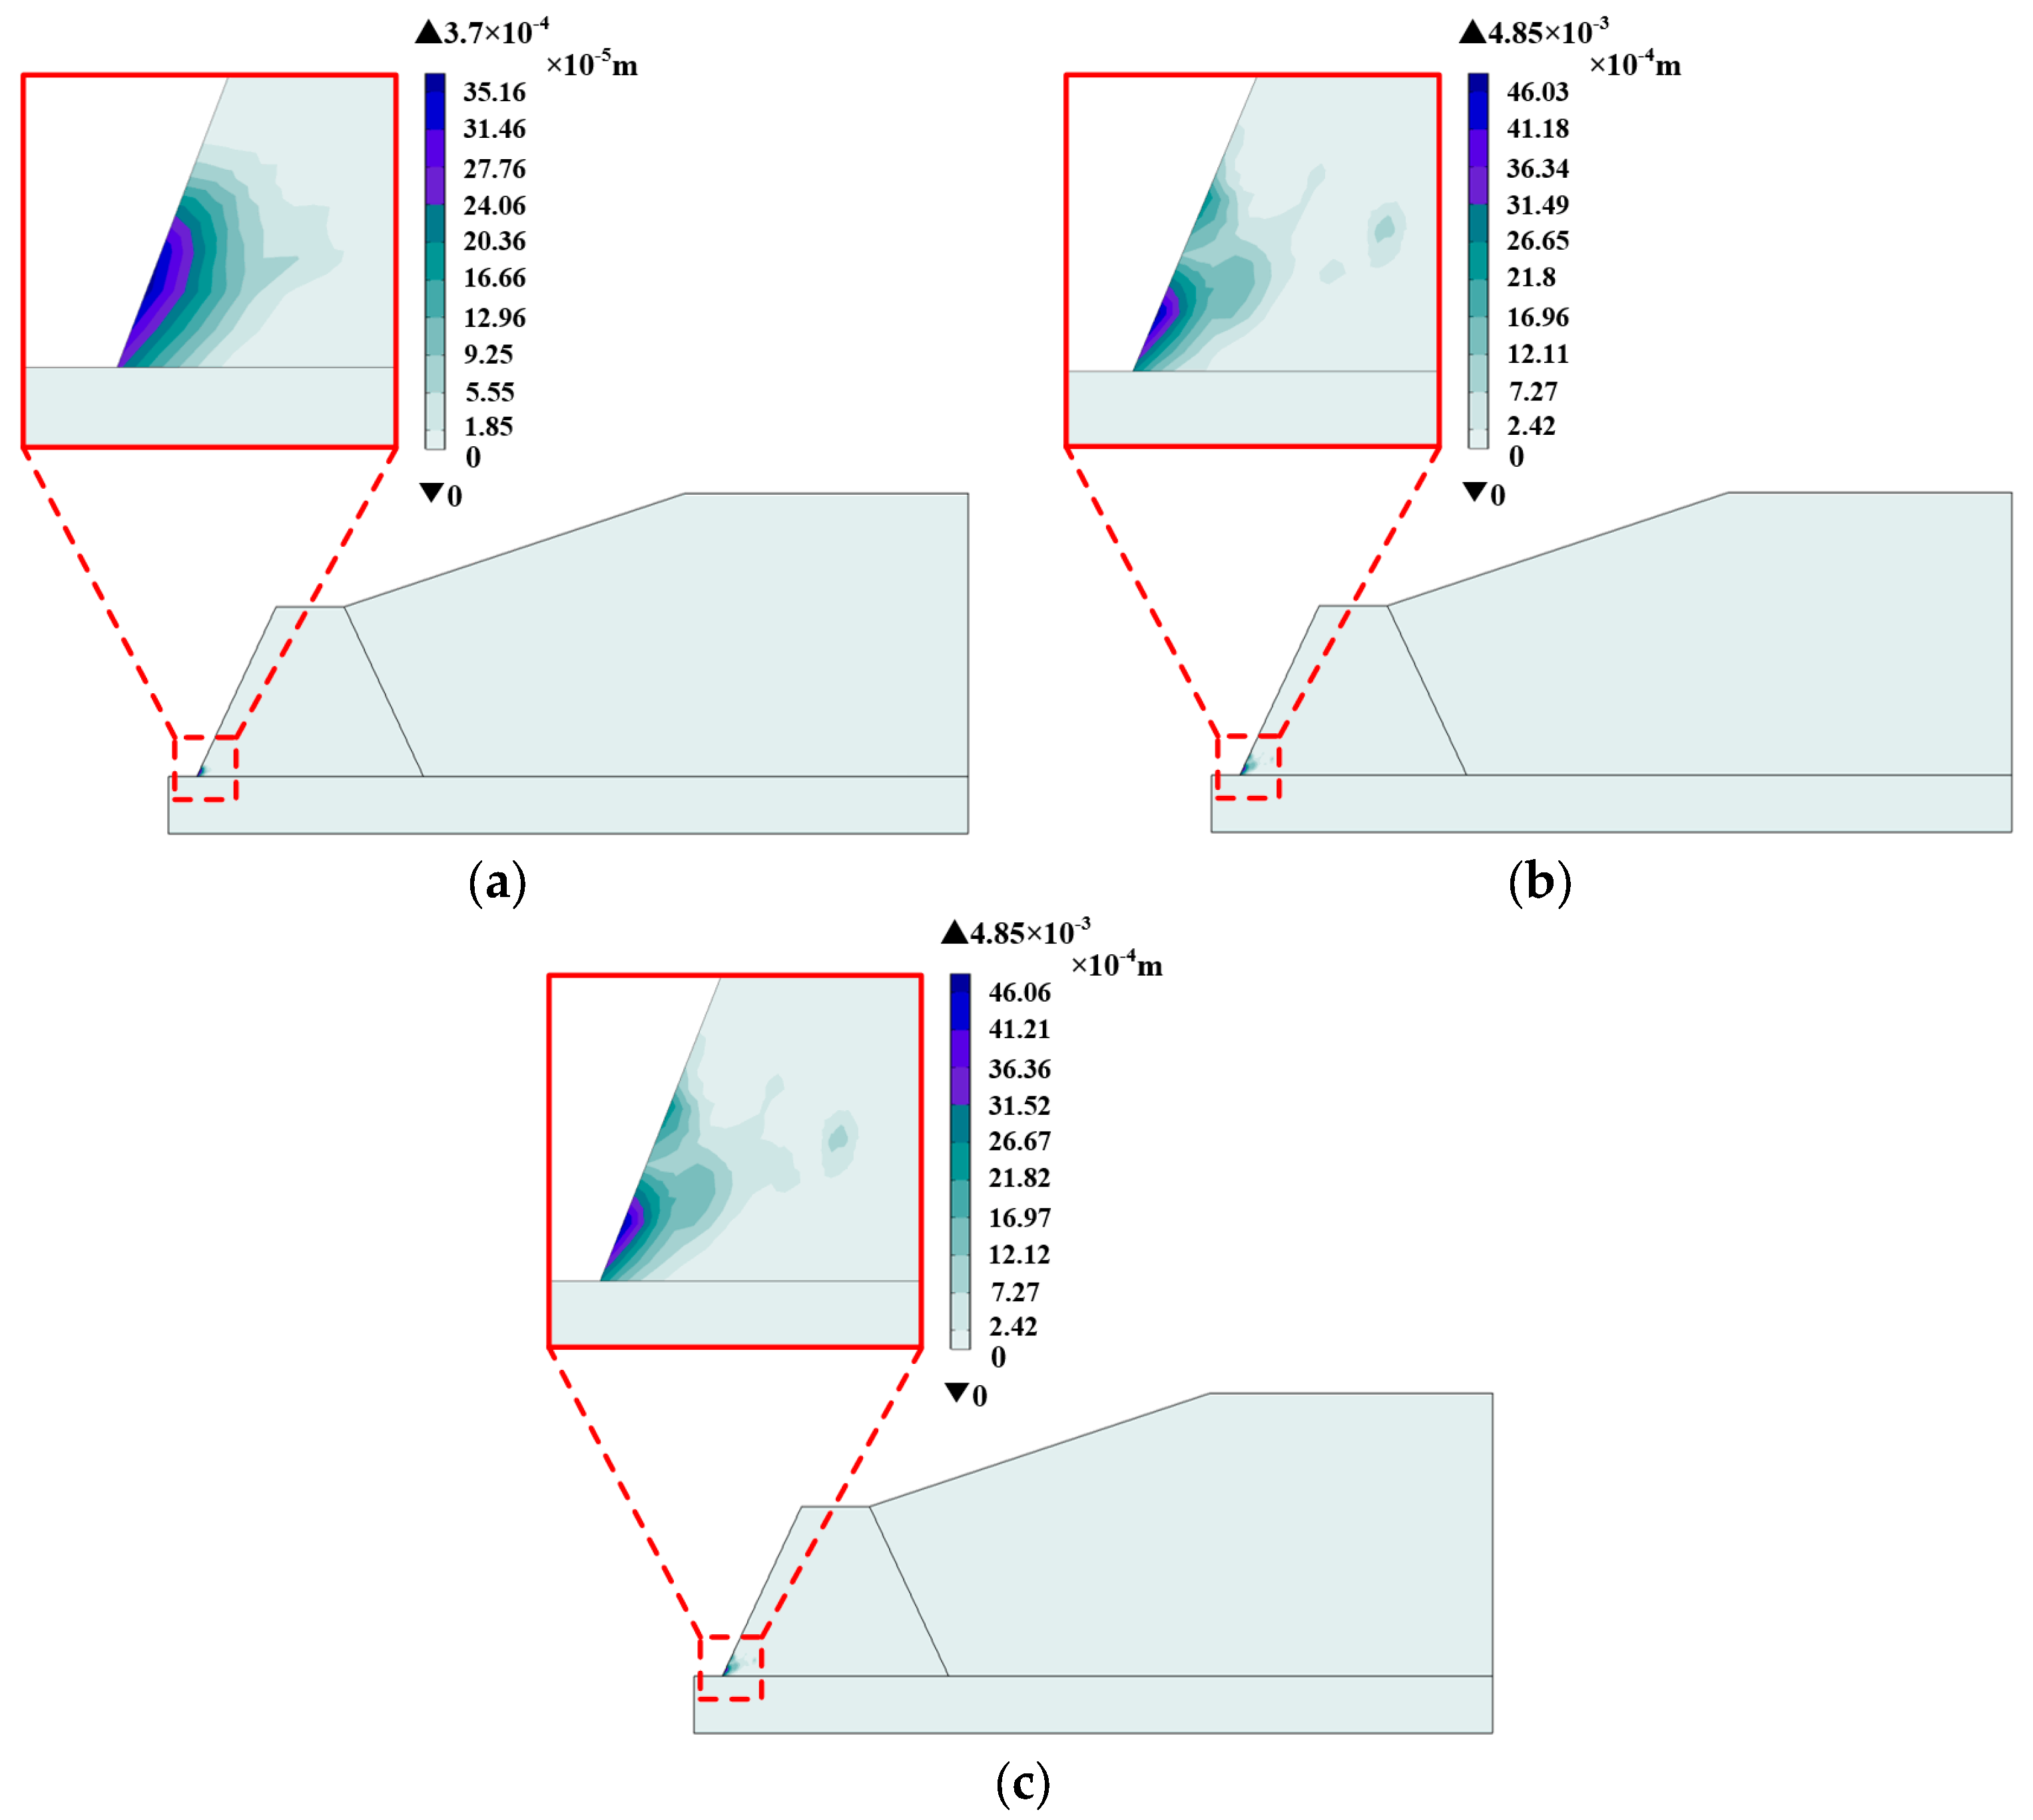
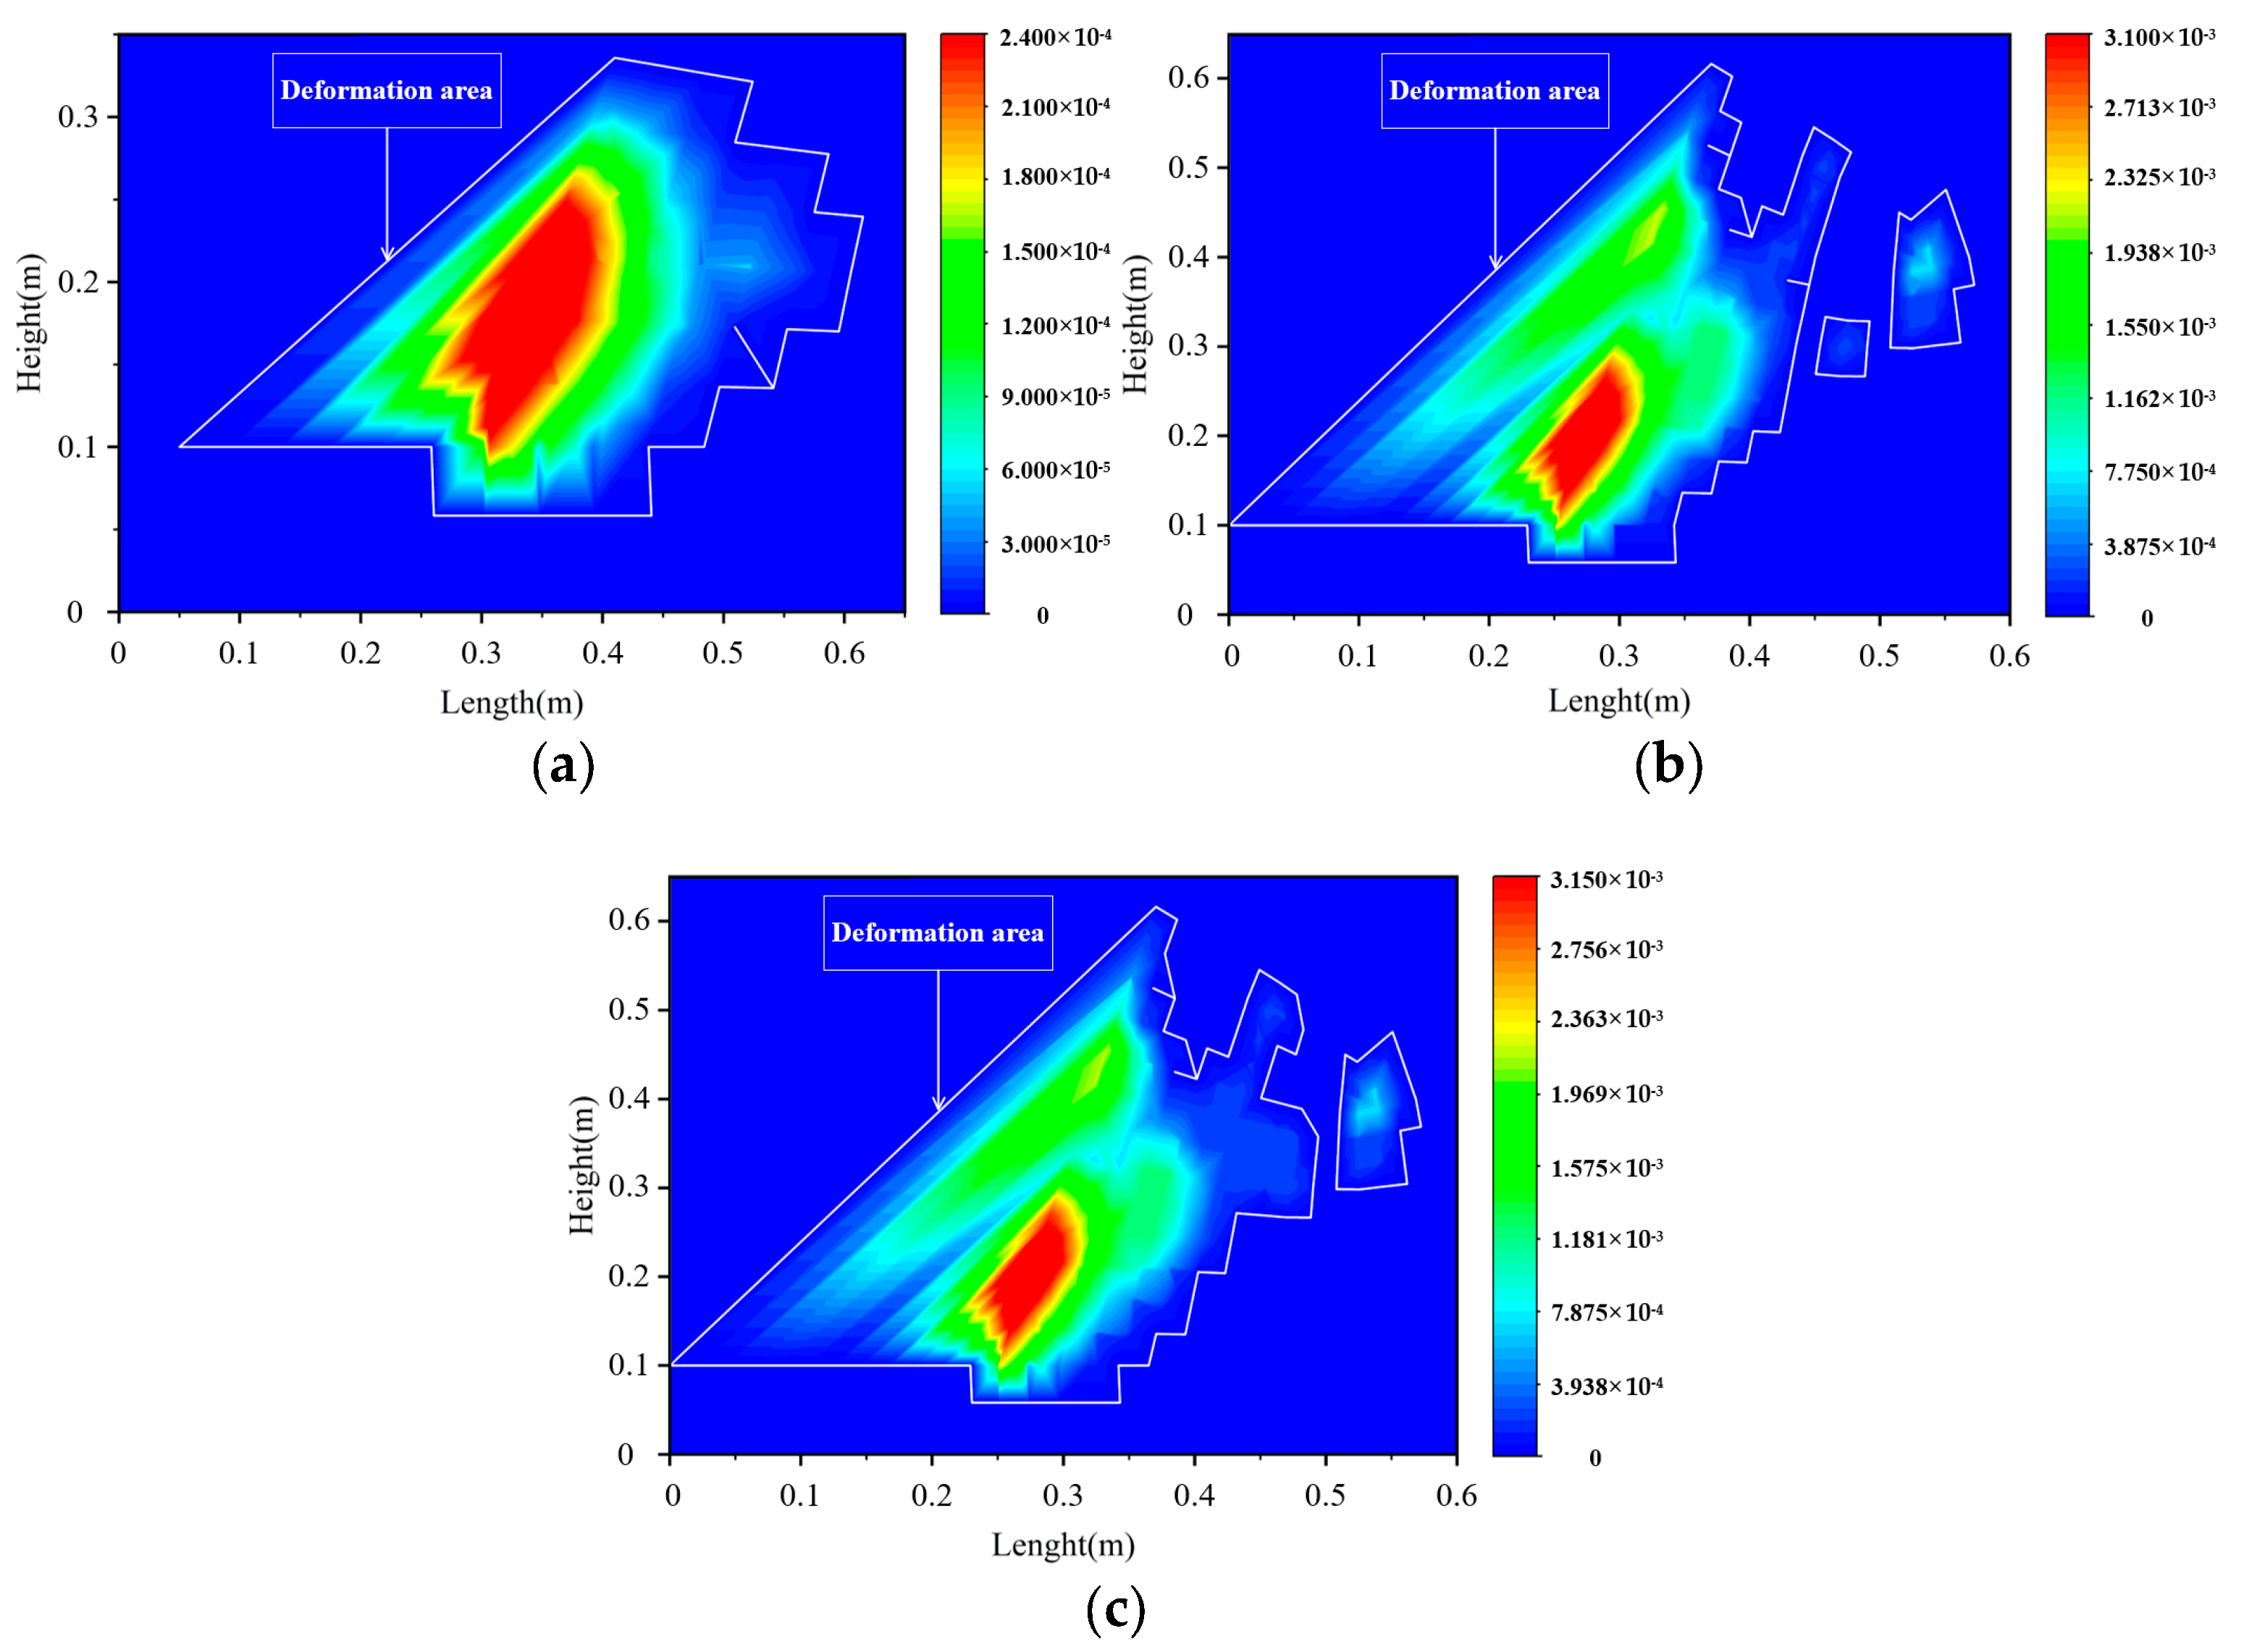
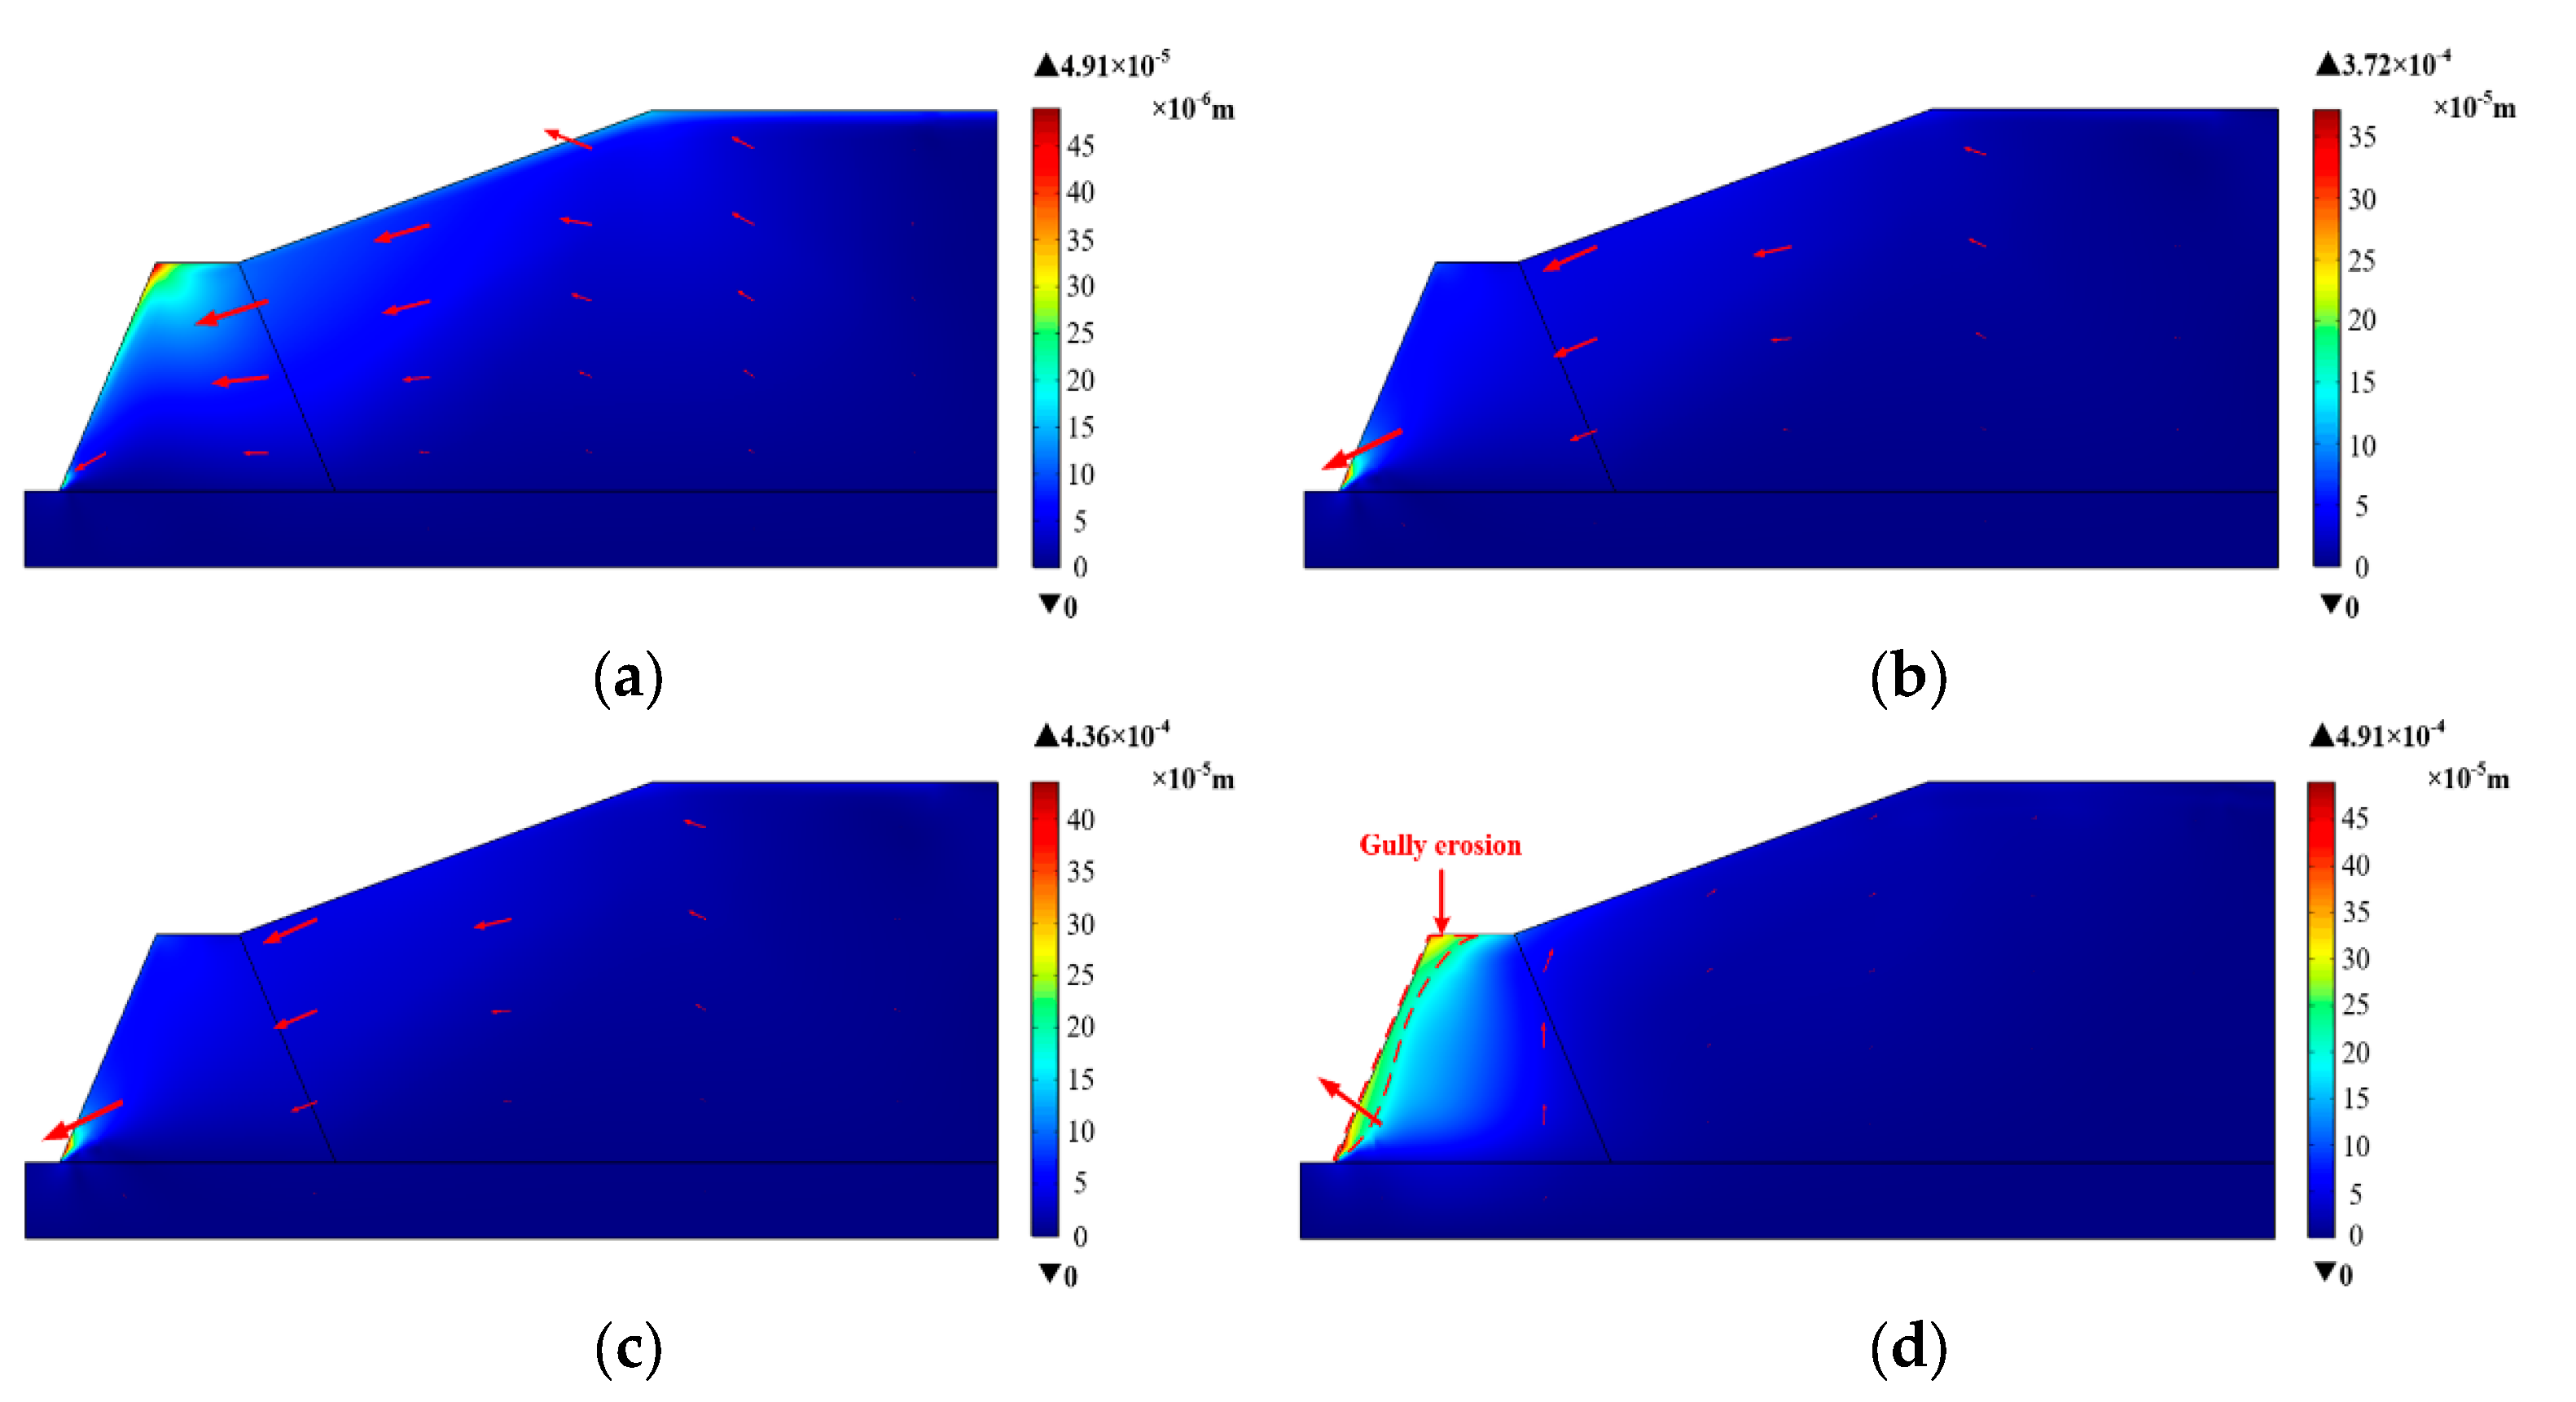
The characteristics of coupling deformation and failure under extreme rainfall conditions are as follows: the plastic deformation area gradually develops on the inside of the tailings dam after dampness and softening, and the area gradually expands. The dam toe and abutment area have obvious displacement, and the whole displacement field gradually transfers from the accumulative tailings to the tailings dam with the rainfall, which intensifies the deformation and damage of the tailings dam. The seepage of rainwater and the hydrodynamic force generated by runoff drive the deformation and failure of tailings dams, and the deformation and failure of tailings dams provide a dominant transport path for rainwater seepage;
(3)
Under extreme rainfall conditions, the dam toe and abutment are high-risk areas. They should be taken as the target areas for priority prevention and control. In actual projects, measures such as the drainage or covering of the dam surface should be taken to avoid damage to the rainwater acceleration tailings dam.
In this paper, the coupled deformation and failure of tailings dams under extreme rainfall conditions are taken as the analysis object, and inversion analysis is carried out through uncertainty cloud reasoning combined with the Morgenstern–Price method, which solves the uncertainty problem of the shear strength index. This study provides a new idea for studying the deformation and failure laws of tailings dams subjected to extreme rainfall.

Author Contributions

Conceptualization, C.X. and Z.C.; methodology, C.X.; software, Z.C.; validation, Z.C., C.X., G.X., J.S. and B.Y.; formal analysis, C.X.; investigation, Z.C.; resources, C.X.; data curation, Z.C.; writing—original draft preparation, Z.C.; writing—review and editing, C.X.; visualization, G.X., J.S. and B.Y.; supervision, Z.C.; project administration, C.X.; funding acquisition, G.X., J.S. and B.Y. All authors have read and agreed to the published version of the manuscript.

Funding

This research was funded by the Excellent Youth Project of Hunan Provincial Department of Education (No: 22B0164) and the Hunan Province Science Foundation (No: 2021JJ30679).

Institutional Review Board Statement

Not applicable.

Informed Consent Statement

Not applicable.

Data Availability Statement

Not applicable.

Conflicts of Interest

The authors declare no conflict of interest.

References

  1. Burritt, R.L.; Christ, K.L. Water risk in mining: Analysis of the Samarco dam failure. J. Clean. Prod. 2018, 178, 196–205. [Google Scholar] [CrossRef]
  2. Dong, L.; Deng, S.; Wang, F. Some developments and new insights for environmental sustainability and disaster control of tailings dam. J. Clean. Prod. 2020, 269, 122270. [Google Scholar] [CrossRef]
  3. Hancock, G. A method for assessing the long-term integrity of tailings dams. Sci. Total Environ. 2021, 779, 146083. [Google Scholar] [CrossRef] [PubMed]
  4. Pacheco, F.; Oliveira, M.; Oliveira, M.; Libanio, M.; Valle, J.F.; Melo, S.M.; Pissarra, T.; Melo, M.; Valera, C.; Fernandes, L. Water security threats and challenges following the rupture of large tailings dams. Sci. Total Environ. 2022, 834, 155285. [Google Scholar] [CrossRef] [PubMed]
  5. Buch, A.; Niemeyer, J.; Marques, E.; Silva-Filho, E. Ecological risk assessment of trace metals in soils affected by mine tailings. J. Hazard Mater. 2021, 403, 123852. [Google Scholar] [CrossRef]
  6. Clarkson, L.; Williams, D. An Overview of Conventional Tailings Dam Geotechnical Failure Mechanisms. Min. Met. Explor. 2021, 38, 1305–1328. [Google Scholar] [CrossRef]
  7. Piciullo, L.; Storrøsten, E.; Liu, Z.; Nadim, F.; Lacasse, S. A new look at the statistics of tailings dam failures. Eng. Geol. 2022, 303, 106657. [Google Scholar] [CrossRef]
  8. Owen, J.; Kemp, D.; Lèbre, É.; Svobodova, K.; Pérez, M.G. Catastrophic tailings dam failures and disaster risk disclosure. Int. J. Disaster Risk Reduct. 2020, 42, 101361. [Google Scholar] [CrossRef]
  9. Rico, M.; Benito, G.; Diez-Herrero, A. Floods from tailings dam failures. J. Hazard Mater. 2008, 154, 79–87. [Google Scholar] [CrossRef]
  10. Hatje, V.; Pedreira, R.; Rezende, C.; Schettini, C.; Souza, G.; Marin, D.; Hackspacher, P. The environmental impacts of one of the largest tailing dam failures worldwide. Sci. Rep. 2017, 7, 10706. [Google Scholar] [CrossRef]
  11. Dong, L.; Tong, X.; Li, X.; Zhou, J.; Wang, S.; Liu, B. Some developments and new insights of environmental problems and deep mining strategy for cleaner production in mines. J. Clean. Prod. 2019, 210, 1562–1578. [Google Scholar] [CrossRef]
  12. Čarman, M.; Jemec Auflič, M.; Komac, M. Landslides at a uranium mill tailing deposit site Boršt (Slovenia) detected by radar interferometry. Landslides 2014, 11, 527–536. [Google Scholar] [CrossRef]
  13. Jia, Y.; Xu, B.; Chi, S.; Xiang, B.; Xiao, D.; Zhou, Y. Joint back analysis of the creep deformation and wetting deformation parameters of soil used in the Guanyinyan composite dam. Comput. Geotech. 2018, 96, 167–177. [Google Scholar] [CrossRef]
  14. Yu, X.; Gong, B.; Tang, C. Study of the slope deformation characteristics and landslide mechanisms under alternating excavation and rainfall disturbance. Bull. Eng. Geol. Environ. 2021, 80, 7171–7191. [Google Scholar] [CrossRef]
  15. Yu, Y.; Zhang, B.; Yuan, H. An intelligent displacement back-analysis method for earth-rockfill dams. Comput. Geotech. 2007, 34, 423–434. [Google Scholar] [CrossRef]
  16. Lin, X.; Zhang, L.; Yang, Z.; Li, P.; Li, T. Inversion analysis of the shear strength parameters for a high loess slope in the limit state. J. Mt. Sci. 2020, 18, 252–264. [Google Scholar] [CrossRef]
  17. Daftaribesheli, A.; Ataei, M.; Sereshki, F. Assessment of rock slope stability using the Fuzzy Slope Mass Rating (FSMR) system. Appl. Soft. Comput. 2011, 11, 4465–4473. [Google Scholar] [CrossRef]
  18. Luo, Z.; Xie, C.; Jia, N.; Yang, B.; Cheng, G. Safe roof thickness and span of stope under complex filling body. J. Cent. South. Univ. 2013, 20, 3641–3647. [Google Scholar] [CrossRef]
  19. Xie, C.; Jia, N.; He, L. Study on the Instability Mechanism and Grouting Reinforcement Repair of Large-Scale Underground Stopes. Adv. Civ. Eng. 2020, 10, 8832012. [Google Scholar] [CrossRef]
  20. Kang, F.; Xu, B.; Li, J.; Zhao, S. Slope stability evaluation using Gaussian processes with various covariance functions. Appl. Soft. Comput. 2017, 60, 387–396. [Google Scholar] [CrossRef]
  21. Li, D.; Liu, C.; Gan, W. A new cognitive model: Cloud model. Int. J. Intell. Syst. 2009, 24, 357–375. [Google Scholar] [CrossRef]
  22. Wang, G.; Xu, C.; Li, D. Generic normal cloud model. Inform. Sci. 2014, 280, 1–15. [Google Scholar] [CrossRef]
  23. Wang, M.; Wang, X.; Liu, Q.; Shen, F.; Jin, J. A novel multi-dimensional cloud model coupled with connection numbers theory for evaluation of slope stability. Appl. Math. Model. 2020, 77, 426–438. [Google Scholar] [CrossRef]
  24. Wang, Y.; Yin, X.; Jing, H.; Liu, R.; Su, H. A novel cloud model for risk analysis of water inrush in karst tunnels. Environ. Earth Sci. 2016, 75, 1–3. [Google Scholar] [CrossRef]
  25. Yao, X.; Deng, H.; Zhang, T.; Qin, Y. Multistage fuzzy comprehensive evaluation of landslide hazards based on a cloud model. PLoS ONE 2019, 14, e0224312. [Google Scholar] [CrossRef]
  26. He, X.; Wang, J.; Feng, J.; Yan, Z.; Miao, S.; Zhang, Y.; Xia, J. Observational and modeling study of interactions between urban heat island and heatwave in Beijing. J. Clean. Prod. 2020, 247, 119169. [Google Scholar] [CrossRef]
  27. Naveendrakumar, G.; Vithanage, M.; Kwon, H.; Chandrasekara, S.; Iqbal, M.; Pathmarajah, S.; Fernando, W.; Obeysekera, J. South Asian perspective on temperature and rainfall extremes: A review. Atmos. Res. 2019, 225, 110–120. [Google Scholar] [CrossRef]
  28. Zipser, E.; Liu, C. Extreme Convection vs. Extreme Rainfall: A Global View. Curr. Clim. Change Rep. 2022, 7, 121–130. [Google Scholar] [CrossRef]
  29. Du, C.; Liang, L.; Yi, F.; Niu, B. Effects of Geosynthetic Reinforcement on Tailings Accumulation Dams. Water 2021, 13. [Google Scholar] [CrossRef]
  30. Kang, C.; Chen, S.; Chan, D.; Tfwala, S. Numerical modeling of large-scale dam breach experiment. Landslides 2020, 17, 2737–2754. [Google Scholar] [CrossRef]
  31. Gonzalez, F.; Raval, S.; Taplin, R.; Timms, W.; Hitch, M. Evaluation of Impact of Potential Extreme Rainfall Events on Mining in Peru. Nat. Resour. Res. 2018, 28, 393–408. [Google Scholar] [CrossRef]
  32. Nazrien, N.J.; Mohd, T.A.; Razali, I.; Abd, R.N.; Wan, M.W.; Karim, O.A.; Mat, D.S.; Awang, S.; Mohd, M. The Effect of Extreme Rainfall Events on Riverbank Slope Behaviour. Front. Env. Sci. 2022, 10, 176. [Google Scholar] [CrossRef]
  33. Zhao, N.; Hu, B.; Yi, Q.; Yao, W.; Ma, C. The Coupling Effect of Rainfall and Reservoir Water Level Decline on the Baijiabao Landslide in the Three Gorges Reservoir Area, China. Geofluids 2017, 12, 3724867. [Google Scholar] [CrossRef]
  34. Yeh, H.; Tsai, Y. Effect of Variations in Long-Duration Rainfall Intensity on Unsaturated Slope Stability. Water 2018, 10, 479. [Google Scholar] [CrossRef]
  35. Gui, R.; He, G. The Effects of Internal Erosion on the Physical and Mechanical Properties of Tailings under Heavy Rainfall Infiltration. Appl. Sci. 2021, 11, 9496. [Google Scholar] [CrossRef]
  36. Yang, Y.; Cai, R.; Zhang, G.; Su, S.; Liu, W. Evaluating and analyzing the stability of loess slope using intermittent rainfall and various rainfall patterns. Arab. J. Geosci. 2022, 15, 218. [Google Scholar] [CrossRef]
  37. Jiang, X.; Wörman, A.; Chen, P.; Huang, Q.; Chen, H. Mechanism of the progressive failure of non-cohesive natural dam slopes. Geomorphology 2020, 363, 107198. [Google Scholar] [CrossRef]
  38. Hu, W.; Xin, C.; Li, Y.; Zheng, Y.; van Asch, T.; McSaveney, M. Instrumented flume tests on the failure and fluidization of tailings dams induced by rainfall infiltration. Eng. Geol. 2021, 294, 106401. [Google Scholar] [CrossRef]
  39. Xu, J.; Ueda, K.; Uzuoka, R. Evaluation of failure of slopes with shaking-induced cracks in response to rainfall. Landslides 2021, 19, 119–136. [Google Scholar] [CrossRef]
  40. Tian, S.; Dai, X.; Wang, G.; Lu, Y.; Chen, J. Formation and evolution characteristics of dam breach and tailings flow from dam failure: An experimental study. Nat. Hazards 2021, 107, 1621–1638. [Google Scholar] [CrossRef]
  41. Zhong, Q.; Chen, S.; Mei, S.; Cao, W. Numerical simulation of landslide dam breaching due to overtopping. Landslides 2017, 15, 1183–1192. [Google Scholar] [CrossRef]
  42. Xie, C.; Nguyen, H.; Choi, Y.; Jahed, A.D. Optimized functional linked neural network for predicting diaphragm wall deflection induced by braced excavations in clays. Geosci. Front. 2022, 13, 101313. [Google Scholar] [CrossRef]
  43. Qiu, X.; Li, J.; Jiang, H.; Ou, J.; Ma, J. Evolution of the Transient Saturated Zone and Stability Analysis of Slopes under Rainfall Conditions. KSCE J. Civ. Eng. 2022, 26, 1618–1631. [Google Scholar] [CrossRef]
  44. Khan, K.; Wang, C.; Khan, M.; Liang, Z.; Li, S.; Li, B. Influence of rainfall infiltration on the stability of unsaturated coal gangue accumulated slope. J. Mt. Sci. 2021, 18, 1696–1709. [Google Scholar] [CrossRef]
  45. Zhou, C.; Ai, D.; Huang, W.; Xu, H.; Ma, L.; Chen, L.; Wang, L. Emergency Survey and Stability Analysis of a Rainfall-Induced Soil-Rock Mixture Landslide at Chongqing City, China. Front. Earth Sci. 2021, 9, 774200. [Google Scholar] [CrossRef]
  46. Wu, K.; Chen, N.; Hu, G.; Han, Z.; Ni, H.; Rahman, M. Failure mechanism of the Yaoba loess landslide on 5 March 2020: The early-spring dry spell in Southwest China. Landslides 2021, 18, 3183–3195. [Google Scholar] [CrossRef]
  47. Li, S.; Yuan, L.; Yang, H.; An, H.; Wang, G. Tailings dam safety monitoring and early warning based on spatial evolution process of mud-sand flow. Saf. Sci. 2020, 124, 104579. [Google Scholar] [CrossRef]
  48. Xie, C.; Nguyen, H.; Bui, X.; Nguyen, V.; Zhou, J. Predicting roof displacement of roadways in underground coal mines using adaptive neuro-fuzzy inference system optimized by various physics-based optimization algorithms. J. Rock Mech. Geotech. 2021, 13, 1452–1465. [Google Scholar] [CrossRef]
  49. Sun, G.; Cheng, S.; Jiang, W.; Zheng, H. A global procedure for stability analysis of slopes based on the Morgenstern-Price assumption and its applications. Comput. Geotech. 2016, 80, 97–106. [Google Scholar] [CrossRef]
  50. Ouyang, W.; Liu, S.; Yang, Y. An improved morgenstern-price method using gaussian quadrature. Comput. Geotech. 2022, 148, 104754. [Google Scholar] [CrossRef]
  51. Liu, X.; Zhang, M.; Sun, Z.; Zhang, H.; Zhang, Y. Comprehensive evaluation of loess collapsibility of oil and gas pipeline based on cloud theory. Sci. Rep. 2021, 11, 15422. [Google Scholar] [CrossRef]
  52. Cao, W.; Deng, J.; Yang, Y.; Zeng, Y.; Liu, L. Water Carrying Capacity Evaluation Method Based on Cloud Model Theory and an Evidential Reasoning Approach. Mathematics 2022, 10, 266. [Google Scholar] [CrossRef]
  53. Zhang, H.; Wang, T.; Ding, Z.; Zhang, X.; Han, L. Uncertainty analysis of impact factors of eco-environmental vulnerability based on cloud theory. Ecol. Indic. 2020, 110, 105864. [Google Scholar] [CrossRef]
  54. Wu, D.; Deng, T.; Duan, W.; Zhang, W. A coupled thermal-hydraulic-mechanical application for assessment of slope stability. Soils Found. 2019, 59, 2220–2237. [Google Scholar] [CrossRef]
  55. Wang, T.; Li, S.; Xu, Z.; Hu, J.; Pan, D.; Xue, Y. Risk assessment of water inrush in karst tunnels excavation based on normal cloud model. Bull. Eng. Geol. Environ. 2018, 78, 3783–3798. [Google Scholar] [CrossRef]
  56. Cao, J.; Xie, C.; Hou, Z. Spatiotemporal distribution patterns and risk characteristics of heavy metal pollutants in the soil of lead–zinc mines. Environ. Sci. Eur. 2022, 34, 1–14. [Google Scholar] [CrossRef]
  57. Zou, J.; Zhang, R.; Zhou, F.; Zhang, X. Hazardous area reconstruction and law analysis of coal spontaneous combustion and gas coupling disasters in goaf based on DEM-CFD. ACS. Omega 2023, 8, 2685–2697. [Google Scholar] [CrossRef]
  58. Cao, J.; Xie, C.; Hou, Z. Transport patterns and numerical simulation of heavy metal pollutants in soils of lead-zinc ore mines. J. Mt. Sci.-Engl. 2021, 18, 2345–2356. [Google Scholar] [CrossRef]
Figure 1. Location of the dry tailings stocking yard.
Sustainability 15 06106 g001
Figure 2. Landslide location of the tailings dam. Yellow frame: dam surface under unstable state. Red frame: shallow landslide area on the dam surface.
Sustainability 15 06106 g002
Figure 3. Morgenstern–Price method theory (a) Model of an arbitrarily shaped soil slope (b) Force analysis diagram for any differential soil strip. dW—weight of a soil strip; dN′—effective normal reaction force at the bottom of the soil strip; dT—frictional resistance of the soil strip; F′, F′ + dF′—horizontal effective normal strip force on both sides of the soil strip; X, X + dX—force between tangential strips at both sides of the soil strip; V, V + dV—pore water stress acting on both sides of the soil strip; dVS—pore water stress acting on the bottom of the soil strip.
Sustainability 15 06106 g003
Figure 4. Normal cloud model digital features.
Sustainability 15 06106 g004
Figure 5. Roadmap of uncertain cloud reasoning inversion technology.
Sustainability 15 06106 g005
Figure 6. Technology roadmap of fluid structure coupling modeling.
Sustainability 15 06106 g006
Figure 7. Sensitivity analysis of the change in shear strength parameters on the safety factor Fs. (a) Cohesion C; (b) internal friction angle φ.
Sustainability 15 06106 g007
Figure 8. The minimum safety factor and sliding surface of tailings dams under different cohesion C: (a) Fs = 1.000; (b) Fs = 1.050; (c) Fs = 1.103.
Sustainability 15 06106 g008aSustainability 15 06106 g008b
Figure 9. Forward cloud map of each interval: (a) Ex = 7.8, En = 0.266, He = 0.0266; (b) Ex = 8.2, En = 0.266, He = 0.0266; (c) Ex = 8.6, En = 0.266, He = 0.0266; (d) Ex = 9, En = 0.266, He = 0.0266; (e) Ex = 9.4, En = 0.266, He = 0.0266.
Sustainability 15 06106 g009aSustainability 15 06106 g009b
Figure 10. Safety coefficient Fs qualitative concept cloud map.
Sustainability 15 06106 g010
Figure 11. Cohesion C = 8.6901 kPa; tailings dam safety factor and sliding surface.
Sustainability 15 06106 g011
Figure 12. Mesh quality.
Sustainability 15 06106 g012
Figure 13. Equivalent plastic strain of the tailings dam: (a) T = 0.01 h; (b) T = 0.05 h; (c) T = 1 h.
Sustainability 15 06106 g013
Figure 14. Equivalent plastic strain area cloud pictures of the tailings dam: (a) T = 0.01 h; (b) T = 0.05 h; (c) T = 1 h.
Sustainability 15 06106 g014
Figure 15. Displacement cloud pictures of the tailings dam: (a) T = 0.01 h; (b) T = 0.05 h; (c) T = 0.5 h; (d) T = 1 h.
Sustainability 15 06106 g015
Figure 16. Monitoring point M1 and M2 displacement. (Ⅰ: Unstable change phase of displacement change. Ⅱ: Stable growth phase of displacement change. A: Maximum value in unstable change stage of displacement. B: Minimum value in unstable change stage of displacement).
Sustainability 15 06106 g016
Table 1. Calculation results in the first range of cohesion C.
Cohesion (kPa)Fs
1C7.501310.943
8.301501.027
7.700460.976
7.402590.939
7.899530.979
8.000751.006
8.202111.023
7.600600.952
Ex1C7.81.000
Table 2. Calculation results in the second range of cohesion C.
Cohesion (kPa)Fs
2C8.004801.006
8.100811.021
8.300781.030
8.401211.035
7.799910.998
7.900930.979
8.500721.043
8.600471.050
Ex2C8.21.023
Table 3. Calculation results in the third range of cohesion C.
Cohesion (kPa)Fs
3C8.401681.035
8.500641.043
8.700931.061
8.801291.070
8.202081.023
8.300441.030
9.002981.084
8.901351.079
Ex3C8.61.05
Table 4. Calculation results in the fourth range of cohesion C.
Cohesion (kPa)Fs
4C8.800211.070
8.900511.079
9.100941.094
9.200221.104
8.603541.050
8.701891.061
9.302141.109
9.407961.113
Ex4C91.066
Table 5. Calculation results in the fifth range of cohesion C.
Cohesion (kPa)Fs
5C9.200951.104
9.300101.109
9.502461.122
9.600231.136
9.003501.091
9.106231.094
9.700471.144
9.800631.152
Ex5C9.41.103
Table 6. Cloud numerical characteristics of the qualitative concept of cohesion C.
1C2C3C4C5C
FsEx1.0001.0231.0501.0661.103
En0.2520.01940.02170.0200.202
He0.00306930.00236930.00256070.00250000.0025006
Table 7. Cloud representation of qualitative concepts of rule antecedent and rule consequent.
Cloud Representation of Qualitative Concept of Rule Antecedents of FsCloud Representation of Qualitative Concept of Rule Consequent of C
PREAC1 = PRE (1.000, 0.0252, 0.0030693)POSTBC1 = POST (7.8, 0.266, 0.0266)
PREAC2 = PRE (1.023, 0.0194, 0.0023693)POSTBC2 = POST (8.2, 0.266, 0.0266)
PREAC3 = PRE (1.050, 0.0217, 0.0025607)POSTBC3 = POST (8.6, 0.266, 0.0266)
PREAC4 = PRE (1.066, 0.0200, 0.0025000)POSTBC4 = POST (9.0, 0.266, 0.0266)
PREAC5 = PRE (1.103, 0.0202, 0.0025006)POSTBC5 = POST (9.4, 0.266, 0.0266)
Table 8. Model parameters of the tailings’ storage yard.
MaterialBulk Density
ρ (kg/m3)
Young’s Modulus E (Pa)Poisson’s Ratio
μ
Cohesion
C (kPa)
Internal Friction Angle
φ (°)
Hydraulic Conductivity K (m/s)
Tailings dam22002.0 × 1070.289.5623.14.1 × 10−5
Tailings28203.5 × 1070.279.8026.65.5 × 10−5
Foundation23003.0 × 1070.3030.0025.01.5 × 10−7
Disclaimer/Publisher’s Note: The statements, opinions and data contained in all publications are solely those of the individual author(s) and contributor(s) and not of MDPI and/or the editor(s). MDPI and/or the editor(s) disclaim responsibility for any injury to people or property resulting from any ideas, methods, instructions or products referred to in the content.

