Article

Effects of Urea Application on Soil Organic Nitrogen Mineralization and Nitrogen Fertilizer Availability in a Rice–Broad Bean Rotation System

1
Faculty of Modern Agricultural Engineering, Kunming University of Science and Technology, Kunming 650500, China
2
Yunnan Institute of Water and Hydropower Engineering Investigation, Design and Research, Kunming 650051, China
*
Author to whom correspondence should be addressed.
Sustainability 2023, 15(7), 6091; https://doi.org/10.3390/su15076091
Submission received: 28 February 2023 / Revised: 26 March 2023 / Accepted: 28 March 2023 / Published: 31 March 2023
(This article belongs to the Special Issue The Sustainability of Agricultural Soils)

Abstract

:
Rice cultivation is facing a situation where rice production stagnates while nitrogen fertilizer (NF) application continues to increase. The effectiveness of the NF residues from the rice season on the growth of rotating broad beans is unclear. High NF use in rice cultivation also affects the nitrogen supply through soil organic nitrogen (SON) mineralization (SONM). However, the rules of SONM and the NF availability in the rice–broad bean rotation system (RBRS) are unknown. A field trial of the RBRS was conducted using 15N-labeled urea (CO(15NH2)2) as the partial NF source (15N accounted for 5.3% of the total pure nitrogen applied) for the rice and no NF for the broad bean. It was found that 33.0–38.1% of NF in the rice season was utilized. NF availability was low in the broad bean season (3.6–4.0%). SONM was the most important source, providing approximately 60% of the nitrogen for rice growth. The SONM into mineral nitrogen and the fixation of mineral nitrogen into SON occurred simultaneously, with SONM dominating in most cases. SON content decreased slowly in the rice season and dramatically in the broad bean’s podding stage with a 0.64 g kg−1 (24.1%) decrease. The high nitrogen application in rice season promoted SONM and aggravated groundwater pollution. Soil urease activity, rather than catalase, phosphatase, and invertase activities, can be the main monitoring object of SONM. Furthermore, fungal abundance (especially Aspergillaceae, Neuroceae, and unclassified_o__Helotiales), rather than bacteria, was the primary target for SONM monitoring. It is unreasonable to apply large amounts of NF in the rice season but not in the broad bean season in the RBRS. N1 (135 kg N ha−1) had the best comprehensive benefits regarding crop yield, nitrogen supply by SONM, NF utilization, and nitrogen loss on the environment in the RBRS.

1. Introduction

Rice is the world’s most important crop, the staple food for more than half of the world’s population [1]. Broad bean is the world’s third most important winter food bean crop, with a total planted area of 2.2 million hectares [2]. The rice–broad bean rotation system (RBRS) is a universal and important global agricultural production system, and its sustainable production affects world food security [3]. However, large amounts of nitrogen fertilizer (NF) were applied to paddy fields to ensure high rice yields, especially in China [4]. Rice yields have stagnated in 79% of paddy fields in China [5]. At the same time, the amount of NF applied continues to increase, with an average nitrogen fertilization rate of over 300 kg ha−1 yr−1. This is considerably higher than the optimal level of NF application, which ranges from 185 kg ha−1 to 270 kg ha−1 as reported in China [1]. Over 50% of this input nitrogen is lost to the environment through multiple pathways [6].
Farmers believe that heavy NF application guarantees high rice yields. The broad bean rotation will absorb unused NF in the rice season [7]. For this reason, the common phenomenon of high nitrogen application in rice season and no nitrogen application in broad bean season was formed in the RBRS. Broad beans can grow normally under this operation. However, whether they are high-yield and how much nitrogen absorbed by broad beans comes from the NF residues in the rice season is still unclear. The NF applied to the paddy field has three main destinations, absorbed and used by the crops in the season, left in the soil, or lost through gaseous discharge and water loss [6,8]. The utilization rate and direct loss of NF in the current season are closely related to the high yield and efficiency of rice and the health of the ecological environment, so they have received extensive attention and research. However, few studies have been conducted on the availability of rice season residual nitrogen in the rotating broad bean season [9].
Compared to applying NF, studies have shown that soil organic nitrogen mineralization (SONM) is the crops’ most important nitrogen source [10]. Soil physicochemical properties (nitrogen content, pH, and so on) and microecological environment (enzyme activity and microbial diversity and abundance) affect SONM [11,12]. Soil moisture status does not promote mineralization [13,14]. Microorganisms are important in SONM for the nitrogen supply [15,16,17]. Microorganisms fix the partial NF in paddy fields through soil organic nitrogen (SON). Microorganisms mineralize SON into mineral nitrogen, which is then absorbed and utilized by broad beans [11]. NF application can quickly change soil physicochemical properties and the microecological environment, thus, causing changes in SONM rate and net mineralization [18,19]. In addition, the reactive substrate content and soil physicochemical properties result from nitrogen application, which determines the soil microbial community structure and functional microbial population response [20]. All these influences can affect the SONM for nitrogen supply [21,22]. The role of physicochemical properties and the microecological environment in SONM could be different, but the contributions of these components to SONM are not systematically studied. More importantly, SONM is closely related to the NF availability in the RBRS. It is an important basis for selecting the appropriate NF application amount in the rice season. However, the effects of NF application on SONM in rice season and the probability or degree of NF residues in rice season being mineralized again after being fixed into organic nitrogen are also unknown.
Based on the problems mentioned above, this study used 15N-labeled urea (Urea is the most commonly used NF in paddy fields [23]) as the nitrogen source to (i) study the mechanisms of SONM, (ii) illustrate the effects of urea application on SONM and NF availability, and (iii) propose the optimum urea application rate by analyzing crop yield, SONM, NF availability, and the effects of nitrogen loss on groundwater pollution comprehensively in the RBRS. The study result is expected to provide theoretical and technical support for improving the NF use efficiency in the RBRS, achieving green and sustainable development.

2. Materials and Methods

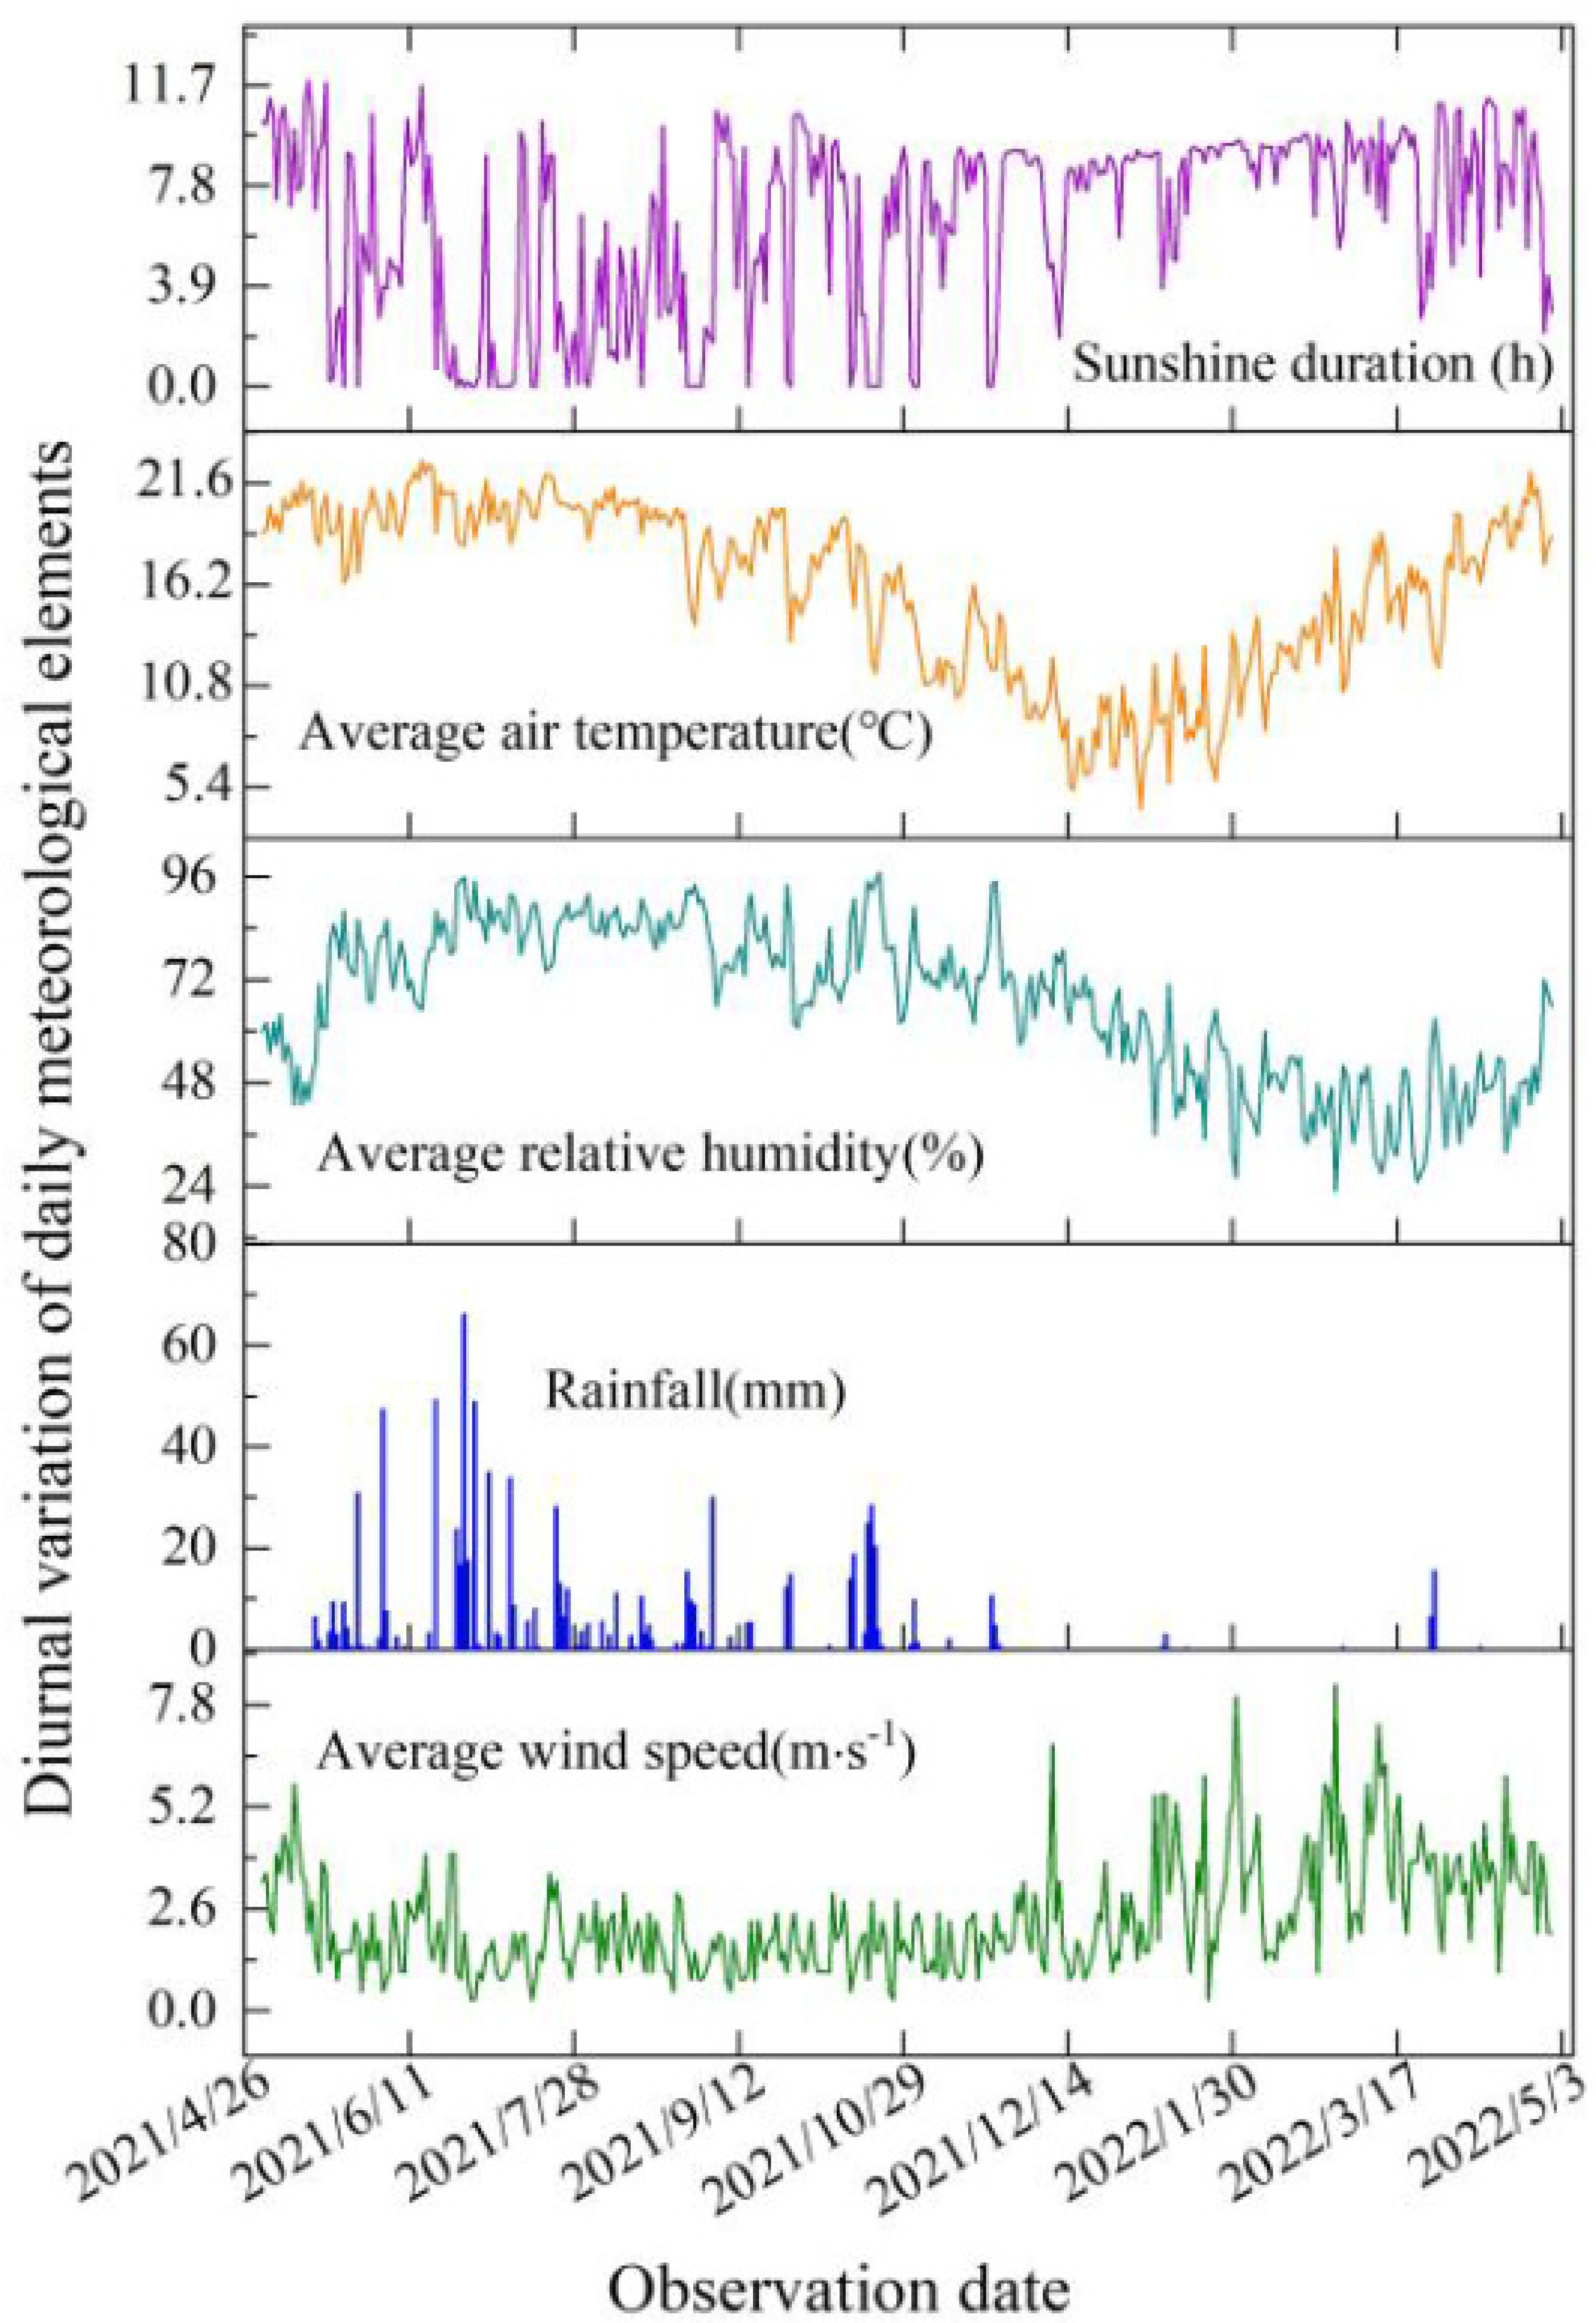
2.1. Test Area Overview

The experiment was conducted at the National Agricultural Environment Dali Observation and Experiment Station in the Erhai Basin, Yunnan Province, China (100°7′50″ E, 25°49′47″ N) in 2021–2022. The test area is a low-latitude plateau with a typical low-latitude plateau monsoon climate, with distinct dry and wet seasons and rainfall mainly concentrated from June to October, accounting for 85–95% of the annual rainfall, with an average annual rainfall of 1034.9 mm. The temperature difference between the four seasons is insignificant, with an average annual sunshine duration of 2439 h and an average annual temperature of 15 °C in the last 15 years. The soil was fertile sandy loam in this area, and the initial soil contents of total nitrogen (TN), total phosphorus, total potassium, NH4+-N, and NO3-N were 3.3 g kg−1, 1.56 g kg−1, 15.4 g kg−1, 4.2 mg kg−1, and 5.88 mg kg−1, respectively, in the field test. The average particle size was 19.26 um. The bulk density was 1.14 g cm−3, the volumetric field water holding rate was 21.2%, and the volumetric saturated water content was 55.0%.
In the rice growing season (May to October 2021), the total sunshine hours were 706.7 h, and the mean air temperature was 19.7 °C. Furthermore, the average relative humidity was 79.1%, the mean wind speed was 1.8 m s−1, and cumulative precipitation was 686.6 mm, mainly concentrated in June and July. In the broad bean growing season (November 2021 to April 2022), the total sunshine hours were 1657.4 h, and the mean air temperature was 13.3 °C. The average relative humidity was 57.9%, the mean wind speed was 2.7 m s−1, and cumulative precipitation was 174.4 mm (Figure 1).

2.2. Experimental Design

There were three treatments (N0, N1, and N2) in the RBRS, each repeated three times, with nine leaching ponds, and a leaching pond was 1.0 m × 1.0 m × 0.8 m (length × width × Depth). The experiment was conducted in the rice season with three urea nitrogen application levels of N2 (193 kg N ha−1, traditional urea application amount in the Erhai irrigation district), N1 (135 kg N ha−1, 70% of N0, reducing fertilization mode), and N0 (no NF) under alternate wetting and drying irrigation mode. Due to the high price of 15N labeled urea (CO(15NH2)2), a small amount of CO(15NH2)2 was mixed with ordinary urea and applied to the leaching ponds, 15N accounted for 5.3% of the total NF applied. Under N2, each leaching pond was applied 19.3 g of the NF, mixed with 10 g of 15N labeled urea (15N content is 10.2%, produced by Shanghai Chemical Research Institute Co., Ltd. Shanghai, China) and 39.7 g of ordinary urea (nitrogen content is 46.0%). Under N1, each leaching pond was applied with 13.5 g of the NF, mixed with 7 g of 15N labeled urea and 27.8 g of ordinary urea. Urea nitrogen was applied in three splits during the rice season, and the ratio of base NF (BF): tillering NF (TF): panicle NF (PF) = 50%:30%:20%. Urea was applied to all NF, and phosphorus (65 kg P2O5 ha−1) and potassium (60 kg K2O ha−1) fertilizers were applied to leaching ponds at the base NF stage in the rice season. The base NF was applied and spread on the ground while leveling the land. Moreover, the tillering NF and panicle NF were sown on the field surface.
The rice was transplanted on 3 June 2021, with 30 holes in each leaching pond, and the plant spacing and row spacing were, respectively, 15 cm and 20 cm. The rice variety was Huijing 27. Rice was harvested on 1 October 2021. After the rice harvest, broad beans were directly sown in the leaching ponds without tillage and no NF application under deficit irrigation mode on 11 November 2021 and harvested on 20 April 2022. There were 25 holes of broad beans in each leaching pond. The variety of broad bean was Fengdou 6. The rice and broad beans in each leaching pond were harvested separately, and the yield was measured when the seeds were dried to 14% moisture content.

2.3. Observation Contents and Methods

Five soil samples were taken from each leaching pond at three depths (surface layer (0–10 cm), tillage layer (10–20 cm), and plow pan (20–40 cm)), and the samples from the same soil layer were mixed homogeneously. The sampling frequency was once every two weeks for the rice season and once every three weeks for the broad bean season. Each sample was divided into two parts. One part of the soil sample was air-dried to determine chemical properties and the other was liquid-N2-frozen immediately for microbial analysis [24]. Two plant holes were taken from each leaching pond during each growth season of rice and broad beans for chemical properties analysis. Groundwater samples were taken every other day and collected simultaneously at 20 cm, 40 cm, and 60 cm depths in the rice season [6].
The soil moisture was automatically monitored hourly by the soil moisture sensor EM50. After water extraction, soil samples were thoroughly stirred; then, soil mineral nitrogen (NH4+-N, NO3-N) was measured using UV spectrophotometry [6]. The TN of the soil and plants was observed by the Kjeldahl method. The SON content was obtained by subtracting the mineral nitrogen from total soil TN [6]. The NH4+-N and NO3-N concentrations in water samples were measured by Naismith’s reagent UV spectrophotometry and hydrochloric acid acidification–UV spectrophotometry, respectively [6].
The activity of soil urease was determined by phenol-sodium hypochlorite colorimetry. First, 5.0 g fresh soil samples were mixed in a 50 mL volumetric bottle with 0.2 mL toluene and 9 mL lentil. Then, the solution was flushed, shaken, and mixed well. A 1.0 mL urea solution was added, shaken, mixed, and plugged into the bottle. The culture was incubated at 37 °C for two h. Then, approximately 35 mL of KCl-Ag2SO4 solution was added, and the volumetric bottle was shaken gently for a few seconds, then placed at room temperature (about 5 min), held with KCl-Ag2SO4 solution, and shaken well. At this time, 20 mL of the soil suspension was taken into the distillation bottle, 0.2 g of MgO was added, and boric acid indicated the solution was absorbed. The volume of the distillation liquid was approximately 30 mL. The activity of the soil urease was titrated with c(1/2 H2SO4) = 0.005 mol L−1 H2SO4 standard solution [25].
The activity of phosphatase was determined by sodium diphenyl phosphate colorimetry. First, 2–5 g soil samples were placed in a 200 mL triangular bottle, 2.5 mL toluene was added and gently shaken for 15 min; then, 20 mL disodium benzene phosphate (0.5%) was added and carefully shaken, then placed in an incubator and incubated at 37 °C for 24 h. Then, 100 mL aluminum acid solution (0.3%) was added to the culture medium and filtered. Next, 3 mL filtrate was absorbed into a 50 mL volumetric bottle and then developed color by drawing standard curves. When borate buffer was used, it appeared blue and was colorimetric at 660 nm on a spectrophotometer [26].
The activity of invertase was determined by 3,5-dinitro salicylic acid colorimetry. First, 5 g of soil (accurate to 0.0001 g) was weighed and placed in a 50 mL stoppered triangular flask. Then, 15 mL of sucrose solution (80 g L−1), 5 mL phosphate buffer (pH 5.5), and 5 drops of toluene were added. Then it was shaken and mixed well, placed in a constant temperature incubator, incubated at 37 °C for 24 h, taken out, and filtered quickly. Next, 1.00 mL of the filtrate was sucked accurately. It was injected into a 50 mL volumetric flask, and 3 mL of LDNS reagent was added. Then, the volumetric flask was moved to the tap water stream to cool for 3 min. The solution turned orange due to the formation of 3-amino-5-nitrosalicylic acid Yellow. Finally, 50 mL of water was diluted into the solution, upon which colorimetry was performed at 540 nm on a spectrophotometer [27].
The catalase activity was determined by ultraviolet absorption. First, 2 g of air-dried soil was taken and put into a 100 mL-triangle bottle. Then, 40 mL steam water and 5 L peroxide solution (0.3%) were poured. The flask was placed on a reciprocating oscillator for 20 min, and then, 5 mL sulfuric acid (1.5 mol L−1) was added to stabilize the undecomposed hydrogen peroxide. Then. the suspension in the bottle was filtered with slow filter paper, and 25 mL filtrate was absorbed and titrated with a high acid solution (0.05 mol L−1) to light pink. The soil catalase activity was expressed by the volume of a high acid (0.05 mol L−1) consumed by 1 g after shaking for 20 min. [28].
The 16S rRNA sequenced the soil bacterial diversity and numbers, and DNA was extracted from (0.25 g) mixed and sieved (2-mm) fresh soil samples using MoBio PowerSoil™ DNA Isolation Kits (Mo Bio Laboratories, Carlsbad, CA, USA). Using SYBR Premix Ex TaqTM (Takara, China), we performed PCR amplifications in 25 μL with primers mb661/A189 targeting the pmoA gene of methanotrophs. PCR reactions were performed in triplicate as follows: 94 °C for 5 min; 30 cycles at 94 °C for 45 s, 56 °C for 45 s, followed by 72 °C for 1 min, and finally, 72 °C for 5 min. The PCR products were cloned using the pLB-simple vector (Tiangen). Clones that contained correctly inserted fragments were selected for further sequencing (BGI, China). The nucleotide sequences of the cloned genes were edited using the SeqMan program (DNASTAR Package). OTUs were generated using Clustal X software and Phylip version 4.0 at a 97% sequence similarity cut-off for the gene’s nucleotide sequence [29,30].
The 15N atomic percentage super determination of soil and plant samples was performed by the combustion reduction of tin foil-wrapped samples in an elemental analyzer (Vario PYRO cube) and later sent to a stable isotope mass spectrometer (IsoPrime 100) for detection. The results were determined using the diffusion adsorption of USGS40 (δ15N air = −4.52‰) and USGS41a (δ15N air = +47.55‰) and were corrected for the determination [31].
The plant nitrogen accumulation was calculated using Equation (1),
NA = GP × NC,
where NA is the plant nitrogen accumulation, kg ha−1; GP is the plant dry matter weight, kg ha−1; NC is the plant nitrogen content, %.
Crop nitrogen uptake from urea was calculated by Equation (2) [32],
U = NA × (PAPCP0)/5.3%,
U denotes plant uptake of nitrogen from urea, kg ha−1; PAPC denotes atomic plant percentage of 15N, %. P0 denotes the natural 15N abundance standard value, 0. 3663%.
The efficiency of NF (RNE, %) calculated using Equation (3) [33],
RNE = U/N × 100%,
where N is the amount of nitrogen applied, kg ha−1.
The SONM rate is the difference in SON content between two adjacent samples.

2.4. Study Methodology and Data Analysis

To explore the effectiveness of urea application on SONM and NF availability in the RBRS, three nitrogen application levels based on the NF application regime of local farmers in the experimental area were set. To distinguish the source of nitrogen, a certain proportion of 15N isotope urea NF was added to the normal urea NF. The research focuses on the absorption and utilization of NF by rice, as well as the absorption and utilization of residual NF by broad beans. The effectiveness of nitrogen applied in paddy fields will be explored based on the comprehensive analysis of the NF utilization by rice and broad beans and their yields.
Because a large portion of the nitrogen absorbed by crops comes from SONM, SONM is affected by the level of nitrogen application, which mainly affects soil enzyme activity and microbial community abundance. Therefore, starting from the changes in soil enzyme activity, microbial community abundance under different nitrogen application levels, the mechanism of SONM, and the nitrogen supply effect under different nitrogen application levels were studied. Combining the nitrogen availability and SONM effects under different nitrogen application levels, the appropriate nitrogen application level for the RBRS will be determined.
Microsoft Excel 2016 was used for statistical data analysis, Origin 2021 software was used for graphical processing, and both the data significance test and the correlation analysis were performed by SPSS 22 statistical software (p < 0.05).

3. Results

3.1. Succession Patterns of Soil Microhabitat Environment in the RBRS

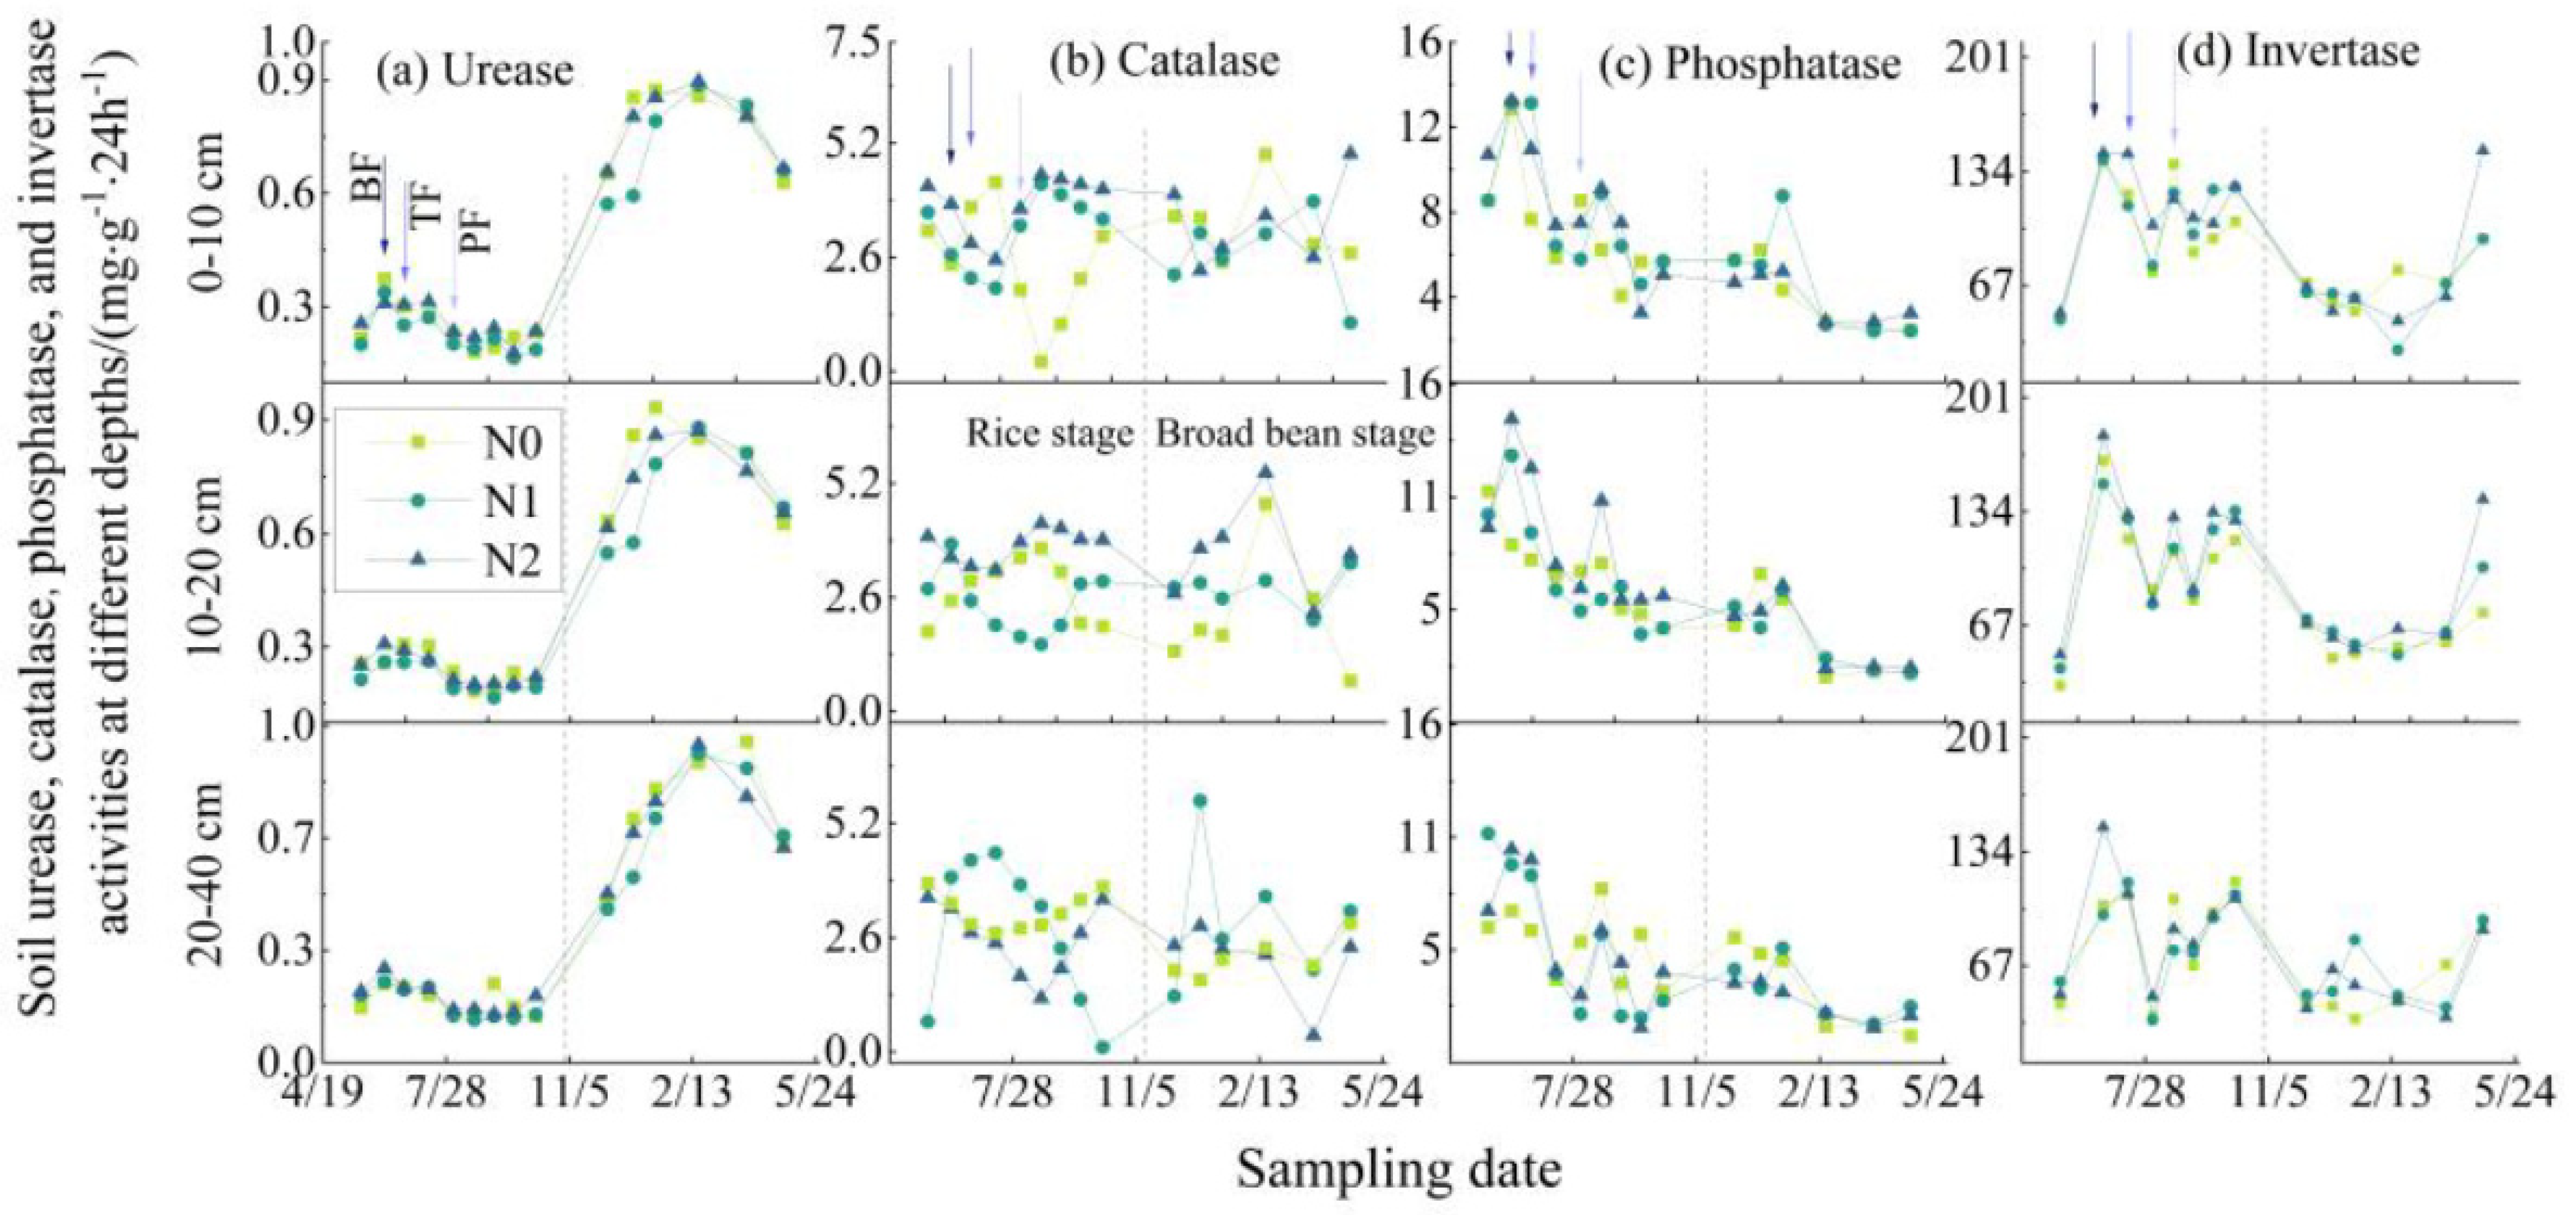
3.1.1. Soil Enzyme Activity

The order of magnitude of soil urease, catalase, phosphatase, and invertase activities was −1, 0, 1, and 2 in the RBRS, respectively (Figure 2). The soil urease activity decreased with the increase in the depths of the soil layers in the rice season and increased with increase in the depths of the soil layers in the broad bean season (Figure 2a). It was 2.5% higher at the N2 level than at N1. The soil urease activity increased by 215.6%, 199.1%, and 256.2% on average at the end of the RBRS for the soil layers of 0–10 cm, 10–20 cm, and 20–40 cm. The soil catalase activity varied drastically and had no specific relationship with the nitrogen application level (Figure 2b). The soil phosphatase activity increased rapidly at the initial stage and then gradually decreased and stabilized in the RBRS (Figure 2c). It increased by an average of 9.0% under N2 compared to N1. It decreased by 31.5%, 54.7%, and 33.7% at three soil layers after rotation. The three peaks of soil invertase activity in the rice season were located before the base NF was applied, the panicle NF application, and the harvest (Figure 2d). Its activity decreased after the NF application. Compared with N0, the soil invertase activity at N1 and N2 levels increased by 1.8% and 17.1% on average, respectively.

3.1.2. Soil Microbial Diversity and Abundance

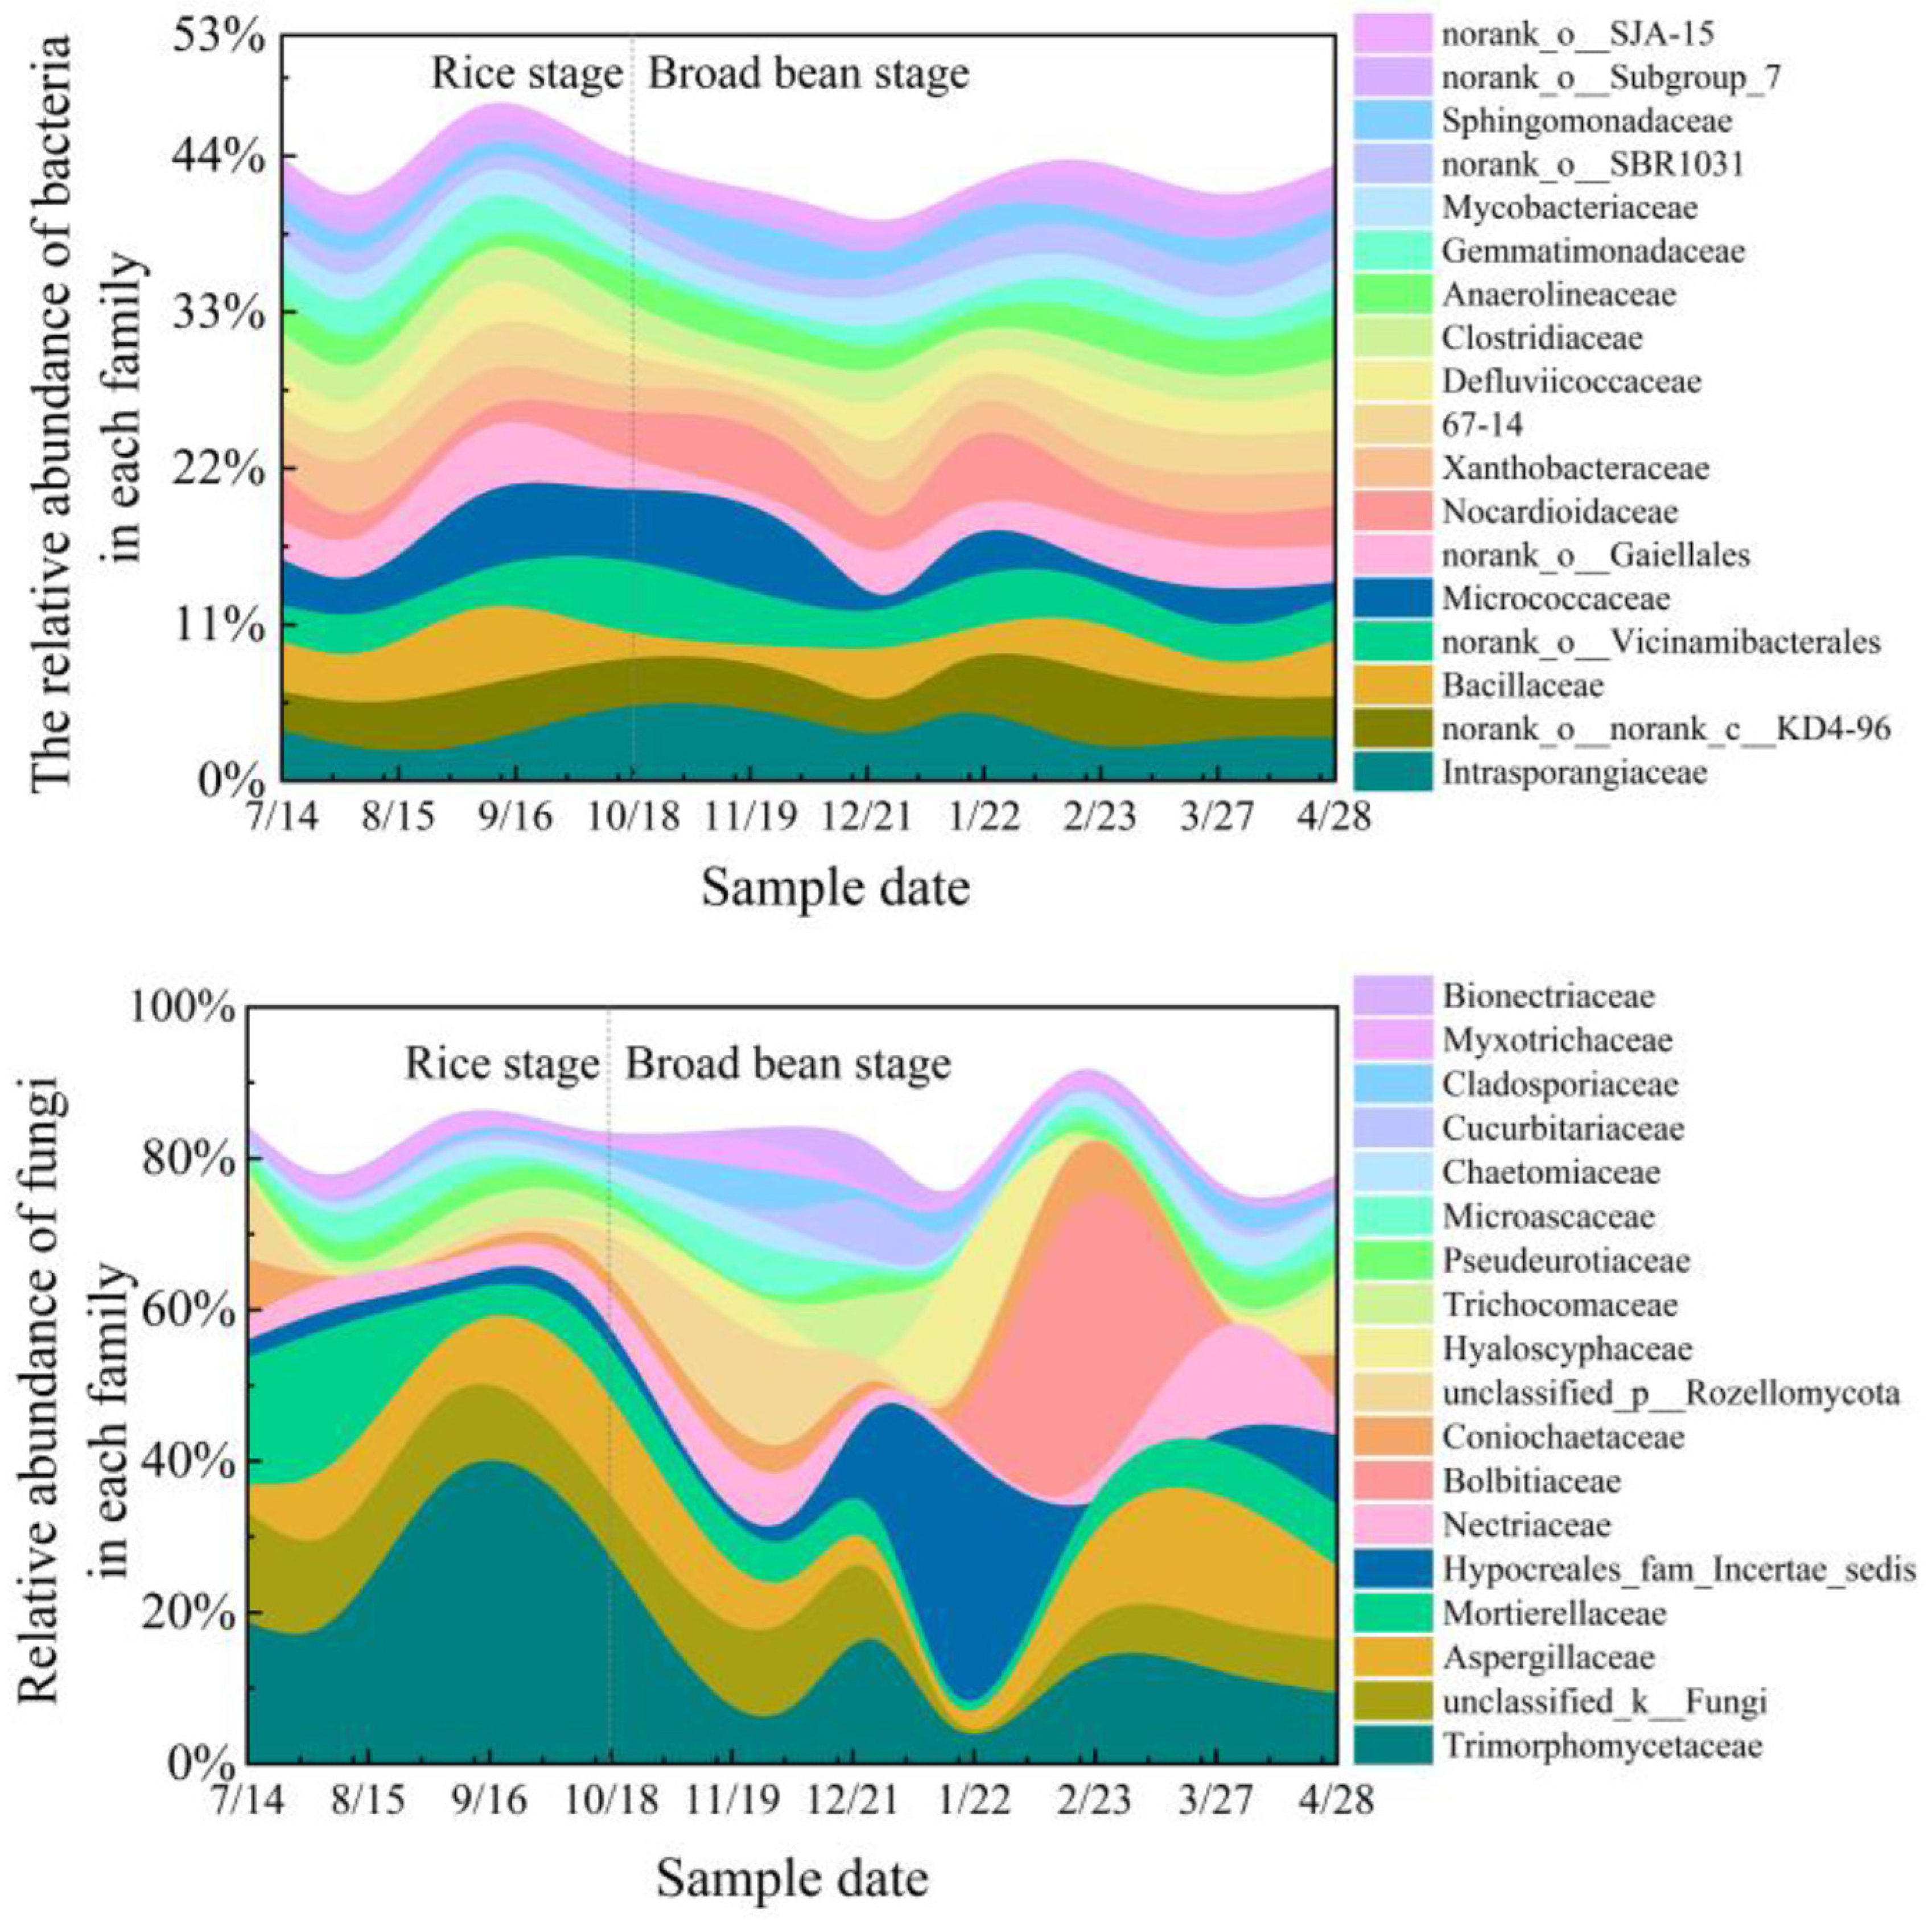
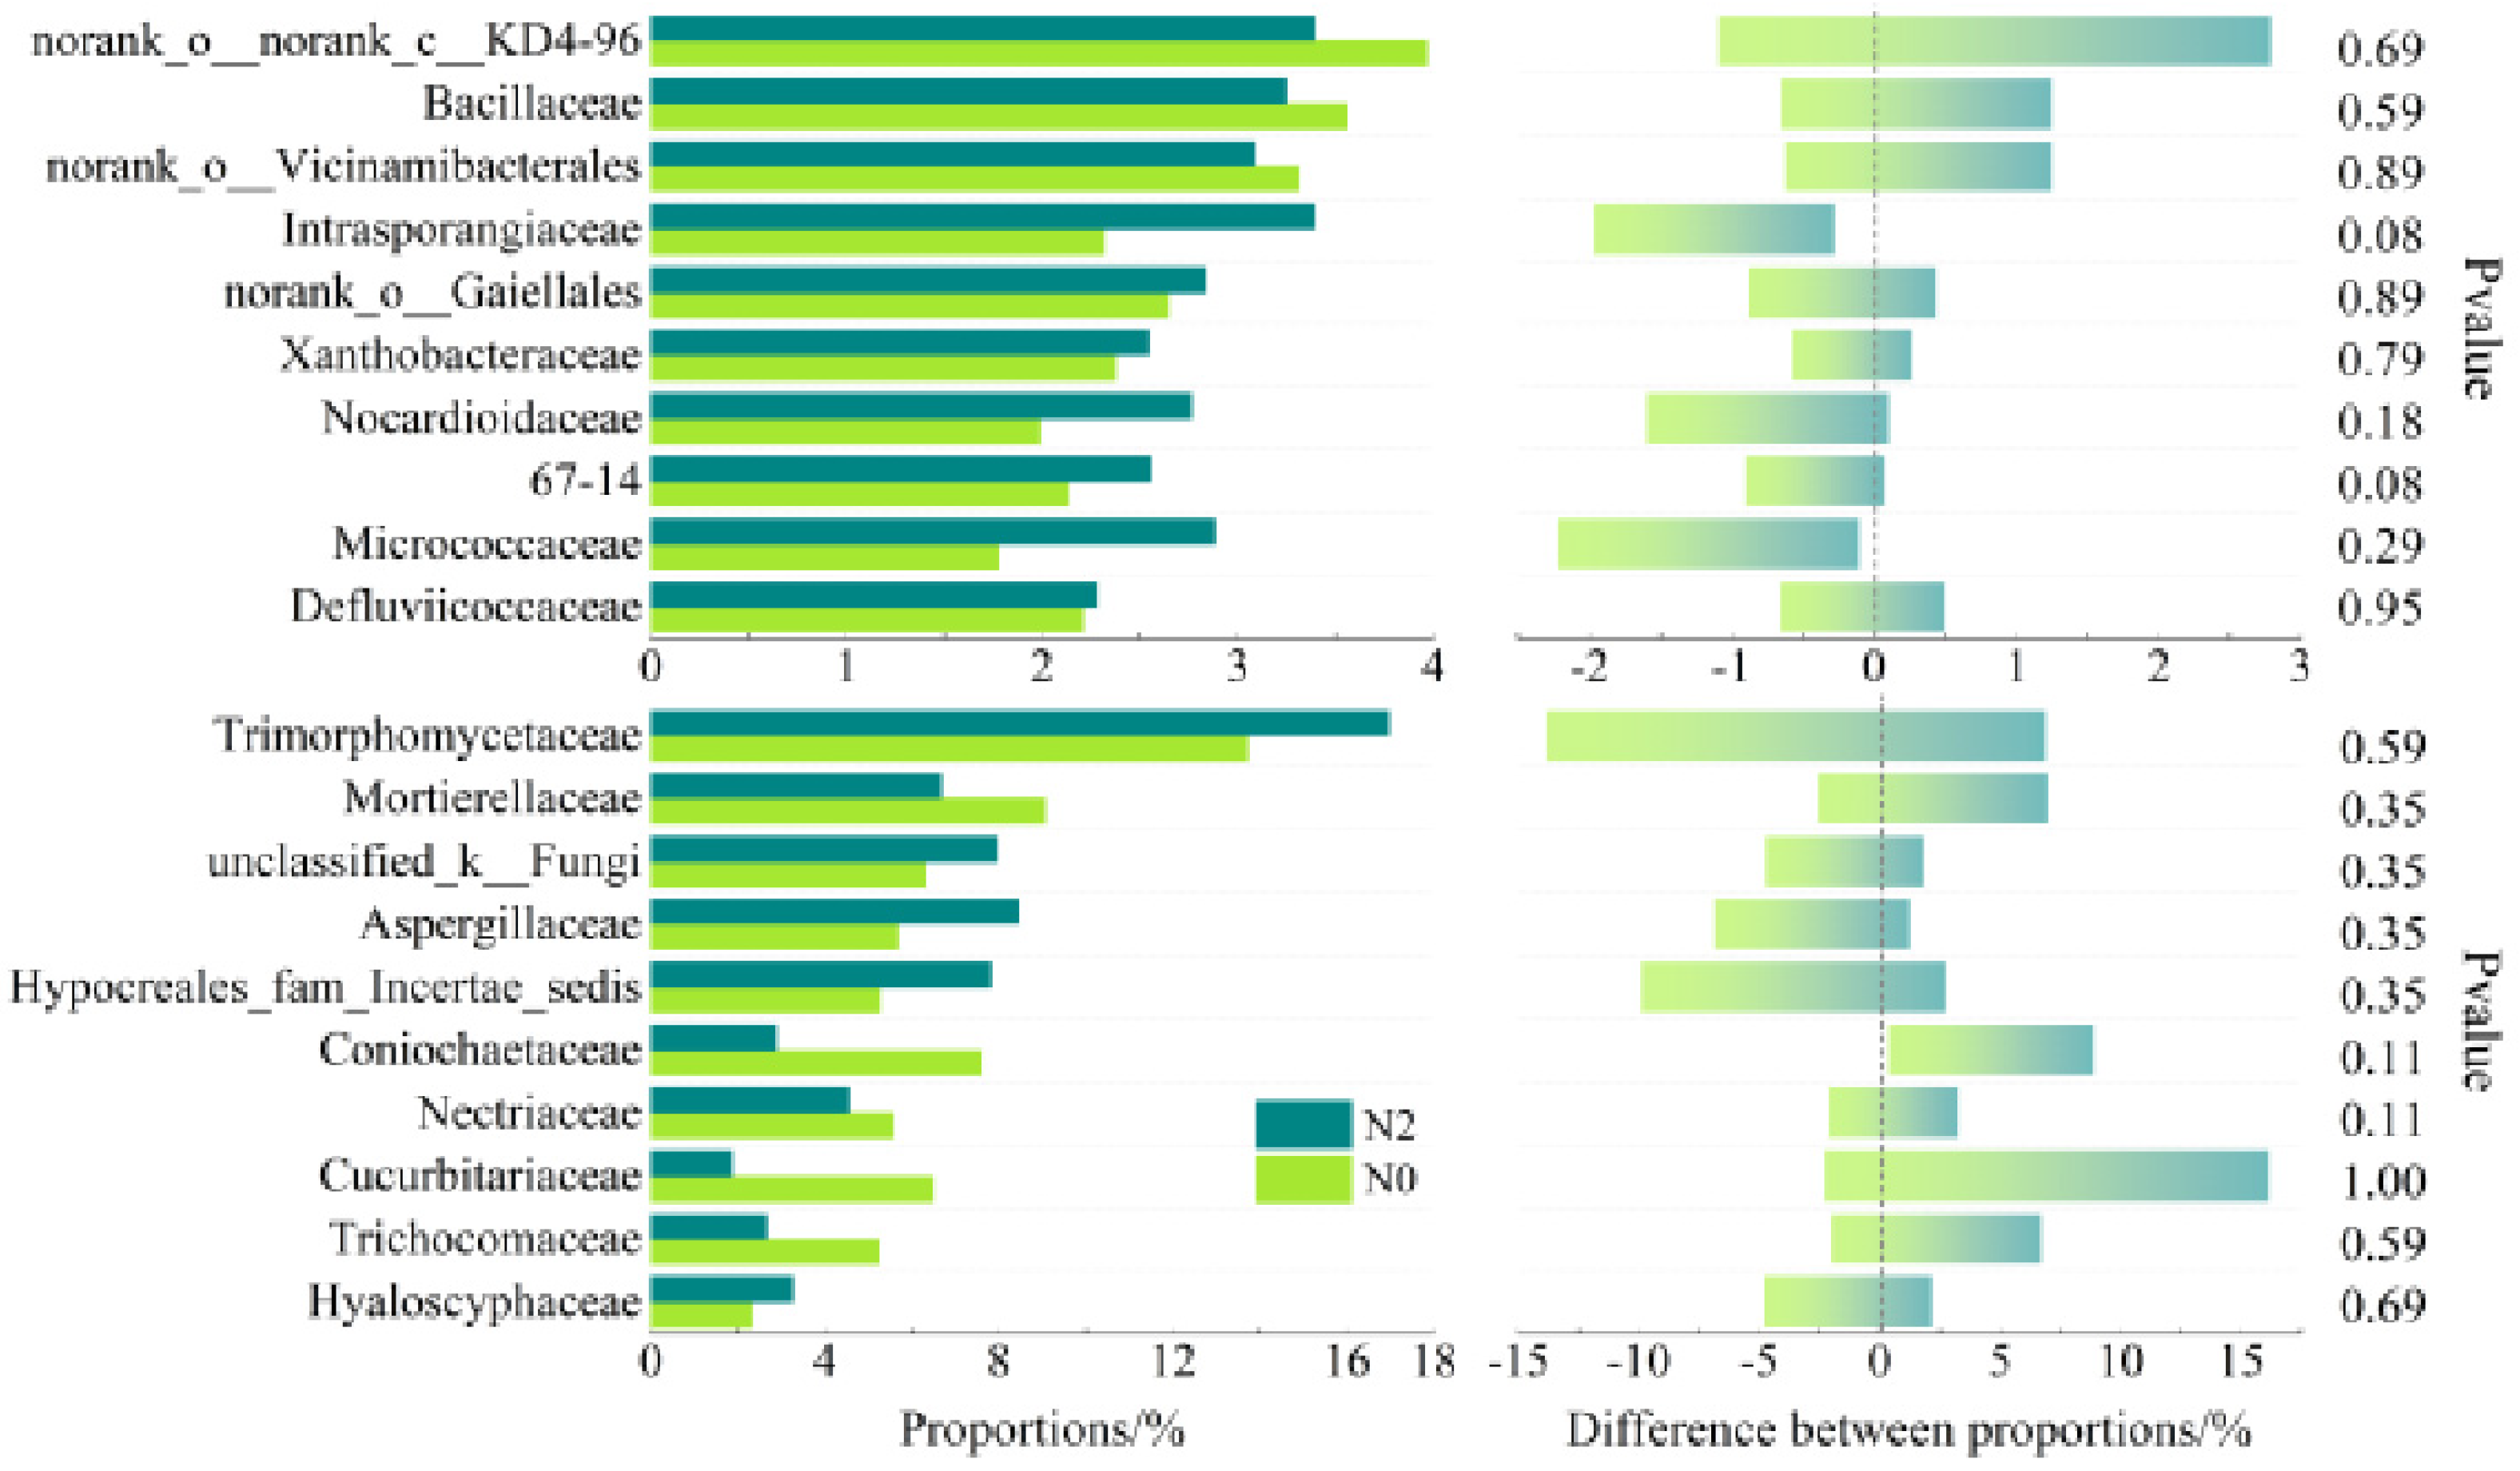
  • Bacteria families’ diversity and abundance
Nearly 20 major bacteria families occupied approximately 40% of the total soil bacteria abundance in the RBRS. The relative abundance of these bacteria families did not vary much (Figure 3). Intrasporangiaceae, norank-o-norank-c-KD4-96, and Bacillaceae were the most abundant bacterial families in the soil, together accounting for approximately 10% of the total bacterial population, and were the main bacteria in the soil calcareous and agricultural soils. Compared to N0, a lower abundance of norank-o-norank-c-KD4-96 and Bacillaceae was shown under N2, with an average decrease of approximately 17% (Figure 4). At the same time, the abundance of Intrasporangiaceae, Micrococcaceae, and norank-o-Gaiellales increased, with Intrasporangiaceae increasing by approximately 50%. There were few differences in the numbers and community composition of soil bacteria at the beginning and end of the RBRS.
  • Fungi families’ diversity and abundance
Fungi abundance varied greatly in the RBRS, especially during the broad bean season (Figure 3). The top 20 fungi families’ abundance accounted for approximately 80% of the total soil fungi abundance. Trimorphomycetaceae, unclassified-k-Fungi, Aspergillaceae, and Mortierellaceae accounted for approximately 55% of the total fungi sequences. Aspergillaceae abundance was high in the rice season and podding stage of the broad bean season. Trimorphomycetaceae abundance was high in the rice season and decreased significantly in the broad bean season, while the overall abundance was still high. The abundance of unclassified-k-Fungi, Aspergillaceae, and Mortierellaceae showed no changes in the RBRS except a significant decrease in the branching stage during the broad bean season. In contrast, Hypocreales_fam and Bolbitiaceae, which were very low in the rice season, became the dominant fungi families during the branching and podding stages of broad bean season, accounting for 48.3% and 42.6% of the fungal families abundance, respectively.
The number of soil fungi families decreased by 8.8% in the RBRS, and the community structure differed significantly, with the number of Aspergillaceae increasing by 90% on average. The rest of the fungi decreased by 80% on average. Trimorphomycetaceae, unclassified-k-Fungi, and Aspergillaceae increased with NF increasing, as well as with Trimorphomycetaceae increasing by approximately 16%. However, NF increasing inhibited the Mortierellaceae growth (Figure 4).

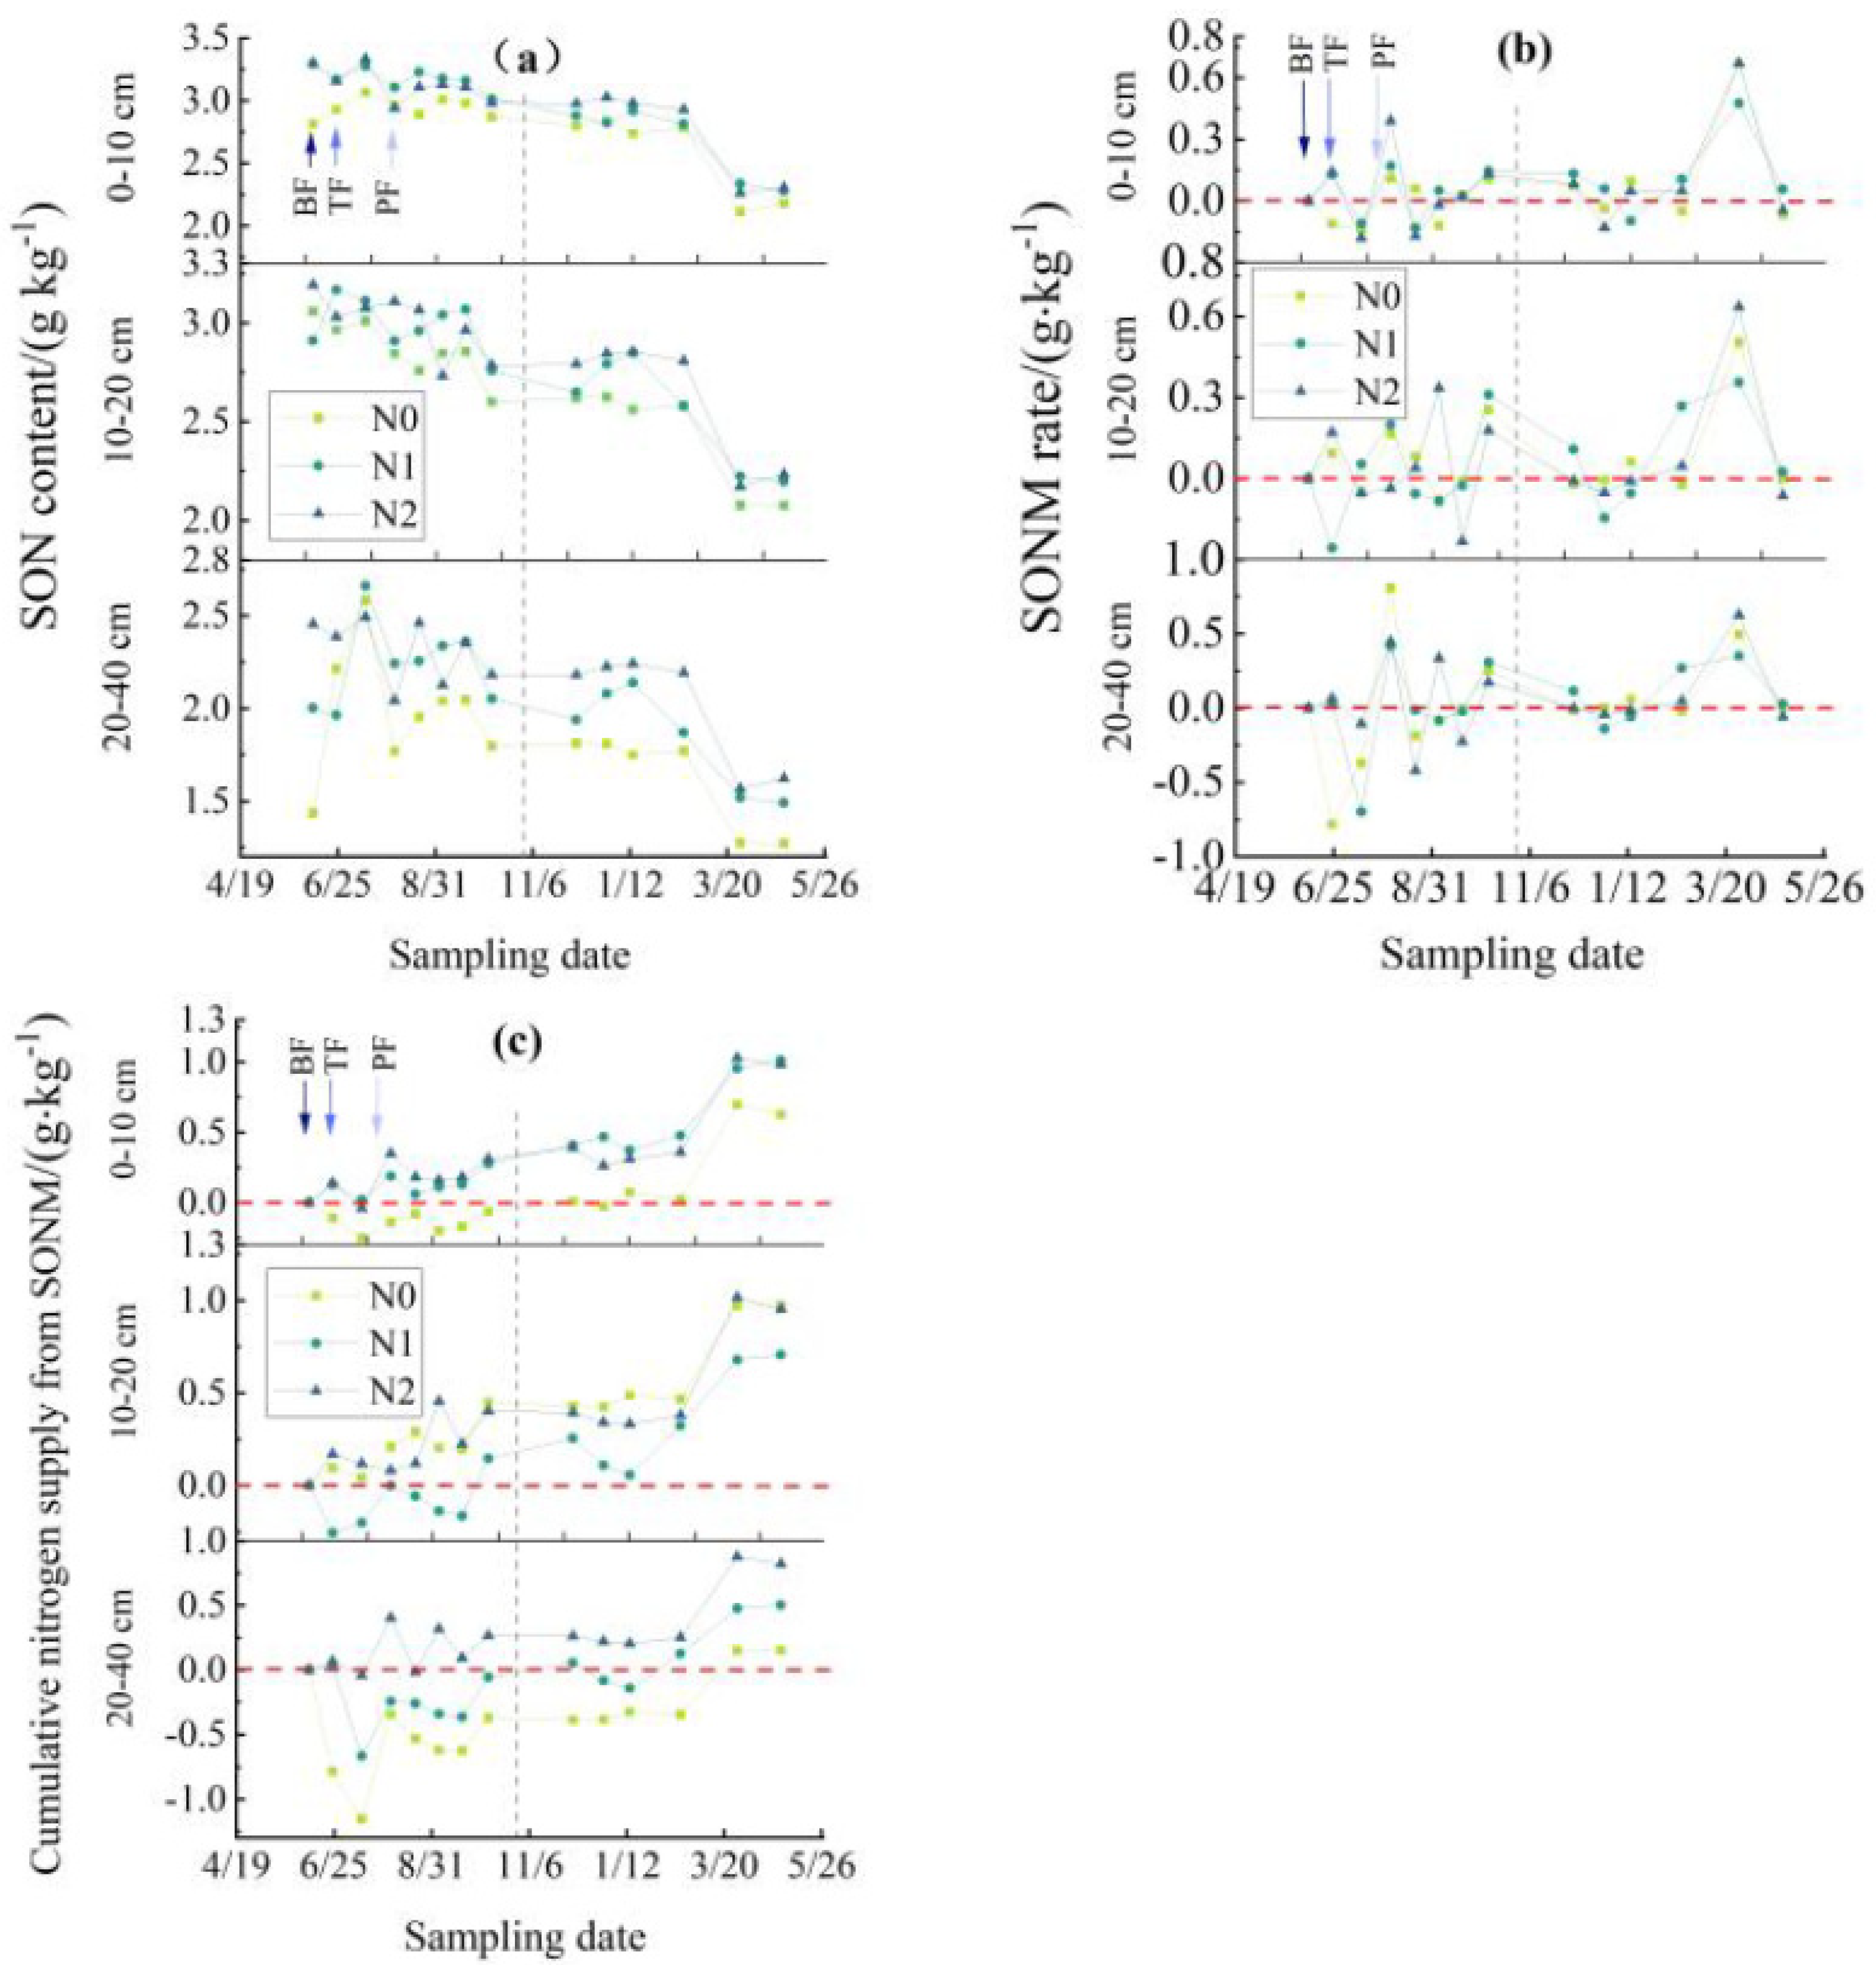
3.2. Dynamic Changes of SON Content and SONM in the RBRS

3.2.1. SON Content

The SON content showed a slow and continuous decrease in the rice season (Figure 5a), and it continued to decrease in all three soil layers (0–10 cm, 10–20 cm, and 20–40 cm) of the broad bean season, with a significant decrease of 0.64 g kg−1 (24.1%) during the podding stage. The average SON content of the three soil layers decreased with the increasing depth (Table 1). In addition, the SON content was significantly higher under N1 and N2 than under N0. After the rotation, the SON content of all three soil layers decreased, with an average decrease of 0.880 g kg−1 in 0–10 cm, 0.884 g kg−1 in 10–20 cm, and 0.502 g kg−1 in 20–40 cm, respectively, as well as an average decrease of 0.592 g kg−1 under N0, 0.746 g kg−1 under N1, and 0.928 g kg−1 under N2, respectively. This shows that the higher the nitrogen application rate, the more the SON content decreased after rotation.

3.2.2. SONM

The cumulative nitrogen supply from SONM under N0, N1, and N2 averaged 0.58, 0.74, and 0.92 g kg−1 from rice transplanting to broad beans harvesting in the RBRS (Figure 5c). The more nitrogen is applied, the greater the SONM. In the rice season, the accumulation of SONM under N0, N1, and N2 averaged −0.06, 0.28, and 0.31, respectively. There was almost no mineralization under N0. During the broad bean season, the average SONM were 0.64, 0.46, and 0.61 g kg−1, respectively, mainly occurring during the flowering–podding stage, while the SONM and the fixation of mineral nitrogen were less in the other growth stages. Even if no NF was applied during the broad bean season, it still exhibited the characteristic that the more NF applied to the rice season, the greater the SONM during the flowering–podding stage of the broad beans.
Additionally, the two processes of SONM and fixation of mineral nitrogen into SON alternated in the rice season, and the SONM mainly occurred after the NF application. The soil layers of 0–10 cm and 10–20 cm exhibited the SONM, while the soil layers of 20–40 cm mainly exhibited the fixation of mineral nitrogen. The nitrogen supply from SONM in the 0–10 cm layer was continuously accumulating, and the more nitrogen applied, the higher the cumulative amount. In the soil layer of 10–20 cm, both nitrogen and non-nitrogen applications showed the SONM. The cumulative nitrogen supplies from SONM were 0.45, 0.15, and 0.4 g kg−1 under N0, N1, and N2, respectively. In the 20–40 cm layer of soil, they were −0.37, −0.06, and 0.26 g kg−1, respectively. Only N2 treatment showed the SONM.

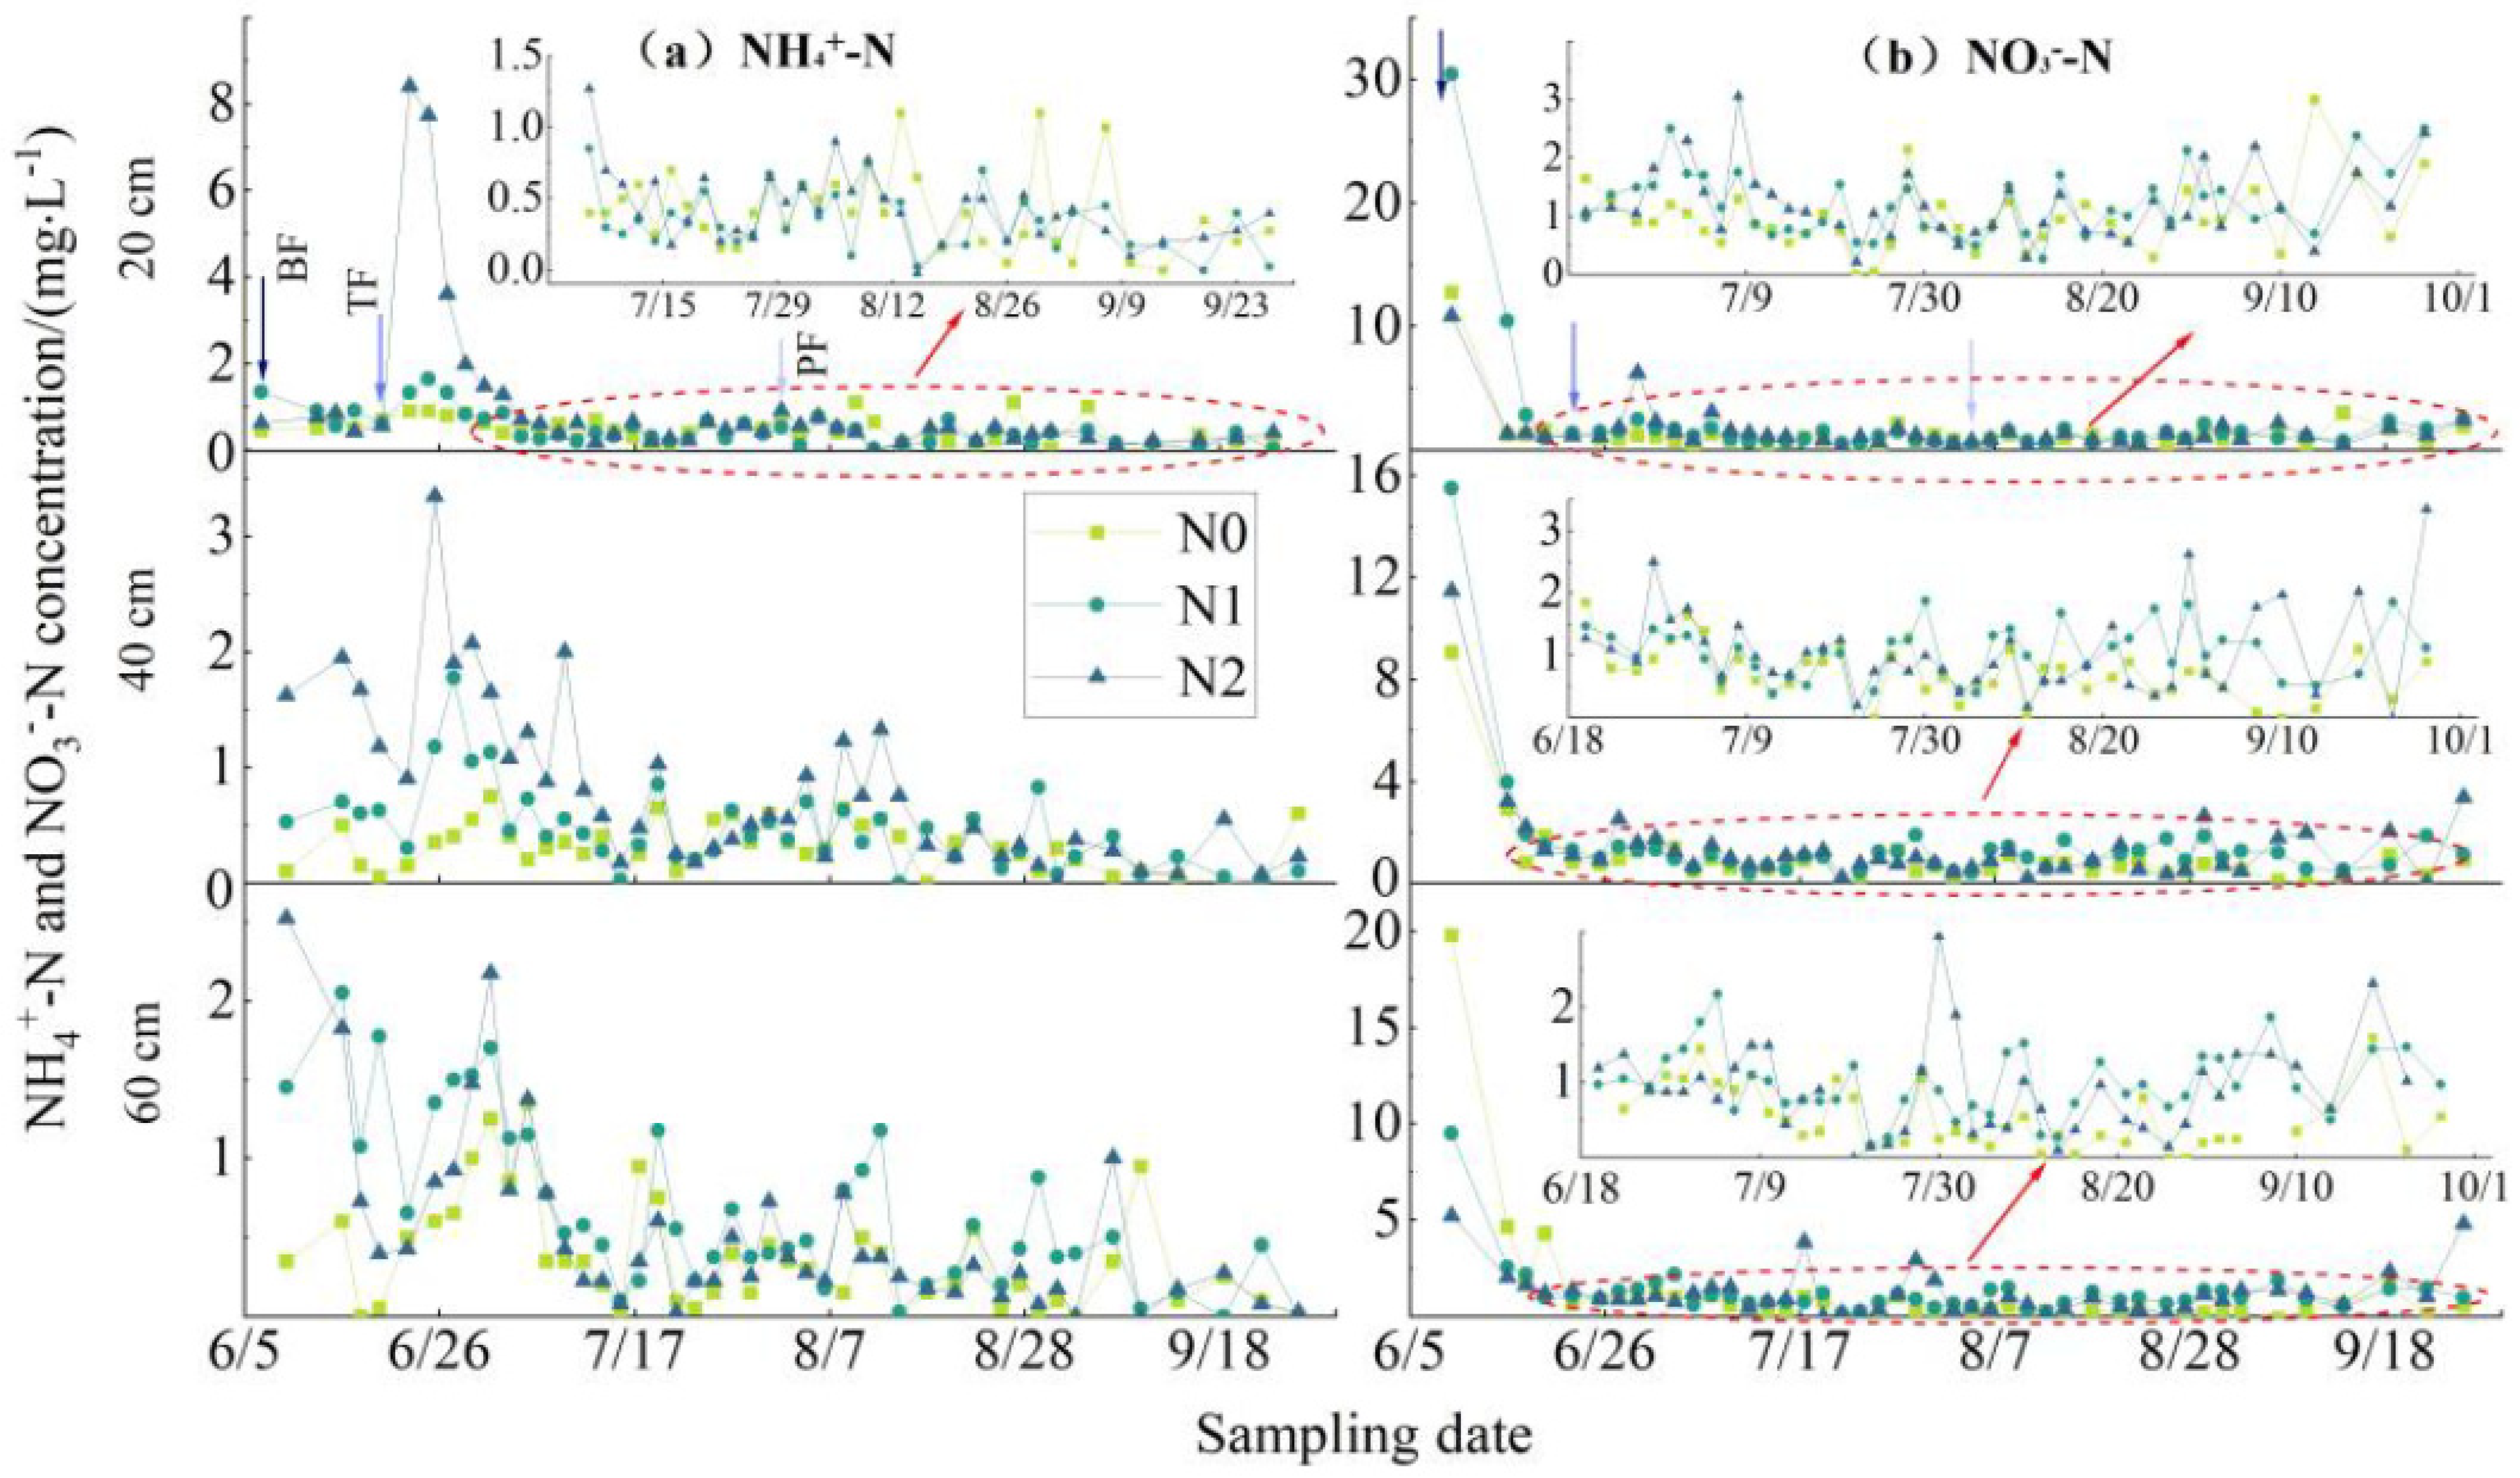
3.3. NF Utilization in the RBRS

Unlike N0, NF application significantly promoted the rice’s nitrogen content and accumulation, and the rice’s nitrogen absorption was approximately ten times that of the broad bean (Table 2). The nitrogen absorbed from the NF in rice plants under N1 and N2 was 51.4 kg ha−1 and 63.7 kg ha−1, accounting for 38.1% and 33.0% of the NF application, respectively. The amount of nitrogen absorbed from the NF in broad bean plants under N1 and N2 was 5.4 kg ha−1 and 7.0 kg ha−1, accounting for 4.0% and 3.6% of the NF application, respectively. There was also no significant difference in the efficiency of NF between N1 and N2 in the rice and broad bean seasons. However, compared with N1, N2 did not significantly improve the broad bean’s nitrogen content and accumulation.

4. Discussion

4.1. Effects of Urea Application on SONM

During the RBRS, the cumulative nitrogen supply from SONM was consistently higher overall under N1 and N2 than under N0, showing a “priming effect” [15,34]. Even in the broad bean season without NF application, the more nitrogen applied in the rice season, the greater the amount of SONM after rotation. This may be related to the crops’ promotion of nitrogen uptake due to high nitrogen application rates (Table 2). The higher the nitrogen application rate, the better the crop growth and the greater the demand for NF, which has a greater promoting effect on the SONM and the release of mineral nitrogen [35]. In addition, it can be seen from the changes in SON content and the accumulated amount of mineralized nitrogen (Figure 5) that the SONM into mineral nitrogen and the fixation of mineral nitrogen into SON occur simultaneously, with SONM dominating in most cases.
The amount of applied urea nitrogen throughout the rice season was less than the accumulated nitrogen in rice plants, and the rice absorbed only approximately 1/3 of the applied urea nitrogen. Approximately 2/3 of the accumulated nitrogen in rice plants also relied on nitrogen brought in by SONM, wet deposition of nitrogen, and irrigation. Our team has observed rice fields in the experimental area for many years and found that during the rice season, the amount of nitrogen brought into the paddy fields by rainfall was approximately 13.2–16.3 kg ha−1, the amount of nitrogen brought into the paddy fields by irrigation was approximately 2.7–4.1 kg ha−1, and the amount of nitrogen fixed by microorganisms was approximately 0.5–1.2 kg ha−1 [6]. The total nitrogen sources of these three parts were approximately 16.4–21.6 kg ha−1, accounting for approximately 1/10 of the cumulative nitrogen of rice. Therefore, SONM was the most important source for rice, providing approximately 60% of the nitrogen source for rice growth. This is consistent with the findings of most researchers [10,13,16,36].
Unlike the continuous and slow SON decrease in the rice season, the SON content decreased slightly before the broad bean season podding stage. Then, it decreased rapidly (Figure 5). This trend is mainly because the broad bean could use its nutrients for growth and development from the germination to the meristem stages [37]. After that, nitrogen fixation provided the major nitrogen needs [38], and the rest needed to be supplemented by fertilization or SONM. The effect of SONM was not perceived as obvious to farmers, who mistook it for nitrogen residues from the rice season and, thus, applied large amounts of urea in the paddy fields [1,39,40]. However, the broad beans absorbed a small proportion of the nitrogen residue from the rice season (Table 2). Therefore, a moderate amount of additional NF needs to be applied during the podding stage of the broad bean, and the urea application regime of high nitrogen application in the rice season and no nitrogen application in the broad bean season is not reasonable in the RBRS.
The impact of NF application on SONM is mainly reflected by affecting the structure and quantity of soil microbial community, soil enzyme activity, etc. [25,41,42,43,44]. Microorganisms also produce most soil enzymes. The SONM and the fixation of mineral nitrogen into organic nitrogen are both processes carried out by microorganisms [12,15,17]. The correlation analysis of SONM rates and soil enzyme activity changes found a significant correlation between SONM and urease, phosphatase, and invertase activities, with a very significant correlation between organic nitrogen mineralization and invertase activity (Table 3). In contrast, the correlation between SONM and catalase activity was not significant. However, only urease activity was positively correlated with SONM rates, while phosphatase and invertase activities were negatively correlated with SONM rates. Relevant studies also indicate that soil urease activity correlates highly with nutrient transport and transformation processes. Soil urease can catalyze the production of NH3 from urea, which is closely related to the soil nitrogen cycle. Its activity can reflect the nitrogen supply capacity of soil [45,46]. It can be seen that soil urease activity can be the main monitoring object of SONM.
Through correlation analysis of SONM rates and changes in the abundance of the fungal and bacterial communities in 0–10 cm, 10–20 cm, and 20–40 cm soil layers, it was found that the fungi species that were significantly correlated with SONM rates were Aspergillaceae, Neuroceae, Pseudoeurotiaceae, Chaetomiaceae, and unclassified_o__Helotiales. There was a significant correlation between Aspergillaceae, Neuroceae, and unclassified_o__Helotiales and the SONM rates in the three soil layers (Table 4). The bacterial and fungal species unrelated to SONM rates are not shown in Table 4. The correlation coefficient between Neuroceae and the SONM rates was the largest. Studies have also shown that fungi such as Aspergillaceae and Neurocaee are mainly involved in decomposing organic matter into inorganic matter, enhancing soil fertility, and promoting crop growth [47,48,49]. However, only norank_o__C0119 bacteria species showed a significant correlation with SONM rates and only showed a significant correlation with SONM rates in the 10–20 cm layer. This may be related to the fact that bacteria mainly use eutrophic soluble organic matter [50,51,52]. After the nitrogen application in the paddy field, the rice either absorbed NF or exported it to the surrounding environment through various channels. Bacteria can utilize less eutrophic soluble organic matter in the rice field. In particular, when NF is not applied during the broad bean season, there are fewer nutrients, limiting the participation of bacteria in the SONM. Overall, it can be seen that changes in the abundance of fungal communities can more reflect the SONM rates than those of bacteria, and abundance changes in Aspergillaceae, Nectriaceae, and unclassified_o__Helotiales were the most optimal monitoring indicators.

4.2. Effects of Urea Application on NF Availability

This study showed that 33–38.1% of the 135–193 kg ha−1 urea nitrogen applied in the rice season was recycled by the current season rice (Table 2), which is consistent with the result of Smith and Chalk [53], who reported that the in-season utilization rate of NF in paddy fields was generally 19–49.5%. Compared with the in-season NF utilization rate, the recovery rate of residual soil NF by subsequent single-season crops was generally low (Table 2). In this experiment, the proportion of NF applied in the rice season used by the broad bean was only 4.1–4.9%. It can be seen that during crop rotation, the NF availability was strong in the current season and weak for the rotation crop.
The availability of residual NF was low in the broad bean season, probably due to the following reasons. First, the broad bean’s dry matter mass and nitrogen accumulation were smaller than the rice’s, even under N0 (Table 2). Second, the broad bean’s absorption and utilization capacity were weaker than the rice’s, especially in the early growth stage. The broad bean could grow well with its nitrogen and did not need to absorb nitrogen from the external environment. In contrast, rice could not. Third, the mineral nitrogen from urea hydrolysis is fixed into the organic nitrogen pool, which is difficult to mineralize into fast-acting nitrogen to be used again by the crop.
The NF availability is not only related to the selection of the nitrogen application rate and the maintenance of the crop yield but also has an important relationship with the generation of non-point source pollution, especially groundwater pollution [8]. Groundwater pollution is more insidious, more difficult to monitor, and more likely to be overlooked [54,55]. NH4+-N and NO3-N concentrations in groundwater at depths of 20 cm, 40 cm, and 60 cm during the rice season were observed (Figure 6). Except for the returning green stage, the NO3-N concentration in the three depths was 0.97 mg L−1, 0.92 mg L−1, and 0.88 mg L−1, respectively. The mineral nitrogen content in groundwater was consistently high at different depths, especially the N H4+-N content, which was much higher than the Chinese maximum permissible NH4+-N in groundwater (0.1 mg L−1). Based on our previous observation results of groundwater leakage (2 mm d−1) in the test area [10], the total amount of mineral nitrogen leaching loss from groundwater at a depth of 40 cm in the rice season was 2.5 kg ha−1 under N0, 6.2 kg ha−1 under N1, and 8.3 kg ha−1 under N2.
In addition, the NF availability was also reflected in crop yields. The comprehensive yield of rice and broad beans was higher under N2, mainly from the broad bean yield (Table 2). Because of the higher economic value of broad beans [37], the yield benefit of the RBRS under N2 is higher than N1. However, this is not enough to offset more NF-applied costs. Moreover, the environmental benefit under N2 was worse than N1 and N0. In addition, the N2 nitrogen application in rice season and no nitrogen application in broad bean season was insufficient to make broad bean fully high-yield.
A comprehensive analysis of SONM, NF availability, crop yield benefits, and the effects of nitrogen loss on the groundwater in the RBRS showed that N1 was a relatively green and efficient water and nitrogen management mode. However, it is necessary to supplement NF at the broad bean season podding stage to obtain its high yield.

5. Conclusions

From the results of this study, it can be concluded that the urea application regime of high nitrogen application in the rice season and no nitrogen application in the broad bean season is not reasonable for the RBRS. A moderate amount of additional NF needs to be applied during the podding stage of the broad bean. The broad bean utilized only a small fraction of the residual nitrogen from the rice season. The SONM into mineral nitrogen and the fixation of mineral nitrogen into SON occur simultaneously, with SONM dominating in most cases. The abundance of fungal communities can more reflect the SONM rates than those of bacteria, and abundance changes in Aspergillaceae, Nectriaceae, and unclassified_o__Helotiales were the most optimal monitoring indicators. Our study also concluded that N1 had the best comprehensive benefits regarding crop yield, nitrogen supply by SONM, NF utilization, and nitrogen loss on the environment in the RBRS. Due to the lack of long-term RBRS experimental studies, the effects of N1 on SONM and NF availability still need further verification.

Author Contributions

Conceptualization, H.H.; methodology, H.H.; software, X.L.; validation, S.G.; formal analysis, H.H. and X.L.; investigation, R.G.; resources, S.G.; data curation, X.L.; writing—original draft preparation, X.L.; writing—review and editing, H.H.; visualization, S.G.; supervision, H.H.; project administration, H.H.; funding acquisition, S.G. All authors have read and agreed to the published version of the manuscript.

Funding

This research was funded by the Fundamental Research Program of Yunnan Province, China, grant number No. 202101AU070039; the National 14th Five-Year Plan for Key Research and Development, China, grant number No. 2021YFC300205-06; the Scientific Research and Technical Innovation Team Construction of Yunnan Province, China, grant number No. 2018HC024; and the Key R&D Program of Yunnan Province, China (special project of science and technology into Yunnan), “Study on agricultural water-saving and farmland non-point source pollution control model in Yunnan plateau lake area”, grant number No. YKK2019092733.

Institutional Review Board Statement

Not applicable.

Informed Consent Statement

Not applicable.

Data Availability Statement

Not applicable.

Conflicts of Interest

The authors declare no conflict of interest.

References

  1. Cai, S.; Zhao, X.; Pittelkow, C.M.; Fan, M.; Zhang, X.; Yan, X. Optimal nitrogen rate strategy for sustainable rice production in China. Nature 2023, 615, 73–79. [Google Scholar] [CrossRef]
  2. FAO (Food and Agriculture Organization of the United Nations). FAOSTAT: FAO Statistical Databases. Available online: http://faostat.fao.org/default.aspx (accessed on 4 December 2022).
  3. Mkhinini, M.; Boughattas, I.; Hattab, S.; Amamou, C.; Banni, M. Effect of treated wastewater irrigation on physiological and agronomic properties of beans Vicia faba. Int. J. Environ. Agric. Biotechnol. 2018, 3, 1414–1420. [Google Scholar] [CrossRef]
  4. Zhang, H.; Jing, W.J.; Zhao, B.H.; Wang, W.L.; Xu, Y.J.; Zhang, W.Y.; Gu, J.F.; Liu, L.J.; Wang, Z.Q.; Yang, J.C. Alternative fertilizer and irrigation practices improve rice yield and resource use efficiency by regulating source-sink relationships. Field Crops Res. 2021, 265, 108124. [Google Scholar] [CrossRef]
  5. Yao, H.; Eva, L.; Wulf, A.; Reiner, W.; Ma, C.; Georg, V.; Jan, S. Drainage and leaching losses of nitrogen and dissolved organic carbon after introducing maize into a continuous paddy-rice crop rotation. Agric. Ecosyst. Environ. 2017, 249, 91–100. [Google Scholar]
  6. Han, H.; Gao, R.; Cui, Y.; Gu, S. Transport and transformation of water and nitrogen under different irrigation modes and urea application regimes in paddy fields. Agric. Water Manag. 2021, 255, 107024. [Google Scholar] [CrossRef]
  7. Zhang, M.; Yao, Y.; Zhao, M.; Zhang, B.; Tian, Y.; Yin, B.; Zhu, Z. Integration of urea deep placement and organic addition for improving yield and soil properties and decreasing N loss in paddy field. Agric. Ecosyst. Environ. 2017, 247, 236–245. [Google Scholar] [CrossRef]
  8. Han, H.; Gao, R.; Cui, Y.; Gu, S. A semi-empirical semi-process model of ammonia volatilization from paddy fields under different irrigation modes and urea application regimes. Agric. Water Manag. 2022, 272, 107841. [Google Scholar] [CrossRef]
  9. Zhang, T.; Chen, A.; Liu, J.; Liu, H.; Lei, B.; Zhai, L.; Zhang, D.; Wang, H. Cropping systems affect paddy soil organic carbon and total nitrogen stocks (in rice-garlic and rice-fava systems) in temperate region of southern China. Sci. Total Environ. 2017, 609, 1640–1649. [Google Scholar] [CrossRef] [PubMed]
  10. Lu, T.; Wang, Y.; Zhu, H.; Wei, X.; Shao, M. Drying-wetting cycles consistently increase net nitrogen mineralization in 25 agricultural soils across the intensity and number of drying-wetting cycles. Sci. Total Environ. 2020, 710, 135574. [Google Scholar] [CrossRef]
  11. Ma, Y.; Shen, S.; Wan, C.; Wang, S.; Yang, F.; Zhang, K.; Gao, W. Organic fertilizer substitution over six years improves the productivity of garlic, bacterial diversity, and microbial communities network complexity. Appl. Soil Ecol. 2023, 182, 104718. [Google Scholar] [CrossRef]
  12. Chen, Z.; Li, Y.; Chang, S.X.; Xu, Q.; Li, Y.; Ma, Z.; Qin, H.; Cai, Y. Linking enhanced soil nitrogen mineralization to increased fungal decomposition capacity with Moso bamboo invasion of broadleaf fore. Sci. Total Environ. 2021, 771, 144779. [Google Scholar] [CrossRef] [PubMed]
  13. Yemadje, P.L.; Chevallier, T.; Guibert, H.; Bertrand, I.; Bernoux, M. Wetting-drying cycles do not increase organic carbon and nitrogen mineralization in soils with straw amendment. Geoderma 2016, 304, 68–75. [Google Scholar] [CrossRef]
  14. Zhang, X.; Li, Q.; Gao, J.; Hu, Y.; Song, M.; Yue, Y. Effects of rainfall amount and frequency on soil nitrogen mineralization in Zoige alpine wetland. Eur. J. Soil Biol. 2020, 97, 103170. [Google Scholar] [CrossRef]
  15. Xu, P.; Liu, Y.; Zhu, J.; Shi, L.; Fu, Q.; Chen, J.; Hu, H.; Huang, Q. Influence mechanisms of long-term fertilizations on the mineralization of organic matter in Ultisol. Soil Tillage Res. 2020, 201, 104594. [Google Scholar] [CrossRef]
  16. Shen, H.; Zhang, Q.; Zhang, X.; Jiang, X.; Zhu, S.; Chen, A.; Wu, Z.; Xiong, Z. In situ effects of biochar field-aged for six years on net N mineralization in paddy soil. Soil Tillage Res. 2021, 205, 104766. [Google Scholar] [CrossRef]
  17. Gao, J.; Feng, J.; Zhang, X.; Yu, F.; Xu, X.; Kuzyakov, Y. Drying-rewetting cycles alter carbon and nitrogen mineralization in litter-amended alpine wetland soil. CATENA 2016, 145, 285–290. [Google Scholar] [CrossRef]
  18. Liu, N.; Li, Y.; Cong, P.; Wang, J.; Guo, W.; Pang, H.; Li, Z. Depth of straw incorporation significantly alters crop yield, soil organic carbon and total nitrogen in the north china plain. Soil Tillage Res. 2021, 205, 104772. [Google Scholar] [CrossRef]
  19. Rodríguez, A.; Durán, J.; Rey, A.; Boudouris, I.; Valladares, F.; Gallardo, A.; Yuste, J.C. Interactive effects of forest die-off and drying-rewetting cycles on C and N mineralization. Geoderma 2019, 333, 81–89. [Google Scholar] [CrossRef]
  20. Dai, X.; Wang, H.; Fu, X. Soil microbial community composition and its role in carbon mineralization in long-term fertilization paddy soils. Sci. Total Environ. 2017, 580, 556–563. [Google Scholar] [CrossRef]
  21. Tian, J.; Lou, Y.; Gao, Y.; Fang, H.; Liu, S.; Xu, M.; Blagodatskaya, E.; Kuzyakov, Y. Response of soil organic matter fractions and composition of microbial community to long-term organic and mineral fertilization. Biol. Fertil. Soils 2017, 53, 523–532. [Google Scholar] [CrossRef]
  22. Clivot, H.; Mary, B.; Valé, M.; Cohan, J.P.; Champolivier, L.; Piraux, F.; Laurent, F.; Justes, E. Quantifying in situ and modeling net nitrogen mineralization from soil organic matter in arable cropping systems. Soil Biol. Biochem. 2017, 111, 44–59. [Google Scholar] [CrossRef]
  23. Scherger, L.E.; Valdes-Abellan, J.; Zanello, V.; Lexow, C. Projecting climate change effect on soil water fluxes and urea fertilizer fate in the semiarid Pampas of Argentina. Earth Syst. Environ. 2022, 6, 745–758. [Google Scholar] [CrossRef]
  24. Chen, D.; Yuan, L.; Liu, Y.; Ji, J.; Hou, H. Long-term application of manures plus chemical fertilizers sustained high rice yield and improved soil chemical and bacterial properties. Eur. J. Agron. 2017, 90, 34–42. [Google Scholar] [CrossRef]
  25. Hu, R.; Wang, X.; Xu, J.; Zhang, Y.; Pan, Y.; Su, X. Themechanism of soil nitrogen transformation under different biocrusts to warming and reduced precipitation: From microbial functional genes to enzyme activity. Sci. Total Environ. 2020, 722, 137849. [Google Scholar] [CrossRef] [PubMed]
  26. Gao, T.; Tian, H.; Niu, H.; Wang, Z.; Dai, Y.; Megharaj, M.; He, W. Soil phosphatase assay to evaluate arsenic toxicity should be performed at the soil’s actual pH. Sci. Total Environ. 2023, 859, 160184. [Google Scholar] [CrossRef]
  27. Wu, Y.; Zhang, H.; Li, J.; Wang, Z.; Jiang, Y. Adsorption of soil invertase to goethite, gibbsite and their organic complexes and the effects on enzyme catalytic performance. Colloids Surf. B Biointerfaces 2023, 222, 113073. [Google Scholar] [CrossRef]
  28. Chabot, M.; Morales, E.; Cummings, J.; Rios, N.; Giatpaiboon, S.; Mogul, R. Simple kinetics, assay, and trends for soil microbial catalases. Anal. Biochem. 2020, 610, 113901. [Google Scholar] [CrossRef] [PubMed]
  29. Smets, W.; Leff, J.W.; Bradford, M.A.; McCulley, R.L.; Lebeer, S.; Fierer, N. A method for simultaneous measurement of soil bacterial abundances and community composition via 16S rRNA gene sequencing. Soil Biol. Biochem. 2016, 96, 145–151. [Google Scholar] [CrossRef]
  30. Liu, F.; Wang, S.; Huang, K.; Yeager, K.M.; Li, Y.; Lv, L.; Jia, G.; Ma, B. Great and fast increase in soil CH4 uptake after reforestation in karst cropland area is linked to the environmental and microbial factors. Agric. Ecosyst. Environ. 2023, 347, 108367. [Google Scholar] [CrossRef]
  31. Du, S.; Zhang, Z.; Chen, P.; Li, T.; Han, Y.; Song, J. Fate of each period fertilizer N in Mollisols under water and N management: A 15N tracer study. Agric. Water Manag. 2022, 272, 107872. [Google Scholar] [CrossRef]
  32. Li, G.; Lin, J.; Xue, L.; Ding, Y.; Wang, S.; Yang, L. Fate of basal N under split fertilization in rice with 15N isotope tracer. Pedosphere 2018, 28, 135–143. [Google Scholar] [CrossRef]
  33. Quan, Z.; Zhang, X.; Fang, E.; Davidson, A. Different quantification approaches for nitrogen use efficiency lead to divergent estimates with varying advantages. Nat. Food 2021, 2, 241–245. [Google Scholar] [CrossRef]
  34. Shahbaz, M.; Kumarb, A.; Kuzyakov, Y.; Börjessona, G.; Blagodatskay, E. Priming effects induced by glucose and decaying plant residues on SOM decomposition: A three-source 13C/14C partitioning study. Soil Biol. Biochem. 2018, 121, 138–146. [Google Scholar] [CrossRef]
  35. Wang, Z.; Zhang, H.; Lu, X.; Wang, M.; Chu, Q.; Wen, X. Lowering carbon footprint of winter wheat by improving management practices in north china plain. J. Clean. Prod. 2016, 112, 149–157. [Google Scholar] [CrossRef]
  36. Zhang, Y.; Xu, W.; Duan, P.; Cong, Y.; An, T.; Yu, N.; Zou, H.; Dang, X.; An, J.; Fan, Q.; et al. Evaluation and simulation of nitrogen mineralization of paddy soils in Mollisols area of Northeast China under waterlogged incubation. PLoS ONE 2017, 12, e0171022. [Google Scholar] [CrossRef]
  37. Hegab, A.; Fayed, M.; Hamada, M.; Abdrabbo, M. Productivity and irrigation requirements of faba-bean in North Delta of Egypt in relation to planting dates. Ann. Agric. Sci. 2014, 59, 185–193. [Google Scholar] [CrossRef]
  38. Zhao, X.; Wang, S.; Xing, G. Maintaining rice yield and reducing N pollution by substituting winter legume for wheat in a heavily-fertilized rice-based cropping system of southeast China. Agric. Ecosyst. Environ. 2015, 202, 79–89. [Google Scholar] [CrossRef]
  39. Zhang, L.; Ruiz-Menjivar, J.; Tong, Q.; Zhang, J.; Yue, M. Examining the carbon footprint of rice production and consumption in Hubei, China: A life cycle assessment and uncertainty analysis approach. J. Environ. Manag. 2021, 300, 113698. [Google Scholar] [CrossRef] [PubMed]
  40. Yao, Y.; Zhang, M.; Tian, Y.; Zhao, M.; Zhang, B.; Zhao, M.; Zeng, K.; Yin, B. Duckweed (Spirodela polyrhiza) as green manure for increasing yield and reducing nitrogen loss in rice production. Field Crops Res. 2017, 214, 273–282. [Google Scholar] [CrossRef]
  41. Dong, W.; Zhang, X.; Dai, X.; Fu, X.; Yang, F.; Liu, X.; Sun, X.; Wen, X.; Schaeffer, S. Changes in soil microbial community composition in response to fertilization of paddy soils in subtropical China. Appl. Soil Ecol. 2014, 84, 140–147. [Google Scholar] [CrossRef]
  42. Lin, Y.; Ye, G.; Kuzyakov, Y.; Liu, D.; Fan, J.; Ding, W. Long-term manure application increases soil organic matter and aggregation, and alters microbial community structure and keystone taxa. Soil Biol. Biochem. 2019, 134, 187–196. [Google Scholar] [CrossRef]
  43. Wang, J.; Wu, L.; Xiao, Q.; Huang, Y.; Liu, K.; Wu, Y.; Li, D.; Duan, Y.; Zhang, W. Long-term manuring enhances soil gross nitrogen mineralization and ammonium immobilization in subtropical area. Agric. Ecosyst. Environ. 2023, 348, 108439. [Google Scholar] [CrossRef]
  44. Liu, W.; Qiao, C.; Yang, S.; Bai, W.; Liu, L. Microbial carbon use efficiency and priming effect regulate soil carbon storage under nitrogen deposition by slowing soil organic matter decomposition. Geoderma 2018, 332, 37–44. [Google Scholar] [CrossRef]
  45. Klink, S.; Keller, A.B.; Wild, A.J.; Baumert, V.L.; Gube, M.; Lehndorff, E.; Meyer, N.; Mueller, C.W.; Phillips, R.P.; Pausch, J. Stable isotopes reveal that fungal residues contribute more to mineral-associated organic matter pools than plant residues. Soil Biol. Biochem. 2022, 168, 108634. [Google Scholar] [CrossRef]
  46. Li, Y.; Wang, C.; Gao, S.; Wang, P.; Qiu, J.; Shang, S. Impacts of simulated nitrogen deposition on soil enzyme activity in a northern temperate forest ecosystem depend on the form and level of added nitrogen. Eur. J. Soil Biol. 2021, 103, 103287. [Google Scholar] [CrossRef]
  47. Honeker, L.K.; Gullo, C.F.; Neilson, J.W.; Chorover, J.; Maier, R.M. Effect of Re-acidification on Buffalo Grass Rhizosphere and Bulk Microbial Communities During Phytostabilization of Metalliferous Mine Tailings. Front. Microbiol. 2019, 10, 1209. [Google Scholar] [CrossRef]
  48. Jemaneh, Z.H.; Bobbi, L.H.; Sandra, F.Y.; Henry, H.J.; Benjamin, H.E.; Edward, G.G. Warming effects on the structure of bacterial and fungal communities in diverse soils. Appl. Soil Ecol. 2021, 163, 103973. [Google Scholar]
  49. Yufita, D.C.; Yoshitaka, U.; Hajime, A. Roles of soil bacteria and fungi in controlling the availability of nitrogen from cover crop residues during the microbial hot moments. Appl. Soil Ecol. 2021, 168, 104135. [Google Scholar]
  50. Deng, S.; Zheng, X.; Chen, X.; Zheng, S.; He, X.; Ge, T.; Kuzyakov, Y.; Wu, J.; Su, Y.; Hu, Y. Divergent mineralization of hydrophilic and hydrophobic organic substrates and their priming effect in soils depending on their preferential utilization by bacteria and fungi. Biol. Fertil. Soils 2021, 57, 65–76. [Google Scholar] [CrossRef]
  51. Kong, Y.; Kuzyakov, Y.; Ruan, Y.; Zhang, J.; Wang, T.; Wang, M.; Guo, S.; Shen, Q.; Ling, N. DNA stable-isotope probing delineates carbon flows from rice residues into soil microbial communities depending on fertilization. Appl. Environ. Microbiol. 2020, 86, e02151-19. [Google Scholar] [CrossRef]
  52. Rashad, M.; Hafez, M.; Popov, A.I. Humic substances composition and properties as an environmentally sustainable system: A review and way forward to soil conservation. J. Plant Nutr. 2022, 45, 7. [Google Scholar] [CrossRef]
  53. Smith, C.J.; Chalk, P.M. The residual value of fertilizer N in crop sequences: An appraisal of 60 years of research using 15N tracer. Field Crop Res. 2018, 217, 66–74. [Google Scholar] [CrossRef]
  54. Compton, J.E.; Pearlstein, S.L.; Erban, L.; Coulombe, R.A.; Hatteberg, B.; Henning, A.; Brooks, J.R.; Selker, J.E. Nitrogen inputs best predict farm field nitrate leaching in the Willamette Valley, Oregon. Nutr. Cycl. Agroecosyst. 2021, 120, 223–242. [Google Scholar] [CrossRef] [PubMed]
  55. Hafez, M.; Popov, A.I.; Rashad, M. Evaluation of the effects of new environmental additives compared to mineral fertilizers on the leaching characteristics of some anions and cations under greenhouse plant growth of saline-sodic soils. Open Agric. J. 2020, 14, 246–256. [Google Scholar] [CrossRef]
Figure 1. Diurnal variation of sunshine duration, average air temperature, average relative humidity, rainfall, and average wind speed in the rice-broad bean rotation system (RBRS) from 1 May 2021 to 30 April 2022.
Sustainability 15 06091 g001
Figure 2. Soil (a) urease, (b) catalase, (c) phosphatase, and (d) invertase activity succession patterns at different depths.
Sustainability 15 06091 g002
Figure 3. Relative abundance of bacteria and fungi at the family level under N2.
Sustainability 15 06091 g003
Figure 4. Significant difference among treatments of bacteria and fungi at the family level.
Sustainability 15 06091 g004
Figure 5. Dynamic changes in soil (a) SON content, (b) SONM rate, and (c) cumulative nitrogen supply from SONM at different depths in the rice−broad bean rotation system (RBRS).
Sustainability 15 06091 g005
Figure 6. (a) NH4+-N and (b) NO3-N concentration in groundwater at 20 cm, 40 cm, and 60 cm depths during the rice season.
Sustainability 15 06091 g006
Table 1. Changes in average content of SON at different soil depths. Different letters indicate means with significant differences according to the least significant difference at p < 0.05.
TreatmentsRice Season (g kg−1)Broad Bean Season (g kg−1)
0–10 cm10–20 cm20–40 cm0–10 cm10–20 cm20–40 cm
N03.32c3.14b2.56b3.22c2.47c2.32c
N13.56a3.387a2.48c3.37b2.59b2.49a
N23.51b3.39a2.69a3.41a2.62a2.44b
Table 2. Analysis of variance of crop yield, nitrogen content, and nitrogen accumulation in rice and broad bean plants after harvest in the rice–broad bean rotation system (RBRS).
PlantsTreatmentsDry Matter
(t ha−1)
Nitrogen
Content (%)
NA
(kg ha−1)
PAPC
(%)
U
(kg ha−1)
RNE
(%)
Yield
(kg ha−1)
RiceN011.3b0.994b112.2c0.3660 5.01b
N118.7a1.105a206.6b1.68551.4a38.1a11.8a
N220.9a1.157a241.6a1.76363.7a33.0a11.7a
Broad beanN0 in rice season4.0a1.765a70.9b0.3660 1.96b
N1 in rice season5.2a1.854a95.7a0.6655.4a4.0a2.69a
N2 in rice season5.6a1.851a103.5a0.7247.0a3.6a2.73a
Note: PAPC denotes plant atomic percentage of 15N. NA denotes plant nitrogen accumulation. U denotes plant uptake of nitrogen from urea. RNE denotes the efficiency of NF. Different letters indicate means with significant differences according to the least significant difference at p < 0.05.
Table 3. Correlation analysis of SONM rate with soil urease, catalase, phosphatase, and invertase activities.
UreaseCatalasePhosphataseInvertaseSONM Rate
Urease1
Catalase−0.1381
Phosphatase−0.509 **0.1881
Invertase−0.651 **0.1420.608 **1
SONM rate0.272 *−0.181−0.276 *−0.342 **1
* and ** represent the significant differences at p < 0.05 and p < 0.01, respectively.
Table 4. Relationship between SONM rate and fungal and bacteria abundance in different layers under N2.
Soil LayerFungiBacteria
AspergillaceaeNectriaceaePseudeurotiaceaeChaetomiaceaeUnclassified_o
__Helotiales
Unclassified_c__
Tremellomycetes
Norank_o
__C0119
0–10 cm0.717 *0.793 **0.5300.5940.744 *0.519−0.406
10–20 cm0.707 *0.753 *0.703 *0.750 *0.709 *0.059−0.826 **
20–40 cm0.707 *0.657 *0.706 *0.5350.698 *0.638 *−0.491
* and ** represent the significant differences at p < 0.05 and p < 0.01, respectively.
Disclaimer/Publisher’s Note: The statements, opinions and data contained in all publications are solely those of the individual author(s) and contributor(s) and not of MDPI and/or the editor(s). MDPI and/or the editor(s) disclaim responsibility for any injury to people or property resulting from any ideas, methods, instructions or products referred to in the content.

