Review

The Impact of Fisheries on the Economy: A Systematic Review on the Application of General Equilibrium and Input–Output Methods

1
School of Organisations, Systems and People, Faculty of Business and Law, University of Portsmouth, Portsmouth PO1 3DE, UK
2
UNESCO Chair in Ocean Governance, Centre for Blue Governance, University of Portsmouth, Portsmouth PO1 3DE, UK
3
School of Economics and Resource Management, Beijing Normal University, Beijing 100875, China
4
Center for Innovation and Development Studies, Beijing Normal University, Zhuhai 519087, China
5
Centre for Blue Governance, Faculty of Business and Law, University of Portsmouth, Portsmouth PO1 3DE, UK
*
Author to whom correspondence should be addressed.
Sustainability 2023, 15(7), 6089; https://doi.org/10.3390/su15076089
Submission received: 16 December 2022 / Revised: 23 February 2023 / Accepted: 20 March 2023 / Published: 31 March 2023
(This article belongs to the Special Issue Integrated Modelling for Sustainable Fisheries Management)

Abstract

:
In this paper, a systematic literature review on the impact of fisheries on the economy and the application of the computable general equilibrium (CGE) and input–output (IO) methods for assessing this impact is conducted. The importance of fisheries as a food source, the over exploitation of this resource, and, consequently, the impact of fisheries on the economy are the motivations behind this study. By reviewing the applications of two of the most common economic modelling tools, we aim to shine light on the state of the art and how the impact of fisheries on the economy has been addressed in the literature. In this analysis, three main themes of socio-economic, ecological, and environmental have been identified, and the application of these methods in each theme has been considered. The results show that while IO methods continue to be applied in the literature, the CGE method has experienced increased application recently, and future applications are anticipated due to its enhanced capabilities in comparison with IO models.

1. Introduction

The fishery sector is one of the important contributors to coastal economies, with significant economic, political, social, and environmental effects within the regional economy. The fisheries are part of the wider economy of a region and involve a number of different industries and agents who facilitate the flow of products between producers and consumers. The interaction of the fishery industry with the economy could be illustrated as a flow involving several stages as following: (i) variety of fish products is produced by the primary fishery industry, (ii) the market intermediaries (i.e., wholesale and retail traders, processors, and brokers) will facilitate the movement of this production amongst households, processing industries, or forward-linked industries and export, (iii) fishers and forward-linked industries draw input from manufacturing and service industry or backward-linked industries, and (iv) governments and households are the key sectors that interact with the three industry category and connect these industries to the economy [1].
In an open fishery access model, the fisheries are common property resources for which the right to catch fish is available to all without restriction or regulation [2]. However, given the fishers’ behaviour to maximize gains, overexploitation and environmental degradation, including depletion of fish population and the risk of extinction, would pose a threat from a sustainability perspective, which could also lead to negative economic consequences for the region. As stated by [3], “It has been recognized for over 50-years that the root cause of the economic problem in capture fisheries management lies in their traditional common property nature and the resulting open access/near open access fisheries.”
From an economic standpoint, the maximum economic yield (MEY) in fisheries is defined as the point that generates the greatest margin of aggregate revenue over cost which incentivises others to enter the fisheries until the net benefit becomes zero, occurring at a point called Open Access Equilibrium (OAE). However, since OAE usually happens at levels of fishing effort greater than that required for maximum sustainable yield, it could often exhibit overfishing, resulting in potential economic impact on the economy of the region [4].
On the other hand, in a regulated open access model, such as the fisheries regulated under the European Common Fisheries Policy (CFP), fisheries are regulated via different measures, such as gear restrictions, seasonal restrictions, and total allowable catch [5]. Such measures are executed via state control, forms of co-management, and community-based management or privatisation. Nonetheless, these top-down management measures could also lead to poor results and dissatisfaction amongst fishers due to lack of transparency and prioritisation of the environmental objectives over criteria such as fisheries’ profit and local employment in the region [6]. Apart from the governance of fisheries (regulated or non-regulated), other external factors affect the fisheries; these factors include (i) environmental factors, such as climate change, (ii) ecological factors, such as changes in the fish biomass, and (iii) socio-economic factors, such as introduction of a new industry within the region.
Fisheries are often related to other sectors within the economy and can be divided into primary fishery sector (wild capture/aquaculture) and secondary fishery sector (processing and packaging, storage, transportation, etc.). To analyze the interdependence of these sectors and quantify the economic impacts of these sectors on each other and the wider economy, the economic models could determine measures, such as the cross-sectoral linkage effect, the employment induced effect, the production inducing effect, and supply shortage effects.
Therefore, the assessment of the impact of fisheries on the economy in light of the aforementioned factors becomes an important issue. In this paper, we present a literature review to consider the application of two well-known economic analysis tools, namely the input–output (IO) and computable general equilibrium (CGE) models, in quantifying and understanding the impact of interactions of fisheries within the regional/national economy. Although a significant amount of the literature is devoted to the assessment of the economy-wide impact of the fishery sector using IO and CGE methods, there is a paucity of recent systematic literature reviews on the application of these economic models in this sector, and the latest survey dates back to the year 2006 [7].
This study fills the gap by providing a comparative analysis and a literature survey on the aforementioned two well-known tools of economic systems modelling in terms of their assessment of the contribution of the fishery sector to the regional development covering the studies in the period between the years 2000 and 2020. The original contribution of this study is to characterize relevant studies in this domain and identify the current state of the art in the application of IO and CGE methods to assess the impact of the fishery sector on the economy, elaborate the strengths and weaknesses of these methods, and anticipate their future applications for the sector given the threat of overexploitation of marine resources. A systematic review will be more successful when the methodology is applied to a clearly defined research question on issues where a review seems sensible [8].
In this study, the following research questions are identified:
  • What are the main application categories of the CGE and IO methods to assess the impact of fisheries on the economy?
  • Which type of criteria has been used in each method?
  • What are the future trends in the application of CGE and input–output methods in the fishery sector?
The remainder of this article is organised as following. In Section 2, the literature search process is explained. In Section 3, the theoretical backgrounds of these methods and the survey of the literature regarding the application of these methods in the fishery sector is provided, followed by discussion of the results. Lastly, in Section 4, the study is concluded by summarizing the results and suggestions into the future direction of the application of models for assessment of the impact of fisheries on the economy.

2. Literature Review
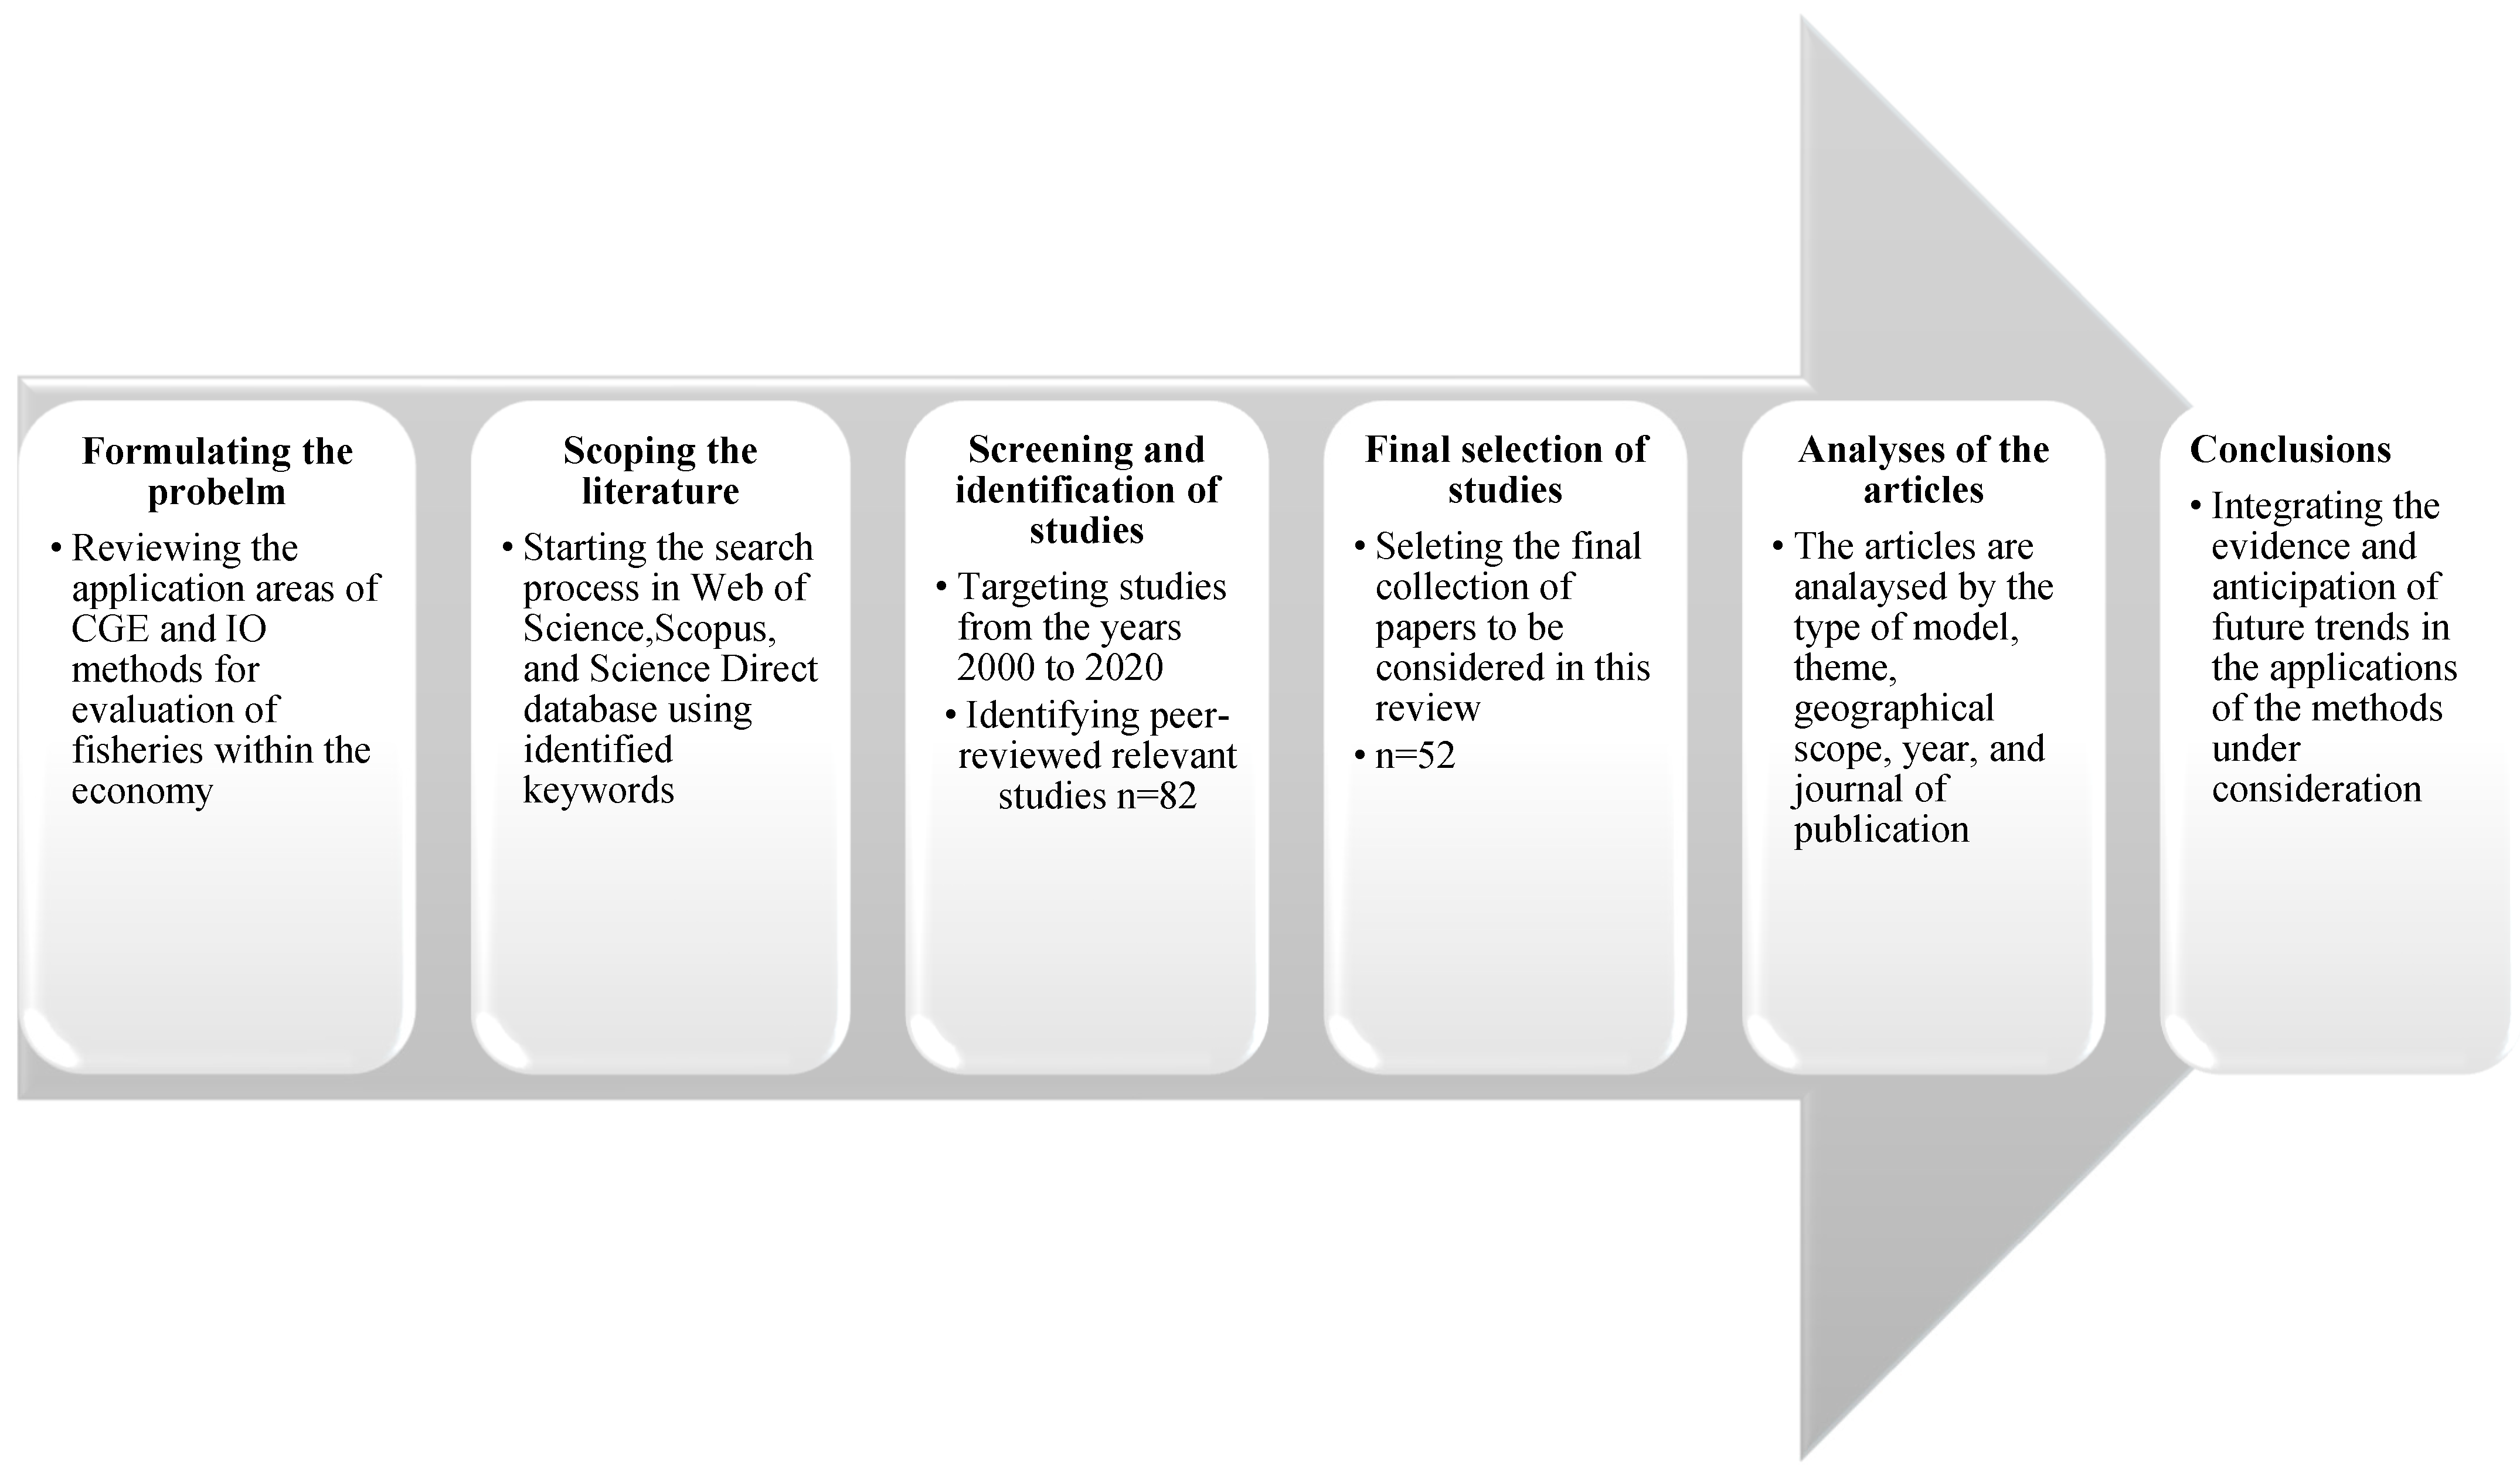
In the remainder of this section, the process of conducting the literature survey related to each method are provided.

Literature Search

Studies that have used the computable general equilibrium or input–output models in the fishery sector were identified using the search strings presented in Table 1 by using Web of Science, Scopus, and Science Direct, which are international indexed electronic databases (the asterisk is used as a truncation symbol).
The inclusion criteria were as following:
  • Included studies must address the application of CGE or IO models in fisheries.
  • Included studies must be quantitative.
  • Included studies must have been published in the period 2000–2020.
  • Included studies must be peer-reviewed; hence, reports, conference papers, and grey literature were excluded.
A total of 52 original articles were retrieved and analysed for this study, and from each original article, the following seven items of information were recorded: author, year, journal information, type of model, type of species, location, and research theme. It should be noted that although this survey may not be exhaustive of all the literature (such as reports and grey literature), every attempt was made to include all the peer-reviewed published articles which used the CGE and IO method in the fishery sector. Figure 1 shows the process of literature review for analysing the studies used in this review article.
On the basis of the information regarding the research themes, three main categories, in which the CGE and IO models were applied, are identified. These categories are (i) socio-economic, (ii) ecological, and (iii) environmental. In the socio-economic category, the studies that have assessed factors related to social and economic policy making, such as assessing the impact of policy measures, including new policy regulations, subsidies, and quota levels, on the fisheries are considered. In the ecological category, studies that have considered marine ecosystem modelling with a combination of economic models are considered. In the environmental category, studies that have considered the impact of climate change (including ocean acidification, sea level rise, and global warming) on the fisheries are considered. The identification of the categories is also important in determining the trends in the application of the models.

3. Literature Review on the Application of IO and CGE Methods in Fisheries

In this section, a theoretical background of each method, followed by the application of these methods, in the fishery sector is presented.

3.1. Input–Output Approach

The input–output models traditionally are built with the Leontief demand-driven approach to derive the quantitative impact of a change in final demands on the whole economy. The input–output analysis is considered an accepted and standard method to model an economy’s structural relationships due to its clear presentation of quantitative interdependence and operational convenience [9]. The input–output tables that are constructed for this model provide the economic data to answer questions regarding the interactions among various sectors in an economy for a given period of time. In the input–output table, the data are related to the transactions among sectors (e.g., agriculture and mining, food, and leisure industry) as well as the sales made to a category, referred to as final demand (e.g., households, government, and export). The model typically assumes that under constant prices, each sector uses a Leontief production technology to produce a specific product to meet final demand. Let a column set of intermediate and primary input coefficients represent a sector’s Leontief technology, then there exists a material balance among total, intermediate, and final outputs in a multi-sector economy such that
X = A X + Y
where X and Y are column vectors of total outputs and final demands, respectively, and A is the square matrix of technical coefficients defined as the shares of all sectors’ products in a sector’s production.
In the case that total outputs are endogenous and final outputs are exogenous, solving for X results in the Leontief model:
X = I A 1 Y
where I is a unit diagonal matrix and is conventionally called the Leontief inverse, which measures total direct and indirect impacts of a change in final demands on total outputs of the sectors.
Leontief initially developed the input–output analysis during the 1930s [10]. The single-region input–output method is based on the simple but fundamental notion that the production of output requires inputs, and IO is grounded in the technological relations of production based on measurable quantities that are empirically verifiable. Assuming access to relevant information, the input–output linkages that exist within an economy can be neatly formalised by constructing a transaction table (or flow matrix), which records all the production flows occurring within the country’s or regional economy during a specific year. On the one hand, in the multiregional IO model, the economic system is described in terms of interdependent industries and several interrelated regions. Each region’s output is defined as combined outputs of economic activities carried on within its geographic boundaries, while its input consists of the direct inputs of these industries and the goods and service absorbed directly by the final demand sector of that region [11]. For example, the seafood industry in a fishing town could depend heavily on the commodities (inputs) produced in the other regions, such as plastic and packaging products, fishing gear and equipment, and boat engines. Furthermore, once the fish is landed, it may be transported to other regions for processing, causing an interdependence among different regions. Therefore, in such cases, interregional IO models are better suited to assess the economic impact of fisheries.
Since Leontief’s pioneer works, the input–output technique has been used in a wide range of applications, including the assessment of technological change, natural resources, and international trade [12]. In particular, this technique can be used for predicting the consequences of any planned or potential changes in the demand for the region’s output [11,13,14].
One of the most important extensions of the input–output analysis is the social accounting matrix (SAM) approach, which is a statistical representation of the entire circular flows of a market economy, a framework developed by [15], but in the spirit of the production relationships of input–output models. Unlike the input–output matrix, a SAM is a square matrix, with the rows and columns representing all transactions among every type of economic agent in a country. Therefore, as for the input–output matrices, the major usefulness of the SAM approach is that it brings together the accounts of various economic agents whose behaviour is to be examined in a consistent framework.

Limits and Drawbacks of Input–Output Models

From a theoretical perspective, although input–output analysis is a valuable technique, it is not free of problems. The input–output models consist of only linear equations, exogenous final demands, and endogenous outputs, and they assume fixed prices and lack a clear description of the behaviour of individual agents [16]. Another serious obstacle is the high cost of collecting the data to construct the transaction table. In practice, it is often necessary to undertake sample surveys of firms. Because of this cost, non-survey methods are usually used for ‘filling in’ the transaction table. The most popular non-survey approach is to use technical relationships among industries calculated for national input–output models. The use of national technical coefficients in regional models, however, is fraught with difficulties since production techniques are likely to vary among regions [17].
Input–output tables are produced for a single specific period of time, such as a calendar year. If production techniques are changing through time (innovation and technological changes) or if the pattern of inter-industry linkages is sensitive to changes in the relative price of inputs, the model may quickly become redundant as a forecasting tool. Although various advanced mathematical methods exist for updating and forecasting the technical relationships among industries, these methods are still of uncertain values, and the input–output analyst is often forced to adopt ad hoc procedures. One method, known as the ex ante technique, utilises the knowledge and judgment of a team of experts for each industry. A further drawback of the input–output approach is that the technical relationship among industries assumes that all industries exhibit constant returns to scale (a doubling of outputs requires a doubling of inputs) [16]. This assumption is restrictive, but it is necessary in the absence of information on the returns to scale in individual industries.

3.2. Applications of the Input–Output Model in the Fishery Sector

The linear Leontief input and output methodologies are commonly used to assess how the potential changes within resource management may affect specific industry sectors as well as the overall regional economy. Input–output analysis allows for the tracing of forward and backward linkage of a sector to the rest of the economy. Traditional fishery management IO models usually consider demand-driven exogenous changes caused by management policies. However, some fishery management policies, such as creating marine protected areas, are supply-driven changes, and, therefore, output-based and supply-driven IO methods are used in such scenarios [18]. In the remainder of this section, the studies using the IO method in the fishery sector are analysed and classified into IO models and SAM models.

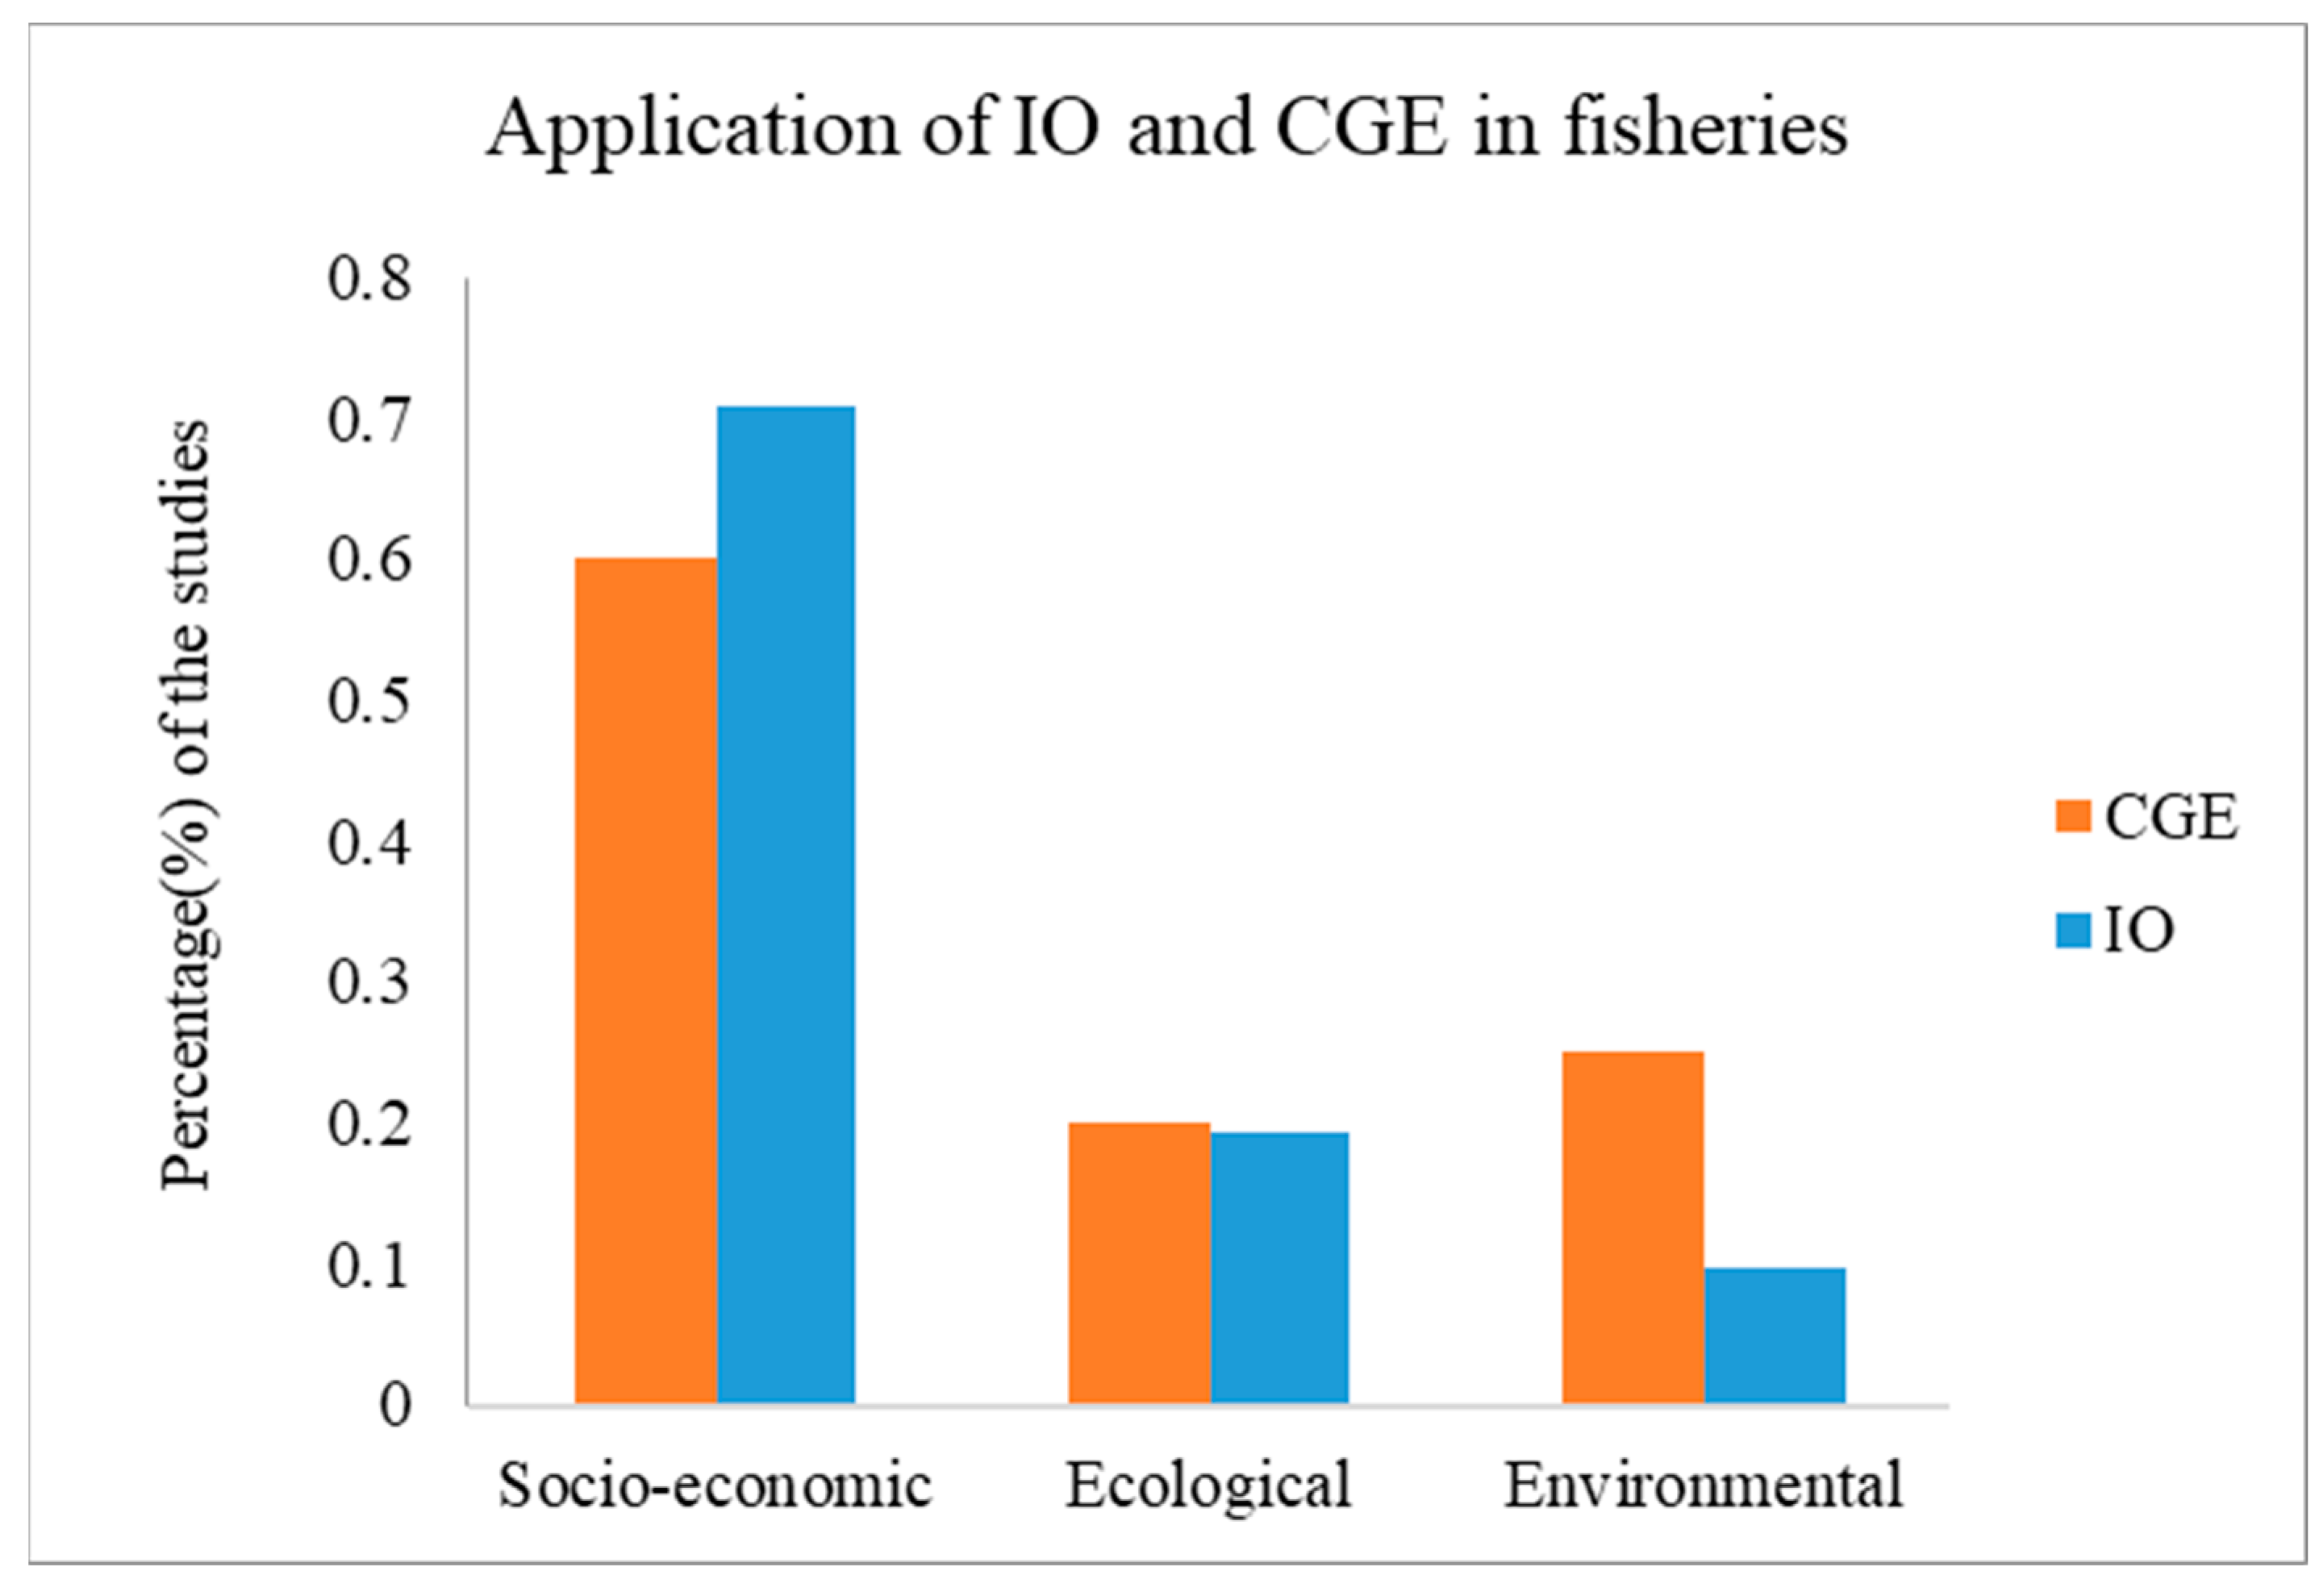
3.2.1. Application of Input–Output Models for Assessing the Impact of Socio-Economic Factors on Fisheries

Assessment of socio-economic changes is one of the most important aspects in fishery management and developing management policies. Issues such as subsidies, level of quota, and new regulations can have an impact on the fisheries and the wider regional or national economy, and input–output models are used to assess the impact of such changes on the wider economy, including employment and social welfare.

IO Models

Demand-driven and supply-driven IO models have been widely used in the literature in areas including the economic impact of catch reallocation [19], output reduction [20], fishery entry regulations [1] (Bhat & Bhatta, 2006), increase in catch size [21], aquaculture development [22,23], individual fishing quota program and annual fishing quota [24,25,26], impact of fisheries on the economy [27,28,29,30,31,32], bycatch [33], and coastal area development [34].
Multiregional IO models have also been applied to assess economic impact within various regions, including the work of [35,36,37] on the economic impact of recreational fisheries and [38] on the economic contribution of charter fishing.

SAM Models

As an extension to the IO model, the SAM method have also been applied in the literature, especially for assessing the multi-regional economic impacts. The study by [39] extended the analysis from the input–output system into a supply-driven SAM framework to measure the economic impacts of TAC regulation of hake on the Galician economy. The advantage of their approach is to internalize the income distribution, consumption, and employment factors. Another study [40] applied a multi-regional SAM method to measure the multiregional economic contribution of the Alaska fishing fleet, with linkage to the internal markets using employment and income as the outputs. Seung [41] applied the multi-regional SAM to assess the economic impact of reduction of salmon harvest in Alaska. They showed that the salmon fishery failure had significant adverse economic impacts on the region, and the disaster relief program offered by the government mitigated only a small portion of the adverse impacts. Another work [36] quantified and compared the economic contribution of two alternative methods of producing fish, aquaculture and wild fisheries, in Gyeong-Nam province, Korea, using the SAM method.

3.2.2. Application of IO for Assessing the Impact of Ecological Factors on Fisheries

The intertwined nature of economy and ecology in the fishery sector leads to economic–ecologic models which combine information and results from each discipline in a single cohesive model. Hoagland et al. [42] developed an economic–ecological model via merging the IO model of a coastal economy with a model of marine food web with a case application in New England, U.S.A. Their model simulated the economic impact of changes in primary production in the ecosystem on final demands for fishery products. Steinback et al. [43] applied the IO model to examine the biological and economic impact of reductions in the level of effort for the southern new England lobster fishery. Their results showed that reduction in effort could potentially improve the sustainability of lobster resource and stimulate economic growth in the coastal economy. Kaplan and Leonard [44] combined a fishery ecosystem model with the IO model that traces how changes in seafood landing impact the broader economy in the U.S. west coast region under different scenarios. Based on their results, each policy option involves trade-offs between economics and conservation of the resources. Wang et al. [45] developed an integrated ecological–economic–social model for marine fishery management in the Pearl River estuary using the Ecopath and SAM methods. In their model, the impact was assessed by varying fishing efforts for four scenarios, including status quo management, fishing effort reduction policy, fishing gear switch policy, and summer closure extension policy. Fay et al. [46] linked the Atlantis ecosystem model to an input–output regional economic model and assessed the economic impact of change in the fishing effort via different scenarios in the Northeast U.S.

3.2.3. Application of IO for Assessing the Impact of Environmental Factors on Fisheries

The oceans are experiencing warming, acidification, eutrophication, and other changes that are modifying marine ecosystems [47]. Therefore, possible physical and biological effects of climate change on the natural resources is one of the major research themes in the input–output literature in the fisheries. The multi-fleet, multispecies ECONMULT model and demand-driven IO method were applied in the study by [48] to examine the potential effects of global warming on the Barents Sea fisheries, and the implications for the North Norwegian economy were applied taking into account changes in the catches, profitability, employment, and income generation of Barents Sea fisheries. Lopez [49] used projected catches for a demand-driven IO model of the Australian economy to determine the flow on effects of climate change affecting lobster fisheries. Hodgson [50] combined the Atlantis model with the IO model to assess the impact of ocean acidification on a number of North American coastlines. Their results suggested that vulnerable species (e.g., calcifying invertebrates) and their predators decline the most, resulting in decline in revenue.

3.3. The Computable General Equilibrium Method

Computable general equilibrium models are based on the theory of general equilibrium that draws on the main concepts of market clearing and neoclassical micro-economic optimisation behaviour of rational and homogenous economic agents [51]. In contrast to input–output models, in CGE models, the behaviour of individual agents is identified, and labour, capital, and often composites of intermediate goods are substitutable. Furthermore, markets are connected, and the models capture a multitude of simultaneous interaction effects [52]. The primary data sources for the CGE model are national accounts, input–output tables, as well as data on taxes, income, and expenditure.
Most CGE models are based on social accounts, explicitly incorporate resource constraints, allow for input substitution, and have a strong price–quantity integration, and they can tackle a broader set of issues than most IO models [12]. As an alternative to the input–output model, the computable general equilibrium model takes into account structural adaptations of an economy to changes in one or more economic components and allows for substitution of inputs, outputs, and trade effects in the event of economic uncertainty [53]. The CGE modelling is fully based on general equilibrium theory and, thus, regarded as being part of mainstream economics. The formalization of the general equilibrium structure of the CGE models can be traced to [54] on proof of the existence of the general equilibrium, Johansen [55] on the first CGE model that allowed substitution between factors, and the theoretical work of Scarf [56]. The other main contributions of CGE or AGE (applied general equilibrium) modelling include nonexclusively and [57,58] on tax and trade policy. CGE models represent an extension to classical equilibrium analytical models through being mostly policy-driven and providing numerical solutions to large multi-sectoral models [51].

Limits and Drawbacks of CGE

The most frequent weakness of CGE models is their lack of empirical validation, in the sense that usually there is no measure of the degree to which the model fits the data or tracks the historical facts. The heavy dependence on calibration data, in addition to their parametrization being based on observations of the economic systems at a particular time, could weaken their predictive power [59].
CGE models are based on parameter values estimated independently and are generally calibrated to a single data point, which is chosen to represent a situation close to general equilibrium. Because of the assumption of general equilibrium, which is seldom observed in all of the markets simultaneously, the results of the model do not pretend to forecast reality but rather indicate long-term tendencies, around which the economy will fluctuate [51].
Another drawback of the CGE method is how the technological changes are modelled. The technological changes are modelled by altering the exogenous productivity factors and/or constant elasticity of substitution, leading to the technology considered exogenous or static, both of which are unrealistic assumption in real-world application [60].

3.4. The CGE Models of Fisheries

CGE modelling has become a widely used tool for analysis of environmental policy and natural resources management since the start of 1990s [61]. In a study by [7], input–output, SAM, and CGE models are compared for fishery management in the U.S. They find that although none of the models can be singly applicable for analysing all types of fishery policy and management issues, the CGE models seem to have more advantages over the input–output and SAM models for fisheries. Furthermore, multi-regional and intra-country CGE models are suitable tools to deal with shared natural resources since the fisheries in many countries are shared among multiple regions or countries (e.g., the European Union).
Similar to the previous section, the applications of CGE identified in this review can be categorised into three main groups of (i) socio-economic, (ii) ecological, and (iii) environmental, and in each category, CGE and dynamic CGE methods are identified. In the remainder of this section different studies that have used the CGE method, are examined based on this categorisation. Although in some studies these areas overlap, this categorisation is beneficial in identifying the applications of CGE in a more structured manner.

3.4.1. Application of CGE for Assessing the Impact of Socio-Economic Factors on Fisheries

The assessment of socio-economic impact of the fisheries has been one of the active research areas in the application of CGE. In this domain, the assessment of regional impact in terms of profitability [62], supply and demand shocks [63,64], social welfare [65,66], the effects of subsidies [67], and sustainable fishery policy [68] have been examined. Dynamic CGE has also gained prominence and is applied in studies assessing the elimination of subsidies [69], and effects of the European Union’s Common Fishery policy regulations and stock rebuilding policies [70].

3.4.2. Application of CGE for Assessing the Impact of Ecological Factors on Fisheries

There is another group of fisheries economic models that simulate both economic and ecological systems and integrate them together, using general equilibrium theory [71,72,73]. Tschirhart [74] applied the CGE to assess the predator–prey relations in Eastern Bering Sea. Jin et al. [75] applied the CGE to develop an integrated economic and ecological framework for ecosystem-based fishery management with a case application in New England, U.S.A. Wang et al. [76] developed a CGE model, which is connected to an Ecopath with Ecosim model, which could simulate the dynamics of an ecosystem. Their model aimed to investigate how different scenarios of fishing effort and catch management simulations result in different states of the socio-economic and ecosystem structure. The results showed that the output control policy has the most positive effect on ecosystem restoration and can increase overall social welfare.

3.4.3. Application of CGE for Assessing the Impact of Environmental Factors on Fisheries

Changes in the natural resources caused by climate change can have direct impact on the economies dependent on natural resources. CGE models are able to quantify the effects of these changes on the economy [61]. It is suggested that the ecosystem follows the general equilibrium theory, and prices drive species to compete for survival. However, it should be noted that while these systems may possess some general equilibrium features but are different from standard, SAM-based, multi-sector general equilibrium models, they are, thus, limited in providing economic insights [77]. Seung [78] combined a stock yield projection model with CGE to study the regional economic impacts of climate change on the Eastern Bering Sea Pollock in Alaska, U.S.A. They also evaluated alternative policies for managing the Pollock fishery with climate change by applying CGE [79]. Nong [77] applied the CGE model to examine the impact of the wild-catch fishery decline due to climate change in major producing countries in Southeast Asia and South America, with a focus on the food Industry. Das et al. [80] applied the CGE for determining the impact of climate change on the fisheries in two Indian deltas, and their result showed that the increase in the temperature caused loss of fish productivity and the need for improved management plans to mitigate the negative impacts. Seung et al. [81] applied a dynamic CGE for assessing the impact of climate change on red king crab in Bristol Bay, Alaska. Dynamic CGE is applied in a study by [82] to assess the sectoral and regional economic consequence of climate change up to the year 2060 on natural resources, including changes in fishery catches. Their results showed that damages are projected to rise twice as fast as global economic activity, with damages from sea level rise growing most rapidly after the middle of the century.

3.5. Challenges in Application of IO and CGE Method in Fisheries

Amongst the weaknesses of the IO models is the price rigidity (i.e., fixed price assumption) and the assumption that no substitution is allowed between factors in production or commodities in consumption [7]. Furthermore, most IO studies of fisheries use the demand-driven IO model; however, fishery management measures are typically concerned with supply constraints, such as changes in total allowable catch and seasonal and area closures [18]. Therefore, demand-driven IO models may not capture the chain of effects, especially if it is not known how much final demand for seafood will change as a result of the change in supply [7].
In order to address these weaknesses, the econometric model is combined with the IO model (EC-IO). Rey [83] argued that this combination has several advantages. Firstly, with detailed inter-industry relationships specified in the IO portion of the integrated model, the EC-IO model had better forecasting performance. Secondly, integrated models had improved impact analysis features and were able to generate the time paths of the effects of policy impacts. Thirdly, since the econometric part in the integrated model was typically estimated on the basis of regional data, the integrated model could be used to reduce the bias of secondary data-type IO models, which were a result of the regionalization of a national IO model [83].
In comparison with IO models, CGE models overcome the price rigidity limitation and allow price variations, which allows for the incorporation of substitution effects in production and consumption. However, Soderbaum [84] argues that the conventional neo-classical approach of CGE, which extends established liberal concepts, such as supply and demand forces, market equilibrium, profit and utility maximisations, and monetary valuation, to address ecological challenges, encompass a mechanistic and reductionist approach. It is suggested that this approach may fail to appropriately account for the institutional arrangements, ethical concerns, and the developmental needs of a society. General equilibrium models lie on the foundation of maximisation and rationality; however, these models may be insufficient to depict socio-economic realities and may not be fully applicable for sustainability policy appraisal [85]. Furthermore, a steady state equilibrium, an inherent assumption in CGE models, may hardly be reached since fisheries are often grounded in instability and subject to never-ending change and dynamic disequilibrium forces.
Currently, some environmental challenges threaten the fisheries, and their impact has rarely been taken into account in the IO and CGE literature. Problems—such as the effects of measures (including landing obligation, bycatch, and choke species) and the impact of trace metal contamination, temperature increase, pollution, and parasitism and how they may affect the fisheries—have not been captured using the aforementioned methods. Therefore, in the context of fishery management policies and assessment, integrated IO models and dynamic CGE models may be suited to fully tackle the uncertain nature of biological, ecological, and socio-economic changes occurring within the fisheries system.

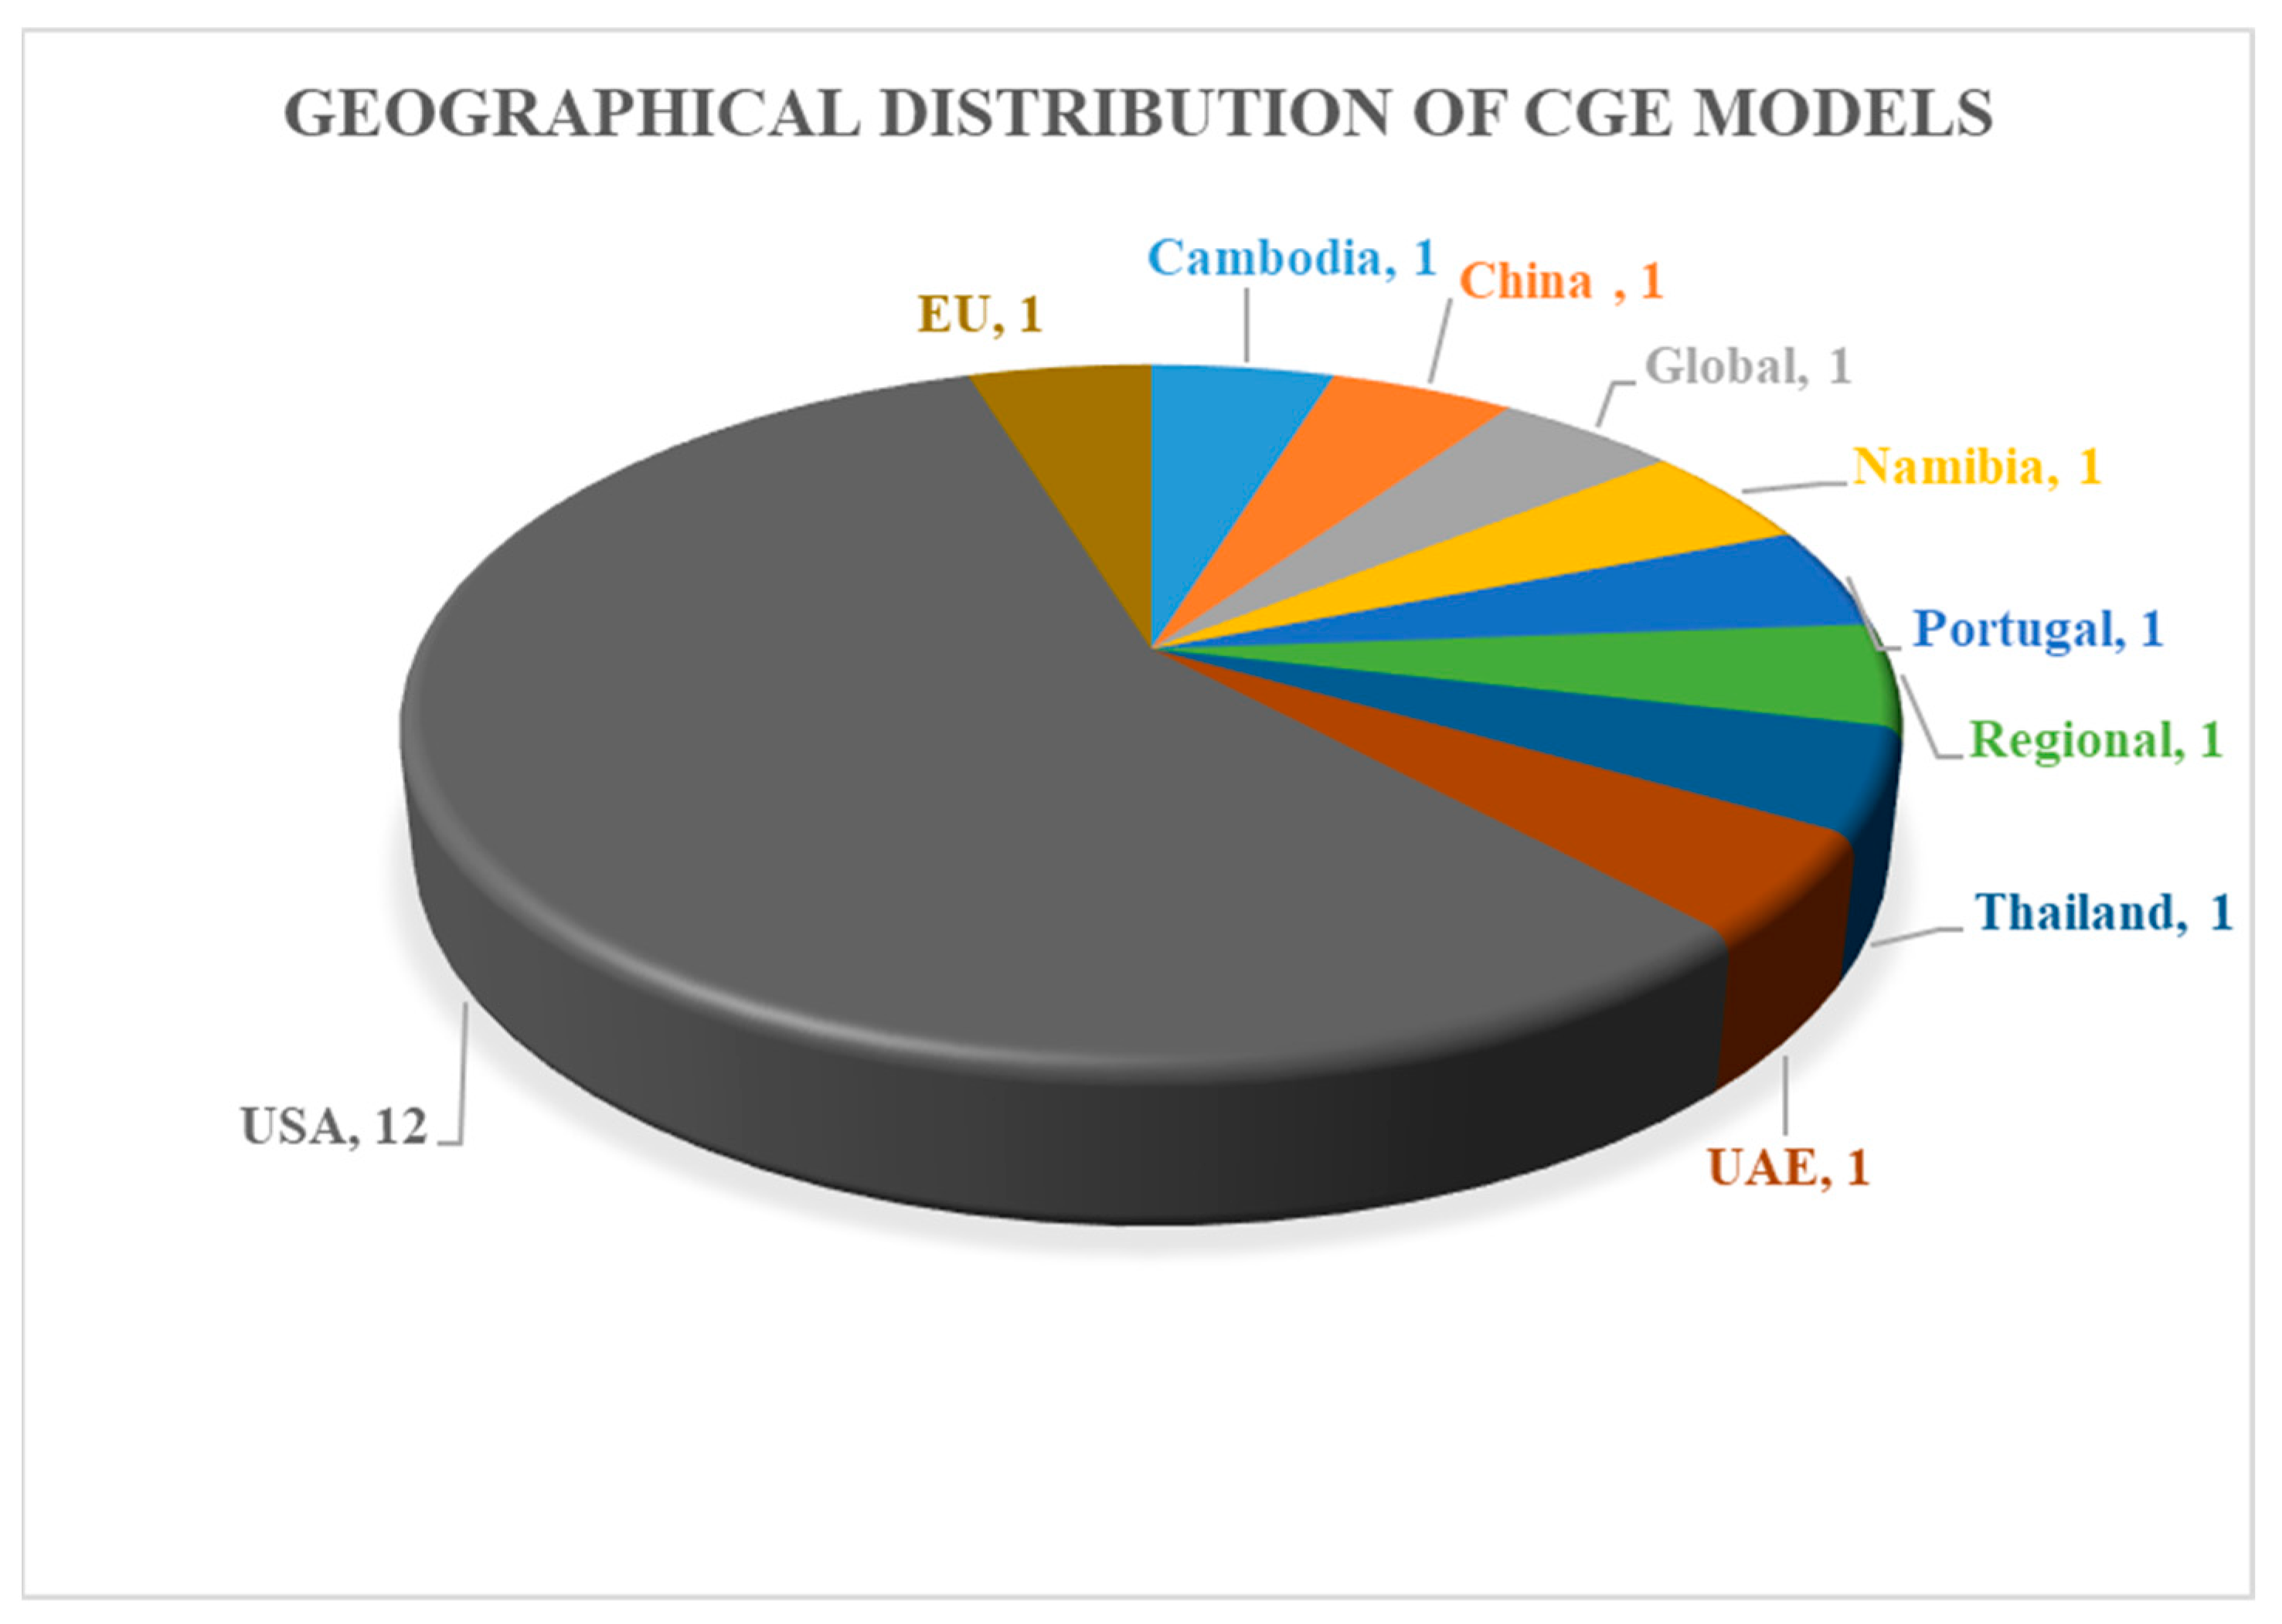
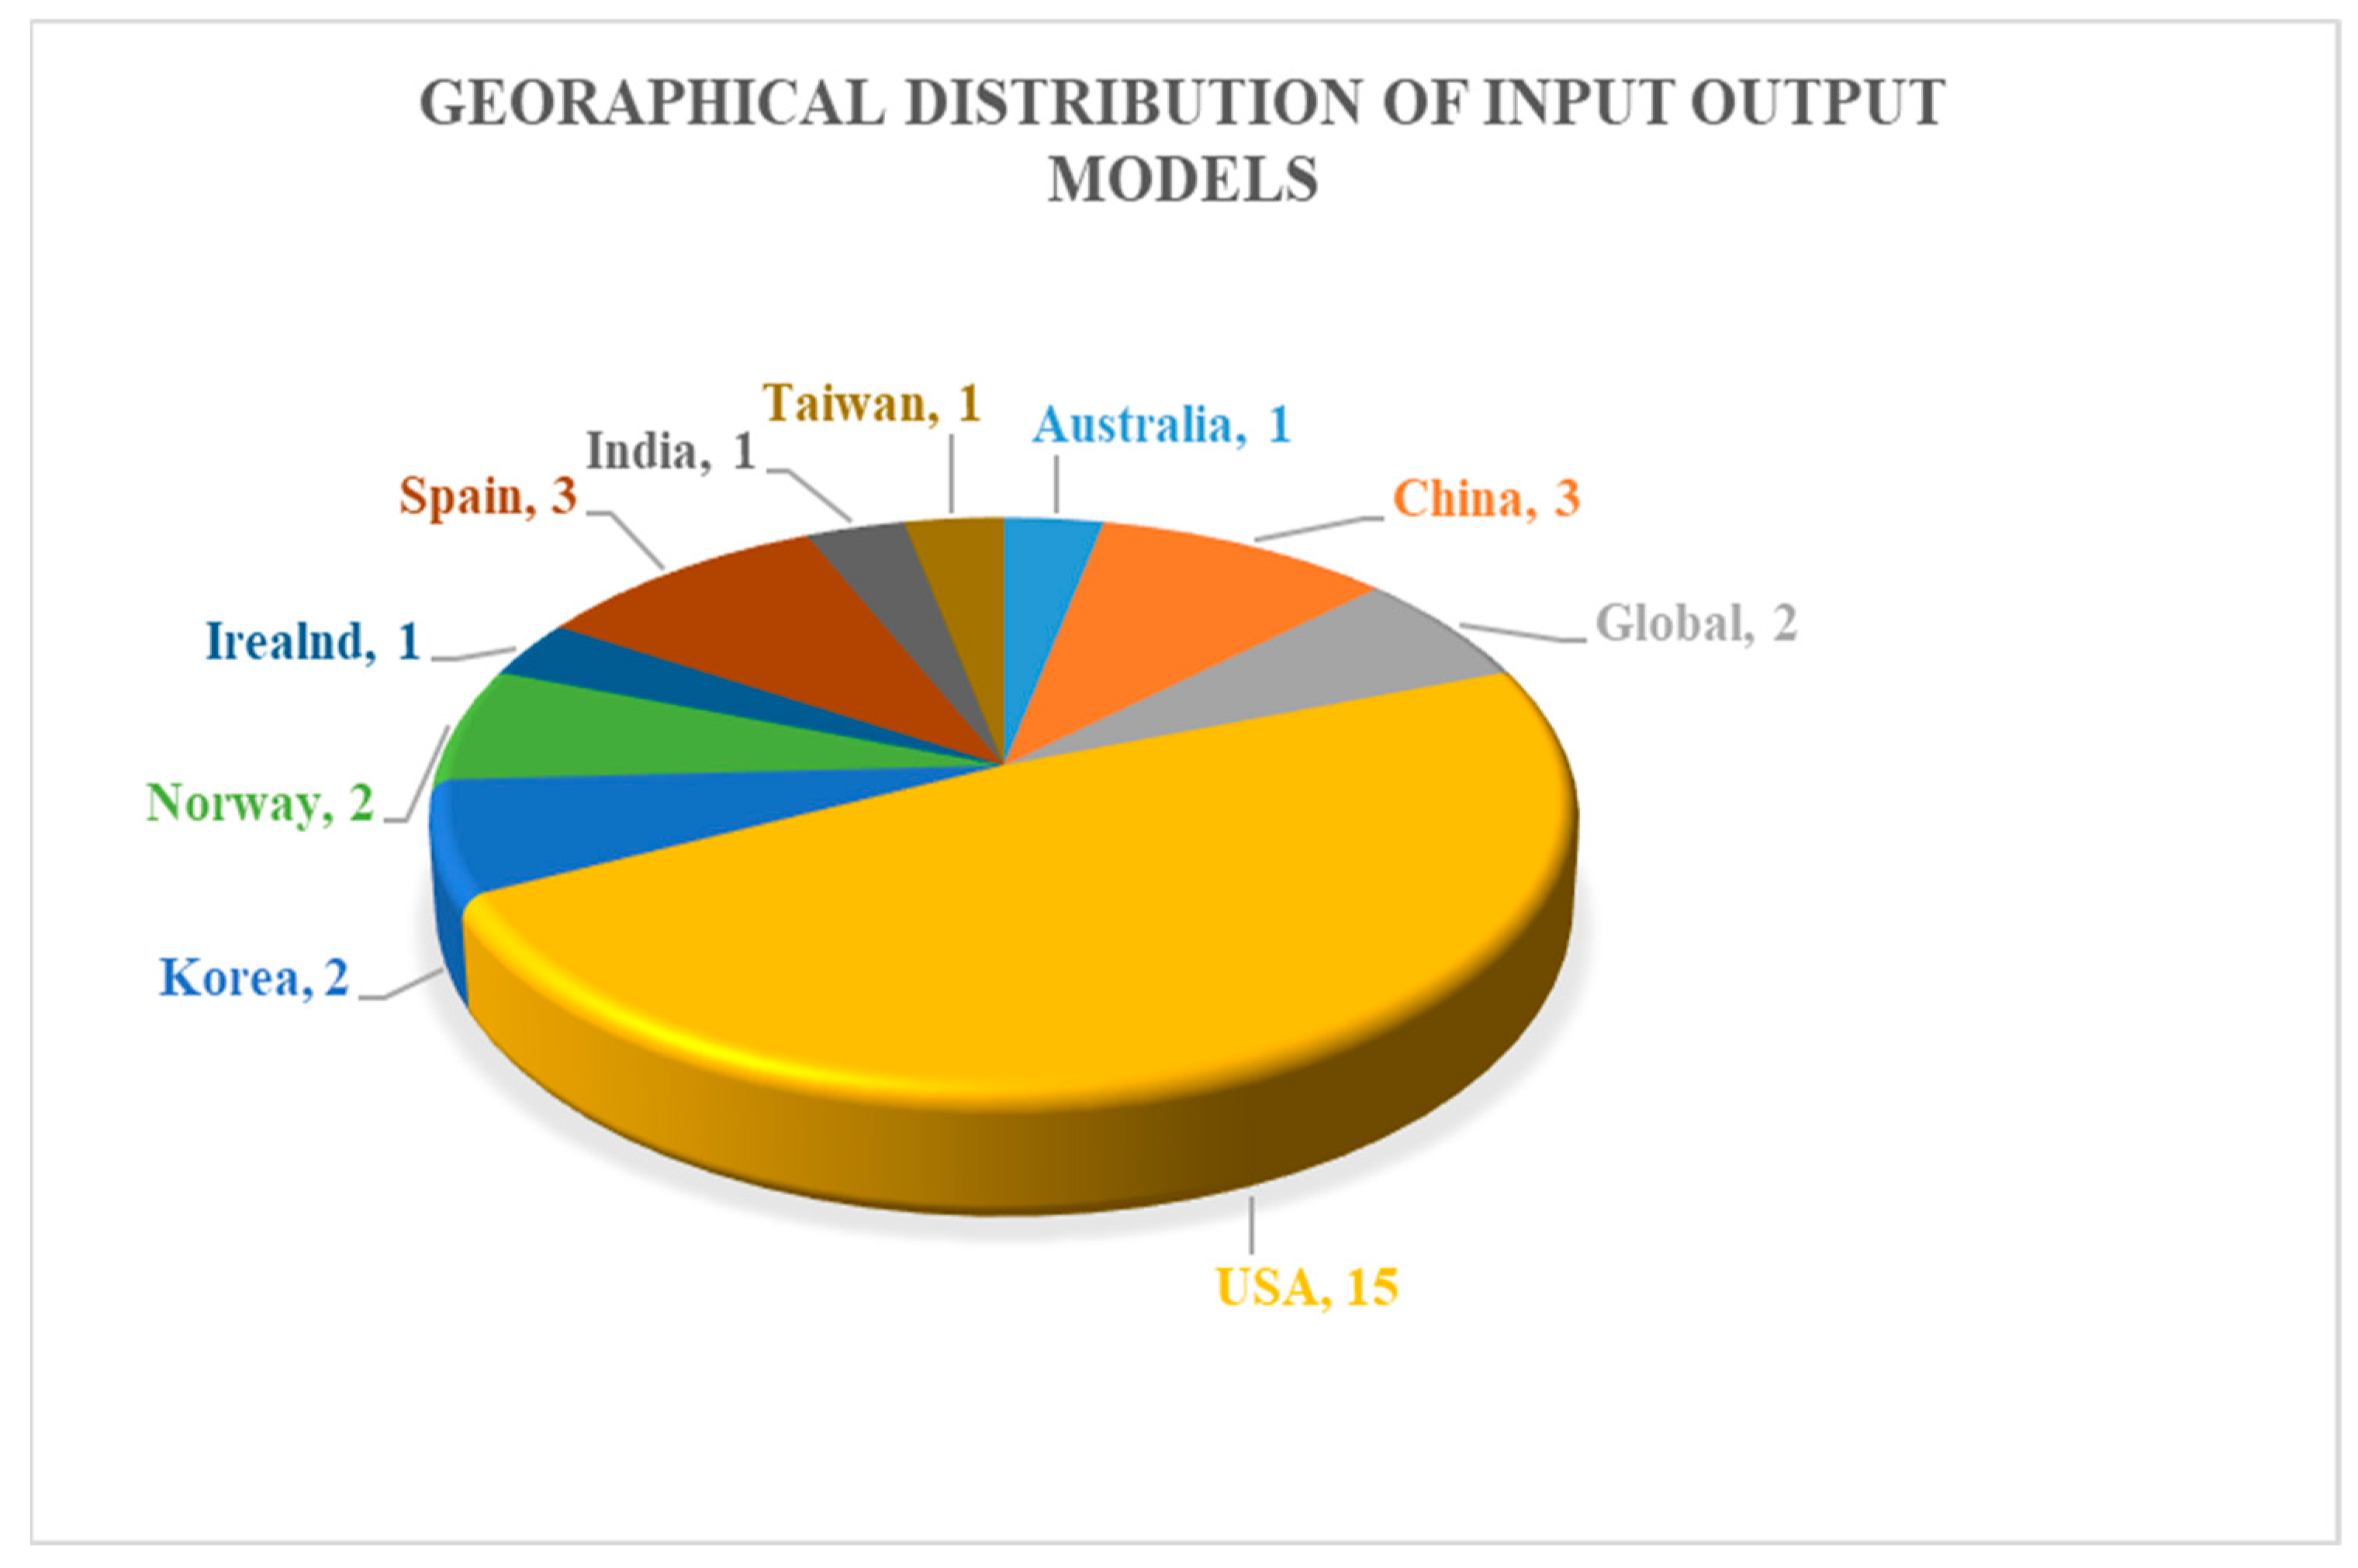
3.6. Analyses of the Literature

The summary of the literature survey on the application of input–output and CGE models in fisheries is shown in Figure 2, which illustrates the breakdown of the studies in each method in each of the three predefined categories. For the IO method, 71% of the studies are in the socio-economic category, 19% are in ecological category, and 10% are in the environmental category. For the CGE method, 57% of the studies are in the socio-economic category, 19% are in the ecological category, and 24% in the environmental category. Thus, the socio-economic area continues to be one of the most common domains of applications, as shown in Figure 2, which is due to the wide acceptability and practicality of these methods and their ability to capture the inter- and intra-region economic linkages and assess the effects of socio-economic indexes within a region. These models are also able to be successfully combined with ecosystem modelling to assess the effect of ecological and biological changes in the fisheries and how they impact the wider economy. Furthermore, the surge in the number of studies using these models to assess the impact of environmental factors, such as climate change, on the fisheries and the wider economy has become one of the major applications in the recent years, which shows the ability of these models to handle a range of complex relationships. Furthermore, dynamic CGE has found its way in the literature and is being applied in a number of studies, particularly in assessing the impact of range of environmental issues, such as the impact of climate change, by helping policy-makers focus on the cost of specific environmental policy measure.
Figure 3 and Figure 4 show the number of studies and geographical spread of the studies. Single-region models are more prevalent, and both IO and CGE methods have been used more frequently in the U.S.A. compared with other regions.
Figure 5 shows the number of the studies by year using input–output and CGE models, both models have been applied increasingly since the year 2000, and since 2010, their application increased significantly, with IO models being applied more in the literature. Figure 6 and Figure 7 show the distribution of articles by journal.

4. Conclusions

This survey of the literature reviews the current state of the art of the applications of IO and CGE methods in the fishery sector in the peer-reviewed studies published during the period from 2000 to 2020. This paper identifies three main application categories for each method, including socio-economic, environmental, and ecological categories, and reports on the indicators and types of models that have been used. The following conclusions can be drawn from this study:
First, the demand driven input–output models continue to be a popular choice amongst modellers, with socio-economic applications being the most addressed topic. CGE models are also growing in application, and the socio-economic category is the focus of the studies. Additionally, in comparison with IO models, CGE models are applied more in the environmental category.
CGE models are particularly important and useful in modelling macro-economic impacts and sectoral interactions. It could be noted from this review that IO models are mostly used for micro-economic analysis, whereas CGE models are particularly used in macro-economic analysis, providing an aggregated representation of the economy. For example, CGE are used to assess the impact of range of environmental issues, such as the impact of climate change, by helping policy-makers focus on the cost of specific environmental policy measure. Furthermore, in contrast to IO models, in which only the demand side is considered with no capacity constraints, the CGE models enable the modeler to take into account the price movements by incorporating the supply side of the economy.
Second, the application area of the models is mostly single country (region), particularly in the U.S.A. compared with other regions. Third, the study draws attention to the limitations of each model and the suitable context for each model. For example, the data availability and construction of the data tables is identified as one of the constraints in modelling, with reliable data collection a key factor in successful implementation of the models. Furthermore, the model choice depends mostly on the information needed by the policy-makers. Single-period static models are suitable if policy-makers in the fishery sector seek to understand the impacts of management actions on a specified region. On the other hand, econometrics-integrated IO and dynamic CGE may be more appropriate where a multi-period impact analysis or analysis on the uncertainties within the system is to be addressed.
This study aims to reveal current application areas of input–output and computable general equilibrium methods in fisheries, elaborate their strengths and weaknesses, and show applications for policy-making. The analysis shows that while input–output models continue to be applied in the fishery sector as the most common method in the period considered in this study, the CGE models are also becoming a popular method for the assessment of the economy-wide impact of fisheries in recent years. The growth in prevalence of CGE models could be due to the fact that they enable the analyst to identify general equilibrium effects of changes in exogenous conditions that may not have been initially obvious, i.e., the enhanced emphasis on institutions and a broader set of interactions and the incorporation of nonlinearities and substitution possibilities in response to market signals. Therefore, the increased application of variants of CGE in the fishery management literature is anticipated, given the increased complexity of the fisheries and associated management policy measures.

Funding

This research has received funding from the European Union’s Horizon 2020 research and innovation program under Grant Agreement No. 773713 (PANDORA).

Institutional Review Board Statement

Not applicable.

Informed Consent Statement

Not applicable.

Data Availability Statement

Not applicable.

Acknowledgments

The EU provided funding for this research through project “Paradigm for Novel Dynamic Oceanic Resource Assessments” (Horizon 2020 research and innovation programme under the grant agreement No. 773713).

Conflicts of Interest

The authors declare no conflict of interest.

References

  1. Bhat, M.G.; Bhatta, R. Regional economic impacts of limited entry fishery management: An application of dynamic input-output model. Environ. Dev. Econ. 2006, 11, 709–728. [Google Scholar] [CrossRef]
  2. Arthur, A. Small-scale fisheries management and the problem of open access. Mar. Policy 2020, 115, 103867. [Google Scholar] [CrossRef]
  3. Lodge, M.W.; Anderson, D.; Lobach, T.; Munro, G.; Sainsbury, K.; Willock, A. Recommended Best Practices for Regional Fisheries Management Organizations: Report of an Independent Panel to Develop a Model for Improved Governance by Regional Fisheries Management Organizations; The Royal Institute of International Affairs: London, UK, 2007. [Google Scholar]
  4. Fuller, K.; Kling, D.; Kroetz, K.; Ross, N.; Sanchirico, J.N. Economics and ecology of open-access fisheries. In Encyclopedia of Energy, Natural Resource, and Environmental Economics; Elsevier: Amsterdam, The Netherlands, 2013; pp. 39–49. [Google Scholar]
  5. Forse, A.; Drakeford, B.; Failler, P.; Potts, J.; Akbari, N. Beyond Brexit—Is the UK’s Fixed Quota Allocation (FQA) system in need of a fix? Mar. Policy 2021, 129, 104563. [Google Scholar] [CrossRef]
  6. Akbari, N.; Bjørndal, T.; Failler, P.; Forse, A.; Taylor, M.H.; Drakeford, B. A Multi-Criteria Framework for the Sustainable Management of Fisheries: A Case Study of UK’s North Sea Scottish Fisheries. Environ. Manag. 2022, 70, 79–96. [Google Scholar] [CrossRef]
  7. Seung, C.; Waters, E.C. A Review of Regional Economic Models for Fisheries Management in the U.S. Mar. Resour. Econ. 2006, 21, 101–124. [Google Scholar] [CrossRef]
  8. Waddington, H.; White, H.; Snilsstveit, B.; Hambrados, J.G. How to do a good systematic review of effects in international development: A tool kit. J. Dev. Eff. 2012, 4, 359–387. [Google Scholar] [CrossRef] [Green Version]
  9. Seung, C.K.; Kim, D.H.; Yi, J.H.; Song, S.H. Accounting for price responses in economic evaluation of climate impacts for a fishery. Ecol. Econ. 2021, 181, 106913. [Google Scholar] [CrossRef]
  10. Leontief, W. Quantitative Input-Output relations in the economic system of the United States. Rev. Econ. Stat. 1936, 18, 105–125. [Google Scholar] [CrossRef] [Green Version]
  11. Leontief, W.; Strout, A. Multiregional input-output analysis. In Structural Interdependence and Economic Development; MacMillan: New York, NY, USA, 1963. [Google Scholar]
  12. Rose, A. Input-output economics and computable general equilibrium models. Struct. Chang. Econ. Dyn. 1995, 6, 295–304. [Google Scholar] [CrossRef]
  13. Miernyck, W. Elements of Input-Output Economics; Random House: New York, NY, USA, 1965. [Google Scholar]
  14. Pullen, M.; Proops, J. The North Staffordshire regional economy: And input-output assessment. Reg. Stud. 1983, 17, 191–200. [Google Scholar] [CrossRef]
  15. Stone, J. The social account for a consumer point of view. Rev. Income Wealth 1966, 12, 1–33. [Google Scholar] [CrossRef]
  16. Dixon, P.; Rimmer, M.T. Johansen’s legacy to CGE modelling: Originator and guiding light for 50 years. J. Policy Model. 2016, 38, 421–435. [Google Scholar] [CrossRef]
  17. Harris, R.I. Technological change and regional development in the UK: Evidence from the SPRU databse and innovations. Reg. Stud. 1988, 22, 361–374. [Google Scholar] [CrossRef]
  18. Seetram, N.; Bhat, M.; Pierce, B.; Cavasos, K.; Die, D. Reconciling economic impacts and stakeholder perception: A management challenge in Florida Gulf Cost fisheries. Mar. Policy 2019, 108, 103628. [Google Scholar] [CrossRef]
  19. Sharma, K.R.; Leung, P.S. Economic impacts of catch reallocation from the commercial fishery to the recreational fishery in Hawaii. N. Am. J. Fish. Manag. 2001, 21, 125–134. [Google Scholar] [CrossRef]
  20. Leung, P.; Pooley, S. Regional economic impacts of reduction in fisheries production: A supply-driven approach. Mar. Resour. Econ. 2001, 16, 251–262. [Google Scholar] [CrossRef]
  21. Loomis, J. Use of survey data to estimate economic value and regional economic effects of fishery improvements. N. Am. J. Fish. Manag. 2006, 16, 251–262. [Google Scholar] [CrossRef]
  22. Grealis, E.; Hynes, S.; O’Donoghue, C. The economic impact of aquaculture expansion: An input-output approach. Mar. Policy 2017, 81, 29–36. [Google Scholar] [CrossRef]
  23. Garzagil, M.D.; Regueiro, J.S.; Lafuene, M.V. Using input-output methods to assess the effects of fishing and aquaculture on a regional economy: The case of Galicia, Spain. Mar. Policy 2017, 85, 48–53. [Google Scholar] [CrossRef]
  24. Leonard, J.; Steiner, E. Initial economic impacts of the U.S. pacific coast groundfish fishery individual fishing quota program. N. Am. J. Fish. Manag. 2017, 37, 862–881. [Google Scholar] [CrossRef]
  25. Santiago, J.L.; Suris-Regueiro, J.C. An applied method for assessing socioeconomic impacts of European fisheries quota-based management. Fish. Res. 2018, 206, 150–162. [Google Scholar] [CrossRef]
  26. Camara, J.A.; Santero-Sanchez, R. Economic, social and environmental impact of a sustainbale fisheries model in Spain. Sustainability 2019, 11, 6311. [Google Scholar] [CrossRef] [Green Version]
  27. Dyck, A.J.; Sumaila, U.R. Economic impact of ocean fish populations in the global fisheries. J. Bioeconomic 2017, 12, 227–243. [Google Scholar] [CrossRef]
  28. McKean, J.R.; Johnson, D.M.; Taylor, R.G. Regional economic impacts of the Snake River Steelhead and Salmon recovery. Soc. Nat. Resour. Int. J. 2011, 24, 569–583. [Google Scholar] [CrossRef]
  29. Lee, M.K.; Yoo, S.H. The role of the capture fisheries and aquaculture sectors in the Korean national economy: An input-output analysis. Mar. Policy 2014, 44, 448–456. [Google Scholar] [CrossRef]
  30. Cheng, B.; Qin, G.; Wang, Y. Analysis on industrial linkages and driving effects of Chinese fishery industry based on input-output model. J. Coast. Res. 2019, 98, 363–366. [Google Scholar]
  31. Qin, G.; Zhang, S.; Liu, X.; Cheng, B. Analysis on factors drivinf growth in Chaina’s fishery industry based on a noncompetitive input-output model. J. Coast. Res. 2019, 98, 367–370. [Google Scholar] [CrossRef]
  32. Johansen, U.; Berg, H.; Vik, L.H. The Norwegian seafood industry—Importance for the national economy. Mar. Policy 2019, 110, 103561. [Google Scholar] [CrossRef]
  33. Patrick, W.S.; Benaka, L.R. Estimating the economic impacts of bycatch in U.S. commercial fisheries. Mar. Policy 2013, 38, 470–475. [Google Scholar] [CrossRef]
  34. Chen, T.P.; Chang, T.C.; Chiau, W.Y.; Shih, Y.C. Social economic assessment of coastal area industrial development: An application of input-output model to oyster farming in Taiwan. Ocean Coast. Manag. 2013, 73, 153–159. [Google Scholar] [CrossRef]
  35. West, C.D.; Hobbs, E.; Croft, S.A.; Green, J.M.; Schmidt, S.Y.; Wood, R. Improving consumption based accounting for global capture fisheries. J. Clean. Prod. 2019, 212, 1396–1408. [Google Scholar] [CrossRef]
  36. Kim, D.H.; Seung, C.; Seo, Y. Multi-regional economic impacts of recreational fisheries: Analysis of small sea ranch in Gyeong-Nam province, Korea. Mar. Policy 2017, 84, 90–98. [Google Scholar] [CrossRef]
  37. Poudel, J.M.; Henderson, J.E.; Munn, I.A. An input-output analysis of recreational fishing expenditures (2006 & 2011) across the southern United States. Int. J. Environ. Stud. 2017, 75, 650–672. [Google Scholar]
  38. Rollins, E.; Lovell, S. Charter fishing in Hawaii: A multi region analysis of the economic linkages and contributions within and outside Hawaii. Mar. Policy 2019, 100, 277–287. [Google Scholar] [CrossRef]
  39. Fernandez-Macho, J.C.; Gallasteguia, P.; Gonzaleza, M. Economic impacts of TAC regulation: A supply-driven SAM approach. Fish. Res. 2008, 90, 225–234. [Google Scholar] [CrossRef]
  40. Waters, E.C.; Seung, C.K.; Hartley, M.L.; Dalton, M.G. Measuring the multiregional economic contribution of an Alaska fishing fleet with linkages to international markets. Mar. Policy 2014, 50, 238–248. [Google Scholar] [CrossRef]
  41. Seung, C.; Lew, D.K. A multiregional approach for estimating the economic impact of harvest restrictions on saltwater sport fishing. N. Am. J. Fish. Manag. 2017, 37, 1112–1129. [Google Scholar] [CrossRef]
  42. Hoagland, P.; Jin, D.; Dalton, T.M. Linking economic and ecological models for a marine ecosystems. Ecol. Econ. 2003, 46, 367–385. [Google Scholar]
  43. Steinback, S.R.; Allen, R.B.; Thunber, E. The benefits of rationalization: The case of the American lobster fishery. Mar. Resour. Econ. 2008, 23, 37–63. [Google Scholar] [CrossRef]
  44. Kaplan, C.; Leonard, J. From Krill to convenience stores: Forecasting the economic and ecological effects of fisheries management on the US West Coast. Mar. Policy 2012, 36, 947–954. [Google Scholar] [CrossRef]
  45. Wang, Y.; Hu, J.; Pan, H.; Li, S.; Failler, P. An integrated model for marine fishery management in the Pearl River Estuary: Linking socio- economic systems and ecosystems. Mar. Policy 2016, 64, 135–147. [Google Scholar] [CrossRef] [Green Version]
  46. Fay, G.; DePiper, G.; Steinback, S.; Gamble, R.J.; Link, J.S. Economic and ecosystem effects of fishing on the northeast US shelf. Front. Mar. Sci. 2019, 6, 133. [Google Scholar] [CrossRef]
  47. Halpern, B.S.; Walbridge, S.; Selkoe, K.A.; Kappel, C.V.; Micheli, F.; d’Agrosa, C.; Bruno, J.F.; Casey, K.S.; Ebert, C.; Fox, H.E.; et al. A global map of human impact on marine ecosystems. Science 2008, 319, 948–952. [Google Scholar] [CrossRef] [Green Version]
  48. Eide, A.; Heen, K. Economic impacts of global warming: A study of the fishing industry in North Norway. Fish. Res. 2002, 56, 261–274. [Google Scholar] [CrossRef] [Green Version]
  49. Lopez, A.N.; Plaganyi, E.; Skewes, T.; Poloczanska, E.; Dennis, D.; Gibbs, M.; Bayliss, P. Linking physiological, population and socio-economic assessments of climate-change impacts on fisheries. Fish. Res. 2013, 148, 18–26. [Google Scholar] [CrossRef]
  50. Hodgson, E.E.; Kaplan, I.C.; Marshal, K.N.; Leonard, J.; Essington, T.E.; Busch, D.S.; Fulton, E.A.; Harvey, C.J.; Hermann, A.J.; McElhany, P. Consequences of spatially variable ocean acidification in the California current. Ecol. Model. 2018, 383, 106–117. [Google Scholar] [CrossRef]
  51. Scrieciu, S. The inherent dangers of using computable general equilibrium models as a single integrated modelling framework for sustainability impact assessment. A critical note on Bohringer and Loschel (2006). Ecol. Econ. 2007, 60, 678–684. [Google Scholar] [CrossRef]
  52. Holmoy, E. The development and use of CGE models in Norway. J. Policy Model. 2016, 38, 448–474. [Google Scholar] [CrossRef]
  53. Failler, P.; Pan, H.; Thorpe, A.; Tokrisna, R. On macro economic impact of fishing effort regulation: Measuring bottom-up fish harvesters’ economy-wide contribution. Nat. Resour. 2014, 5, 269–281. [Google Scholar]
  54. Arrow, J.; Debreu, G. Existence of equilibrium for a competitive economy. Econometrica 1954, 22, 265–290. [Google Scholar] [CrossRef]
  55. Johansen, L. A Multi-Sectoral Study of Economic Growth; North-Holland: Amsterdam, The Netherlands, 1960. [Google Scholar]
  56. Scarf, H. The Computation of Economic Equilibria; Yale University Press: New Haven, CT, USA, 1973. [Google Scholar]
  57. Shoven, J.B.; Whalley, J. Applied general equilibrium models of taxation and international trade: Introduction and survey. J. Econ. Lit. 1984, 52, 1007–1051. [Google Scholar]
  58. Shoven, J.B.; Whalley, J. Applying General Equilibrium; Cambridge University Press: Cambridge, UK, 1992. [Google Scholar]
  59. Allan, G.; Hanley, N.; McGregor, P.; Swales, K.; Turner, K. The impact of increased efficiency in the industrial use of energy: A computable general equilibrium analysis for the United Kingdom. Energy Econ. 2007, 29, 779–798. [Google Scholar] [CrossRef]
  60. Bardazzi, E.; Bosello, F. Critical reflections on Water-Energy-Food Nexus in Computable General Equilibrium models: A systematic literature review. Environ. Model. Softw. 2021, 145, 105201. [Google Scholar] [CrossRef]
  61. Bergman, L. CGE modeling of environmental policy and resource management. In Handbook of Environmental Economics; North-Holland: Amsterdam, The Netherlands, 2005. [Google Scholar]
  62. Seung, C.K.; Kraybill, D. The effects of infrastructure investment: A two-sector dynamic computable general equilibrium analysis for Ohio. Int. Reg. Sci. Rev. 2001, 24, 261–281. [Google Scholar] [CrossRef]
  63. Seung, C.; Waters, E.C. Evaluating supply-side and demand-side shocks for fisheries: A computable general equilibrium (CGE) model for Alaska. Econ. Syst. Res. 2010, 22, 87–109. [Google Scholar] [CrossRef]
  64. Seung, C.; Lew, D. Accounting for variation in exogenous shoicj in economic impact modeling. Ann. Reg. Sci. 2013, 51, 711–730. [Google Scholar] [CrossRef]
  65. Kobayashi, S.; Saito, K.; Tanji, H.; Huang, W.; Tada, M. Economic structure of Cambodia and strategies for pro-poor growth: Results from a computable general equilibrium analysis. Stud. Reg. Sci. 2008, 38, 137–154. [Google Scholar] [CrossRef] [Green Version]
  66. Gronau, S.; Winter, E.; Grote, U. Aquaculture fish resources and rural livelihoods: A village CGE analysis from Namibia’s Zambezi Region. Environ. Dev. Sustain. 2020, 22, 615–642. [Google Scholar] [CrossRef]
  67. Da-Rocha, J.M.; Prellezo, R.; Sempere, J.; Antelo, L.T. A dynamic equilibrium model for the economic assessment of the fishert stock-rebuilding policies. Mar. Policy 2017, 81, 185–195. [Google Scholar] [CrossRef] [Green Version]
  68. Pan, H.; Zhao, J.; Failler, P.; Wang, Y. Sustainable Fishery Policy for Thailand Gulf: A General Equilibrium Analysis. J. Coast. Res. 2019, 94, 955–961. [Google Scholar] [CrossRef]
  69. Carvalho, N.; Rege, S.; Fortuna, M.; Isidro, E.; Jones, G.E. Estimating the impacts of eliminating fisheries subsidies on the small island economy of the Azores. Ecol. Econ. 2011, 10, 1822–1830. [Google Scholar] [CrossRef] [Green Version]
  70. Colla-De-Robertis, E.; Da-Rocha, J.M.; Garcia-Cutrin, J.; Gutierrez, M.J.; Prellezo, R. A Bayesian estimation of the economic effect of the Common Fishery Policy on the Galician fleet: A dynamic stochastic general equilibrium approach. Ocean Coast. Manag. 2019, 167, 137–144. [Google Scholar] [CrossRef] [Green Version]
  71. Eichner, T.; Pethig, R. Harvesting in an integrated general equilibrium model. Environ. Resour. Econ. 2007, 37, 233–252. [Google Scholar] [CrossRef] [Green Version]
  72. Pethig, R.; Eichner, T. Pricing the ecosystem and taxing ecosystem services: A general equilibrium approach. J. Econ. Theory 2009, 144, 1589–1616. [Google Scholar]
  73. Finnoff, D.; Tschirhart, J. Linking dynamic economic and ecological general equilibrium models. Resour. Energy Econ. 2008, 30, 91–114. [Google Scholar] [CrossRef]
  74. Tschirhart, J. A new adaptive system approach to predator-prey modeling. Ecol. Model. 2004, 176, 255–276. [Google Scholar] [CrossRef]
  75. Jin, D.; Hoagland, P.; Dalton, T.M.; Thunberg, E.M. Development of an integrated economic and ecological framework for ecosystem-based fisheries management in New England. Prog. Oceanogr. 2012, 102, 93–101. [Google Scholar] [CrossRef] [Green Version]
  76. Wang, Y.; Hu, J.; Pan, H.; Failler, P. Ecosystem-based fisheries management in the pearl River Delta: Applying a computable general equilibrium model. Mar. Policy 2020, 112, 103784. [Google Scholar] [CrossRef]
  77. Nong, D. Potential economic impacts of global wild catch fishery decline in Southeast Asia and South America. Econ. Anal. Policy 2019, 62, 213–226. [Google Scholar] [CrossRef]
  78. Seung, C.K.; Ianelli, J.N. Regional economic impacts of climate change: A computable general equilibrium analysis for an Alaska fishery. Nat. Resour. Model. 2016, 29, 289–333. [Google Scholar] [CrossRef]
  79. Seung, C.K.; Ianelli, J.N. Evaluating alternative policies for managing an Alaska Pollock fishery with climate change. Ocean Coast. Manag. 2019, 178, 104837. [Google Scholar] [CrossRef]
  80. Das, I.; Lauria, V.; Kay, S.; Cazcarro, I.; Arto, I.; Fernandes, J.A.; Hazra, S. Effects of climate change and management policies on marine fisheries productivity in the north-east coast of India. Sci. Total Environ. 2020, 724, 138082. [Google Scholar] [CrossRef] [PubMed]
  81. Seung, C.; Dalton, M.G.; Punt, A.E.; Poljak, D.; Foy, R. Economic impacts of changes in an Alaska crab fishery from ocean acidification. Clim. Chang. Econ. 2015, 6, 1550017. [Google Scholar] [CrossRef] [Green Version]
  82. Dellink, R.; Lanzi, E.; Chateau, J. The sectoral and regional economic consequences of climate chane to 2060. Environ. Resour. Econ. 2017, 72, 309–363. [Google Scholar] [CrossRef]
  83. Rey, S. Integrated Regional Econometric +input-output modeling: Issues and opportunities. Pap. Reg. Sci. 2000, 79, 271–292. [Google Scholar] [CrossRef]
  84. Soderbaum, P. Ecological Economics: A Political Economy Approach to Environment and Development; Earthscan Publications: London, UK, 2000. [Google Scholar]
  85. DeCanio, S.J. Economic Models of Climate Change: A Critique; Palgrave Macmillan: London, UK, 2003. [Google Scholar]
Figure 1. Literature search procedure.
Sustainability 15 06089 g001
Figure 2. Percentage of studies applying IO and CGE in different categories.
Sustainability 15 06089 g002
Figure 3. Geographical distribution of studies using CGE model.
Sustainability 15 06089 g003
Figure 4. Geographical distribution of studies using IO models.
Sustainability 15 06089 g004
Figure 5. Number of published studies using IO and CGE models (2000–2020).
Sustainability 15 06089 g005
Figure 6. Article distribution by journal (IO method).
Sustainability 15 06089 g006
Figure 7. Article distribution by journal (CGE method).
Sustainability 15 06089 g007
Table 1. Search strings for literature review.
Search Strings
“Input output (IO) model ∗ fisheries”; “Input output (IO) model ∗ fisheries management”; “Input output (IO) model ∗ fisheries ∗ regional economy”
“Computable General Equilibrium (CGE) ∗ Fisheries”; “Computable General Equilibrium (CGE) ∗ Fisheries ∗ management”; “Computable General Equilibrium (CGE) ∗ Fisheries ∗ regional economy”; “economic modelling ∗ fisheries”
Disclaimer/Publisher’s Note: The statements, opinions and data contained in all publications are solely those of the individual author(s) and contributor(s) and not of MDPI and/or the editor(s). MDPI and/or the editor(s) disclaim responsibility for any injury to people or property resulting from any ideas, methods, instructions or products referred to in the content.

