Article

Optimization-Driven Machine Learning Approach for the Prediction of Hydrochar Properties from Municipal Solid Waste

by
Parthasarathy Velusamy
1,†,
Jagadeesan Srinivasan
2,
Nithyaselvakumari Subramanian
3,
Rakesh Kumar Mahendran
4,
Muhammad Qaiser Saleem
5,
Maqbool Ahmad
6,†,
Muhammad Shafiq
7,* and
Jin-Ghoo Choi
7,*
1
Department of Computer Science and Engineering, Karpagam Academy of Higher Education, Coimbatore 641021, India
2
School of Information Technology and Engineering, Vellore Institute of Technology, Vellore 632014, India
3
Department of Biomedical Engineering, Saveetha School of Engineering, Chennai 602105, India
4
Department of Computer Science and Engineering, School of Computing, Rajalakshmi Engineering College, Chennai 602105, India
5
College of Computer Science and Information Technology, Al Baha University, Al Baha 1988, Saudi Arabia
6
School of Digital Convergence Business, University of Central Punjab, Rawalpindi 46000, Pakistan
7
Department of Information and Communication Engineering, Yeungnam University, Gyeongsan 38541, Republic of Korea
*
Authors to whom correspondence should be addressed.
These authors contributed equally to this work.
Sustainability 2023, 15(7), 6088; https://doi.org/10.3390/su15076088
Submission received: 22 October 2022 / Revised: 15 February 2023 / Accepted: 16 February 2023 / Published: 31 March 2023

Abstract

:
Municipal solid waste (MSW) management is an essential element of present-day society. The proper storage and disposal of solid waste is critical to public health, safety, and environmental performance. The direct recovery of MSW into useful energy is a critical task. In addition, the demand for conventional power supplies is high. As a strategy to solve these two problems, the technology to directly convert municipal solid waste into conventional energy to replace fossil fuels has been obtained. The hydrothermal carbonization (HTC) process is a thermochemical conversion process that utilizes heat to convert wet biomass feedstocks into hydrochar. Hydrochar with premium gasoline properties is used for fuel combustion for strength. The properties of fuel hydrochar, including C char (carbon content), HHV (higher heating value), and yield, are mainly based on the properties of the MSW. This study aimed to predict the properties of fuel hydrochar using a machine learning (ML) model. We employed an ensemble support vector machine (E-SVM) as the classifier, which was combined with the slime mode algorithm (SMA) for optimization and developed based on 281 data points. The model was primarily trained and tested on a fusion of three datasets: sewage sludge, leftovers, and cow dung. The proposed ESVM_SMA model achieved an excellent overall performance with an average R2 of 0.94 and RMSE of 2.62.

1. Introduction

Humans create waste, and the way these pollutants are handled, cared for, processed, and disposed of can cause health and environmental concerns. Challenges and barriers to managing municipal solid waste (MSW) are critical in urban environments, especially those in rapidly urbanizing developing countries. This has been recognized by many government agencies; however, the overpopulation is beyond the ability of most community officials to provide even the most basic services. Generally, one-third to two-thirds of solid waste is left untreated. As a result, uncollected waste (often combined with manure) is inadvertently dumped in roads and ditches. This leads to spills, the spread of insect and rodent vectors, and the spread of infection. Additionally, captured waste is often sent to unmanaged landfills or is incinerated, polluting water and air sources. Some municipal wastes, such as catering and household leftovers and municipal sewage sludge, also contain a high moisture content, leading to increased pollution [1].
MSW is a diverse and complex energy source. Globally, with the tightening of disposal policies, the proportion of municipal waste is increasing, especially in the context of a circular economy [2]. However, MSW in developing countries still faces five common problems. These are: (1) inadequate access to services, (2) difficulties in operating services, (3) limited utilization of recycling activities, (4) poor management of non-industrial hazardous materials, and (5) an inadequate disposal of landfills. In addition to these problems, our traditional energy supply is also decreasing. This is coupled with higher rates of consumption than production, increasing the demand for non-traditional energy sources [3]. Solar, wind, geothermal, hydroelectric, and biomass are all examples of renewable resources that can be used to replace fossil fuels. Biomass, especially from the wood industry and farmland and horticulture waste or residues, is inexpensive. It is also the most convenient to use. These biomasses can be recovered and pressed into uniform shapes and sizes for easy storage, distribution, and use [4,5]. A biomass formed from MSW, such as food residues, animal manure, and sludge, is a promising but difficult resource to manage due to its high organic matter content and natural capacity for liquid retention [6,7]. In addition, large amounts of organic wastes with a high water content are considered carriers of toxic metals, microorganisms, antibiotics, micropollutants, and carbon dioxide, posing a threat to the environment [8,9,10].
The concept of recycling waste, especially high-moisture waste, has attracted extensive attention in recent decades due to its benefits for a circular economy, resource recovery, and environmental protection [11]. We can address the above challenges using MSW as a suitable alternative to fossil fuels such as combustion [12] or gasification [13]. In addition, technologies to recover energy and resources from wet waste offer a way to minimize environmental degradation, minimize fossil fuel consumption, and minimize the accumulation of high-moisture waste. To produce valuable products from household waste, a hydrothermal carbonization (HTC) process may be used. HTC wastewater treatment of sludge can help minimize environmental volumes and convert sludge into valuable commodities [14]. HTC is a unique activity in which wet livestock is converted into a marketable product at temperatures of approximately 350 degrees Celsius, using minimal energy input. Aromatization, hydrolysis, dehydration, recondensation, and transient reactions are a few of the many events that occur during HTC. The degree of transformation is determined by the temperature and incubation period as well as various process-related parameters and the livestock morphology [15]. HTC is gaining popularity as a long-term thermochemical process for converting wet biomass to hydrochar (HC), which is a solid, swamp-like substance.
For HTC to be a profitable product, we need to test its quality and usable ingredients in waste. Producing hydrochar of the proper grade is a time-consuming and expensive process that requires multiple iterations in pilot runs to create an effective working environment with different types of waste. The standard trial strategy is an error-prone, one-factor-at-a-time (OFAT) optimization method. The implementation of several experimental tests that accompany hydrochar characterization is also labor-intensive [16]. Therefore, developing a computational model that can predict HC characteristics and optimize the desired properties in an appropriate experimental setting is very useful to cheaply and efficiently augment or accelerate research. Therefore, we developed an ML model for predicting HC attributes. To produce reliable results, our model is optimized using ESVM and Bionic SMA. Bionic computing is a branch of computer science that uses biological models to solve problems. SMA is a population-based biomimetic technology based on the vibrational patterns of the natural slime molds that we used in our research. SMA has a unique computational formula that simulates the feedback mechanism of favorable and unfavorable propagating waves of slime molds. In addition, the effects of animal quality and HTC-related parameters on the HC traits were examined. In addition, an algorithm was developed to predict HC performance using ML techniques. It is efficiently linked through the SMA algorithm to improve the performance of fuel properties (FP) and the carbon capture and storage stability (CCS) according to different uses.
Several scholars have described distinct ML algorithms to determine HC characteristics from high-moisture MSW. Classification and optimization are two common phrases in all these approaches. For example, recent ML solutions in waste treatment and other environmental issues, such as soil solubility and chemical-mixture toxicity prediction, forecasting the generation of MSW, and the prediction of PM2.5 atmospheric concentrations, have received much attention. Additionally, Li et al. examined the impact of feedstock qualities and processing parameters on HTC outputs, and Ro et al. and others implemented models [17,18,19,20]. However, the classification performance was low. In [21], to enhance the precision of the methods mentioned above, Jie Li et al. developed a predictive model that yielded the HHV and C_char of HC all at once with a high accuracy, using the multi-task learning of a random forest (RF) and data from HC of food scraps, sludge, and manure. Furthermore, for the hyperparameter tuning of an RF, ten-cross validation was utilized to obtain an optimal model with a strong predictive capacity. Although the model had a high degree of precision, it still needed to forecast other valuable data about the HC. In [22], Ma. J et al. built an alternative model with an improved prediction accuracy. The features of an HC made from sawdust (SD) and sewage sludge (SS) co-HTC and their gasification performance in a CO2 atmosphere were systematically investigated. In their experiment, the co-HTC of SD and SS was demonstrated to be an effective primary treatment of gasification toward water and gas generation of outstanding quality [23]. Ismail et al. designed an ANN–Kriging architecture for prognosticating the recovery of inorganic phosphorus and carbon from HTC [24]. Experiments with poultry litter on the recovery of C and IP from HTC for various settings were obtained for this system (time and /2 temperature). Kriging interpolation was utilized to create a limited amount of extra sample points for gathered trial scores to develop an ANN model for this model with increased precision. An enhanced ANN algorithm was used to create a group of exponential equations. These equations forecasted CR and IP based on process factors and then generated a system of LE, which was utilized in the further dynamic optimization of the HTC process. Unlike ANN, the SVM technique is predicated on the fundamental risk mitigation approach, aiming to reduce the UB of misclassifications rather than the empirical error. SVM seems to have a distinct benefit over ANN in that it could be conceptually studied using principles from statistical ML theory. While we tended to discover a universal result in the course of training, we encountered structural risk in complex models while training SVM. To obtain local minima, the ANN applies the gradient descent learning technique. Consequently, overfitting occurs frequently, particularly for challenging nonlinear processes. We therefore incorporated E-SVM in our suggested model to avoid this issue [25]. Ensemble-SVM provides users with quick access to tools for experimenting with SVM ensembles. Training ensemble models are substantially faster than training ordinary LIBSVM models with a comparable prediction accuracy. Due to their low training complexity, linear algorithms are commonly used in large-scale learning.
The next sections of the study are organized in the following manner: Section 2 discusses the various alternative solutions published in the journal. Section 3 demonstrates the ML model’s functioning with respect to the system and technique including the model’s efficiency and obtained results. Finally, the Section 4 provides a conclusion and a discussion on future research.

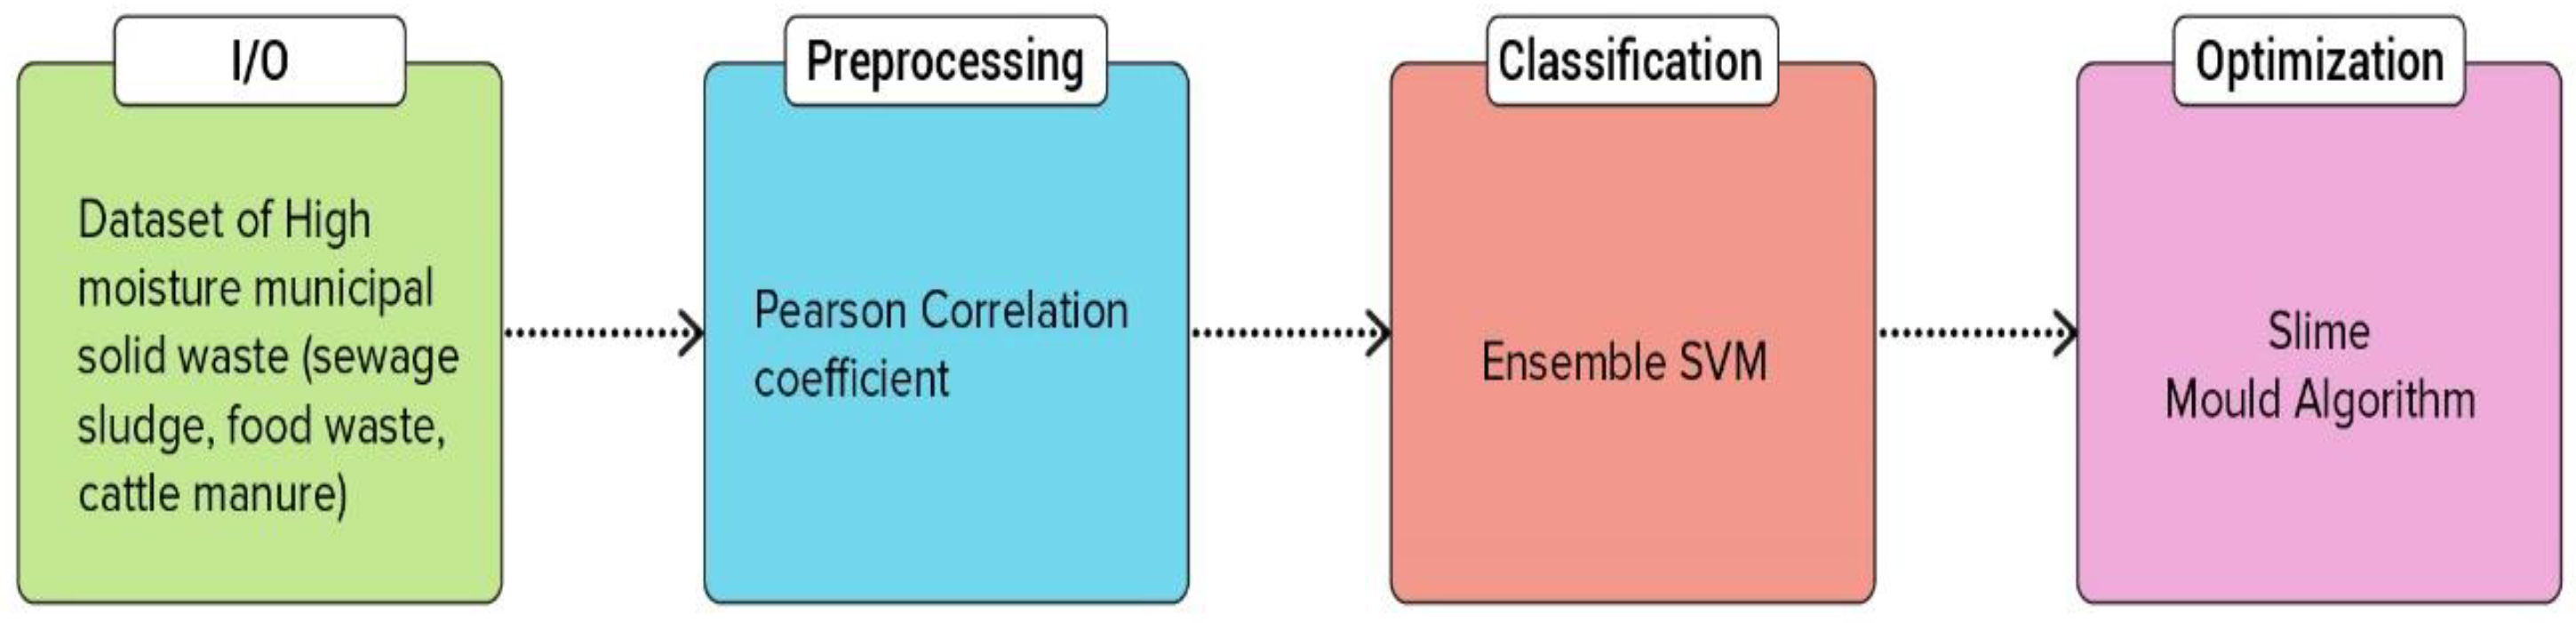
2. Materials and Methods

The proposed model’s overall flow is shown in Figure 1. The obtained data sets regarding sewage sludge, food scraps, and animal manure were utilized as the initial input. The datasets were then trained to estimate the most significant loss of function after preprocessing with the Pearson correlation coefficient. The learned dataset was then optimized using the Smile mould algorithm. Lastly, the hydrochar characteristics were predicted using the Ensemble-SVM.

2.1. Dataset and Preprocessing

Following the protocols mentioned in [11], a search of the existing HTC-related publications in the database was performed over the eighth month of 2017. Hydrochar literature reviews were undertaken on food scraps, wastewater slurry, and livestock compost. Proximate analyses data and element analyses (H, O, C, and N) for those feedstocks, including A—ash; V—Volatile-matter; and FC—fixed carbon, and the conditions of HC data, such as water content (WC), time (t), and temperature (T) were gathered. Data on yield, HHV, and C char were acquired for the HC properties [14]. The cattle dung was obtained from a feed lot. From this dung, it was determined that the fresh cattle manure had a moisture content of 85.12 ± 0.5 wt percent, and the moisture level of the cattle dung samples was decreased to 10.14 wt percent after processing in a greenhouse. After that, the air-dried cattle dung samples were compressed and presented at a size of 0.63 mm atoms. They were then retained in a sealed vessel for pyrolysis tests. Furthermore, the moisture levels of samples of fc, V, and A were determined on a dry-matter basis to be 15.12 wt%, 69.51 wt%, and 15.37 wt%, respectively. According to the final study, the cattle manure comprised C-41.13 weight%, H-5.89 weight%, N-2.69 weight%, S-0.37 weight% and 0–49.92 weight% [25]. In this study, a maximum of 281 data samples containing comprehensive data were acquired.

2.2. Data Preprocessing

All data from input variables and outcome goals were standardized, and the values was determined using the following formula to ensure that the domain of variables was homogeneous.
x i * = x i u s
where xi represents the value of the input feature i, x i * represents the normalized value of xi, and s and u represent the standard deviation and mean PCC (Pearson-correlation-coefficient) for xi, respectively, which were was used to acquiring a quick grasp for the correlation among the input variables and outcome goals. Then, Pxy was obtained using Equation (2), which is the PCC value for target–target/feature–target.
P x y = i = 1 n ( x i x )   ¯ i = 1 n ( y i y )   ¯ i = 1 n ( x i x )   ¯ 2 i = 1 n ( y i y )   ¯ 2
where x - or y - denote the average of the input variable x or outcome goal y, respectively. PCC is a metric that measures how similar two vectors are. The range of Pxy was between −1 and +1. Additionally, zero represents a non-linear correlation [11].
The entire dataset was separated into two random sections during the model building phase. Ninety percent of sample points, or 281 sample points chosen randomly, were designated as a training phase, The remaining one-tenth (25 data points) were designated as a testing set for the generated model’s final assessment. In addition, the hyperparameters of different models were adjusted via a 10-fold cross-validation during learning to improve predictive ability.

2.3. Ensemble-SVM for Classification

A compilation of multiple classification techniques whose independent choices were merged in a particular manner to categorize the test instances is referred to as an ensemble classifier. It is well established that such an ensemble’s efficiency frequently outperforms the individual classifiers. The reason for ensembles outperforming specific classifiers was demonstrated by Hansen et al., which is mentioned below.
Imagine there are n classifiers in the ensemble: f1, f2, …, fn, and x is data test. If every classifier were the same, there would be inaccuracy for the same data, and an ensemble would function as an individual classifier. Whenever the classifier is diverse and the inaccuracies are not correlated, if fi(x) is incorrect, almost all the other classifiers could be accurate. Then, the outcome of a majority of votes could be trusted. If p < ½ for a specific classifier, then the probability, pE, that the popular vote outcome is erroneous is k = n 2 n ( p k 1 p n k . k = n 2 n 1 2 k 1 2 n k = k = n 2 n 1 2 n . The probability, p E , decreases as the number of classifiers (n) increases. SVM is noted for its high generalization efficiency and ease of learning precise global optimal parameters. For these benefits, its ensemble would not be regarded as a viable strategy for significantly boosting the classifier’s performance. However, practical SVMs use approximation techniques to minimize the computing complexities of duration and storage. An individual SVM might not even be capable of learning the accurate variables of the global optimum. Occasionally, support vectors acquired during training are insufficient to classify every unfamiliar test sample adequately.
As a result, researchers cannot ensure that a single SVM will consistently deliver the best overall classification efficiency across all test samples. We proposed an ensemble of SVMs to solve this restriction. A similar assumption, which applies to a broad ensemble of classifiers, can likewise apply to the SVM ensemble. The general design of the suggested SVM ensemble is depicted in Figure 2. Using a bootstrap strategy, every SVM is trained individually using duplicated training. Various combination procedures were used to combine the constituent SVMs. All SVMs were synchronously fed with testing samples during the testing step and, depending on the aggregate approach, a collective decision was derived. Regarding multi-class classification, the benefit of employing an SVM ensemble above a single SVM is that it can be achieved with equal effectiveness. As SVMs were designed to perform two-class classifications, numerous SVMs must merge to acquire the multinomial categorization described in Section 2.2. For multinomial categorization, the SVM classifier does not function as well as it does for binary-class classification. Additionally, we could enhance performance classification in multinomial categorization through an ensemble SVM for which every SVM is structured to perform multinomial categorization [26].

2.4. Slime Mould Optimization

The proposed model employs SMA for performing the optimization of hyperparameters [27]. This was proposed due to the nature of the wavering style of fuligo septica (slime- mold). Positive and negative feedback of slime mold movements was restored using the mathematical model contained in the SMA [28]. The SMA could be consolidated with multiple problems regarding optimization, including engineering problems. There are two principal phases of the SMA algorithm: approaching food and warp food [29].

2.4.1. Approaching Food Algorithm

This is the phase in which the slime proceeds toward food. It depends on the food’s odor, which is present in the air. This process is mathematically defined as follows:
X t + 1 = x b t + v b   × W × X A   t X B   t ,   r < p v c × X t ,   r p
where v b refers to specifications ranging from −a to a; v c portrays a specification that reduces from one to zero in a linear manner; Xb constitutes the present, single location with respect to a high concentration of odor; t shows the present iteration; X represents the slime mold’s locality; XA and XB are arbitrarily picked singulars from the mold; and W denotes the weight of the slime mold. The equation for p can be written as: p = tanh[S(i) – DF], where i 1, 2, 3, …, n, and S(i) represents the fitness of X [30]. As previously described, a varies from −a to a, in which a can be written as:
a = arctanh t m a x t + 1
The W equation is written as:
W ( SmeelIndex t ) ¯ = 1 + r × log   bF S i bF wF + 1 ,   condition 1 r × log   bF S i bF wF + 1 , others
where SmeelIndex = sort(S)l; r represents the arbitrary value from the interval [0, 1]; bF represents the maximum fitness acquired from the present process of iteration; and wF represents the minimum fitness value acquired from the present process of iteration. The Smeel Index mentions the series of fitness values [27].

2.4.2. Warp Food Algorithm

This phase shows the performance of the slime in executing the contraction of its venous structure. It is mathematically written as:
X * = rand × UB LB + LB · rand < z X t + v b × W × X A t X B t ,   r < p v c × X t ,   r p
where UB denotes the upper border and LB denotes the lower border in a search range, and rand and r are the arbitrary specifications, ranging from 0 to 1 [31]. The acquired database yielded an LB and UB of an extensive variety of contaminants, as well as their elementary composition, proximal optimization, and operational state, The weighting factors of various objectives, which are considered equally in the optimization of fuel properties and the stability of carbon capture and storage (all μ set as 0.5), are shown in Table 1.

2.5. Training and Evaluation

ML techniques have traditionally been regarded as an optimization problem to define a loss function (cost function) that will then be minimized to optimize the model. Generally, a cost function refers to the difference between the anticipated terms (which are acquired by an ML model) and the terms of a real experiment. As shown in this paper, the cost function of multi-task learning (Ltotal) is,
L t o t a l W = t = 1 m γ t L t h   x i t ; w t ,   y i t
where m is number of total tasks; h accounts for ML model’s hypothesis function; [w1, w2wm] = W; the vector matrix (wt) of the hypothesis function is trained by Ltotal; λt is the scalar coefficient, which evaluates importance of various loss objectives, for which each of these projects is set to be the same; Lt represents the ML model’s task (t) loss function; and xti and yti are the input and output values of the task t, respectively. The results of the proposed model were evaluated based on the test data’s RMSE [32] and regression coefficient (R2) for which Equations (8)–(11) were calculated to evaluate the performance of the model [33]. The mathematical formulae are mentioned below:
R 2 = 1 i   i n   1 N Y i e x p Y i p r e d 2 i   i n   1 N Y i e x p Y a v e e x p 2
RMSE = 1 N   i = 1 N ( Y i e x p   Y i p r e d ) 2
% error = Y p r e d . i t Y e x p . i t Y e x p . i t × 100
MAPE = 100 n   i = 1 n Y p r e d . i t Y e x p . i t Y e x p . i t
where Ytpred.i represents the predicted value of target t; Ytexp,i denotes the target’s experimental data; and n shows the amount of data [34].

2.6. Analysis Method for Feature Importance

Specific methodologies are termed “black box” techniques as they provide no explanatory information on the relative effects of independent variables in the prediction phase, which would be an essential subject of concern for environmentalists. Although ML approaches have typically performed well, scientists have not remarked on the structural link between input variables and modeled outcomes. Approaches to analyzing the contribution of variables to SVM models have been established in previous studies; they were also applied in this work, providing a transparent method for sustainable development [35].

3. Results and Discussion

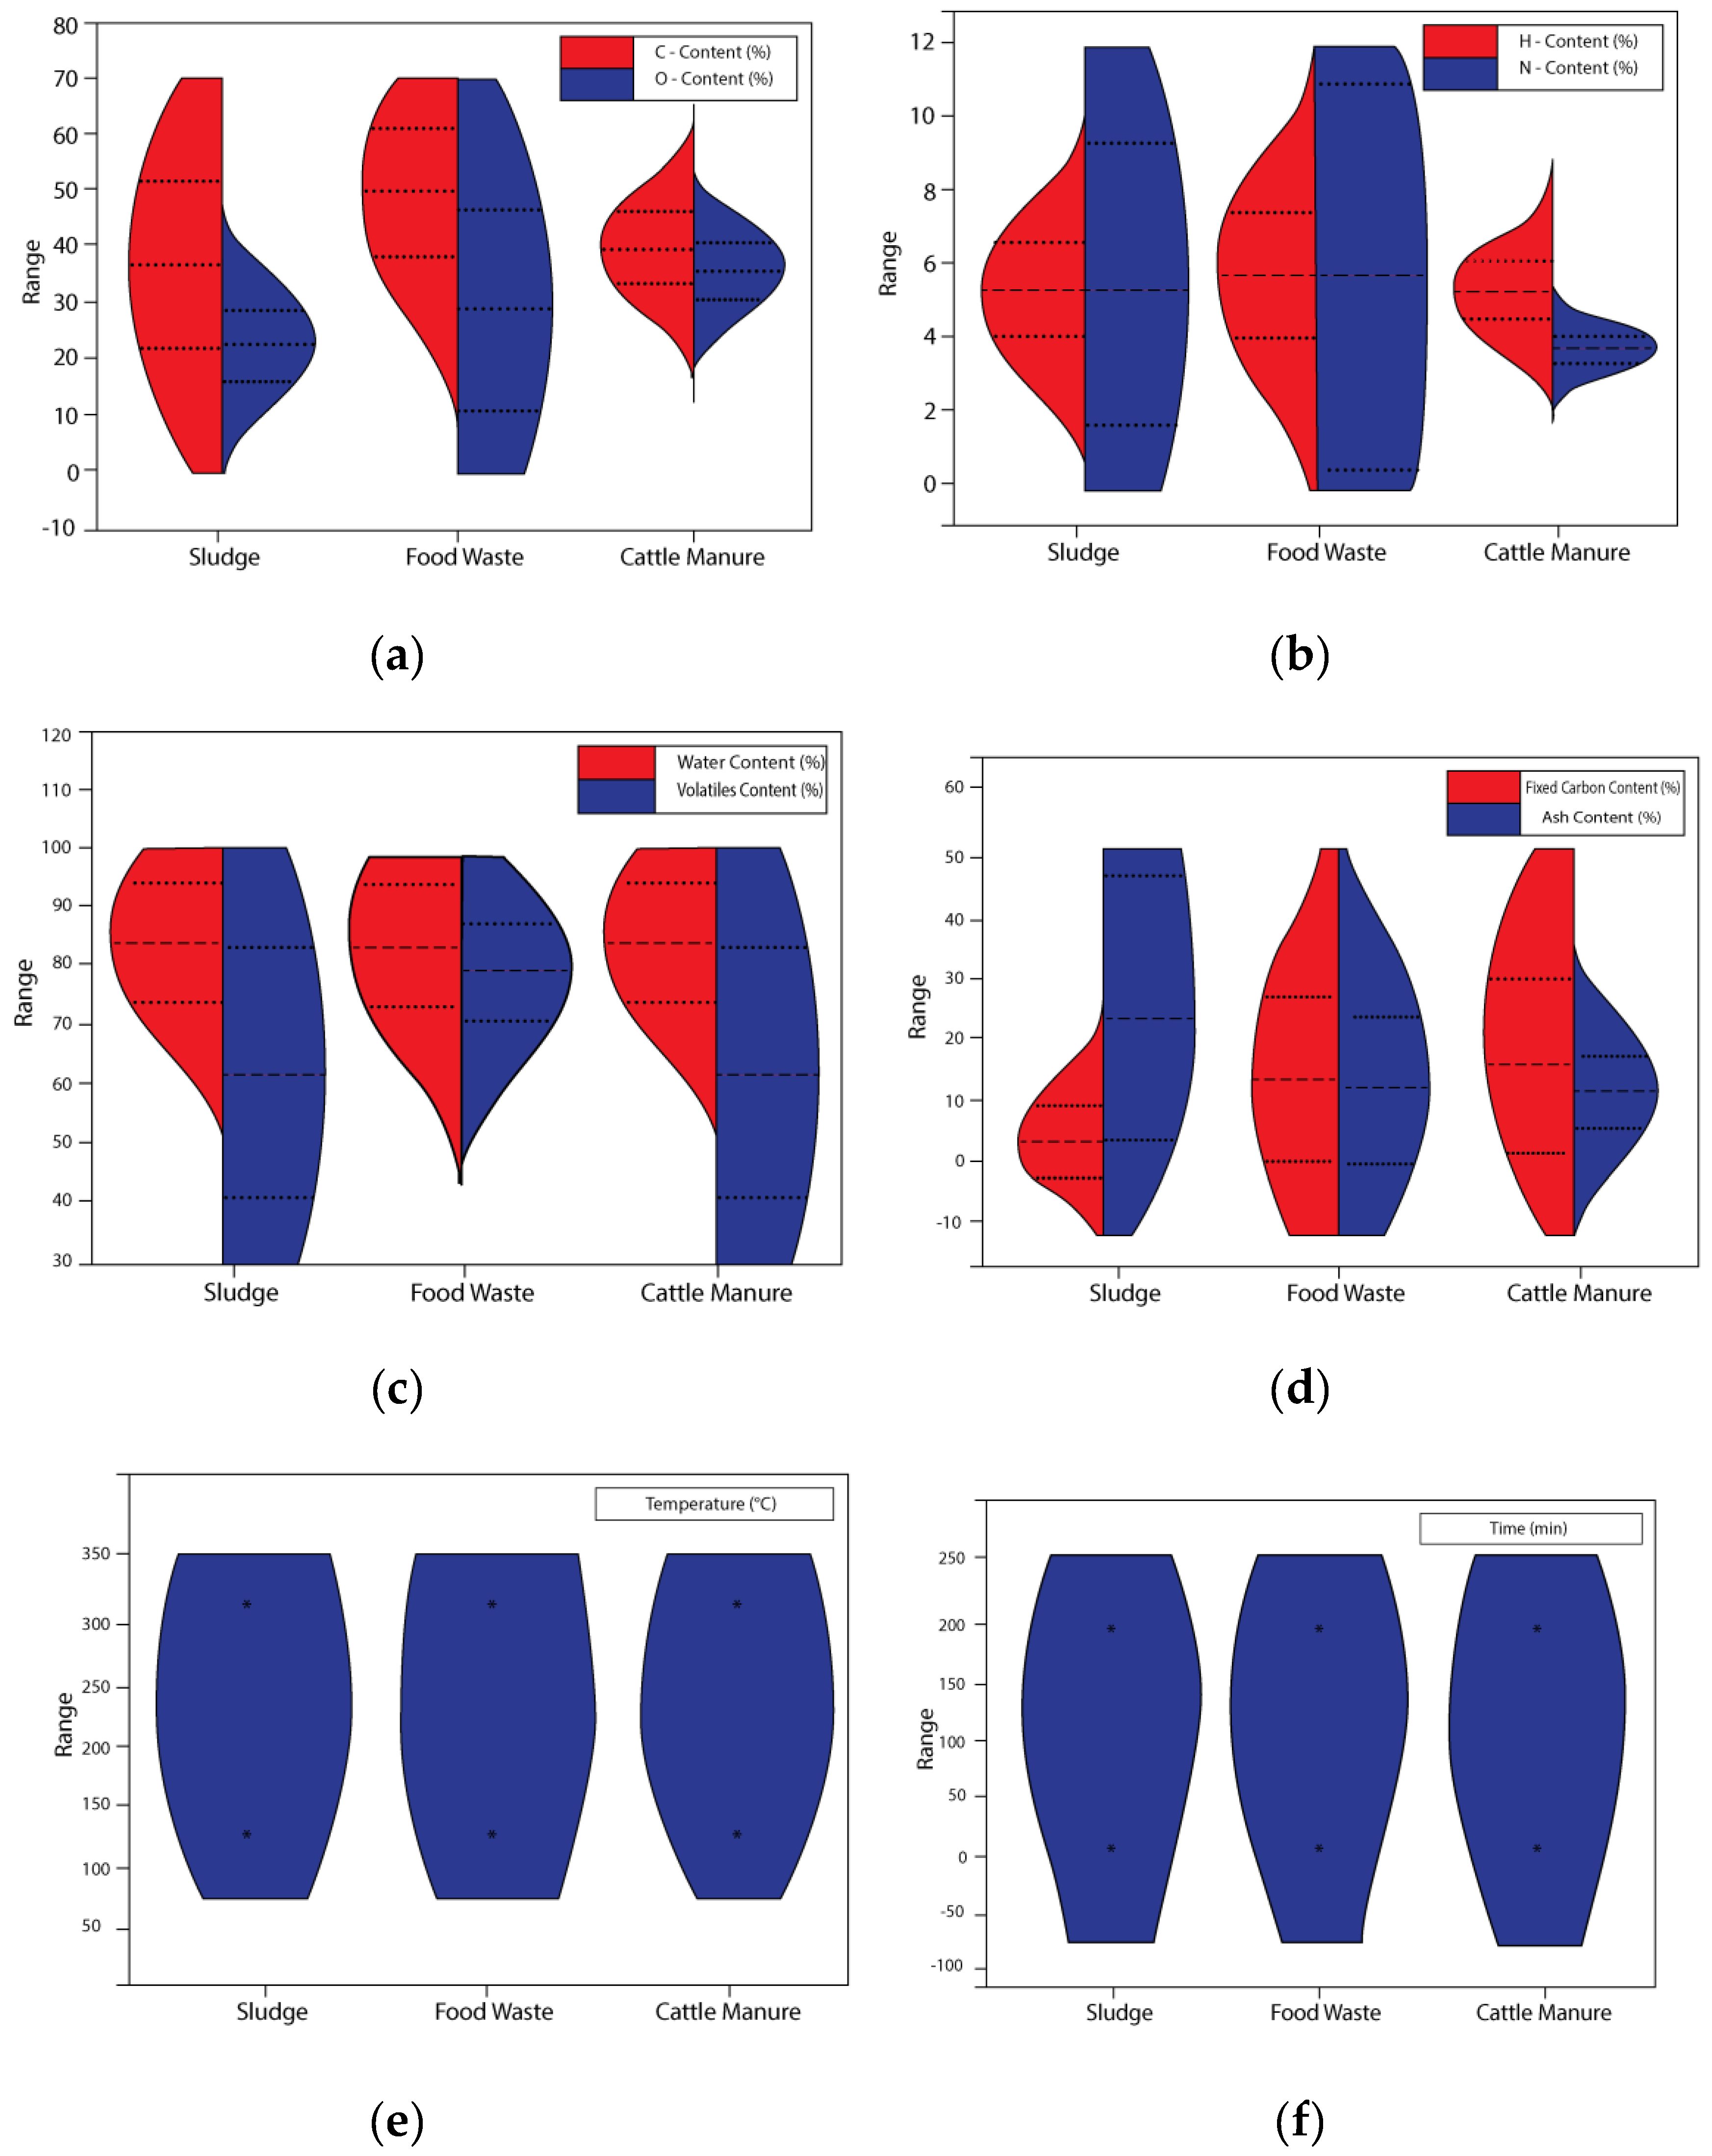
3.1. Statistical Analysis of Sewage Sludge, Food Waste, Cattle Manure, and Hydrochar Characteristics

Figure 3 depicts a descriptive statistical analysis for data on food scraps, wastewater slurry, and livestock compost qualities. According to the average of the statistics concerned with elemental exploration, food scraps demonstrated the highest C, H, and O contents and the lowest N content. The basic composition of the sediment had the reverse trend, shown in Figure 3a,b. In proximate analysis, the average moisture content of wastewater slurry and scraps was nearly 90 percent, whereas cattle manure had a water content of approximately 70 percent. Additionally, food scraps were the most volatile, and fc demonstrated a five percent ash concentration, which is much less than compared to the thirty percent for slurry and eighteen percent for livestock compost. The highest ash content in sewage sludge was caused by both the supply of the sewage and the filtration process. The most typical temperature for HTC circumstances was 200–250 °C, and the time was between 60 and 90 min, Figure 3c–f. Regarding output goals, the average HC of slurry capitulated was the greatest at sixty-five percent, resulting in the lowest carbon content and HHV. The median carbon and energy recovered from three types of wastes and converted into HC were, on the other hand, relatively close. Furthermore, the plot of O/C versus H/C suggests that three types of chemical processes (dehydration, demethylation, and decarboxylation) occurred during the process of performing HTC in waste with a high moisture content. The violin plot statistical data of yield, C Char, CR, energy recovery (ER), and HHV is shown in Figure 4a–c.

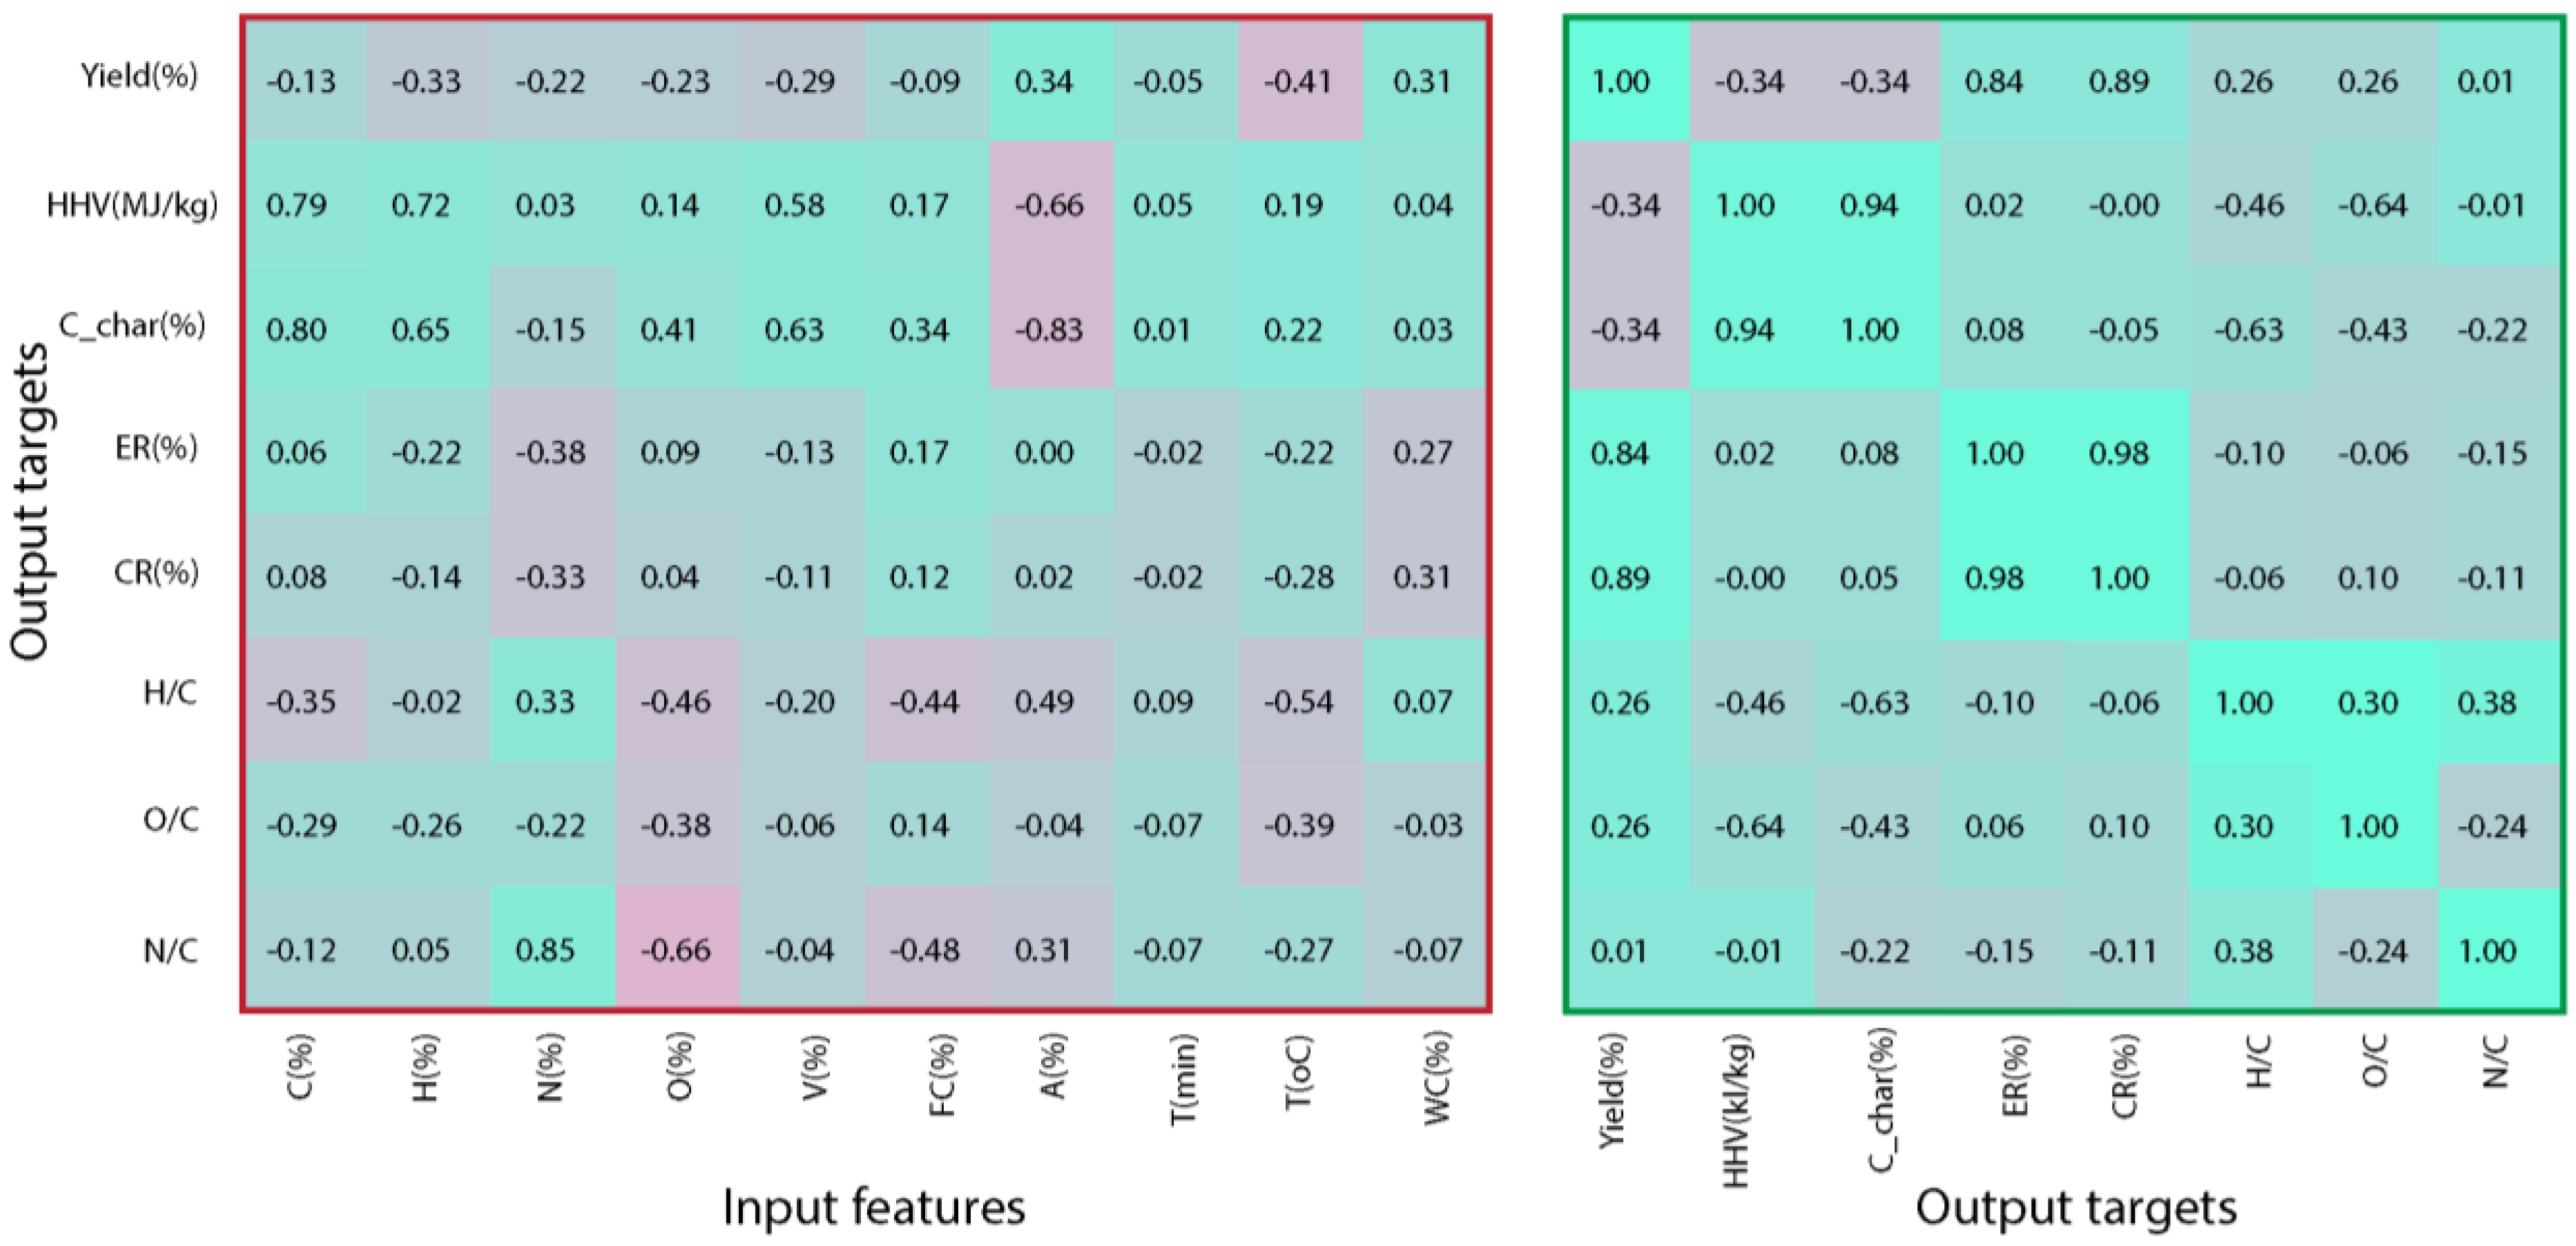
3.2. ML Model’s Hyperparameter Tuning and Variable Correlation

The initial connection among the input and output goals was studied based on the PCC. Both C char and HHV of the HC were favorably correlated with the H, C, and V feedstock composition, yet displayed strong negative correlations with the ash components, as per the PCC feature–target matrix in Figure 5. In addition, HC’s N/C ratio was inversely proportional to the N feedstock content and positively proportional to the O concentration. The link between the input features and other targets such as O/C, ER, yield, H/C, and CR, on the other hand, did not demonstrate any appreciable linear combination. However, practically all of the objectives were strongly correlated. The C char, ER, HHV, CR, and ER all demonstrated a strong positive correlation. Moreover, the yield was associated with CR and ER but not with the HHV/C_char. The ratios of atoms were also associated somehow, with H/C and O/C being inversely connected with the C char and HHV. Most of the targets had combinations with one another, demonstrating that multi-task ML predictions are feasible.

3.3. Evaluation of ML Model’s Optimization for Testing Dataset

The remaining one-tenth of the testing dataset was compared to the three best models to determine the overall predictive performance for the multi-task HC property prediction. Furthermore, one-task learning was built and evaluated with multi-task training, utilizing identical hyperparameters from each model. The evaluation criteria for model prediction accuracy were established as R2 and RMSE. If the RMSE value was low or the R2 value was closer to 1.0, then the prediction accuracy would be high. For diagnosing ER, C char, H/C, and CR, the R2 multi-task of RF was higher than the single-task R2, as can be seen in Figure 5, but the latter remained significantly greater with respect to predicting targets. The RF models, on the other hand, performed poorly (Figure 6a). Although the efficiency for predicting a single task with an RF might be enhanced by setting hyperparameters for every function individually, it is laborious and costly to implement. All the R2 values of the multi-task prediction of the optimized Ensemble SVM algorithm were over 0.85. In addition, the mean R2 was 0.90, which is much greater than compared to the R2 for predicting a task. With multi-task prediction, both the SVM and RF models achieved a minimum average RMSE (Figure 6b). When comparing the suggested model to the existing model shown in Table 2, Ensemble SVM ranked among the top because it had the lowest RMSE and the highest R2.

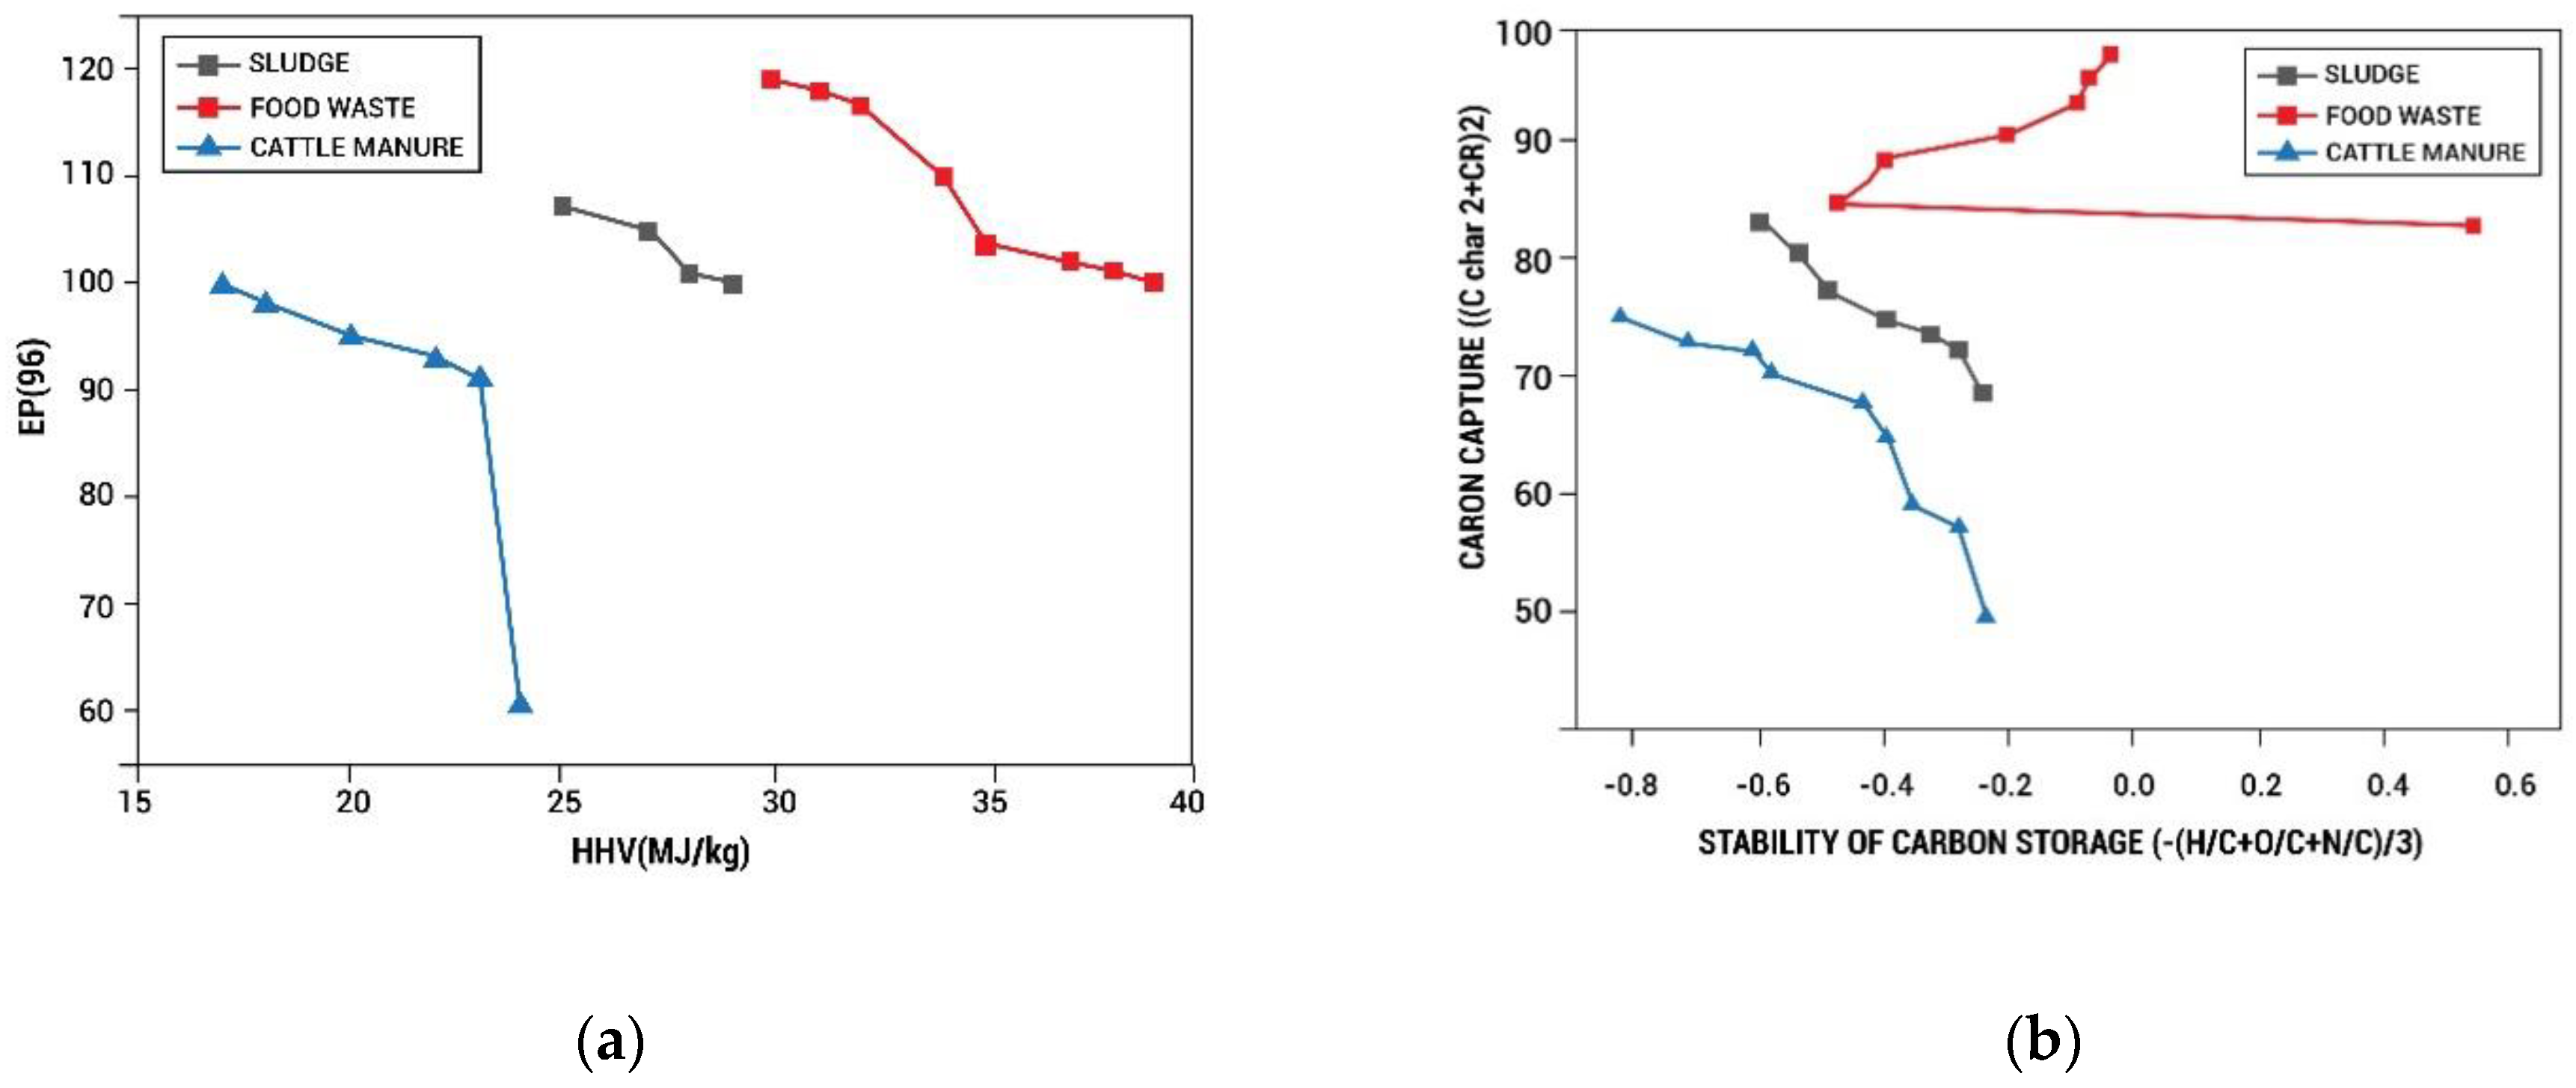
3.4. Slime Mould Algorithm Optimization of Hydrochar Properties Based on Ensemble SVM

The optimal E-SVM model, which served as pass-over among input terms and hydrochar resultant features, was also used to merge with optimization techniques to maximize desirable features and provide the associated operational parameters for experimentations to attain the intended results of hydrochar. Two of the hydrochar’s important FP, notably ER and HHV, were optimized as potential fuel substitutes. Figure 7a shows the Pareto curves of HHV vs. ER of an HC made using food scraps, compost, and sludge. The highest levels of HHV and ER were found in food scraps, followed by sludge and then manure. It appears unusual for a maximal ER to be over 100%, but it was logical considering our ML model’s prediction errors due to insufficient capabilities. As tabulated in Table 3, the non-inferior solution of input terms for the H and C compositions had only a border constraint, implying that greater H and C concentrations of biofuel could contribute more robust fuel attributes. The remediation of soil and carbon sequestering was implemented on HC where the potentiality of the steadiness of CC and CCS was considered. The hydrochar’s CR, C char, and atomic ratios were chosen with targets for demonstrating the CCS stability for optimization. The Pareto curves illustrate CC vs. CCS, using an HC obtained from various unwanted wastes associated with multi-attribute optimization, shown in Figure 7b.

4. Conclusions

We developed a multi-task, high-accuracy prediction system to predict water char grades and effectively combined it with SMA to optimize water char performance. An ensemble machine learning algorithm was used to estimate the yields of hydrochar, HHV, and C char based on the results of previous experimental studies and considering the hydrochar fuel properties, which provided a good multi-task prediction performance. The model optimized by ESVM had an average R2 of 0.94 and an RMSE of 2.62. In addition, the yield of the hydrochar is mainly affected by the HC conditions, especially temperature and water content. In contrast, the carbon and ash contents of sewage sludge, food waste, and animal manure were major contributors to the HHV and C-char. Biofuel ratios and functional states, especially elemental content and temperature, appear to be critical for predicting HC CSS and FP efficiency based on an ML-constructed feature analysis. The ensemble-ML-based slime mold model produced non-inferior solutions with input constraints for optimizing the CCS/FP HC for different applications. The unique importance of Pareto solutions and brackets can provide direction for the fabrication of ideal hydrochar while saving labor, time, and money. In an effort to further reduce numerous hazardous emissions, MSW recycling and energy recovery should be precisely predicted with experimental validation that is carried out using an optimized deep learning.

Author Contributions

Conceptualization, P.V., J.S., N.S. and R.K.M.; methodology, M.Q.S., M.A., M.S. and J.-G.C.; software, P.V., J.S., N.S. and R.K.M.; validation, M.Q.S., M.A., M.S. and J.-G.C.; formal analysis, P.V., J.S., N.S. and R.K.M.; investigation, M.Q.S., M.A., M.S. and J.-G.C.; resources, M.S., P.V., J.S., N.S. and R.K.M.; data curation, M.A., M.S. and J.-G.C.; writing—original draft preparation, P.V., J.S., N.S. and R.K.M.; writing—review and editing, M.Q.S., M.A., M.S. and J.-G.C.; visualization, P.V., J.S., N.S. and R.K.M.; supervision, M.Q.S., M.A., M.S. and J.-G.C.; project administration, M.S. and R.K.M.; funding acquisition, M.A. M.S. and J.-G.C. All authors have read and agreed to the published version of the manuscript.

Funding

This research received no external funding.

Institutional Review Board Statement

Not applicable.

Informed Consent Statement

Not applicable.

Data Availability Statement

Not applicable.

Conflicts of Interest

The authors declare no conflict of interest.

References

  1. Multi-Task Prediction of Fuel Properties of Hydrochar Derived from Wet Municipal Wastes with Random Forest. Available online: https://www.researchgate.net/profile/jie-li-85/publication/343124219_multi-task_prediction_of_fuel_properties_of_hydrochar_derived_from_wet_municipal_wastes_with_random_forest/links/5f1799dda6fdcc9626a67c5a/multi-task-prediction-of-fuel-properties-of-hydrochar-derived-from-wet-municipal-wastes-with-random-forest.pdf (accessed on 20 June 2022).
  2. Birgen, C.; Magnanelli, E.; Carlsson, P.; Skreiberg, Ø.; Mosby, J.; Becidan, M. Machine learning based modelling for lower-Ju heating value prediction of municipal solid waste. Fuel 2020, 283, 118906. [Google Scholar] [CrossRef]
  3. AlZubi, A.A. IoT-based automated water pollution treatment using machine learning classifiers. Environ. Technol. 2022, 1–9. [Google Scholar] [CrossRef] [PubMed]
  4. Li, H.; Liu, X.; Legros, R.; Bi, X.T.; Lim, C.J.; Sokhansanj, S. Pelletization of torrefied sawdust and properties of torrefied pellets. Appl. Energy 2012, 93, 680–685. [Google Scholar] [CrossRef]
  5. Liu, Z.; Quek, A.; Balasubramanian, R. Preparation and characterization of fuel pellets from woody biomass, agro-residues and their corresponding hydrochars. Appl. Energy 2014, 113, 1315–1322. [Google Scholar] [CrossRef]
  6. Xie, S.; Yu, G.; Li, C.; You, F.; Li, J.; Tian, R.; Wang, G.; Wang, Y. Dewaterability enhancement and heavy metals immobilization by pig manure biochar addition during hydrothermal treatment of sewage sludge. Environ. Sci. Pollut. Res. 2019, 26, 16537–16547. [Google Scholar] [CrossRef]
  7. Diggelman, C.; Ham, R.K. Household food waste to wastewater or to solid waste? That is the question. Waste Manag. Res. J. Sustain. Circ. Econ. 2003, 21, 501–514. [Google Scholar] [CrossRef]
  8. Leng, L.; Yuan, X.; Shao, J.; Huang, H.; Wang, H.; Li, H.; Chen, X.; Zeng, G. Study on demetalization of sewage sludge by sequential extraction before liquefaction for the production of cleaner bio-oil and bio-char. Bioresour. Technol. 2016, 200, 320–327. [Google Scholar] [CrossRef]
  9. Mau, V.; Gross, A. Energy conversion and gas emissions from production and combustion of poultry-litter-derived hydrochar and biochar. Appl. Energy 2018, 213, 510–519. [Google Scholar] [CrossRef]
  10. Tian, H.; Li, J.; Yan, M.; Tong, Y.W.; Wang, C.-H.; Wang, X. Organic waste to biohydrogen: A critical review from technological development and environmental impact analysis perspective. Appl. Energy 2019, 256, 113961. [Google Scholar] [CrossRef]
  11. Li, J.; Zhu, X.; Li, Y.; Tong, Y.W.; Ok, Y.S.; Wang, X. Multi-task prediction and optimization of hydrochar properties from high-moisture municipal solid waste: Application of machine learning on waste-to-resource. J. Clean. Prod. 2020, 278, 123928. [Google Scholar] [CrossRef]
  12. Hameed, Z.; Aslam, M.; Khan, Z.; Maqsood, K.; Atabani, A.; Ghauri, M.; Khurram, M.S.; Rehan, M.; Nizami, A.-S. Gasification of municipal solid waste blends with biomass for energy production and resources recovery: Current status, hybrid technologies and innovative prospects. Renew. Sustain. Energy Rev. 2020, 136, 110375. [Google Scholar] [CrossRef]
  13. Qian, X.; Lee, S.; Chandrasekaran, R.; Yang, Y.; Caballes, M.; Alamu, O.; Chen, G. Electricity Evaluation and Emission Characteristics of Poultry Litter Co-Combustion Process. Appl. Sci. 2019, 9, 4116. [Google Scholar] [CrossRef] [Green Version]
  14. Tasca, A.L.; Puccini, M.; Gori, R.; Corsi, I.; Galletti, A.M.R.; Vitolo, S. Hydrothermal carbonization of sewage sludge: A critical analysis of process severity, hydrochar properties and environmental implications. Waste Manag. 2019, 93, 1–13. [Google Scholar] [CrossRef] [PubMed]
  15. Li, L.; Flora, J.R.; Caicedo, J.M.; Berge, N.D. Investigating the role of feedstock properties and process conditions on products formed during the hydrothermal carbonization of organics using regression techniques. Bioresour. Technol. 2015, 187, 263–274. [Google Scholar] [CrossRef] [PubMed]
  16. Cao, H.; Xin, Y.; Yuan, Q. Prediction of biochar yield from cattle manure pyrolysis via least squares support vector machine intelligent approach. Bioresour. Technol. 2016, 202, 158–164. [Google Scholar] [CrossRef]
  17. Taki, M.; Rohani, A. Machine learning models for prediction the Higher Heating Value (HHV) of Municipal Solid Waste (MSW) for waste-to-energy evaluation. Case Stud. Therm. Eng. 2022, 31, 101823. [Google Scholar] [CrossRef]
  18. Jassim, M.S.; Coskuner, G.; Zontul, M. Comparative performance analysis of support vector regression and artificial neural network for prediction of municipal solid waste generation. Waste Manag. Res. J. Sustain. Circ. Econ. 2021, 40, 195–204. [Google Scholar] [CrossRef]
  19. Adeleke, O.; Akinlabi, S.; Jen, T.-C.; Dunmade, I. A machine learning approach for investigating the impact of seasonal variation on physical composition of municipal solid waste. J. Reliab. Intell. Environ. 2022, 1–20. [Google Scholar] [CrossRef]
  20. Riaz, A.R.; Gilani, S.M.M.; Naseer, S.; Alshmrany, S.; Shafiq, M.; Choi, J.G. Applying Adaptive Security Techniques for Risk Analysis of Internet of Things (IoT)-Based Smart Agriculture. Sustainability 2022, 14, 10964. [Google Scholar] [CrossRef]
  21. Ro, K.S.; Flora, J.R.V.; Bae, S.; Libra, J.A.; Berge, N.D.; Álvarez-Murillo, A.; Li, L. Properties of Animal-Manure-Based Hydrochars and Predictions Using Published Models. ACS Sustain. Chem. Eng. 2017, 5, 7317–7324. [Google Scholar] [CrossRef]
  22. Li, J.; Pan, L.; Suvarna, M.; Tong, Y.W.; Wang, X. Fuel properties of hydrochar and pyrochar: Prediction and exploration with machine learning. Appl. Energy 2020, 269, 115166. [Google Scholar] [CrossRef]
  23. Ma, J.; Chen, M.; Yang, T.; Liu, Z.; Jiao, W.; Li, D.; Gai, C. Gasification performance of the hydrochar derived from co-hydrothermal carbonization of sewage sludge and sawdust. Energy 2019, 173, 732–739. [Google Scholar] [CrossRef]
  24. Ismail, H.Y.; Shirazian, S.; Skoretska, I.; Mynko, O.; Ghanim, B.; Leahy, J.J.; Walker, G.M.; Kwapinski, W. ANN-Kriging hybrid model for predicting carbon and inorganic phosphorus recovery in hydrothermal carbonization. Waste Manag. 2019, 85, 242–252. [Google Scholar] [CrossRef] [PubMed]
  25. Bokhari, S.A.; Saqib, Z.; Amir, S.; Naseer, S.; Shafiq, M.; Ali, A.; Zaman-ul-Haq, M.; Irshad, A.; Hamam, H. Assessing land cover transformation for urban environmental sustainability through satellite sensing. Sustainability 2022, 14, 2810. [Google Scholar] [CrossRef]
  26. Kim, H.-C.; Pang, S.; Je, H.-M.; Kim, D.; Bang, S.Y. Constructing support vector machine ensemble. Pattern Recognit. 2003, 36, 2757–2767. [Google Scholar] [CrossRef]
  27. Li, S.; Chen, H.; Wang, M.; Heidari, A.A.; Mirjalili, S. Slime mould algorithm: A new method for stochastic optimization. Future Gener. Comput. Syst. 2020, 111, 300–323. [Google Scholar] [CrossRef]
  28. Patino-Ramirez, F.; Boussard, A.; Arson, C.; Dussutour, A. Substrate composition directs slime molds behavior. Sci. Rep. 2019, 9, 15444 . [Google Scholar] [CrossRef] [Green Version]
  29. Zubaidi, S.L.; Abdulkareem, I.H.; Hashim, K.S.; Al-Bugharbee, H.; Ridha, H.M.; Gharghan, S.K.; Al-Qaim, F.F.; Muradov, M.; Kot, P.; Al-Khaddar, R. Hybridised Artificial Neural Network Model with Slime Mould Algorithm: A Novel Methodology for Prediction of Urban Stochastic Water Demand. Water 2020, 12, 2692. [Google Scholar] [CrossRef]
  30. Kumar, C.; Raj, T.D.; Premkumar, M. A new stochastic slime mould optimization algorithm for the estimation of solar photovoltaic cell parameters. Optik 2020, 223, 165277. [Google Scholar] [CrossRef]
  31. Mostafa, M.; Rezk, H.; Aly, M.; Ahmed, E.M. A new strategy based on slime mould algorithm to extract the optimal model parameters of solar PV panel. Sustain. Energy Technol. Assess. 2020, 42, 100849. [Google Scholar] [CrossRef]
  32. Yin, C.-Y. Prediction of higher heating values of biomass from proximate and ultimate analyses. Fuel 2010, 90, 1128–1132. [Google Scholar] [CrossRef] [Green Version]
  33. Qian, X.; Lee, S.; Soto, A.-M.; Chen, G. Regression Model to Predict the Higher Heating Value of Poultry Waste from Proximate Analysis. Resources 2018, 7, 39. [Google Scholar] [CrossRef] [Green Version]
  34. Zhu, X.; Li, Y.; Wang, X. Machine learning prediction of biochar yield and carbon contents in biochar based on biomass characteristics and pyrolysis conditions. Bioresour. Technol. 2019, 288, 121527. [Google Scholar] [CrossRef]
  35. Wu, G.; Kechavarzi, C.; Li, X.; Wu, S.; Pollard, S.J.; Sui, H.; Coulon, F. Machine learning models for predicting PAHs bioavailability in compost amended soils. Chem. Eng. J. 2013, 223, 747–754. [Google Scholar] [CrossRef]
  36. Jiang, W.; Xing, X.; Li, S.; Zhang, X.; Wang, W. Synthesis, characterization and machine learning based performance prediction of straw activated carbon. J. Clean. Prod. 2018, 212, 1210–1223. [Google Scholar] [CrossRef]
  37. Cheng, F.; Porter, M.D.; Colosi, L.M. Is hydrothermal treatment coupled with carbon capture and storage an energy-producing negative emissions technology? Energy Convers. Manag. 2020, 203, 112252. [Google Scholar] [CrossRef]
Figure 1. Block diagram of the proposed model.
Sustainability 15 06088 g001
Figure 2. Ensemble-SVM architecture.
Sustainability 15 06088 g002
Figure 3. Volin plot for statistical data of elementary composition (a,b); proximate analysis (c,d) of waste with high moisture content, and HTC conditions (e,f).
Sustainability 15 06088 g003
Figure 4. Data statistics in violin plot: (a) yield of hydrochar, (b) CC and CR of hydrochar, and (c) HHV and ER of hydrochar.
Sustainability 15 06088 g004
Figure 5. The PCC method was employed for exploring features–targets and targets–targets (248 types of data was analyzed for C_char, T, A, t, CR, Fc, WC, V, ER, and HHV).
Sustainability 15 06088 g005
Figure 6. Prediction accuracy for the eight targets in the two distinct optimized models of (a) the average R2 and (b) average RMSE (RF, ESVM).
Sustainability 15 06088 g006
Figure 7. Pareto curves of a hydrochar generated from sludge, food waste, and animal dung: (a) HHV vs. ER and (b) C Char vs. CSS.
Sustainability 15 06088 g007
Table 1. LB and UB of variables for various types of wastes, their elemental composition, proximal composition, and operational condition.
Content Sewage SludgeFood WasteCattle Manure
LBUBLBUBLBUB
Elemental CompositionC (%)22.251.938.9246.233.9246.2
O (%)16.122931.2340.9831.2340.98
H (%)4.176.734.177.624.626.23
N (%)1.8610.920.6310.923.424.23
Proximate compositionFc (%)0.029.870.8225.861.2129.26
V (%)45.9883.6271.5287.2329.2639.5
A (%)15.2148.230.8721.745.4717.63
Operational conditionsT (°C)150320150320150320
T (min)922082205220
WC (%)75.2395.2474.8695.8794.9774.56
Table 2. Machine learning studies are compared to past works focused on waste to resource management.
ReferencesProcess of Waste ConversionFeedstock TypesSize of the Data SetMachine Learning ModelTask TypeR2 Testing
Li et al. (2019) [22]HTCOrganic wastes248Random ForestMulti0.8–0.95
Ismail et al. (2019) [24]HTCPoultry litter21NNMulti>0.90
Jiang et al. (2019) [36]HTC + pyrolysisStraw30Linear RegressionSingle0.098–0.99
SVRSingle0.98–0.99
Li et al. (2020) [27]HTCOrganic wastes649RFSingle>0.90
475RFSingle>0.90
Cheng et al. (2020) [37]Hydrothermal treatmentMicroalgae, crops/forest residues, and organic wastes800Multiple linear regressionMulti0.16–0.60
-Regression treeMulti0.29–0.75
-RFMulti0.70–0.90
Li, J., Zhu et al. (2020) [11]HTCFood waste, sludge, and manure248RFMulti0.55–0.91
SVRMulti0.88–0.96
NNMulti0.88–0.95
This WorkHTCSewage sludge, food waste, and cattle manure281Ensemble SVMMulti0.89–0.97
Table 3. Maximum FP and CCS stability-based Pareto solutions for input and output.
PropertiesMaximum Fuel Properties of Pareto SolutionMaximum CCS Stability of Pareto Solution
Sewage SludgeCattle ManureFood WasteSewage SludgeCattle ManureFood Waste
C (%)50.9848.4063.8750.9848.4063.87
O (%)17.5432.0111.0123.7838.7615.21
H (%)4.315.093.254.315.093.25
N (%)9.044.1112.564.873.499.06
Fc (%)11.0213.2315.268.0413.1112.01
V (%)70.8674.5271.9175.3682.6376.71
A (%)20.3213.6511.8714.326.3113.44
T (°C)223.00205.42285.65297.93328.98327.78
t (min)6.006.006.0829.5657.0614.14
WC (%)76.0276.0576.0288.0474.9195.78
HHV (MJ/kg)29.3721.6636.4327.1125.4433.21
YIELD (%)70.3180.0670.6565.0746.5766.18
ER (%)104.8795.32113.2796.4571.65107.33
CR (%)92.5492.41106.2191.5365.65103.26
C_char (%)66.9853.2782.7467.6166.4684.71
H/C0.822.020.210.620.950.12
N/C0.230.080.230.080.10.07
O/C0.010.570.010.030.180.01
Disclaimer/Publisher’s Note: The statements, opinions and data contained in all publications are solely those of the individual author(s) and contributor(s) and not of MDPI and/or the editor(s). MDPI and/or the editor(s) disclaim responsibility for any injury to people or property resulting from any ideas, methods, instructions or products referred to in the content.

