

The Impact of Optimizing Industrial Energy Efficiency on Agricultural Development in OECD Countries


Abstract
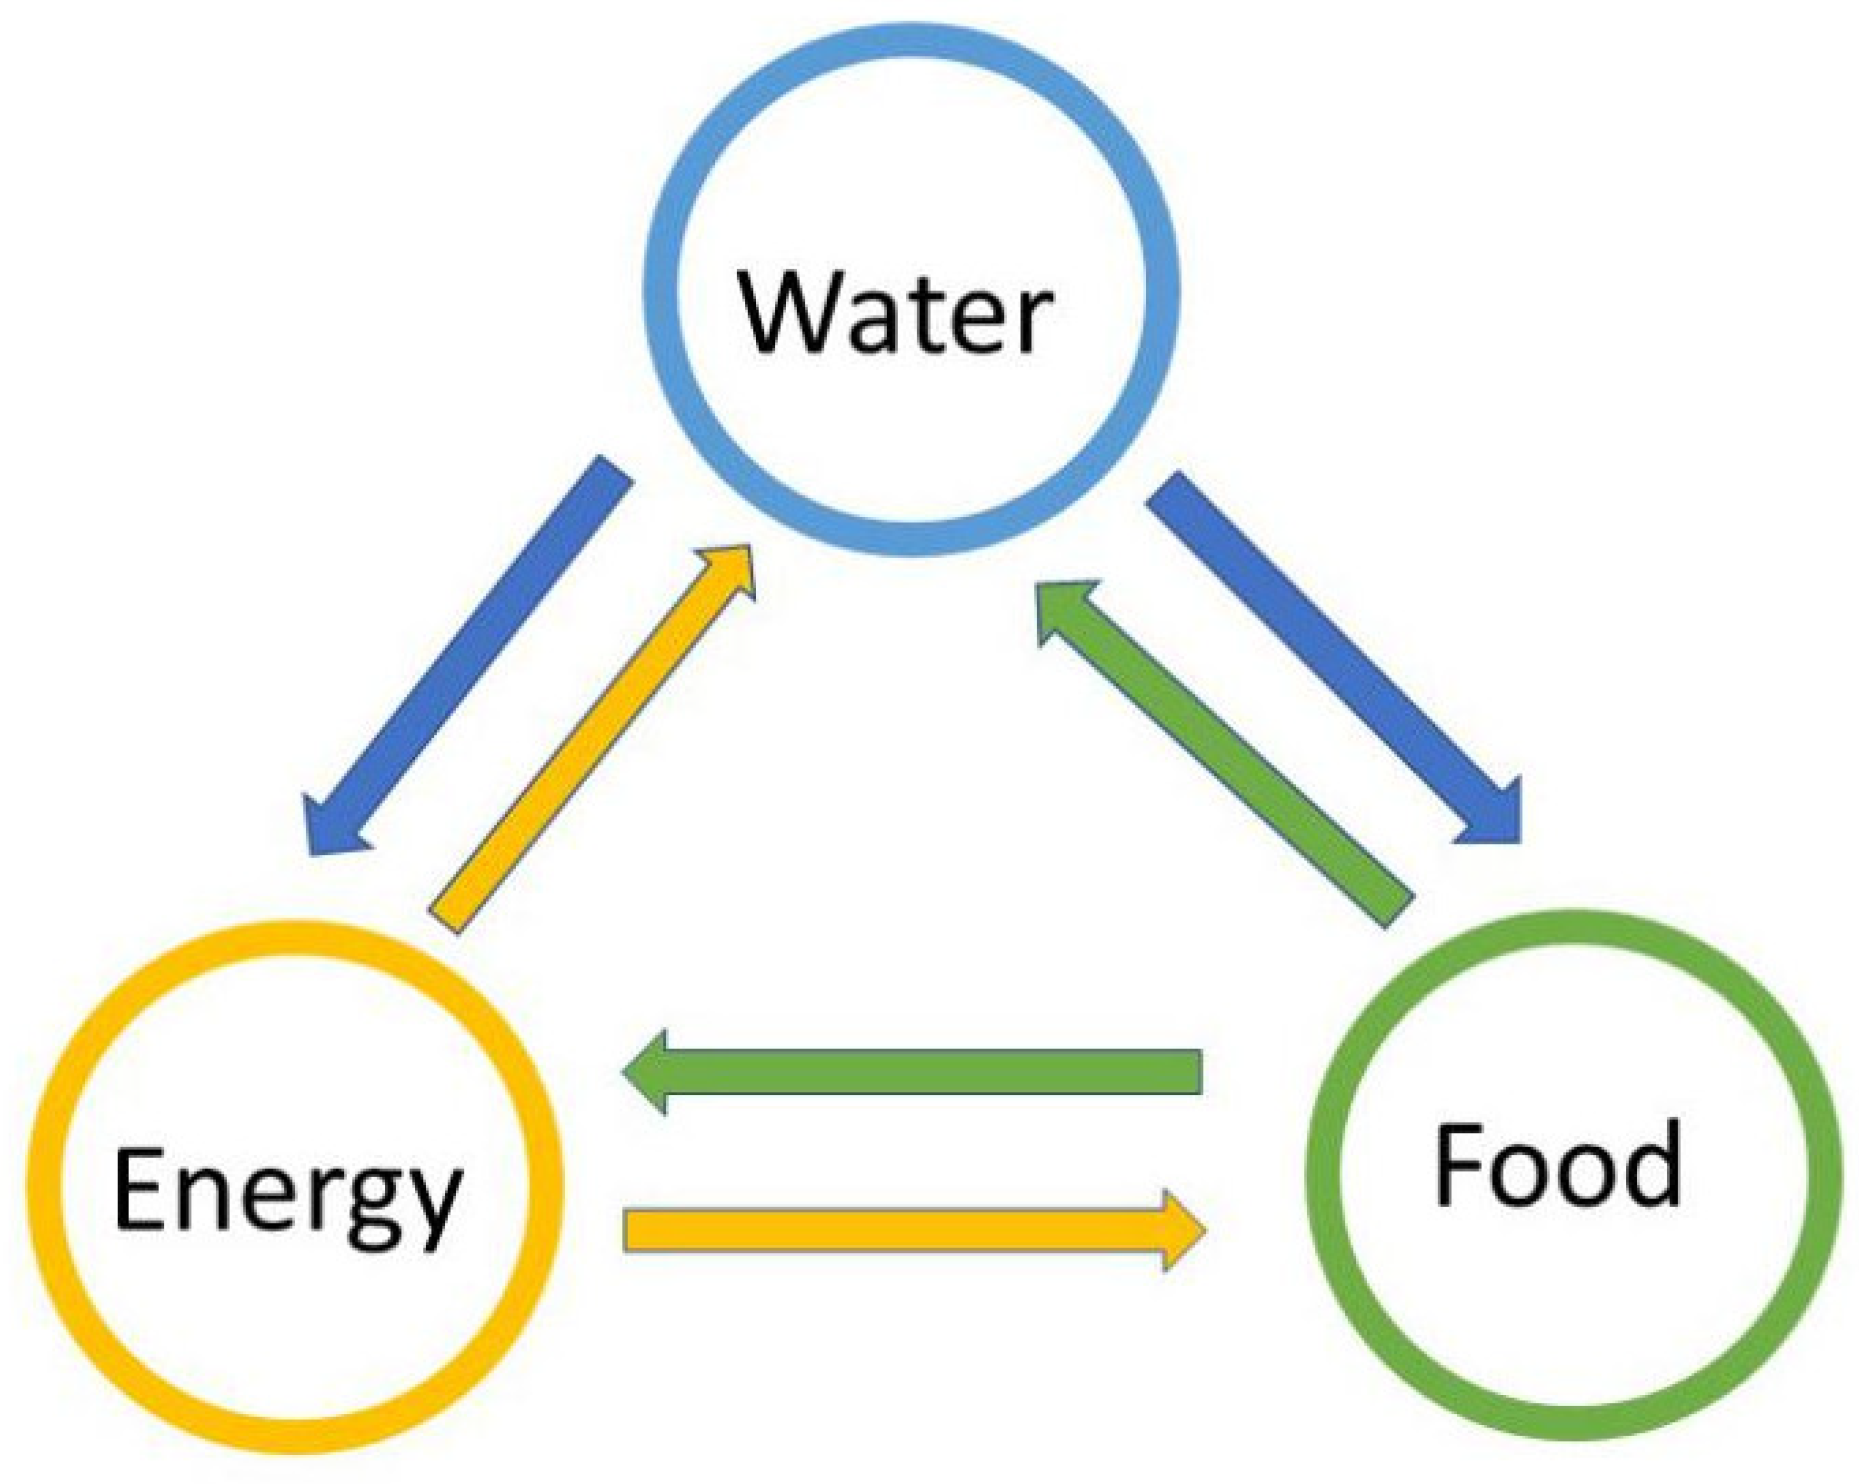
:1. Introduction
2. Literature Review
3. Research Method
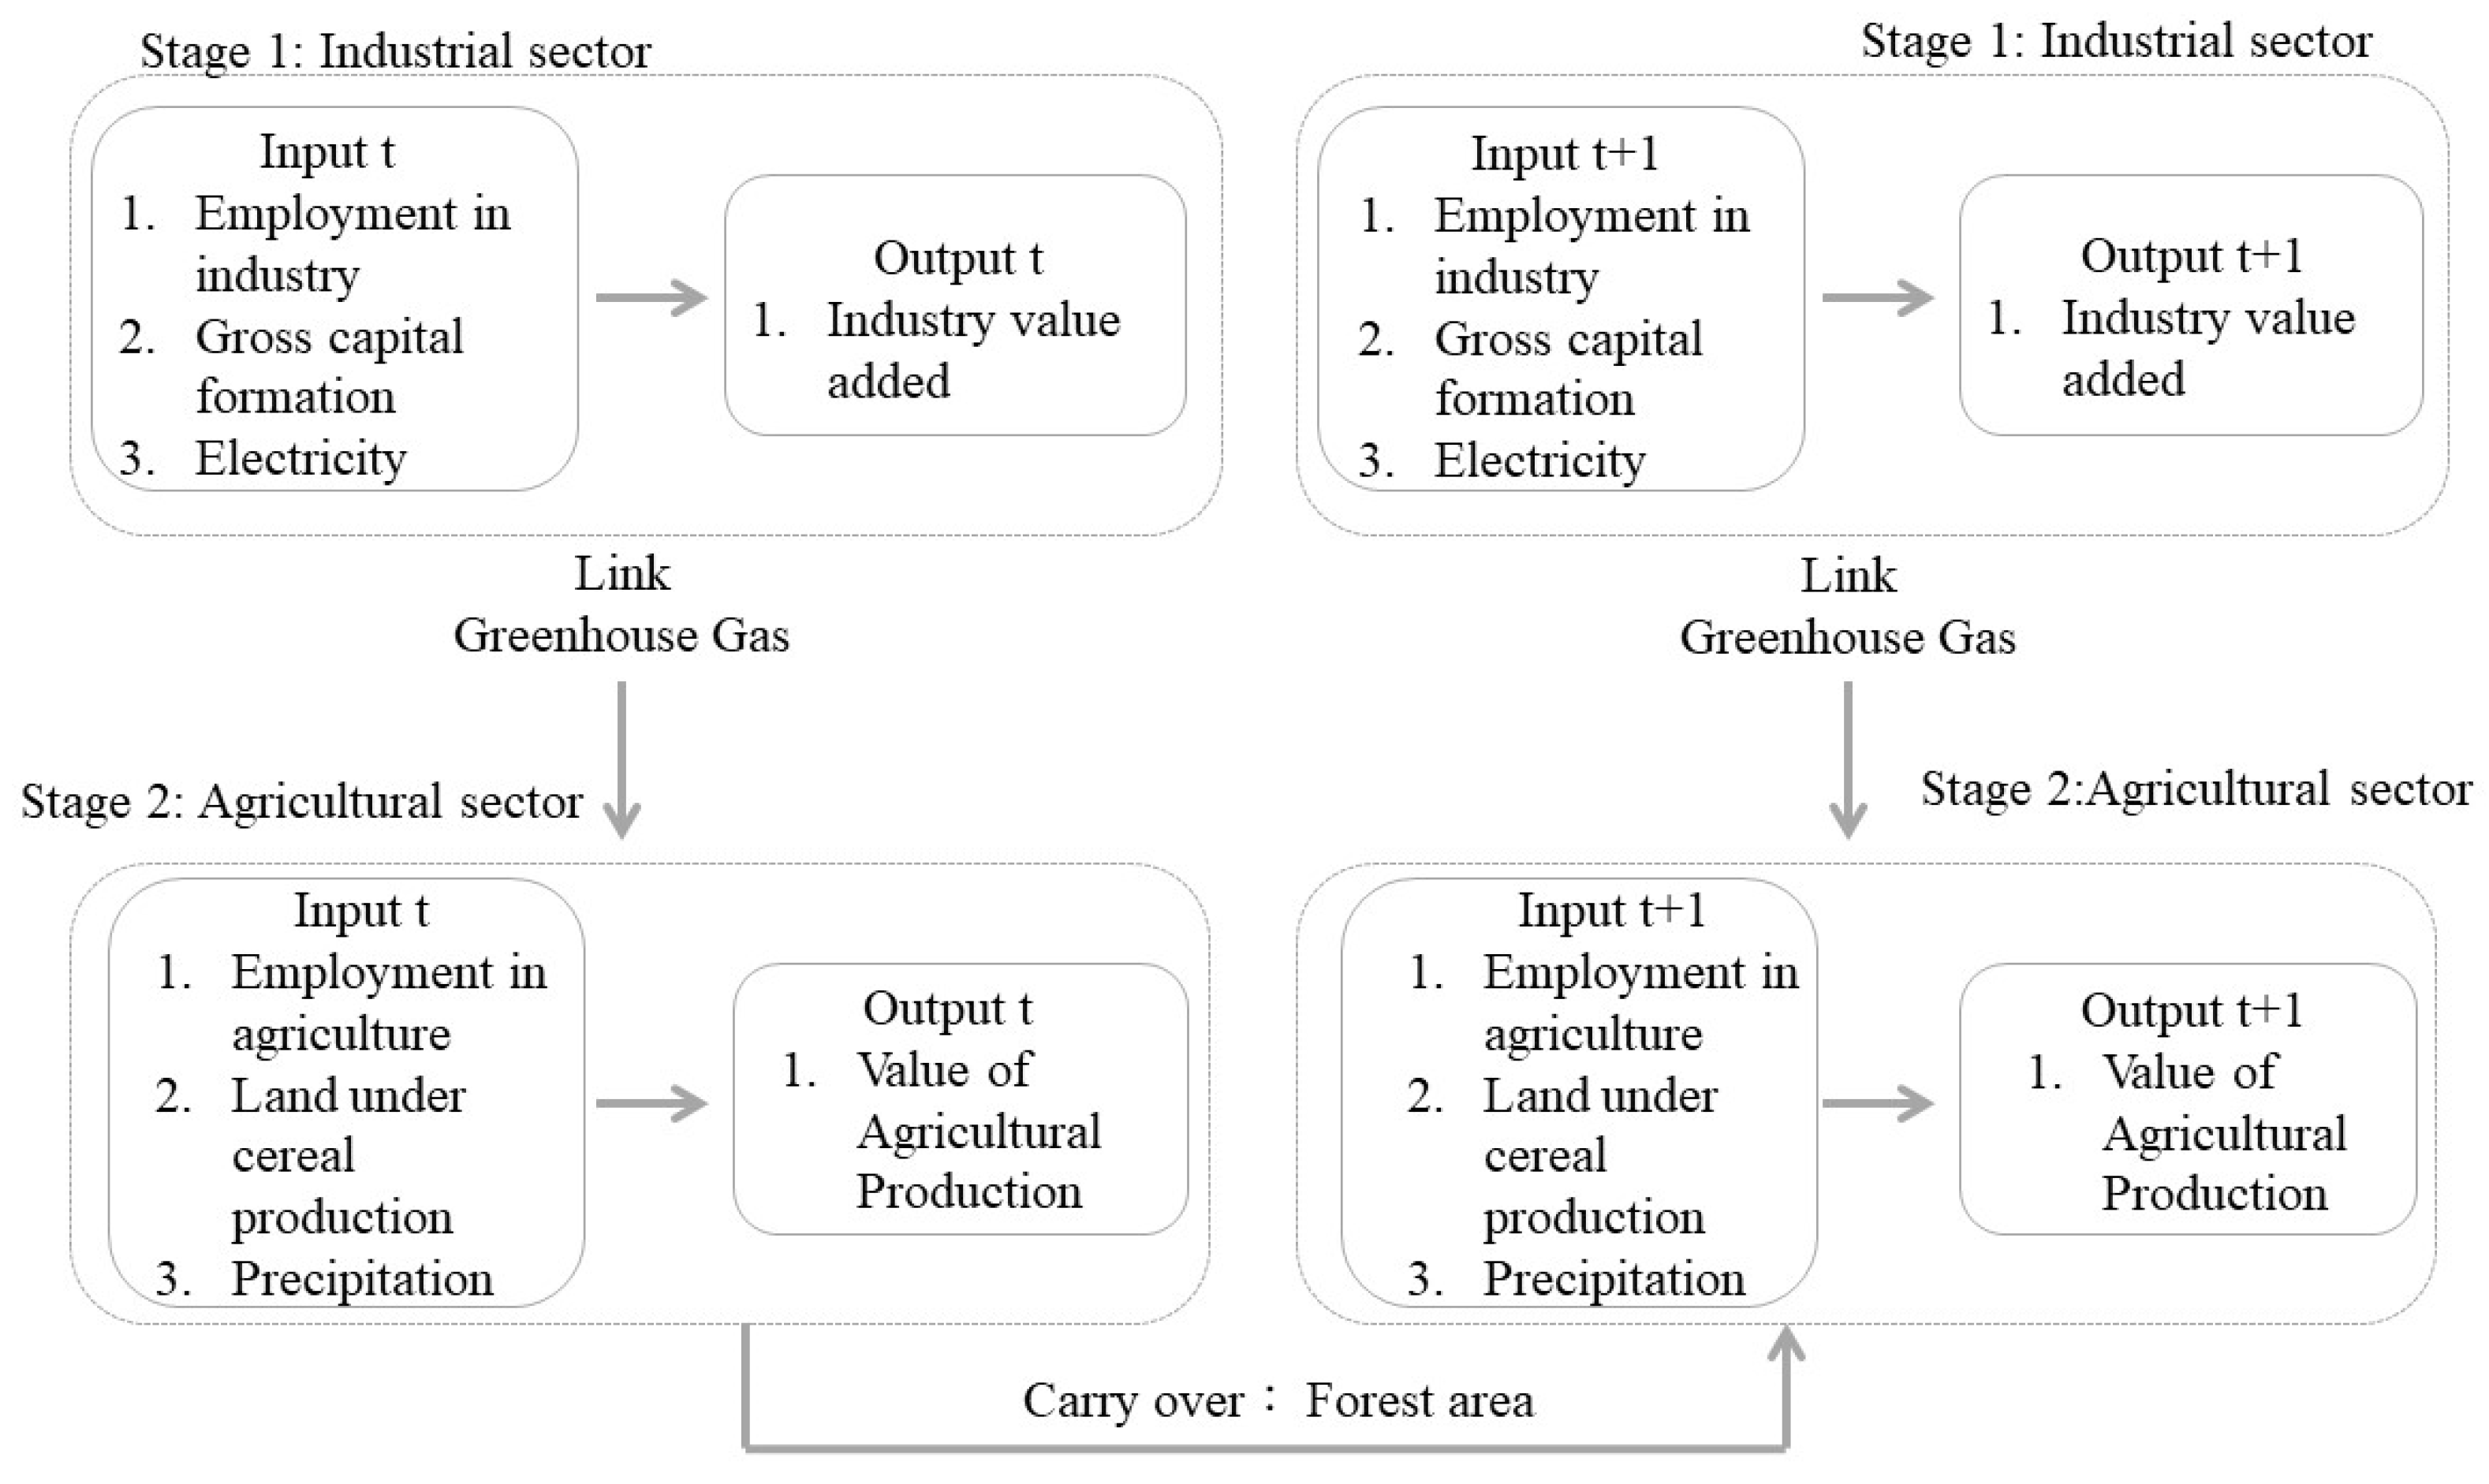
3.1. Dynamic Network SBM, DN-SBM
- (1)
- Inputs and outputs
- (2)
- Links
- (3)
- Carry-overs
Period and Sector Efficiencies
- (1)
- Period efficiency, as is shown in Formula (3):
- (2)
- sector efficiency, as is shown in Formula (4):
- (3)
- Sector period efficiency is defined as follows, as is shown in Formula (5):
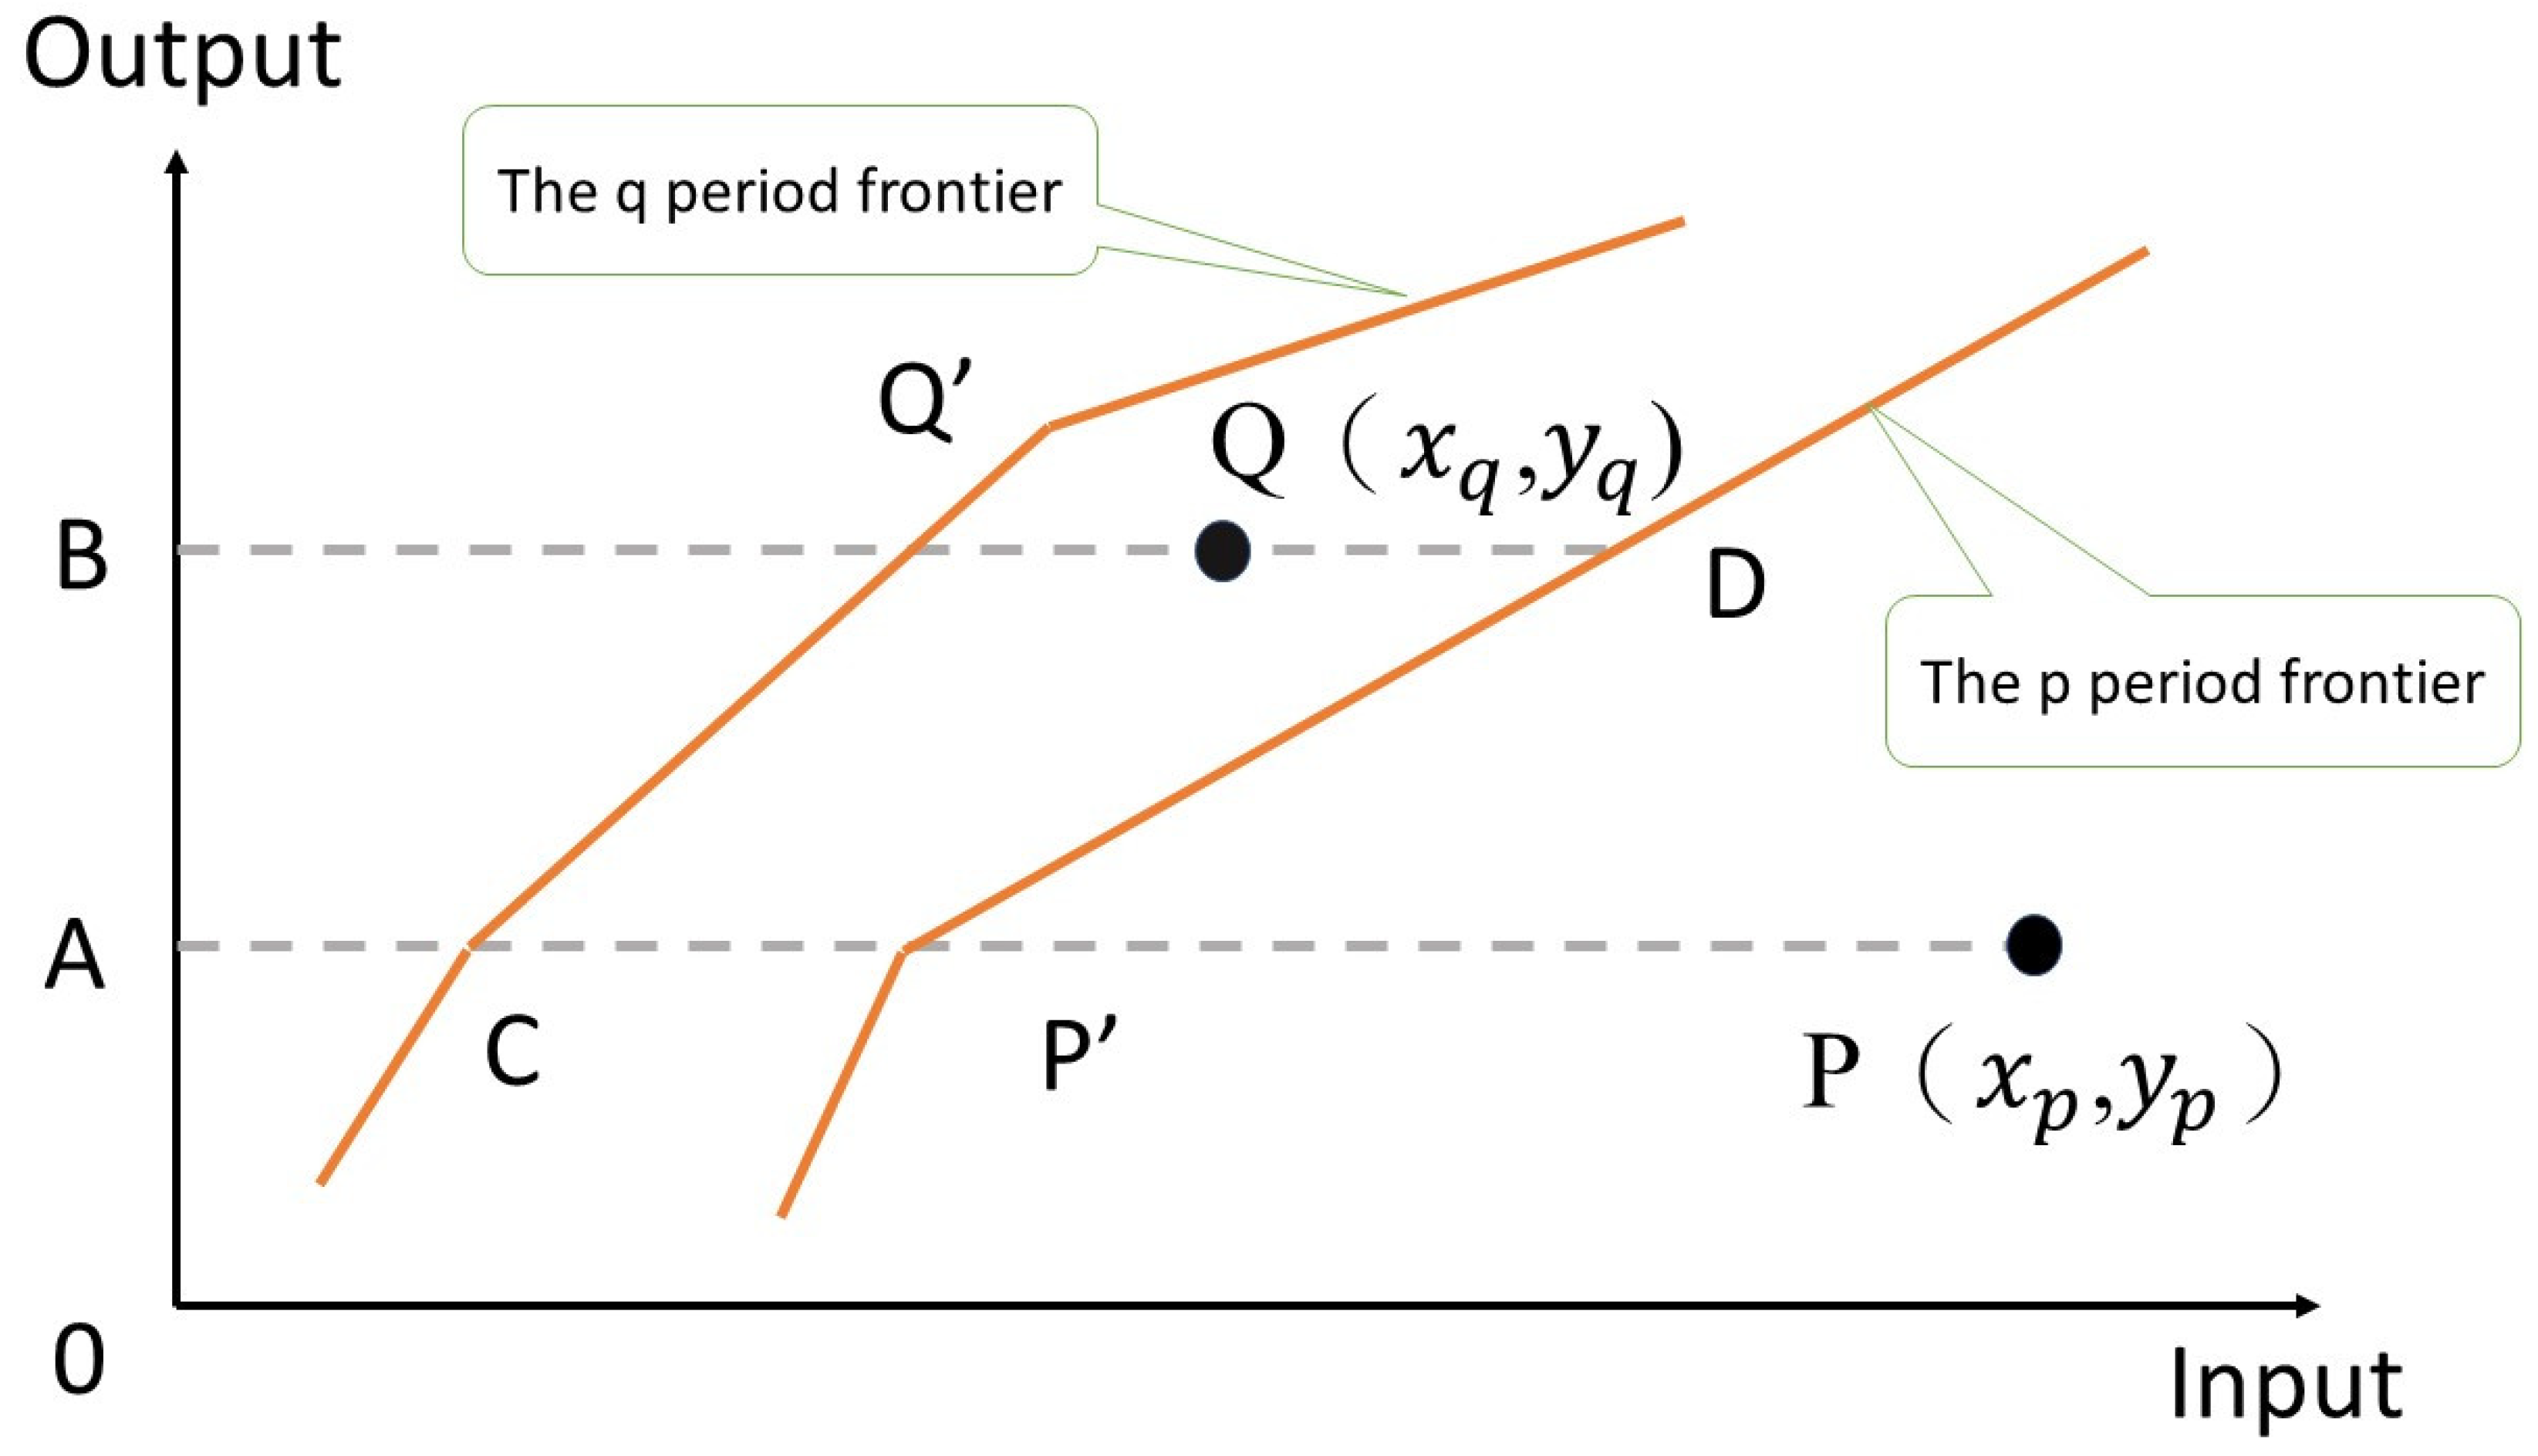
3.2. Dynamic Network Malmquist Total Factor Productivity, DN-TFP
Overall DN-TFP
4. Empirical Analysis
4.1. Data Source
4.1.1. Variable Description
4.1.2. Descriptive Statistical Analysis
4.2. DN-SBM Empirical Result
4.2.1. The Industrial Sector Efficiency
4.2.2. Agricultural Sector Efficiency
4.2.3. DN-SBM Overall Efficiency
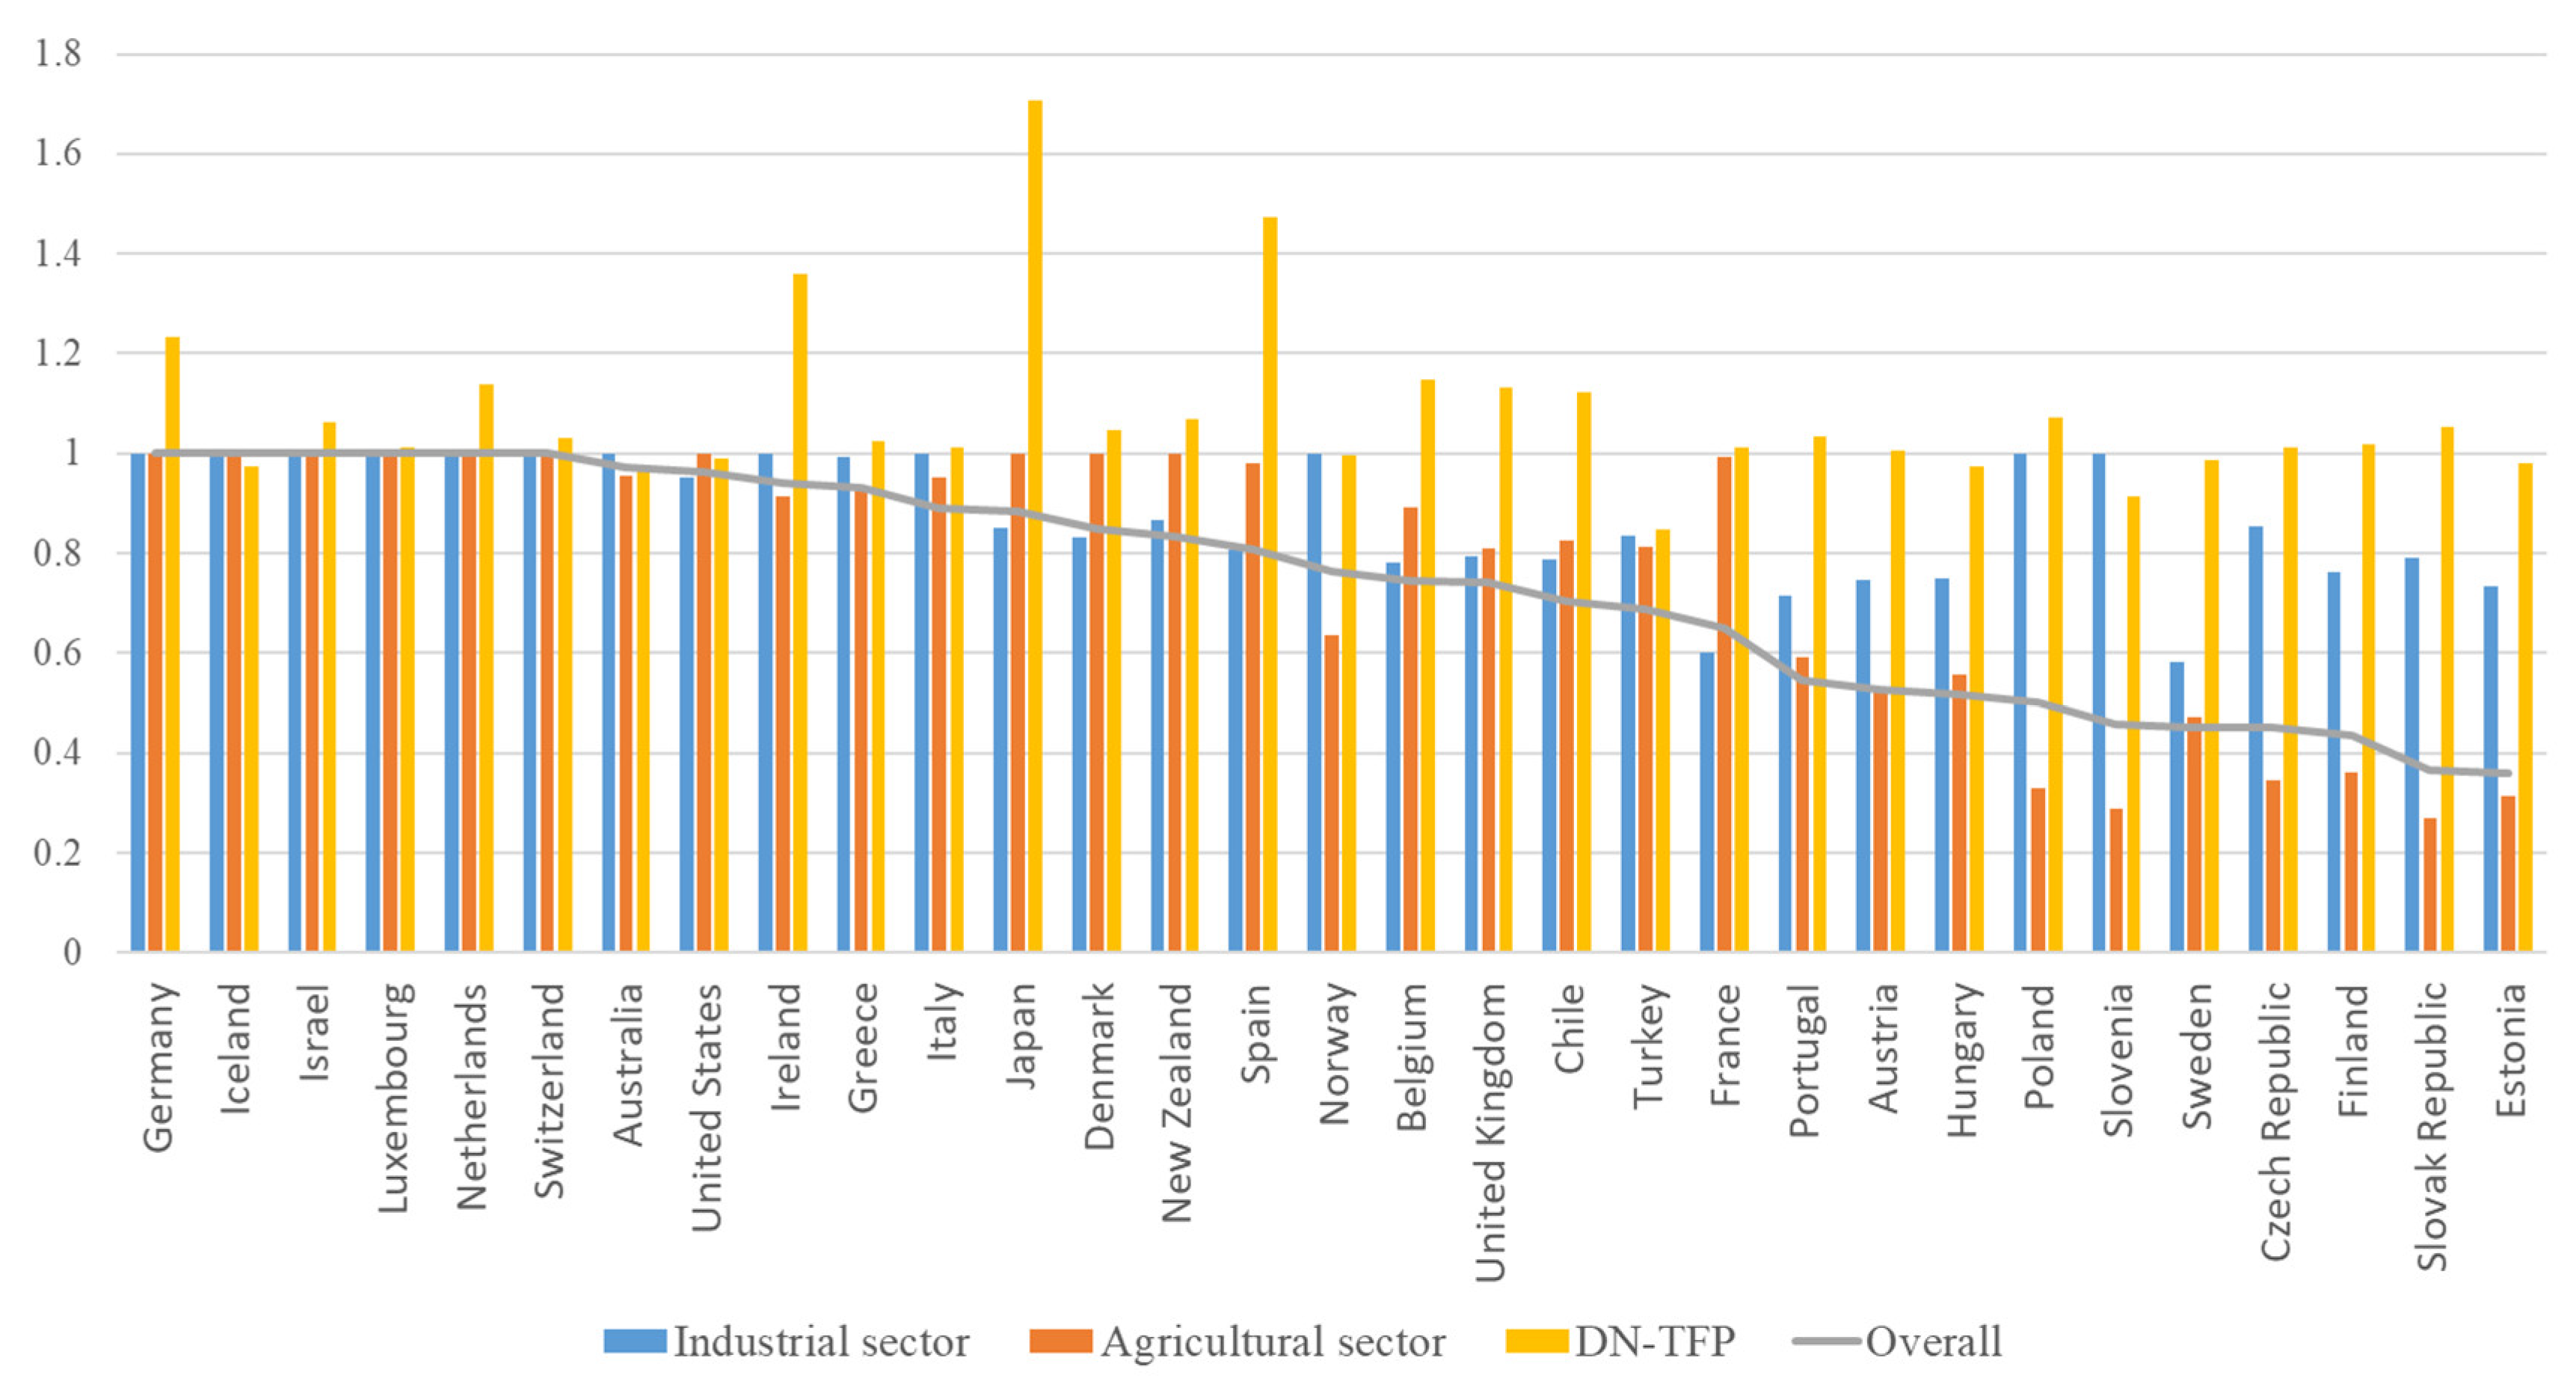
4.3. DN-TFP Empirical Results
4.4. Policy Implications and Discussion
5. Conclusions
- (1)
- The average efficiency value of the OECD industrial sector during the study period is 0.8719, with a maximum value of 1 and a minimum value of 0.5835. The efficiency values of 14 countries are higher than the average level, and the efficiency values of 17 countries are lower than the average level. The countries with the lowest efficiency values are Portugal (0.7147), France (0.6002), and Sweden (0.5835).
- (2)
- The average efficiency value of the agricultural sector is 0.7666, with a maximum value of 1 and a minimum value of 0.2708 and a standard deviation of 0.2730. The efficiency values of 20 countries are higher than the average level, and the efficiency values of 11 countries are lower than the average level. The countries with the lowest efficiency values are Estonia (0.3134), Slovenia (0.2890), and the Slovak Republic (0.2708).
- (3)
- The overall average value of DN-SBM is 0.7411, with a maximum value of 1 and a minimum value of 0.3607 and a standard deviation of 0.2221. The efficiency values of 17 countries are higher than the average level, and 14 countries are lower than the average level. The countries with the lowest efficiency values are Finland (0.4367), the Slovak Republic (0.3649), and Estonia (0.3607).
- (4)
- The DN-TFP average value is 1.0776, indicating a slight improvement trend. Japan (1.7059) shows the best productivity performance, while Turkey (0.8489) has the lowest DN-TFP value with a standard deviation of 0.1681. DN-TFP values for 22 OECD countries are greater than 1, indicating a trend in progress. DN-TFP values for 9 countries are less than 1, indicating a declining trend. The DN-TFP values for Australia (0.9645), Slovenia (0.9126), and Turkey (0.8489) are the lowest.
- (5)
- This study further compares DN-SBM and DN-TFP and finds that the overall efficiency values for five countries, including Germany (1.2333), Israel (1.0617), Luxembourg (1.0131), Netherlands (1.139), and Switzerland (1.0296), are 1, and productivity has improved. Among the three countries with lower efficiency values, Finland (0.4367, 1.0168) and Slovakia (0.3649, 1.0532) have improved productivity, while Estonia (0.3607, 0.9795), with the lowest efficiency value, not only has lower efficiency but also a decline in productivity. Eight countries have a decline in productivity, but there is still room for improvement in efficiency.
Author Contributions
Funding
Institutional Review Board Statement
Informed Consent Statement
Data Availability Statement
Conflicts of Interest
References
- Ferroukhi, R.; Nagpal, D.; Lopez-Peña, A.; Hodges, T.; Mohtar, R.H.; Daher, B.; Mohtar, S.; Keulertz, M. Renewable energy in the water, energy & food nexus. IRENA Abu. Dhabi. 2015, 1–125. Available online: https://www.google.com.hk/url?sa=t&rct=j&q=&esrc=s&source=web&cd=&cad=rja&uact=8&ved=2ahUKEwj0jtGVkoX-AhWesFYBHYYXDy0QFnoECAgQAQ&url=https%3A%2F%2Fwww.irena.org%2F-%2Fmedia%2FFiles%2FIRENA%2FAgency%2FPublication%2F2015%2FIRENA_Water_Energy_Food_Nexus_2015.pdf&usg=AOvVaw0G-XJI-miEvfrQc3zyGql8 (accessed on 1 March 2023).
- Han, D.; Yu, D.; Cao, Q. Assessment on the features of coupling interaction of the food-energy-water nexus in China. J. Clean. Prod. 2020, 249, 119379. [Google Scholar] [CrossRef]
- Lu, C.-C.; Chiu, Y.-H.; Yang, C.-Y.; Lin, T.-Y. Evaluating the energy, health efficiency, and productivity in OECD. Environ. Geochem. Health 2021, 43, 4347–4365. [Google Scholar] [CrossRef] [PubMed]
- Sun, C.; Yan, X.; Zhao, L. Coupling efficiency measurement and spatial correlation characteristic of water–energy–food nexus in China. Resour. Conserv. Recycl. 2021, 164, 105151. [Google Scholar] [CrossRef]
- Zou, W.-J.; Cai, P.-H.; Shen, N.; Lu, C.-C. The technology gap of Chinese regions’ energy efficiency and spatial convergence—Based on the hybrid meta-frontier data envelopment analysis. J. Renew. Sustain. Energy 2015, 7, 023124. [Google Scholar] [CrossRef]
- Bian, Y.; Hu, M.; Wang, Y.; Xu, H. Energy efficiency analysis of the economic system in China during 1986–2012: A parallel slacks-based measure approach. Renew. Sustain. Energy Rev. 2016, 55, 990–998. [Google Scholar] [CrossRef]
- Guo, X.; Lu, C.-C.; Lee, J.-H.; Chiu, Y.-H. Applying the dynamic DEA model to evaluate the energy efficiency of OECD countries and China. Energy 2017, 134, 392–399. [Google Scholar] [CrossRef]
- Chen, L.; Jia, G. Environmental efficiency analysis of China’s regional industry: A data envelopment analysis (DEA) based approach. J. Clean. Prod. 2017, 142, 846–853. [Google Scholar] [CrossRef]
- Ziolo, M.; Jednak, S.; Savić, G.; Kragulj, D. Link between energy efficiency and sustainable economic and financial development in OECD countries. Energies 2020, 13, 5898. [Google Scholar] [CrossRef]
- Liddle, B.; Sadorsky, P. Energy efficiency in OECD and non-OECD countries: Estimates and convergence. Energy Effic. 2021, 14, 72. [Google Scholar] [CrossRef]
- Borozan, D. Technical and total factor energy efficiency of European regions: A two-stage approach. Energy 2018, 152, 521–532. [Google Scholar] [CrossRef]
- Paramati, S.R.; Shahzad, U.; Doğan, B. The role of environmental technology for energy demand and energy efficiency: Evidence from OECD countries. Renew. Sustain. Energy Rev. 2022, 153, 111735. [Google Scholar] [CrossRef]
- Diao, P.; Zhang, Z.; Jin, Z. Dynamic and static analysis of agricultural productivity in China. China Agric. Econ. Rev. 2018, 10, 293–312. [Google Scholar] [CrossRef]
- Adetutu, M.O.; Ajayi, V. The impact of domestic and foreign R&D on agricultural productivity in sub-Saharan Africa. World Dev. 2020, 125, 104690. [Google Scholar]
- Chen, Y.; Miao, J.; Zhu, Z. Measuring green total factor productivity of China’s agricultural sector: A three-stage SBM-DEA model with non-point source pollution and CO2 emissions. J. Clean. Prod. 2021, 318, 128543. [Google Scholar] [CrossRef]
- Wan, B.; Zhou, E. Research of total factor productivity and agricultural management based on Malmquist-DEA modeling. Math. Probl. Eng. 2021, 2021, 1–8. [Google Scholar] [CrossRef]
- Toma, P.; Miglietta, P.P.; Zurlini, G.; Valente, D.; Petrosillo, I. A non-parametric bootstrap-data envelopment analysis approach for environmental policy planning and management of agricultural efficiency in EU countries. Ecol. Indic. 2017, 83, 132–143. [Google Scholar] [CrossRef]
- Rybaczewska-Błażejowska, M.; Gierulski, W. Eco-efficiency evaluation of agricultural production in the EU-28. Sustainability 2018, 10, 4544. [Google Scholar] [CrossRef] [Green Version]
- Agrawal, M. Effects of air pollution on agriculture: An issue of national concern. Natl. Acad. Sci. Lett. 2005, 28, 93–106. [Google Scholar]
- Wang, Z.; Wei, W. Effects of modifying industrial plant configuration on reducing air pollution-induced agricultural loss. J. Clean. Prod. 2020, 277, 124046. [Google Scholar] [CrossRef]
- Wang, Z.; Wei, W.; Zheng, F. Effects of industrial air pollution on the technical efficiency of agricultural production: Evidence from China. Environ. Impact Assess. Rev. 2020, 83, 106407. [Google Scholar] [CrossRef]
- Dong, D.; Wang, J. Air Pollution as a Substantial Threat to the Improvement of Agricultural Total Factor Productivity: Global Evidence. Environ. Int. 2023, 173, 107842. [Google Scholar] [CrossRef] [PubMed]
- González-Abraham, C.; Flores-Santana, C.; Rodríguez-Ramírez, S.; Olguín-Álvarez, M.; Flores-Martínez, A.; Torres Rojo, J.M.; Bocco Verdinelli, G.; Fernández Calleros, C.A.; McCord, G.C. Long-term pathways analysis to assess the feasibility of sustainable land-use and food systems in Mexico. Sustain. Sci. 2023, 18, 469–484. [Google Scholar] [CrossRef]
- Lu, L.-C.; Chiu, S.-Y.; Chiu, Y.-H.; Chang, T.-H. Sustainability efficiency of climate change and global disasters based on greenhouse gas emissions from the parallel production sectors—A modified dynamic parallel three-stage network DEA model. J. Environ. Manag. 2022, 317, 115401. [Google Scholar] [CrossRef]
- Lu, L.C.; Chiu, S.-Y.; Chiu, Y.-H.; Chang, T.-H.; Tang, W. Energy performance of European countries by considering the role of forest. Environ. Sci. Pollut. Res. 2022, 29, 44162–44174. [Google Scholar] [CrossRef] [PubMed]
- Teng, X.; Liu, F.-P.; Chang, T.-H.; Chiu, Y.-H. Measuring China’s energy efficiency by considering forest carbon sequestration and applying a meta dynamic non-radial directional distance function. Energy 2023, 263, 125756. [Google Scholar] [CrossRef]
- Tone, K.; Tsutsui, M. Dynamic DEA with network structure: A slacks-based measure approach. Omega 2014, 42, 124–131. [Google Scholar] [CrossRef] [Green Version]


| Variable | Unit | |
|---|---|---|
| Industrial Sector Input | Employment in industry | Person |
| Gross capital formation | Current Millions of US dollars | |
| Electricity | Gigawatt hours | |
| Output | Industry value added | Current Millions of US dollars |
| Link | Greenhouse Gas | Thousand tons CO2-eq |
| Agricultural sector Input | Employment in agriculture | Person |
| Land under cereal production | Hectares | |
| Precipitation | mm/year | |
| Output | Value of Agricultural Production | Current Millions of US dollars |
| Carry over | Forest area | sq. km |
| Employment in Industry | Gross Capital Formation | Electricity | Industry Value Added | Greenhouse Gas | ||
|---|---|---|---|---|---|---|
| Max | 2015 | 37,445,319.59 | 3,859,763 | 4,109,219 | 33,839,77.115 | 6,689,006.13 |
| 2016 | 37,818,786.61 | 3,844,982 | 4,119,445 | 3,373,013.267 | 6,537,871.03 | |
| 2017 | 39,437,363.87 | 4,558,260 | 4,236,927 | 3,908,533.954 | 6,689,006.13 | |
| 2018 | 39,437,363.87 | 4,558,260 | 4,236,927 | 3,908,533.954 | 6,689,006.13 | |
| 2019 | 39,437,363.87 | 4,558,260 | 4,236,927 | 3,908,533.954 | 6,689,006.13 | |
| Min | 2015 | 39,921 | 3398.974485 | 2738 | 3537.62447 | 4746.024 |
| 2016 | 38,716 | 4384.008718 | 2168 | 4064.186221 | 4692.48 | |
| 2017 | 35,956 | 5376.285015 | 2204.811 | 4846.374721 | 4776.967 | |
| 2018 | 40,384 | 5850.274779 | 2170.172 | 5161.739529 | 4847.088 | |
| 2019 | 38,377 | 5243.821439 | 1877.378 | 4918.171152 | 4713.009 | |
| Average | 2015 | 4,280,958.438 | 299,316.6691 | 289,633.9 | 296,547.8839 | 434,829.016 |
| 2016 | 4,322,013.254 | 303,525.6767 | 291,647.3 | 300,008.4507 | 430,037.309 | |
| 2017 | 4,382,999.656 | 321,048.2218 | 292,560.8 | 315,344.2028 | 429,735.341 | |
| 2018 | 4,447,133.462 | 345,313.9125 | 297,112.1 | 335,314.2987 | 431,342.955 | |
| 2019 | 4,451,693.684 | 352,894.9669 | 294,085.8 | 334,365.6366 | 632,357.843 | |
| St Dev. | 2015 | 7,464,689.608 | 704,040.3221 | 741,776.6 | 636,356.3478 | 1,197,366.58 |
| 2016 | 7,528,023.506 | 706,333.5941 | 743,027.9 | 644,511.2976 | 1,170,671.86 | |
| 2017 | 7,604,771.65 | 742,329.5852 | 737,329.2 | 679,785.36 | 1,163,663.02 | |
| 2018 | 7,726,565.533 | 796,135.8071 | 763,085.2 | 721,168.3267 | 1,194,822.81 | |
| 2019 | 7,789,510.195 | 831,098.8412 | 754,459.9 | 734,050.0275 | 1,623,890.78 | |
| Employment in agriculture | Land under cereal production | Precipitation | Value of Agricultural Production | Forest area | ||
| Max | 2015 | 7,476,523.112 | 58,124,740 | 1940 | 2,790,602.87 | 3,100,950 |
| 2016 | 7,319,259.506 | 58,445,763 | 1940 | 2,722,427 | 3,100,950 | |
| 2017 | 7,489,642.452 | 58,445,763 | 1940 | 2,846,178.41 | 3,100,950 | |
| 2018 | 7,489,642.452 | 58,445,763 | 1940 | 2,846,178.41 | 3,100,950 | |
| 2019 | 7,489,642.452 | 58,445,763 | 1940 | 2,846,178.41 | 3,100,950 | |
| Min | 2015 | 3348 | 1455 | 435 | 2373.82 | 481.6 |
| 2016 | 3309 | 2300 | 435 | 2297.58 | 486.6 | |
| 2017 | 4645 | 2100 | 435 | 2763.93 | 493.8 | |
| 2018 | 3608 | 1500 | 435 | 2838.07 | 500.4 | |
| 2019 | 2414 | 2200 | 435 | 2637.91 | 506.9 | |
| Average | 2015 | 753,733.9634 | 4,489,500.71 | 934.8065 | 253,562.5184 | 217,360.311 |
| 2016 | 745,114 | 4,424,700.419 | 934.8065 | 251,158.6084 | 217,753.913 | |
| 2017 | 747,157 | 4,271,956.129 | 934.8065 | 263,145.9048 | 217,794.477 | |
| 2018 | 731,794.0176 | 4,193,802.097 | 934.8065 | 267,690.7819 | 217,940.652 | |
| 2019 | 713,782.3127 | 4,176,708.194 | 934.8065 | 262,925.7271 | 218,092.742 | |
| St Dev. | 2015 | 1,448,894.294 | 10,797,194.8 | 403.6056 | 509,858.478 | 586,418.715 |
| 2016 | 1,418,468.485 | 10,787,376.53 | 403.6056 | 499,627.1191 | 587,007.838 | |
| 2017 | 1,444,949.138 | 9,988,974.662 | 403.6056 | 518,714.6516 | 586,488.961 | |
| 2018 | 1,402,110.18 | 9,968,133.91 | 403.6056 | 515,326.6791 | 586,468.461 | |
| 2019 | 1,348,335.55 | 9,790,477.275 | 403.6056 | 515,053.9373 | 586,455.652 |
| DMU | Industrial Sector | Agricultural Sector | Overall | DMU | Industrial Sector | Agricultural Sector | Overall |
|---|---|---|---|---|---|---|---|
| Germany | 1 | 1 | 1 | Chile | 0.7874 | 0.8271 | 0.7038 |
| Iceland | 1 | 1 | 1 | Turkey | 0.8353 | 0.8134 | 0.6880 |
| Israel | 1 | 1 | 1 | France | 0.6002 | 0.9945 | 0.6505 |
| Luxembourg | 1 | 1 | 1 | Portugal | 0.7147 | 0.5909 | 0.5447 |
| Netherlands | 1 | 1 | 1 | Austria | 0.7453 | 0.5248 | 0.5257 |
| Switzerland | 1 | 1 | 1 | Hungary | 0.7510 | 0.5587 | 0.5166 |
| Australia | 1 | 0.9564 | 0.9714 | Poland | 1 | 0.3286 | 0.5020 |
| United States | 0.9519 | 1 | 0.9637 | Slovenia | 1 | 0.2890 | 0.4575 |
| Ireland | 1 | 0.9126 | 0.9418 | Sweden | 0.5835 | 0.4729 | 0.4520 |
| Greece | 0.9921 | 0.9339 | 0.9302 | Czech Republic | 0.8533 | 0.3447 | 0.4515 |
| Italy | 1 | 0.9512 | 0.8912 | Finland | 0.7619 | 0.3608 | 0.4367 |
| Japan | 0.8504 | 1 | 0.8839 | Slovak Republic | 0.7898 | 0.2708 | 0.3649 |
| Denmark | 0.8305 | 1 | 0.8484 | Estonia | 0.7325 | 0.3134 | 0.3607 |
| New Zealand | 0.8675 | 1 | 0.8322 | Max | 1 | 1 | 1 |
| Spain | 0.8062 | 0.9813 | 0.8081 | Min | 0.5835 | 0.2708 | 0.3607 |
| Norway | 1 | 0.6366 | 0.7632 | Average | 0.8719 | 0.7666 | 0.7411 |
| Belgium | 0.7802 | 0.8921 | 0.7458 | StDev. | 0.1288 | 0.2730 | 0.2221 |
| United Kingdom | 0.7951 | 0.8113 | 0.7406 |
| DMU | 2015–2016 | 2016–2017 | 2017–2018 | 2018–2019 | Ave. | DMU | 2015–2016 | 2016–2017 | 2017–2018 | 2018–2019 | Ave. |
|---|---|---|---|---|---|---|---|---|---|---|---|
| Japan | 1.2858 | 0.9401 | 1.0719 | 6.5367 | 1.7059 | Luxembourg | 1 | 0.9602 | 1.0961 | 1.0008 | 1.0131 |
| Spain | 1.2384 | 1.1153 | 1.1853 | 2.8674 | 1.4719 | Italy | 0.9305 | 1.0658 | 1.1274 | 0.937 | 1.0117 |
| Ireland | 0.8485 | 1.229 | 1.1257 | 2.9084 | 1.3593 | France | 0.8208 | 1.212 | 1.2907 | 0.8153 | 1.0115 |
| Germany | 0.9443 | 1.0192 | 0.8734 | 2.752 | 1.2333 | Czech Republic | 1.0138 | 1.0338 | 1.0032 | 0.9948 | 1.0113 |
| Belgium | 0.8983 | 1.3411 | 1.3443 | 1.0669 | 1.1465 | Austria | 0.9984 | 1.0388 | 1.0608 | 0.932 | 1.0063 |
| Netherlands | 1.267 | 1.1844 | 0.9733 | 1.1523 | 1.139 | Norway | 0.7691 | 1.3899 | 1.3443 | 0.6851 | 0.9961 |
| United Kingdom | 0.8842 | 1.0322 | 1.0795 | 1.6755 | 1.1335 | United States | 0.9333 | 1.081 | 0.9901 | 0.9627 | 0.9903 |
| Chile | 1.2176 | 1.1579 | 1.1958 | 0.9454 | 1.1236 | Sweden | 0.9759 | 1.0896 | 0.9927 | 0.8996 | 0.9872 |
| Poland | 1.4331 | 0.7494 | 0.666 | 1.8547 | 1.0732 | Estonia | 0.8287 | 1.186 | 0.9405 | 0.9958 | 0.9795 |
| New Zealand | 1.0633 | 1.2644 | 1.146 | 0.8495 | 1.0696 | Hungary | 1.0556 | 0.9924 | 0.9155 | 0.9402 | 0.9745 |
| Israel | 1.1053 | 1.1453 | 0.9629 | 1.0423 | 1.0617 | Iceland | 1.042 | 1.0124 | 0.9801 | 0.8697 | 0.9738 |
| Slovak Republic | 1.0776 | 0.9875 | 1.1845 | 0.9762 | 1.0532 | Australia | 0.9667 | 1.1301 | 0.9775 | 0.8102 | 0.9645 |
| Denmark | 1.1021 | 1.1714 | 0.8275 | 1.1281 | 1.0477 | Slovenia | 1.7484 | 0.6294 | 0.6305 | 0.9994 | 0.9126 |
| Portugal | 0.95 | 1.0522 | 1.0054 | 1.1419 | 1.035 | Turkey | 0.8543 | 0.8135 | 0.6649 | 1.1237 | 0.8489 |
| Switzerland | 0.9886 | 1.0177 | 1.1197 | 0.9975 | 1.0296 | Max | 1.7484 | 1.3899 | 1.3443 | 6.5367 | 1.7059 |
| Greece | 0.9762 | 1.0601 | 0.9992 | 1.0678 | 1.0251 | Min | 0.7691 | 0.6294 | 0.6305 | 0.6851 | 0.8489 |
| Finland | 0.9785 | 1.0715 | 1.014 | 1.0056 | 1.0168 | Average | 1.0386 | 1.0701 | 1.0254 | 1.3850 | 1.0776 |
| StDev. | 0.1996 | 0.1563 | 0.1752 | 1.1220 | 0.1681 |
Disclaimer/Publisher’s Note: The statements, opinions and data contained in all publications are solely those of the individual author(s) and contributor(s) and not of MDPI and/or the editor(s). MDPI and/or the editor(s) disclaim responsibility for any injury to people or property resulting from any ideas, methods, instructions or products referred to in the content. |
© 2023 by the authors. Licensee MDPI, Basel, Switzerland. This article is an open access article distributed under the terms and conditions of the Creative Commons Attribution (CC BY) license (https://creativecommons.org/licenses/by/4.0/).
Share and Cite
Shang, H.; Feng, Y.; Lu, C.-C.; Yang, C.-Y. The Impact of Optimizing Industrial Energy Efficiency on Agricultural Development in OECD Countries. Sustainability 2023, 15, 6084. https://doi.org/10.3390/su15076084
Shang H, Feng Y, Lu C-C, Yang C-Y. The Impact of Optimizing Industrial Energy Efficiency on Agricultural Development in OECD Countries. Sustainability. 2023; 15(7):6084. https://doi.org/10.3390/su15076084
Chicago/Turabian StyleShang, Haiyang, Ying Feng, Ching-Cheng Lu, and Chih-Yu Yang. 2023. "The Impact of Optimizing Industrial Energy Efficiency on Agricultural Development in OECD Countries" Sustainability 15, no. 7: 6084. https://doi.org/10.3390/su15076084