Article

Energy Sufficiency in the Passenger Transport of Lithuania

by
Viktorija Bobinaite
*,
Inga Konstantinaviciute
,
Arvydas Galinis
,
Ausra Pazeraite
,
Vaclovas Miskinis
and
Mindaugas Cesnavicius
Lithuanian Energy Institute, Breslaujos St. 3, LT-44403 Kaunas, Lithuania
*
Author to whom correspondence should be addressed.
Sustainability 2023, 15(7), 5951; https://doi.org/10.3390/su15075951
Submission received: 23 February 2023 / Revised: 17 March 2023 / Accepted: 27 March 2023 / Published: 29 March 2023

Abstract

:
This paper aims to understand the significance of energy sufficiency (ES) in passenger transport for the long-term resolution of energy, climate, and sustainable development issues in Lithuania. It computes related indicators, by fixing the passenger-kilometres (pkm) travelled by various modes of transportation and applying a scenario analysis with the MESSAGE model. The findings indicated that the country’s final energy consumption (FEC) in transportation could be reduced by 21.8% by 2050 due to slowing growth rate of distances travelled by passenger car but increasing use of public transport and bicycles. This would result in a decrease in the growth rate of primary energy consumption (PEC) by half (to 0.3% a year), an increase in the use of renewable energy sources (RES) to 67.2% in the PEC structure, savings of oil products by 6.4 TWh, and savings of new electricity generation capacity by 550 MW. Furthermore, 20 MtCO2eq. in greenhouse gas (GHG) emission reductions could be realised between 2021 and 2050. To take advantage of the potential of ES, the policy measures of passenger car demand containment and a shift to non-motorised and less polluting modes of transportation should be implemented. Furthermore, priority should be given to policy measures that encourage use of public transportation.

1. Introduction

The country’s reliance on fossil fuels imported from unreliable and volatile markets, its poorly diversified energy supply, its high and variable energy prices, its rising energy demand, its irresponsible energy consumption and production, its unsustainable and non-resilient infrastructure, its changing climate, its rising emissions and its untapped potential for competitiveness, growth and employment are crucial issues for Lithuania’s energy [1], climate [2] and sustainable development [3]. In response, the country established short- to long-term objectives. They are primarily focused on improving energy efficiency (EE) and expanding the use of renewable energy sources (RES) in all sectors of the national economy, as well as utilising various forms of sustainable transportation. Specifically, the National Energy Independence Strategy (NEIS2050) [1] requires a 1.5-fold reduction in primary and final energy intensities by 2030 and a 2.4-fold reduction by 2050. EE is intended to be improved through the renovation of multi-family and public buildings, the development of low-energy and energy-efficient industries with the latest and eco-friendly technologies and equipment, as well as the improvement of EE in transport, by renewing the vehicle stock, transitioning to modern and efficient public transportation, optimising transport and alternative fuel infrastructure and electrifying, and utilising alternative fuels. The National Energy and Climate Plan (NECP2030) [4] calls for increasing the share of electricity from RES relative to the country’s total final energy consumption (FEC) to at least 45% by 2030, district heat (DH) from RES to 90%, and fuels from RES in transportation to 15% through the implementation of sectoral measures that promote the production and consumption of energy from RES. All these measures and more are intended to reduce greenhouse gas (GHG) emissions by 70% by 2030 and continue doing so at a rate that would allow the economy to become climate neutral by 2050 [1].
However, the potential of RES and EE as well as various forms of sustainable mobility are underutilised for achieving these goals in Lithuania [3]. New complementary approaches must be identified and implemented. The Association negaWatt [5] proposes prioritising essential needs through energy sufficiency (ES), reducing the amount of energy required through EE and extracting energy from RES. The developed Energy transition scenario 2050 for France [5] revealed that because of ES—referring to absolute reductions in energy demand [6] and ensuring that people’s basic needs for energy services, such as space and water heating, space cooling, cooking, lighting and electrical appliances for washing, drying and freezing are met equitably while respecting ecological limits [7]—the FEC could reduce by 31% and the GHG emissions reach close to zero in 2050 in the country. Moreover, if the ES approach is implemented globally, global warming could be limited to approximately 1.8 °C [5], below the 2 °C [8] required by the Paris Agreement.
A brief review of Lithuanian strategic documents [1,2,3,4] reveals that ES, as a complementary approach to EE, RES, and sustainable mobility, is underutilised in Lithuania, with unknown positive consequences. This approach is mistakenly thought to be incompatible with economic growth models, as well as the concepts of comfort and consumerism [9]. However, the subject is already being researched [10]. Authors of [11] addressed the gaps and potentials of ES in “catching up” European economies by focussing on ES indicators and incorporating their assumptions into energy system models. The potential reduction in residential energy demand, associated GHG savings, and resulting change in the energy mix from limiting the per capita-heated floor area in Lithuania was quantified in [12]. According to the findings, the ES could contribute to the country reaching net zero emissions.
While continuing the research begun, the novelty of this paper lies in the fact that there is no research that demonstrated the role that ES in the largest sectors of the economy can play in achieving energy, climate, and sustainable development goals. In detail, the importance of ES, as a case of modal shift and management of passenger-kilometres (pkm), in the passenger transport in addressing the aforementioned goals is not understood, therefore, remains unclear. Moreover, explicit and transparent methodological principles as to how ES cases, their potential and impacts in that sector should be analysed are absent.
Thus, the research aims to (1) identify the ES indicators for passenger transport and build assumptions determining their sufficiency levels until 2050; (2) quantify the impact of ES in passenger transport on reductions in FEC; (3) assess energy system transformations; and (4) calculate the associated reductions in GHG emissions.
The research findings are useful in terms of disclosing the complementary approaches that facilitate the achievement of mandatory national energy, climate and sustainable development goals. The findings support ES as an important complement to RES and EE in meeting climate change, energy security, and sustainable consumption goals. They discuss relevant policy measures to unleash the ES potential in Lithuanian passenger transport. The research has practical implications for energy policy makers all over the world as energy needs are localized. Using the MESSAGE model to simulate energy scenarios is an important aspect of energy research, which allows for making projections. This paper fulfils this aspect using the case scenario of Lithuania. It is a combination of review and theoretical research, which make the research even more relevant in terms of literature expansion in this area.
The remainder of the paper is structured as follows. Section 2 examines the literature on ES in transportation. Section 3 examines the evolution of fuels and energy consumption in Lithuanian passenger transport. Section 4 introduces the research method, describing the assumptions, scenarios and modelling. Section 5 introduces the analysis’ findings, such as decreases in FEC and primary energy consumption (PEC), changes in the electricity production structure, and GHG emissions; it also discusses the findings. Finally, Section 6 presents the conclusions.

2. Literature Review

In transportation, EE improvements aim to increase energy intensities while covering the same distances with less fuel consumption. Improving EE could aid in maintaining the same level of mobility while lowering the negative environmental impact. However, as Millard-Ball et al. [13] pointed out, increases in EE are frequently offset by increases in travel distances. This is attributable to behavioural responses like the rebound effect [14,15,16,17,18]. As a result, technical solutions alone are unlikely to achieve the required fuel consumption reductions to meet climate change mitigation targets.
ES is one of three options for reducing emissions associated with energy use, along with EE and RES energies. Aside from technological efficiency and the development of RES-derived energies, ES aims to achieve absolute reductions in the use of energy services through behavioural changes. According to Samadi et al. [18], there are two general leverage points for implementing behavioural ES changes. On the one hand, the sufficiency target at the purchase point is a reduction in equipment size. On the other hand, however, the reduction is possible during the usage phase.

2.1. Impact of Energy Sufficient Behaviour during the COVID-19 Pandemic Period

COVID-19 caused worldwide reductions in energy consumption [19] due to government measures restricting unnecessary travel, introducing staying at home and teleworking, and adapting mobility for essential workers and goods [20], which were implemented to control the virus’s spread. Therefore, the passenger transport system was shut down. Safety and health standards have become increasingly stringent. The restrictions impacted people’s lifestyles and daily behaviours, particularly in travel. People began to avoid taking public transportation out of fear of becoming infected. Instead, they began using passenger cars or open-air transportation (bicycles and walking) [21,22,23]. Cycling and walking, telecommuting and online schools were discovered as alternative solutions to the COVID-19 spread [21], revealing that ES-encouraging measures have begun to take off more vigorously.
As a result, domestic and international traffic by all modes of transportation, including electric battery vehicles, has decreased [24,25,26,27]. With rising COVID-19 cases and tighter governmental measures, the number of passengers, service capacity, and travelled distance decreased [23]. Due to the COVID-19 lockdown, the International Energy Agency [28] concluded that global road transport activity would be nearly 50% lower than the 2019 average by the end of March 2020 and commercial flight activity would be nearly 75% lower by April 2020. This significant decrease in transportation activity contributed to a 5% drop in oil consumption in the first quarter of 2020. The COVID-19 pandemic has resulted in significant reductions in aviation and public transportation use, as well as a significant increase in cycling.
Using public transportation was generally discouraged during the pandemic. There were several reasons for this, including regulations imposed on service providers to implement measures (1–2-metre physical distance), which resulted in significant declines in a service capacity of 60% to 90% and governmental guidelines to limit demand to essential travel only [29]. According to the most recent research based on mobility data and passenger counts, there has been a significant decrease in the use of public transportation in many countries. For example, public transportation usage in Sweden has decreased by 40–60% across different regions [30] and in major Chinese cities by up to 80–90% [29]. Public transportation usage in the United States (Nashville and Chattanooga) fell by 65–70% [31]. In Poland, public transportation users fell by up to 77% [32], in Hungary by 80% [33], in the Netherlands by 90% [34], and in Spain and Italy by 93% [35,36]. Public transportation, which was perceived as unsafe, lost ground to private modes and walking [37].
During the pandemic, private transportation provided a social distance advantage, making road users more reliant on private mobility modes (cars, bicycles). During the COVID-19 lockdown, the use of monomodal cars increased from 53% to 66% in Germany [38]. In Switzerland, the average number of kilometres travelled by car per day has decreased by 60%. This was due to home offices [39]. According to studies, those driving private cars are less likely to use public transportation [34]. According to Das et al. [40], more than 80% of car commuters would continue to drive after the pandemic.
COVID-19 also had an impact on rail passenger traffic. According to [41], traffic on both the supply (passenger train-km) and demand (passenger-km, pkm) sides decreased. The impact was more visible on the demand side, with pkm being cut in half by 2020. On the supply side, efforts were made to maintain passenger rail transport for the provision of critical services; as a result, passenger train-km was reduced by 10%. The passenger load factor, which had been steadily increasing until 2019, was reduced by 43% in 2020 to account for 77 passengers on the train. Because of the restrictions on international cross-border travel, the decline in international traffic was more severe than the decline in domestic traffic.
Similarly, the impact on global air passenger traffic was significant [42], owing to numerous flight cancellations and airport closures [43]. Airlines offered only half of the seats in 2020 and passenger numbers fell by 60% [42]. In the two years that followed, reductions were smaller but still significant, demonstrating that civil aviation was far from the pre-pandemic supply and demand levels. Three scenarios on the impact of COVID-19 on future air travel were developed in [44]. The Clean Restart, Green and Clean New Normal scenarios assume ES measure adaptation. Under the Clean Restart scenario, improved communication technologies lay the groundwork for teleworking, resulting in a 20% decrease in business travellers compared to 2019 levels. Additionally, short-distance flights are being phased out in favour of trips via sustainable high-speed rail. Sufficiency-related behaviour will become even more clear under the Clean New Normal scenario. The share of business travellers is expected to decrease due to the widespread use of remote-working practices, increased environmental awareness, and new remote-working technologies, which reduced corporate travel expenses.
River cruises declined in terms of cruise ship transit and passengers from the European Union (EU), especially from abroad in 2020 [45]. The COVID-19 crisis resulted in a modal shift toward inland navigation, which is required to meet the Green Deal’s goals of re-orienting passenger transport away from roads towards more sustainable modes such as rail and inland navigation [46].
The COVID-19 pandemic increased the appeal of cycling as a mode of transportation and recreational activity, demonstrating its resilience in a crisis [47]. During the pandemic, the use of bicycles and walking increased by 22% in India [48]. In Germany, the proportion of bicycle users increased from 6% to 9% [38]. Cycling and bike sharing decreased the least in Hungary (23% and 2%, respectively) [33]. Cycling increased significantly in most European cities, North America, and Australia during 2019–2020 due to programmes developed by cities to promote cycling during COVID-19; cycling levels are likely to remain higher after the pandemic [49].
If changes in transportation behaviour become permanent after the travel ban is lifted, any changes in travel patterns caused by the COVID-19 crisis will have a significant global impact on energy-related emissions. However, Moriarty et al. [50] concluded that reduced travel activity in various emergencies tends to return to pre-emergency levels once the emergency has passed [24]. However, according to Alvik and Irvine [51], COVID-19 has unavoidable consequences, such as reduced office work and altered commuting habits; as a result, transportation energy use will never again reach 2019 levels. Travel consciousness and efficiency, green mobility, and sustainability and mobility mode innovation will impact reductions in private and business-related long-distance travel in the post-COVID period. For example, business-related travel will be reduced by 12% as virtual communications expand [22].

2.2. Impact of Possible Energy Sufficient Behaviour

According to Brand et al. [52], who studied the lifecycle carbon emission effects of changes in travel modes in seven European cities, shifting from car to active travel mode reduced CO2 emissions by 9.28 kg/day and shifting from car to public transportation reduced CO2 emissions by 6.81 kg/day. Using a Computable General Equilibrium model, Duarte et al. [53] discovered that shifting to public transportation is the most environmentally efficient choice for reducing carbon emissions. Based on an in-depth observational study of 50 residents in Cardiff, Wales, Neves et al. [54] discovered that walking or cycling could substitute for 41% of short car trips, saving nearly 5% of CO2 emissions from car travel.
Vita et al. [55] confirmed the most promising sufficiency scenarios by simulating various scenarios in an economy-wide model using Environmentally Extended Multi-Regional Input-Output analysis. According to the modelling results, reducing motorised transportation through remote work and active travel could reduce the carbon footprint by 9 to 26%.
Thus, the literature review reveals that since the start of the COVID-19 pandemic, the ES-driven behaviour promoted by various governmental measures has become increasingly visible in passenger transport. This resulted in reduced supply and demand for various modes of passenger transport, as well as reduced GHG emissions. However, little is expressed in the literature about ES-driven behaviour and perspectives on it from different national contexts. This study fills the gap by considering conditions in Lithuania, considered a European economy that is “catching up” to attain average economic development and thus the consumption level of other EU countries [11].

3. Energy Consumption and Travelling Trends

As illustrated in Figure 1, the Lithuanian economy consumes more and more fuels and energy each year.
Over the last decade, the FEC in Lithuania grew by 1.7% per year, except in 2020, when a 4.4% drop was realised due to the COVID-19 economic lockdown. The economic sectors consumed 5339.3 ktoe in 2020. The transportation sector consumes the most energy and emits the most GHGs. In 2020, this sector consumed 41% of all fuels and emitted 52% of all GHG emissions from the energy sector. Fuel consumption in the sector increased the fastest (by 4.4% per year) between 2010 and 2019 but decreased the most (by 4.1%) in the most recent year. Similarly, GHG emissions from the sector increased by 4.1% per year from 2010 to 2019 but decreased by 2.3% in 2020. Recent development trends dictated by the economy’s lockdown and related behavioural changes point to the possibility of ES in this area, which, with the help of policy measures, could be transformed into a reduction in demand for energy services; thus, the resulting energy savings and reductions in GHG emissions in absolute value could be significant.
As shown in Figure 2, passenger transport consumes the greatest proportion of transportation fuels.
Passenger transport consumes roughly 60% of fuel, corresponding to 903.3 ktoe in 2010 and 1210.0 ktoe in 2019. Consumption increased by 3.3% per year during the studied period. Diesel consumption increased the fastest (by 7.9% per year), reaching 88% in 2019 compared to 45% in 2010. Biofuel consumption increased by 5.5% per year and accounted for 8% of the structure in 2019, whereas LPG and gasoline consumption decreased by 5.4% and 2.2%, respectively. The increasing consumption and high proportion of fuels used in passenger transport suggest that the ES related to the passenger sector is worth further investigation.
Figure 3 depicts the composition of distances travelled by passenger transport mode and the share of public transportation.
Road transport is an important mode of transportation in Lithuania. Road transport accounts for up to 98% of total distance travelled, with rail and rivers accounting for 1.4% and 0.6%, respectively. Only approximately 10% of the total distance is covered by public transportation, demonstrating its low attractiveness for travel. Public transportation is unpopular for a variety of reasons. First, in terms of frequency and transfers, approved timetables are inconvenient. Second, route planning is wasteful. It is impossible to reach the most important locations in the city; there are duplicate routes and some streets do not even have them; and there are too many passengers on a single bus or trolley bus at peak times. Third, dangerous and emergency transportation modes are not fixed, which increases passenger stress and delays. Fourth, the bus park is old, which causes discomfort and low temperatures in the winter and high temperatures in the summer. Fifth, Lithuanians prefer to drive their cars. The trends and fuel structure of energy consumption suggest that ES-driven fuel consumption reductions in passenger transport are worth investigating in Lithuania. Several ES interventions can reduce fuel consumption, the most important of which are related to distance travelled and mode shift.

4. Methodology

The research answers the questions: What is the long-term energy savings potential of ES in transportation? What is the anticipated impact on GHG emissions?
The analysis relied on time series data collected from the databases of Lithuania Statistics [58], Eurostat, ODYSSEE-MURE [57], and the NECPs2030 [4], as well as the NEIS2050 [1], for the period 2008–2020. This 12-year time frame allowed us to identify trends and forecast to 2050.

4.1. The Calculation of Fuel-Saving Potential

The Lithuanian NEIS2050 [1] and NECP2030 [4] were used to establishing key drivers of energy consumption in transportation. Under the Base (non-green) scenario, long-run energy consumption in transport (EECTt) is assessed by factoring in indicators such as GDP, energy price, energy substitution, and energy savings from the previous year into the econometric model developed by the Lithuanian Energy Institute (LEI) [60].
The model considers EE technologies, implying that Baseline scenario estimates include EE potential regardless of ES.
The energy sufficiency-related consumption of a specific transport mode (TM), whether a passenger car (C), a bus or trolleybus (B), rail (R), navigation (N), or air (A), is calculated using the equation:
E S C T T M ; t   = D T M ; t × P t × F E C T M ; t
where E S C T T M ; t is the energy sufficiency-related consumption by a particular TM during year t, ktoe; D T M ; t denotes the distance travelled by a passenger by a TM during year t, pkm per capita; P t denotes the population in year t, persons; F E C T M ; t denotes the average FEC norms of the TM during year t, ktoe/pkm. F E C T M ; t are obtained from the ODYSSEE database [57] and fixed to an average value estimated from 2001 to 2018. The projections of P t are taken from the Eurostat database [61].
Energy savings of soft mobility are calculated by the equation:
E S C T S M ; t = D S M ; d ; t × L S M ; d _ m ; t × L S M ; m _ y ; t × R S M ; t × P t × F E C C ; t
where E S C T S M ; t denotes the energy savings of soft mobility during year t, ktoe; D S M ; t denotes the distance travelled by a person using soft mobility per day during year t, pkm per day; L S M ; d _ m ; t denotes the number of days in a month a person travels by soft mobility, days; L S M ; m _ y ; t denotes the number of months in a year a person uses soft mobility, months; R S M ; t denotes the ratio of bicycle riders to the population; F E C C ; t denotes the average FEC norms of cars during year t, ktoe/pkm. In this research, soft mobility substitutes travelling by passenger cars.
Total energy sufficiency-related consumption in transport ( E S C T T ; t ) is calculated by the equation:
E S C T T ; t = ( E S C T C ; t E S C T S M ; t ) + E S C T B ; t + E S C T R ; t + E S C T N ; t + E S C T A ; t
E S C T T ; t   —total energy sufficiency-related consumption in transport during year t, ktoe; E S C T C ; t —energy sufficiency-related consumption by passenger cars during year t, ktoe; E S C T B ; t —energy sufficiency-related consumption by buses and trolleybuses during year t, ktoe; E S C T R ; t —energy sufficiency-related consumption by rail during year t, ktoe; E S C T N ; t —energy sufficiency-related consumption by navigation during year t, ktoe; E S C T A ; t —energy sufficiency-related consumption by air during year t, ktoe;
E S C T S M ; t —energy savings of soft mobility during year t, ktoe.
The equation for the energy-saving potential of ES is as follows:
Δ E S T T ; t = E S C T T ; t   E E C T T ; t  
where Δ E S T ; t denotes total reduction in fuel and energy consumption due to ES in transport during year t, ktoe; E E C T T ; t   denotes the final fuel and energy demand of transport during year t under the Base (non-green) scenario of NEIS2050, ktoe. E E C T T ; t   includes the impact of EE measures in transportation.

4.2. Sufficient Levels of Indicators during 2025–2050

The “sufficient values” for the selected indicators of distances travelled by a passenger by car, bus and trolleybus, rail, navigation, air and soft mobility are estimated for the period 2025–2050 to build the Sufficiency scenario. These estimates were reported in the Central and Eastern European Climate Targets through the ES research project [10]. They are based on a review of the literature, an examination of economic and socio-cultural trends and policies implemented in the country, a regression analysis and expert consultation. Grubler et al. [62] and Kuhnhenn et al. [63] are used to determine the “sufficient values” of the indicators. The Sufficiency scenario incorporates historical trends as well as projections up to 2050.
Table 1 compares the values of ES indicators in the base year (2017) to their assumed levels in the years 2025–2050.
Following the historically upward trend of distances travelled per capita and following [62], the study assumes that residents cover ever greater distances under “sufficiency” conditions. Grubler et al. [62] predicted a 6.7% increase, whereas this study predicts a 15.9% increase to reach 15,050 pkm in 2050. While Grubler et al. [62] predicted a decrease in the distance travelled by passenger car and a noticeable shift from driving to taking public transportation, this study assumes a longer distance travelled by car and a smaller redistribution in favour of buses, trolleybuses, and trains. It assumes that the share of public transportation will rise from 8.6% in 2017 to 14.6% in 2050, rather than the 24.1% proposed by Grubler et al. [62]. Passenger cars are still the most popular mode of transportation. Grubler et al. [62] forecasted achieving 63% of the structure by 2050; however, in this research, this was set at 76%, translating into 11,500 pkm. The distance travelled by passenger car per capita increases per the power function rather than the linear function, thus best approximating the historical data. It rises as living standards rise, resulting in purchasing homes outside of cities and, as a result, increases in pkm for car-based commuting. Grubler et al. [62] estimated that the per capita distance travelled by buses and trolleybuses would double; this study estimates that the distance would increase by 55%. According to Konstantinaviciute [64], financial support from the Programme for Climate Change for the renewal of public transportation, comfortable timetables and high frequency, priority lines for buses in larger cities, urban electronic tickets lowering travel costs, smart tickets, advanced integrated ticket systems for different transport modes (urban and inter-city distances), or a ban on driving into the city centre can potentially mitigate increased travelling by car. According to [62], it is assumed that a “sufficient” distance travelled by train per capita is 1366 pkm. This study assumes that the country will only move toward “sufficient” distances per capita after the international Rail Baltica infrastructure project is completed in 2026. If passengers are satisfied with complaint handling and accessibility for passengers with limited mobility [65], the country will approach “sufficient” distances travelled by trains. Because of the availability of funds from the European Regional Development Fund, as well as the subsequent renovation of existing infrastructure for bicycle riding and the construction of new bicycle paths (combined with pedestrian paths), soft mobility travel increased by more than two times to 200 pkm in 2050. Although small, it represents a significant 1% of the structure.

4.3. Scenarios and Modelling

The Sufficiency scenario was developed based on the established assumptions per capita pkm of different transport modes.
The mathematical model of partial equilibrium used for the analysis of the long-term development of the energy system and the assessment of EE measures was developed using the MESSAGE software package. The mathematical model is classified as a bottom-up model. Its description is given in [66,67]. Figure 4 depicts the overall scheme.
Fuel supply for heat and electricity systems is determined by existing and future supply infrastructure (pipelines, terminal capacity, natural gas storage facilities, etc.), fuel prices, and volumes. The rationality of local and RES supply for individual technologies of heat and electricity supply systems is addressed, taking into account the potential and prices of these resources.
Using this mathematical model for DH systems in individual cities, the most cost-effective heat generation technologies (existing, modernised and new) and used fuels are chosen, the volumes of heat and electricity generation in separate periods (seasons, separate time intervals) and relevant fuel consumption are calculated and issues of reserve power, compliance with energy production technologies and/or adaptation to the environment are addressed. Each city searches for heat generation technologies (in a hydraulically insulated district heating system) among many existing, modernised, and new technologies that could be installed in the city at any time. The efficiency of technologies is measured in terms of the cost of installation, fixed and variable operating costs, available fuels and efficiency factors, service lifetime and construction time, and environmental characteristics. The link with the power system is investigated through the capabilities of cogeneration plants to meet end users’ constantly changing electricity demand and ensure the necessary reserve capacities while also participating in meeting fluctuating heat demand and electricity consumption in electric water heating boilers and heat pumps.
Similarly, in the power system, similar issues of optimal selection of electricity generation technologies and their rational use are addressed. Electricity and reserve capacities, exchange possibilities and expediency with separate foreign countries, which are determined by the needs of neighbouring countries’ electricity markets (exports from Lithuania) or supply possibilities (imports to Lithuania), electricity prices, and transmission line capacity, etc., are also assessed.
Changes in heat and electricity demand, as well as the availability of RES (wind, hydropower and solar energy), are assessed using multi-year monitoring of natural processes (outdoor temperatures, changes in river aquifers, solar radiation and wind speeds). The annual demand for various types of energy in separate markets corresponds to forecasts of the country’s final electricity and district heating demand.
The mathematical model estimates energy policy provisions (such as RES deployment, energy security requirements expressed through diversification of PEC, etc.), external factors (such as the volume of electricity to be imported in foreign markets, etc.) and environmental obligations (such as GHG emissions, etc.). These factors are considered in the solutions and their potential impact is reflected in changes in the optimal fuel and energy balance, the structure of energy-generating power or environmental technologies, investments in the future development of the energy sector, operation cost and other factors.
Even though the MESSAGE is a cost-minimising mathematical optimisation model and the cost is an important factor in determining the best solution, the model did not explicitly model ES. This is due to a lack of information about the costs and benefits. As a result, the cost of ES implementation was not considered. Instead, ES was applied exogenously by lowering the final energy demand by ΔESTT;t. Using this method, we analysed the implementation of EE technologies with or without ES in passenger transport. The price of CO2 fluctuates in the model, rising from 52 EUR/t in 2020 to 104 EUR/t in 2030 and remaining constant until 2050. Under such constraints, modelling results should be interpreted as indicating the direction and scale of potential ES impacts.

5. Results and Their Discussion

The figures below depict the results of modelling with the above ES assumptions.

5.1. Impact on Energy Consumption

Figure 5 depicts the potential for fuel savings in Lithuanian passenger transport from ES.
The estimated fuel savings from ES in Lithuanian transport in early 2030 is 7.8% per year, representing 100 ktoe of oil products saved in passenger transport. They increase every other year, eventually reaching 21.8%, or 550 ktoe, in 2050. This equates to an 8.2% decrease in FEC in 2050, compared to a 2.6% decrease in 2025. ES achieved in passenger transport saves approximately 10 Mtoe of oil products over time. Because oil products are imported, fuel savings demonstrate improved energy security.

5.2. Impacts on the PEC

Figure 6 depicts how ES in passenger transport affects PEC.
PECs will grow regardless of scenario (a) or (b). Growth rates will be twice as slow in the Sufficiency scenario as in the Baseline scenario, 0.3% vs. 0.6%. In 2050, the Baseline scenario will consume 86.2 TWh of primary energy, but the Sufficiency scenario will consume 79.3 TWh. In the structure, RES will be dominant. In 2050, RES will account for 67.2% of total energy consumption in the Sufficiency scenario, compared to 62.7% in the Baseline scenario. Solar energy consumption will increase the most (9.6% per year), followed by biofuels (7.9%) and wind energy (6.5%), while oil and gas consumption will decrease by 1.9% and 0.8%, respectively. Primary fuel savings will be achieved (c). The most significant savings will be in oil products (6.4 TWh in 2050). Annual savings in biomass, wind and solar energy will be realised. However, because of ES in passenger transport, additional gas consumption and waste heat will be required in the 2040s.

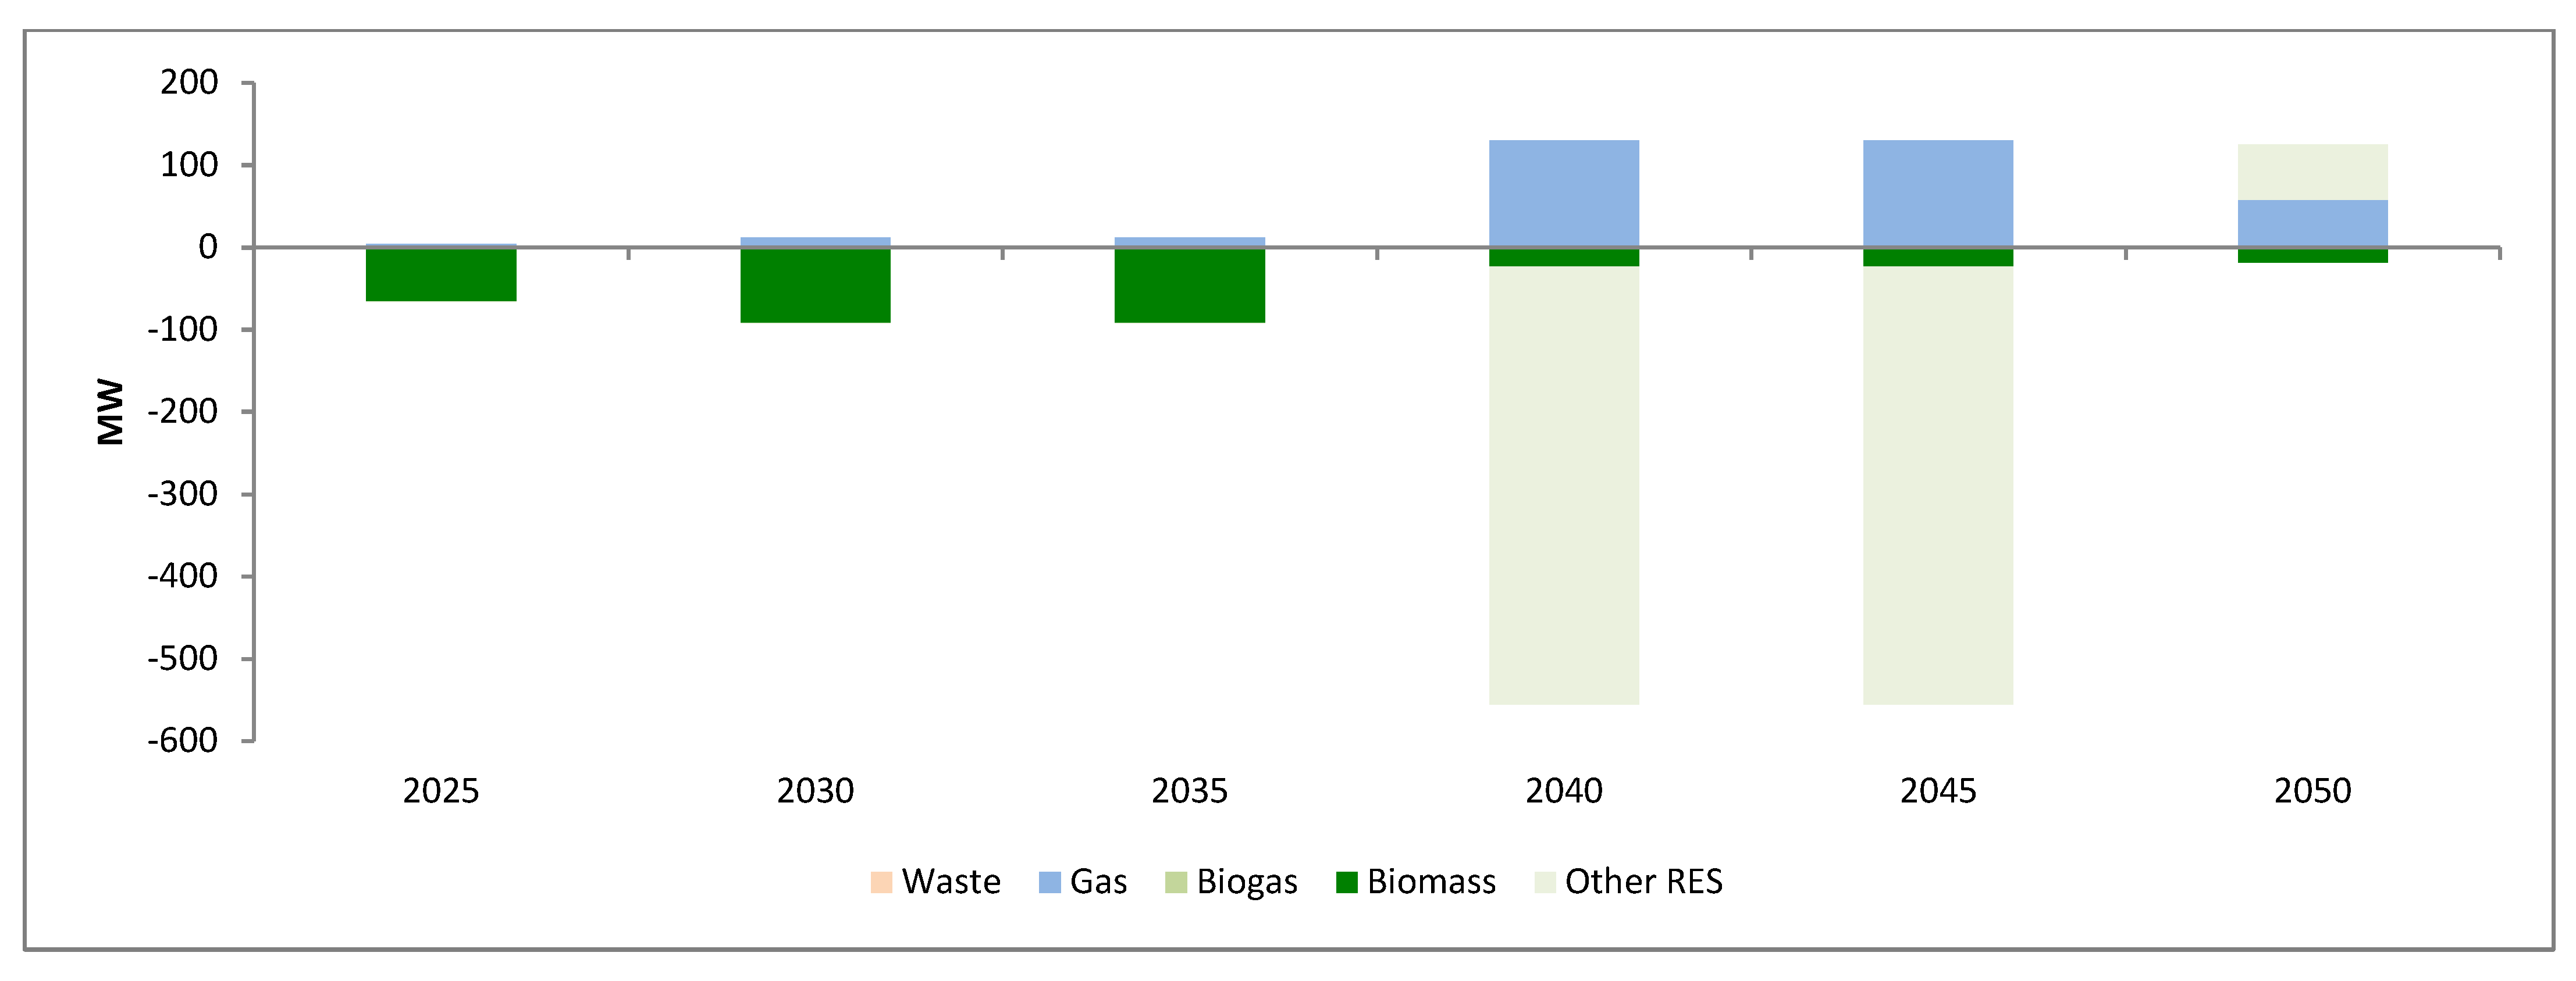
5.3. Impacts on the Electricity Production Mix

Reduced fuel and energy consumption in passenger transport causes changes in electricity production. Figure 7 depicts projections of final electricity demand and electricity production by fuel type under the Baseline (a) and the Sufficiency (b) scenarios, as well as the expected changes (c) in Lithuania.
Under any scenario (a) or (b), long-term final demand for electricity will increase by 1.5%. It will account for 17.77 TWh by 2050. Domestic production will increase by 6.4% per year to meet the rising demand. As a result, the country will produce 24.8 TWh of electricity by 2050. Furthermore, net imports will be reduced. Under the Baseline scenario, the country will transition from net electricity importer to net exporter by 2030, whereas the Sufficiency scenario will take another decade. Electricity produced from biogas will grow the fastest (37% per year) under the Sufficiency scenario (b), but its share will remain the smallest (1.4%) in 2050. Electricity from gas will grow at a 7.7% annual rate until 2045, followed by a nearly threefold decrease, but with a 6.8% share in 2050. Other RES will grow at a 6.9% annual rate and dominate the electricity production structure (79.3% in 2050). During this period, the share of renewable energy in the production structure will rise from 18.2% in 2017 to 89.8% (2050). Savings of electricity produced from other RES and biomass will be realised because of ES in passenger transport, while this will necessitate additional production of electricity from gas and waste (c).
Given the anticipated developments, changes in the total installed electrical capacity in PPs will be requested, as shown in Figure 8.
Increasing the consumption of energy services in passenger transport will reduce the total installed electrical capacity of PP in Lithuania by nearly 550 MW, primarily affecting other RES and biomass energy, while increasing gas consumption-related electrical capacity of PPs by nearly 130 MW.

5.4. Impacts on Greenhouse Gas Emissions

ES achieved in passenger transport reduces CO2 emissions in Lithuania, as shown in Figure 9.
CO2 emissions were reduced by 0.4–1.7 MtCO2eq. (3.8–20.8%, respectively) per year mainly because of the reduction in oil product consumption, saving approximately 20 MtCO2eq.

5.5. Consideration of Results

In [68], a typology of consumption changes that sufficiency could trigger was developed and the sufficiency practices across consumption categories were identified. Following them, this paper referred to a particular case of the established theoretical comprehensive classification—the absolute reductions and the mode shift in transportation. In [68], it was observed that absolute reductions are difficult to achieve. Instead, it is better to focus on a mode shift. This study contributes to the findings and clarifies them. In detail, it quantified the consequences of a mode shift and limitedly growing pkm (pay attention to this: according to [68], travelling shorter distances are proposed for that purpose) in Lithuanian passenger transport and demonstrated the savings but not the absolute reductions in FEC and PEC and associated GHG emissions. Findings are in line with results obtained in [10,69,70,71,72,73], where both a mode shift and other ES cases are analysed based on assumptions on national context and the mastered modelling tools. Specifically, in [10], the Hungarian case was presented. The modelling by partial equilibrium model, known as TIMES, results demonstrated that a mode shift induced decreases in private car use, resulting in 2.6% lower energy consumption in 2050, while significantly higher savings in energy use (by 10%) is achieved due to reduction in overall transport demand. This allows achievement of cost savings of 1800 million EUR. In [69], the potential energy demand reductions due to ES related behavioural changes in transport sector were quantified from the existing literature. It was found that energy demand could reduce from 21.7% (Low Ambition scenario) to 30.9% (High Ambition scenario) in the transport sector. Furthermore, in [70], it was estimated that due to implementation of an integrated public transportation plan, fuel consumption could decrease by 37.5% and related CO2 emissions by 34% in cities in Indonesia. Other results are less comparable to ours, although meaningful in this context, as they are expressed in absolute volumes. For example, in [71], it was calculated that, if public transport seat occupancy in Swedish cities could be increased to average European levels and nonmotorized mode (cycling and walking) use could be increased to 50%, 533.3 million liters of fuel could be saved, which is significantly less than 788.1 million liters saved because of doubled public transport seat occupancy. In our research, we calculated that ES influences changes in the electricity production mix toward self-supply, an increase in the share of RES, and savings in RES capacity. The latter finding is in line with results of [69], who assessed the Germany national context and found that due to ES related behavioural change, a renewable capacity reduction of between 21.7% and 30.6% is possible, as well as related cost savings could be achieved, which was not addressed in this paper.
Therefore, as the NEIS2050 [1] mandates, ES in the passenger transportation reduces the negative effects of climate change and air pollution and enhances the nation’s energy reliability and security. Complementary to that, it contributes to ensuring environmental quality and the sustainable use of natural resources, mitigating Lithuania’s impact on climate change and enhancing its resistance to its effects, as required by the National Progress Plan for 2021–2030 [3]. Furthermore, it promotes reducing reliance on fossil fuels, as required by the NECP2030 [4]. Additionally, ES could provide extra benefits to the nation. Best et al. [72] argue that the benefits of ES could manifest in multiple ways, such as avoiding the transgression of planetary boundaries, mitigating the unintended side effects of other sustainability strategies, fostering sovereignty and resilience, enhancing health and well-being, promoting justice and freedom, and saving time or money. ES usage can also have a positive effect on decreasing energy prices. ES-driven decrease in energy usage results in lower resource demand (oil, natural gas, etc.) and lower energy prices that are produced by using those resources. The year 2020 can be considered a higher ES year because of COVID-19 restrictions. In the same year, electricity market prices in Lithuania decreased by 26% compared to 2019 (Figure 10).
In 2021, an average hourly electricity market price significantly grew from 34 EUR/MWh to 90 EUR/MWh. An electricity price drop during a higher ES year, 2020, and growth during the year after indicates a potential connection between ES usage and energy prices. However, the above-presented example only explores the relationship with electricity price, and further research needs to be done to understand the ES effect on prices of other energy types, including heat.
Compared to Lithuanian households, the country’s passenger transport has a greater ES potential in terms of energy savings and reductions in GHGs [12]. Due to the decrease in per capita floor area, households could save 2.5 Mtoe of energy between 2021 and 2050, while passenger transport could save up to 10 Mtoe of energy by regulating the pkm and organizing the mode shift.
For passenger transport, it is necessary to develop ES-oriented policy strategies to unleash its energy-saving potential and initiate the necessary changes to achieve the aforementioned national goals. According to Shortall et al. [74], three distinct policy strategies could be implemented. These strategies encourage travel avoidance, mode shift, and improvement of travel quality. Based on Best et al. [75]’s findings, strategies for reducing trips and individual motorised transport, promoting active modes, enhancing public transportation and multimodality, or establishing sector limits could be developed. These could include measures promoting teleworking, cycling and walking, informing employees about commuting impacts, reducing commuting trips or parking in public spaces, increasing shared mobility, increasing the cost of car use, increasing the density and frequency of public transportation, public transportation funding, attractive public transportation prices, etc., as well as short- to long-term fiscal, economic, information, education, and regulation instruments or voluntary agreements. Specifically, infrastructure development, awareness-raising, and information campaigns are proposed for Lithuanian passenger transport [10], considering Lithuanian conditions (Figure 11).
According to Konstantinaviciute [64], policy measures should focus on demand control and the transition to non-motorised and less polluting modes of transportation. Priority should be given to the one that encourages public transportation. A combination of policy measures addressing the density, diversity and supply of attractive public transportation should be proposed, including its extensive coverage, integration of different modes, high frequency, ticketing, comfort, safety, security, information, and dependability. To manage automobile travel and its effects, car taxes, congestion fees, parking fees and road tolls must be implemented. To reduce fuel consumption, speed limits should be enforced [6], and cars should be restricted from certain areas (city centre). Given the ages of the existing transport parks in the country, financial support should be provided for its replacement with an eco-friendly alternative. The development of soft mobility infrastructure would increase the number of bicycle and pedestrian trips. The COVID-19 lockdown demonstrated that teleworking and flexible work hours should be options. This could be accomplished via the home office IT equipment subsidy, subsidised energy bills, company tax credit, etc. [74]. These measures may be accompanied by education and awareness campaigns.
This study has some limitations. First, it emphasised the significance of limitedly rising pkm travel and mode shifts on the assumption that residents will travel significantly less than predicted by the PRIMES model. Second, ES indicators were developed based on literature-derived assumptions, regression analysis and comparison with the EU average, which may not account for the vast potential of passenger transport. Third, analogous to the analysis of ES in Lithuanian households, the modelling relied on national averages for the selected ES indicators, which conceals the diversity of travelling practices among different age or income groups. In fact, achieving sufficiency may increase pkm and consumption of energy services for some, while decreasing these for others. The limitations of ES modelling are expected to be resolved soon. A cost–benefit analysis could be used to assess the effects of ES. Future research may include additional ES indicators.

6. Conclusions

This paper investigated the role ES in passenger transport could play in resolving the most pressing energy, climate, and sustainable development issues in Lithuania until 2050, including an increasing demand for energy, a lack of energy reliability and security and an unsustainable use of resources. Findings revealed a variety of changes due to transition towards ES. In detail,
-
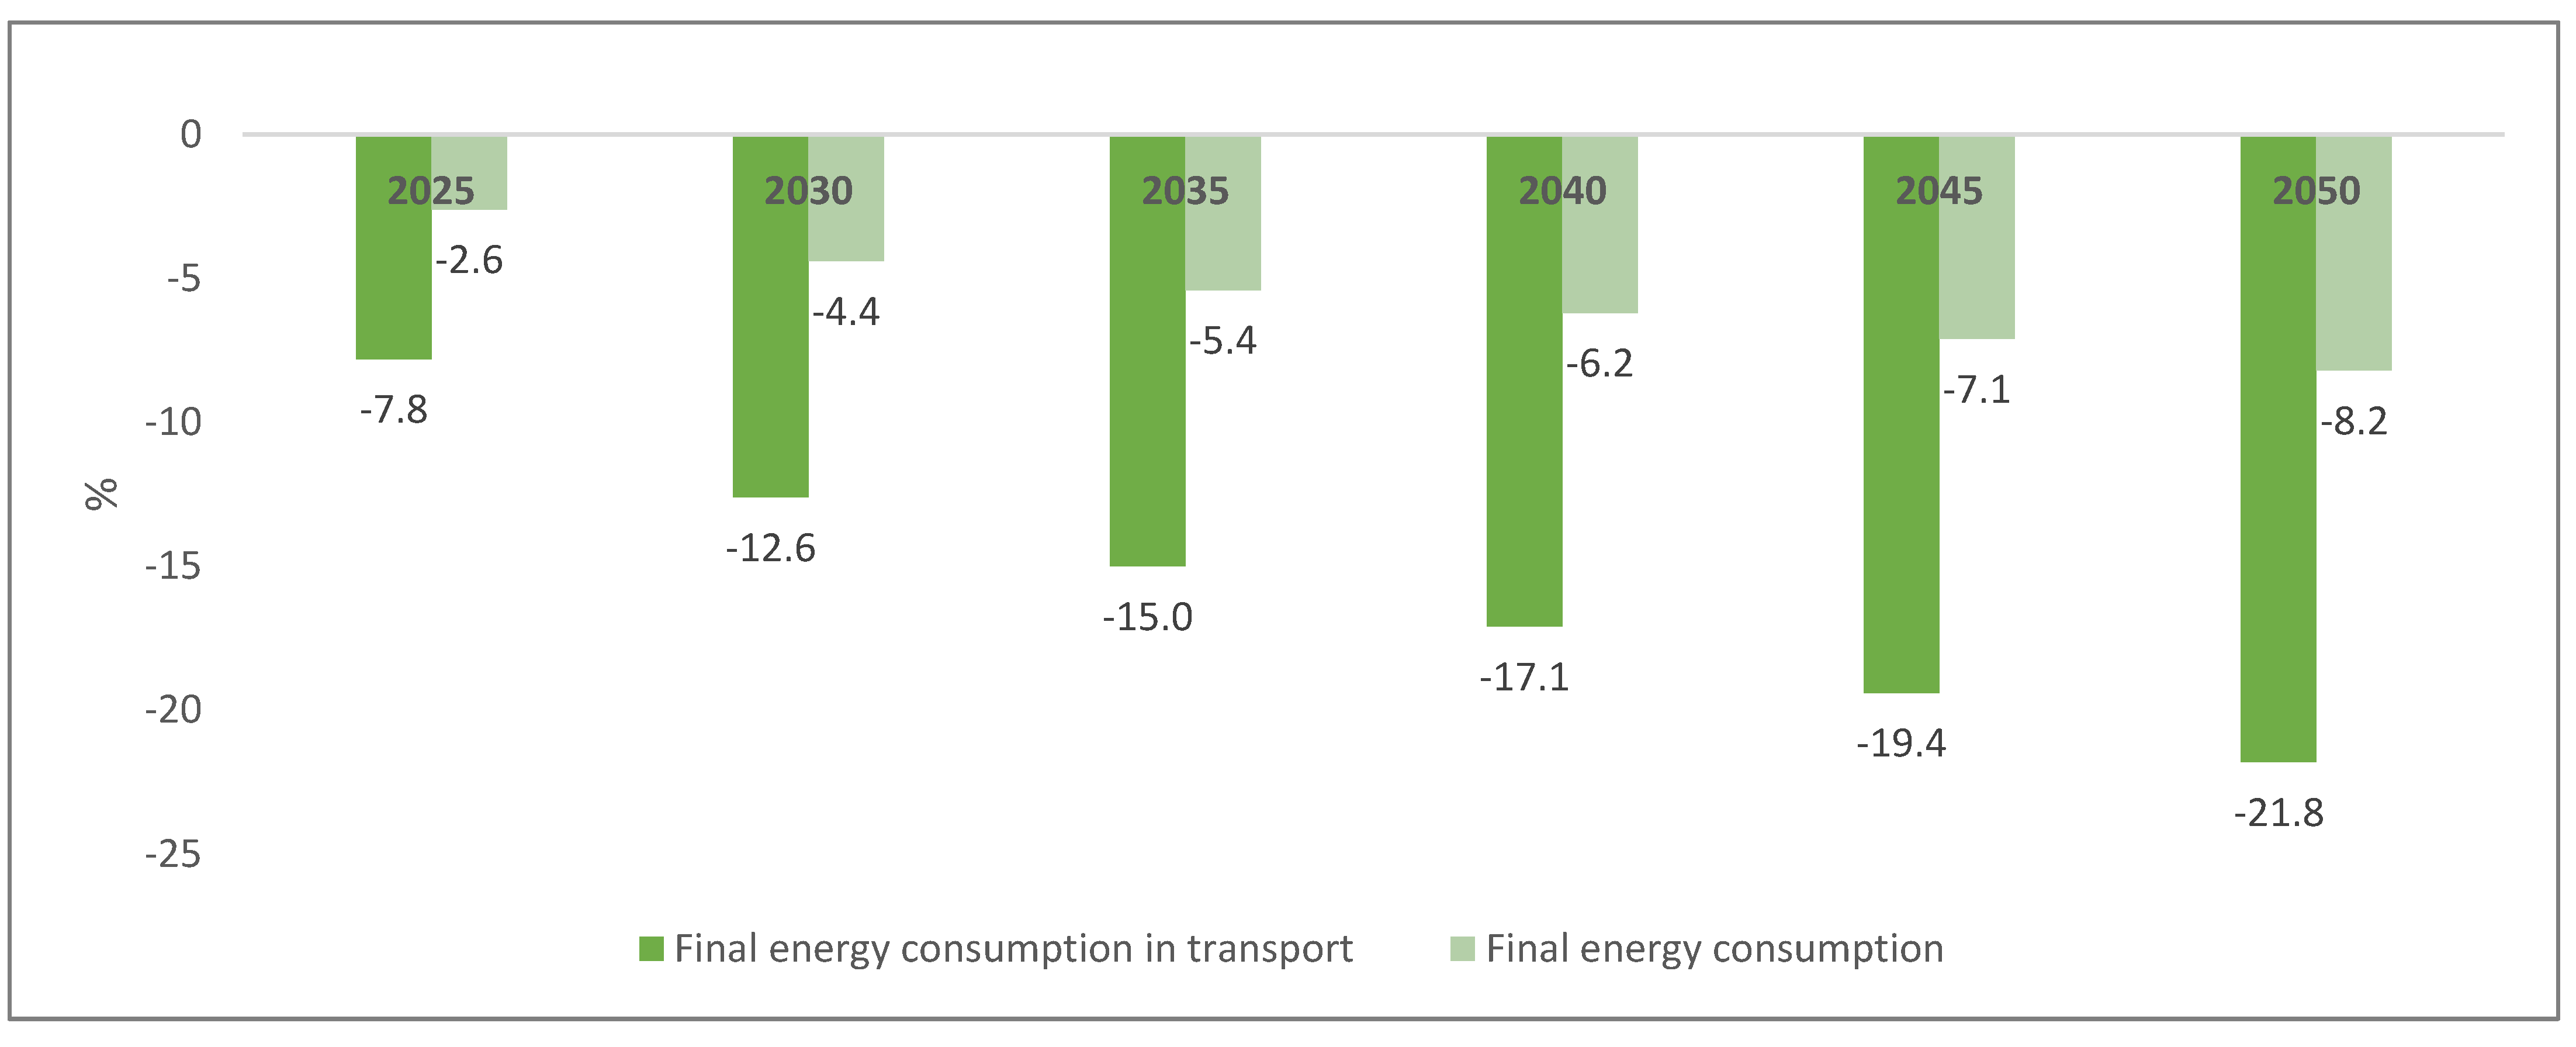
Quantifying the impact on energy consumption revealed that wider use of public transportation and bicycles, as well as slowing the growth rate of passenger car travel will have an impact on better management of pkm in the passenger transport sector. This could result in final energy savings and thus slow the growth of energy consumption in the sector, which is the country’s largest energy consumer. As a result, in 2050, it is possible to save 550 ktoe of energy, equivalent to an 8.2% reduction in FEC. Furthermore, between 2021 and 2050, 10 Mtoe of energy could be saved in transportation.
-
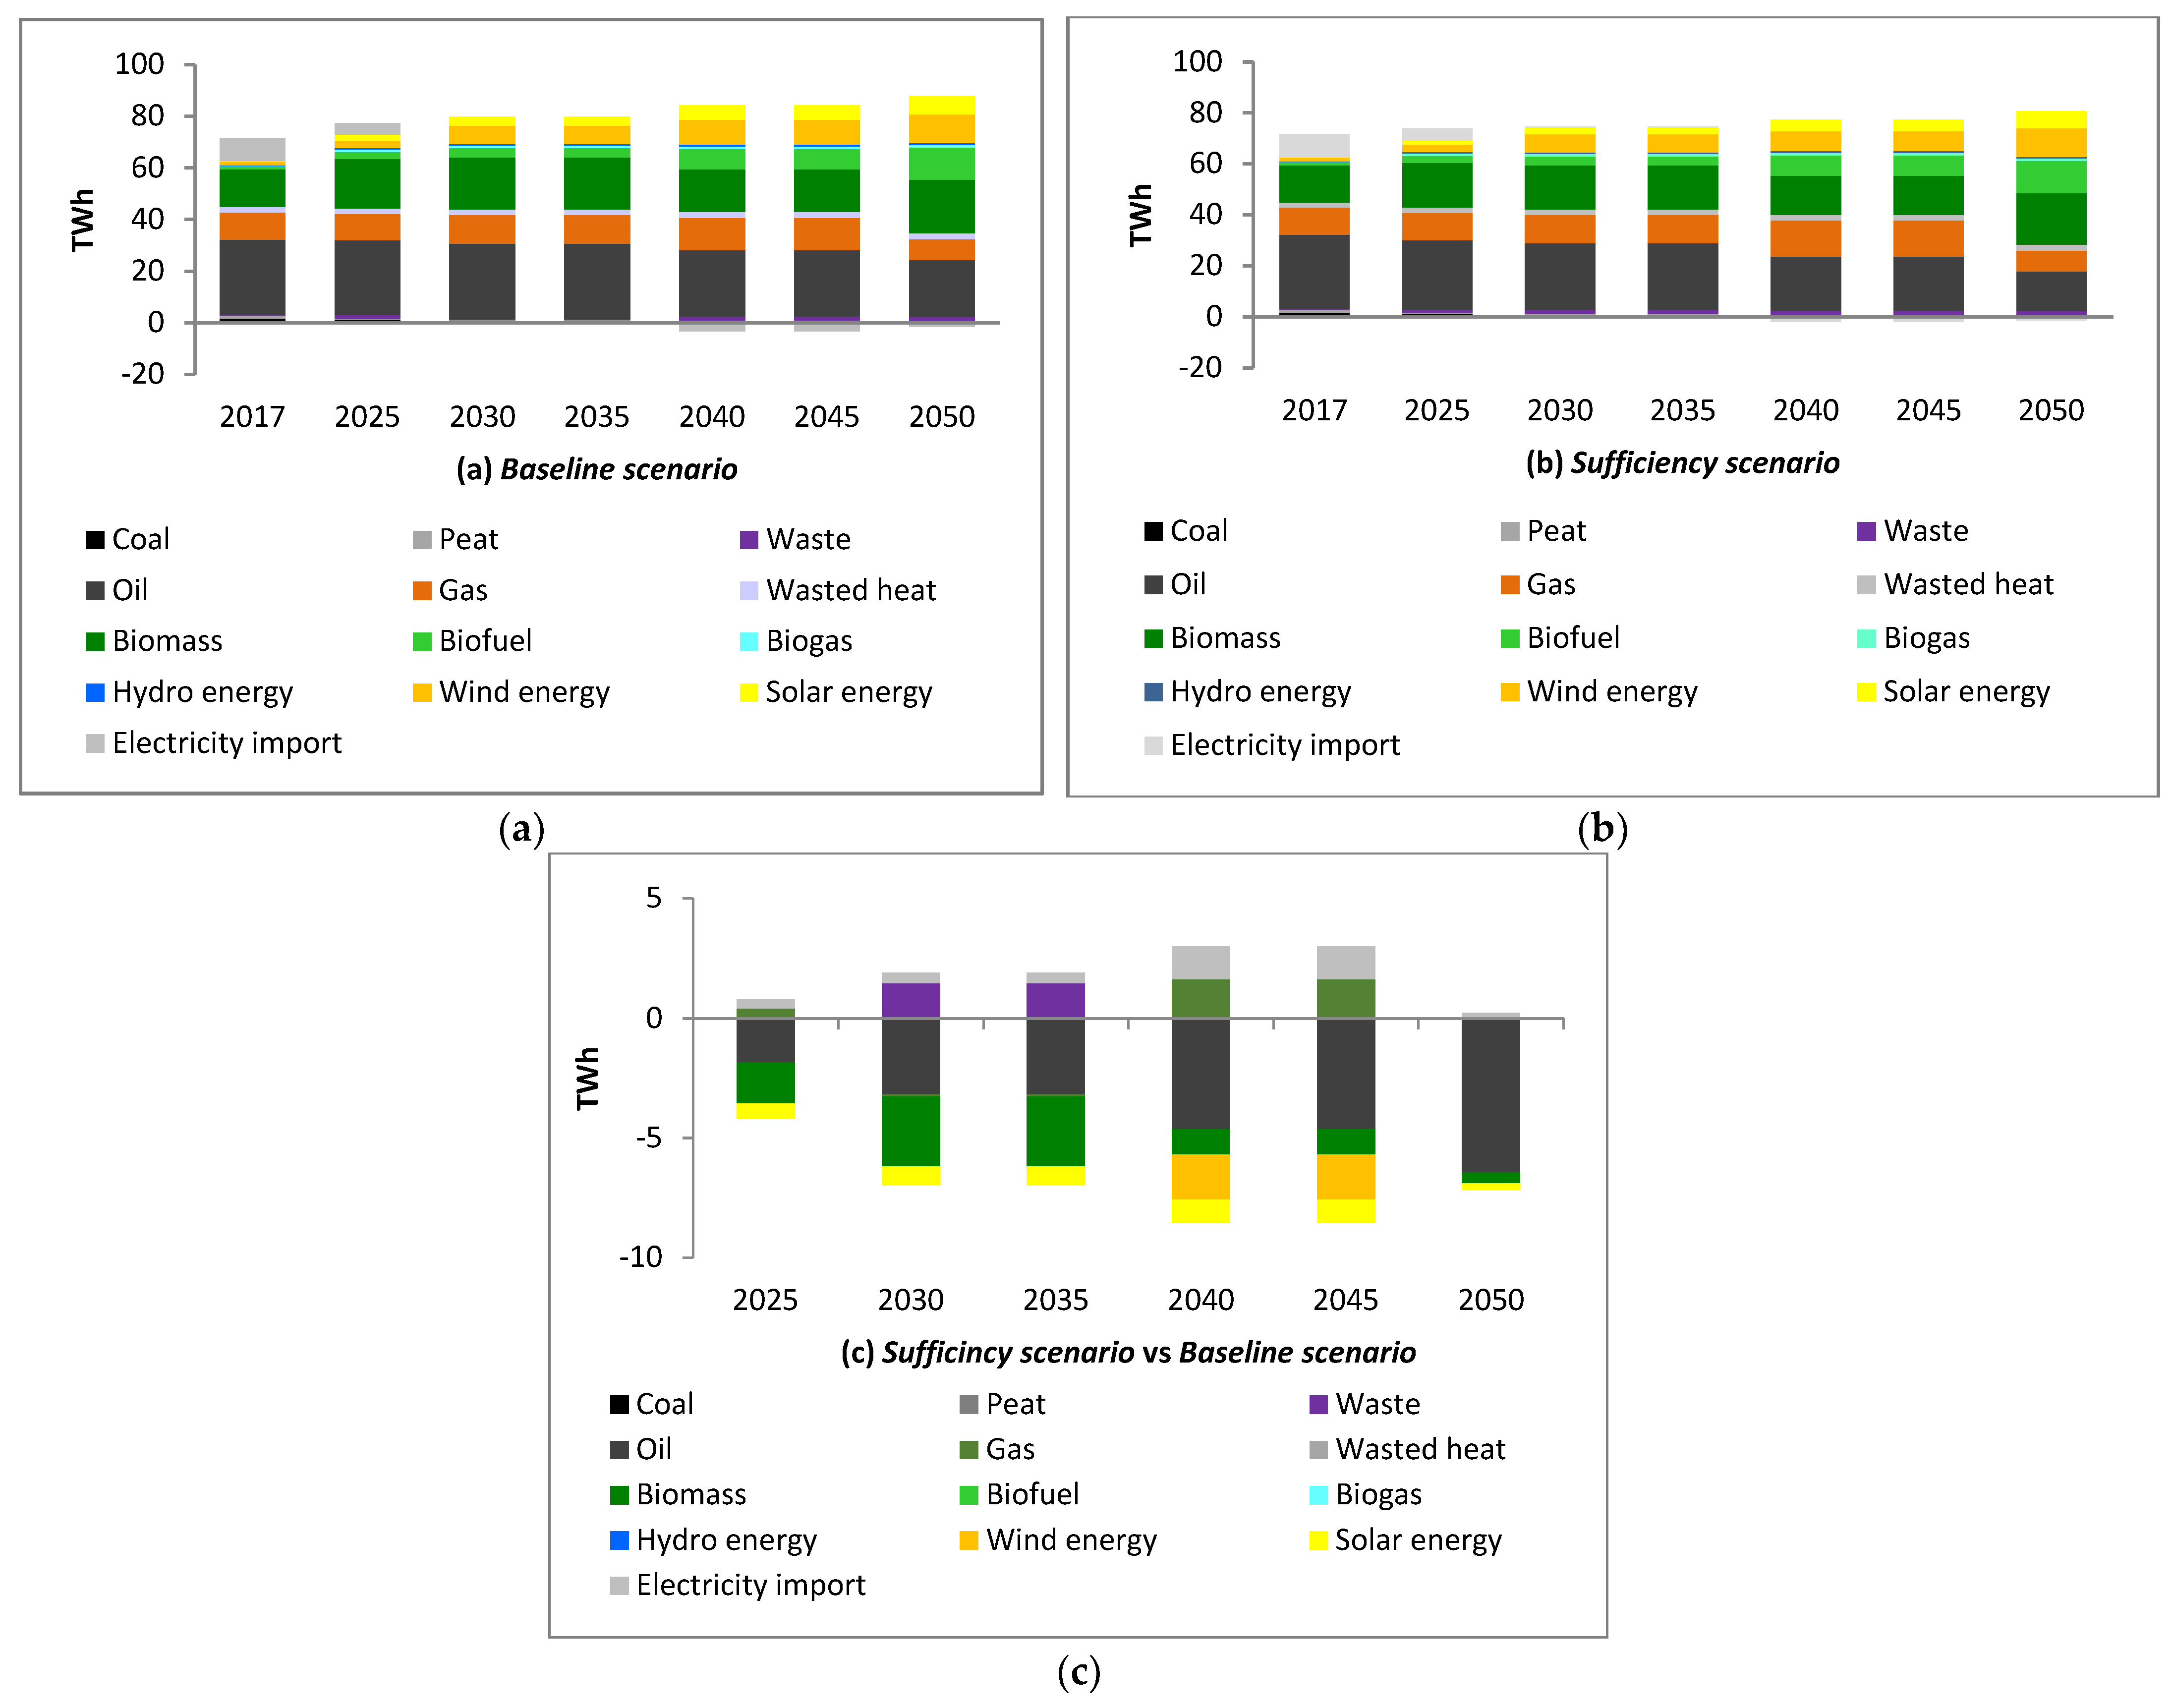
Estimating the impact on PEC revealed that ES-driven behaviour change, such as increase in pkm by buses, trolleybuses, trains, and bikes, as well as by passenger cars but at a lower than historical rate, could contribute to a halving of PEC growth. However, changes favourable to the use of RES are anticipated in the long term. It is estimated that the proportion of RES will increase to 67% in 2050, up from 25% in 2017. 6.9 TWh of primary energy savings could be realised in 2050.
-
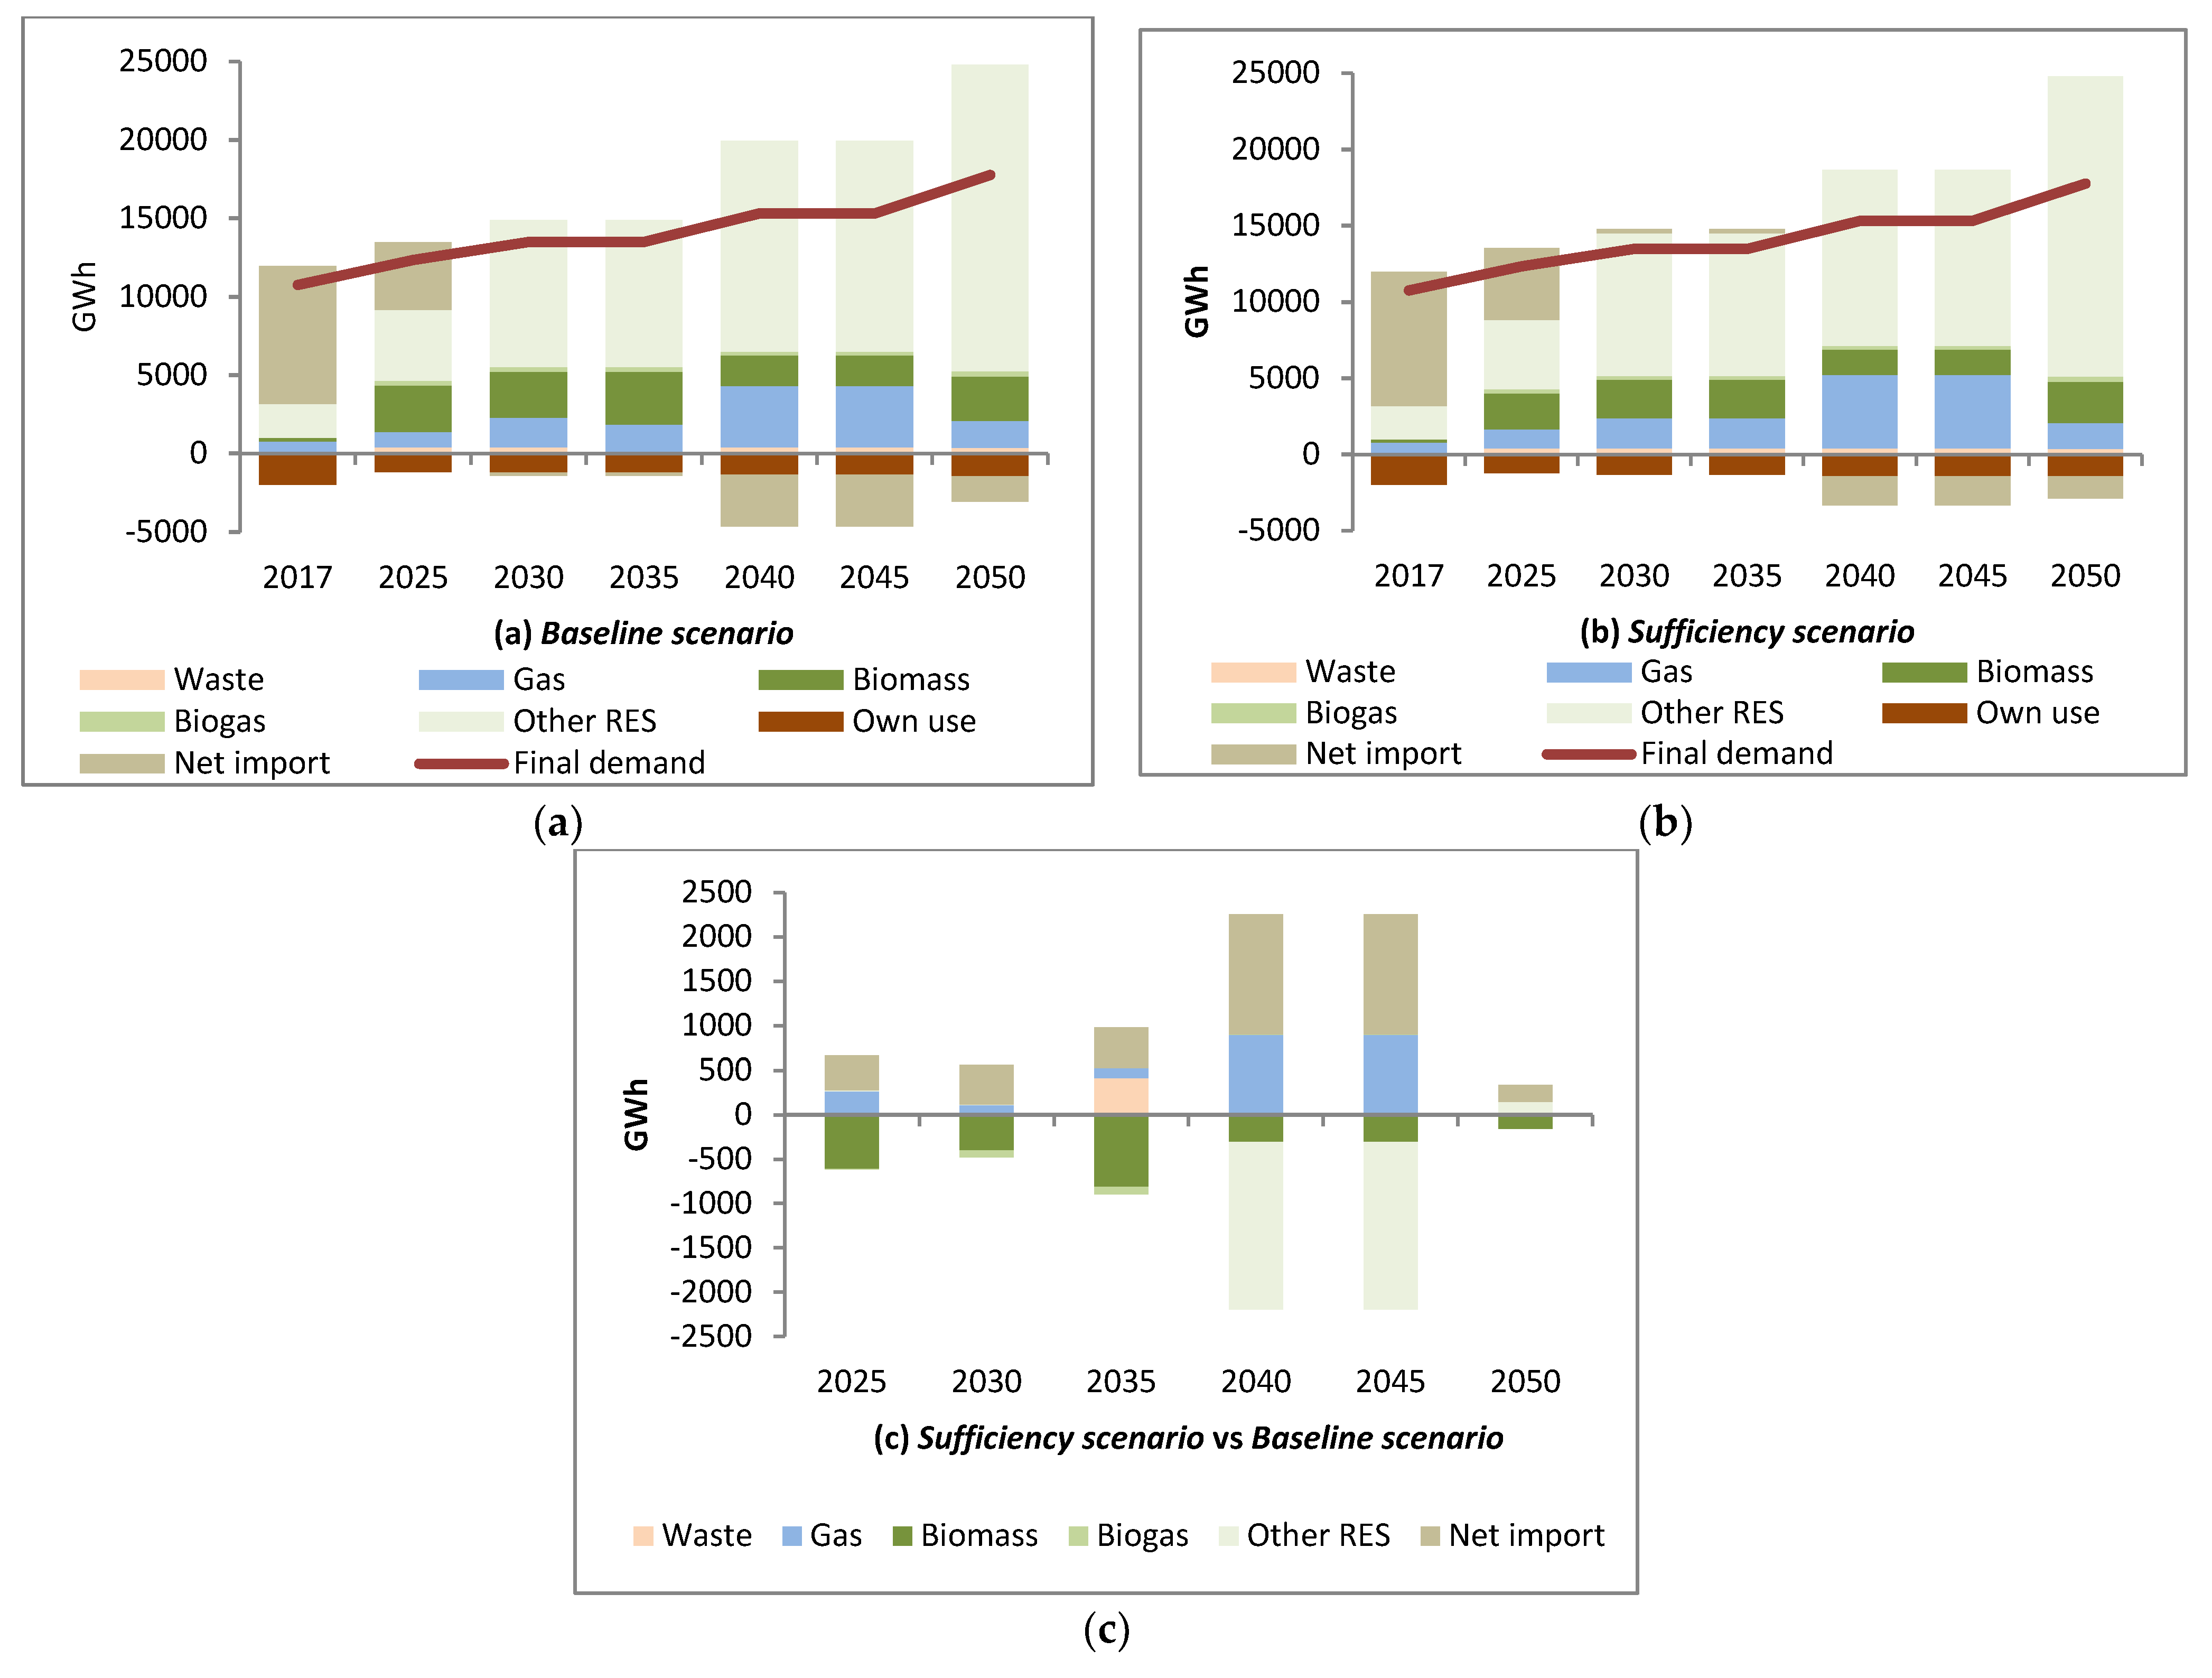
Calculating the impact on electricity production and consumption revealed that electricity consumption could increase by 65% to 17.77 TWh by 2050. This is due to an increase in travelling by electric vehicles. The nation could be self-sufficient in electricity by the 2030s, and net imports could reach 6% by 2050. Nearly 90% of electricity could be generated by RES in 2050, contributing significantly to the achievement of RES goals.
-
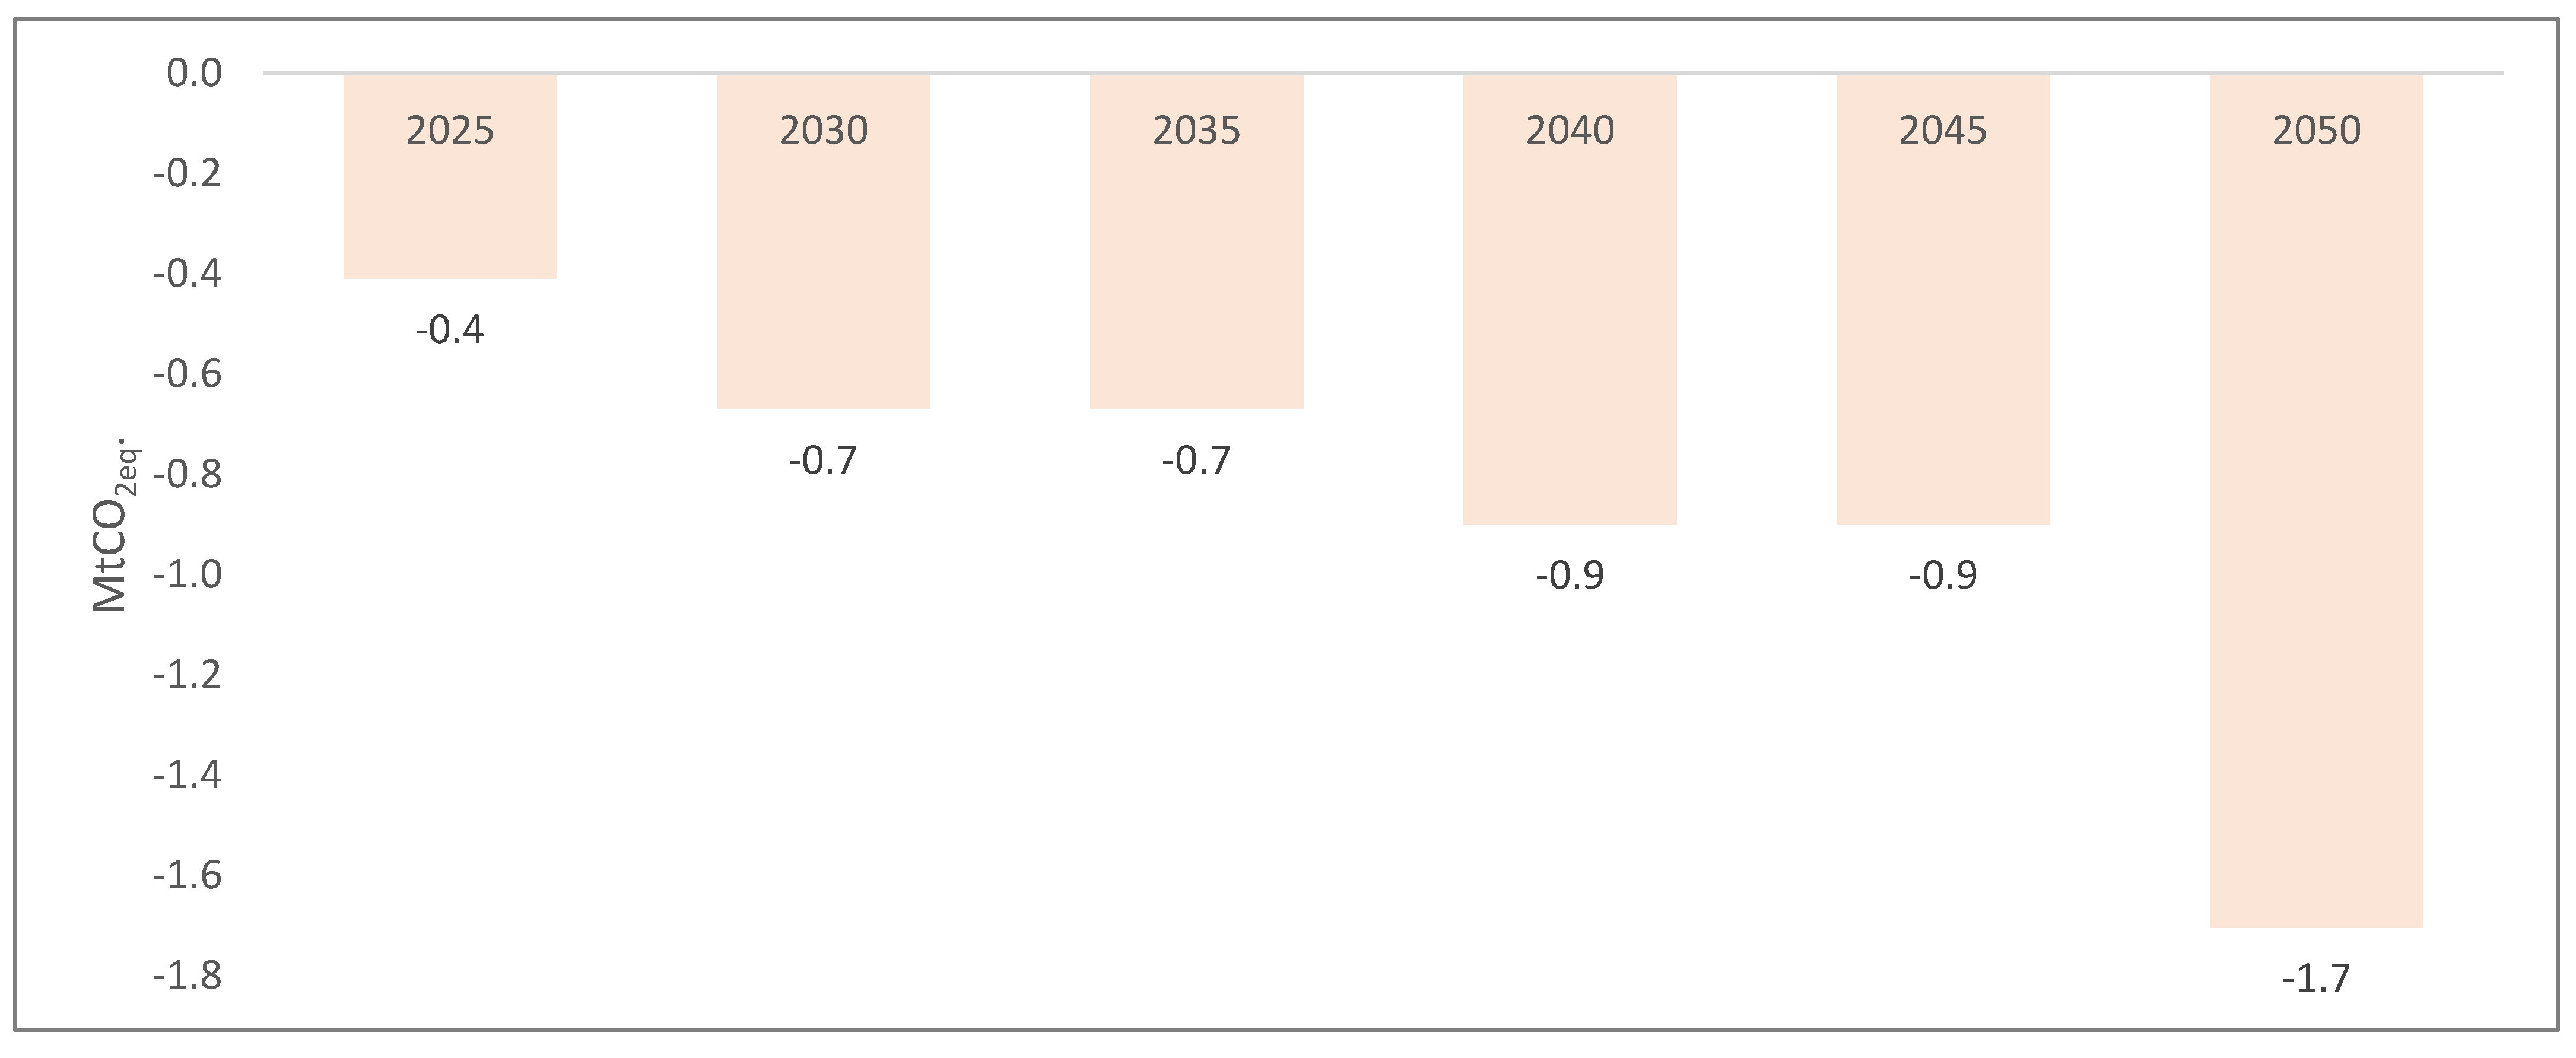
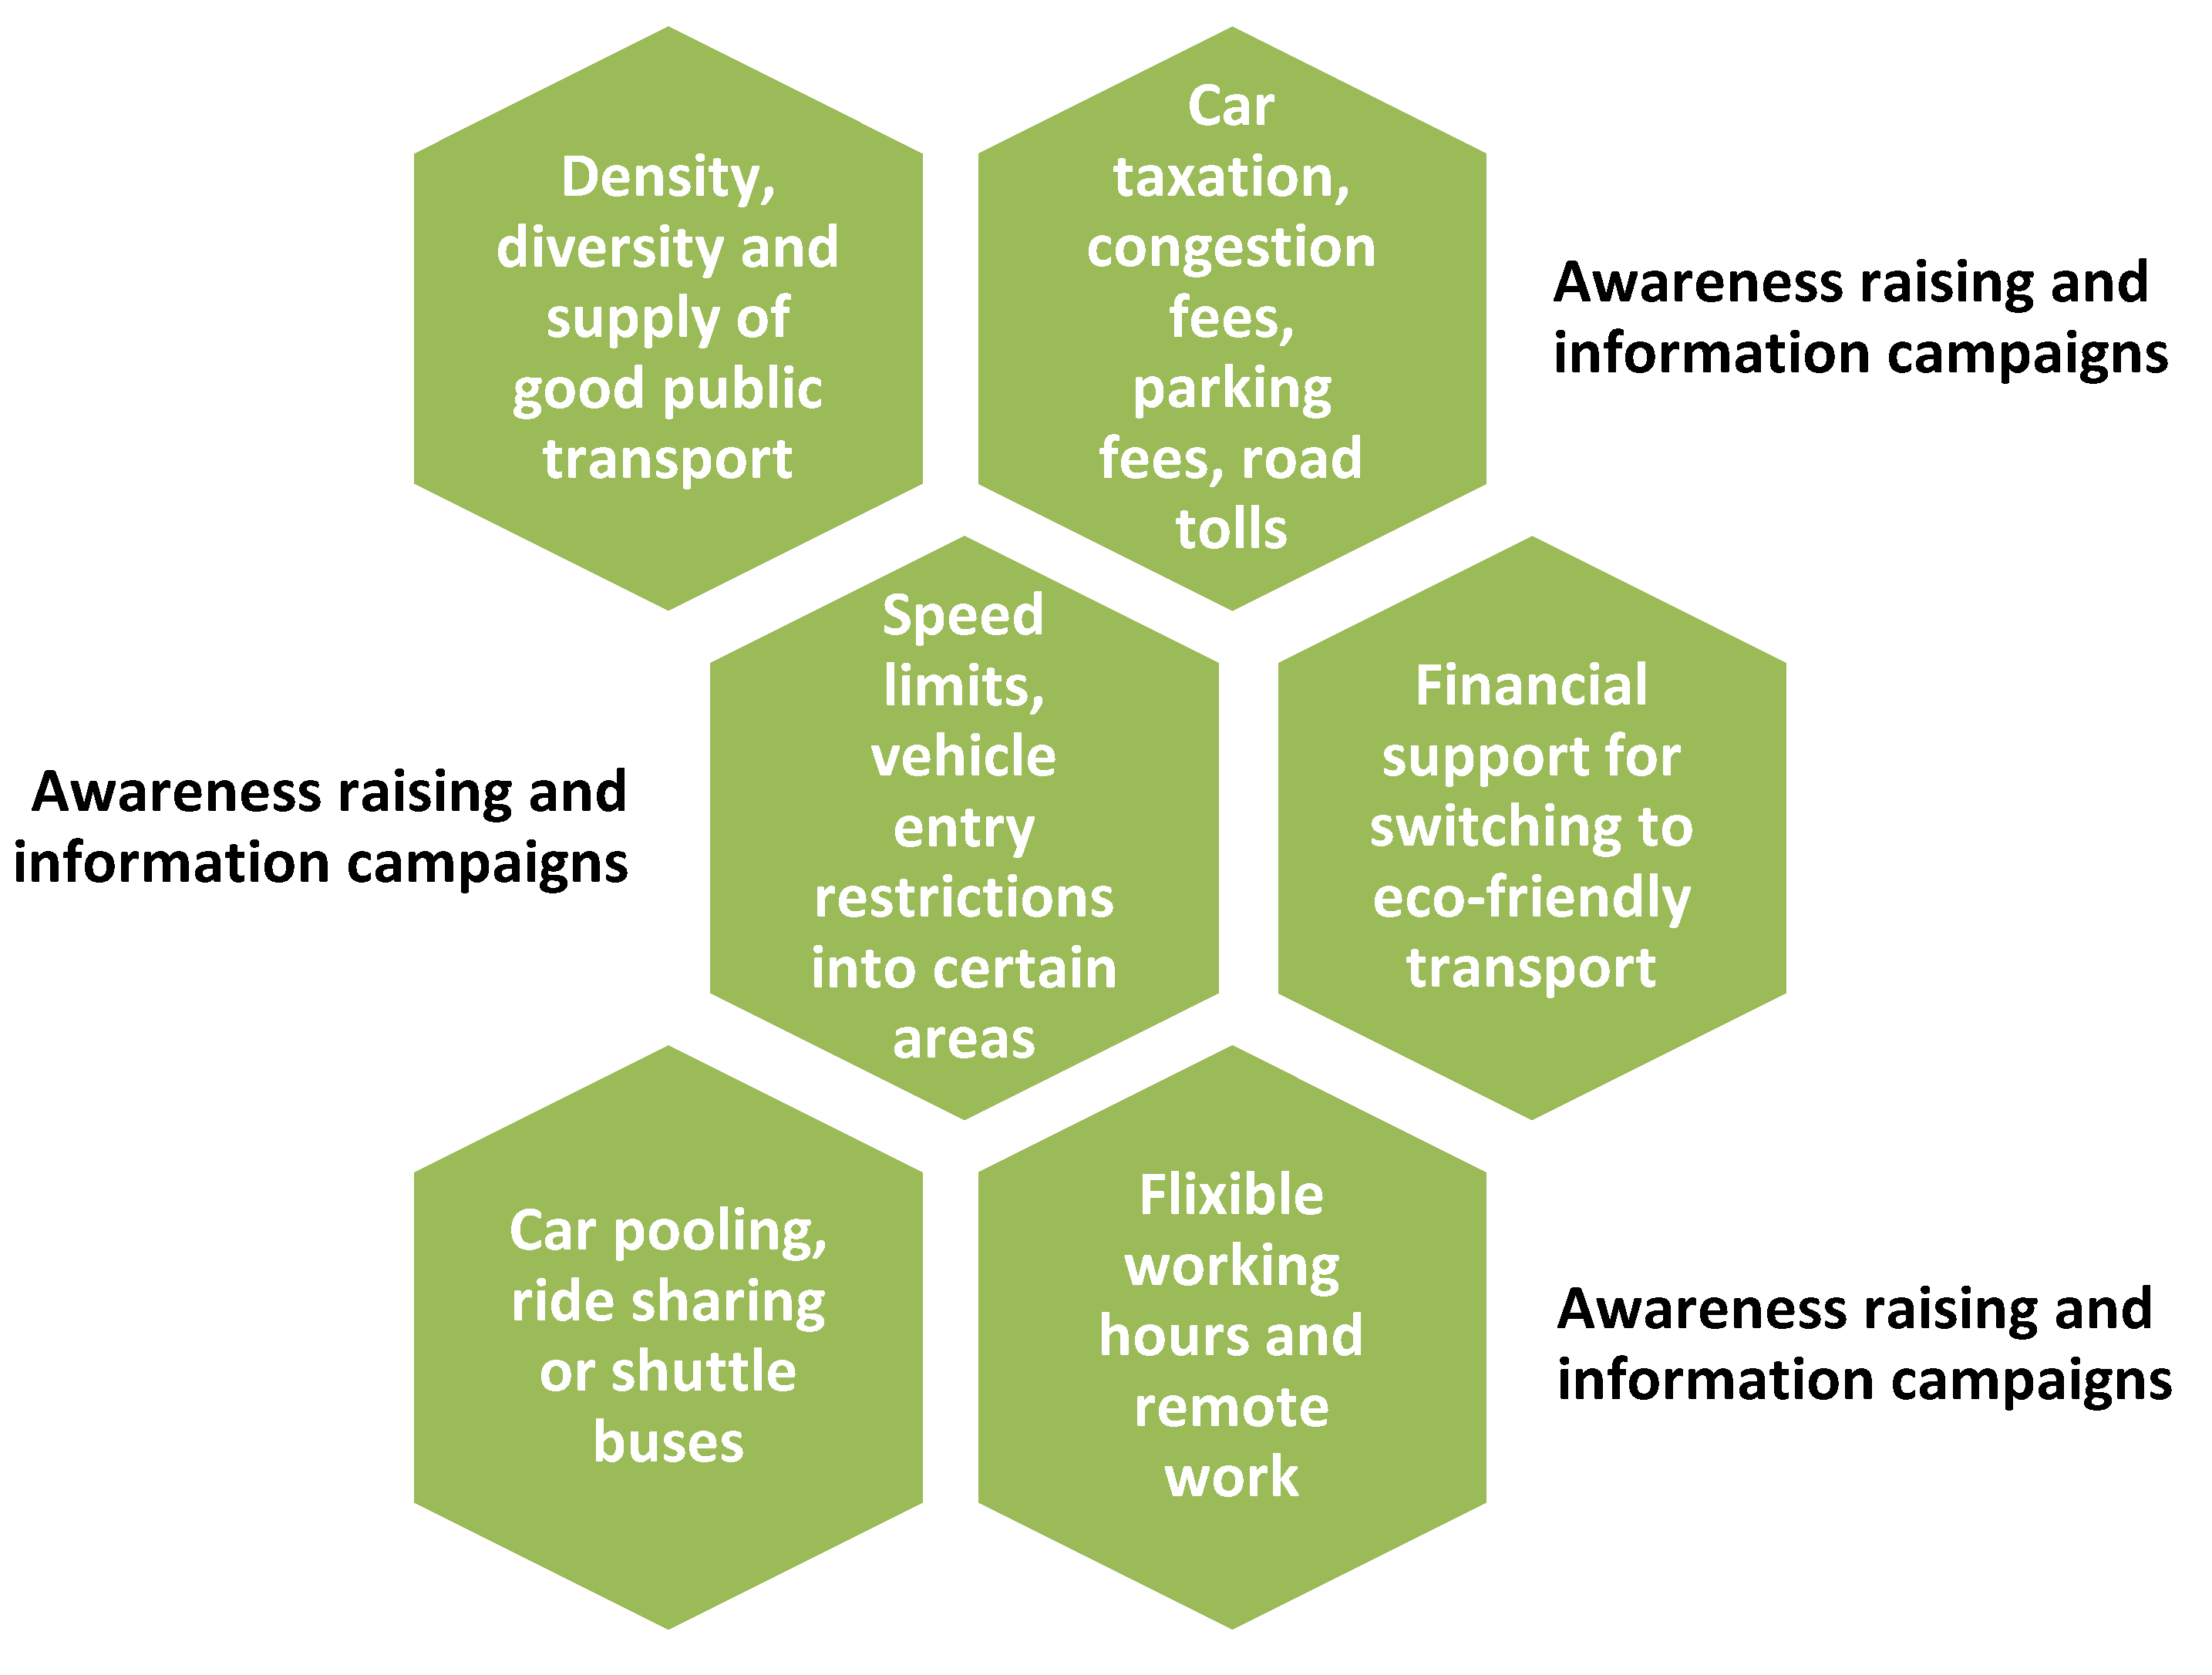
Evaluating the impact on GHG emissions demonstrated annually increasing (by 3.8% to 20.8%) reductions in GHG emissions, resulting in 20 MtCO2eq. savings over the period. For this objective, policy measures are indispensable. They could be directed toward demand control and the transition to non-motorised and less polluting modes of transportation. This should be done in conjunction with education and awareness campaigns.
This analysis aimed to draw policymakers’ attention to the energy savings potential inherent to ES, which can achieve energy, climate, and sustainable development goals.

Author Contributions

Conceptualisation by V.B., I.K., A.G., A.P., V.M. and M.C.; methodology by V.B., I.K. and A.G.; software by A.G.; validation by A.G.; formal analysis by V.B., I.K. and A.G.; investigation by V.B., I.K., A.G., A.P., V.M. and M.C.; writing—original draft preparation by V.B., I.K., A.G., A.P., V.M. and M.C.; writing—review and editing by V.B., I.K., A.G., A.P., V.M. and M.C.; visualisation by V.B., I.K., A.G., A.P., V.M. and M.C. All authors have read and agreed to the published version of the manuscript.

Funding

This research ‘Strengthening Central and Eastern European Climate Targets through Energy Sufficiency (CACTUS)’ was funded by the European Climate Initiative EUKI. Contract number: 81259154, Project processing number: 17.9045.0-002.69.

Institutional Review Board Statement

Not applicable.

Informed Consent Statement

Not applicable.

Data Availability Statement

Data available in a publicly accessible repository that does not issue DOIs. Publicly available datasets were analyzed in this study. This data can be found here: [https://ec.europa.eu/eurostat/web/main/data/database; https://osp.stat.gov.lt/statistiniu-rodikliu-analize#/; https://www.odyssee-mure.eu/] (accessed on 10 January 2023).

Conflicts of Interest

The authors declare no conflict of interest. The funders had no role in the design of the study; in the collection, analyses, or interpretation of data; in the writing of the manuscript; or in the decision to publish the results.

References

  1. Parliament of Lithuanian Republic. National Energy Independence Strategy of Lithuania. Available online: https://enmin.lrv.lt/uploads/enmin/documents/files/Nacionaline%20energetines%20nepriklausomybes%20strategija_2018_LT.pdf (accessed on 21 June 2022).
  2. Parliament of Lithuanian Republic. Agenda for National Climate Change Management of Lithuania. Available online: http://e-seimas.lrs.lt/portal/legalAct/lt/TAD/7eb37fc0db3311eb866fe2e083228059?positionInSearchResul (accessed on 30 June 2021).
  3. Government of Lithuanian Republic. National Progress Plan for 2021–2030. Available online: https://e-seimas.lrs.lt/portal/legalAct/lt/TAD/c1259440f7dd11eab72ddb4a109da1b5?jfwid=i3h7wm1wn (accessed on 21 June 2022).
  4. Parliament of Lithuanian Republic. National Energy and Climate Action Plan of Lithuania. Available online: https://enmin.lrv.lt/uploads/enmin/documents/files/Teisin%C4%97%20informacija/Teis%C4%97s%20aktai/Bendrieji%20energetikos%20strateginiai%20dokumentai/NECP/Lietuvos_Respublikos_nacionalinis_energetikos_ir_klimato_srities_veiksmu_planas.pdf (accessed on 31 December 2022).
  5. Association NegaWatt. NegaWatt Scenario 2017–2050: A Blueprint for a Successful Energy Transition in France. 2022. Available online: https://negawatt.org/IMG/pdf/181128_negawatt-scenario_eng_12p.pdf (accessed on 15 September 2022).
  6. Linnanen, L.; Nyfors, T.; Heininen, T.; Liimatainen, H.; Nissinen, A.; Regina, K.; Saarinen, M.; Seppala, J.; Viri, R.; The Sufficiency Perspective in Climate Policy: How to Recompose Consumption. The Finish Climate Change Panel. 2020. Available online: https://www.ilmastopaneeli.fi/wp-content/uploads/2020/09/Sufficiency-in-climate-policy_2020-09-25.pdf (accessed on 25 November 2022).
  7. Darby, S.; Fawcett, T.; Energy Sufficiency—An Introduction: A Concept Paper for ECEEE. October 2018. Available online: 10.13140/RG.2.2.31198.08006 (accessed on 28 October 2022).
  8. United Nations. Paris Agreement. 2015. Available online: https://unfccc.int/files/essential_background/convention/application/pdf/english_paris_agreement.pdf (accessed on 20 October 2022).
  9. ENGIE. Energy Sufficiency: The Other Side of the Energy Transition. 2020. Available online: https://www.engie.com/en/news/energy-sufficiency-dashboard (accessed on 16 November 2022).
  10. CACTUS Project. Publications. Available online: https://cactus-energy-sufficiency.eu/publications/ (accessed on 16 July 2022).
  11. Bagheri, M.; Durand, A.; Marignac, Y.; Djelali, M.; Bourgeois, S.; Konstantinaviciute, I.; Bobinaite, V.; Galinis, A.; Neniskis, E.; Bartek-Lesi, M.; et al. Understanding the gaps and addressing the potentials of energy sufficiency in “catching-up” European economies. In Proceedings of the ECEEE Summer Study Proceedings, Hyères, France, 6–10 June 2022. [Google Scholar]
  12. Bobinaite, V.; Konstantinaviciute, I.; Galinis, A.; Bartek-Lesi, M.; Rácz, V.; Dézsi, B. Energy Sufficiency in the Household Sector of Lithuania and Hungary: The Case of Heated Floor Area. Sustainability 2022, 14, 16162. [Google Scholar] [CrossRef]
  13. Millard-Ball, A.; Schipper, L. Are we reaching peak travel? Trends in passenger transport in eight industrialized countries. Transp. Rev. 2011, 31, 357–378. [Google Scholar] [CrossRef]
  14. Herring, H. Energy efficiency—A critical view. Energy 2006, 31, 10–20. [Google Scholar] [CrossRef]
  15. Dimitropoulos, A.; Oueslati, W.; Sintek, C. The rebound effect in road transport: A meta-analysis of empirical studies. Energy Econ. 2018, 75, 163–179. [Google Scholar] [CrossRef]
  16. Llorca, M.; Jamasb, T. Energy efficiency and rebound effect in European road freight transport. Transp. Res. Part A Policy Pract. 2017, 101, 98–110. [Google Scholar] [CrossRef] [Green Version]
  17. Zheng, Y.; Xu, H.; Jia, R. Endogenous energy efficiency and rebound effect in the transportation sector: Evidence from China. J. Clean. Prod. 2022, 335, 130310. [Google Scholar] [CrossRef]
  18. Samadi, S.; Gröne, M.C.; Schneidewind, U.; Luhmann, H.J.; Venjakob, J.; Best, B. Sufficiency in energy scenario studies: Taking the potential benefits of lifestyle changes into account. Technol. Forecast. Soc. Chang. 2017, 124, 126–134. [Google Scholar] [CrossRef] [Green Version]
  19. Jiang, P.; Fan, Y.V.; Klemeš, J.J. Impacts of COVID-19 on energy demand and consumption: Challenges, lessons and emerging opportunities. Appl. Energy 2021, 285, 116441. [Google Scholar] [CrossRef]
  20. Panteia, M.; Rodrigues, T.; Teoh, C.; Ramos, T.; de Winter, L.; Knezevic, L.; Marcucci, E.; Lozzi, G.; Gatta, V.; Antonucci, B.; et al. Relaunching Transport and Tourism in the EU after COVID-19. Part I: Overview. 2021. Available online: https://www.europarl.europa.eu/RegData/etudes/STUD/2021/652235/IPOL_STU(2021)652235_EN.pdf (accessed on 7 March 2022).
  21. Habib, M.A.; Anik, M.A.H. Impacts of COVID-19 on Transport Modes and Mobility Behavior: Analysis of Public Discourse in Twitter. Transp. Res. Rec. 2021. [Google Scholar] [CrossRef]
  22. Berger, R. How COVID-19 Has Disrupted the Future of Long-Distance Mobility. 2021. Available online: https://www.tourmag.com/attachment/2243501/ (accessed on 16 July 2022).
  23. Kellermann, R.; Sivizaca Conde, D.; Rößler, D.; Kliewer, N.; Dienel, H.L. Mobility in pandemic times: Exploring changes and long-term effects of COVID-19 on urban mobility behavior. Transp. Res. Interdiscip. Perspect. 2022, 15, 100668. [Google Scholar] [CrossRef] [PubMed]
  24. Zhang, X.; Li, Z.; Wang, J. Impact of COVID-19 pandemic on energy consumption and carbon dioxide emissions in China’s transportation sector. Case Stud. Therm. Eng. 2021, 26, 101091. [Google Scholar] [CrossRef]
  25. de Lang, B. Vehicle Mileage Not Yet Back at Pre-Pandemic Level. 2022. Available online: https://www.cbs.nl/en-gb/news/2022/45/vehicle-mileage-not-yet-back-at-pre-pandemic-level (accessed on 16 July 2022).
  26. Eurostat Impact of COVID-19 on Air Passenger Transport. 2020. Available online: https://ec.europa.eu/eurostat/web/products-eurostat-news/-/ddn-20200616-2 (accessed on 12 September 2022).
  27. Independent Regulators’ Group—Rail Tenth Annual Market Monitoring Report. 2022. Available online: //Https://Www.Irg-Rail.Eu/Irg/Documents/Market-Monitoring/363,2022.Html (accessed on 16 July 2022).
  28. International Energy Agency Changes in Transport Behaviour during the COVID-19 Crisis. 2020. Available online: https://www.iea.org/articles/changes-in-transport-behaviour-during-the-covid-19-crisis (accessed on 16 July 2022).
  29. Gkiotsalitis, K.; Cats, O. Public transport planning adaption under the COVID-19 pandemic crisis: Literature review of research needs and directions. Transp. Rev. 2021, 41, 374–392. [Google Scholar] [CrossRef]
  30. Jenelius, E.; Cebecauer, M. Impacts of COVID-19 on public transport ridership in Sweden: Analysis of ticket validations, sales and passenger counts. Transp. Res. Interdiscip. Perspect. 2020, 8, 100242. [Google Scholar] [CrossRef]
  31. Wilbur, M.; Ayman, A.; Ouyang, A.; Poon, V.; Kabir, R.; Vadali, A.; Pugliese, P.; Freudberg, D.; Laszka, A.; Dubey, A. Impact of COVID-19 on Public Transit Accessibility and Ridership. arXiv 2020, arXiv:2008.02413. Available online: https://arxiv.org/pdf/2008.02413.pdf (accessed on 28 July 2022).
  32. Wielechowski, M.; Czech, K.; Grzęda, L. Decline in Mobility: Public Transport in Poland in the time of the COVID-19 Pandemic. Economies 2020, 8, 78. [Google Scholar] [CrossRef]
  33. Bucsky, P. Modal share changes due to COVID-19: The case of Budapest. Transp. Res. Interdiscip. Perspect. 2020, 8, 100141. [Google Scholar] [CrossRef]
  34. Abdullah, M.; Ali, N.; Ashraf Javid, M.; Dias, C.; Campisi, T. Public transport versus solo travel mode choices during the COVID-19 pandemic: Self-reported evidence from a developing country. Transp. Eng. 2021, 5, 100078. [Google Scholar] [CrossRef]
  35. Aloi, A.; Alonso, B.; Benavente, J.; Cordera, R.; Echániz, E.; González, F.; Ladisa, C.; Lezama-Romanelli, R.; López-Parra, V.; Mazzei, V. Effects of the COVID-19 Lockdown on Urban Mobility: Empirical Evidence from the City of Santander (Spain). Sustainability 2020, 12, 3870. [Google Scholar] [CrossRef]
  36. Moslem, S.; Campisi, T.; Szmelter-Jarosz, A.; Duleba, S.; Nahiduzzaman, K.M.; Tesoriere, G. Best–Worst. Method for Modelling Mobility Choice after COVID-19: Evidence from Italy. Sustainability 2020, 12, 6824. [Google Scholar] [CrossRef]
  37. Marra, A.D.; Sun, L.; Corman, F. The impact of COVID-19 pandemic on public transport usage and route choice: Evidences from a long-term tracking study in urban area. Transp. Policy 2022, 116, 258–268. [Google Scholar] [CrossRef] [PubMed]
  38. Eisenmann, C.; Nobis, C.; Kolarova, V.; Lenz, B.; Winkler, C. Transport mode use during the COVID-19 lockdown period in Germany: The car became more important, public transport lost ground. Transp. Policy 2021, 103, 60–67. [Google Scholar] [CrossRef] [PubMed]
  39. Molloy, J.; Schatzmann, T.; Schoeman, B.; Tchervenkov, C.; Hintermann, B.; Axhausen, K.W. Observed impacts of the Covid-19 first wave on travel behaviour in Switzerland based on a large GPS panel. Transp. Policy 2021, 104, 43–51. [Google Scholar] [CrossRef] [PubMed]
  40. Das, S.; Boruah, A.; Banerjee, A.; Raoniar, R.; Nama, S.; Kumar Maurya, S. Impact of COVID-19: A radical modal shift from public to private transport mode. Transp. Policy 2021, 109, 1–11. [Google Scholar] [CrossRef]
  41. Eurostat Railway Passenger Transport Statistics—Quarterly and Annual Data. 2022. Available online: https://ec.europa.eu/eurostat/statistics-explained/index.php?title=Railway_passenger_transport_statistics_-_quarterly_and_annual_data (accessed on 10 July 2022).
  42. ICAO Effects of Novel Coronovirus (COVID-19) on Civil Aviation: Economic Impact Analysis. 2022. Available online: https://www.icao.int/sustainability/Documents/COVID-19/ICAO_Coronavirus_Econ_Impact.pdf (accessed on 6 November 2022).
  43. Bao, X.; Ji, P.; Lin, W.; Perc, M.; Kurths, J. The impact of COVID-19 on the worldwide air transportation network. R. Soc. Open Sci. 2021, 8, 210682. [Google Scholar] [CrossRef]
  44. Michelmann, J.; Schmalz, U.; Becker, A.; Stroh, F.; Behnke, S.; Hornung, M. Influence of COVID-19 on air travel—A scenario study toward future trusted aviation. J. Air Transp. Manag. 2023, 106, 102325. [Google Scholar] [CrossRef]
  45. Central Commission for the Navigation of the Rhine. Market Observation Annual Report 2021. Available online: https://inland-navigation-market.org/chapitre/7-passenger-transport/?lang=en (accessed on 9 October 2022).
  46. Borca, B.; Putz, L.-M. Impacts of the COVID-19 crisis on inland navigation. In Adapting to the Future: How Digitalization Shapes Sustainable Logistics and Resilient Supply Chain Management, Proceedings of the Hamburg International Conference of Logistics (HICL), Hamburg, Germany, 23–24 September 2021; Kersten, W.R., Christian, M., Blecker, T., Eds.; Epubli GmbH: Berlin, Germany, 2021; Volume 31, pp. 879–898. ISBN 978-3-7549-2770-0. [Google Scholar] [CrossRef]
  47. Rérat, P.; Haldimann, L.; Widmer, H. Cycling in the era of Covid-19: The effects of the pandemic and pop-up cycle lanes on cycling practices. Transp. Res. Interdiscip. Perspect. 2022, 15, 100677. [Google Scholar] [CrossRef] [PubMed]
  48. Meena, S. Impact of novel Coronavirus (COVID-19) pandemic on travel pattern: A case study of India. Indian J. Sci. Technol. 2020, 13, 2491–2501. [Google Scholar] [CrossRef]
  49. Buehler, R.; Pucher, J. COVID-19 Impacts on Cycling, 2019–2020. Transp. Rev. 2021, 41, 393–400. [Google Scholar] [CrossRef]
  50. Moriarty, P.; Honnery, D. Greening passenger transport: A review. J. Clean. Prod. 2013, 54, 14–22. [Google Scholar] [CrossRef]
  51. Alvik, S.; Irvine, M. The Impact of COVID-19 on the Energy Transition. 2020. Available online: https://www.dnv.com/energy-transition/impact-of-covid19-on-the-energy-transition.html (accessed on 25 October 2022).
  52. Brand, C.; Götschi, T.; Dons, E.; Gerike, R.; Anaya-Boig, E.; Avila-Palencia, I.; de Nazelle, A.; Gascon, M.; Gaupp-Berghausen, M.; Iacorossi, F.; et al. The climate change mitigation impacts of active travel: Evidence from a longitudinal panel study in seven European cities. Glob. Environ. Chang. 2021, 67, 102224. [Google Scholar] [CrossRef]
  53. Duarte, R.; Feng, K.; Hubacek, K.; Sánchez-Chóliz, J.; Sarasa, C.; Sun, L. Modeling the Carbon Consequences of Pro-Environmental Consumer Behavior. Appl. Energy 2016, 184, 1207–1216. Available online: http://linkinghub.elsevier.com/retrieve/pii/S0306261915012271 (accessed on 10 October 2022). [CrossRef]
  54. Neves, A.; Brand, C. Assessing the potential for carbon emissions savings from replacing short car trips with walking and cycling using a mixed GPS-travel diary approach. Transp. Res. Part A Policy Pract. 2019, 123, 130–146. [Google Scholar] [CrossRef]
  55. Vita, G.; Lundström, J.R.; Hertwich, E.G.; Quist, J.; Ivanova, D.; Stadler, K.; Wood, R. The Environmental Impact of Green Consumption and Sufficiency Lifestyles Scenarios in Europe: Connecting Local Sustainability Visions to Global Consequences. Ecol. Econ. 2019, 164, 106322. [Google Scholar] [CrossRef]
  56. EUROSTAT. Complete Energy Balances. 16 January 2023. Available online: https://ec.europa.eu/eurostat/databrowser/view/nrg_bal_c/default/table?lang=en (accessed on 17 January 2023).
  57. ADEME. Enerdata and Fraunhofer. Database of Odyssee-Mure Project. Available online: https://www.odyssee-mure.eu/ (accessed on 10 January 2022).
  58. Lithuanian Statistics. Database of Energy Consumption in Transport. Available online: https://osp.stat.gov.lt/statistiniu-rodikliu-analize#/ (accessed on 16 July 2022).
  59. Lithuanian Statistics. Database of Passenger Turnover by All Transport Modes. Available online: https://osp.stat.gov.lt/statistiniu-rodikliu-analize#/ (accessed on 16 July 2022).
  60. Galinis, A.; Miškinis, V.; Lekavicius, V.; Konstantinaviciute, I.; Štreimikiene, D.; Pažeraite, A.; Gatautis, R.; Norvaiša, E.; Neniškis, E.; Alebaite, I. Assessment of Energy Policy Directions of Lithuanian Energy Independence Strategy; Laboratory for Energy Systems Research of Lithuanian Energy Institute: Kaunas, Lithuania, 2017. [Google Scholar]
  61. EUROSTAT. Population on 1st January by Age, Sex and Type of Projection. 8 February 2021. Available online: https://appsso.eurostat.ec.europa.eu/nui/show.do?dataset=proj_19np&lang=en (accessed on 15 August 2022).
  62. Grubler, A.; Wilson, C.; Bento, N.; Boza-Kiss, B.; Krey, V.; McCollum, D.L.; Rao, N.D.; Riahi, K.; Rogelj, J.; de Stercke, S.; et al. A low energy demand scenario for meeting the 1.5 °C target and sustainable development goals without negative emission technologies. Nat. Energy 2018, 3, 515–527. [Google Scholar] [CrossRef] [Green Version]
  63. Kuhnhenn, K.; Costa, L.; Mahnke, E.; Schneider, L.; Lange, S. A Societal Transformation Scenario for Staying below 1.5 °C; Economic + Social Issues; Heinrich Böll Stiftung: Berlin, Germany, 2020. [Google Scholar]
  64. Konstantinaviciute, I. Energy consumption trends and sufficiency potential for the passenger transport in Lithuania. In Proceedings of the CACTUS Lithuanian Policy Workshop Vilnius, Vilnius, Lithuania, 10 November 2021. [Google Scholar]
  65. European Commission Transport in the EU: Current Trends and Issues. 2019. Available online: https://www.amt-autoridade.pt/media/1934/2019-transport-in-the-eu-current-trends-and-issues.pdf (accessed on 16 July 2022).
  66. Neniškis, E.; Galinis, A.; Norvaiša, E. Improving Transport Modeling in MESSAGE Energy Planning Model: Vehicle Age Distributions. Energies 2021, 14, 7279. [Google Scholar] [CrossRef]
  67. International Institute for Applied Systems Analysis MESSAGE: Model for Energy Supply Strategy Alternatives and Their General Environmental Impact. 2012. Available online: https://webarchive.iiasa.ac.at/Research/ENE/model/message.html (accessed on 15 November 2022).
  68. Sandberg, M. Sufficiency transitions: A review of consumption changes for environmental sustainability. J. Clean. Prod. 2021, 293, 126097. [Google Scholar] [CrossRef]
  69. Eerma, M.H.; Manning, D.; Økland, G.L.; Rodriguez del Angel, C.; Seifert, P.E.; Winkler, J.; Zamora Blaumann, A.; Zozmann, E.; Hosseinioun, S.S.; Göke, L.; et al. The potential of behavioral changes to achieve a fully renewable energy system—A case study for Germany. Renew. Sustain. Energy Transit. 2022, 2, 100028. [Google Scholar] [CrossRef]
  70. Sukarno, I.; Matsumoto, H.; Susanti, L. Transportation energy consumption and emissions—A view from city of Indonesia. Future Cities Environ. 2016, 2, 6. [Google Scholar] [CrossRef]
  71. Kenworthy, J.R.; Svensson, H. Exploring the Energy Saving Potential in Private, Public and Non-Motorized Transport for Ten Swedish Cities. Sustainability 2022, 14, 954. [Google Scholar] [CrossRef]
  72. Best, B.; Christ, M.; Santarius, T.; Wiese, F. Exploring Energy Sufficiency: New Challenges and Options in Times of Crisis. Special Topic: Energy Sufficiency: Conceptual Considerations, Modeling, and Scenarios for Less Energy Consumption. Available online: https://www.tatup.de/index.php/tatup/article/view/6984/11724 (accessed on 16 July 2022).
  73. Nord Pool AS. Day-Ahead Prices: Yearly. Available online: https://www.nordpoolgroup.com/en/Market-data1/Dayahead/Area-Prices/ALL1/Yearly/?view=table (accessed on 20 July 2022).
  74. Shortall, R.; Mouter, N.; Van Wee, B. COVID-19 passenger transport measures and their impacts. Transp. Rev. 2022, 42, 441–466. [Google Scholar] [CrossRef]
  75. Best, B.; Thema, J.; Zell-Ziegler, C.; Wiese, F.; Barth, J.; Breidenbach, S.; Nascimento, L.; Wilke, H. Building a Database for Energy Sufficiency Policies. F1000Research 2022, 11, 229. [Google Scholar] [CrossRef] [PubMed]
Figure 1. FEC by sector (ktoe) and GHG emissions in the transport (ktCO2eq.) in Lithuania [56].
Sustainability 15 05951 g001
Figure 2. Fuel consumption in passenger transport (ktoe) and the share of passenger transport (%) [57,58].
Sustainability 15 05951 g002
Figure 3. Distances travelled by the passenger transport mode (Mpkm) and the share of public transportation (%) [57,59].
Sustainability 15 05951 g003
Figure 4. Structure and functional relationships of the mathematical model for the analysis of the perspective development and functioning of the energy sector (own work).
Sustainability 15 05951 g004
Figure 5. Changes in FEC due to ES in the passenger transport in Lithuania (%) (own estimations).
Sustainability 15 05951 g005
Figure 6. PEC under the Baseline (a) and the Sufficiency (b) scenarios and the expected changes (c) in Lithuania (TWh) (own estimations).
Sustainability 15 05951 g006
Figure 7. Final electricity demand and generation structure under the Baseline (a) and the Sufficiency (b) scenarios and the expected changes (c) in Lithuania (GWh) (own estimations).
Sustainability 15 05951 g007
Figure 8. Changes in installed electrical capacity in PPs due to energy sufficiency in the passenger transport in Lithuania (MW) (own estimations).
Sustainability 15 05951 g008
Figure 9. Change in CO2 emissions due to ES in passenger transport in Lithuania (Mt CO2eq.) (own estimations).
Sustainability 15 05951 g009
Figure 10. Average hourly electricity market price in Lithuania between 2018 and 2021 (EUR/MWh) [73].
Sustainability 15 05951 g010
Figure 11. Possible measures to facilitate ES in Lithuanian passenger transport [10].
Sustainability 15 05951 g011
Table 1. Assumptions for key energy sufficiency indicators used in the modelling.
IndicatorAbbreviationTheoretical ES Level from the
Literature [62,63]
Base-Year Data (2017) [59]Assumed Level *
202520302035204020452050
Pkm by car per capita D C ; t 867411,08811,19011,25011,31011,37011,44011,500
Pkm by bus and trolleybus per capita D B ; t 1968969111312331328138114351500
Pkm by rail per capita D R ; t 1366150299664664664664700
Pkm by navigation per capita D N ; t n/a678092103115126150
Pkm by air per capita D A ; t 581–18416286136827488128741000
Pkm by soft mobility per capita D S M ; t n/a8097113131152175200
Notes: * Own evaluation.
Disclaimer/Publisher’s Note: The statements, opinions and data contained in all publications are solely those of the individual author(s) and contributor(s) and not of MDPI and/or the editor(s). MDPI and/or the editor(s) disclaim responsibility for any injury to people or property resulting from any ideas, methods, instructions or products referred to in the content.

