1. Introduction
Entering the 21st century, regions have become the most active economic unit. The report of the 20th National Congress of the Communist Party of China pointed out that we should “focus on promoting regional coordinated development, and promote the effective improvement of the quality and reasonable growth of the economy” [
1]. However, the development of regional economic integration has led to an increasing number of public problems across multiple departments, governments, or regional boundaries. Among them, the trans-regional air pollution problem has become an important bottleneck restricting the sustainable development of the regional economy and society due to its extensive scope of influence. As one of the most dynamic regions in China’s economy, the Beijing–Tianjin–Hebei region is also plagued by trans-regional air pollution problems. Because of the complexity and mobility of trans-regional air pollution, the environmental territorial management model that is used and relies on a single action subject is no longer applicable. Regional collaborative governance between local governments through joint meetings and joint law enforcement has become a feasible option to effectively resolve trans-regional air pollution problems [
2,
3]. Against this background, at the beginning of 2017, the former Ministry of Environmental Protection issued The 2017 Work Plan for Air Pollution Prevention and Control in Beijing, Tianjin, Hebei and Surrounding Areas, requiring 28 cities in Beijing–Tianjin–Hebei and surrounding areas to implement the regional air pollution joint prevention and control mechanism by “improving regional air quality as the core and reducing heavy air pollution weather as the key” [
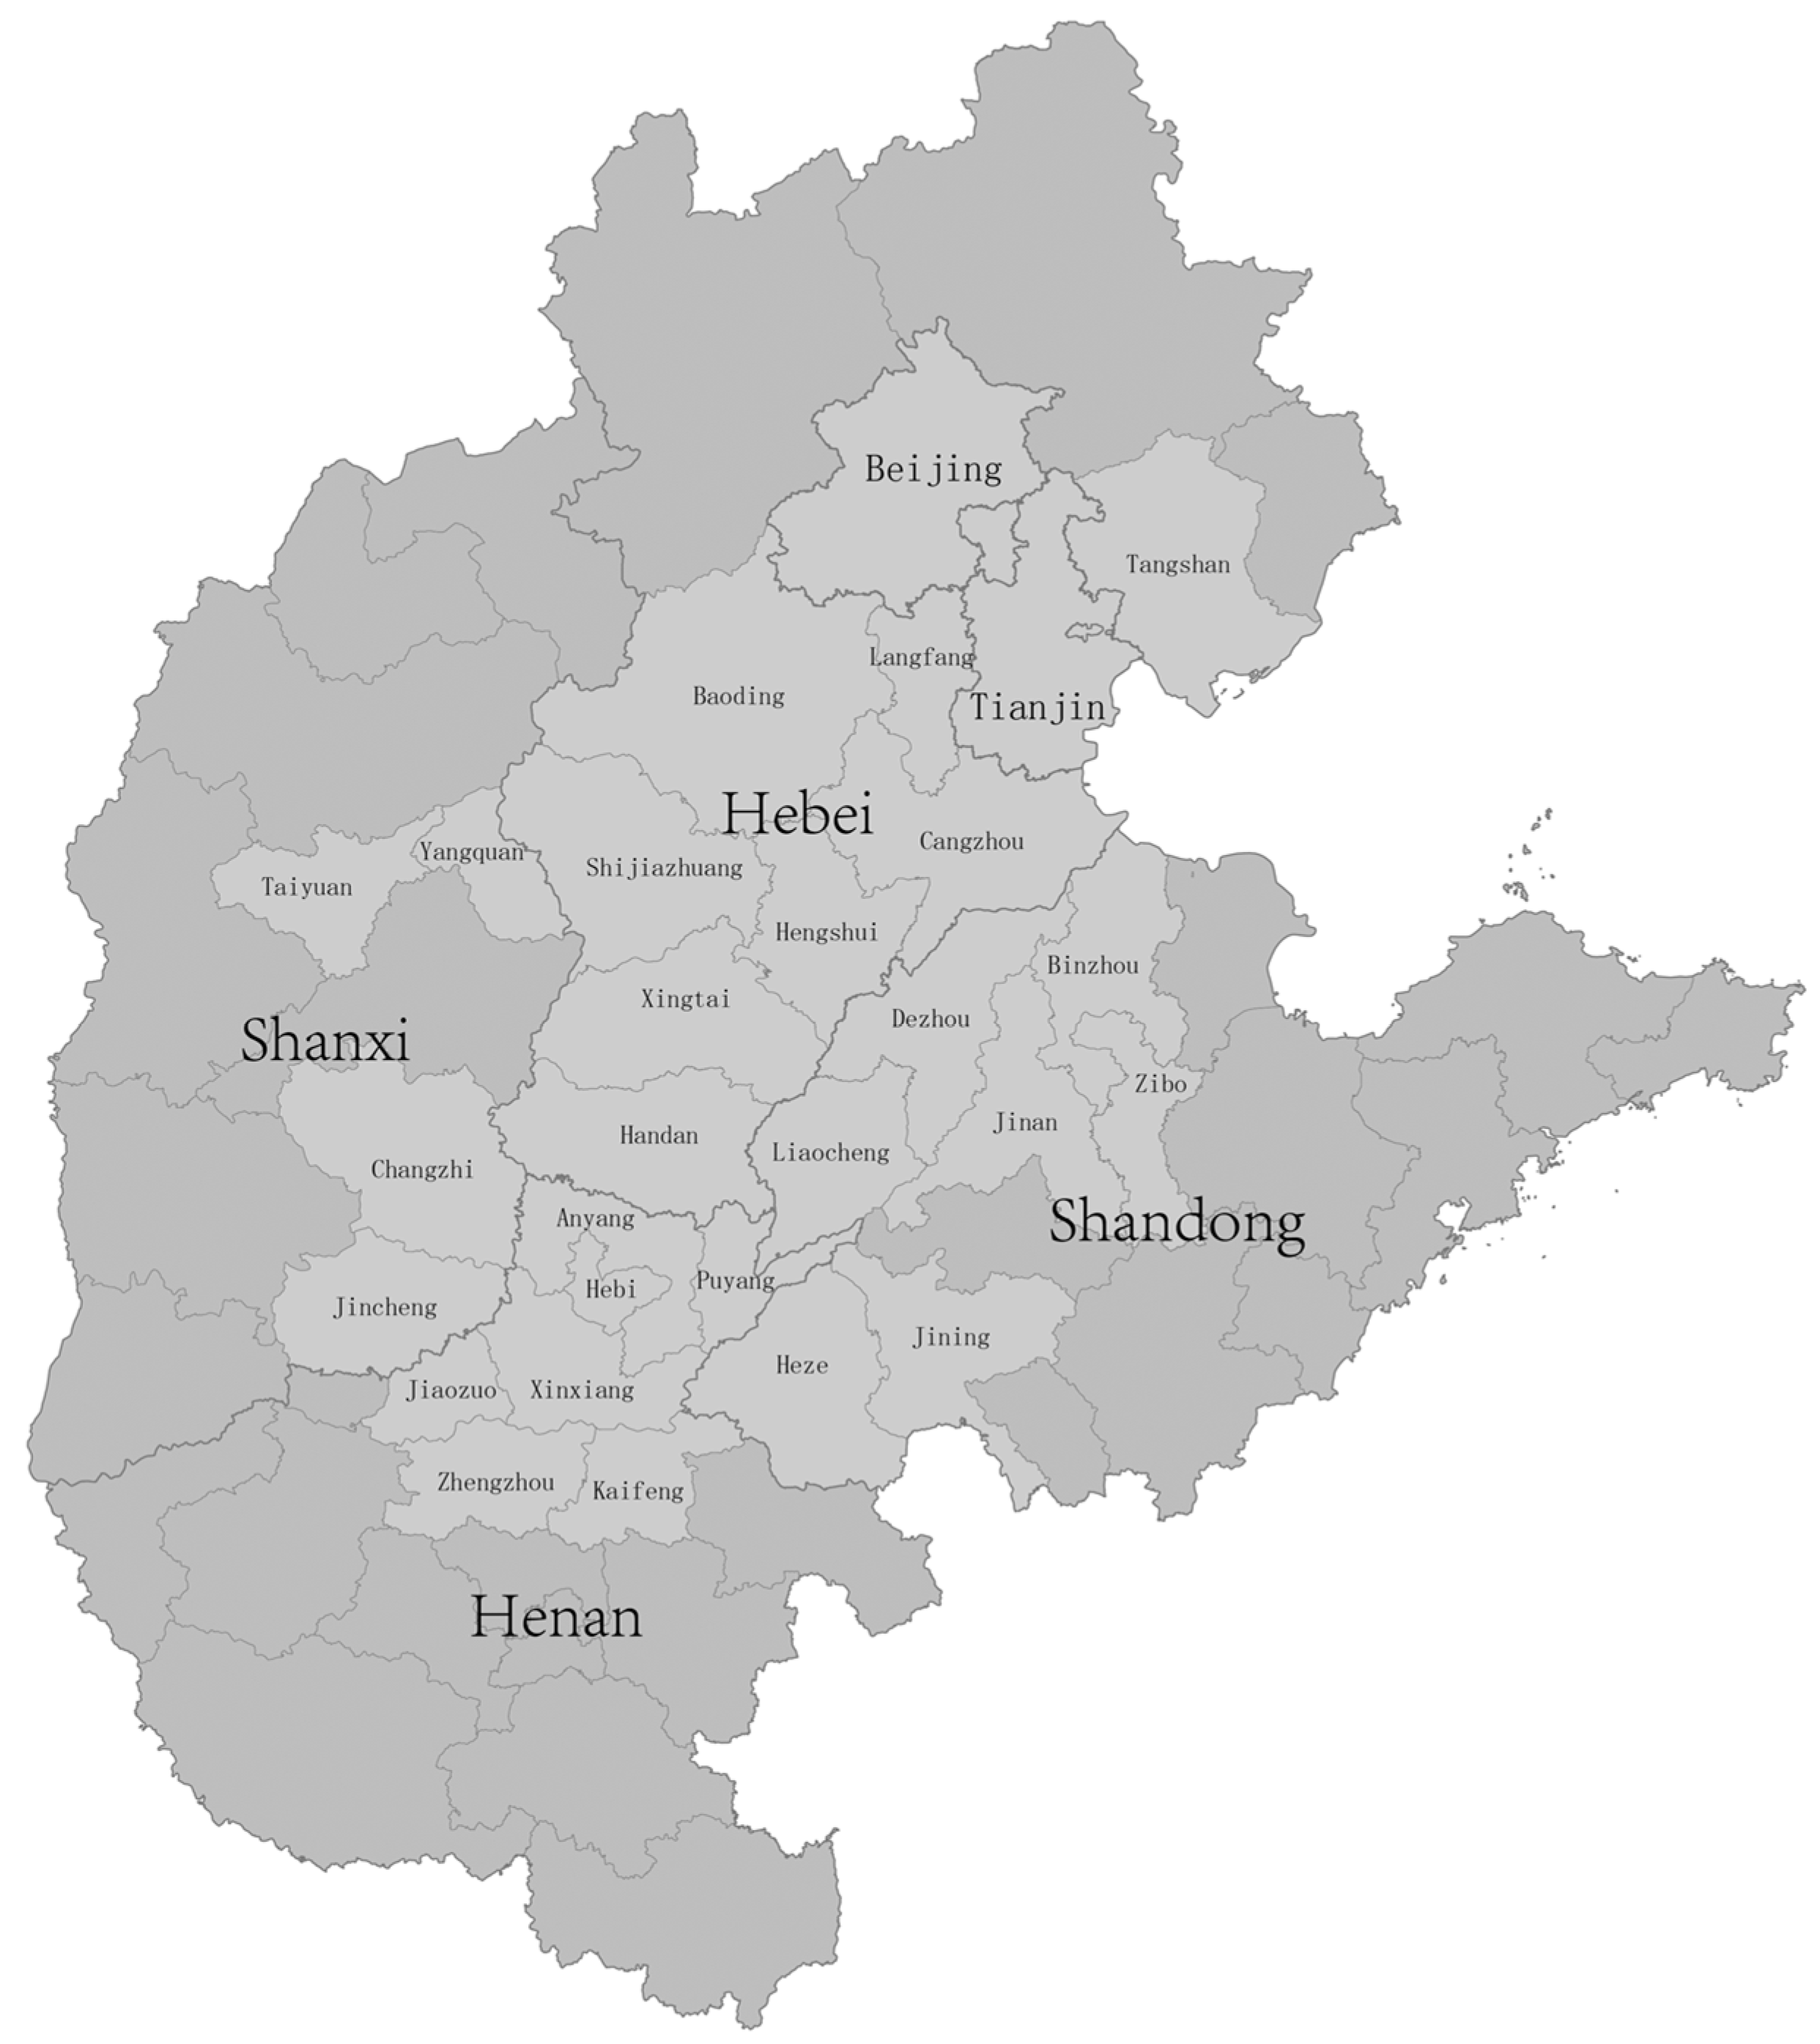
4]. This is the beginning for the collaborative governance of trans-regional air pollution in the Beijing–Tianjin–Hebei region. Affected by factors such as the adjacent geographical locations and the industrial structure dominated by highly polluting enterprises, when heavy pollution occurs, polluted air masses are easily transmitted and superimposed among the 28 cities, resulting in regional heavy pollution. Therefore, these 28 cities are also known as Beijing–Tianjin–Hebei air pollution transmission channel cities, referred to as “2 + 26” cities, and the city range is shown in
Figure 1. The 2021 China Ecological Environment Status Bulletin shows that the average proportion of good days in “2 + 26” cities has reached 67.2%, and the number of days with severe pollution or above has dropped to 3.2% in 2021 [
5]. This shows that the “2 + 26” cities have basically achieved the set goal of eliminating heavy pollution weather, laying a solid foundation for the successful conclusion of The Three-Year Action Plan for Winning the Battle of Blue Sky.
The results of the collaborative governance of air pollution in “2 + 26” cities show that regional coordination has a significant effect on solving regional and complex air pollution problems. Therefore, the collaborative governance of air pollution in “2 + 26” cities was traced back to grasp its development context, and based on this, the structural characteristics and evolution trend of the network of collaborative governance of air pollution in “2 + 26” cities were explored. It is not only a key link for understanding why regional coordination can achieve the set goal of regional air pollution prevention, but it is also an important measure for further optimizing and improving the “2 + 26” cities collaborative governance structure for air pollution and improving the efficiency of collaborative governance. In view of this, this study took the collaborative governance of air pollution in “2 + 26” cities based on related policy texts, intergovernmental agreements, news reports, etc., from 2017 to 2021 as the research object. This work used social network analysis. Based on the analysis of the collaborative governance of air pollution in the “2 + 26” cities relationship value matrix and visual network atlas, its structural characteristics and evolution trend were determined. Based on this, corresponding policy suggestions for the optimization and improvement of the collaborative governance of air pollution in “2 + 26” cities are put forward.
2. Literature Review
Regional collaborative governance is a development mode of co-construction, co-governance, and sharing formed through communication, cooperation, consultation, and participation by multiple subjects in order to realize the overall interests of the region. The constant appearance of regional public affairs and the increasing difficulty and complexity of governance mean that a single subject no longer has the resources and conditions for independent action. Regional collaborative governance has become an important theoretical basis and action plan for government departments in solving cross-regional governance problems such as regional environmental pollution and regional public service supply [
6]. The attention of the practical circle to regional collaborative governance has aroused the concern and thinking of the theoretical circle. Two approaches are presented in relevant research: On the one hand, some scholars focus on examining regional collaborative governance at the theoretical level, and believe that regional collaborative governance has removed the scope of territorial management [
7], and does not pursue the establishment of an integrated governance system, but focuses on voluntary cooperation between local governments, and emphasizes frequent interaction and collaboration between government departments and between government departments and private sectors based on regional governance goals [
8]. It can be found that regional collaborative governance attaches importance to consensus formation among local governments through consultation and dialogue and advocates a collaborative mechanism involving multiple subjects [
9], which provides good ideological inspiration for the governance of cross-regional problems that cannot be properly solved by a single government subject [
10]. On the other hand, some scholars also pay attention to the practical application of regional collaborative governance. Based on the review and sorting of the application of this mechanism in cross-regional ecological environment, public service supply, economic integration development, and other fields, they believe that, through communication and consultation, interest compensation, cross-regional linkage, and other measures, regional collaborative governance has effectively achieved the governance goal of solving cross-regional problems and developing regional economy. However, due to the traditional departmentalism, regional division, and other inertia thinking blocks, the lack of coordination consciousness and the low degree of coordination also need to be paid attention to. By giving legitimacy to regional coordinated legislation, we should innovate the system, mechanism, and policy tools of regional collaborative governance, and promote the unity and implementation of the relationship between the responsibilities, rights, and interests of governance subjects [
11], so as to ensure the stable play of the effects of regional collaborative governance [
12].
The remarkable advantages of regional collaborative governance in dealing with regional public affairs, especially in solving cross-regional problems with significant externalities, lay a foundation for its application in the field of regional air pollution prevention. Scholars mainly discuss the problem of collaborative governance of regional air pollution in terms of three dimensions: The first is research on the influencing factors for regional air pollution collaborative governance. The analysis of the influencing factors for the collaborative governance of regional air pollution carried out from subjective and objective perspectives by existing studies shows that the strength of supervision and assessment by the superior government and the level of environmental awareness of local governments determine whether local governments can achieve cooperative governance of trans-regional air pollution [
13]. At the same time, the establishment of interregional joint organizations, the improvement of benefit compensation mechanism, and the support and participation of the public have a significant impact on the maintenance of collaborative governance behavior [
14,
15], which constitute the key factors to promote the normalization of regional air pollution collaborative governance [
16]. The second is research on the effect evaluation of regional air pollution collaborative governance. Based on the evaluation of the effect of collaborative governance of air pollution in Beijing–Tianjin–Hebei [
17], Yangtze River Delta [
18], and other regions [
19], the study found that although coordinated emission reduction and joint law enforcement measures taken by regional local governments have improved regional air quality to a certain extent [
20], large-scale emission reduction measures have also consumed huge costs [
21,
22]. Moreover, the pollution control effect of relevant measures has a time lag [
23], and the control effect of different air pollutants is also different [
24]. This kind of situation needs to be paid attention to in the optimization and adjustment of future policies [
25]. The third is research on the optimization and perfection of the measures of regional air pollution cooperative governance. Based on the analysis of the current situation of collaborative governance practices of air pollution in some regions of China, some scholars have proposed that the key to optimize and improve the collaborative governance mechanism of trans-regional air pollution is to realize the shared responsibility and reasonable cost sharing. To achieve this goal, on the one hand, we can learn from the beneficial experience of European and American countries in the sharing of legal responsibility for environmental governance, combine the principle of common but differentiated responsibility for emission reduction, accelerate the process of collaborative legislation on regional environmental protection issues [
26,
27], and realize the sharing of responsibility for collaborative governance of regional air pollution [
28]. On the other hand, we can also make reasonable cost sharing strategies for haze control, innovate the interest balance and compensation system for collaborative governance of air pollution among local governments, improve the benefits of direct control while reducing the cost of control risks, and implement other measures to ensure the reasonable cost sharing of collaborative governance of regional air pollution, so as to achieve long-term stable operation of collaborative governance of regional air pollution [
29]. In addition, as one of the areas with the most serious air pollution in China, some scholars have taken Beijing–Tianjin–Hebei and its surrounding areas as research objects to carry out special research on the air pollution problems in this area. The study found that the air pollutants in “2 + 26” cities have obvious spatial mobility [
30], resulting in each city having significant spatial association effects of air pollution with at least another city [
31].The spatial range of pollutant concentration extends from southeast to northwest [
32], and presents a spatial distribution pattern that the plain is larger than the mountain area, and the city is larger than the suburb [
33]. In terms of the causes of air pollution, the industrial waste gas produced by the developed manufacturing and construction industries in the region is an important source of air pollution [
34]. The clean heating and joint emission reduction measures jointly implemented by cities in the region have effectively curbed the growth of pollutant concentration and constitute the key measures for air pollution control in the region [
35,
36]. The relevant research results have laid a solid theoretical and practical foundation for the implementation of the collaborative governance policy of air pollution in “2 + 26” cities.
The regional and complex characteristics of air pollution provide an opportunity for the introduction of social network analysis methods into this field. On the one hand, research based on the data of regional air pollutants as the governance object found that the spatial correlation of major air pollutants between cities showed typical network structure characteristics [
37]. In addition, each city has an obvious unbalanced position in the air pollution spatial network. High pollution cities may affect multiple cities at the same time, while low pollution cities may also be affected by multiple cities. Therefore, in order to improve the effectiveness of the joint prevention and control of air pollution, it is necessary to ensure the reasonable sharing of governance costs among cities [
38]. On the other hand, research based on the data of the intergovernmental relations network as the main governance body found that the central government has always been at the core of the collaborative governance network of air pollution. Moreover, due to the lack of common strategies and authoritative coordination organizations, the collaborative governance network of air pollution among local governments still has obvious characteristics of mobilization governance [
39]. In general, the research on air pollution control based on the social network analysis method is still in its infancy. However, the regional and complex characteristics of air pollution mean that the traditional atomistic analysis idea of taking individuals as objects is not applicable to the research of air pollution control. The actor network perspective based on the relationship between individuals to explain individual behavior has become a feasible strategy for exploring the problem of the collaborative governance of air pollution.
Reviewing the existing research, we found that the academic community has fully discussed the theoretical review and practical application of regional collaborative governance, as well as the influencing factors, effect evaluation, mechanism improvement, and other issues of collaborative governance of regional air pollution. Focusing on the related research on collaborative governance of air pollution in Beijing–Tianjin–Hebei and its surrounding areas, some scholars began to carry out special research on the spatial distribution differences of air pollutants in this area from the perspective of the treatment object. Relevant research results provide a solid theoretical foundation for this paper, and also show the existing research gap. First, as a specific application of collaborative governance theory in the field of air pollution prevention and control, the existing research tends to discuss the practical effect, mechanism, and optimization path of collaborative governance of regional air pollution from a macro perspective, while the research on collaborative governance of regional air pollution from the perspective of micro-actor interaction network is slightly insufficient. Second, studies on the spatial distribution of air pollutants in the Beijing–Tianjin–Hebei and its surrounding areas that have emerged in recent years have shown that researchers have realized the potential value of social network analysis in the study of collaborative governance of regional air pollution. However, the research carried out from the perspective of regional air pollutants as the treatment object cannot reveal how regional governance subjects can build a collaborative governance network of air pollution and how to realize the benign operation of the governance network. Third, the available research on collaborative governance of regional air pollution from the perspective of intergovernmental relations network focuses more on the discussion of the cooperation network between central and local governments, but neglects the horizontal cooperation and interaction between local governments as the specific implementers of policies, which cannot systematically show the overall picture of the actor-interaction network of collaborative governance of regional air pollution, nor can it provide a basis for the further optimization and improvement of the interactive network. In view of this, this paper takes the collaborative governance of air pollution in “2 + 26” cities related policy texts, intergovernmental agreements, news reports, etc., from 2017 to 2021 as the research object using the social network analysis method. Based on the analysis of the overall structure, the internal characteristics and evolution trend of the collaborative governance network of air pollution in “2 + 26” cities clarify the status quo of the local government cooperation network in the collaborative governance of regional air pollution. It provides a theoretical reference for the benign operation of the actor network of collaborative governance of regional air pollution and the long-term operation of collaborative governance of regional air pollution.
3. Research Design
3.1. Research Method
This paper discusses the structural characteristics and evolution trend of the collaborative governance of air pollution in “2 + 26” cities by using the social network analysis method. A social network is a collection of social actors and their action relationships. Social network analysis is an important method to study how social actors form social networks and how social networks develop and evolve. Freeman summarized four core elements of social network analysis: First is the structural perspective, which describes and discusses the behavior of actors from the perspective of social relations and interaction structure. Second is relational data with a focus on the relationship between social actors rather than individual attributes, and the co-occurrence matrix formed by actors in interaction constitutes the database of social networks. Third is the visual display, which is made up of a visual network graph based on nodes and connections and is used to describe the social network. Nodes represent the actors in the social network, and connections represent the relationships between nodes. Fourth is a focus on quantitative analysis, which mainly uses quantitative measurement indicators such as network scale, cohesive subgroups, centrality, and factions to describe the position of actors in the social network and calculates some characteristics of the social network itself [
40].
Specifically, social network analysis mainly analyzes the relationship network formed between actors from the following three aspects: the overall structure of the network, cohesion subgroup, and centrality. Among them, the density of the overall structure of the network is an indicator used to measure the degree of relevance between the various actors in the relationship network. If there is a higher correlation among the actors in the network, the network density will be greater. For a one-mode network, the network density is the ratio of the number of relationships that actually exist in the network to the number of relationships that may exist in theory. For an undirected network with
N nodes and
L actual connection lines, the calculation formula of its network density is shown in model (1).
Cohesive subgroup analysis mainly explores the relationship between actors. When the relationship between some actors in the overall network is particularly close, and these actors form a secondary network, this secondary network is called a cohesive subgroup. Compared with the overall network, the members of the cohesive subgroup are more closely connected, and the cooperation in information exchange and resource sharing is more frequent, which constitutes the core area of the overall relationship network. The analysis of the cohesive subgroups in the social network can objectively reflect the “center edge” structure of the overall network, and to some extent predict the development trend of the network. The centrality analysis includes two indicators: the centrality of the nodes and the centralization index of the graphs. Among them, the centrality of the nodes includes point centrality, betweenness centrality, and closeness centrality.
The point centrality mainly measures the degree to which a node is directly connected with other nodes. The higher the value of the node’s degree of point centrality, the higher the centrality of the node’s position in the overall relationship network. The calculation formula of the point centrality is shown in model (2).
The betweenness centrality mainly measures the degree to which a node is not controlled by other nodes, that is, the extent to which an actor controls resources. The calculation formula of the betweenness centrality is shown in model (3).
The closeness centrality mainly measures the degree to which nodes are in the intermediate position between other nodes. The higher the value of the node’s degree of closeness centrality, the more it indicates that the node is not the core of the overall relationship network. The calculation formula of the closeness centrality is shown in model (4).
In the above formula, , , and represent the point centrality, betweenness centrality, and closeness centrality of actor . N represents the scale of the relationship network. represents the number of relationships between actor and other actors. represents the number of geodesic lines containing between actors and . represents the number of all geodesic lines between actors and . represents the distance between actors and . The above three indicators collectively reflect the centrality of an actor in the whole social network. Corresponding to the centrality index measuring the centrality of nodes, the centralization index is mainly used to measure the centrality of the overall network, that is, the degree of integration or consistency of the overall relationship network. For example, if all nodes in a relationship network are connected with only one of them, and there is no connection between them, the centralization index of the network is 100%. On the contrary, if each node in the relationship network is connected in pairs, the centralization index of the network is 0%.
In view of the significant advantages of social network analysis in exploring the structural elements and network characteristics of regional collaborative governance, this paper uses social network analysis to build a visual network atlas based on the collaborative governance relationship data of air pollution in “2 + 26” cities, so as to intuitively display the status quo and evolution process of the collaborative governance network of air pollution in “2 + 26” cities. The structural characteristics of the collaborative governance network of air pollution in “2 + 26” cities are analyzed at three levels: the overall network at the macro level, the cohesive subgroup at the meso level, and the node centrality at the micro level.
3.2. Data Source and Data Sorting
In terms of sample selection, the network actors identified in this paper are 28 municipal government entities involved in the collaborative governance of air pollution in “2 + 26” cities. The municipal government is in the middle of China’s administrative hierarchy. It is not only under the macro guidance of the central and provincial governments, but also responsible for directing grassroots governments and functional departments to implement relevant policies. This special position shows that the municipal government is key to transforming macro institutional arrangements into practical actions. At the same time, the institutional arrangement of the collaborative governance of air pollution in “2 + 26” cities, which takes cities as the basic governance unit, also means that the level of synergy between municipal governments will directly determine the success or failure of the policy of air pollution joint prevention and control in “2 + 26” cities. Therefore, municipal governments often have both the objective necessity to promote consultation and cooperation and the subjective initiative to achieve collaborative governance. The analysis of the collaborative network among municipal governments is typical for demonstrating the collaborative governance among governments.
In terms of data sources, this paper adopts a data collection method based on documents and network search. The data are mainly from the database of Peking University, “2 + 26” city government portals, CNKI newspaper databases, and some authoritative news portals, such as Windows of the Capital, Dazhong, Dahe, etc. The specific retrieval method is to collect the policy documents, intergovernmental agreements, and news reports on the collaborative governance of air pollution in “2 + 26” cities published on various websites by taking air pollution, Beijing–Tianjin–Hebei and its surrounding areas, ‘2 + 26’ cities, collaborative governance, joint prevention and control, joint meetings, joint action, and other keywords. In terms of the time range of data collection, The 2017 Work Plan for Air Pollution Prevention and Control in Beijing–Tianjin–Hebei and Surrounding Areas issued in early March 2017 marks the official implementation of the collaborative governance of air pollution in “2 + 26” cities, while the successful conclusion of The Three Year Action Plan for Winning the Battle of Blue Sky announced at the end of February 2021 marks the phased victory of the collaborative governance of air pollution in “2 + 26” cities. Therefore, in combination with the above documents, the time range of data collection in this paper is from March 2017 to February 2021. On this basis, by taking the year as the unit, the time is further divided into four stages, namely, from March 2017 to February 2018, from March 2018 to February 2019, from March 2019 to February 2020, and from March 2020 to February 2021, to investigate the evolution of the collaborative governance network of air pollution in “2 + 26” cities.
After the preliminary collection of data, cross information and invalid information will be eliminated and merged. Multiple joint meetings held regularly by the same actors, joint actions on the same theme in different time periods, and joint emergency response measures taken by multiple entities in case of heavy pollution conditions are recorded together. After checking and screening, 107 pieces of data that can be used for social network analysis were finally obtained. On this basis, we further assign values to the data for social network relationship calculation. In view of the two-way nature of intergovernmental collaboration, the sample data used in this paper are undirected. In terms of relationship assignment, we extract the relevant information from the original data. Whenever there is a related statement about the joint document, joint meeting, or joint action between the government entities of the “2 + 26” cities in the data, the value of the collaborative relationship between the relevant cities will be increased by 1. For example, based on the original data, large-scale heavy pollution weather occurred in Beijing–Tianjin–Hebei and its surrounding areas from 12 November to 16 November 2020. In the process of this air pollution event, 17 cities, including Beijing, Tianjin, Shijiazhuang, Tangshan, Langfang, Baoding, Cangzhou, Hengshui, Xingtai, Handan, Zhengzhou, Kaifeng, Anyang, Hebi, Xinxiang, Jiaozuo, and Puyang, jointly launched the emergency response to heavy pollution weather, and took joint action measures such as emergency emission reduction [
41]. Based on this, it can be considered that the above cities have taken collaborative governance measures in the process of this heavy pollution weather; thus, the value of the collaborative relationship between the above cities has been increased by 1. Similarly, we analyze the 107 original data after sorting one by one, and then assign the value of the collaborative relationship between the “2 + 26” cities. Finally, we can obtain the multi-value relationship value matrix of the collaborative governance of air pollution in “2 + 26” cities in four stages.
After constructing the relationship value matrix, it can be imported into Ucinet software, which was produced by Analytic Technologies, Lexington, KY, USA, for social network analysis. Ucinet is a software package jointly developed by Borgatti, Everett, and Freeman for processing social network data [
42]. The commonly used faction analysis, centrality analysis, and cluster analysis in social network analysis can be realized through Ucinet software. In addition, through the built-in Net-Draw function, Ucinet software can also draw a visual map of social networks, so as to intuitively display the whole picture of the relationship network. In view of the key role of Ucinet software in the analysis of social networks, this paper will use Ucinet software to analyze the data of the collaborative governance of air pollution in the “2 + 26” cities relationship matrix formed in the previous links.
4. Empirical Analysis
4.1. The Overall Network at the Macro Level
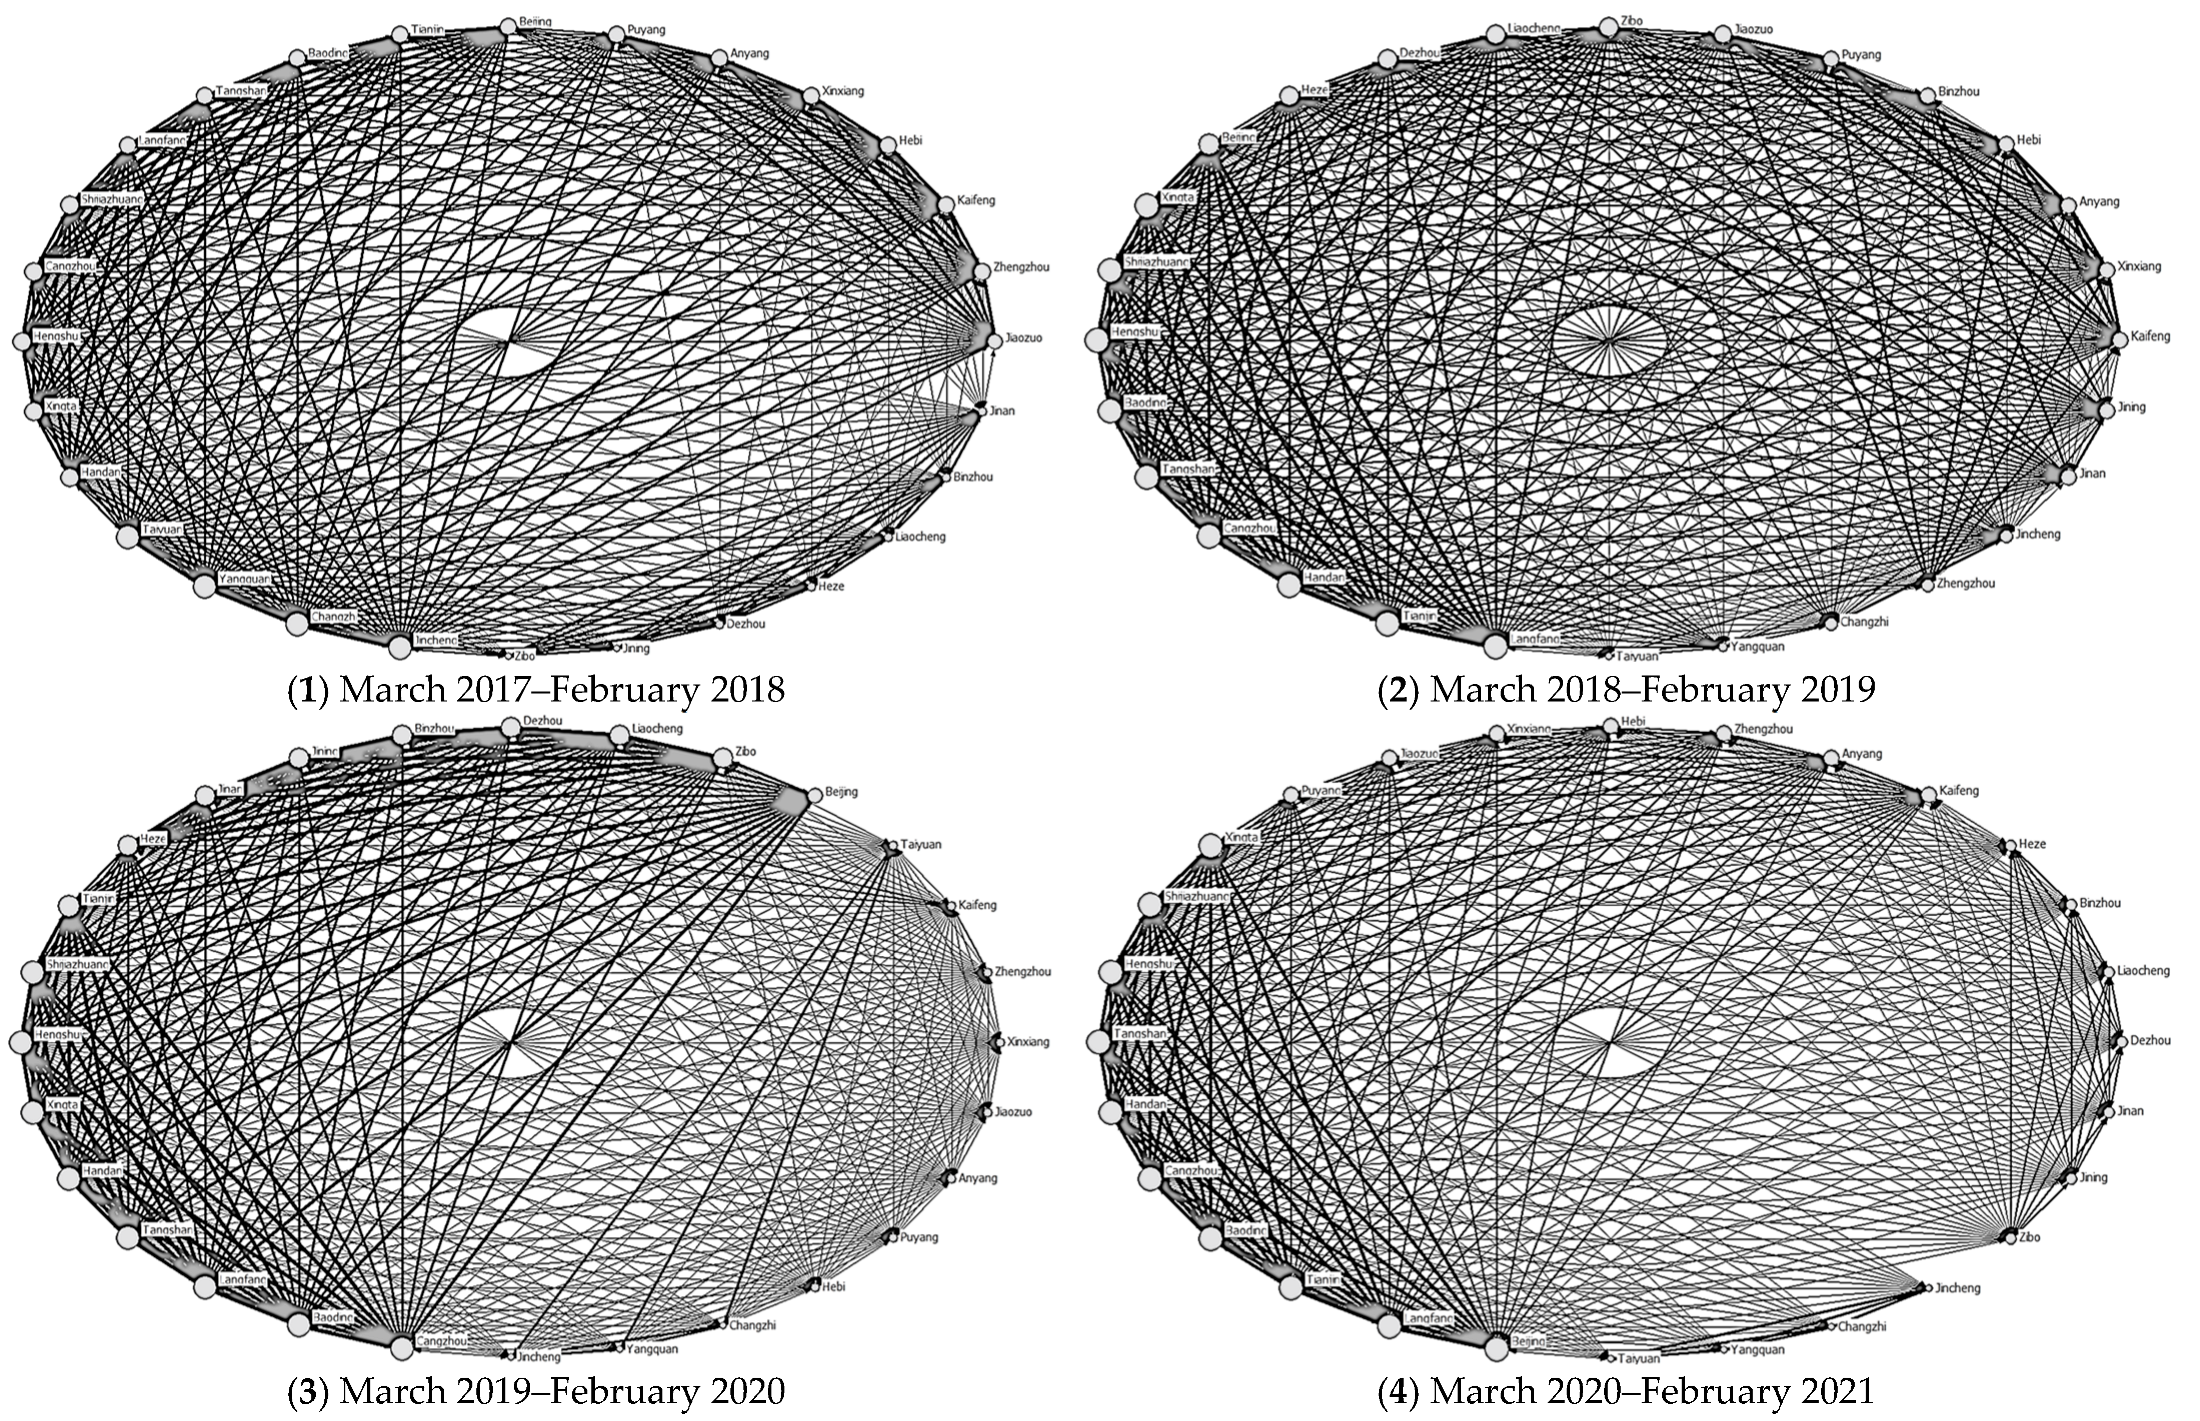
Taking the end of February as the time node, the data are divided into four stages according to the period of March 2017–February 2018, March 2018–February 2019, March 2019–February 2020, and March 2020–February 2021, and the collaboration value matrix is imported into the Ucinet software to draw the four stages of collaborative governance network visualization map of air pollution in “2 + 26” cities, as shown in
Figure 2(1)–(4). The nodes in
Figure 1 are the “2 + 26” cities participating in the collaborative governance of air pollution, and the connection between the points represents the collaborative governance relationship between the subjects. On the basis of the visualization map, the network structure indicators of the four stages are measured to reflect the changes of the collaborative relationship in different stages. The results are shown in
Table 1. Among them, the number of samples represents the total amount of information about the collaborative governance of air pollution among the subjects within a certain period of time. The scale represents the number of subjects participating in the collaborative governance of air pollution. The number of ties represents the number of associations between various actors in the network structure. The density indicates the degree of correlation between various actors in the network structure. Generally speaking, the density of the overall network is positively correlated with the density of the relationship between the various actors, that is, the higher the network density, the more frequent the cooperation between the actors. By comparing the collaborative network structure diagrams at different stages, we can find the evolution of the positions of different actors in the collaborative network at different stages, the changes in the strength of their cooperation relationships, and the changes in the coordination modes of the main actors, so as to explore the structural characteristics and evolution trends of the collaborative network from the macro level.
From
Figure 2, it can be found that, since March 2017, there has been frequent collaborative governance behaviors among “2 + 26” cities aimed at regional air pollution. At the same time, combined with the network density analysis results in
Table 1, it can be further found that the collaborative governance network of air pollution in “2 + 26” cities presents an overall evolution trend of an inverted V-shape from relatively dense to dense, and then it gradually becomes sparse. On the one hand, this is because in the early stage of collaborative governance of air pollution in “2 + 26”cities, cities are not familiar with the cross-provincial collaborative governance of air pollution. Under the influence of territorial management system, even if there is cross-regional collaborative governance of air pollution in cities, it is limited to the same province. Then, with the strong promotion of the central government and provincial government, as well as the exploration attempt among cities, the cross-provincial collaborative governance behavior of air pollution gradually increased. This makes the collaborative network between “2 + 26” cities show a dense evolution in the first two stages. On the other hand, the reason why the collaborative governance network of air pollution in “2 + 26” cities evolved from dense to sparse in the last three stages is that at that time, the form of collaborative governance of air pollution in “2 + 26” cities was mainly the joint launch of emergency response to heavy air pollution weather. That is to say, when heavy air pollution weather occurs, “2 + 26” cities will jointly launch the emergency response and take corresponding measures to achieve the goal of collaborative governance of regional air pollution. However, with the improvement of air pollution, the frequency of launching emergency response to heavy air pollution weather in cities has decreased significantly. This is reflected in the collaborative governance process of air pollution in “2 + 26” cities, which reflects the evolution of the collaborative network from dense to sparse.
By observing the collaborative governance network structure diagram at each stage, it can be found that the evolution of the collaborative network is mainly affected by the frequency change of cross-provincial collaborative governance behavior. However, no matter how the overall network density changes, there is always frequent collaboration and interaction between cities belonging to the same provincial administrative region, and there are small groups composed of cities belonging to the same provincial administrative region at all stages. For example, according to
Figure 1, Changzhi and Jincheng are subordinate to Shanxi Province, while the neighboring cities of Anyang, Xinxiang, and Jiaozuo are subordinate to Henan Province. Generally speaking, these five cities take more frequent collaborative governance actions against air pollution because of their close geographical locations. However, combined with
Figure 2, we can find that Changzhi and Jincheng are more closely related to the collaborative governance of Taiyuan and Yangquan, which are also subordinate to Shanxi. Meanwhile, Anyang, Xinxiang, and Jiaozuo also tend to have more frequent collaborative governance behaviors with Zhengzhou, Kaifeng, Hebi, and Puyang, which belong to the same province. By observing the specific collaborative governance behaviors among cities in each province, it can be further found that forms of collaborative governance are not limited to jointly launching emergency response, but there are more diverse collaborative governance methods such as joint meetings and joint law enforcement actions. It can be seen that although the air pollution situation in each city has improved significantly since the implementation of the joint prevention and control policy of air pollution in “2 + 26” cities [
5], with the normalization of air pollution prevention and control, it is more important to think about how to break the constraints of territorial management ideas on regional and complex air pollution control. In addition to an emergency response, initiatives to explore and implement new forms of cross-provincial collaborative governance of air pollution should be created, so as to further improve joint prevention approaches and better control air pollution. This has obviously become a question that must be considered in the future to optimize and improve the collaborative governance system and mechanism of regional air pollution.
4.2. The Cohesive Subgroup at the Meso Level
Cohesive subgroup analysis of the collaborative governance network of air pollution in “2 + 26” cities can show the existing sub structures in the overall network and the relationship between them. The specific association mode of collaborative governance between “2 + 26” cities is reflected through the evolution of different stages of the internal members of the substructure, so as to examine the changes of the internal characteristics of the collaborative network from the meso level.
Import the value matrix of the “2 + 26” cities’ collaborative relationship into the Ucinet software, and use faction analysis to cluster the data. The results of cohesive subgroup analysis and “core—edge” analysis are shown in
Table 2 and
Table 3, respectively. In view of the fact that the current form of collaborative governance of air pollution in “2 + 26” cities is mainly the reality of jointly launching the emergency response to heavy pollution weather, the cohesive subgroups at different stages are the most representative city combinations of jointly launching the emergency response to heavy pollution weather in different periods. The members in the core position at different stages are the combination of cities with the highest frequency of heavy pollution weather in each period.
Observing the cohesive subgroups in each stage, we can find that, first of all, the cohesive subgroups with the largest number of members in each stage mostly cover all the cities in each province that are included in the “2 + 26” city range. For example, in the analysis result 1 with the largest number of members in each stage, the eight cities affiliated with Hebei Province are always the specific members of this cohesive subgroup. This shows that the cities affiliated to Hebei Province have frequent cooperative and interactive behaviors in the process of regional air pollution control, and have formed stable secondary governance groups. At the same time, cities belonging to the same provincial administrative region tend to jointly launch emergency responses to deal with air pollution in case of heavy pollution weather. This further confirms the previous analysis on the evolution of the overall collaborative network structure, that is, no matter the increase or decrease in cross-provincial collaborative governance behavior, there is always frequent collaborative governance interactions for air pollution between cities in the province.
Secondly, Beijing, Tianjin, and cities in Hebei Province are specific members of each cohesive subgroup in most cases. According to the “core—edge” analysis results, it can also be found that Beijing, Tianjin, and cities in Hebei Province are core members at different stages in most cases. The reason is that, based on the data, the three provinces (cities) in Beijing, Tianjin, and Hebei have begun to implement diversified collaborative governance measures of regional air pollution, including regional joint prevention of meteorological disasters, joint law enforcement of pollution issues, and joint special action of motor vehicle pollution, in addition to the emergency response to heavy pollution weather. This can obviously provide reference for other cities to explore and implement normalized trans-provincial collaborative governance of air pollution.
Finally, it can be found from the specific number of members of each cohesive subgroup in the four stages that, with the promotion of the collaborative governance of air pollution in “2 + 26” cities, the number of specific members in the cohesive subgroup is steadily declining. By observing the analysis results with a relatively small number of specific members in each stage, we can find that the number of specific members has decreased from 17 in the first stage to 14 in the fourth stage. At the same time, by observing the “core edge” analysis results, it can also be found that in the first stage, 14 cities are core members of the collaborative governance of air pollution in the “2 + 26” cities. However, in the fourth stage, only 10 cities in the Beijing–Tianjin–Hebei region remain at the core of the collaborative governance of air pollution in “2 + 26” cities. It is not difficult to infer from the actual situation of “2 + 26” cities in which the main form of collaboration is to jointly launch the emergency response to heavy air pollution weather. The reason for this phenomenon is the reduction in emergency response initiation frequency in heavy air pollution weather. This not only shows the remarkable effect of the collaborative governance of air pollution in “2 + 26” cities from the side, but also further shows that it is urgent to explore and establish a more normalized and comprehensive collaborative governance measure of regional air pollution across provinces.
4.3. The Node Centrality at The Micro Level
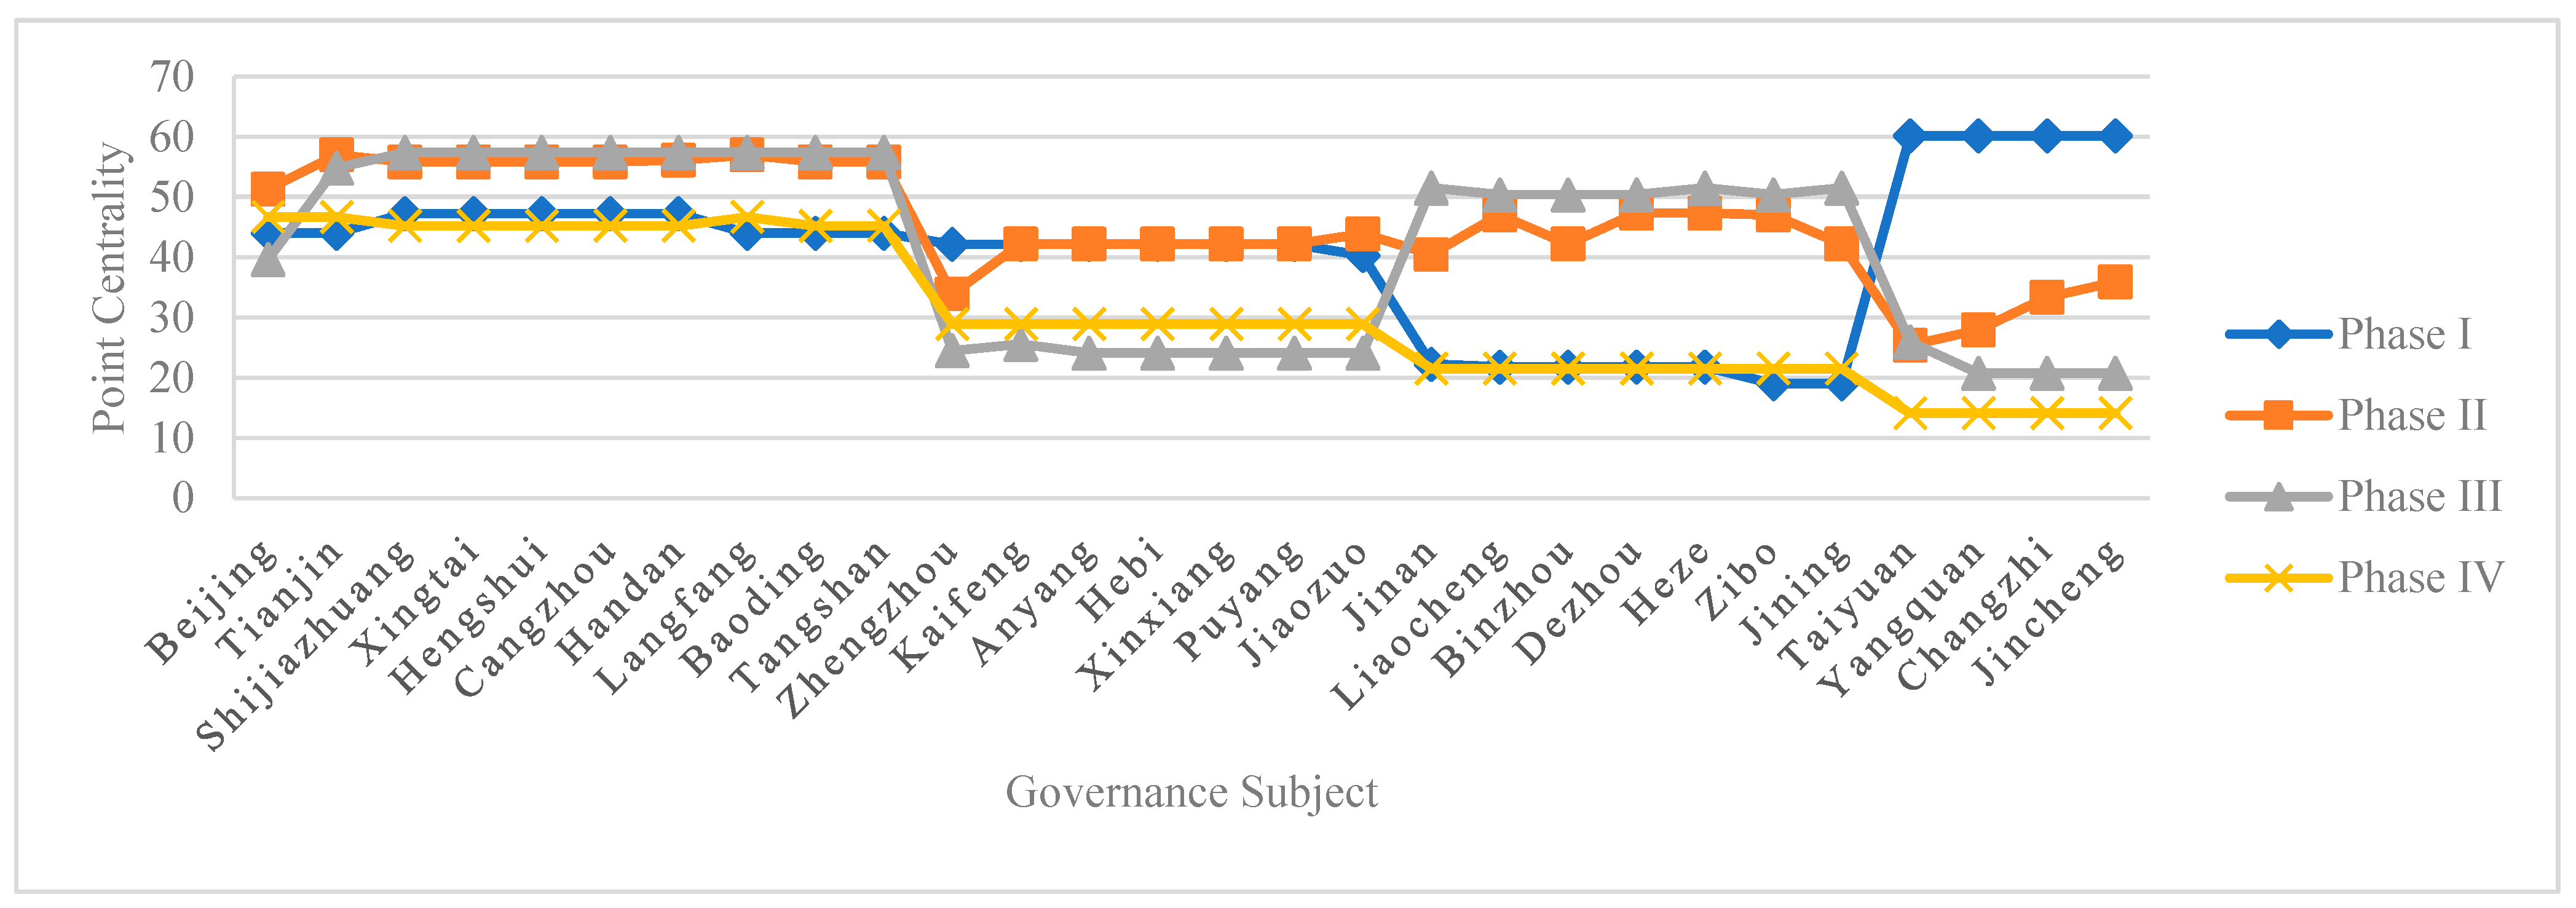
The node centrality analysis can measure the microstructure of the collaborative governance network of air pollution in “2 + 26” cities. Through the analysis and judgment of the change trend of indicators such as point centrality, betweenness centrality, and closeness centrality, the change of the location of “2 + 26” cities in the collaborative network is displayed, so as to objectively reflect the overall structure evolution of the collaborative network.
First of all, we looked at the evolution analysis of the point centrality of the collaborative governance network of air pollution in “2 + 26” cities in different stages. According to the calculation, the point centralization index of the collaborative network in the four stages is 21.08%, 12.1%, 16.89%, and 16.98%, respectively. It can be found that the point centralization index of the collaborative network developed from high to low and then slowly increased. This shows that there are relatively central actors in the collaborative network in the first stage, and then the influence of each actor tends to be balanced, and the overall network shows a trend of decentralization.
The specific indicators and their evolution of the point centrality of different actors in each stage are shown in
Figure 3. It can be found that, firstly, in most cases, there is no significant difference in the point centrality of cities belonging to the same province at the same stage. This shows that the influence of cities in the same province in the overall network is relatively balanced, and when severe pollution weather occurs, cities in the province tend to participate in the collaborative governance of regional air pollution by jointly launching an emergency response. Secondly, the point centrality of Beijing, Tianjin, and cities in Hebei Province has always been at a high position in the four stages, indicating that the coordinated air pollution control activities in the Beijing–Tianjin–Hebei region are relatively frequent. The reason is that, on the one hand, in recent years, heavy air pollution weather has occurred frequently in the Beijing–Tianjin–Hebei region, and the emergency response frequency of heavy air pollution weather jointly launched by various cities is relatively high. On the other hand, the deeper reason is that Beijing, Tianjin, and Hebei have established a relatively complete regional environmental law enforcement linkage mechanism under the guidance of a coordinated development strategy. Driven by the normalized air pollution joint prevention and control policy, the region is inclined to carry out more frequent collaborative governance activities. Thirdly, the four cities in Shanxi have the highest point centrality in the first stage, and then gradually decline with the passage of time. This shows that the heavy air pollution weather in the early stage of the collaborative governance of air pollution in Shanxi is more serious, and the emergency response to the heavy air pollution weather in the four cities is more frequent. Then, the lower point centrality of the four cities shows that the air pollution situation in the four cities has improved significantly over time. This also shows the remarkable effect of the “2 + 26” cities collaborative governance model on regional air pollution problems.
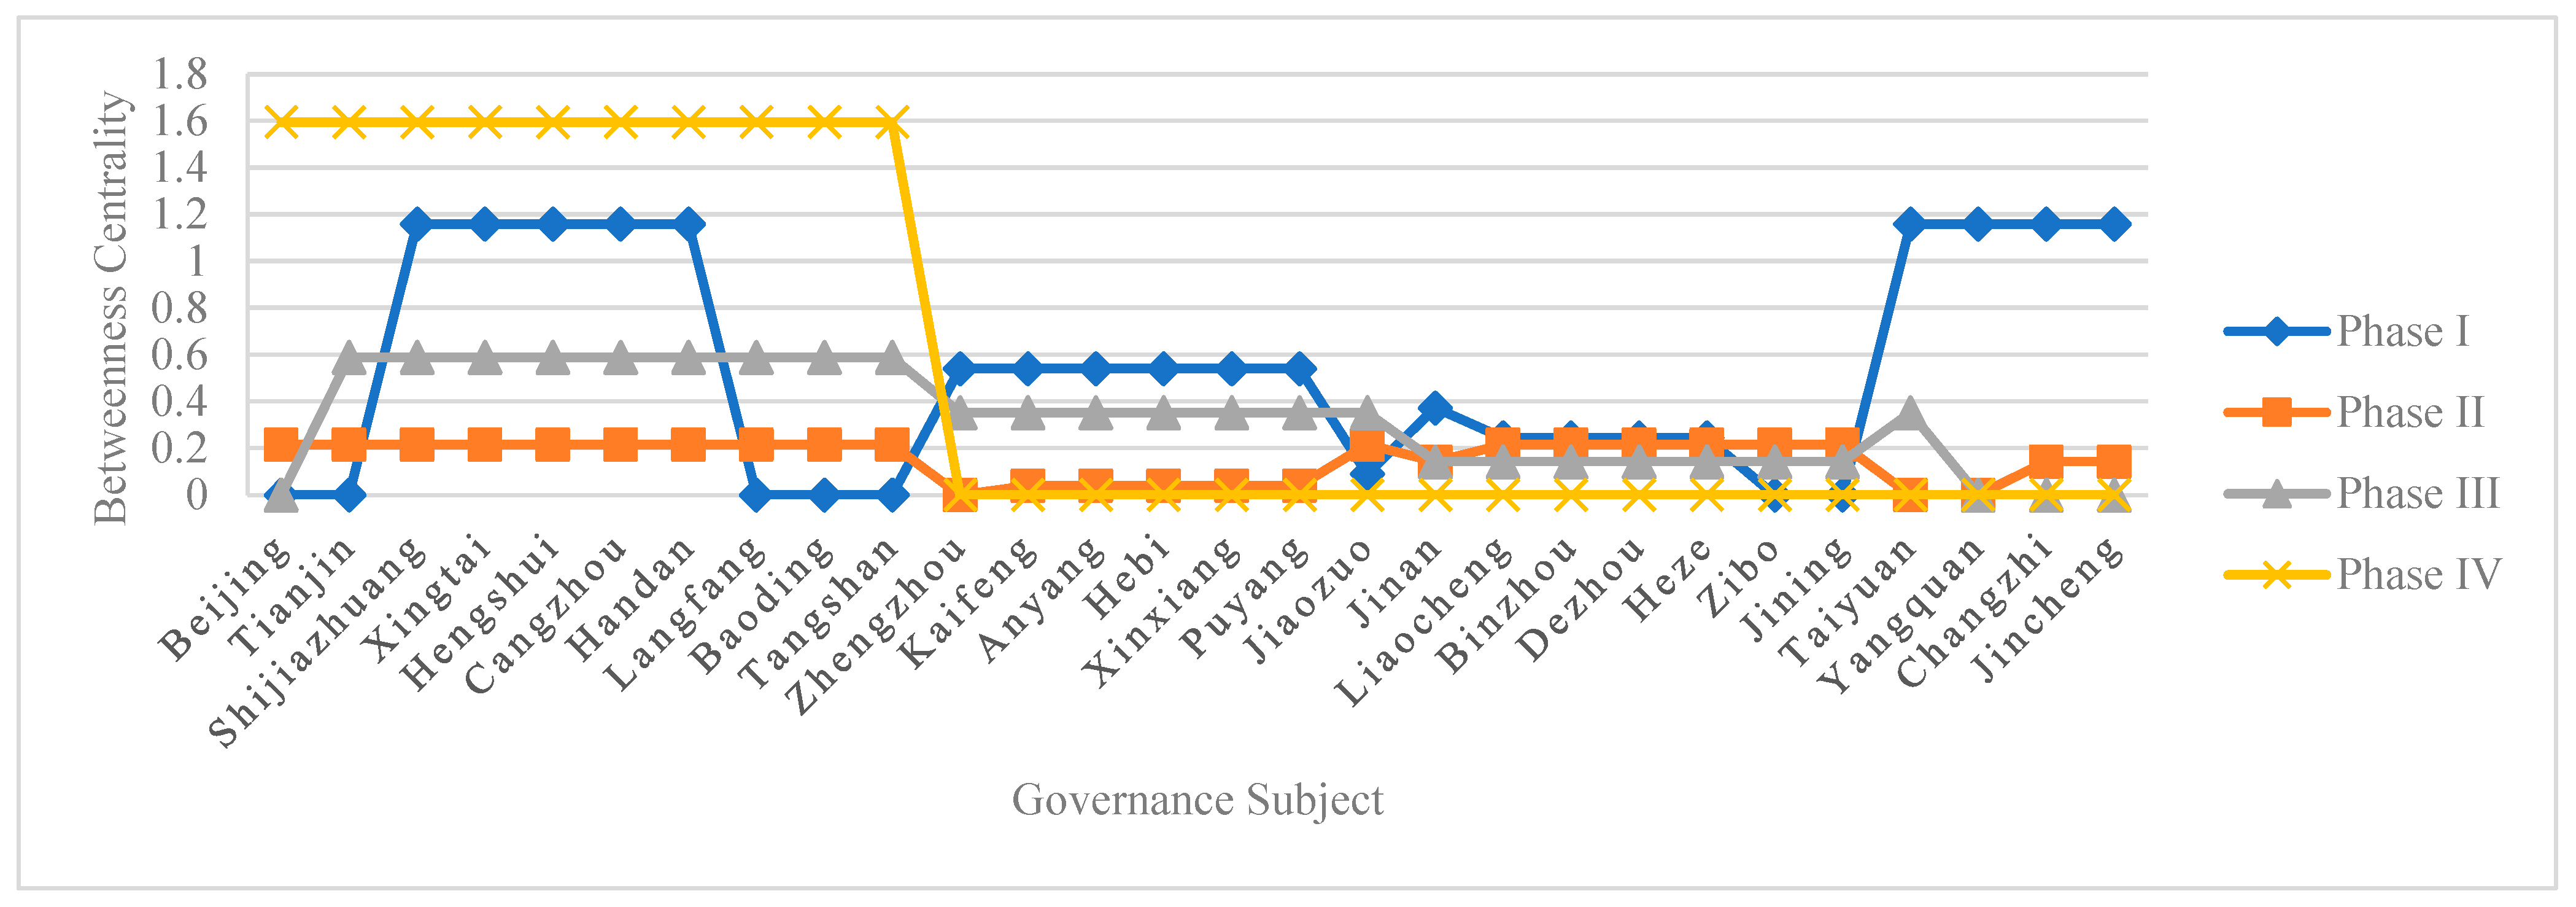
Second, the evolution analysis of the betweenness centrality of the collaborative governance network of air pollution in “2 + 26” cities in different stages is shown. According to the calculation, the betweenness centralization index of the collaborative network in the four stages is 0.64%, 0.06%, 0.27%, and 1.06%, respectively. It can be found that the betweenness centralization index of the collaborative network has not changed significantly in the four stages, and the index of each stage is around 1%. This shows that the control power of each city in the collaborative network is relatively balanced, and there are no key actors in the overall network that can control other actors.
The specific indicators and their evolution of the betweenness centrality of different actors in each stage are shown in
Figure 4. It can be found that, firstly, in the first stage, most cities have a high betweenness centrality, and the cities of Zhengzhou, Kaifeng, Anyang, Hebi, Xinxiang, Puyang, Jinan, Taiyuan, Yangquan, Changzhi, and Jincheng have the highest betweenness centrality in the first stage among the four stages. This shows that in the first stage, the above cities frequently participated in the collaborative governance of regional air pollution, that is, they jointly launched the emergency response to heavy pollution weather many times. Secondly, most cities significantly reduced their betweenness centrality in the subsequent stages, and even in the fourth stage, except for the three provinces (cities) of Beijing, Tianjin, and Hebei, the betweenness centrality of cities under the jurisdiction of other provinces decreased to zero. On the surface, this result shows that the control power of the above cities in the overall network is reduced, and the collaborative interaction between them tends to decrease. However, the underlying reason is that the frequency of emergency response to heavy pollution weather jointly launched by the above cities is significantly reduced, that is, the air pollution situation is significantly improved. Thirdly, the significant increase in the betweenness centrality of Beijing, Tianjin, and cities in Hebei Province in the fourth stage indicates the improvement of their influence in the overall network. The reason is that under the circumstance that the frequency of interactive actions in other cities implementing an emergency response of heavy air pollution weather as the main form of collaborative governance has significantly decreased, consequently, normalization action between Beijing, Tianjin, and Hebei, represented by joint meetings and joint law enforcement, has gradually become the main form of collaborative governance of regional air pollution. The three places have occupied an increasingly important position in the collaborative network.
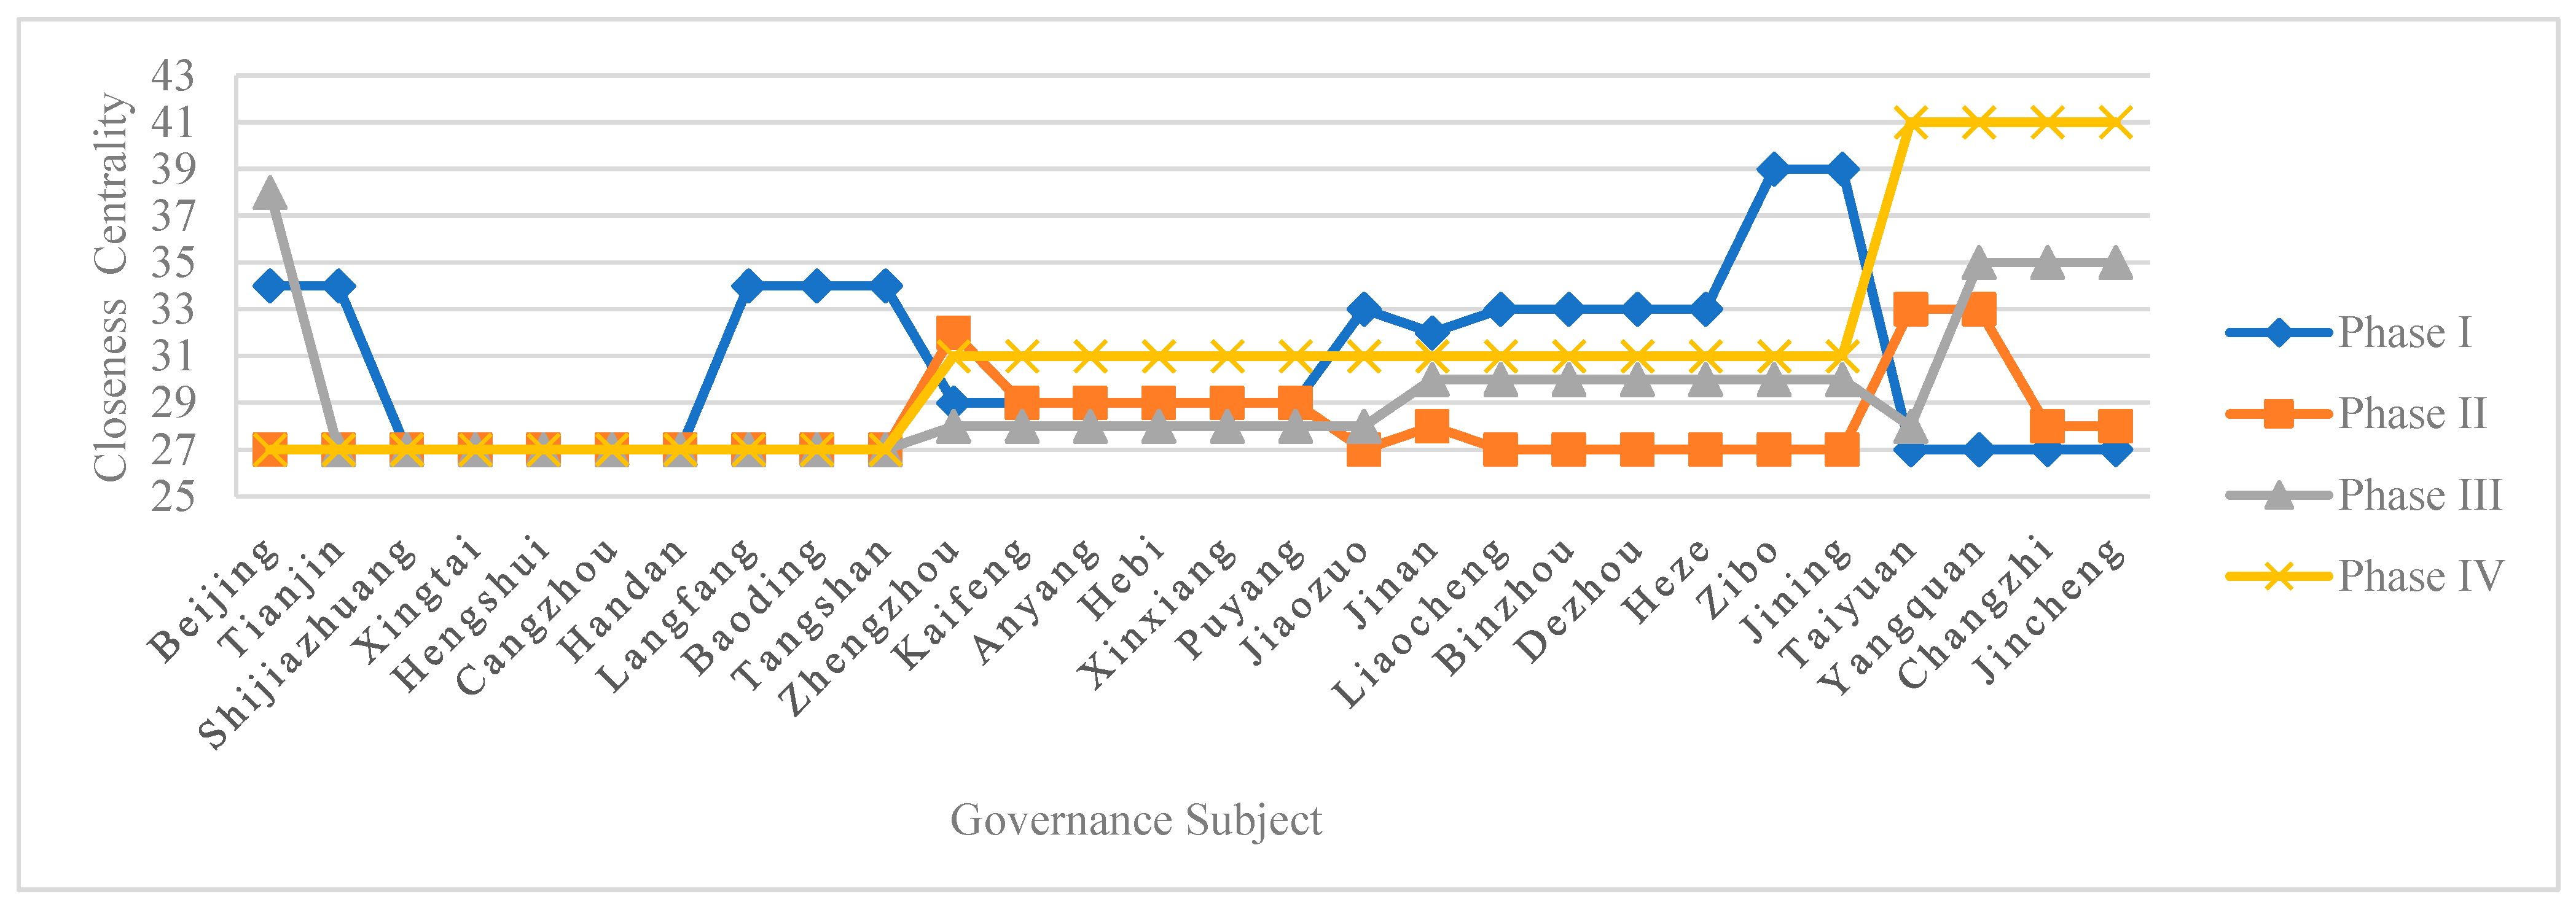
Third, the evolution analysis of the closeness centrality of the collaborative governance network of air pollution in “2 + 26” cities in different stages is shown. According to the calculation, the closeness centralization index of the collaborative network in the four stages is 23.59%, 7.34%, 14.8%, and 23.95%, respectively. It can be seen that although the closeness centralization index of the collaborative network fluctuates slightly in the four stages, its index value is always around 20%. This further shows that there is no central actor in the collaborative governance network of air pollution in “2 + 26” cities. The influence and control of all actors in the overall network are relatively balanced.
The specific indicators and their evolution of the closeness centrality of different actors in each stage are shown in
Figure 5. It can be found that the closeness centrality of cities in the four stages shows obvious correlation with provinces and regions as the boundary. Firstly, the closeness centrality of Beijing, Tianjin, and Hebei is at the lowest level in most cases, indicating that there is always frequent interaction between them in the collaborative governance of air pollution. Secondly, the closeness centrality of cities in the Shandong and Henan Province fluctuates in the four stages, but the change range is relatively small, indicating that the position of cities in the overall network is relatively fixed and the frequency of collaborative activities is relatively stable. The reason is that Shandong and Henan are not the only important members of the “2 + 26” cities; cities in the border area between Jiangsu, Anhui, Shandong, and Henan are included in the key areas of air pollution prevention and control in the border area between Jiangsu, Anhui, Shandong, and Henan. This provides more frequent opportunities for the cities of Shandong and Henan to jointly control air pollution. Third, among the four cities in Shanxi, except Taiyuan, the closeness centrality of the other three cities shows a trend of increasing gradually, and in the fourth stage, the four cities are the maximum of the closeness centrality in the overall collaborative network. This shows that the coordination frequency of the four cities in the overall network has decreased, which also shows that the regional air pollution situation of the four cities has improved significantly.
5. Conclusions and Policy Insights
5.1. Conclusions
Using the social network analysis method, based on the collaborative governance of air pollution in “2 + 26” cities-related policy texts, intergovernmental agreements, news reports, etc., from 2017 to 2021, this paper builds the synergy relationship value matrix and visual network atlas, and discusses the structural characteristics and evolution trend of the collaborative governance of air pollution in “2 + 26” cities at the following three levels: the overall network at the macro level, the cohesive subgroup at the meso level, and the node centrality at the micro level. Finally, this paper draws the following conclusions.
First of all, the outstanding achievements in air pollution prevention and control in Beijing–Tianjin–Hebei and its surrounding areas are attributed to the precise and efficient collaborative governance among the “2 + 26” cities. After years of development, the “2 + 26” cities have formed a relatively stable multi-agent and decentralized collaborative governance network of air pollution control. Starting from the overall interests of the region, cities have broken the boundaries of administrative divisions between different government entities in the region by using certain organizational and institutional resources. Instead, taking the overall regional air environment quality as the basic control unit and planning and implementing a common air pollution prevention and control plan will help to ultimately achieve the goal of controlling regional air pollution, improving regional air quality, and sharing regional governance results.
Secondly, the collaborative network formed by the “2 + 26” cities based on the joint launch of the emergency response to heavy air pollution weather is an important measure for the effective treatment of regional air pollution problems. Based on the visual network map, it can be found that the collaborative governance network of air pollution in “2 + 26” cities has experienced an overall evolution trend with an inverted V-shaped trend from relatively dense to dense, and then gradually sparse. The reason is that with the promotion of the collaborative governance of regional air pollution, the heavy air pollution weather is significantly reduced, and the frequency of cities jointly launching an emergency response to the heavy air pollution weather is correspondingly reduced, which leads to the relatively weak synergy between the cities. Although this result shows that the regional air pollution situation is gradually improving, as a non-conventional means, the pollution control effectiveness of the heavy pollution weather emergency response mechanism is often achieved through mandatory emission reduction measures such as temporary construction site shutdown, factory production restriction, truck embargo, etc., when heavy pollution weather occurs, which will undoubtedly cost high emission reduction costs. Needless to say, as an unconventional means of governance, mobilization governance can achieve the rapid integration and allocation of human, financial, material, and other resources in a very short time, thus realizing the rapid improvement of the regional environmental quality. However, the immediate governance effects often come at a high cost. At the same time, with the significant reduction in the frequency of heavy pollution weather in the short term, this unconventional collaborative governance measure is not conducive to the stability and continuity of the collaborative governance network of air pollution in “2 + 26” cities. It also has a certain negative impact on the long-term improvement of the regional atmospheric environment. In fact, in order to prevent the rebounding of air pollution control effects in this region, it is necessary to promote the normalized cooperation of air pollution control from the perspective of institutional construction and mechanism improvement. In other words, exploring and establishing a normalized air pollution collaborative governance mechanism and building a collaborative network combining normalized combat and emergency response should be the future exploration direction of the collaborative governance of air pollution in “2 + 26” cities.
Finally, the collaborative governance of air pollution in “2 + 26” cities has an obvious differential coordination pattern, that is, the collaborative relationship between adjacent cities is relatively close, while the collaborative relationship between cities with cross-province or distant space is relatively loose, showing a nested differential order network structure. Based on the visual network map, it can be found that with the reduction in the frequency of emergency responses to heavy pollution weather, the density of the collaborative network between “2 + 26” cities tends to decrease, and the collaborative relationship between cities across provinces tends to weaken, while the collaborative interaction between cities belonging to the same province or adjacent cities has not changed significantly. Taking Beijing, Tianjin, and Hebei as an example, Beijing, Tianjin, and the cities in Hebei Province have strong collaborative network relations in the four stages, and in most cases, the cities in the three provinces (cities) are the actors at the core of each stage. The reason is that under the guidance of the coordinated development strategy, the three provinces (cities) established the normalized regional air pollution joint prevention and control measures with joint meetings, joint law enforcement, and joint actions as the main collaboration methods, which has helped to realize the transformation of the cross-regional air pollution collaboration from emergency response management to normalized management. This can obviously provide important experience for other cities to establish and implement a more normalized and systematic collaborative governance mechanism of regional air pollution.
5.2. Policy Insights
Based on the above conclusions, in order to further realize the optimization and improvement of the collaborative governance of air pollution in “2 + 26” cities, this paper puts forward the following policy suggestions.
First of all, the cooperation among multiple subjects should be deepened and the normalization of the collaborative governance of regional air pollution should be promoted. To realize the transformation from mobilization cooperation to normalization cooperation, which is mainly based on the joint launch of the heavy pollution weather emergency response, we must effectively realize the combination of the “prevention” and “control” of regional air pollution. To be specific, on the one hand, we need to cultivate the awareness of ecological communities of multiple subjects in the region. Compared with the actor network formed by the intervention of external forces, the collaborative governance network formed by the active cooperation of actors has lower cost and higher stability. Therefore, the further improvement of the effectiveness of collaborative governance of air pollution in “2 + 26” cities is inseparable from the cultivation of ecological community awareness. To this end, it is not only necessary to enhance the initiative of enterprises in the region to save energy and reduce emissions, as well as to transform and upgrade the industrial structure, update sewage equipment, and eliminate outdated production capacity, but it is also necessary to increase the enthusiasm of ordinary people to participate in environmental protection and advocate a green and healthy production and lifestyle. The aim is to effectively reduce emissions and coordinate successfully on the regional scale. On the other hand, it is necessary to formulate and improve the overall plan for the collaborative governance of regional air pollution. Strengthening the unified action ability of cooperative organizations and the ability of local governments to normalize the collaborative governance of air pollution is also important. Relying on big data, artificial intelligence, cloud computing, and other advanced technologies, the aim should be to build a unified and complete public air pollution data information-sharing platform, so as to achieve cross-regional government-normalized collaborative supervision and unified law enforcement, as well as to help promote the scientific and accurate governance of regional air pollution.
Secondly, the independent action of local governments and the formation and optimization of subgroups should be strengthened. The autonomous regional air pollution prevention and control measures carried out by Beijing, Tianjin, and Hebei under the guidance of the coordinated development strategy show the important role of subgroups in building a normalized collaborative governance system of air pollution. Therefore, it is necessary to strengthen the autonomous action of local governments. On the basis of fully considering the differences in the development level and demand between local governments, space should be provided for local governments to independently build small-scale consultation mechanism, so as to achieve local breakthroughs in the collaborative governance of regional air pollution. At the same time, the restrictive effect of the intervention of the higher-level government on the autonomous cooperation of the local government should be considered. Therefore, in the process of shaping the subgroups between local governments, the higher-level government should mainly provide guarantees to support local government actions by means of supervision and guidance and reduce or avoid the mobilization or negative regional governance. At the same time, in order to enhance the enthusiasm of local government officials to carry out collaborative governance of regional air pollution, a complete environmental governance performance evaluation index should also be established. This includes taking collaborative governance performance of regional air pollution as an important part of evaluating the working ability of local government officials, so as to ensure the realization of collaborative governance goal of regional air pollutions.
Finally, attention should be paid to the differential coordination between local governments and the coordination and complementarity of strong and weak links should be realized. The network structure characteristics and evolution process of the collaborative governance of air pollution in “2 + 26” cities show that the collaborative relationship between “2 + 26” cities is strong or weak due to administrative divisions and spatial distance. Generally speaking, a strong connection is conducive to the establishment of trust relations. From here, forms of stable and sustained cooperative relations can be established, while weak connections can provide the possibility for cooperation and exchange between actors. Obviously, both strong and weak connections are essential for the normalization of the collaborative governance of air pollution in “2 + 26” cities. Therefore, on the one hand, we should strengthen the strong connection between neighboring cities and establish consensus through independent consultation and interaction, so as to establish a stable collaborative network based on trust. On the other hand, we should also pay attention to cities with weak connections in the collaborative network. By establishing a sound mechanism of responsibility sharing, cost sharing, and benefit sharing, we can ensure the full participation of regional governance, so as to realize the coordination and complementarity of strong and weak links and help in the long-term operation of the normalized collaborative governance of air pollution in “2 + 26” cities.


