1. Introduction
Traffic accidents are unavoidable and can occur anytime and anywhere. The World Health Organization (WHO) reports that approximately 1.35 million lives are lost to traffic accidents each year [
1]. Traffic accidents cost about 3% of most counties’ gross domestic product (GDP). To be precise, 1500 to 3500 people were killed each year due to road accidents in the UK in the years between 2000 to 2013 [
2]. However, it has been adequately managed recently by using road safety measures that have been implemented due to a better understanding of the determining causes. Road accidents are influenced by external factors, such as weather conditions, road status, and driver skills. According to [
3], more severe injuries were sustained in darker conditions (at night without streetlights) and dry road surface conditions. The month, season, and weather conditions were also significant factors in the analysis conducted by Wang et al. [
4] in China, showing that autumn and winter were likely to cause severe fatalities brought on by difficult weather such as rain and snow. However, Potoglou et al. [
5] show that summer and autumn seasons are more likely to result in traffic accidents from data from Italy and Europe, which are more relevant to this research because it uses data from the UK.
Traffic accident data patterns can be explored and studied using machine-learning-enabled big data analysis techniques. Road accident datasets are variant, unstructured, large, and rapidly changing. Because of this, traditional data processing and storage techniques offer no benefits, especially where the data processing platform is restricted (i.e., a single data server). Hence, road accident analysis applications (e.g., prediction) need to benefit from robust and scalable data processing frameworks to analyze massive and/or streaming datasets according to distributed computing fashion. Apache Spark is an open-sourced framework that provides a unified data analysis framework to manage big data tasks [
6,
7]. It can perform workloads at up to 100 × faster speeds than Hadoop using a directed acyclic graph (DAG) scheduler, supporting operation optimization [
8]. Yet, it supports cluster-based computing through which several data servers are linked to run data analysis codes. Spark provides a machine learning library named MLlib, which includes several machine learning algorithms for classification, regression, decision trees, and so forth [
6].
This paper focuses on predictive data analysis for road car accidents. The prime goal is to propose a predictive machine learning model with the capacity of analyzing and determining accident severity, casualty count, and the number of vehicles involved. The authors performed a validated and online large dataset to train and test the machine learning models [
9]. The dataset includes traffic accident data during 2005–2014, except in 2008 in the UK. Four machine learning techniques, including decision trees, random forest classification, multinomial logistic regression, and naïve Bayes classifications, were set up and evaluated to find the best fit predictive model for road accidents. To do so, each dependent variable was predicted by using several parameters that were chosen because of their high correlation. They are outlined as weather conditions, light conditions, road type, road surface conditions, season, time of day (daytime/nighttime), date of the week (weekday/weekend), area (i.e., rural or urban), and region (including latitude and longitude). The machine learning techniques were fed the training dataset to propose the prediction model. The prediction accuracy of each machine learning technique was measured and compared to highlight the best fit one with maximized accuracy. The key contributions of this research are outlined below:
To study road car accident data patterns and figure out the most influential/meaningful predictive and prediction features in accident data analysis;
To pre-process and prepare a public dataset in order to meet the requirements of a comparative machine-learning-enabled traffic accident data analysis;
To build, train, and evaluate four machine learning methods to find the best fit solution based on three different targets.
The overall outline of the paper is as follows:
Section 2 reviews the literature to present the key benefits of machine learning techniques, especially in the field of road accident prediction, and the correlated and determinant variables towards such accidents.
Section 3 focuses on the research methodology and explains data pre-processing, selected features for model fitting, and a predictive model design.
Section 4 outlines the results and discusses the key findings of this research. In
Section 5, we conclude the paper and address future works.
2. Literature Review
Machine learning enabled by big data analytic techniques can propose a predictive road accident model to increase road safety and conserve resources. For this, some solutions have been designed to manage road accidents. Li et al. [
10] support that weather conditions influence the amount of road traffic accidents. Small scale increments (SSI) in weather can cause a reduction in visibility when fog accumulates; the effect of rain and snow on the road surface condition can also cause traffic accidents [
11]. Other research by Hammad et al. [
12] has also shown that weather conditions, such as rainfall, temperature, and windstorms, are directly related to the occurrence of road traffic accidents. Elassad et al. [
13] used weather conditions in traffic accident crash prediction with support vector machines and multi-layer perceptron to generate high accuracies due to the correlation between weather and traffic accidents. Several kinds of models have been proposed to deduce a beneficial approach to road accident prediction [
14]. Kumeda et al. [
15] revealed that lighting conditions, road class and number of vehicles are the key features via fuzzy-FARCHD, random forest, hierarchal LVQ, RBF network (radial basis function network), multilayer perceptron, and naïve Bayes models. Moghaddam Gilani et al. [
16] used the multiple logistic regression and the pattern recognition type of artificial neural network (ANN) to show the role of environmental variables in Rasht city. Mohanta et al. [
17] implemented logistic regression, artificial neural network, decision tree, K-nearest neighbors, and random forest and proposed a web-based message alert system. Labib et al. [
18] figure out factors that have a clear effect on road accidents in Bangladesh by using decision tree, K-nearest neighbors (KNN), naïve Bayes, and AdaBoost.
According to Bozorg et al. [
19], road traffic accidents are closely related to weather and light conditions. This study analyzed road accident severity based on many different scenarios, such as daylight and fair weather, daylight and poor weather, and others from data generated in the UK and Scotland. Ratio tests determined that these two parameters generated variations in the injury severity, and hence, are determining factors in traffic accidents. Bozorg et al. [
19] show that lighting conditions affect driver visibility and are subject to road traffic accidents. Yet, most traffic accidents are found to have occurred in daylight conditions and when the road’s surface is dry. This is predicted by the recurrent neural network (RNN) from a dataset of accident data recorded between 2009–2015 in Malaysia [
20]. Bozorg et al. [
19] show that lighting conditions affect driver visibility and are subject to road traffic accidents. Yet, most traffic accidents are found to have occurred in daylight conditions and when the road’s surface is dry. The RNN predicts this from a dataset of accident data recorded between 2009–2015 in Malaysia [
20].
It is widely acknowledged that road surface condition is a key external parameter influencing road traffic accidents. Wet road surface conditions are safe only for fewer moving vehicles [
21]. Heavy rain causes more slippery road surface conditions, increasing the risk of a traffic accident [
10,
22]. A chi-square statistical test is used in [
11] to show that road surface conditions are significantly correlated to road traffic accidents, especially in bend (curve) roads. According to the authors of [
4], this indicates that season is statistically correlated to road traffic accidents. This means a greater number of traffic accidents occur in difficult weather conditions during the summer (82%) as compared to winter (62%) [
23,
24]. Studies in Saudi Arabia show that the risk of traffic accidents is significantly increased when the outdoor temperature is high during summer [
25].
Daytime plays a vital role in road accident severity [
26,
27,
28]. According to [
15], weekday occurrence is a significant factor in determining the accident severity for goods delivery, vehicles and motorcycles. The research performed by Adanu et al. [
29] in Alabama, US also analyzes the importance of weekend or weekday occurrences and determines that more accidents occur on weekdays. Still, a higher proportion of severe injuries occurred on weekends.
According to Kumar et al.’s research in India [
30], rural areas are more likely to have road traffic accidents and more fatalities. This study analyzed the traffic accident trend using the day of the week and time parameters and found about two-thirds of the accident victims were from rural regions. Research by Shafabakhsh et al. [
27] also determines the spatial factors that influence accidents by using their x and y location in the geographic information system (GIS) to deploy a clustering technique. Acker and Yuan [
31] also used a case study in Dallas, Texas, USA, using region and time to generate prediction models to find the influence of these parameters (closely related) and apply them to other areas for further analysis.
Ait-Mlouk et al. [
32] utilize a decision tree (DT) model on Apache Spark to predict traffic accidents. This study reports that the proposed model achieves an accuracy of 91% for prediction. It supports that Spark works fast and is scalable on single-node architectures as it can use multi-threading to run parallel computations. Cheng et al. [
33] utilize a random forest prediction model with traffic data for accident prediction. This uses principal component analysis and the year and road type as independent variables to train the random forest model. The dependent variable was the number of road traffic accidents in this case. The generated predictions were found to be good because of the good fitting effect of the model [
34]. Dogru and Subasi [
35] propose a random forest model to explore road accident data patterns. To determine accidents, they benefited from three machine learning techniques, including ANN, support vector machine (SVM), and random forest (RF). According to the results, RF addresses the best results among all predictive models in terms of accuracy, sensitivity, and the detection rate of accidents.
Joni et al. [
36] conduct a traffic accident analysis in Baghdad using a logistic regression (LR) predictive model. This study analyzed independent variables, such as season, day of the week, and road defect, as input for a binary logistic regression (BLR) model to predict the accident severity (dependent variable). The results show that this solution has 80% accuracy using the area under the receiving operating characteristic curve (AUC) by using a validation method of splitting the dataset into training and testing sets. However, when the output variable is not binary and has more than two values, multinomial logistic regression (MLR) can handle such classification, as shown by [
18]. This research uses MLR to predict the accident severity with four possible outcomes so that the classification categories are more explanatory of the accident.
In the research conducted by AlMamlook et al. [
37], LR, RF, and the naïve Bayes classifier (NB) were all used to predict traffic accident severity. RF showed better performance concerning accuracy than the others, with a 70/30 split in the data for training and testing, respectively. Along with DTs, the above algorithms are suitable for generating predictive modes. Parameters such as light condition, weather condition, road surface condition, month, season, weekend, or weekday are all important and determinant factors in road traffic accidents. They should be used in the training of the predictive models. Thus, this research aims to test and evaluate decision trees, random forest, multinomial logistic regression, and naïve Bayes classification models to predict road accidents. It was shown that accident severity, the number of vehicles, and the number of casualties are dependent variables that are predicted using the independent attributes mentioned above.
According to the literature, there is still a research gap to building a comparative machine learning approach to find the best predictive method for road car traffic accident analysis. By this it is meant that road accident data patterns should be studied and processed to figure out the most meaningful predictive and prediction features, find their correlations and dependencies to model (or forecast) road accident behavior. This research aims to pre-process a big online dataset and highlight the most correlated predictive features according to three predictions—mainly accident severity, the number of casualties, and the number of vehicles. Yet, four well-known machine learning models, including decision trees, random forest classification, multinomial logistic regression, and naïve Bayes classifications, are by the dataset and compared to find the best-fit method to forecast car road accidents.
3. Methodology
3.1. Data Preprocessing
Data preprocessing is the process in which the data to be used for the machine learning algorithm are manipulated (e.g., transformed, encoded, etc.) to bring them to such a state that the machine can quickly parse it. Additionally, it is a process in which irrelevant data are deleted or modified to be helpful for the predictive analysis process.
In this research, a validated and online traffic accident dataset [
2] is used, which includes UK accidents during 2005–2014, except 2008. This dataset was cleaned up, transformed, and pre-processed to build and train the predictive models. It is because some of the data columns contain redundant data, or are uncorrelated to the prediction target, or consist of missing values. The prepared dataset contains the following columns:
Accident severity;
Number of vehicles;
Number of casualties;
Region;
Road type;
Light conditions;
Weather conditions;
Road surface conditions;
Urban or rural area;
Day or night;
Year;
Month;
Season;
Weekend or weekday.
By using the information gathered in the literature review (see
Section 2), it can be concluded that the first three data columns represent the output to be predicted (dependent variables). In contrast, the rest of the data columns are the input required (independent variable) for the models. Then, the interquartile method was applied to trim the outliers—ensuring robustness in our predictive model. After performing the steps above, over a million data records remained over the span of nine years of recorded accident data (2005 to 2007, 2009 to 2011, and 2012 to 2014). The available data may seem to be old, but they fulfill the requirements of this study’s objectives. The data are accurate and consistent, enabling us to conduct holistic modeling for this study. The categorical data columns were then encoded into the numerical format as most machine learning algorithms require all input variables to be in such a form.
3.2. Modelling Strategy
The labels to be predicted are accident-related: accident severity level, number of involved vehicles, and number of casualties. These three factors summarize the overall situation of a car accident under some specific conditions. The resulting system models must predict these three factors given these input conditions. By identifying the accident severity, road managers can focus on areas with greater potential risk. Resources, such as professional personnel to aid accident victims with injuries, are limited in some regions. Still, with the help of predictions from machine learning models, the decision-makers can organize resources in an efficient and need-based manner. For example, more ambulances should be available in the vicinity of a prediction that indicates many casualties on a specific road. Suppose the result suggests that many vehicles are involved. In that case, more rescue cars, such as tow trucks and fire engines, available on short notice are recommended to reduce the time between requesting and transporting relevant equipment and specialists. We need to measure and obtain all feature values and run the model to perform the prediction. The output labels do not mean the exact number of predicted vehicles and casualties that will occur. Rather they indicate the situation of the most likely scenario predicted by the model.
Classification is the machine learning method we chose to use. Regression mainly predicts continuous values, while classification is used for discrete labels. In the dataset, most of the features are discrete. The involved vehicles and the number of casualties are numeric, but the possible values are distributed among several specific numbers due to the characteristics of car accidents. Therefore, they are better treated as discrete labels. Classification has its limitation in predicting unseen results, while regression can predict results that do not appear in the training dataset. Knowing the situation from a macro perspective can also be meaningful when predicting a car accident. The unseen values, in this case, are large numbers of damaged vehicles and casualties, which indicates a devastating accident. Those tragedies are complicated and may involve many human factors, while the given dataset provides more information about the surrounding environment. Obtaining a predictive result can offer valuable insights to regulation makers and road managers to mitigate accident rates and prevent severe cases.
Different algorithms were tested and compared based on accuracy to obtain an optimal prediction model. There are several classification methods in Spark. However, some methods are not applicable in our case because they only support binary classification. The four algorithms used in this project are the decision tree classifier, random forest classifier, multinomial logistic regression, and naïve Bayes classifier. Each algorithm predicted the three output labels separately, and as a result, they were grouped. To perform the algorithm’s training, we used a global model approach where the data are fed to a pipeline to train a single model, the result of which is a single classifier. This way, higher accuracy is expected from our model because the generated classifier takes advantage of the entire dataset rather than training on local partitions of the dataset. This also means that it is independent of the number of data partitions and produces a single model at the end. Although this may cause longer computational time due to more communication between nodes, higher accuracy is preferred in the case of traffic accidents. Through the analysis of the accuracy of the predictions and the data patterns, the Results and Discussion section interprets the generated results and proposes a new strategy to improve the machine learning model predictions.
4. Results and Discussion
4.1. Data Exploration
Matplotlib is a drawing library provided by Python. By using this visualization method, the severity and frequency of the accidents are analyzed and counted. This approach explores the potential relationships between accident severity and various factors such as weather conditions, light conditions, and road surface. The findings can help road managers identify and avoid possible adverse factors to reduce the likelihood of significant accidents.
The severity of the accident is classified into three levels. Level 1 traffic accidents are the most serious, meaning that accidents cause many casualties. Level 3 accidents are the most common and minor, meaning fewer vehicle collisions and people injuries. Therefore, the pie chart can show the proportion of accidents of the three different severity levels under various factors.
4.2. Traffic Accident Severity Analysis Based on Different Factors
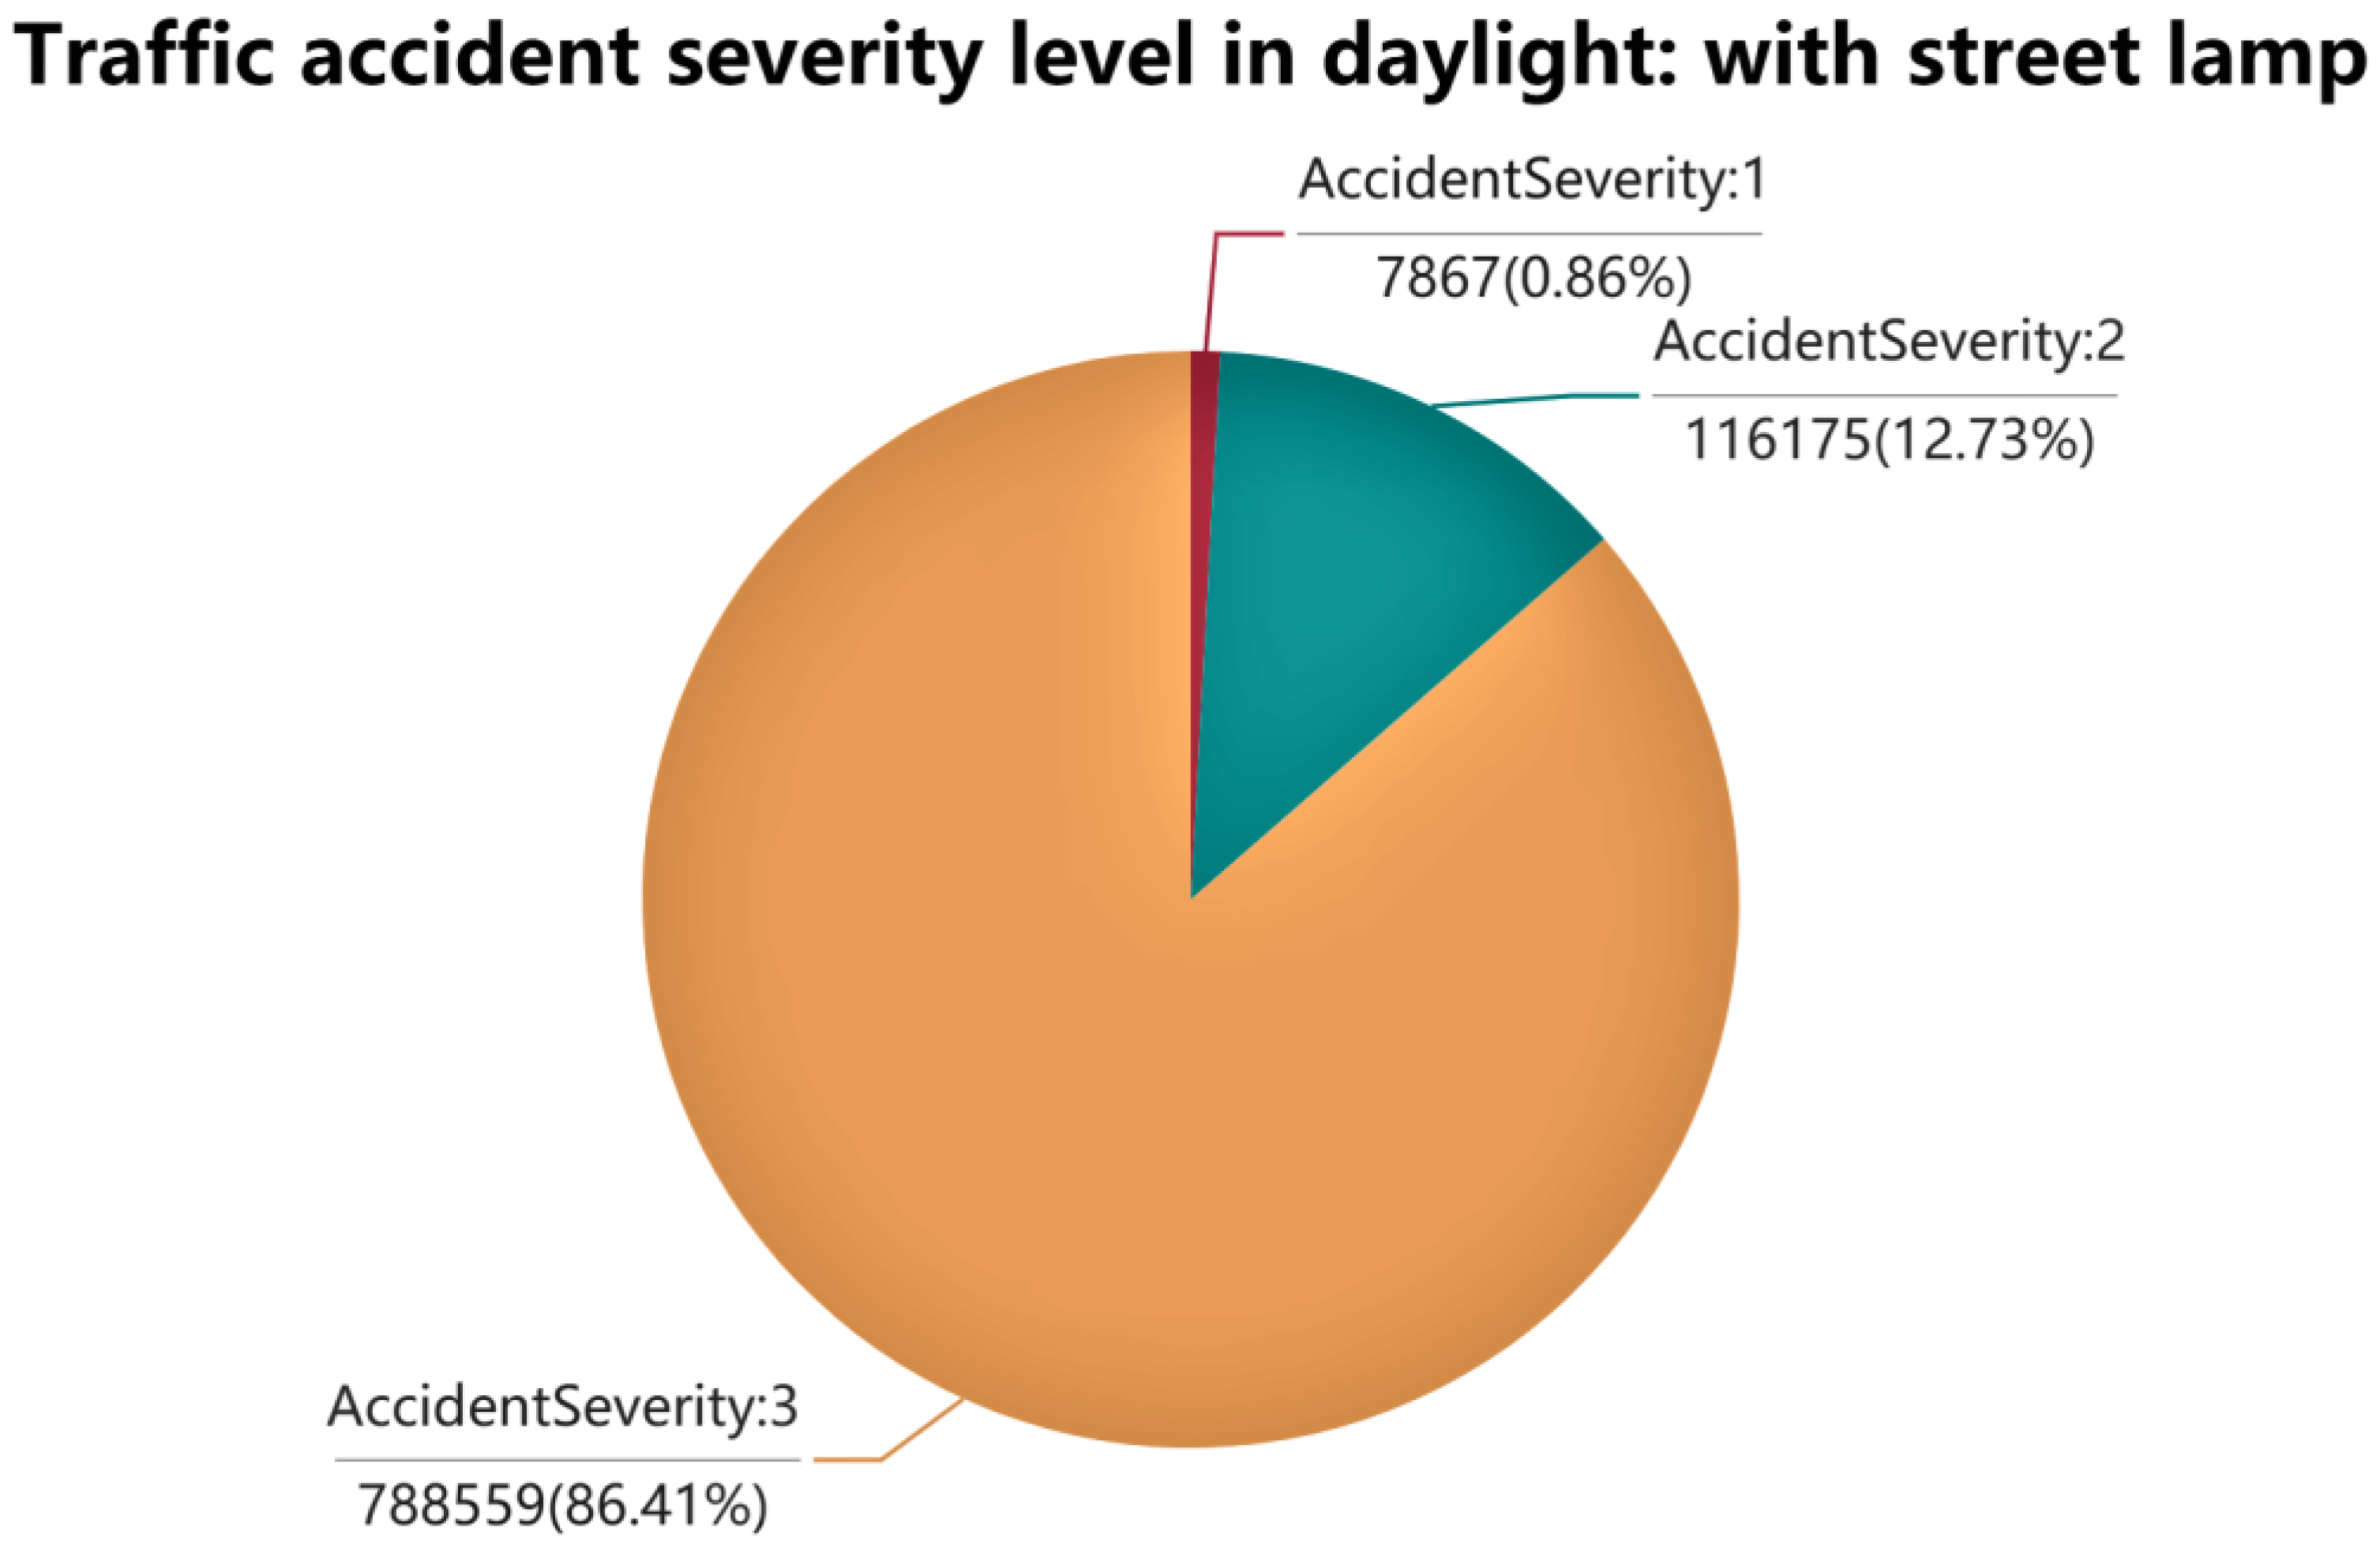
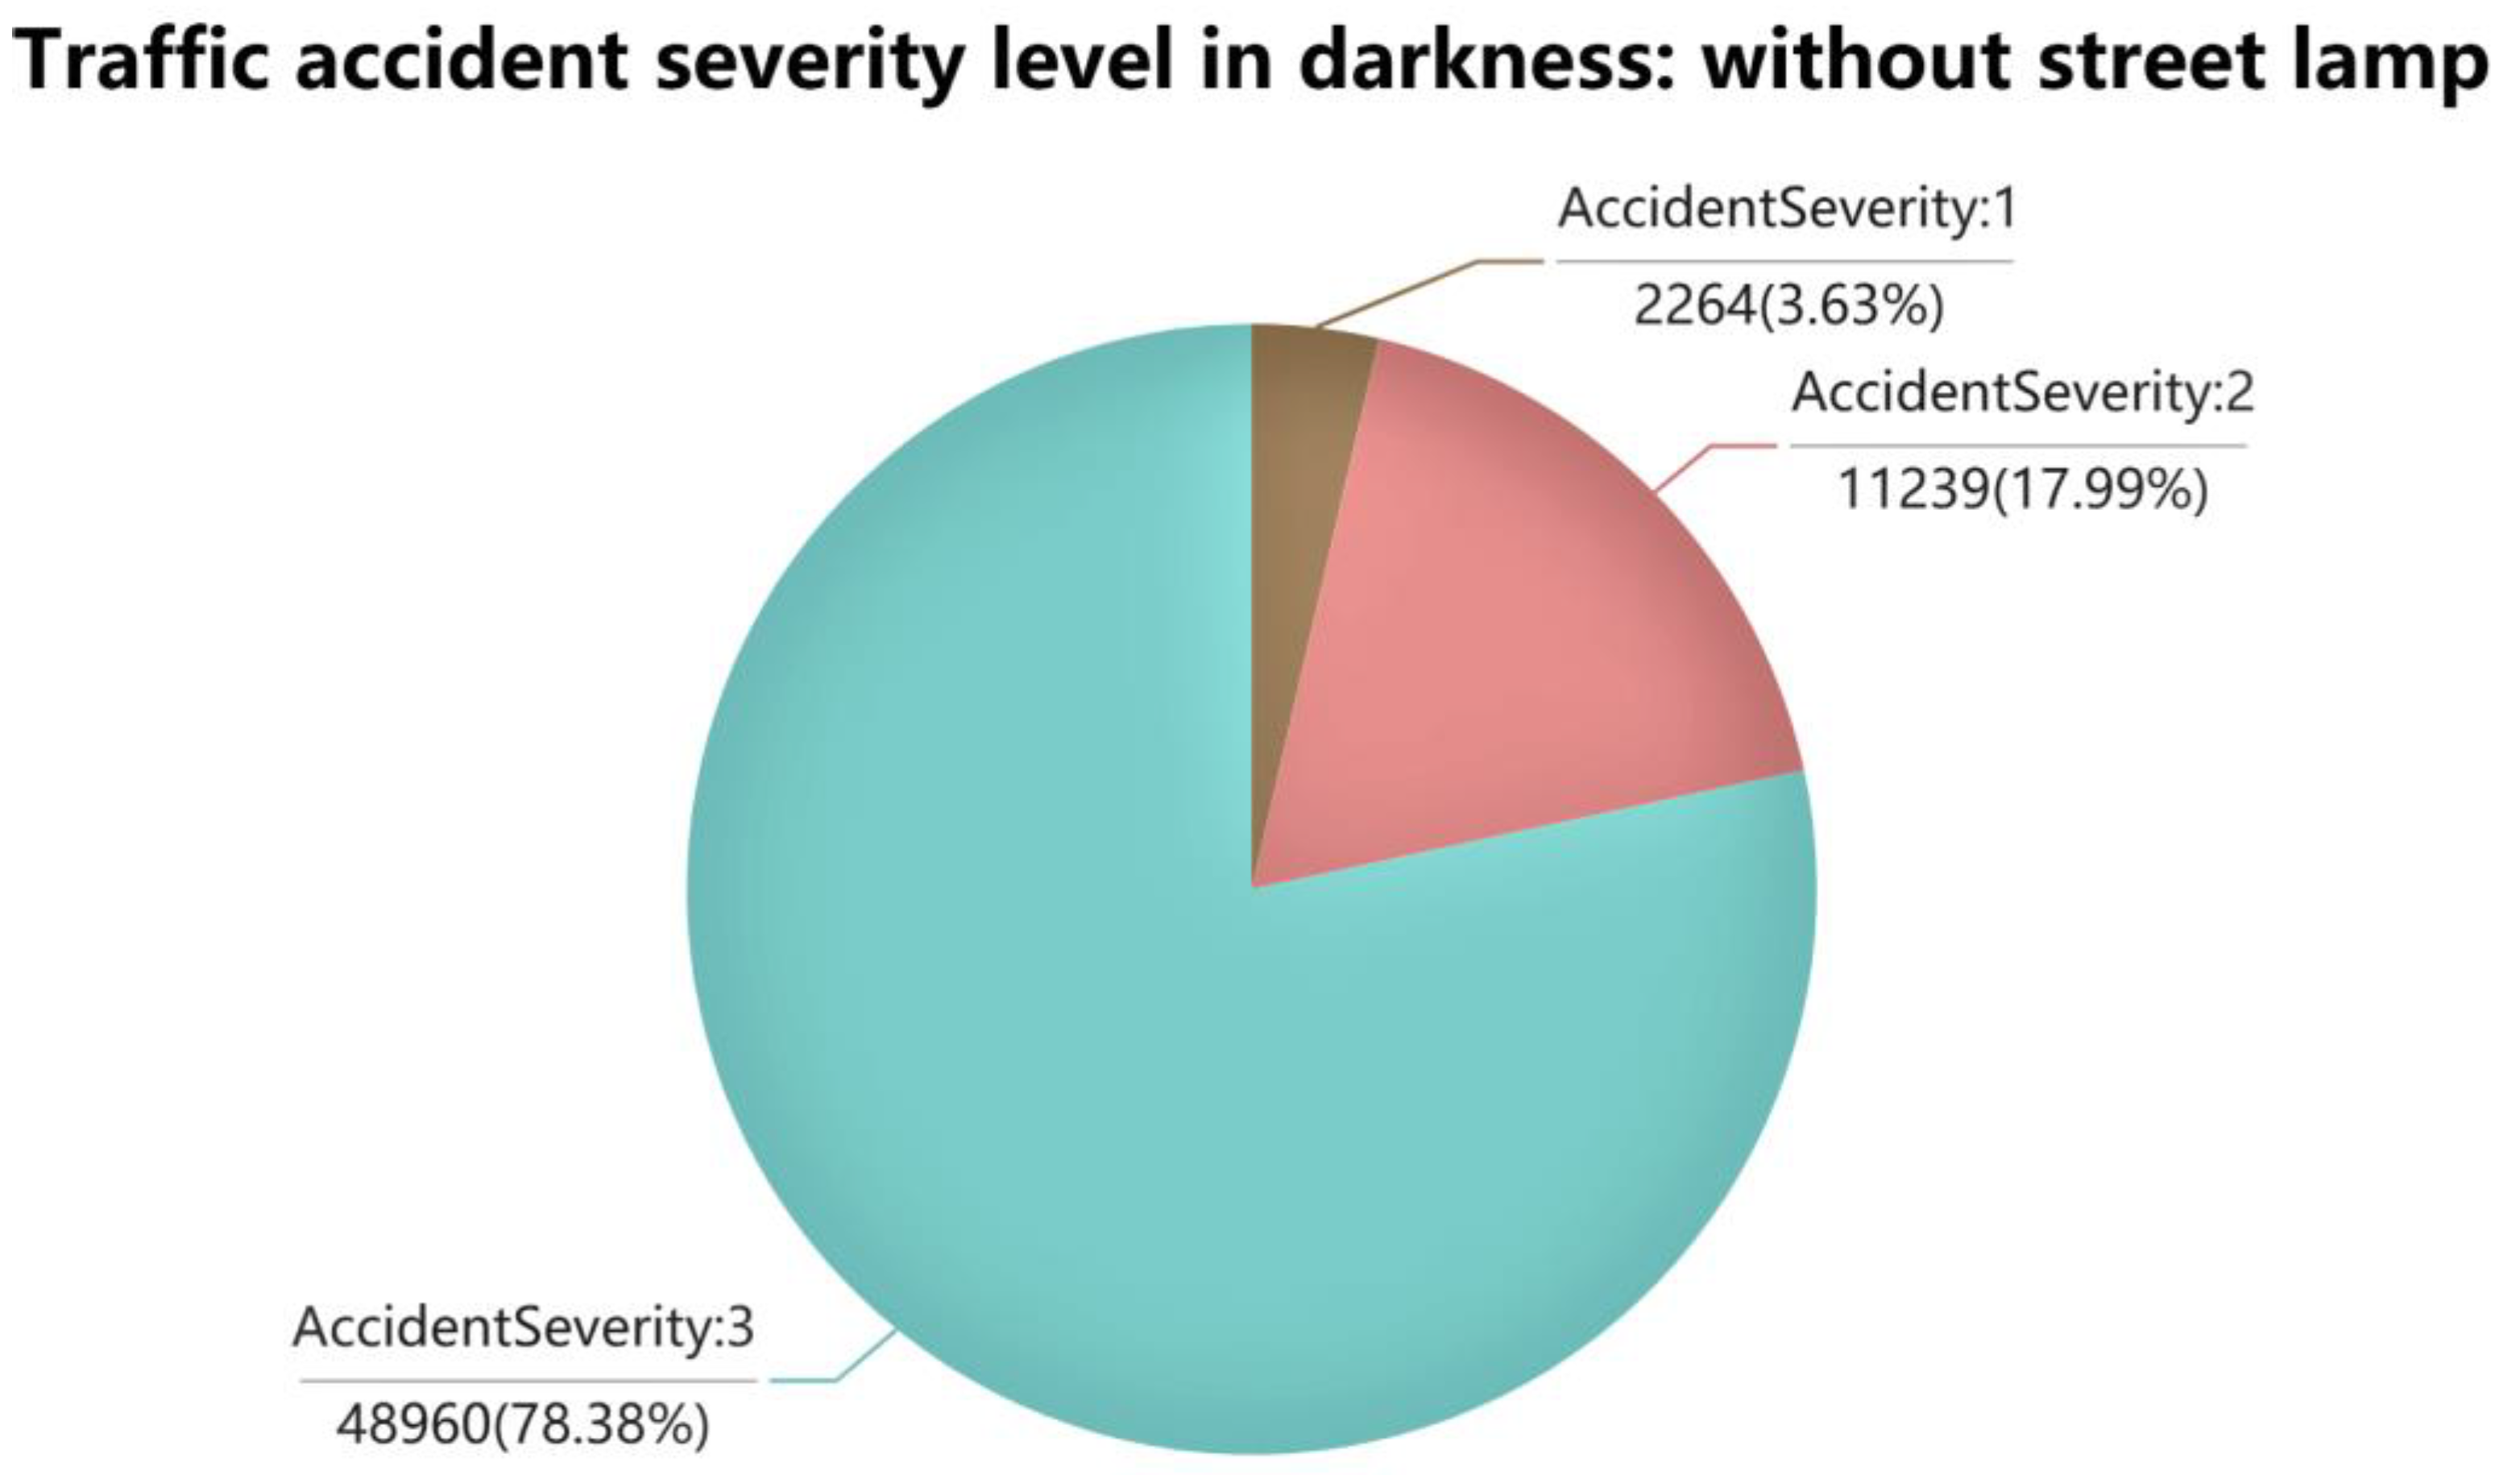
According to the visualization results, the severity of an accident is indeed related to some factors. Light conditions, weather conditions, and road surface conditions are taken as examples. For light conditions,
Figure 1 clearly shows that more severe traffic accidents may occur in the absence of streetlamps. In the lack/absence of street lights, Level 1 accidents account for 3.625%. In comparison, this proportion is only 0.862% in the presence of streetlights. This conclusion is consistent with human common sense. When there is no street lamp to provide illumination, the driver cannot see the road ahead only with the illumination provided by the headlights. Therefore, the difficulty of reacting to an emergency increases, and it is more likely to cause serious traffic accidents.
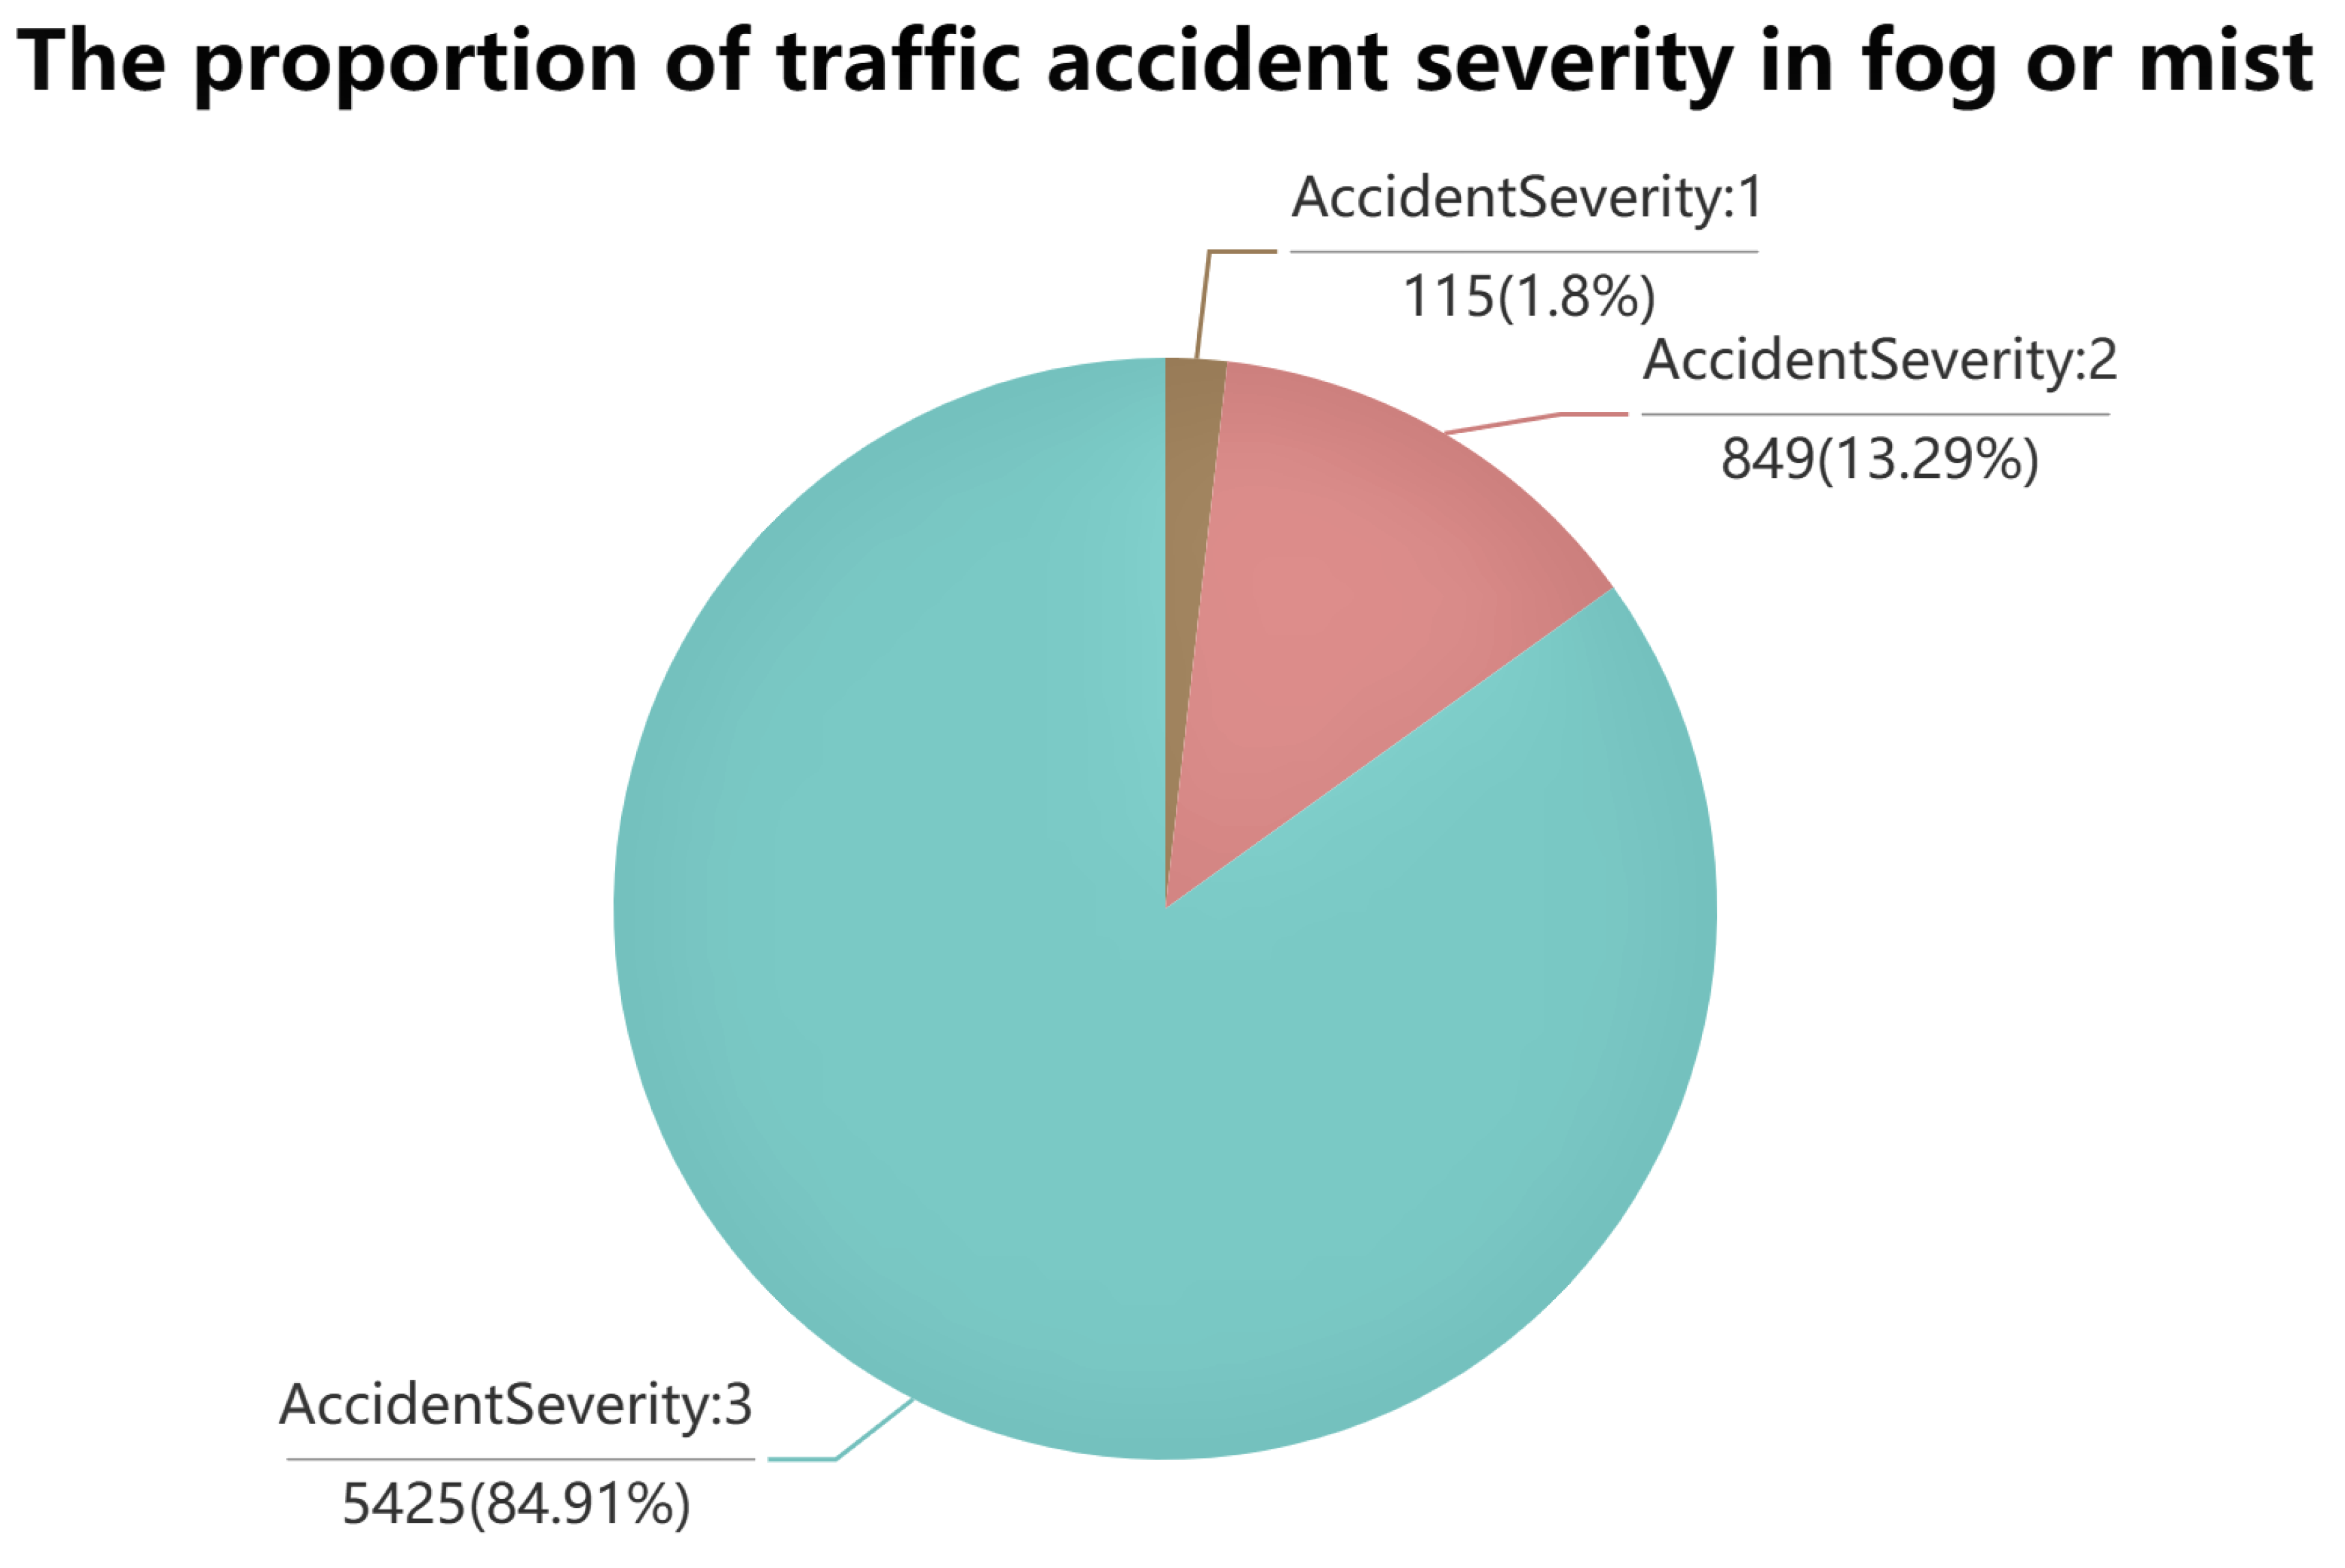
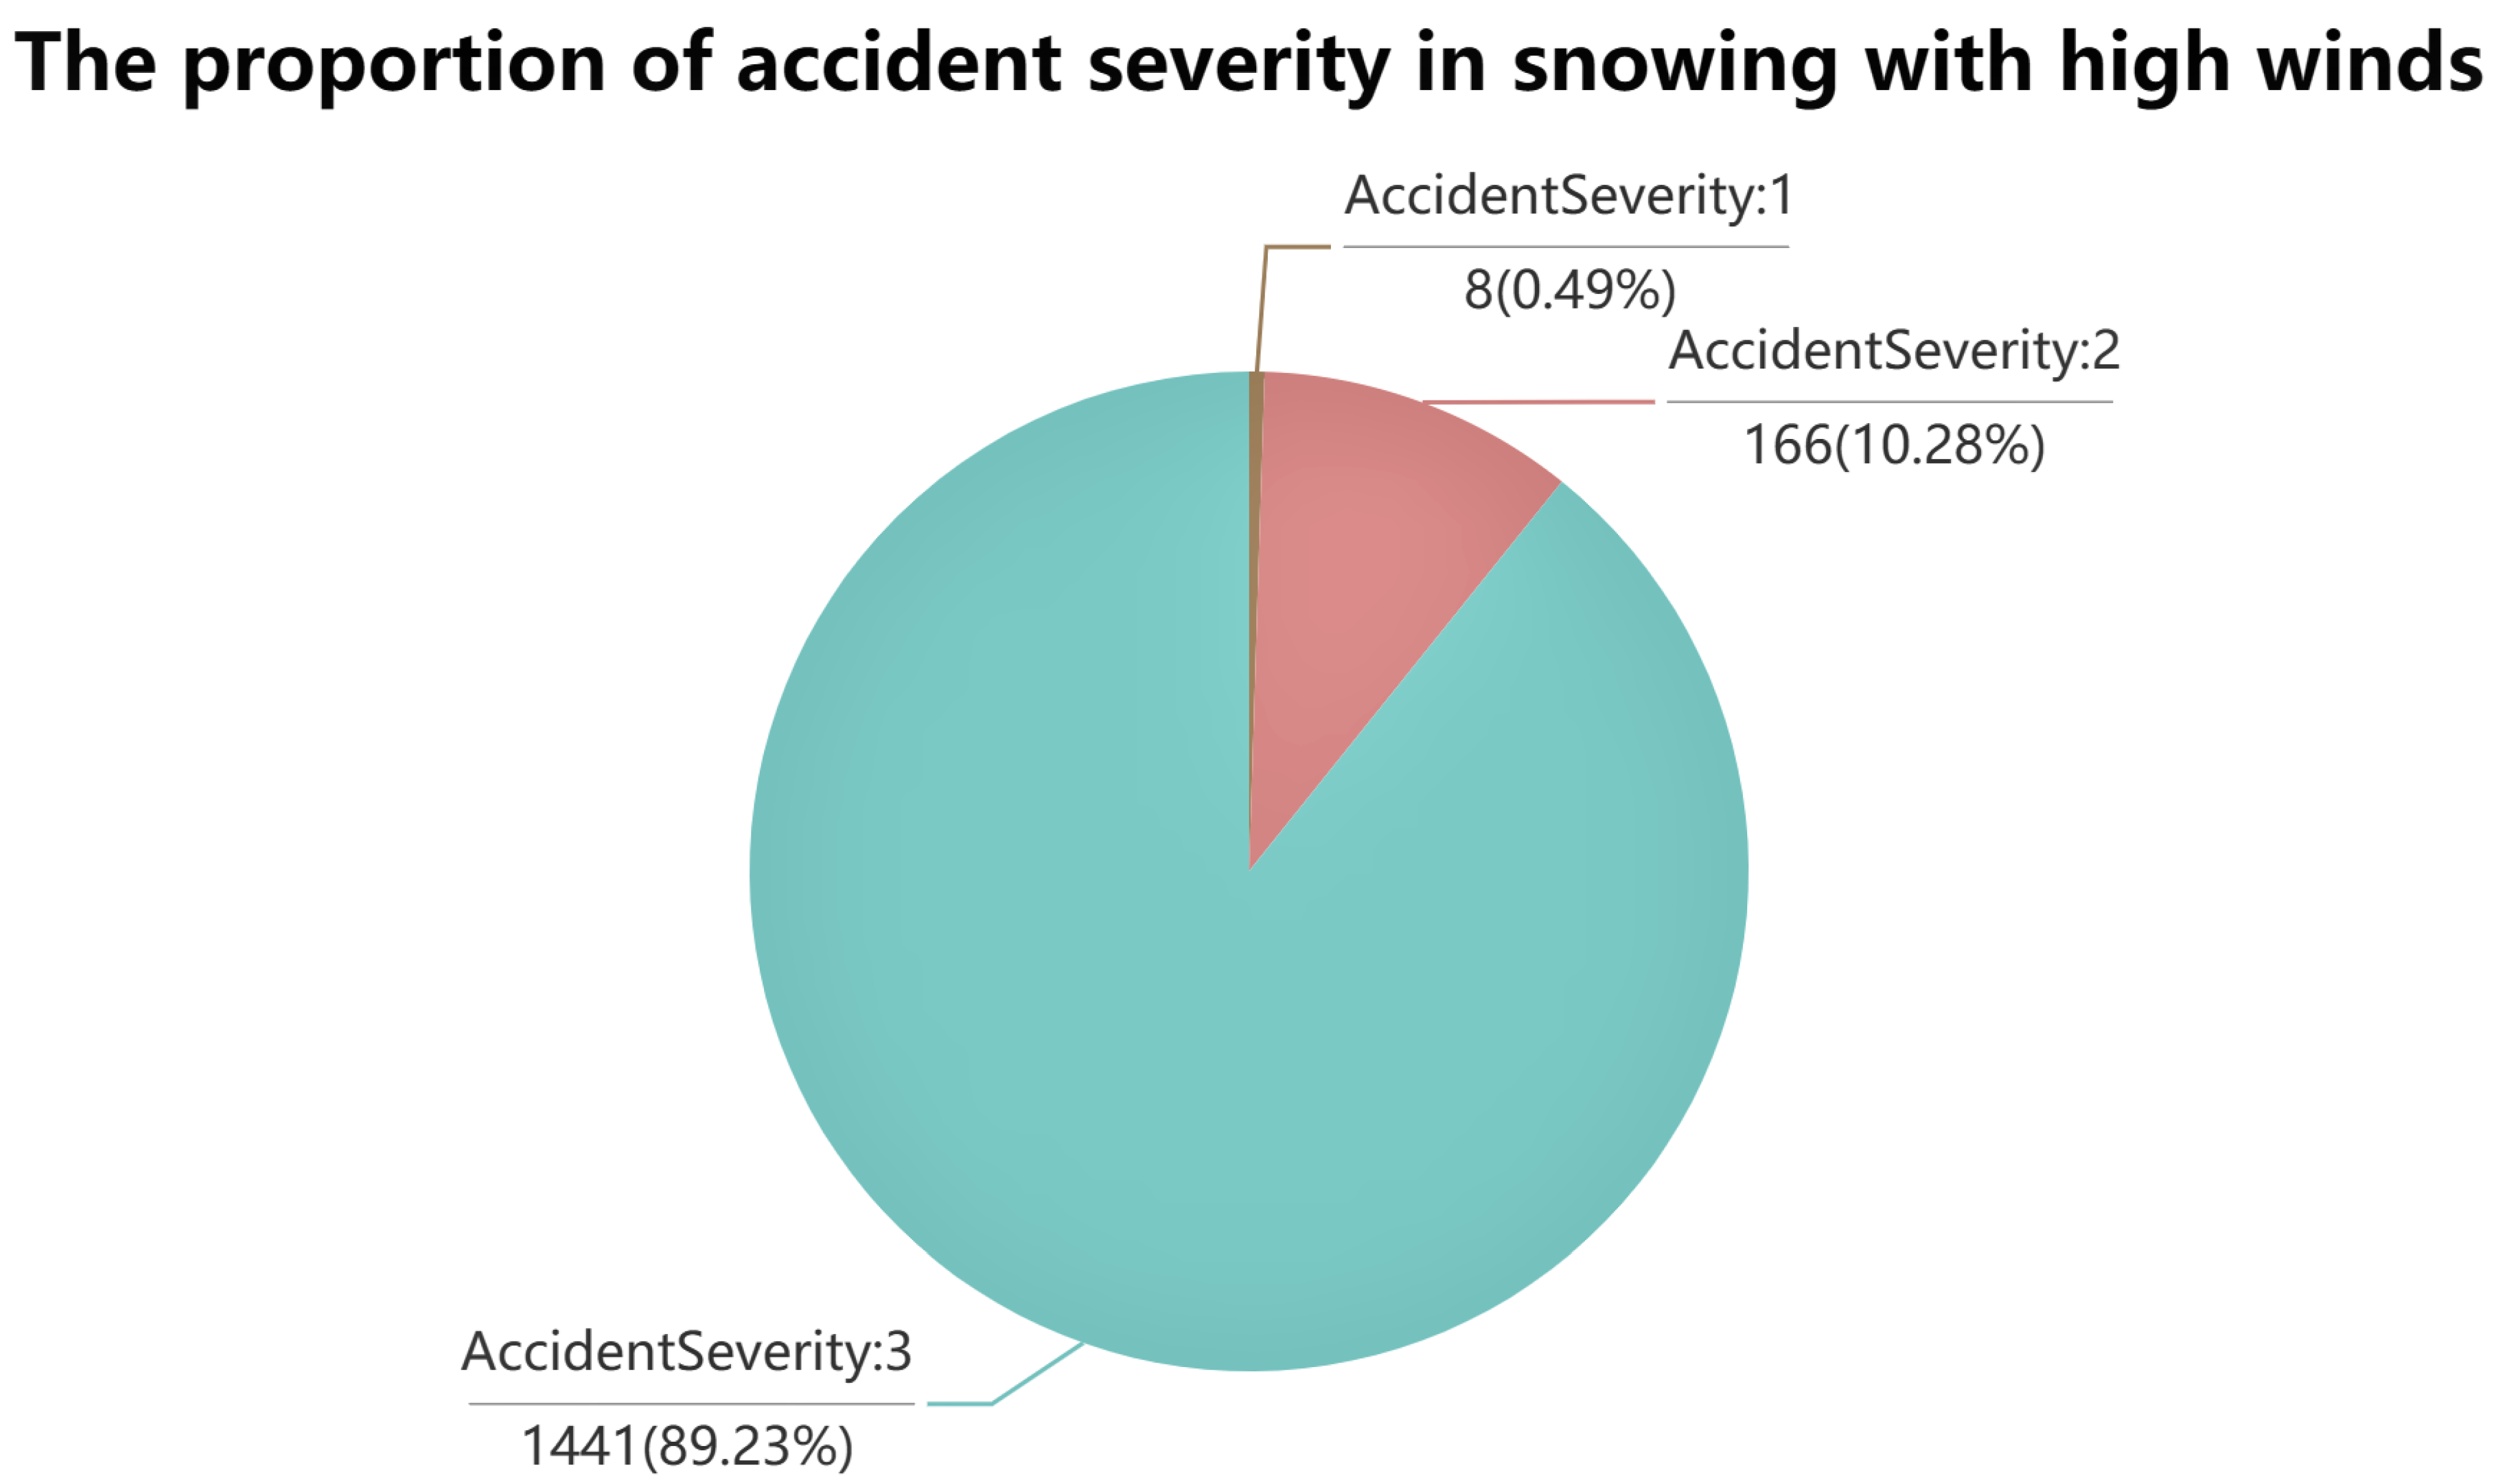
Weather conditions are analyzed in terms of wind, rain, snow, fog, normal, and other weather conditions.
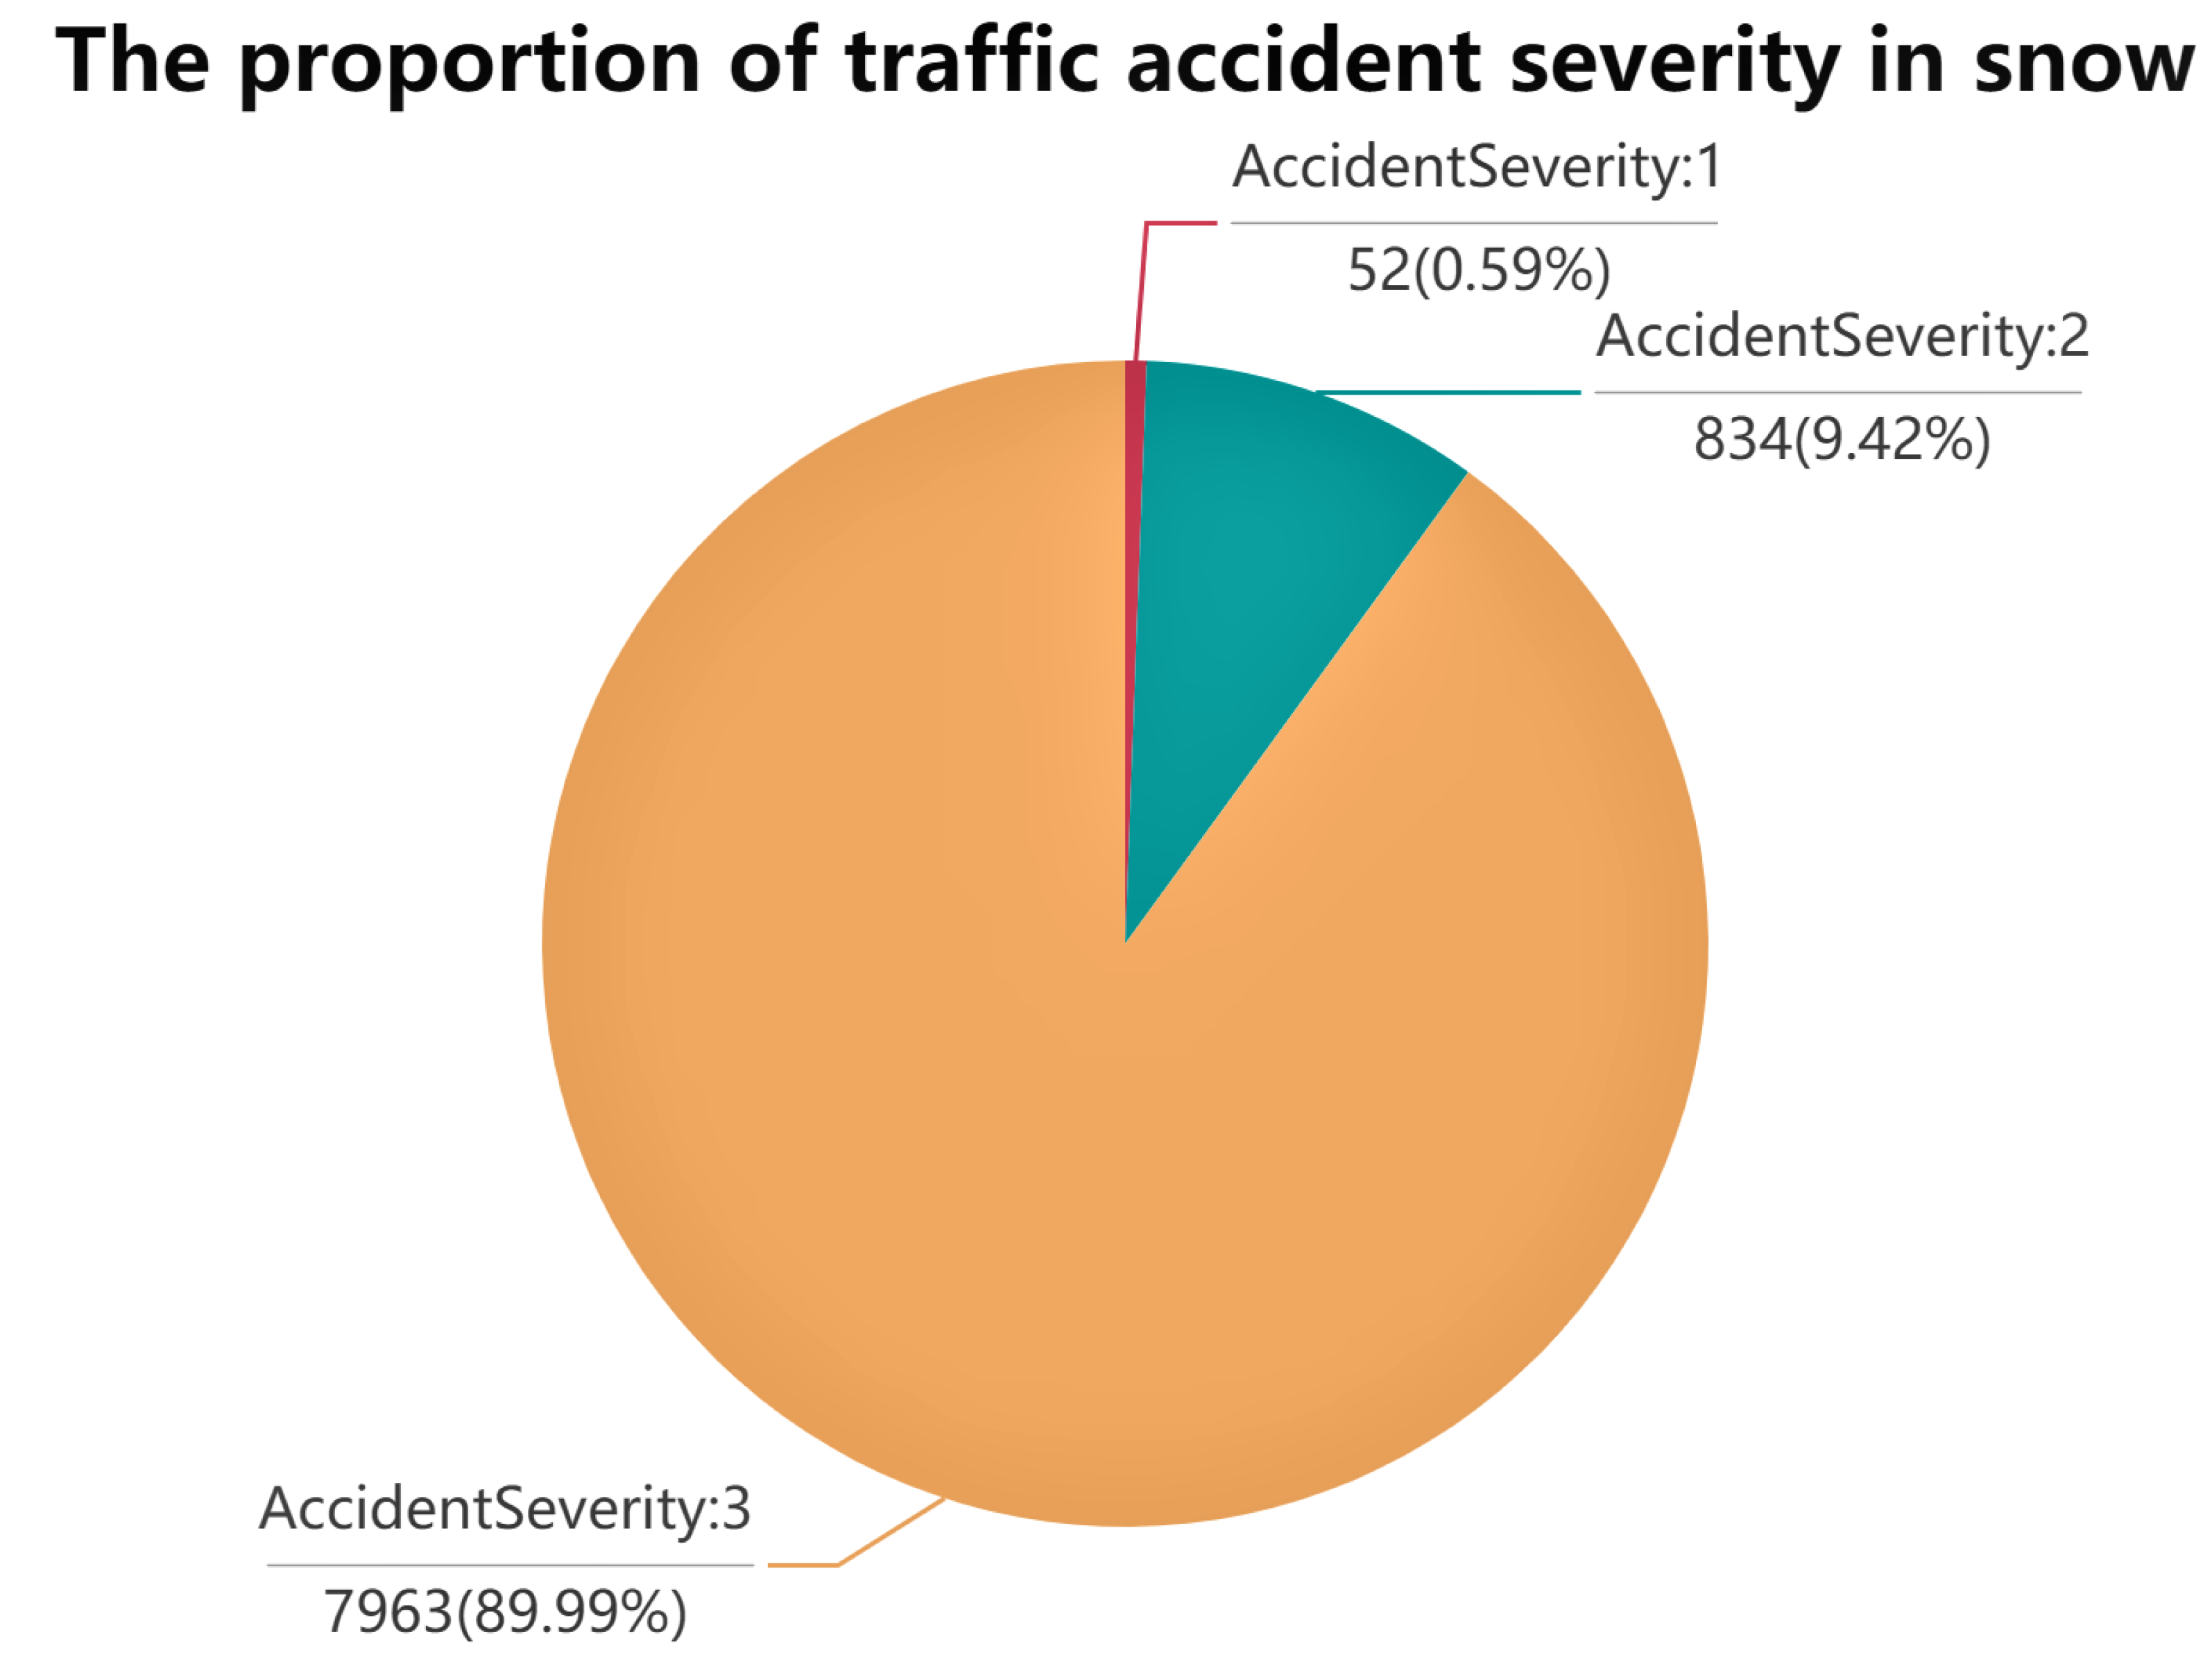
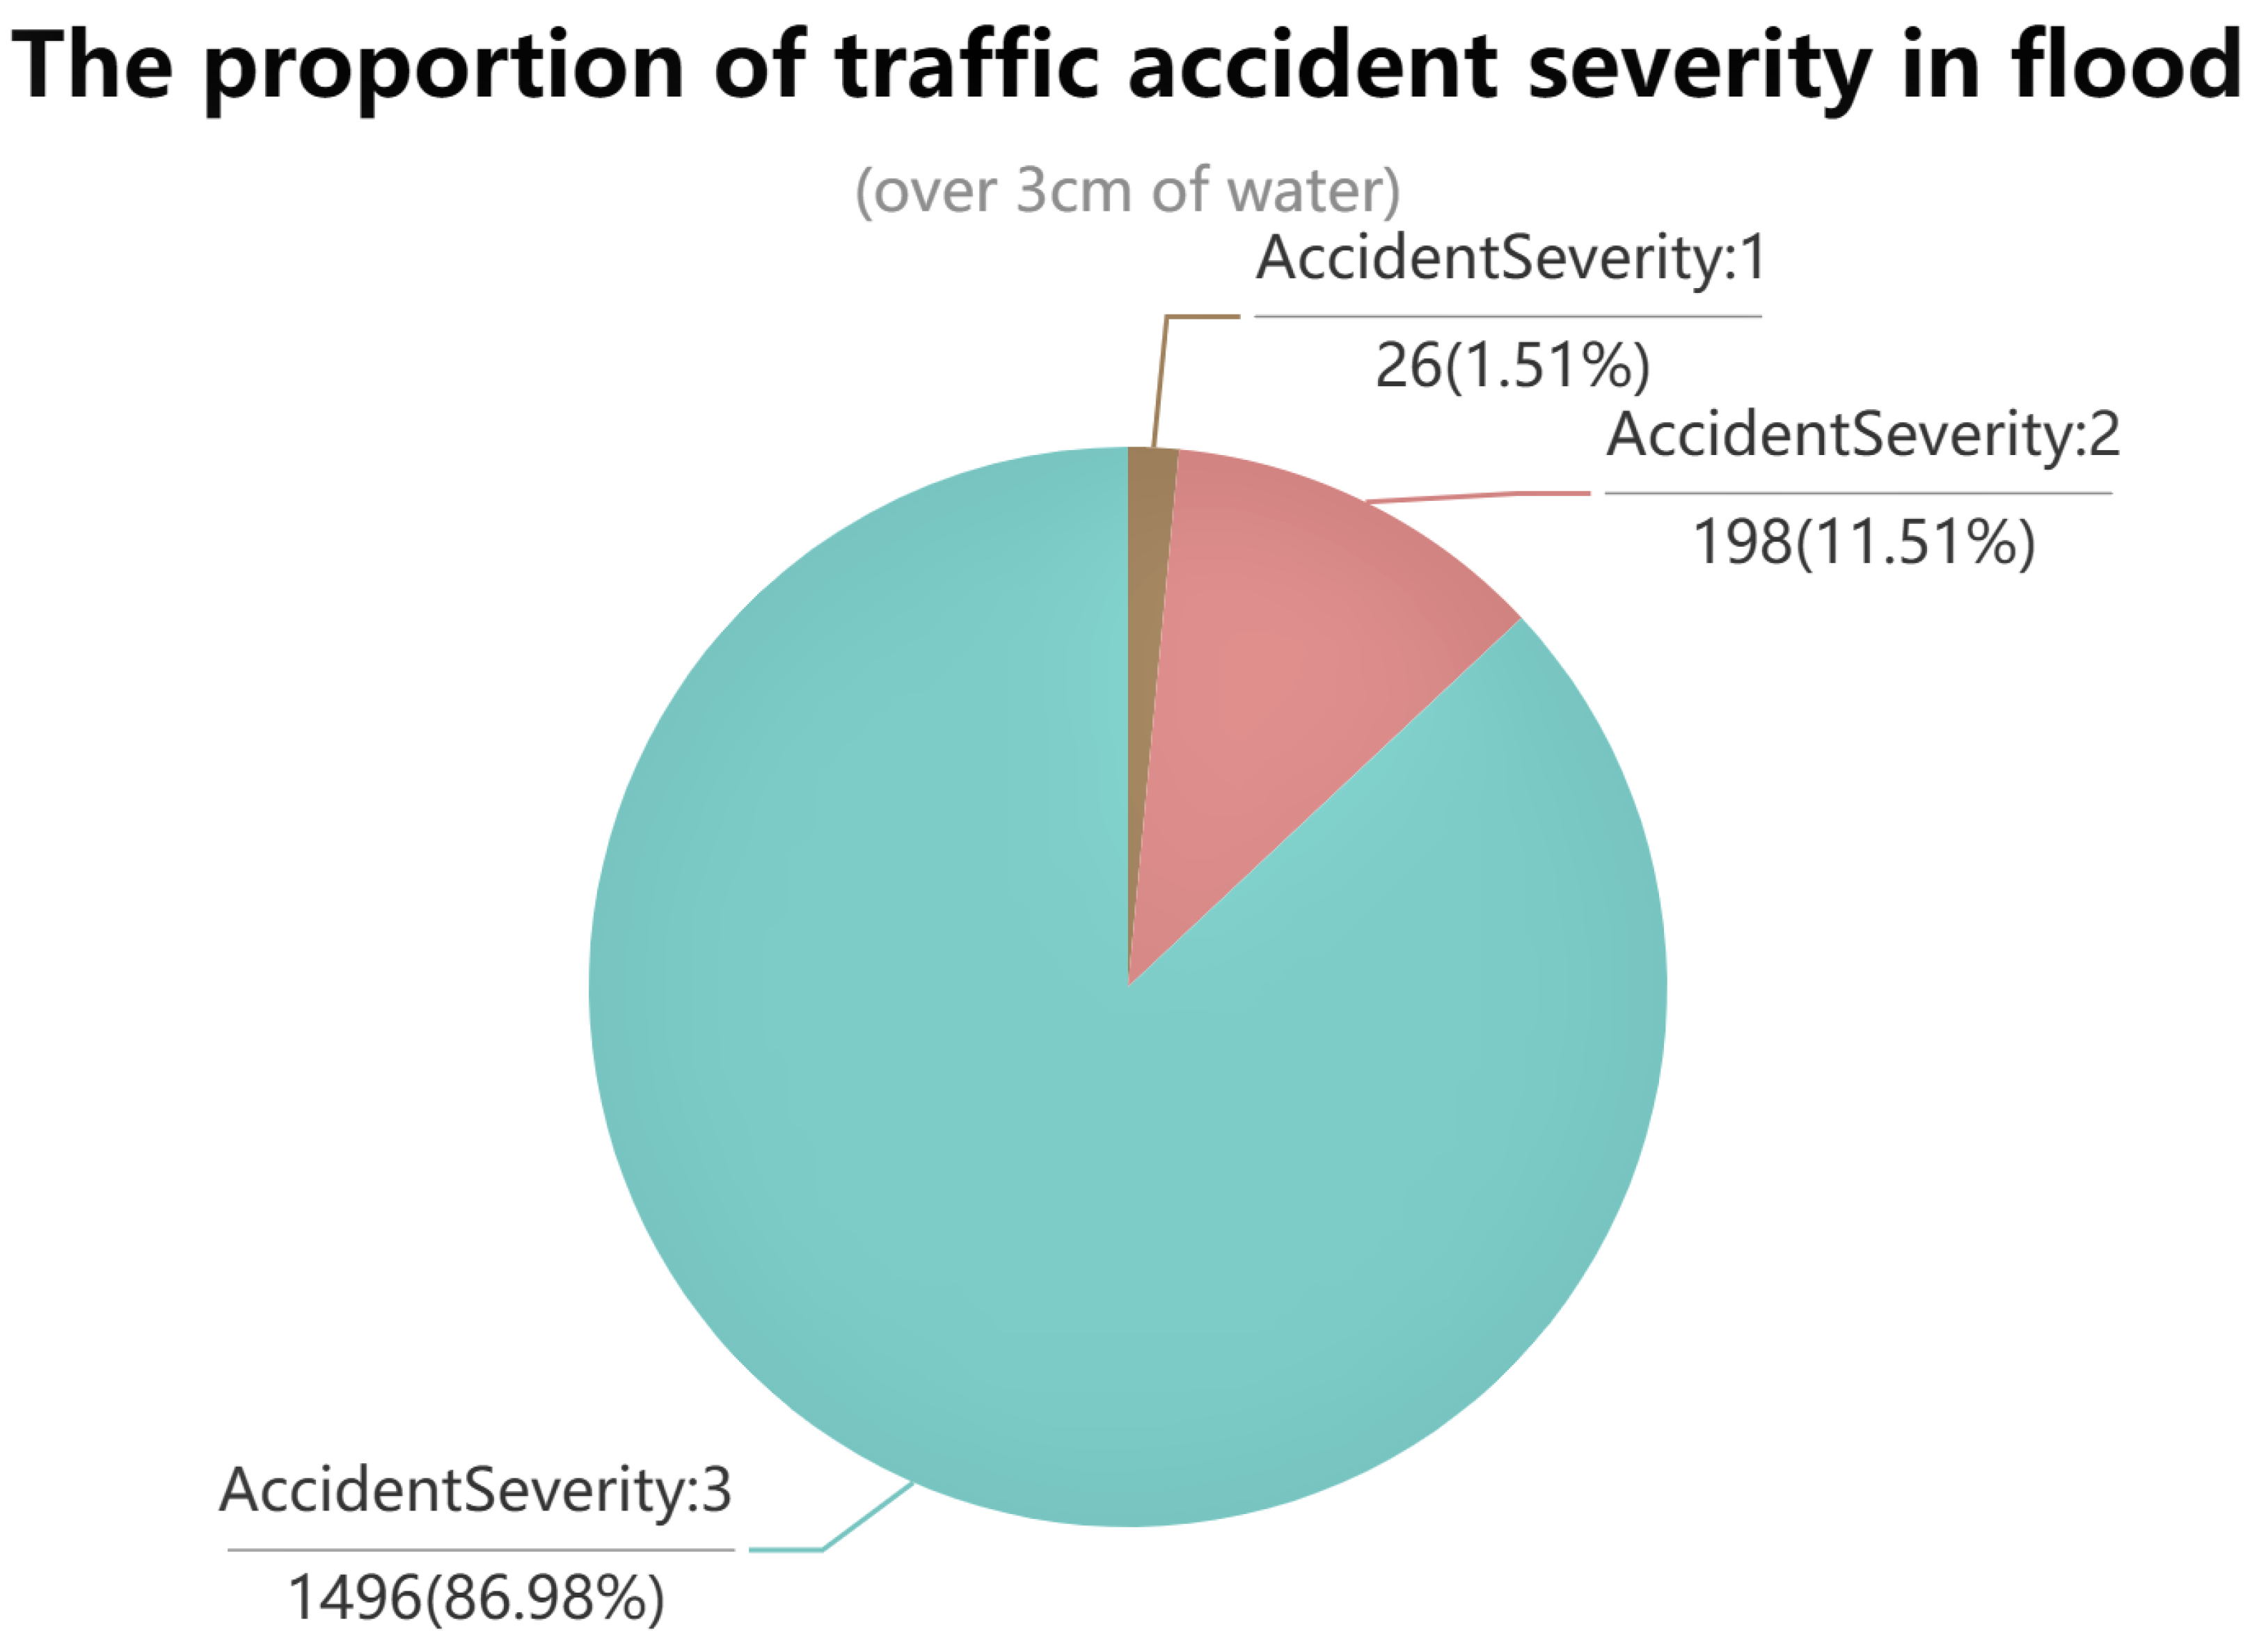
Figure 2 shows that foggy days can cause more severe traffic accidents than other kinds of weather. Snowing with high winds is least likely to cause serious traffic accidents. In terms of road surface conditions, snow, dry, wet, flood, and other conditions are analyzed.
Figure 3 shows that flooded road surfaces can cause more severe traffic accidents. However, snow roads are less likely to cause serious accidents. Fog weather is more likely to cause serious traffic accidents. A possible reason is that the fog blocks the drivers’ view of the road. They cannot accurately judge the distance of the pedestrians or vehicles ahead. One possible explanation for accident severity being the lowest on snowy days is that people drive slower and maintain a higher concentration level. A reasonable assumption for accident severity being highest in flood is that it reduces the friction on the road surface, making it easier for vehicles to slip and roll over due to inertia when braking, emergency acceleration, or turning. A likely reason for accident severity being lowest in the snow is that when there is a lot of snow on the road, people often install anti-skid chains and drive at low speeds.
4.3. Traffic Accident Frequency Analysis Based on Time and Space
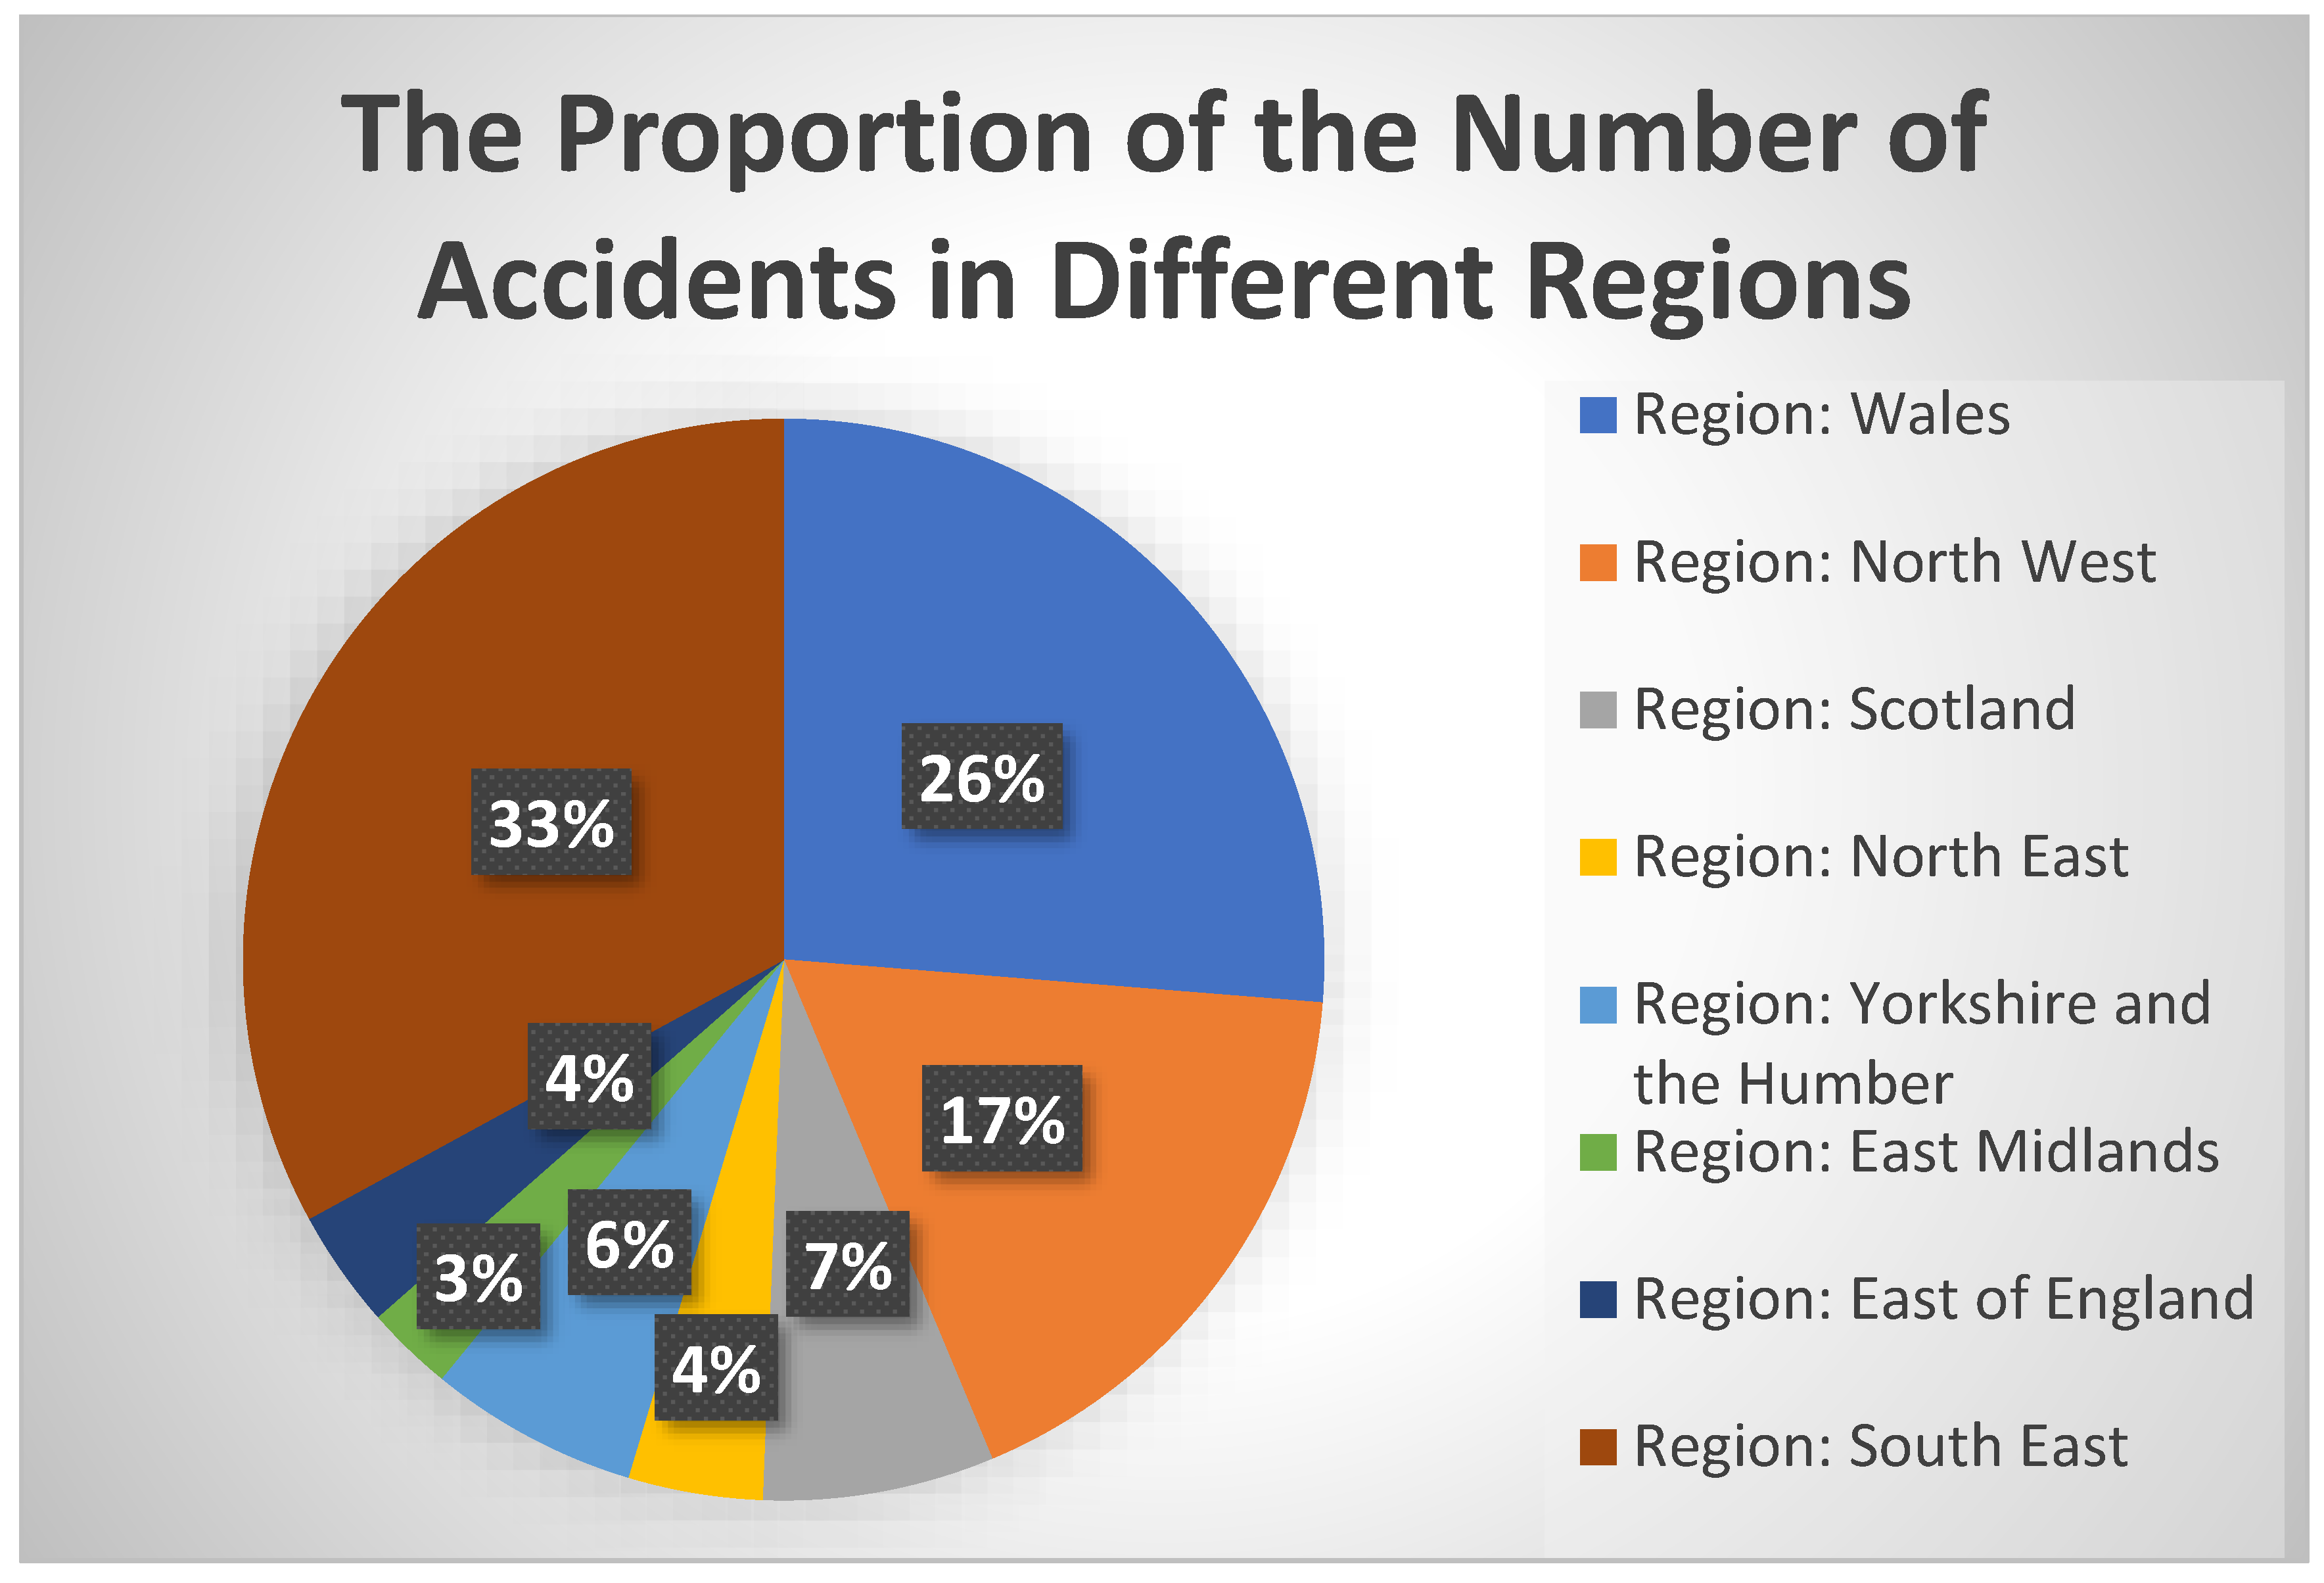
From the perspective of spatial dimension, as shown in
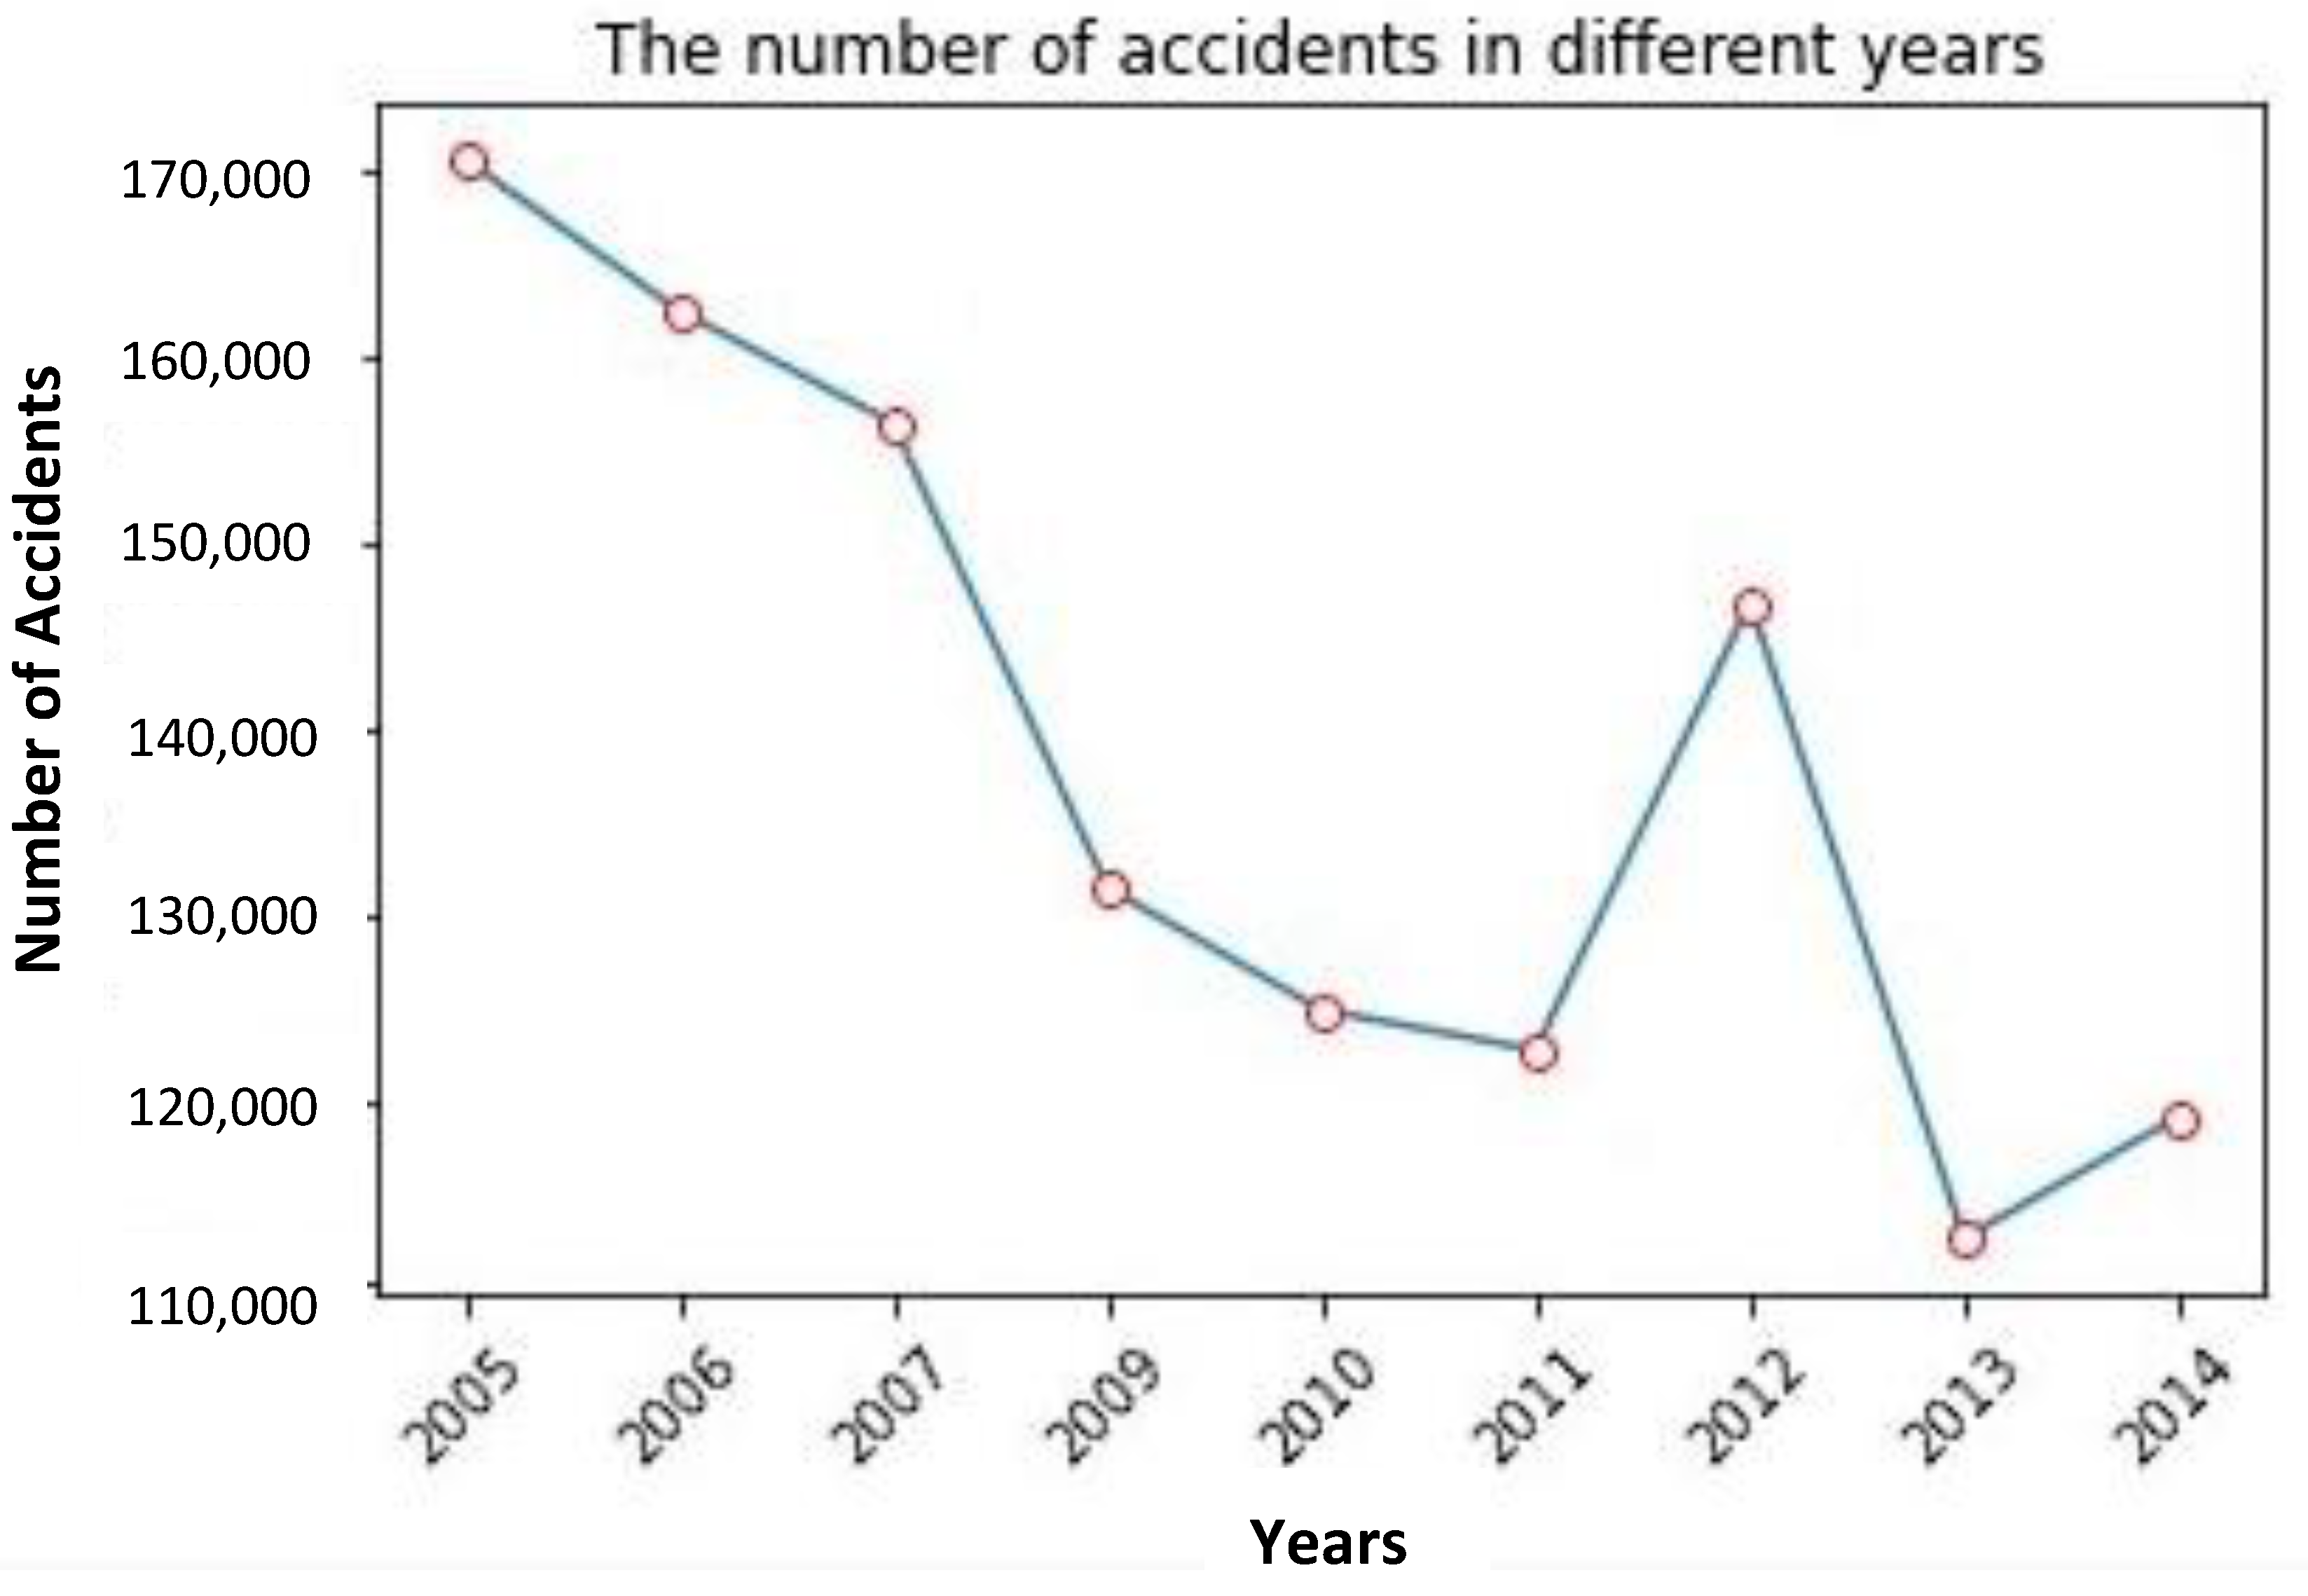
Figure 4, the number of traffic accidents that occurred in the southeast of the United Kingdom was highest from 2005 to 2014, which was close to 33% of the whole country, while the number of traffic accidents occurred in the East Midlands was the least, accounting for only 2.6%. From the perspective of the time dimension, as shown in
Figure 5, from 2005 to 2011, the number of traffic accidents in the UK was decreasing year by year. This number rebounded slightly in 2012 but has continued to decline since then. From the perspective of the time dimension, as shown in
Figure 5, from 2005 to 2011, the number of traffic accidents in the UK was decreasing year by year. This number rebounded slightly in 2012 but has continued to decline since then.
The southeast of the UK has the highest number of traffic accidents, probably because it has a higher population density and higher traffic flow. One possible reason for the downward trend in the number of traffic accidents in the UK is that the British Department for Transport has introduced more effective transport policies and established a more comprehensive transport system. At the same time, with the progress of science and technology, the safety of vehicle protection mechanisms has also gradually improved. A possible reason for the accidents’ rebound in 2012 was the hosting of the London Olympics. During this period, the number of tourists visiting Britain increased considerably, leading to an increased number of road accidents.
After evaluating the machine learning models using the test data, accuracy was generated. Three of the models have very similar performances and have good results. Naïve Bayes is not suitable for classifying practice because it assumes that all features are independent. It generated unsatisfactory accuracy in the evaluation stage. The accuracy of predicting the severity is around 85.5%, which means most of the test data were classified into correct labels. Predicting the number of vehicles is less accurate. Approximately 64.5% are classified correctly. The three models also classified the number of casualties with good results, with nearly 84% accuracy obtained. There is no significant difference in accuracy between each of the three models; they are all suitable to make predictions on accident severity and the number of casualties while having relatively lower performance in predicting the number of involved vehicles in the accident (
Table 1).
According to the statistical analysis result of the dataset, most records have the same accident severity and the number of casualties. Over 90% of car accident records have a severity level of 3 (the lowest severity), and over 95% have many casualties of 1. In other words, minor accidents occupy most of the records in the dataset. During the modeling stage, many records with different features are classified into the same label, thereby reducing the model’s sensitivity. When dividing the dataset for training and testing, many minor accidents are more likely to be involved in the testing data; hence, it is not surprising that the accuracy is high because the model can predict minor accidents very well. However, the number of involved vehicles in the accident has more possible values (larger range), meaning more relevant factors might determine it. Hence, the classification model can achieve a lower accuracy than the other two labels.
An improved training strategy is proposed to improve the accuracy in predicting accidents with the severity of 1 and 2, the number of casualties above 1, and the number of vehicles. Since the problem is mainly caused by the unbalanced portion of each of the labels, the population of records with severity of 3 or the number of casualties that is 1 will be reduced in the new strategy. Minor car accidents are dominant in the training data, but their portion will be adjusted slightly higher than the other labels. The resulting model may become more accurate in classifying data into different labels, then the testing results accuracy could be higher.
Since the three models’ accuracy is very close, we discuss the three algorithms and car accident problems based on other aspects. After data processing, the attributes of a car accident are either nominal or ordinal. Multinomial logistic regression is based on linear algebra, it can be used to classify data points, but the performance might reduce when the attributes become more complex. DT and RF are more suitable in this case. Random forest is a method derived from the decision tree. Random forest generates many decision trees randomly and produces the final classification result by launching voting among the temporary effects of those decision trees. The decision tree’s performance is ensured by correctly determining the important factors. In the car accident dataset, our knowledge makes it hard to determine their importance in an accident. Therefore, the random forest’s methodology is more sensible in such a complicated case. Because it tries different combinations of attributes and makes many trees, the algorithm considers more possible tree structures than only one (a simple decision tree). The car accident may involve many other factors; more relevant data might be available in the future and may be added to the dataset. Hence, the random forest can achieve higher accuracy in car accident prediction.
5. Conclusions
This paper has covered the need to reduce traffic accidents since the number of accidents produced is still relatively high and causes significant economic expenditure. To find insights into where and how these accidents could be reduced, the project aimed to generate predictive models to understand the causes of the accidents. We determined the independent determinants from the extensive literature review (see
Section 2), including weather, light, road surface conditions, and others. We first had to drop unnecessary columns that were not needed for the prediction model from the dataset we used. Outlier data were dropped to make the data more robust to uncertainties and errors. Furthermore, we performed some pre-processing to convert some of these variables into more useful formats, such as latitude and longitude, into geographical regions for more general solutions. The output variables to predict are the number of vehicles, the number of casualties, and accident severity. They were treated as discrete labels due to the limited values and concentration around that small range. Since the dataset was large in volume, big data analysis is important to handle large datasets of various types and generate them quickly. The dataset used in this research is quite large, and therefore, big data analysis helps generate faster results. Additionally, big data analysis allows us to extract useful information from the datasets through classification to generate predictive models. By using the analyzed results, decision-makers can easily understand accident patterns, driver behavior, time of day, road and weather conditions causing traffic congestion and other key factors contributing to accidents, such as fatalities and serious injuries, thus improving traffic safety control strategies. They can also use predictive models to adopt new policies in road safety and accident prevention. Future work may include determining the determinant factors from this dataset before developing predictive models using methods such as correlation matrix to find the significant dependent variables for the dataset.
Apache Spark’s framework handles distributed data processing and streaming datasets to overcome traditional storage restrictions, and is useful for big data analysis. Using MLLib in Spark, we used the machine learning models implemented in classification: decision tree, random forest, multinomial logistic regression, and naïve Bayes classifier. Then, the input (independent) variables and output (dependent) variables from the dataset were split into training sets to fit the data and testing sets to obtain the accuracy of the models we used. Matplotlib was used to draw the figures for the data exploration and discussion of the effect of the independent variables. Null values were dropped from the dataset, and outlier data were dropped using the interquartile method to make the data more robust. More advanced machine learning algorithms, such as neural networks, could be used to determine a higher accuracy. Other techniques to fill in missing data, such as using mean values, could improve accuracy rather than dropping the null values.
Three algorithms produced relatively good results (60 to 80% accuracy). Accident severity and the number of casualties were above 80%, and the number of vehicles was slightly lower at around 64%. This might have been caused because the possible range for the number of vehicles was higher. Additionally, because most of the dataset’s records, over 90%, had minor accident severities, the modeling stage may have reduced the model’s sensitivity by joining records with different features into the same label. Hence, an improved strategy can be proposed in which the unbalanced proportion of the labels can be reduced before feeding the dataset to the model for training, such as reducing the number of records with the severity of three casualties equal to one but keeping it as the dominant value. Hence, the model may become more accurate in classification. Some valuable findings are generated in data exploration. Traffic accidents are more likely to occur on foggy days than on rainy days and more likely to occur on snowy roads than on flooded roads. Neutrosophic statistics, an extension of interval statistics, are more efficient than classical statistics when the data are imprecise and uncertain [
38]. More applications of neutrosophic statistics can be seen in the intelligent traffic system [
32,
38]. The limitation of the current study is that some of the factors may have effects on accidents that are not considered. In the future, comprehensive datasets that include more important variables, such as air humidity and wind speed, could be used to possibly improve the accuracy of the prediction. The implementation in this study can take accurate decisions and experiences to manage the situation and assist traffic authorities in reducing the number of accidents, as they are validated and more accurate in predicting the severity of traffic accidents. To make this more feasible, the authors propose building a system or mobile app that can predict and warn road users of traffic accidents, providing users with accurate predictions.

 ,
, 


