Essay

Has the Development of the Digital Economy Reduced the Regional Energy Intensity—From the Perspective of Factor Market Distortion, Industrial Structure Upgrading and Technological Progress?

School of Economics and Management, Jiangxi University of Science and Technology, Ganzhou 341400, China
*
Author to whom correspondence should be addressed.
Sustainability 2023, 15(7), 5927; https://doi.org/10.3390/su15075927
Submission received: 10 February 2023 / Revised: 26 March 2023 / Accepted: 27 March 2023 / Published: 29 March 2023
(This article belongs to the Section Energy Sustainability)

Abstract

:
The digital economy has become the key driver of improving the quality and efficiency of the social economy and reshaping core competitiveness with the new technological revolution. This paper uses China’s provincial panel data from 2011 to 2019 and the entropy method to measure the digital economy development index of China’s provinces and cities and examines the impact of digital economy development on regional energy intensity using the fixed effect model. The results show that: (1) There is a significant difference in the development levels of the digital economy in the eastern and western regions of China. In addition, there is also a significant difference in the intensities of energy use between the northern and southern regions. (2) The development of the digital economy can significantly reduce China’s regional energy intensity. (3) There are three intermediary transmission paths for digital economy development to reduce the energy intensity through alleviating factor market distortion, promoting industrial structure upgrading and improving the technological innovation level, which are optimizing factor allocation, reducing factor distortion, adjusting and upgrading industrial structure and driving technological innovation applications. In general, all regions should further promote the development of digital industrialization and industrial digitization, enhance digital technology innovation and application, deepen the integrated development of digital economy and real economy and promote a new round of technological change and industrial upgrading on the basis of optimizing the allocation of important factors such as information data and artificial intelligence.

1. Introduction

The Guiding Opinions on Accelerating the Establishment and Improvement of a Green and Low-Carbon Circular Development Economic System put forward that promoting green and low-carbon development is the simplest way to accelerate the construction of ecological civilization and also transform the economic development mode. Reducing the energy intensity is conducive to addressing international climate change and achieving energy conservation and emission reduction targets; this is backed by studies such as one by Gurrib and Kamalov (2019 [1]), who compared the Chinese Yuan with major foreign currencies and energy markets and found the local currency had the lowest annualized risk. In addition, improving energy efficiency is also an intrinsic requirement for China to build a modern energy system and promote high-quality economic development (Zhang Yinhao, 2022 [2]).
Research on the influencing factors of energy intensity has a long history. Many scholars focus on the industrial structure (Yong and Yongjian, 2015 [3]; Xiaowei et al., 2017 [4]; Feng et al., 2018 [5]), technological innovation (Voigt et al., 2014 [6]; Gongbo and Jiatao, 2019 [7]; Qiying and Lina, 2020 [8]), energy prices (Chai et al., 2009 [9]; Jin and Mengnan, 2017 [10]; Yongsheng et al., 2020 [11]), environmental regulation (Jianzhong and Manman, 2018 [12]) and other aspects of research to analyze the causes of energy intensity fluctuations (Tan and Lin, 2018 [13]; Lin and Wang, 2021 [14]). As a new economic form, the digital economy has become a key driving force for improving the quality and efficiency of national economy and reshaping core competitiveness. This is also an important support for building an ecological civilization and realizing green and low-carbon development. Technological innovation triggered by the digital economy can promote economic transformation and development and industrial structure optimization and upgrading (Basu and Fernald, 2008 [15]; Mengfei and Xinwei, 2020 [16]; Qi et al., 2021 [17]), ecological protection and resource conservation (Changhong et al., 2018 [18], Qingxiang and Aiping, 2020 [19]) and improve urban ecological efficiency (Qi et al., 2021 [17]), but only a few studies have directly linked the two; Siyu et al. (2021 [20]) showed that Internet development can accelerate the decline in energy intensity through channels such as economic growth, R&D investment, human capital, financial development and industrial structure upgrading; Lu (2018 [21]) argued that the Internet has a positive spillover effect on enterprises, including energy utilization, by exerting network effects and promotes the improvement of enterprise energy technology efficiency. It is of interest to explore the impact of digital economy on regional energy intensity and its mechanism.
The digital economy plays a strong role in penetrating and promoting the overall social economy, and it has become an important engine to promote China’s modernization system construction and high-quality economic development. The Digital China Development Report (2020) shows that China’s total digital economy ranks second in the world. So, can the development of digital economy effectively reduce regional energy intensity? How does it affect regional energy intensity? Is there regional heterogeneity in its impact on energy intensity? Based on the panel data of 30 provinces and cities in China from 2011 to 2019, first, this paper constructed an index system to measure the development level of regional digital economy and used the entropy method to determine the level index. Then, it focused on the impact of digital economy on energy intensity and analyzed the differences between three regions in detail. At the same time, three intermediary variables of factor market distortion, industrial structure upgrading and technological innovation were introduced, and the intermediary effect model was used to test the influence mode and mechanism of the digital economy on energy intensity.
The innovation of this paper is mainly reflected in two aspects: First, we introduce an innovative research perspective, including energy intensity and digital economy in the same analytical framework, and explore the mechanism of the role of the digital economy on energy intensity in order to provide a new perspective for subsequent theoretical research. Second, in terms of research content, the analysis obtained that digital economy development can effectively reduce regional energy intensity, and it holds in three geographic regions, east, west and the central area. At the same time, the distortion of the factor market, the upgrading of industrial structure and technological innovation all have a significant intermediary effect at the national level, but there are geographically heterogeneous differences.

2. Literature Review

2.1. Digital Economy, Distortion of Factor Market and Energy Intensity

The digital economy is characterized by high permeability, high substitution and high synergy. It can match elements more efficiently and accurately (Xinlin and Zhengyuan, 2021 [22]) and promote regional development to reduce energy consumption and increase efficiency.
First, the digital economy has high permeability, which can search and transform all existing elements, including energy, realize the digital transformation of elements, excavate and allocate all idle elements, expand the scale of the factor market and reduce the search cost. At the same time, the development of the digital economy can not only promote the high connectivity of factor information in the market, but also the positive externalities and scale effects of the network structure of the digital economy provide more convenient conditions for the creation, transfer, aggregation and application of factors, thus reducing the distortion of the factor market and achieving the precise allocation of factor supply and demand (Zhongdong and Chaoshan, 2020 [23]).
Second, highly important factors in the digital economy era, represented by information and data, have the characteristics of high substitution, which can effectively improve the input ratio of factors, deeply integrate with traditional production factors, such as labor and capital, and improve the production efficiency of traditional factors. In addition, the innovative application of digital technology, especially the replacement of simple labor by artificial intelligence and automation, has triggered the effect of capital replacing labor, increases the demand for highly important talents and improves economic efficiency.
Third, the collaborative evolution of industrial digitalization and digital industrialization has driven the penetration of the whole industrial chain of factors and the application of diversification and multi-dimensional integration, reduced the transaction costs in production and life and jointly improved the efficiency of factor allocation (Zhang Yongheng, 2021 [24]). At the same time, by relying on new digital technologies, the government can effectively adjust factor allocation and pricing and alleviate factor market distortions in the process of upgrading the development level of the digital economy, promoting industrial digitization and digital industrialization.
The distortion of the factor market will lead to inefficient or ineffective resource allocation, lead to excessive energy consumption and other problems, and also, will have a significant inhibitory effect on energy utilization efficiency, which is bound to be detrimental to the effective reduction of the energy intensity. The digital economy can effectively reduce the problem of information asymmetry in the factor market, efficiently allocate all production factors, including energy, optimize the production structure of enterprises, improve the efficiency of resource allocation, improve the economic output per unit of energy and realize the reduction of the energy intensity (Wang Xiaoying, 2021 [25]). Based on this, this paper proposes Hypothesis 1.
H1: 
The digital economy can reduce the regional energy intensity by easing the distortion of the factor market.

2.2. Digital Economy, Industrial Structure Upgrading and Energy Intensity

The digital economy has the characteristics of high growth. The development of industrial digitalization and digital industrialization continues to promote the upgrading of the regional industrial structure, thus adjusting the energy consumption structure and reducing energy intensity.
First, in the era of the digital economy, compared with traditional factors such as labor and capital, highly important production factors such as artificial intelligence and information data have more development potential and higher productivity efficiency, driving the upgrading of the industrial structure (Zhongdong and Chaoshan, 2020 [23]), In addition, digital technology promotes the effective integration of information and resources, strengthens the competitive survival-of-the-fittest mechanism in the market environment, forces traditional backward industries to be eliminated, promotes the upgrading of manufacturing industry, and thus reduces the energy intensity (Vassileva et al., 2012 [26]).
Second, the popularization of industrial digitalization and the development of digital industrialization can strengthen the mutual penetration and integration of different industries, accelerate the deconstruction and restructuring of industrial chains, transform traditional industries, accelerate the birth of new industries and new formats and drive the upgrading of the regional industrial structure (Yunhong and Heng, 2020 [27]).
Thirdly, due to different geographical resource endowments, there are huge differences in the industrial systems and industrial structures among regions (Xiaowei et al., 2017 [4]). The digital economy can take advantage of information technology, data connectivity and other advantages to accelerate the development of regional, advantageous industries, promote the upgrading and adjustment of regional industrial structure (Xiaohui et al., 2020 [28]), eliminate energy-intensive and high-polluting enterprises and effectively promote the green upgrading of the regional industrial structure and the low-carbon transformation of energy enterprises.
Therefore, with the development of the digital economy, the proportion structure of industries with different energy intensities has also begun to change, which can promote the proportion of the tertiary industry that is relatively less dependent on energy to increase and the proportion of the secondary industry that is more dependent on energy to decrease. While promoting the optimization and upgrading of the industrial structure, it also drives the change in energy consumption structure, so as to effectively reduce regional energy intensity (Wang Xiaoying, 2021 [25]). Based on this, Hypothesis 2 is proposed in this paper.
H2: 
The digital economy will reduce regional energy intensity by promoting the upgrading of the industrial structure.

2.3. Digital Economy, Technological Innovation and Energy Intensity

The digital economy, characterized by complex technology, constantly promotes technological innovation and breakthroughs, realizing innovation-driven transformation, especially the innovation of green and low-carbon technology in industries that consume a lot of energy, which can eliminate redundant waste in the production process and improve energy utilization efficiency; reduce information asymmetry and transaction costs and improve the decision-making efficiency of the energy transmission system; integrate the enterprise production process and information flow to improve energy management efficiency and indirectly reduce energy consumption (Lange et al., 2020 [29]).
First, the digital economy has the characteristics of complex technology and can achieve technological emission reduction with the help of advanced digital and information technology (Ceccobelli et al., 2020 [30]). Digital technology promotes knowledge spillover and interaction by accelerating the flow of information. The high degree of connectivity of data elements reduces the cost of resource search and matching, improves the efficiency of resource circulation and helps to promote the understanding and exchange of research and development personnel and improves the innovation ability (Li and Xuelian, 2020 [31]). Using digital technologies, the digital economy can enable the energy industry to innovate, improve the efficiency of technological innovation in the development and use of clean energy and further shorten the research and development cycle. The innovation of green technology also contributes to the development and utilization of renewable energy (Alam and Murad, 2020 [32]), fully realizing the goal of building a smart energy system with digital technology, effectively adjusting the regional energy consumption structure and improving energy utilization efficiency.
Secondly, the digital economy optimizes the enterprise organization model and business model through technological innovation of digital production and management and gives innovation space for the transformation and upgrading of traditional industries (Zhongdong and Chaoshan, 2020 [23]). Digital technology can optimize the production and operation process; promote the interconnection and interaction of all of the links; realize the transformation of energy system operation and the management of intelligence, precision and standardization; reduce energy consumption in the enterprise management and production process; effectively improve energy utilization efficiency and reduce the energy intensity.
Third, the digital economy can establish a feedback mechanism for environmental protection by building a digital platform, improve market management and social governance and achieve the reduction of energy consumption and the low-carbon development of the energy structure. In addition, it will also affect the end consumers’ demand, spread the concept of green consumption, guide public green consumption and reduce energy consumption.
Based on this, Hypothesis 3 is proposed in this paper.
H3: 
The digital economy can reduce the regional energy intensity through technological innovation and development.

3. Model Design and Variable Selection

3.1. Model Design

Based on analysis of the relevant literature, this paper establishes a benchmark model, as shown in Equation (1), to test the impact of digital economy development on regional energy use intensity.
E i , t / Y i , t = α 0 + α 1 D E i , t + k α k C o n t r o l i , t + δ i + η t + ξ i , t
In the above equation, i and t represent the region and period, respectively; E i , t / Y i , t indicates the energy intensity; D E i , t is the development level of digital economy, calculated according to the indicator system; C o n t r o l i , t is the control variable; δ i and η t are the individual effect and time effect, respectively; ξ i , t is the residual item.
At the same time, based on the study of Wen Zhonglin et al. (2004) [33], this paper uses the intermediary effect model to empirically test that the development of the digital economy can reduce the energy intensity by restraining factor market distortion, promoting industrial structure upgrading and technological progression. The specific model setting is as follows:
W i , t = β 0 + β 1 D E i , t + k β k C o n t r o l i , t + δ i + η t + ξ i , t
E i , t / Y i , t = γ 0 + γ 1 W i , t + γ 2 D E i , t + k γ k C o n t r o l i , t + δ i + η t + ξ i , t
Among them, W i , t represents the intermediary variables, including factor market distortion (DIS), industrial structure upgrading (ISU) and technological innovation (TI) indicators. In addition, in order to increase the reliability of the test process, the Sobel test is also combined with the intermediary effect test. The specific inspection process can be divided into the following four steps: ① If α 1 is significant, it indicates that there may be a mediating effect. If it is not significant, the masking effect may be present. ② If β 1 and γ 1 are significant, this indicates the existence of an intermediary effect; if any coefficient is not significant, the Sobel test is required. ③ If γ 2 is not significant, it indicates that there is a complete intermediary effect; if γ 2 is significant, this indicates that there is a partial intermediary effect. ④ Sobel test: if the observed Sobel coefficient is significant, the original assumption is β 1 γ 1 = 0 . If the coefficient of the calculated model is significant, it indicates the existence of a mediation effect.

3.2. Variable Selection

The explained variable of this paper is energy intensity (E/Y), which is expressed by the ratio of the total energy consumption of each province and city to GDP. The core explanatory variable is the development level of the digital economy (DE). Based on research by many scholars (Lan Guojiao, 2020 [34]; Xinlin and Zhengyuan, 2021 [22]) and the availability of relevant data, this paper constructs an indicator system for measuring the development level of the digital economy from four dimensions: the digital infrastructure, the development of the digital industry, the integrated application of the digital economy and the development environment of the digital economy. The data are also standardized by analyzed with the Network Readiness Index method (NRI) [35] constructed by the World Economic Forum. On this basis, the entropy method is used to calculate the weights of indicators at all levels of development of the digital economy. The specific index evaluation system and its index weight are shown in Table 1.
Referring to the research of many scholars, such as Lan Guojiao (2020) [34] and Xinlin and Zhengyuan (2021) [22], urbanization rate (CZHL), population density (RKMD), fiscal expenditure level (CZZC), financial development level (JRFZ), foreign trade intensity (OPEN) and FDI intensity (FDI) are selected as the control variables. Among them, the urbanization rate is expressed by the proportion of the urban permanent population to the provincial permanent population. The population density is the ratio of the permanent population of each province and city to the area of the administrative division. The level of financial development, the level of fiscal expenditure, the intensity of foreign trade and the intensity of FDI are, respectively, expressed by the ratio of foreign direct investment, total imports and exports, total RMB loans of financial institutions and fiscal expenditure to GDP.
The intermediary effect variables include factor market distortion (DIS), industrial structure upgrading (ISU) and technological innovation (TI). The upgrading of the industrial structure refers to the practice of Gan Chunhui et al. (2011) [36], which is expressed as the ratio of the added value of the tertiary industry to that of the secondary industry. Technological innovation is represented by the number of patent applications in each province and city [17]. For factor market distortion, this paper uses the method of Li Xuesong (2020) [37] to calculate the factor capital (DIS_K), labor market distortion degree (DIS_L) and the total factor market distortion index (DIS) of each province and city.
The sample data in this paper are panel data from 30 provinces in China, covering the period from 2011 to 2019. The above indicator data are all from provincial and municipal statistical yearbooks, the National Bureau of Statistics, the China Statistical Yearbook, etc., (the interpolation method is used to complete the missing values of individual data during the collection process). Due to the lack of relevant data in some years in the Tibet Autonomous Region, it was not included in the sample. The main variables after standardization are described in Table 2.

4. Empirical Analysis

4.1. Spatial and Temporal Patterns and Evolution Characteristics of Energy Intensity and Development Level of Digital Economy in China’s Provinces and Cities

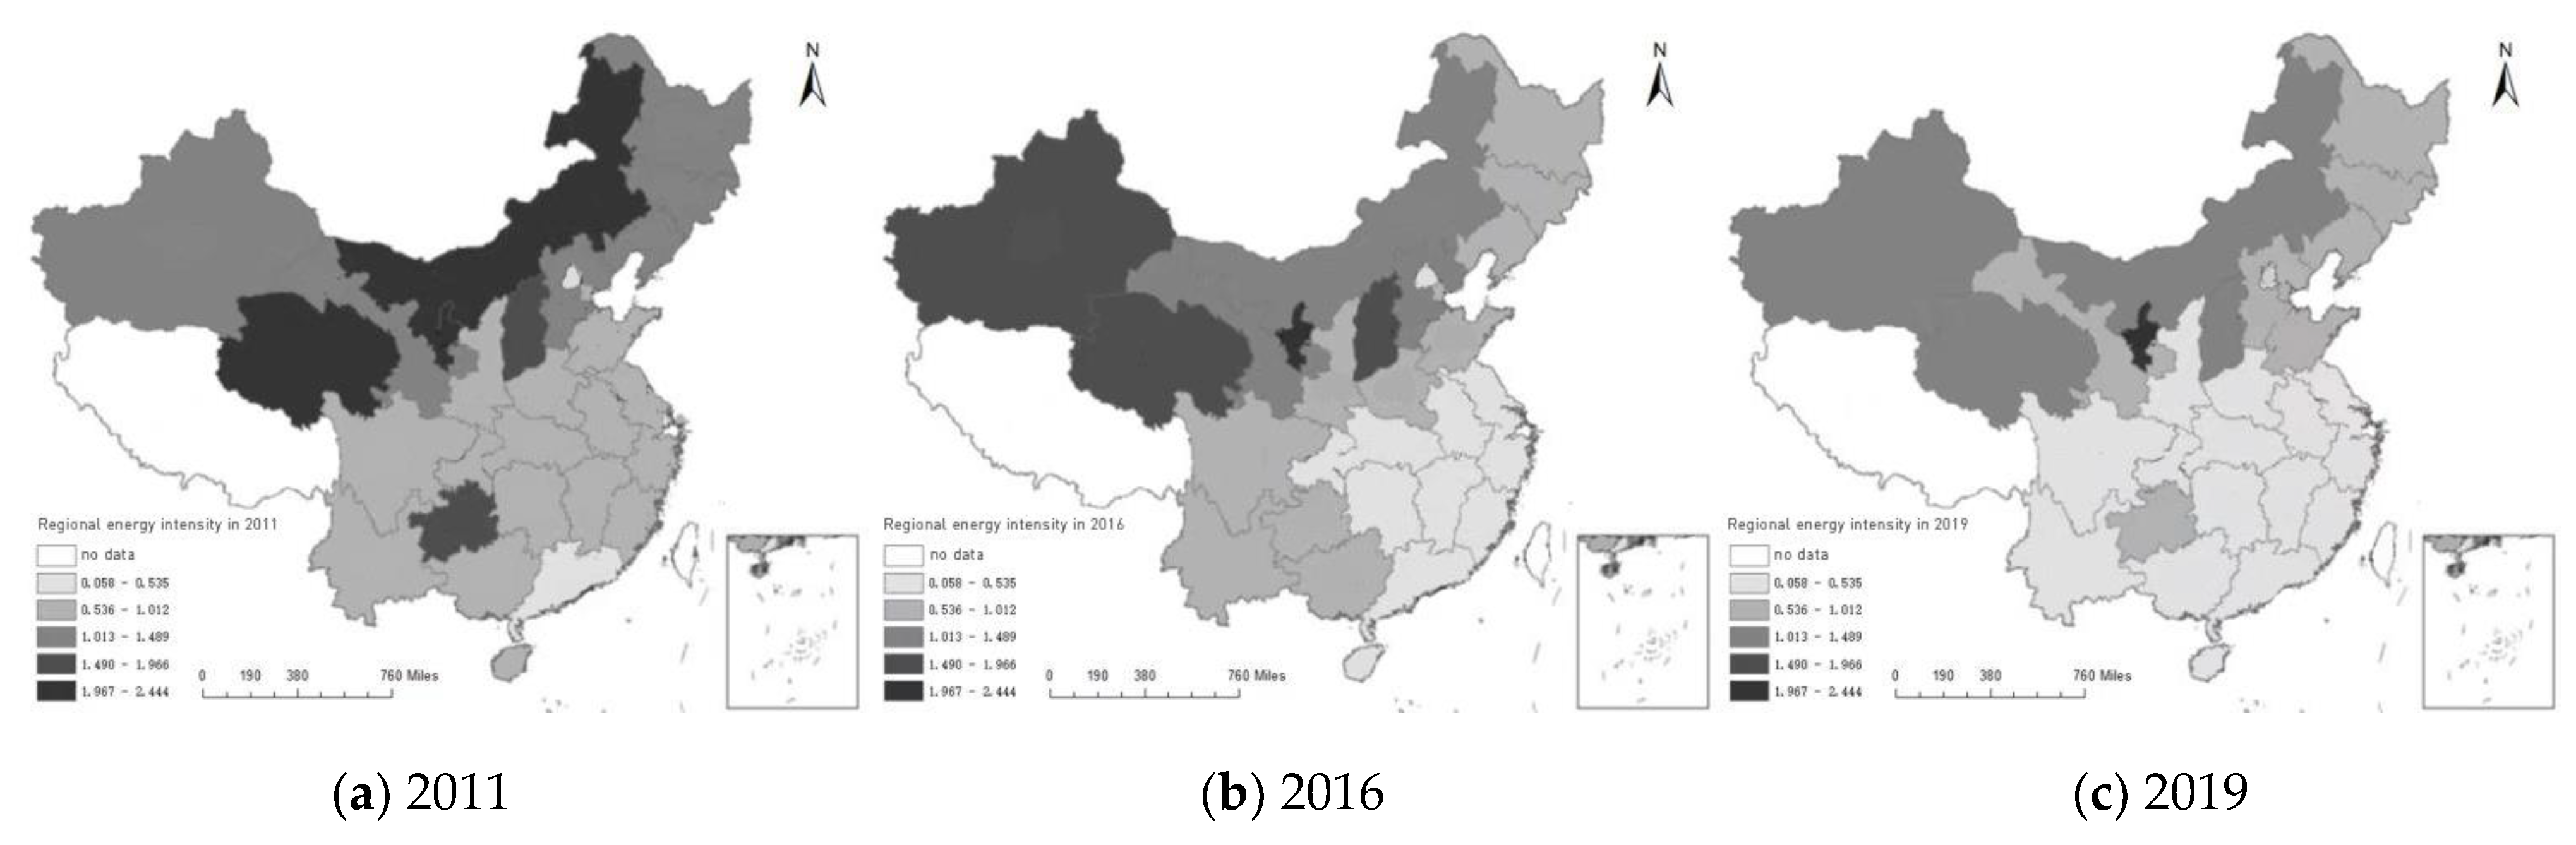
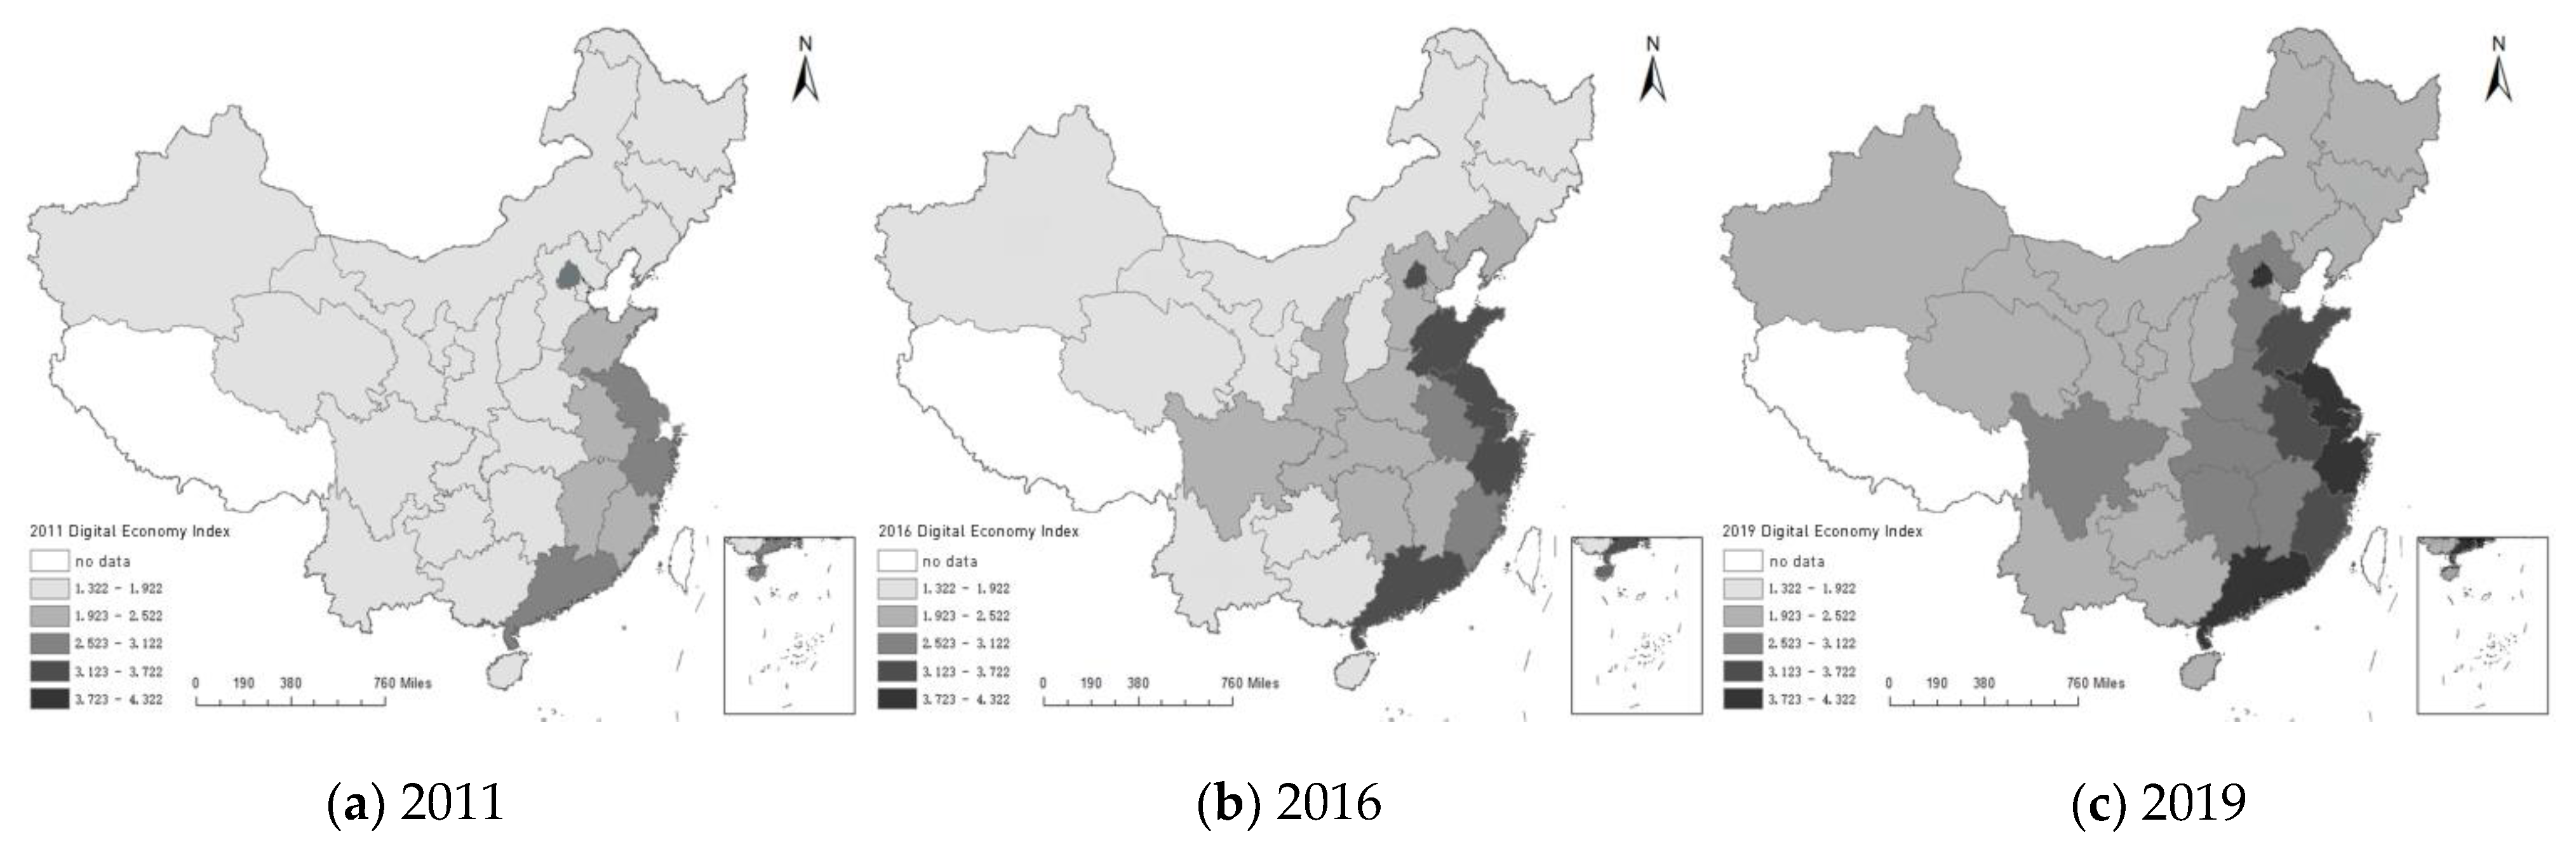
The digital economy was first identified as a new engine of innovation-driven economic growth strategy in the G20 Summit in Hangzhou in 2016. Therefore, this paper selects three time periods, 2011, 2016 and 2019, using the same break point; the spatial evolution characteristics of energy intensity and digital economy development level in China are analyzed more clearly.
As can be seen from Figure 1 and Figure 2, there are obvious regional differences among the provinces and cities in China in terms of energy intensity and digital economy development. In 2011, the three regions with the lowest energy intensities were Beijing, Shanghai and Guangzhou, and the eastern provinces had the most developed digital economies, of which Beijing’s digital economy developed the fastest. In 2016, the energy intensities in most of the eastern regions and some central provinces further declined, while the digital economy developed rapidly. By 2019, the energy intensity of most of the eastern and central regions continued to decrease and showed obvious north–south differences. Except for some provinces in the north-west, the digital economies in all the provinces developed rapidly, showing significant differences between the east and the west. It can be seen that there is an obvious spatial difference between the development level of the digital economy and energy use intensity. Compared with the central and western regions, the infrastructure for digital economy development in the eastern provinces is larger in scale and has a faster development momentum due to the more developed economy. They can reasonably allocate resources and use advanced technology, accelerate the development of emerging industries, eliminate the backward production capacity, promote the upgrading and adjustment of the industrial structure and effectively reduce the energy intensity. At the same time, the digital economies in the eastern region have an obvious radiation effect, which can not only promote the economic development of the region, but also drive the development of the digital economies in the surrounding areas.

4.2. Analysis of Basic Regression Results

In this paper, we first use the provincial panel data from 2011 to 2019 to regress the least squares method, the random effect model and the fixed effect model (1), and the results are shown in Table 3. On this basis, the regression results of the fixed effect model, least square method and random effect model are, respectively, carried out with the Hausman test, and their p value is −0.000. Therefore, the fixed effect model is finally selected to explore the effect and mechanism of digital economic development on regional energy intensity.
According to the analysis of the results in Table 3, after controlling the relevant variables, the coefficient of the digital economy development index under the fixed effect panel model is significantly negative, indicating that the development level of the digital economy has a significantly negative correlation with the energy intensity. The digital economy index increases by 1%, and the regional energy intensity decreases by 1.103%, indicating that the development of the digital economy can reduce the regional energy intensity and energy consumption per unit of GDP.
From the results of control variables, we can see that the coefficient of urbanization rate is significantly positive, indicating that the energy intensity will rise with the improvement of the urbanization level. This may be due to the fact that the urbanization level of each province is still in the initial stage, and the scale advantages in resource allocation, energy efficiency and other aspects have not been brought into play; thus, the regional energy consumption per unit GDP not significantly reduced. The coefficient of population density is significantly positive, indicating that the expansion of the regional population will lead to the growth of energy consumption and have a positive impact on regional energy intensity. Fiscal expenditure has a significantly negative impact on regional energy intensity, which fully shows that the more government investment there is, and in particular, the more attention that is paid to environmental pollution, the stronger the role of improving the quality and efficiency of energy resources utilization is.
In addition, considering the vast territory of China and the differences in resource endowment in different regions, the inhibition effect of digital economic development on energy intensity may also present different characteristics. Therefore, according to the division standard of the National Development and Reform Commission in 2000, this paper will carry out fixed effect regression for 30 provinces according to the three regions of the east, the middle and the west. At the same time, we consider that different provinces, even those located in the same region, may have different effects due to their different resource conditions. Therefore, with reference to the practice of Li et al. (2021) [38], the typical resource-based provinces of Shanxi, Inner Mongolia, Heilongjiang, Guizhou, Yunnan, Shaanxi, Qinghai, Ningxia and Xinjiang are taken as one research object, and the other 21 provinces are classified as another research object to explore the impact of digital economic development on regional energy intensity. The summary of all the regression results obtained according to Formula (1) is shown in Table 4.
According to the result analysis in Table 4, the regression coefficients of all the regions are significantly negative, indicating that the development of the digital economy has a significantly negative relationship with energy intensity. This also further shows that the impact of the development of the digital economy on energy intensity does not change with regional changes, which to some extent ensures the stability of the research results.
From the perspective of the eastern, central and western regions, the development of the digital economy has a more prominent impact on the energy intensity of the eastern region, followed by the western and central provinces. The reason may be that there is still a certain gap between the central and western regions and the eastern regions in terms of economic development, advanced technology and resource allocation, and the development of the digital economy is slow. At the same time, the development of the western region is still dominated by traditional industries, and the development of emerging industries is relatively slow, so the impact of the digital economy on energy intensity is small. However, due to improved infrastructure, economic development and the technological innovation capabilities of the eastern provinces, the development of digital economy in the eastern region started early and developed rapidly, which can rationalize the allocation of resources to a greater extent and promote the rational development of industrial structure, thus reducing energy intensity.
From the perspective of whether it is a resource-based province or not, the development of the digital economies in resource-based provinces has a more obvious inhibitory effect on energy intensity than they do in non-resource-based provinces. This also shows that if resource-based provinces want to reduce their energy intensity, they can accelerate the development process of the digital economy, optimize resource allocation based on digital technology innovation, promote the upgrading of the industrial structure, improve the energy consumption structure and improve energy utilization efficiency.

4.3. Mediation Effect Test

According to the regression results of the benchmark model in Table 3 and Table 4, the digital economy has a significant inhibitory effect on regional energy intensity, and the degree of influence varies in different regions. Then, how does the development of the digital economy affect the regional energy intensity? Based on this, this paper examines the mechanism of the development of the digital economy on energy intensity from three aspects: factor market distortion, industrial structure upgrading and technological innovation drive, with a view to clarifying the internal mechanism of the impact of the digital economy on regional energy intensity. The regression results are shown in Table 5, Table 6 and Table 7, respectively. Columns (1), (3), (5), (7), (9) and (11) in the table are regression results based on Equation (2), and columns (2), (4), (6), (8), (10) and (12) are regression results based on Equation (3).

4.3.1. The Intermediary Effect Test of Factor Market Distortion

Table 5 shows the test results of the intermediary effect of factor market distortion on the reduction of energy intensity in the development of the digital economy. At the national level, the results in column (1) in Table 5 show that the development of the digital economy has a significantly negative impact on the distortion of the factor market, indicating that the development of the digital economy can reduce the distortion of the factor market. The result in column (2) shows that the distortion of the factor market has a significantly positive impact on energy intensity. This shows that the development of the digital economy will reduce the energy intensity by reducing the distortion of the factor market. This verifies Hypothesis 1. The development of the digital economy can further promote the flow of factors nationwide, optimize the allocation of factors, reduce resource mismatch and factor market distortion; thus, this improves the efficiency of resource allocation and reduces the energy intensity.
From the perspective of the eastern, central and western regions, the results from columns (3) to (8) in Table 5 show that the digital economy in the eastern region has a significantly negative impact on the factor market distortion, but the factor market distortion has no significant impact effect on energy intensity, so only one of the two coefficients is significant, and the Sobel test was required. The test results show that the P value is less than 1% of the significance level, and the original hypothesis is rejected, indicating that there is still an intermediary effect. The digital economies in the central provinces have a significantly negative impact on the distortion of factor market, and the distortion of factor market has a significantly positive impact on energy intensity, indicating that the distortion of factor market in the central region has an intermediary effect on the development of digital economies and the reduction of energy intensity. However, the coefficients in the western region are not significant, indicating that there is no intermediary effect on the distortion of the factor market. The possible reason is that compared with those in the western region, the digital economies’ infrastructure in the eastern and central regions is more complete, the resource utilization efficiency is more advantageous and the optimization of factor allocation has a more significant impact on energy intensity.
From the perspective of whether it is a resource-based province, the results from columns (9) to (12) in Table 5 show that the digital economies in resource-based provinces have a significantly negative impact on factor market distortion, but the factor market distortion does not have a significant impact on energy intensity, and they failed to pass the Sobel test, indicating that there is no intermediary effect on factor market distortion in resource-based provinces. For non-resource-based provinces, the development of the digital economy can reduce the distortion of the factor market, thereby reducing the regional energy intensity and achieving low-carbon economic development.

4.3.2. Test of Intermediary Effect of Industrial Structure Upgrading

Table 6 shows the test results of the intermediary effect of industrial structure upgrading on the reduction of energy intensity in the development of the digital economy. At the national level, it can be seen from column (1) in Table 6 that the development of the digital economy has an obvious promoting effect on the upgrading of the industrial structure, and from column (2), the upgrading of the industrial structure also significantly reduces the energy intensity, which indicates that the upgrading of the industrial structure has a mediating effect on the development of the digital economy to reduce the energy intensity.
From the perspective of different regions, columns (3) to (4) in Table 6 show that the development of the digital economies in the eastern region can promote the upgrading of the industrial structure, thereby reducing the energy intensity, and this has a significant intermediary effect. However, columns (5) to (6) in Table 6 show that the coefficient of the central region is not significant, indicating that there is no intermediary effect of industrial structure upgrading in the central region. For western provinces, it can be seen from columns (7) to (8) in Table 6 that the development of the digital economies has significantly promoted the upgrading of the industrial structure, but the upgrading of the industrial structure has no significant impact on energy intensity, so the Sobel test was required. The test results show that the Sobel coefficient value is significant at the significance level of 5%, and there is still an intermediary effect, indicating that the development of the digital economies in western provinces will promote the upgrading of the industrial structure and reduce the energy intensity. The reason may be that the development of the digital economy, especially the development of industrial digitalization and digital industrialization, can accelerate the upgrading of the regional industrial structure, replace traditional industries with emerging industries, eliminate backward production capacity and effectively reduce the energy intensity. The digital economy in the eastern region has developed rapidly, and the upgrading of the industrial structure has more advantages. It can make faster use of emerging technologies, develop new drivers of green economic development and further reduce the energy intensity. However, the upgrade level of the industrial structure in the central region is relatively low, and the dividend advantage of the digital economy in reducing energy intensity has not been brought into play.
From the perspective of whether it is a resource-based province or not, the development of the digital economy in non-resource-based provinces has a stronger role in promoting the upgrading of the industrial structure than it does in resource-based provinces, but the impact of industrial structure upgrading on regional energy intensity is not significant. Through the Sobel test, it is found that the upgrading of the industrial structure in non-resource-based provinces has a significant intermediary effect on the reduction of energy intensity in regions with digital economies. This may be because the economic development of non-resource-based provinces is less dependent on local resource endowment than that of resource-based provinces is. The digital economy can penetrate into all industries faster, accelerate the deconstruction and restructuring of the industrial chain and promote the further upgrading of the local industrial structure, thereby reducing energy consumption, improving the energy structure, improving energy utilization efficiency and reducing the energy intensity. However, the industrial development of resource-based provinces is highly dependent on local resources, and the development of the digital economy cannot achieve low energy consumption and high energy efficiency by changing the regional industrial pattern in a short time.

4.3.3. Test of Intermediary Effect of Technological Innovation

Table 6 shows the test results of the intermediary effect of technological innovation on the reduction of energy intensity in the development of the digital economy. At the national level, it can be seen from column (1) in Table 7 that the development of the digital economy can significantly promote the development of technological innovation, and from column (2) in Table 7, the development of technological innovation can significantly reduce the energy intensity, which shows that technological innovation has a significant intermediary effect on the development of the digital economy to reduce the energy intensity.
From the perspective of different regions, the development of the digital economies in the eastern region and resource-based provinces effectively promotes the innovation of science and technology, and technological innovation can also effectively reduce the regional energy intensity. The digital economies in the central and western regions do not significantly promote technological innovation, but technological innovation has a significantly negative impact on regional energy intensity. The Sobel test shows that technological innovation still has a significant intermediary role in reducing regional energy intensity in the digital economy. The digital economies in non-resource-based provinces have a significant role in promoting technological innovation, but the inhibition of technological innovation on energy intensity is not significant. The Sobel test results show that technological innovation still has a mediating effect. Therefore, technological innovation in all regions has an intermediary effect in the process of reducing energy intensity in the development of the digital economy.
This is because the digital economy, which relies on big data, cloud computing, artificial intelligence and other information technologies, has become a new driving force for regional development, has spawned the new generation of innovative applications of digital technology and has led regional innovation-driven development. Green and low-carbon technological innovation triggered by digital technology has also caused huge improvements in the energy utilization efficiency of various industries, which is conducive to the reduction of energy intensity.

4.3.4. Robustness Test

In order to verify the reliability of the above results, the following four methods are mainly used: First, the staged regression method was used. In July 2015, the country improved the digital economy to the national strategic level. Since 2016, the digital economy has developed rapidly. Therefore, the results of this paper are divided into two periods, 2011–2015 and 2016–2019, to test the impact of the development of the digital economy on energy intensity. The results are shown in columns (1) and (2) in Table 8. The impact direction and significance of the digital economy on energy intensity have not changed substantially, indicating that the regression results are robust.
Second, we replaced the interpreted variable. Due to the large difference in the levels of economic development among regions, there are also large differences in the size of permanent residents. Therefore, we replaced the regional energy intensity with the per capita carbon emissions and conducted the robustness test. The regression results are shown in column (3) in Table 8. The impact coefficient of the digital economy is still significantly negative, which is basically consistent with the benchmark regression results.
Third, we replaced the core explanatory variables. The previous article calculates the development level of the digital economies in various regions by constructing a digital economy measurement system and using entropy method. Based on this, this paper further uses the principal component analysis method to re-evaluate the development level of the digital economies in various regions and test the relationship between the digital economy and regional energy intensity. The regression results are shown in column (4) in Table 8. The impact coefficient of the digital economy is still significantly negative, confirming the robustness of the benchmark regression results.
Fourth, the instrumental variable method deals with endogenous problems. In order to avoid the possible influence of other factors and endogenous problems caused by two-way causation, this paper, based on research by scholars such as Zhiming et al. (2007) [39], Yun and Qing (2020) [40], Xie Yunfei (2022) [41], selects topographic relief as the instrumental variable in the regional digital economy. (The topographic relief data are from You Zhen, Feng Zhiming * and Yang Yanzhao. The China relief degree in km grid data set was used (J/DB/OL). Global change data warehousing electronic magazine were used (both in English and Chinese), 2018; https://doi.org/10.3974/geodb.2018.03.16.V1.) On the one hand, terrain undulation can reflect local terrain complexity to a certain extent and affect the cost and difficulty of digital infrastructure construction, so it meets the exogenous conditions of tool variables. On the other hand, topographic relief, as a natural factor, has no direct relationship with regional energy consumption and other economic variables and meets the exogenous requirements as a tool variable. In addition, considering that terrain relief is a constant that does not change with time, the intersection of terrain relief and dummy variables of each year is used as a tool variable for 2SLS regression. As shown in column (5) in Table 8, the relationship of the digital economy with regional energy intensity is significantly negative, indicating that the result is still stable. In the first stage, the regression F value is 80.81, which conforms to the empirical rule of F > 10. Then, Sargan statistics are used to test the exogenous nature of the instrumental variables (p value is 0.2888), which shows that the selection of the model instrumental variables is reasonable.

5. Conclusions and Suggestions

Based on the panel data of 30 provinces and cities across the country from 2011 to 2019, this paper uses the entropy method to measure the development levels of the digital economies in each province and explores the impact of digital economy development on energy intensity. The main conclusions are as follows:
First, there are obvious regional differences in the energy intensities and digital economy development in all provinces and cities in China. The digital economy developed the fastest in the eastern region and had obvious radiation effect, which drove the development of the digital economies in the surrounding regions.
Second, the development of digital economy can effectively reduce regional energy intensity. Among them, the development level of the digital economy in eastern region is relatively high, which quickly used advanced technologies to reduce the energy consumption of sectors and effectively improved the efficiency of resource utilization.
Thirdly, at the national level, factor market distortion, industrial structure upgrading and technological innovation have significant mediating effects on the reduction of energy intensity due to digital economy development. The development of the digital economy can effectively reduce the regional energy intensity by optimizing factor allocation, reducing factor market distortion, promoting the upgrading of the regional industrial structure, promoting technological innovation and development and improving energy utilization efficiency.
Fourthly, from the perspective of regional differences, the digital economy in the eastern region can effectively reduce energy intensity by reducing factor market distortion, promoting industrial structure upgrading and technological innovation development. In the central region, only factor market distortion and technological innovation have a mediating effect on the reduction of energy intensity by the digital economy. The digital economy in the western region can effectively reduce the energy intensity by relying on the influence of industrial structure upgrading and technological innovation development. In resource-based provinces, the development of the digital economy promotes technological innovation, and then, this reduces the regional energy intensity. On the other hand, non-resource-based provinces can rely on the development of the digital economy to alleviate the distortion of factor markets, promote the upgrading of industrial structure and accelerate technological innovation, so as to improve the quality and efficiency of regional development and effectively reduce the energy intensity.
Based on the above conclusions, this paper proposes the following policy implications:
First, the development of the digital economy is an effective way to reduce the energy intensity, strengthen the construction of digital infrastructure, deepen the integrated development of the digital economy and real industry, promote the integrated application of information technology and further release the dividend advantages of the digital economy for reforming the energy structure, reducing energy consumption and reducing energy intensity, so as to achieve the goal of energy conservation and emission reduction and promote the sustainable development of the environment.
Second, we must give full play to the intermediary effect under the optimized factor allocation, industrial upgrading and technological innovation of the digital economy. We must give full play to the allocation effect of factors in the digital economy, improve the market-oriented allocation of factors, promote the effective allocation of production factors in the market, make comprehensive use of highly important factors such as information and data, reduce the distortion of the factor market, improve the efficiency of factor allocation and enhance the efficiency of the new driving force of the digital economy to promote the reduction of energy intensity. At the same time, we must accelerate the development of digital industrialization and industry digitalization, promote the innovative application of digital technology, use emerging technologies such as artificial intelligence, improve the breadth and depth of the application of digital economy in industrial sectors, accelerate the integration of information technology and traditional industries, accelerate the elimination of outdated capacity, promote the upgrading of the regional industrial structure and develop new drivers of green economic development. In addition, we must rely on the development of digital technology to accelerate new energy research and development, innovate low-carbon production technology, effectively improve the energy consumption structure, improve energy utilization efficiency and achieve energy intensity reduction.
Third, we should pay attention to the heterogeneity of the impact of the digital economy on regional energy intensity and guide the coordinated development of the digital economy and ecological construction according to local conditions. The digital economy in the eastern region has the most obvious impact on energy intensity and can reduce regional energy intensity by optimizing factor allocation and promoting industrial structure upgrading and technological innovation, and other measures, so as to accelerate the development of the digital economy, promote the development and application of green technology innovation, promote the formation of emerging industries and industries and reshape the demand side to reduce the energy intensity. The digital economy in the central region plays a significant role in factor allocation and technological innovation, improving the environment for the development of the digital economy, promoting the development of intelligent, integrated and digital industries and the integrated application of enterprises, further improving the economic system for green, low-carbon and circular development, and effectively reducing the regional energy intensity. The development level of the digital economy in the western region is low and has only a little impact on energy intensity. We should combine our resource advantages and development status, strengthen the construction of digital economy infrastructure, vigorously popularize network resources and personal digital applications, introduce high-quality talents and absorb innovative technologies from the eastern and central regions and reform traditional industries. We will promote enterprise production automation, digital reform and the integrated application of digital technology and build distinctive digital industries to release the dividend advantages of the digital economy for reducing the energy intensity and other aspects. Resource-based provinces can rely on the development of the digital economy to strengthen technological innovation and realize the reform of energy structure and the reduction of unit energy consumption. Non-resource-based provinces can give full play to the advantages of the digital economy in optimizing resource allocation, industrial upgrading and technological innovation, reforming regional energy systems, improving energy utilization systems, reducing the regional energy intensity and promoting green and low-carbon development.

Author Contributions

Methodology, X.Y.; formal analysis, P.W.; investigation, P.W. and X.Y.; resources, G.Z.; data curation, P.W. and X.Y.; writing—original draft preparation, P.W.; supervision, G.Z.; project administration, X.Y. All authors have read and agreed to the published version of the manuscript.

Funding

This study was supported by the National Social Science Foundation of China (No: 21XGL02, 18BGL246), the Youth Jinggang Scholars Program in Jiangxi Province(No: QNJG2020047), the Jiangxi Higher Education Teaching Reform Research Project (No: JXJG-20-7-32), Innovation and Entrepreneurship Training Program for College Students (No: 202010407029), the Basic Research Plan of The Science and Technology Plan Project of Jiangxi Provincial Science and Technology Department (No: 20181BAA208005).

Institutional Review Board Statement

Not applicable.

Informed Consent Statement

Not applicable.

Data Availability Statement

The data that support the findings of this study are openly available in Chinese provincial and municipal statistical yearbooks, National Bureau of Statistics of China, China Statistical Yearbook, etc.

Conflicts of Interest

The authors declare no conflict of interest.

References

  1. Gurrib, I.; Kamalov, F. The implementation of an adjusted relative strength index model in foreign currency and energy markets of emerging and developed economies. In Macroeconomics and Finance in Emerging Market Economies; Taylor & Francis: Abingdon, UK, 2019; Volume 12, pp. 105–123. [Google Scholar]
  2. Zhang, Y. Analysis of regional differences and influencing factors of energy consumption intensity. Macroecon. Res. 2022, 287, 129–142. [Google Scholar]
  3. Zhang, Y.; Pu, Y. Industrial structure change and its impact on energy intensity. Ind. Econ. Res. 2015, 2, 15–22+67. [Google Scholar]
  4. Ma, X.; Shi, X.; Wang, Y.; Liao, H. The impact of China’s industrial structure change on energy intensity. Resour. Sci. 2017, 39, 2299–2309. [Google Scholar]
  5. Feng, C.; Wang, M.; Zhang, Y.; Liu, G.-C. Decomposition of Energy Efficiency and Energy-saving Potential in China: A Three-hierarchy Meta-frontier Approach. J. Clean. Prod. 2018, 176, 1054–1064. [Google Scholar] [CrossRef]
  6. Voigt, S.; De Cian, E.; Schymura, M.; Verdolini, E. Energy Intensity Developments in 40 Major Economies: Structural Change or Technology Improvement? Energy Econ. 2014, 41, 47–62. [Google Scholar] [CrossRef] [Green Version]
  7. Liao, J.; Xu, J. Enterprise Innovation and Energy Intensity. Contemp. Financ. Econ. 2019, 1, 108–118. [Google Scholar]
  8. Ran, Q.; Xu, L. Heterogeneity R&D, government support and energy intensity. Sci. Technol. Manag. Res. 2020, 40, 224–232. [Google Scholar]
  9. Chai, J.; Guo, J.-E.; Wang, S.-Y.; Lai, K.K. Why does energy intensity fluctuate in China? Energy Policy 2009, 37, 5717–5731. [Google Scholar] [CrossRef]
  10. Yang, J.; Cao, M. Empirical study on the impact of changes in energy prices and total factor productivity on China’s industrial energy intensity. Sci. Technol. Manag. Res. 2017, 37, 255–260. [Google Scholar]
  11. Feng, Y.; Zhang, Y.; Liu, Z. Energy price, technological progress and energy intensity-dynamic space-time evolution based on urban data in China. Urban Environ. Res. 2020, 3, 69–92. [Google Scholar]
  12. Xu, J.; Wang, M. Green technology innovation, environmental regulation and energy intensity: An empirical analysis based on China’s manufacturing industry. Sci. Res. 2018, 36, 744–753. [Google Scholar]
  13. Tan, R.; Lin, B. What Factors Lead to the Decline of Energy Intensity in China’s Energy Intensive Industries? Energy Econ. 2018, 71, 213–221. [Google Scholar] [CrossRef]
  14. Lin, B.; Wang, M. What Drives Energy Intensity Fall in China? Evidence from a Meta-frontier Approach. Appl. Energy 2021, 281, 116034. [Google Scholar] [CrossRef]
  15. Basu, S.; Fernald, J.G. Information and Communications Technology as a General Purpose Technology: Evidence from U.S. Industry Data. Econ. Rev. 2008, 8, 146–173. [Google Scholar]
  16. Wang, M.; Zhang, X. Research on the impact mechanism of technological change on production process in the era of digital economy. Economist 2020, 1, 52–58. [Google Scholar]
  17. Liang, Q.; Xiao, S.; Li, M. Has the development of digital economy improved urban ecological efficiency—Based on the perspective of industrial structure upgrading. Explor. Econ. Issues 2021, 6, 82–92. [Google Scholar]
  18. Pei, C.; Ni, J.; Li, Y. Political economic analysis of digital economy. Financ. Trade Econ. 2018, 39, 5–22. [Google Scholar]
  19. Zhou, Q.; He, A. Digital economy enables high-quality development in the Yellow River basin. Econ. Issues 2020, 11, 8–17. [Google Scholar]
  20. Ren, S.; Hao, Y.; Xu, L.; Wu, H.; Ba, N. Digitalization and energy: How does internet development affect China’s energy consumption? Energy Econ. 2021, 98, 105220. [Google Scholar] [CrossRef]
  21. Lu, W.-C. The impacts of information and communication technology, energy consumption, financial development, and economic growth on carbon dioxide emissions in 12 Asian countries. Mitig. Adapt. Strateg. Glob. Chang. 2018, 23, 1351–1365. [Google Scholar] [CrossRef]
  22. Liao, X.; Yang, Z. Effect measurement and realization path of digital economy enabling the transformation and upgrading of manufacturing industry in the Yangtze River Delta. East China Econ. Manag. 2021, 35, 22–30. [Google Scholar]
  23. Ma, Z.; Ning, C. Digital economy, factor allocation and manufacturing quality upgrading. Econ. Syst. Reform. 2020, 3, 24–30. [Google Scholar]
  24. Zhang, Y.; Wang, J. Has the development of the digital economy reduced the level of China’s factor mismatch? Forum Stat. Inf. 2020, 35, 62–71. [Google Scholar]
  25. Wang, X.; Wang, Y.; Shen, L.; Li, X.; Du, Q. The spatial effect of informatization on China’s energy intensity-based on the spatial Dubin error model. Resour. Sci. 2021, 43, 1752–1763. [Google Scholar]
  26. Vassileva, I.; Wallin, F.; Dahlquist, E. Understanding energy consumption behavior for future demand response strategy development. Energy 2012, 46, 94–100. [Google Scholar] [CrossRef]
  27. Shen, Y.; Huang, H. Research on the impact of digital economic level on the optimization and upgrading of manufacturing industrial structure-based on the panel data of Zhejiang Province from 2008 to 2017. Sci. Technol. Manag. Res. 2020, 40, 147–154. [Google Scholar]
  28. Chen, X.; Zhang, H.; Wu, Y. How does the digital economy affect the level of industrial structure? Secur. Mark. Guide 2020, 7, 20–29. [Google Scholar]
  29. Lange, S.; Pohl, J.; Santarius, T. Digitalization and energy consumption. Does ICT reduce energy demand? Ecol. Econ. 2020, 176, 106760. [Google Scholar] [CrossRef]
  30. Ceccobelli, M.; Gitto, S.; Mancuso, P. ICT capital and labour productivity growth: A non-parametric analysis of 14 OECD countries. Telecommun. Policy 2012, 36, 282–292. [Google Scholar] [CrossRef] [Green Version]
  31. Xiong, L.; Cai, X. The impact of digital economy on the improvement of regional innovation capacity-an empirical study based on the Yangtze River Delta urban agglomeration. East China Econ. Manag. 2020, 34, 1–8. [Google Scholar]
  32. Alam, M.M.; Murad, M.W. The Impacts of Economic Growth, Trade Openness and Technological Progress on Renewable Energy Use in Organization for Economic Co-operation and Development Countries. Renew. Energy 2020, 145, 382–390. [Google Scholar] [CrossRef]
  33. Wen, Z.; Zhang, L.; Hou, J.; Liu, H. Intermediary effect test procedure and its application. J. Psychol. 2004, 36, 614–620. [Google Scholar]
  34. Lan, G. Research on Statistical Measurement of Digital Economic Development Level in Central China. Master’s Thesis, Jiangxi University of Finance and Economics, Nanchang, China, 2020. Available online: https://d.wanfangdata.com.cn/thesis/D02062497 (accessed on 9 February 2023).
  35. Yang, J.; Xiong, Y. International Comparison Research Group of Informatization Level of the National Bureau of Statistics Research Institute, International Comparison of the Network Readiness Index (NRI) of the World Economic Forum-the fifth report in the series of “International Comparison Research of Informatization Level”. China Inf. Soc. 2010, 7, 58–66. [Google Scholar]
  36. Gan, C.; Zheng, R.; Yu, D. The impact of China’s industrial structure change on economic growth and volatility. Econ. Res. 2011, 46, 4–16+31. [Google Scholar]
  37. Li, X.; Wang, C. Does the distortion of factor market inhibit the improvement of innovation efficiency—Empirical analysis based on China’s inter-provincial dynamic panel data. J. Yunnan Univ. Financ. Econ. 2019, 35, 24–36. [Google Scholar]
  38. Li, Y.; Yang, X.; Ran, Q.; Wu, H.; Irfan, M.; Ahmad, M. Energy Structure, Digital Economy, and Carbon Emissions: Evidence from China. Environ. Sci. Pollut. Res. 2021, 28, 64606–64629. [Google Scholar] [CrossRef]
  39. Feng, Z.; Tang, Y.; Yang, Y.; Zhang, D. China’s topographic relief and its correlation with population distribution. J. Geogr. 2007, 10, 1073–1082. [Google Scholar]
  40. Ji, Y.; Yang, Q. Can the opening of high-speed railway promote enterprise innovation: Research based on quasi-natural experiment. World Econ. 2020, 43, 147–166. [Google Scholar]
  41. Xie, Y. The effect and mechanism of digital economy on regional carbon emission intensity Contemporary. Econ. Manag. 2022, 44, 68–78. [Google Scholar]
Figure 1. Energy intensity of China’s provinces in 2011, 2016 and 2019.
Sustainability 15 05927 g001
Figure 2. Development level of digital economy in China’s provinces in 2011, 2016 and 2019.
Sustainability 15 05927 g002
Table 1. Evaluation index and weight of digital economy development levels.
First-Order Index WeighSecondary Index WeightThird-Level Index WeightIndicator TypeThird-Level Index WeightSecondary Index WeightFirst-Order Index Weigh
InfrastructureTerminal facilitiesLength of optical cable line per square kilometerForward0.05110.0990.2312
Number of Internet broadband access portsForward0.0484
network resourceNumber of domain namesForward0.05890.1317
Number of websites ownedForward0.0728
Industrial developmentIndustrial scaleProportion of operating revenue of computer, communication and other electronic equipment manufacturing industry in GDPForward0.03220.14610.2550
Proportion of total telecom business in GDPForward0.0588
Proportion of software business income in GDPForward0.0551
Industrial inputFull-time equivalent of R&D personnel in industrial enterprises above designated sizeForward0.06520.1089
Proportion of R&D expenditure in GDPForward0.0437
Convergence applicationPersonal applicationInternet broadband access usersForward0.05230.12940.2664
Mobile phone penetrationForward0.0291
E-commerce sales per capitaForward0.0480
Enterprise applicationEvery 100 people in industrial enterprises use computersForward0.04130.1370
Number of websites owned by every 100 enterprisesForward0.0119
Proportion of enterprises with e-commerce activitiesForward0.0398
Proportion of e-commerce transaction volume to GDPForward0.0440
Development environmentPolicy environmentProportion of fixed asset investment in information technology industry in the total social fixed asset investmentForward0.02880.19810.2474
Proportion of education expenditure in financial expenditureForward0.0343
Proportion of science and technology expenditure in financial expenditureForward0.1350
Talent environmentProportion of employed persons in urban units in information transmission, software and information technology servicesForward0.02330.0493
Average number of college students per 100,000 populationForward0.0260
Table 2. Descriptive statistics of main variables after standard.
VariablesMeaning of VariablesNumber of ObservationsMean Standard DeviationMinimum Maximum
E/Yenergy intensity 270−0.3910.671−2.8420.893
EDDevelopment level of digital economy2700.7510.2730.2791.464
DISFactor market distortion index270−3.1520.338−4.276−1.499
IUIndustrial structure upgrading2700.1670.380−0.6401.643
TItechnological innovation27010.6391.4066.59613.602
CZHLUrbanization rate2704.0330.2013.5544.495
RKMDPopulation density2705.4591.2822.0648.251
CZZCFinancial expenditure level2703.1950.3892.4854.328
JRFZFinancial development2704.8620.4022.8475.550
OPENForeign trade intensity2702.7770.9370.2354.992
FDIFDI intensity2700.4551.398−4.53810.435
Table 3. Basic regression results of digital economy development to energy intensity.
(1)(2)(3)
OLSREFE
DE−1.547 *** (0.128)−1.158 *** (0.146)−1.103 *** (0.144)
CZHL−0.201 (0.161)0.107 ** (0.161)0.046 ** (0.161)
RKMD−0.169 *** (0.028)−0.083 (0.055)1.330 *** (0.295)
CZZC−0.450 *** (0.104)−0.345 *** (0.068)−0.321 *** (0.066)
JRFZ0.785 *** (0.069)0.004 (0.032)0.010 (0.030)
OPEN−0.076 ** (0.030)0.023 (0.017)0.030 * (0.016)
FDI0.041 ** (0.017)−0.004 (0.005)−0.007 (0.005)
Constant term0.318 (0.571)−0.022 (0.689)−5.604 *** (1.648)
Individual effect--yes
Time effect -Yesyes
Sample size270270270
Adjusted R20.7590.6240.884
Note: The figures in brackets are standard errors; *, **, *** They are significant at the levels of 10%, 5% and 1%, respectively.
Table 4. Basic regression results of regional digital economies’ development of energy intensity.
(1)(2)(3)(4)(5)
Eastern regionCentral regionWestern regionResource-based provincesNon-resource provinces
DE−1.979 *** (0.379)−0.459 *** (0.146)−0.578 * (0.291)−1.015 ** (0.481)−0.889 *** (0.130)
Constant term−6.958 *** (1.453)−8.986 (8.208)−16.042 *** (3.791)−11.725 *** (3.159)−7.288 *** (1.759)
control variable yesyesyesyesyes
Individual effectyesyesyesyesyes
Time effect yesyesyesyesyes
Sample size99729981189
Adjusted R20.9680.9310.9060.8820.933
Note: The figures in brackets are standard errors; *, **, *** They are significant at the levels of 10%, 5% and 1%, respectively.
Table 5. Regression results of the intermediary role of factor market distortion in the energy intensity of regions affected by the development of digital economy.
Variable(1)(2)(3)(4)(5)(6)(7)(8)(9)(10)(11)(12)
Full SampleEastCentral SectionWestResource-Based ProvincesNon-Resource Provinces
DISEDDISEDDISEDDISEDDISEDDISED
DIS 0.183 *** 0.120 0.214 ** 0.106 −0.127 −0.125 **
(0.046) (0.098) (0.097) (0.069) (0.078) (0.061)
DE−0.393 **−1.052 ***−0.404 ***−0.411 **−0.551 **−2.096 ***0.398−0.536 **−0.576 **−1.104 **−0.210 *−0.907 ***
(0.170)(0.140)(0.175)(0.151)(0.533)(0.369)(0.495)(0.290)(0.248)(0.268)(0.110)(0.129)
Constant term13.732 ***−7.082 ***4.559 **−7.502 ***22.533 *−4.1719.124−15.083 ***1.629−8.951 ***−2.773 ***1.224 **
(3.523)(1.652)(1.736)(1.515)(11.536)(8.212)(6.444)(3.807)(1.061)(1.124)(0.517)(0.565)
Sobel test0.091 **0.526 ***0.031 **0.0280.0950.124 **
(0.049)(0.149)(0.054)(0.039)(0.081)(0.066)
Control variable yesyesyesyesyesyesyesyesyesyesyesyes
Individual effectyesyesyesyesyesyesyesyesyesyesyesyes
Time effect yesyesyesyesyesyesyesyesyesyesyesyes
Sample size2702709999727299998181189189
Adjusted R20.6060.8910.9740.9690.8790.9360.8380.9100.8600.8870.9000.934
Note: The figures in brackets are standard errors; *, **, *** They are significant at the levels of 10%, 5% and 1%, respectively.
Table 6. Regression results of the intermediary role of industrial structure upgrading in the energy intensity of regions affected by the development of digital economy.
Variable(1)(2)(3)(4)(5)(6)(7)(8)(9)(10)(11)(12)
Full SampleEastCentral SectionWestResource-Based ProvincesNon-Resource Provinces
IUEDIUEDIUEDIUEDIUEDIUED
IU −0.124 *** −0.205 *** −0.098 * −0.160 −0.355 −0.810
(0.045) (0.064) (0.057) (0.141) (0.062) (0.065)
DE0.913 ***−1.090 ***0.938 ***−0.508 ***0.365−1.924 ***0.560 ***−0.667 **0.827 **−0.479 *1.025 ***−1.307 ***
(0.120)(0.142)(0.103)(0.139)(0.955)(0.280)(0.240)(0.301)(0.464)(0.093)(0.242)(0.093)
Constant term−3.035−8.331 ***−2.506−7.179 ***−9.8064.917−6.317 **−15.030 ***−2.028−7.126 ***−6.380 ***−4.541 **
(2.484)(1.663)(2.406)(1.371)(20.665)(7.502)(3.131)(3.888)(4.893)(2.461)(2.272)(1.912)
Sobel test−0.158 **−0.035 **−0.250 *−0.192 **−0.052−0.256 ***
(0.068)0.1470.1320.1110.1150.084
Control variableyesyesyesyesyesyesyesyesyesyesyesyes
Individual effectyesyesyesyesyesyesyesyesyesyesyesyes
Time effectyesyesyesyesyesyesyesyesyesyesyesyes
Sample size2702709999727299998181189189
Adjusted R20.7150.8880.8970.9720.6830.9060.9030.9090.5720.8640.8620.913
Note: The figures in brackets are standard errors; *, **, *** They are significant at the levels of 10%, 5% and 1%, respectively.
Table 7. Regression results of the intermediary role of technological innovation in the energy intensity of regions affected by the development of digital economy.
Variable(1)(2)(3)(4)(5)(6)(7)(8)(9)(10)(11)(12)
Full SampleEastern RegionCENTRAL REGIONWestern RegionResource-Based ProvincesNon-Resource Provinces
TIEDTIEDTIEDTIEDTIEDTIED
TI −0.082 *** −0.035 ** −0.118 *** −0.131 *** −0.099 ** −0.0133
(0.023) (0.033) (0.043) (0.039) (0.053) (0.027)
DE1.367 ***−1.318 ***1.357 ***−1.265 ***0.278−2.129 ***1.387 *−0.396 ***3.698 ***−0.3501.160 ***−0.889 ***
(0.230)(0.086)(0.253)(0.086)(1.174)(03610)(0.812)(0.278)(1.170)(0.511)(0.396)(0.135)
Constant term−3.222 ***−5.888 ***−1.410 ***−3.829 ***5.866−9.6787.435−1.326 ***−1.058 ***−1.621 ***−2.799 ***−7.284 ***
(2.752)(1.831)(1.899)(2.196)(25.409)(7.725)(1.577)(1.619)(1.680)(1.095)(1.335)(1.925)
Sobel test−0.360 ***−0.149 **−0.030 **−0.896 ***−0.772 **−0.248 ***
(0.123)(0.263)(0.294)(0.263)(0.419)(0.139)
Control variable yesyesyesyesyesyesyesyesyesyesyesyes
Individual effectyesyesyesyesyesyesyesyesyesyesyesyes
Time effect yesyesyesyesyesyesyesyesyesyesyesyes
Sample size2702709999727299998181189189
Adjusted R20.8440.8700.8900.9380.8730.9390.9140.9200.9230.8640.8970.933
Note: The figures in brackets are standard errors; *, **, *** They are significant at the levels of 10%, 5% and 1%, respectively.
Table 8. Robustness test.
(1)(2)(3)(4)(5)
Staged regressionReplace interpreted variableReplace core explanatory variableInstrumental variable method
EDEDC_pEDED
DE−1.088 ***−0.574 ***−0.173 ***
(0.154)(0.140)(0.042)
DE2 −0.198 ***
(0.039)
DE3 −1.440 ***
(0.156)
Constant term−3.530 **6.787 **−7.1336.79−15.098
(2.891)(3.343)(1.930)(1.786)(3.181)
Control variable yesyesyesyesyes
Individual effectyesyesyesyesyes
Time effect yesyesyesyesyes
Sample size150120270270270
Adjusted R20.7070.8380.2480.869-
Note: The figures in brackets are standard errors; **, *** They are significant at the levels of 5% and 1%, respectively.
Disclaimer/Publisher’s Note: The statements, opinions and data contained in all publications are solely those of the individual author(s) and contributor(s) and not of MDPI and/or the editor(s). MDPI and/or the editor(s) disclaim responsibility for any injury to people or property resulting from any ideas, methods, instructions or products referred to in the content.

