

FinTech and Green Credit Development—Evidence from China
1
School of Finance, Guangdong University of Foreign Studies, 178 Waihuan East Road, Guangzhou 510006, China
2
Institute of Financial Openness and Asset Management, Guangdong University of Foreign Studies, 178 Waihuan East Road, Guangzhou 510006, China
3
Southern China Institute of Fortune Management Research, Guangdong University of Foreign Studies, 178 Waihuan East Road, Guangzhou 510006, China
*
Author to whom correspondence should be addressed.
Sustainability 2023, 15(7), 5903; https://doi.org/10.3390/su15075903
Submission received: 25 February 2023
/
Revised: 17 March 2023
/
Accepted: 26 March 2023
/
Published: 28 March 2023
(This article belongs to the Special Issue Accounting, Corporate Policies and Sustainability)
Abstract
:The existing literature on FinTech and green finance has primarily focused on exploring sustainable economic and environmental benefits. However, empirical research examining the effect of FinTech on green finance remains underexplored. In light of the advantageous position of green credit in the development of green finance in China, this study analyzes the impact of FinTech on green credit development using polluting listed firms in 2012–2021. The results show that FinTech significantly improves the development of green credit, affecting it through two crucial mechanisms: information asymmetry and green credit allocation efficiency. Additionally, heterogeneity analysis reveals that FinTech has a more significant impact on regions with higher government environmental objectives, small-to-medium enterprises with low carbon emissions, and firms with high external ESG (Environment, Social, and Governance) scores. Overall, our findings indicate that financial institutions should be committed to leveraging FinTech for the pre-loan investigation of green credit, and policymakers should encourage the development of FinTech in order to perfect environmental information disclosure policies to establish environmental information-sharing platforms.
1. Introduction
Financial support from the banking sector plays an essential role in the sustainable development of China’s green economy [1]. In the process of transforming China’s economic structure, economic growth in pursuit of short-term gains has caused significant environmental pollution, which has hindered future economic development. Ecological civilization and environment-friendly development have become principles of high-quality economic development [2]. Therefore, the government could determine how to rationally allocate funds to enterprises in need while maintaining a sustainable green economy. In 2007, with the announcement of the “Opinions on Implementing Environmental Protection Policies and Regulations to Prevent Credit Risks” in China, the government first proposed the concept of “green credit” with the aim of directing green funds to environmentally friendly enterprises. Green credit, as an important part of sustainable financing or environmental financing in China, mainly refers to loans issued by financial institutions to enterprises for investment in green environmental protection, clean energy, circular economy, infrastructure and green upgrading, and services of traditional industries. The main purpose of green credit is to restrict the provision of financing to enterprises with high energy consumption and pollution that do not meet environmental protection standards. Green credit volumes among the major banks in China achieved RMB 9.66 trillion in 2018, according to the China Green Finance Development Report released by the People’s Bank of China in 2018. The onset of green credit started later in China than that in other Western countries. Due to the high requirements for the environmental governance and credit repayments of companies, green credit has a strong screening function. Consequently, green credit has a strong crowding-out effect on high-emission and high-pollution enterprises that cannot meet environmental standards [3].
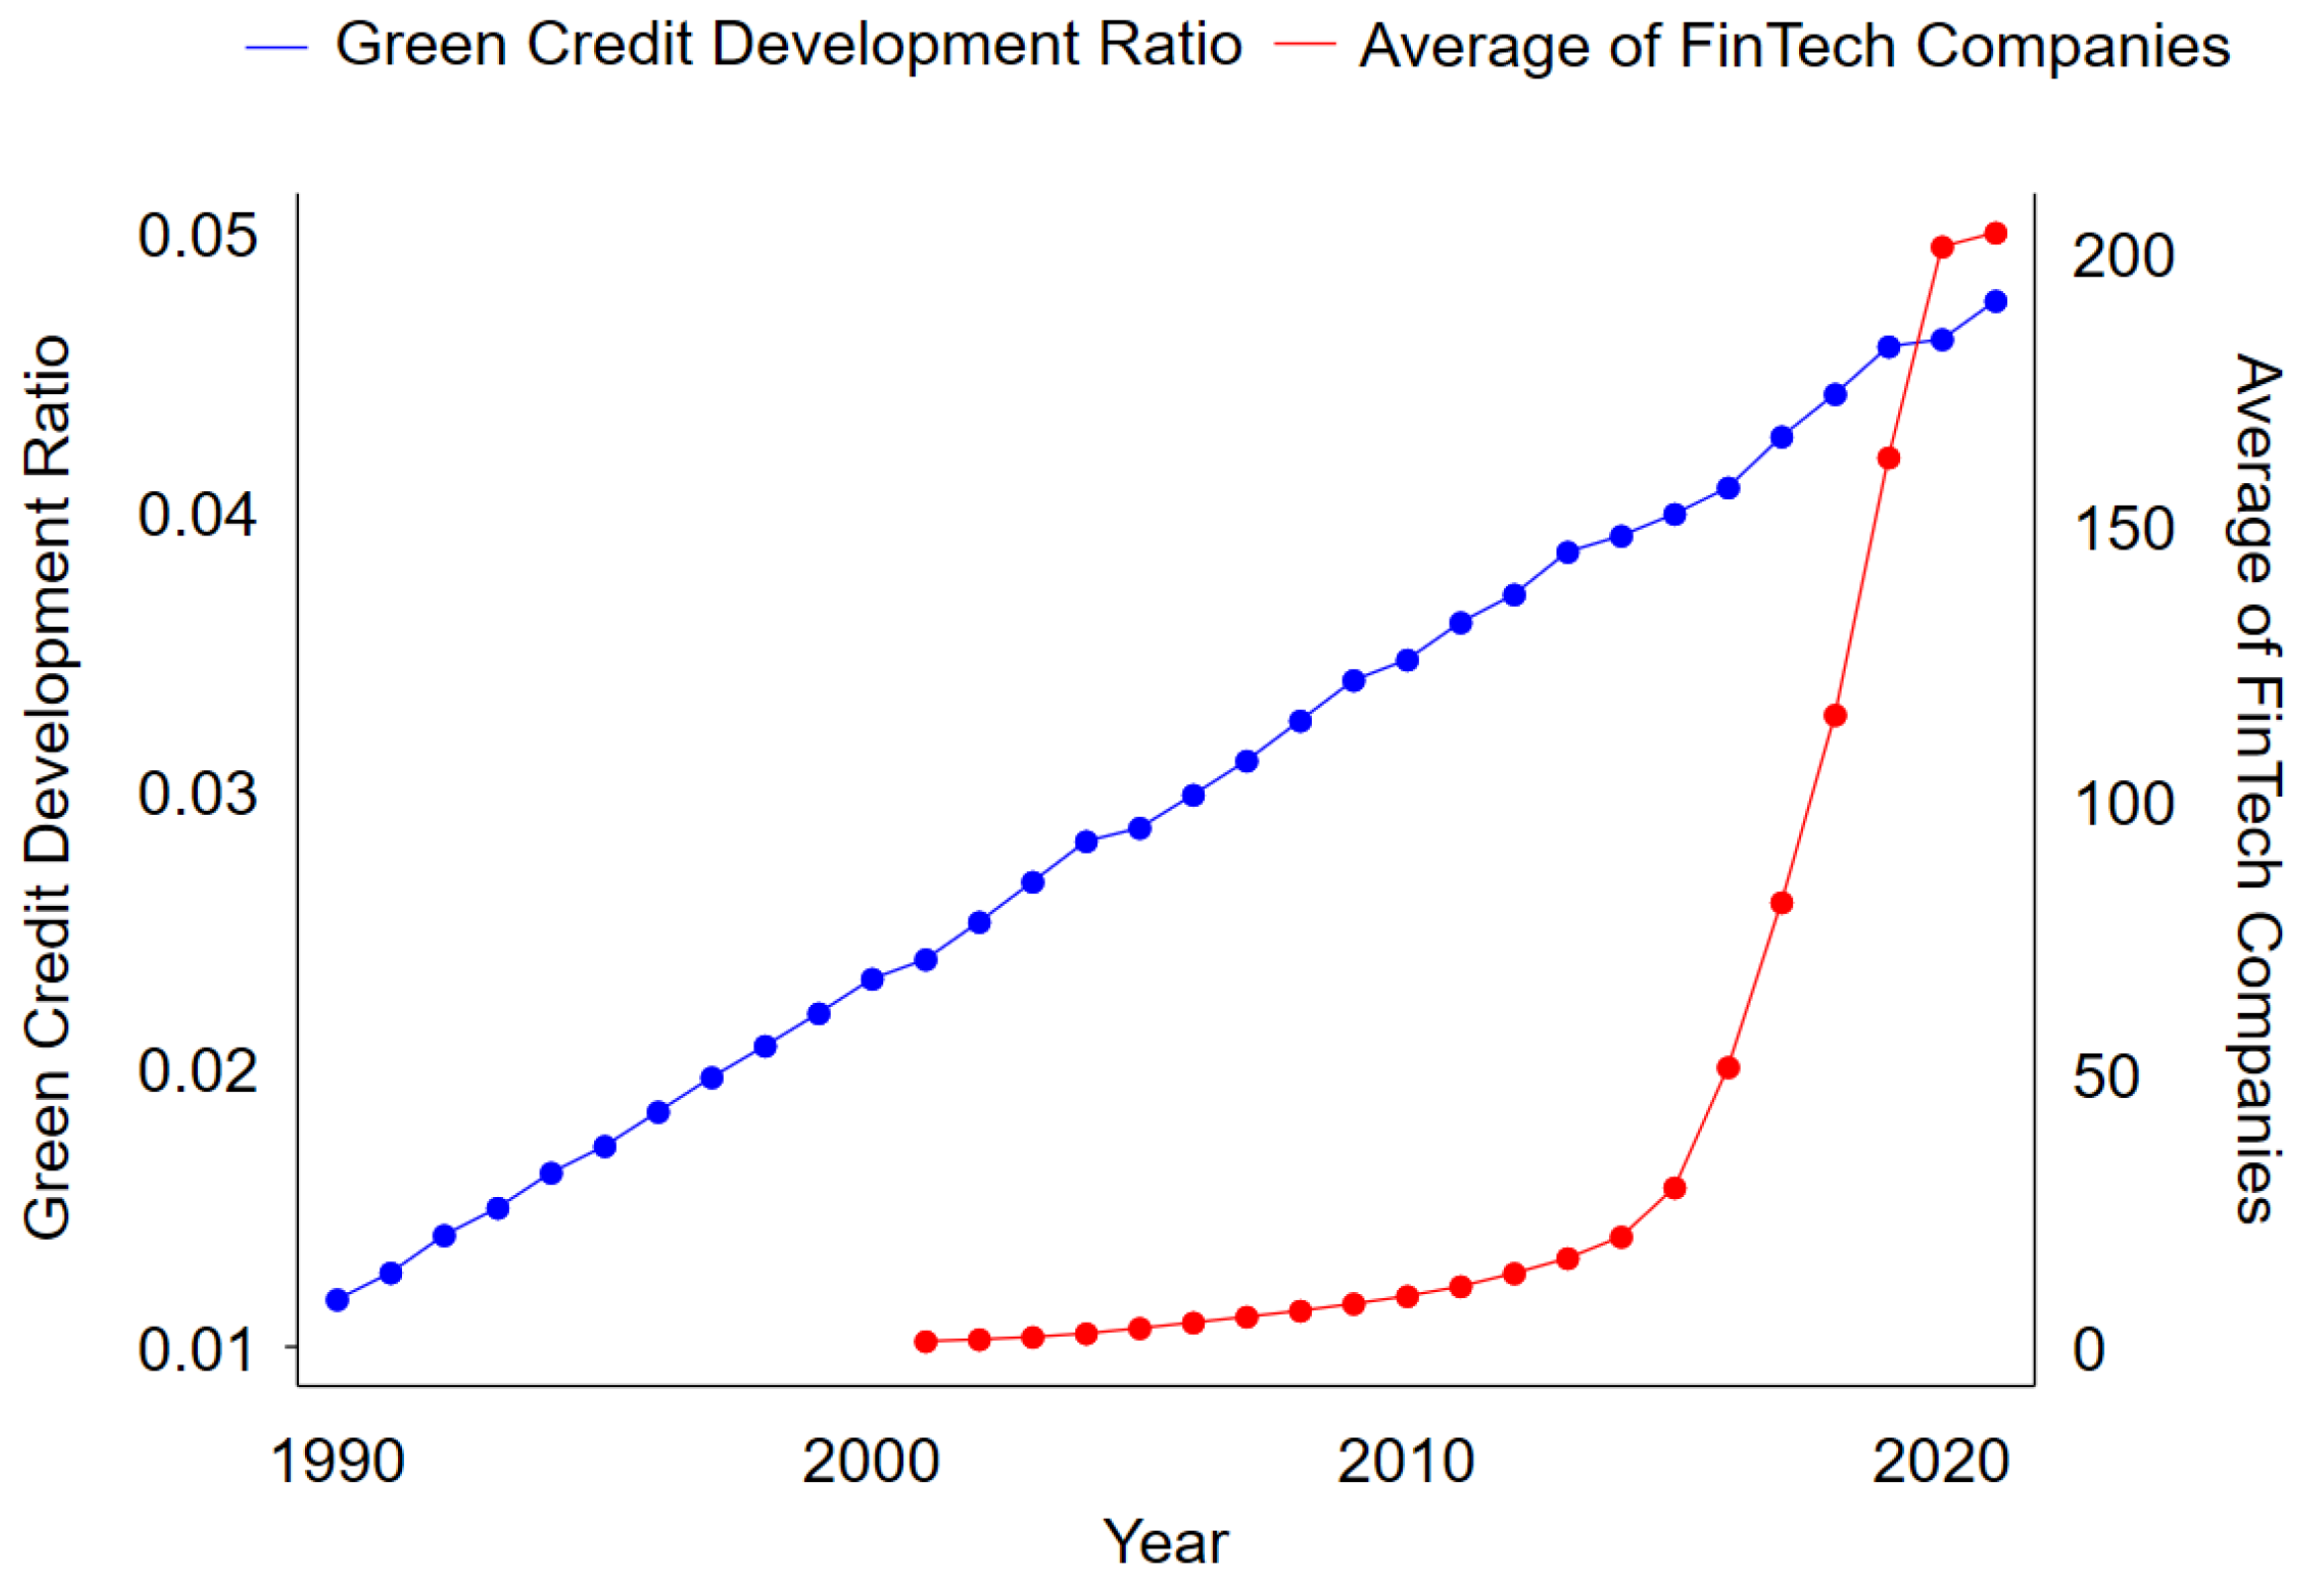
Green finance requires the data processing technology and decision-making capabilities of FinTech for its development [4]. Additionally, we measure China’s green credit development ratio since 1990 and compare it with the average of FinTech companies at the city level in China since 2000, as shown in Figure 1. The green credit development ratio refers to the ratio of the average credit required for environmental protection projects to the average of total credit. This indicates that the development of FinTech and green credit have maintained an upward trend over the last two decades in China. Therefore, we believe that FinTech and green credit are at a favorable stage of development in China. FinTech includes artificial intelligence, blockchain technology, cloud computing, and data technology, which can be abbreviated as the “ABCD” technologies [5,6]. The banking sector, which has developed FinTech, accelerates the efficiency of pre-loan examinations with an increase in the amount of data and technology. FinTech, which causes information and technology monopolies, has an antagonistic relationship in its utilization. On the one hand, it brings a shock to traditional commercial banks, causing them to lose substantial borrowers and reducing profits from the lending business, called the “competitive effect” [7]. On the other hand, FinTech can perform a “technology spillover effect”, using information technology to create new opportunities for traditional banks and alleviate information asymmetry and low efficiency of loan allocation [8]. However, in China’s financial system, not all FinTech players can obtain a loan license from a strict regulatory body. Thus, the “competitive effect” has little influence on the traditional financial sector. Instead of “competitive effect”, under the “technology spillover effect” FinTech uses its more advanced technology and greater amount of data to empower traditional financial institutions. FinTech can help to reduce information asymmetry and improve credit allocation efficiency. Considering that green credit requires more pre-loan investigation and more diverse data than traditional corporate credit, green credit disrupts the banking sector by information asymmetry [9]. Not all high-emission and high-pollution companies voluntarily disclose their environmental data.
FinTech can make it easier for lenders to allocate capital to qualified companies and to gradually abandon previously burdensome due diligence. However, it can be confusing whether green credit, a more stringent credit to polluting companies, can be affected by FinTech development. Previous research on the impact of FinTech on sustainable development or the green economy as mainly focused on green growth, sustainability, climate change impact, and energy efficiency [10,11,12,13,14,15], as well as the practical application of FinTech to green finance. However, only a few studies have examined the specific impact of FinTech on green lending and its channels at the micro-level. Therefore, this study focuses on research when discussing the impact of FinTech on green credit. It aims to address the following research questions: How and to what extent will FinTech affect green credit development? What factors can influence FinTech’s impact on green credit development? What features of regional governments can make FinTech more powerful in helping develop green credit? Which types of polluting enterprises can benefit more from FinTech when it is applied to green loans?
This paper extend the existing research on the development of FinTech and green credit and makes the following contributions. First, the previous literature has mainly focused on how FinTech or green credit affects sustainable economic or environmental benefits, while ignoring the impact of FinTech on green credit [4,10,11,16]. We investigate the impact of FinTech on green credit and further explore its impact on short-term and long-term green credit. This paper finds that FinTech can positively enhance the development of green credit, especially long-term green credit. Second, we complement the existing research on the impact of FinTech on green credit by examining two relevant mechanisms: information asymmetry and green credit allocation efficiency. We confirm the significant positive effect of reducing information asymmetry on green credit development and ensuring that green credit development can benefit from increasing green credit allocation efficiency. Third, considering that the pre-loan investigation and requirements for enterprises are different between corporate credit and green credit, previous methods used to measure the efficiency of credit allocation are not accurate. We construct an innovative index to measure the efficiency of green credit allocation and use it for mechanism analysis. Fourth, this paper considers the heterogeneous effects of FinTech on different regional environmental targets, firm-level carbon emissions, and ESG scores. Finally, this paper demonstrates that FinTech can better promote green credit in areas with high environmental goals, among SMEs with low carbon emissions, and among firms with high ESG scores.
The remainder of this paper is structured as follows. Section 2 describes the related literature and research hypotheses on how FinTech affects green credit. Section 3 presents the econometric model and data source. Section 4 presents and discusses the empirical results. Finally, Section 5 provides conclusions and implications.
2. Literature Review and Hypotheses
In this section, we introduce related literature and set out four hypotheses related to baseline regression and mechanism analysis to target this research.
2.1. The Impact of FinTech on Green Credit
The emerging literature on FinTech and green credit can be broadly summarized into three main strands: FinTech, green credit, and both FinTech and green credit together.
2.1.1. FinTech
Based on the rapid development of information and communication technology (ICT), FinTech plays a crucial role as a link between finance and technology. It can make an effort in financial activities, as it can support financial institutions, investors, and government efficiency as a promoter. In particular, FinTech can improve the competitiveness and performance of the banking industry [17]. When considering the promotion of sustainable economics enhanced by FinTech, FinTech can support sustainable finance by reducing transaction costs between lenders and borrowers, increasing green capital efficiency, reducing information asymmetries and bank credit risk [11], improving green innovation, and completing green information sharing systems [18]. However, FinTech requires regulations to limit its impact on the financial market [19], especially in developing countries, as many FinTech innovations are still unregulated, such as crowdfunding and peer-to-peer (P2P). Though governments in developing countries are creating an environment conducive to FinTech innovation, it is necessary to ensure sufficient regulation and supervision of these innovations [19,20].
2.1.2. Green Credit
In the previous literature, green credit has been introduced in two aspects, namely, qualitative and quantitative research. In qualitative research, Alexander (2015) and Campiglio (2016) used qualitative methods to explain the advantages of green credit, including the importance of banks in green credit and environmental risk [21,22]. In quantitative research, Li et al. (2022), Caragnano et al. (2020), and Zhang et al. (2021) suggested that green credit can improve sustainable economic growth by upgrading the industry and alleviating environmental pollution by allocating financial resources [23,24,25]. Thus, green credit can bring environmental improvement to society by directly leading funding and affecting an enterprise’s financial performance and financing costs [26,27]. Considering this paper’s focus on the impact of FinTech on companies, our summary of the literature indicates that enterprises may respond differently to green credit. Green credit functions as a financing penalty for polluting enterprises [28]. This may cause constraints on the production of polluting enterprises, as green credit to polluting enterprises may inhibit their investment activities. Small and Medium Enterprises (SMEs) are the main beneficiaries of the green economy, as they tend to in difficulty when they need investment [29]; however, green credit imposes constraints on large enterprises [25].
2.1.3. FinTech and Green Credit
There is limited literature on the relationship between FinTech and green credit. However, the existing research has already stated a number of conclusions in examining the influence of FinTech development on corporate credit, which can be suitable for providing insight into the case of green credit. The literature in this field, which links FinTech and credit, can be summarized as the technological progress aspect and the data collection aspect. From the perspective of technological progress, Fuster et al. (2019) stated that automated credit machines enabled by FinTech can make banks more efficient in pre-loan investigations and achieve flexible changes in borrower requirements [7]. From the perspective of data collection, FinTech can help financial institutions collect business information in pre-loan investigations. For example, digital footprints improve lenders’ understanding of business data, thereby speeding up loan approval [30,31,32]. FinTech can help lenders set new interest rates based on a large amount of information, which helps lenders find qualified lenders and compete with traditional financial institutions. Hauswald and Marquez (2003) and He et al. (2020) built a credit market model related to data. He et al. (2020) stated that FinTech has a technological advantage over traditional banks in the credit market [33,34].
Based on the existing literature, we believe that promoting FinTech will enhance green credit development. Therefore, the following baseline regression hypothesis is developed:
H1.
FinTech can have a positive impact on the development of green credit.
2.2. Information Asymmetry Mechanism
As information asymmetry is problematic for improving green credit, we set up three mechanisms to study its impact on FinTech for green credit. We hypothesize that FinTech affects green credit through environmental information disclosure, and media and investor attention.
FinTech can promote the identification of green projects and decrease information asymmetry. The Equator Principles (EPs) should be introduced because they are intended to serve as a common baseline for risk management for financial institutions to identify, assess, and manage environmental and social risks. However, in reality, the implementation of EPs will encounter some predicaments, and strictly following the investigation rules will lead to the loss of profitable opportunities [11,12]. The due diligence process for environmentally friendly projects is costly and time consuming [35,36]. As a result, capital seeking high profit leads to financial institutions lacking patience and being unwilling to provide loans for these projects. Banks face information asymmetry problems with regard to green projects, and require FinTech when they intend to sign loan contracts with polluting enterprises [37,38].
Sustainability reporting, such as climate-related reporting and GHG emissions reporting, are crucial for government decision-making and corporate governance; here, we mainly discuss the impact of such reporting requirements on companies [39,40,41]. Environmental information disclosure (EID) is crucial for a company in need of a loan, as competitive advantages gained through a strong positive reputation can manifest themselves in the form of enhanced qualifications [42]. Additionally, Dhaliwal et al. (2014) found that CSR (Corporate social responsibility) disclosure can decrease the cost of equity capital in the banking industry [43]. Therefore, because EID promotes the utility of both lenders and borrowers, EID plays a key role in determining eligibility for green credit. EID can be realized either through “certification” by third parties which evaluate companies’ products, production processes, and management procedures [44], or through “self-reporting” without external verification [45]. Beginning in 2001, China’s polluting listed companies have been required to disclose environmental risks in their initial public offerings (IPOs). In 2010, the “Guidelines for Environmental Information Disclosure of Listed Companies” stipulated that companies should disclose environmental information in a timely manner. We believe that increasing EID can help the issuance of green credit, as it will cost financial institutions less to dig out environmental data.
With the aim of improving green credit, increasing EID will be beneficial to FinTech efficiency and promotion. Therefore, the following hypothesis was developed:
H2A.
FinTech can improve green credit development through environmental information disclosure.
Information from financial news and financial social media is the main resource used by FinTech companies to predict the eligibility of enterprises to obtain green credit. As a third party that acts as a sensor, media can provide high-quality information and various information resources [46]. Media helps enterprise-specific and commercial information to spread rapidly [47]. Both the ability to obtain market information and its quality determines the decision-making efficiency of market participants [48]. In addition to media focus, investor focus can affect market participants’ decisions [49]. Considering the complementary effect of media focus and investor focus to help FinTech influence financial institutions to provide green loans to qualified enterprises, we propose Hypothesis 2B:
H2B.
FinTech can improve green credit development through media and investor focus.
2.3. Green Credit Allocation Efficiency Mechanism
In addition to the information asymmetry mechanism, the impact of FinTech’s green credit allocation efficiency mechanism on green credit development deserves consideration. Despite the abundance of research on credit allocation efficiency in the banking industry, the potential role of FinTech in influencing the development of green credit has received little attention. The previous literature has mainly applied non-parametric Data Envelopment Analysis (DEA) to measure credit allocation efficiency, with a few studies applying parametric Stochastic Frontier Analysis (SFA) [50,51,52,53,54]; based on loan data, the non-performing loan ratio and loan-to-deposit ratio have been applied to measure the credit allocation efficiency [55,56]. The DEA and SFA methods are used to estimate production or cost functions in economics, using input and output indicators to measure the weights of indicators and thereby analyze whether the weights meet optimal efficiency. The prior literature has typically used banks’ staffing inputs and pre-credit profits to measure the overall credit efficiency of banks. However, the specific ratio of green credit to individual banks is not fully disclosed in China, which makes it difficult for DEA and SFA methods to accurately measure the efficiency of green credit allocation. Therefore, we use the ratio of economic growth to green credit growth for our measure of green credit allocation efficiency.
The impact of FinTech on credit allocation efficiency has been debated in the past. On the one hand, it has been argued that FinTech has inefficient capital allocation efficiency because it causes competition in the credit market and is caught in an equity efficiency dilemma [54]. On the other hand, it has been argued that FinTech can improve lending cost efficiency and technology, making commercial banks more efficient, thereby reducing bank operating costs, increasing service efficiency, and improving traditional business [57,58]. We believe that promoting FinTech can enhance green credit development by increasing green credit allocation efficiency. Based on the literature, we formulate a hypothesis and test it using the following empirical analysis:
H3.
FinTech can enhance green credit development by increasing green credit allocation efficiency.
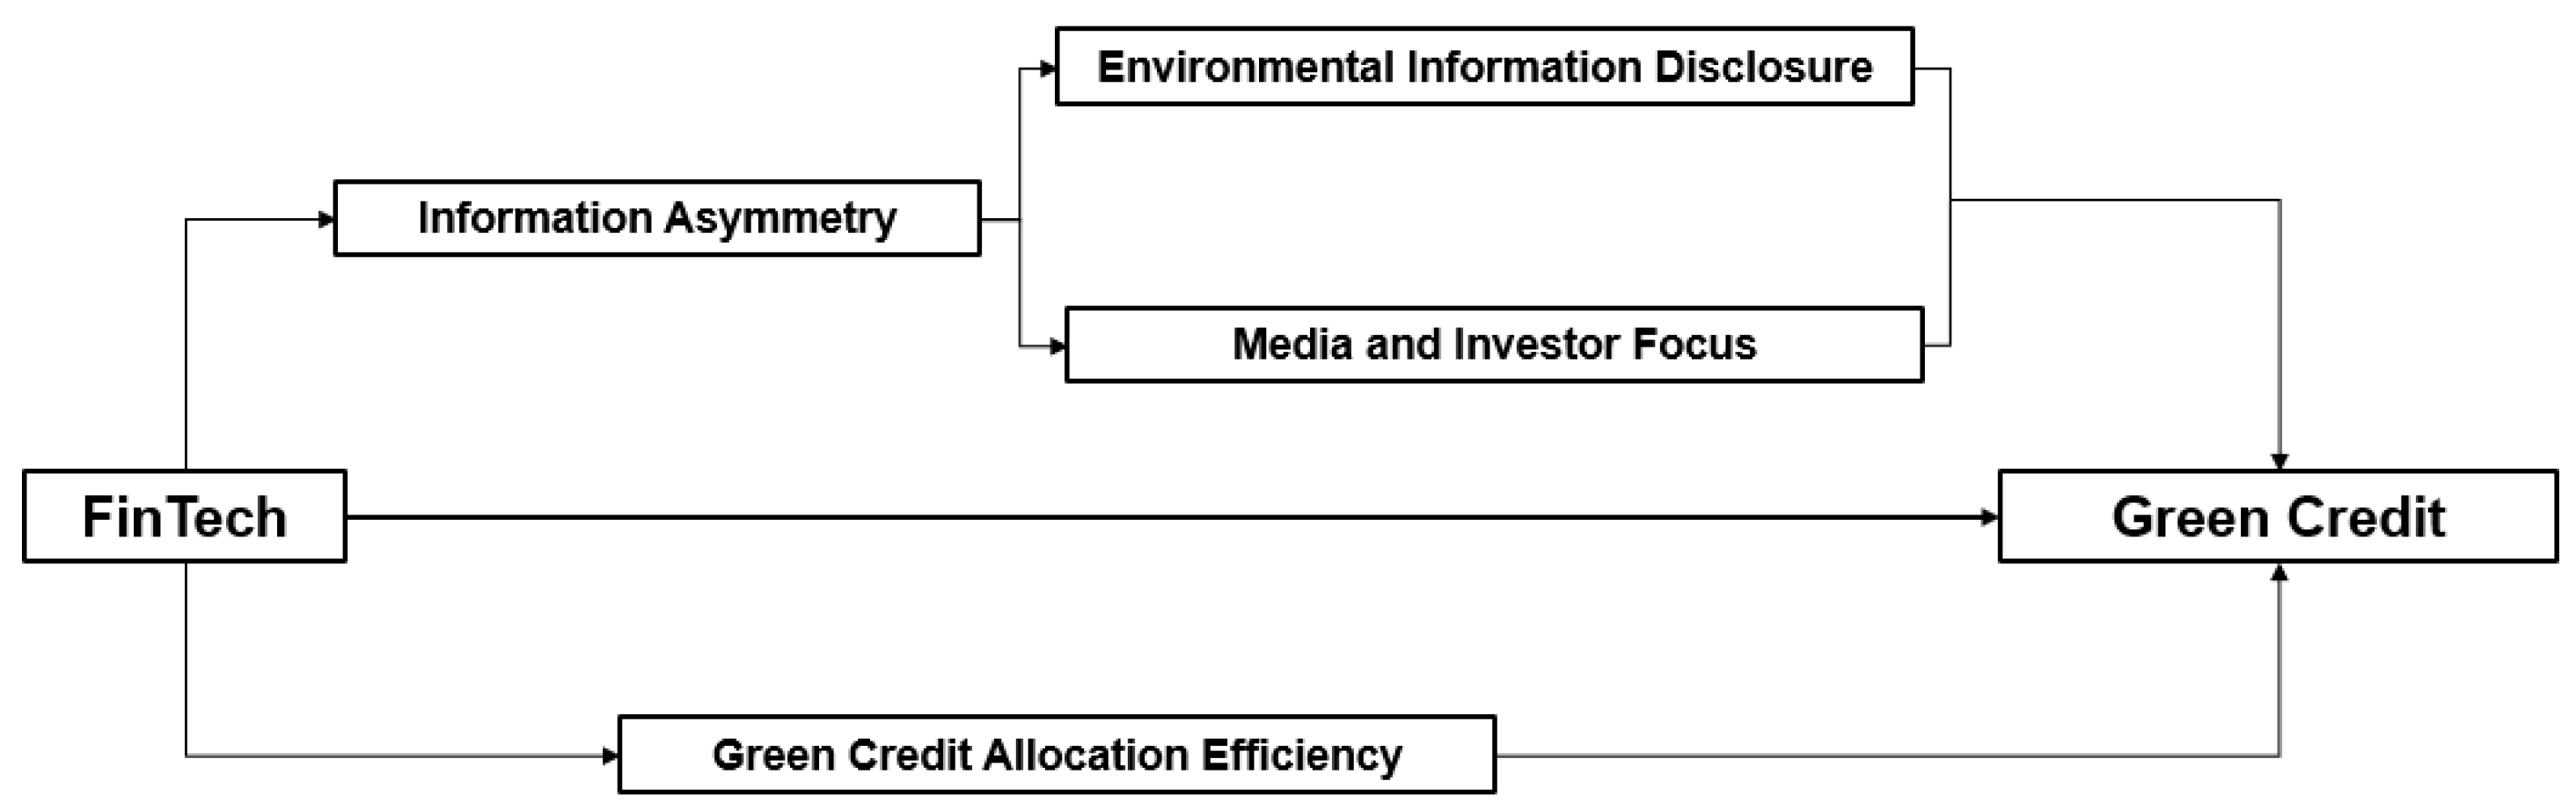
The mechanism hypotheses above are introduced into mechanism design; the framework is shown as Figure 2.
3. Research Methods
This section describes the data sources and empirical design of the study of the impact of FinTech on the development of green credit.
3.1. Variables and Data Sources
We set green credit and FinTech as explained and explanatory variables, respectively, and constructed important control and moderator variables prior to empirical analysis.
3.1.1. Explained Variable: Green Credit
We set the explained variable as the green credit level of polluting enterprises. First, we selected quarterly data of polluting and listed enterprises in China from 2012 to 2021. We referred to and improved the measurement method of Zhang et al. (2021) [25]. According to the Guidelines for Information Disclosure Protection of Listed Companies issued by the Ministry of Environmental Protection in China, certain specific industries are selected as polluting enterprises (mining, textile, paper products, petroleum, chemicals and chemical fibers, ferrous(non-ferrous) metal smelting and processing, rubber and plastics, pharmaceuticals, and fur products). Second, the level of green credit development was measured by dividing the enterprise’s credit by the ratio of regional credit for environmental protection projects to the total regional credit. The level of green credit development in our study is determined by the level of green development at the regional level combined with the level of credit at the enterprise level. The higher the value, the better the credit development of the enterprise.
3.1.2. Explanatory Variable: FinTech
There are many types of FinTech companies in the world, and they play different roles. In China, due to strict lending licenses, FinTech companies mainly play the role of helping lenders in the financial market with information gathering, screening, and decision-making; as mentioned in the introduction, they play a crucial role with respect to financial institutions due to the “technology spillover effect” [8]. Referring to Xie and Zhu (2021) [54], we set city-level FinTech development as the explanatory variable. Referring to the Financial Stability Board’s definition, we screened FinTech business information from TianYanCha Website. The criteria for screening information were taken from Shen and Guo (2015) [59]. The core explanatory variable FinTech was set as follows. First, we matched the industrial and commercial registration information of all FinTech-related enterprises. Second, we prevented the emergence of shell companies and eliminated the samples of those enterprises that had been in operation for less than one year as well as of those that had been dissolved or revoked. Third, we used regular expressions in the business scope. We first matched the business scope related to “finance”, “insurance”, “credit”, and “payment”, then removed irrelevant samples and companies with prohibited phrase prefixes in the keywords. Finally, we obtained FinTech development at the city level and used the natural logarithm of FinTech, as follows: the greater the number of FinTech firms, the higher the level of local FinTech development.
3.1.3. Control Variables
Referring to the previous literature and the measurement of green finance development level [60,61,62,63] and considering ownership structure, political connections, and board diversity in China [64,65], we obtained relevant control variables as follows. (1) At the enterprise level, we set the natural logarithm of enterprise asset size (Size), return on equity (ROE), return on assets (ROA), asset growth rate (AG_Rate), main business income growth rate (MBIG_Rate), net profit growth rate (NPG_Rate), Tobin’s Q ratio (Tobin’s Q), a dummy variable for whether the firm is a state-owned enterprise or not (for which we referred to Xu et al. (2022) and Xiao and Xi (2022) (Stat_Own) [66,67]), the degree of political connections of the firm’s executives (for which we referred to Fan et al. (2007) and Zhou et al. (2021) (PCLevel) [68,69]), and the ratio of the firm’s independent directors to the number of board members (referring to Nguyen et al. (2019) (Ind_Ratio) [70]. According to Fan et al. (2007) [68,69], if the president or CEO of the enterprise has served or is currently serving in the Chinese government, the Party Committee, the Standing Committee of the National People’s Congress, or the Chinese People’s Political Consultative Conference, the PCLevel is assigned a value at five levels: PCLevel at section level is 1, PCLevel at division level is 2, PCLevel at department level is 3, PCLevel at ministry level is 4, and with no political connections PCLevel takes the value of 0. If the president or CEO of an enterprise has been or is currently a party representative, NPC deputy, or CPPCC member, the PCLevel is assigned at five levels: PCLevel at the district and county level or below is 1, PCLevel at the municipal level is 2, PCLevel at the provincial level is 3, and PCLevel at the national level is 4, while with no political connection PCLevel takes the value of 0. (2) at the regional level, we set the green finance development level at the provincial level (Green_Fin), GDP growth rate (GDP_Rate), industrial solid waste utilisation rate (Solid_Rate), and centralised wastewater treatment rate (Water_Rate). The construction method of green finance was as follows. First, the entropy method was used for calculation. The comprehensive evaluation system was as follows, including seven factors: (1) for green credit, the ratio of credit for environmental protection projects to the total credit of environmental protection projects in the province and the total credit of the province; (2) for green investment, the ratio of investment in environmental protection to GDP; (3) for green insurance, the ratio of income from environmental pollution liability insurance to total premium income; (4) for green bonds, the ratio of the total amount of green bonds issued to the total amount of all bonds issued; (5) for green support, the ratio of fiscal expenditure on environmental protection to general fiscal expenditure; (6) for green funds, the ratio of the total market value of green funds to the total market value of all funds; (7) for green rights and interests, the ratio of carbon trading, energy use right trading, pollution emission right trading, and the total amount of stock market transactions. After calculation, we standardized the data. The sources of the control variables were the CSMAR database, the National Bureau of Statistics, the People’s Bank of China, the Ministry of Science and Technology, and various official yearbooks. Finally, descriptive statistics of the baseline regression are presented in Table 1.
3.1.4. Moderator Variables
In addition, we introduced a set of moderator variables to investigate the mechanism influencing the impact of FinTech on green credit in order to verify above three assumptions of mechanism analysis.
For the environmental information disclosure channel, and referring to Lu et al. (2023) and Xu et al. (2022) [71,72], we set three variables to measure environmental information disclosure. First, we set a dummy variable with regard to whether polluting enterprises report their environmental information on their annual official environmental reports (Env_Report). Second, we set a variable that represents the sum of the dummy variable from external supervision (Illegal_Info), from whether the company is a key monitoring unit from government, whether there have been sudden major environmental pollution incidents, whether there have been environmental violations, and whether there have been environmental complaints. Third, we set a variable that represents setting of the sum of eight aspects of internal environmental protection concept disclosure, which mainly involve whether the information is disclosed by the environmental protection missions of internal governance (Env_Mission). The internal governance information disclosure consisted of: (1) environmental protection concept; (2) environmental protection goals; (3) environmental protection management goals; (3) environmental protection management system; (4) environmental protection education and training; (5) special environmental protection actions; (6) emergency response mechanism for environmental protection incidents; (7) environmental protection honors or awards; (8) the “three simultaneous” system (measures for pollution prevention and control in construction projects must be designed, constructed, and put into operation at the same time as the main project).
For the media and investor focus channel, we set five moderator variables to measure the media and investor focus. The data accessed on 1 December 2022 were mainly drawn from CNDRS and CSMAR. For polluting enterprises, we used the annual news frequency of financial media (Media), total quantity of posts in Guba (Post), total reading volume of posts in Guba (Read), comment volume of posts in Guba (Comment), and the number of green funds which invested in it (G_invest). We gathered the data of all the polluting enterprises annually and constructed the natural logarithm of these five variables.
For the green credit allocation efficiency mechanism, we set a moderator variable to measure the extent of green credit allocation efficiency. Considering that green credit, as compared to corporate credit, has fairly stringent industry norms for pre-loan investigation, traditional measures of credit allocation efficiency such as the non-performing loan ratio and loan-to-deposit ratio may not be fully appropriate for application to green credit. In particular, the non-performing loan ratio for green credit is not efficient; it cannot be an accurate measure of credit allocation efficiency, as the pre-lending investigation of green credit requires quite high company qualifications and standards. Therefore, we used the the ratio of economic growth rate to green credit growth rate as green credit allocation efficiency, which can reflect the efficiency of banks’ approval of green credit. In addition, in light of the inadequate disclosure of specific information on green credit in China, we first, set the credit growth rate containing all credit at the city level, with t and representing the current and previous periods, respectively:
Second, we measured the green credit growth rate with the regional ratio of credit for environmental protection projects compared to the average of total credit. Due to data disclosure issues, we collected green credit data at the provincial level to measure green credit at the city level approximately, as follows:
Third, per Equation (3), we constructed the ratio of economic growth rate to green credit growth rate as the moderator variable (CA_efficiency). When measuring the contribution of each 1% increase in green credit to economic growth, we found that the larger the economic contribution of each 1% increase in green credit, the more efficient the allocation of green credit.
3.2. Econometric Model
This paper establish an econometric model (4) to conduct our baseline empirical research:
Here, is the explained variable, refers to the FinTech development level lagged by one year, is a series of enterprise-level and regional-level control variables, i refers to the enterprise, c refers to the city, t refers to the time period, refers to error term, refers to the industry fixed effect, refers to the city fixed effect, refers to year fixed effect, and refers to a constant.
In the first step, the baseline regression model is used to assess whether FinTech can improve green credit. In the second step, moderator variables and the interactions between moderator variables and FinTech are added to the benchmark model to assess the mechanism. The specific setting, denoted as model (5), is as follows:
In model (5), is the moderator variable, and includes the night variables mentioned formerly. Hypotheses 2A, 2B, and 3 can be assessed by examining the coefficients and their significant level of interaction term.
4. Results and Discussion
4.1. The Impact of FinTech on Green Credit Development
The impact of FinTech on green credit is shown in Table 2. As local FinTech develops, green credit for polluting companies improves, and the evidence is statistically positive at the 1% significance level. This shows that a 1% increase in FinTech promotes green credit by 1.187%. We divide green credit into short-term and long-term credits. The conclusions remain robust, showing that the improvement of regional FinTech has long-term and short-term effects on polluting enterprises, with higher long-term effects. Therefore, this section shows that regional FinTech can have a positive effect on green credit for polluting enterprises and provides the conditions for the growth of green credit. Considering the control variables, both ROE and ROA are statistically positive at the 1% significance level. These results are used to measure the extent of polluting enterprises’ ability to return on investment in the previous project and their own financing ability. This shows that with the increment in ROE and ROA, firms can use their own profits to invest in future green projects without green loans from financial institutions. Size is statistically negative at the 1% significance level; this is because with more assets, firms have more collateral to increase their green credit from financial institutions. In addition, a higher degree of political connection reduces green credit significantly, and the status of state-owned enterprises promotes green credit development.
The reasons for these results are as follows. (1) FinTech provides financial agencies with the ability to select qualified polluting enterprises to approve green credit. Therefore, with the help of FinTech, financial institutions can obtain more environmental information, such as enterprises’ protection missions, environmental protection information, and illegal emissions cases. (2) in the case of enterprises’ concealment or fraudulent behavior, FinTech can act as an external supervisor. By promoting FinTech, polluting enterprises reduce their need for concealment or fraud with regard to pollution information or data, as concealment or fraud reduces their probability of obtaining green credit if discovered by financial institutions. (3) The impact of FinTech on long-term green credit is larger than short-term green credit, as the investment payback cycle of environmental protection projects is often longer. Because the demand for green credit is often longer than one year, FinTech has a greater impact on long-term green credit to reduce burdensome tasks.
4.2. Mechanism Identification
The above regression fully verifies that FinTech can help polluting enterprises to cultivate conditions that promote green credit development. It is necessary to identify the factors that can contribute to FinTech’s impact on green credit. This section discusses the mechanisms of information asymmetry and green credit allocation efficiency. The information asymmetry mechanism contains two sub-mechanisms: the environmental information disclosure mechanism, and the media and investor mechanism.
4.2.1. Environmental Information Disclosure Mechanism
The first channel of the information asymmetry conclusion can be seen in Table 3. This shows that the estimated coefficients of the cross terms were significant at the 1% significance level. The results show that higher disclosure of environmental information from industry principles or self-reporting strengthens the impact of FinTech on green credit. However, releasing bad signals from environmental information weakens the FinTech process. There are two possible reasons for this. First, for lenders, higher disclosure of environmental information contributes to their pre-loan investigation, which makes them effective in assessing the qualification of polluting enterprises to obtain green credit. On the contrary, it weakens the process if the released information is a bad signal in their green qualification, because it disrupts the system of lenders or banks in assessing the enterprise based on EPs. Second, borrowers or polluting enterprises actively disclose their environmental beliefs and release their desire for green credit. While FinTech can easily assess enterprises willing to release good signals, it is difficult to make rational decisions when accessing enterprises that hide their governance beliefs regarding environmental protection. Thus, Hypothesis 2A is verified.
4.2.2. Media and Investor Focus Mechanism
The second-channel conclusion of information asymmetry can be obtained from Table 4. This shows that the estimated interactions are significant. The results show that increasing media and investor focus makes the influence of FinTech on green credit more efficient, regardless of the information generating from financial media news or Guba. More green fund investment suggests a good signal for polluting firms, and is an efficient way for FinTech to make a prediction about firms. We explain the complementary effects of the media and investor focus on this channel. More media information, Guba posts, Guba comment volume, and Guba reading volume imply more varied information about polluting enterprises. This kind of environmental information helps FinTech to qualify its prediction of green credit and makes pre-loan investigations more efficient. More green investors, who can expose investment information to public and financial institutions such as green fund investments disclosed by official reports, can extend a good signal to polluting enterprises. Consequently, lenders reduce the cost of the data collection process and increase the efficiency of green credit businesses. Thus, Hypothesis 2B is verified.
4.2.3. Green Credit Allocation Efficiency Mechanism
In this section, we explore the mechanism of green credit allocation efficiency and examine FinTech’s impact on credit allocation efficiency using an innovative index, as shown in Table 5. We find that FinTech can significantly enhance green credit development by improving green credit allocation efficiency, including short-term green credit development and long-term green credit development. At the same time, the effect of FinTech on the efficiency of green credit allocation increases the growth of long-term green credit more than its short-term growth. As shown in the interaction, 1% more FinTech companies of the total quantity in the region increase green credit development by approximately 1.249%. This can be explained by FinTech ultimately enhancing green credit development by improving lenders’ digital processing capabilities and decision-making techniques, thereby reducing labor costs and approval time for green credit pre-loan investigations. Therefore, Hypothesis 3 is confirmed.
Summarizing the regression results of the above three mechanism analyses, we find that the results concerning information asymmetry are more significant than those concerning the efficiency of green credit allocation. It can be concluded that the reduction in information asymmetry plays a leading role in facilitating FinTech to enhance the development of green credit.
4.3. Heterogeneity Analysis
In this section, we discuss the heterogeneity analysis from the perspective of different regional environmental objectives, different emissions of enterprises, and different ESG scores.
4.3.1. Environmental Objective Heterogeneity Analysis
The implementation effect of FinTech on green credit may have regional differences. The previous literature always refers to regional resource types or financial market development levels [25], and there might be a research gap with respect to the heterogeneity of government environmental objectives. Because we used micro-enterprise data from China to conduct the research, we decided to use the government’s objectives to conduct a heterogeneity analysis. From 2011 to 2020, the authorities aimed to realize significant achievements with regard both the economy and environment, and proposed emission reduction targets. Here, we use sulfur dioxide as the main reduction target. Taking China’s emission reduction target in government reports and setting it as the dividing line, the provincial targets that are above the national target can be divided into high targets. In contrast, those who are below the target can be divided into low targets. The results are shown seen in Table 6. FinTech has a greater impact on the green credit of polluting companies with higher emission targets than on those with lower targets.
Zhejiang Province, China, with a relatively high goal, launched the “Green Loan Link” online platform to collect information on green loan products from 36 banking institutions in the city. In addition to conventional environmental protection information, this included information such as on-site environmental protection investigation requests and inspection records, and helped more than 16,000 enterprises obtain bank loans of RMB 170 billion. Based on the province’s geographical location, resource characteristics, industrial structure, and economic development, the government should prudently set different emission reduction targets and make them achievable. Because the internal decision-making process of the government is sometimes difficult to comprehend, we consider the emission targets set by the government as a measure that combines environmental protection fiscal expenditure with the environmental situation faced by local governments. With higher targets, the impact of FinTech benefits from the good condition of reduced emissions, as higher targets mean a higher desire to implement environmental protection and more beneficial green policies. As a result, with a greater desire for government environmental protection, the effect of FinTech will improve.
4.3.2. Enterprise Emission Heterogeneity Analysis
Small and medium-sized enterprises play an important role in developing a sustainable economy [73]. In this section, as shown in Table 7, we test whether certain conclusions in the literature remain robust when we introduce the impact of FinTech on green credit. He et al. (2019) and Zhang et al. (2021) showed that small- and medium-sized enterprises play a leading role in green credit [25,29] and that they benefit more from green credit than large enterprises. However, the green credit policy becomes a constraint for large enterprises. The average asset size is used to divide SMEs and large enterprises, and the average carbon emission value is used to divide low-carbon enterprises and high-carbon enterprises. In Table 7, SMEs with low carbon emissions benefit more from FinTech and improve their ability to obtain green credit. However, large enterprises with low carbon emissions benefit less from FinTech because they can release more information, while traditional agencies can find qualified enterprises without FinTech assistance.
4.3.3. Enterprise ESG Scores Heterogeneity Analysis
The last part of the heterogeneity analysis uses the ESG score, taken from Wind accessed on 1 December 2022. The ESG score is composed of the governance, environmental protection, and social responsibility level scores. The higher the ESG score, the better a company implements policies for the environment, society, and governance. The results in Table 8 indicate that there is a more intense impact of FinTech on green credit in the case of higher scores on governance, environmental protection, and social responsibility levels. The ESG score is an external index from third parties, and represents the cautious judgment of many financial institutions. Therefore, a high ESG score indicates that companies have sound and responsible policies for society and a good reputation in the industry.
4.4. Endogeneity Problem
To mitigate the endogeneity problems of FinTech’s impact on green credit, we use the instrumental variable method, propensity score matching method, and staggered difference-in-difference estimation.
We rely on the instrumental variable selection method of Chong et al. (2013) [74], which measures the average FinTech development of the three cities closest to the GDP of the city where the firm is located. Two reasons for this variable are as follows: first, there are similarities in the structure of local financial systems with similar GDP. Therefore, cities with similar GDP have similar FinTech developments [75]. Second, FinTech with a similar GDP does not significantly affect the green credit of enterprises, as the pollution level and environmental protection ability of the government at the city level may behave differently from other cities with similar GDP. Cities with similar GDP may be adjacent; therefore, the structure of the green economy may behave the same due to similar geographical characteristics or sharing the same river source. As air pollution is hard to vary, we controlled the level of the green economy in the whole province in all regressions. In the end, the green finance variable was insignificant in the regressions. These types of FinTech developments have different impacts on green credit. As shown in Table 9, adding the propensity score matching method, we used the instrumental variable, one-to-one nearest neighbor matching, one-to-two nearest neighbor matching, and kernel matching methods. The results remained valid.
For the staggered difference-in-difference method, we chose a quasi-natural experiment called “Broadband China” to construct it as an event in the staggered difference estimates [76]. As the industrial revolution progressed, computer and information technologies developed significantly. China’s government introduced the “Broadband China” strategy to develop network infrastructure under the constraint of China’s low internet penetration rate. Approximately 120 cities were selected as pilot cities in three phases during 2014, 2015, and 2016. Pilot cities were tasked with continuing to increase broadband network speed and coverage while increasing the scale of internet use in urban and rural areas. This increasing scale of network infrastructure has an impact on FinTech development, which mainly relies on a robust network and benefits from this strategy. To assess the causal impact of broadband infrastructure development on green credit, we applied a staggered difference-in-difference(DID) model, referring to model (6):
where
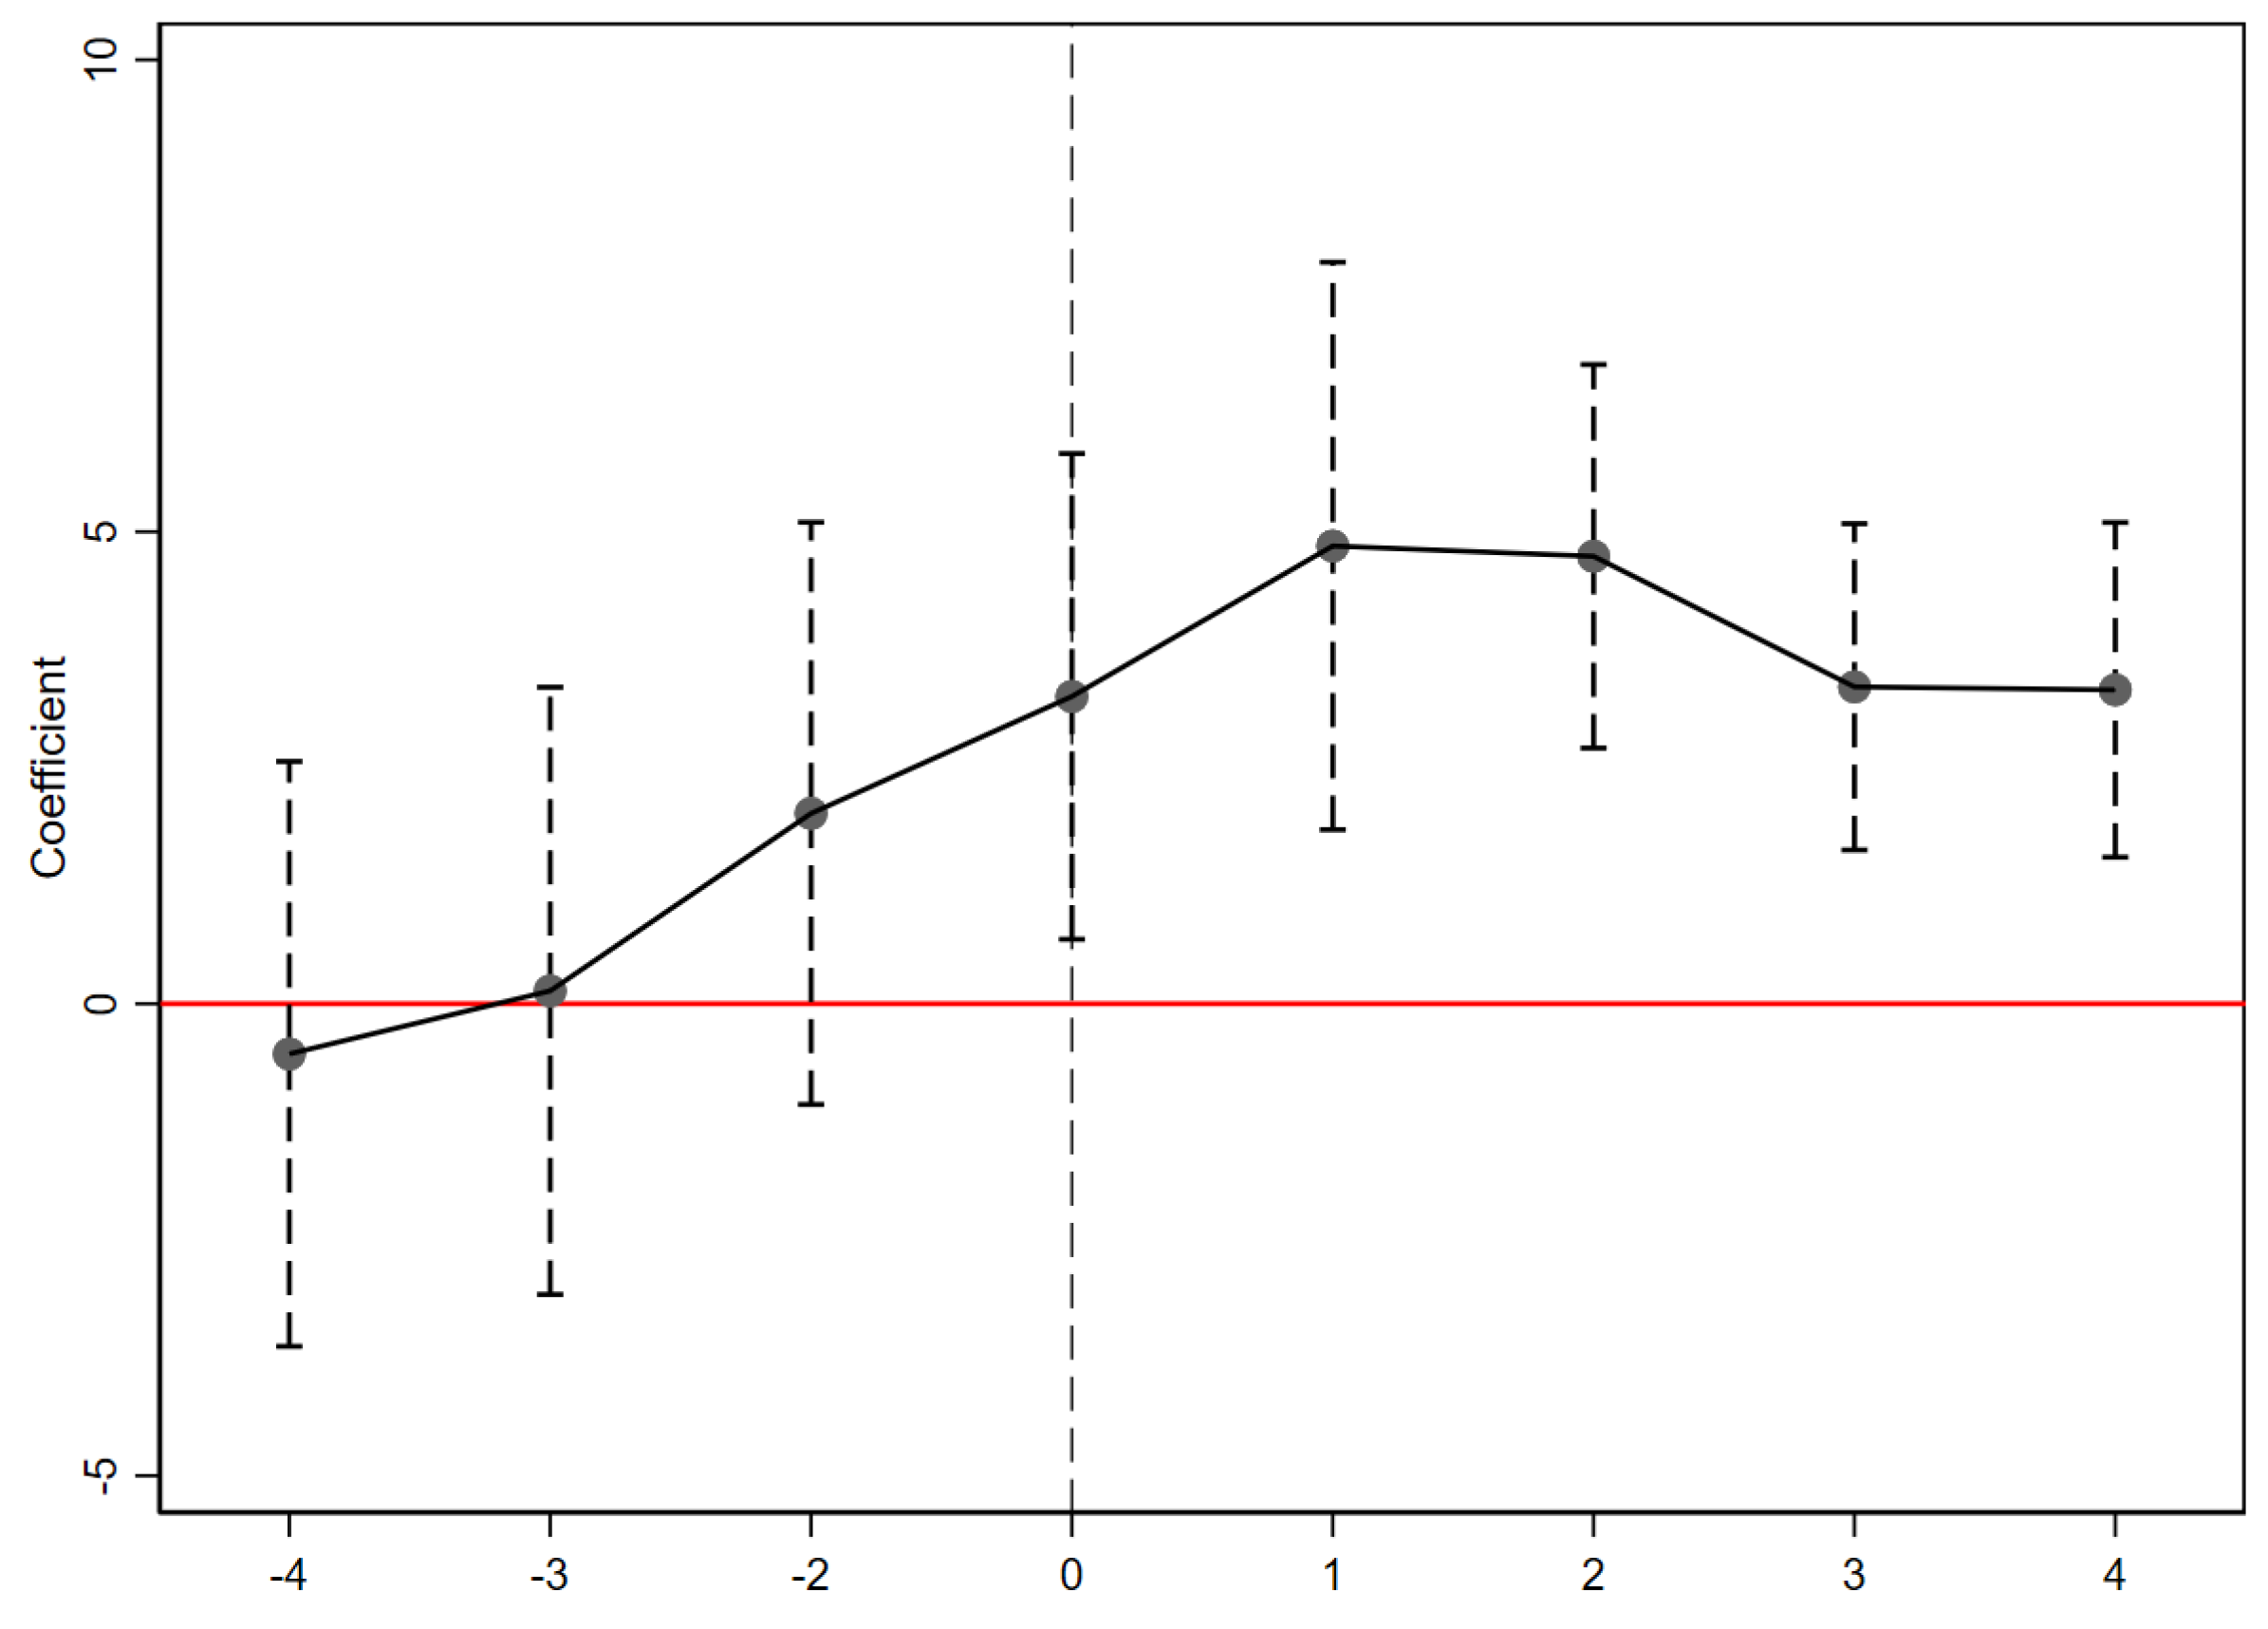
The premise of using staggered DID method is the parallel trend assumption. We set the sample in 2012 as basic group and test parallel trend assumption. We refer to the model (8):
where indicates whether the city was selected as a “Broadband China” pilot city or not. Negative k means that it is k years before the year when the city becomes a pilot city, while positive k means that the city has become the pilot city, representing the difference between the experimental group and the control group. We set as the baseline experimental group; if and are not significantly different from 0, then the test for parallel trends is passed. Figure 3 shows the coefficients of in the interval and its 95% confidence interval. It can clearly be seen that the estimated values of remain flat in the interval , indicating that there is nothing significant before the strategy is implemented. From , the estimated values of start to increase significantly, indicating that the “Broadband China” policy improves green credit. Table 9 shows that the staggered DID approach is a reasonable method for mitigating the endogeneity problems.
4.5. Robustness Check
In Table 10, we choose the replacement of explanatory variables, time-varying method, and replacement of explained variables for the robustness test. Regarding explanatory variables, we adopt seven replacements: (1) the development level of FinTech with a two-period lag (FinTechlag2); (2) the ratio of the development level of FinTech to the number of colleges at the city level (FinTechEdu), (3) the credit sub-index of the Peking University Digital Financial Inclusion Index of China (PKUCredit), referring to Guo et al. (2020) [77]; (4) the digital transformation index collection, referring to Wu et al. (2021) (DT_index) [78]; (5) the digital utilization index, again referring to Wu et al. (2021) (DU_index) [78]; (6) the frequency of related FinTech media news at the provincial level, referring to Li et al. (2020) (FTNews_freq) [79]; and (7) the proportion of news related to FinTech at provincial level, again referring to Li et al. (2020) (FTNews_prop) [79]. The development of FinTech is closely related to the cultivation of local talent, because more talent is cultivated in local colleges, indicating that an increase in high-quality labor can result from the development of enterprises and the financial system. As the demand for enterprise credit increases, the demand for FinTech increases as welll. Regarding the time-varying method, we consider that the time trends of the control variables might affect the FinTech development of different regions, which might disturb the benchmark regression. Referring to Moser and Voena (2012) [80], we set dummy variables for each year and constructed interactions with control variables and the dummy variables; the results shown in Table 10 are robust.
For the changing explanatory variables in Table 11, we used three variables to replace the level of green credit in the explanatory variables. These three indicators are closely related to green credit: replacement with fiscal expenditures on environmental protection, replacement with the local financial development level, and replacement with the local financial employment rate. All the above tests are robust, as can be seen Table 11.
5. Conclusions, Limitations, and Future Research Directions
5.1. Conclusions and Policy Implications
This study explores the impact of FinTech on green credit using data from listed polluting companies and regional data in China. The empirical results show that FinTech enhances green credit development, including short-term and long-term green credit. Specifically, approximately 1% more FinTech companies of the total quantity in the region could increase the level of green credit by 1.187%. Regarding the information asymmetry mechanism, the effect of promoting green credit development can be achieved by enhancing environmental information disclosure and improving media and investor attention. Considering the relationship between FinTech and banks, we find that the effect of FinTech on green credit allocation efficiency is significant for green credit development, including short-term and long-term green credit development. In detail, 1% more FinTech companies of the total quantity in the regional will increase green credit development by approximately 1.249%, which means that FinTech can improve the allocation efficiency of local banks and improve green credit development. Our heterogeneity analysis shows that FinTech can enhance green credit development in regions with higher government environmental targets, SMEs with lower carbon emissions, and firms with higher ESG scores.
These research findings have important policy implications for China.
First, it is important to establish effective environmental communication and information-sharing platforms between lenders and accelerate the penetration of FinTech. To reduce information asymmetry, lenders, investors, the media, and local governments need to work together to promote environmental disclosure. Thus, lenders should establish information-sharing platforms. Investors and the media need to use their monitoring mechanisms to help FinTech companies gather more external information by publishing more commentary on companies and digging up more in-depth reports on them. Local governments need to use FinTech companies to promote the development of green credit, while avoiding any invasion of corporate privacy.
Second, local governments need to set their reduction targets rationally; external raters should be prudent in their ESG scoring, and high-emission production processes should aim to meet environmental standards. The government should set reasonable environmental targets according to the local environmental situation, economic development, and the financial situation. Simultaneously, the level of technology and talent in financial institutions should be upgraded to promote the development of green credit. Third-party institutions should objectively evaluate companies on ESG scores to help financial institutions make reasonable judgments on their green credit worthiness. Polluting companies need to make technological improvements to their production processes to reduce pollution and meet local environmental production standards.
5.2. Limitations
This study has three main limitations, which can be optimized in future research. First, data disclosure on green credit in China is incomplete. We did not have access to information on the lender or on time spent in pre-loan review of green credit for specific firms, making it difficult for us to directly measure the efficiency of green credit allocation. Second, due to the unavailability of internal bank data, we were unable to measure the change in bank competitiveness caused by FinTech, which makes it difficult to conduct further analysis.
5.3. Future Research Directions
In the future, with the implementation of increasingly stringent environmental protection policies and information disclosure policies, banks and enterprises can be expected to improve their voluntary disclosure of access to green credit, and we intend to conduct more detailed measurements of corporate green credit development in order to deepen the present research. The investment behavior of enterprises using green credit will receive increased attention as well. Whether and how FinTech can deter enterprises’ fraudulent lending behavior to ensure that the environmental benefits brought by green credit can be implemented is another direction in our future research.
Author Contributions
Conceptualization, methodology, writing—review and editing, Q.L.; writing—original draft preparation, software, validation, Y.Y. All authors have read and agreed to the published version of the manuscript.
Funding
This paper gratefully acknowledges financial support from the National Social Science Foundation of China “impact assessment and mechanism of digital finance on residents’ consumption inequality” (No. 21CJY045).
Institutional Review Board Statement
Not applicable.
Informed Consent Statement
Not applicable.
Data Availability Statement
We refer the data from CSMAR database, CNDRS database, and official reports issued from Chinese government.
Conflicts of Interest
The authors declare no conflict of interest.
References
- Wang, C.; Zhang, H.; Lu, L.; Wang, X.; Song, Z. Pollution and corporate valuation: Evidence from China. Appl. Econ. 2019, 51, 3516–3530. [Google Scholar] [CrossRef] [Green Version]
- Liu, L.; He, L.Y. Output and welfare effect of green credit in China: Evidence from an estimated DSGE model. J. Clean. Prod. 2021, 294, 126326. [Google Scholar] [CrossRef]
- Wen, H.; Lee, C.C.; Zhou, F. Green credit policy, credit allocation efficiency and upgrade of energy-intensive enterprises. Energy Econ. 2021, 94, 105099. [Google Scholar] [CrossRef]
- Muganyi, T.; Yan, L.; Sun, H.P. Green finance, fintech and environmental protection: Evidence from China. Environ. Sci. Technol. 2021, 7, 100107. [Google Scholar] [CrossRef] [PubMed]
- Swai, S.; Gochhait, S. ABCD technology-AI, Blockchain, Cloud computing and Data security in Islamic banking sector. In Proceedings of the 2022 International Conference on Sustainable Islamic Business and Finance (SIBF), Sakhir, Bahrain, 11–12 October 2022; pp. 58–62. [Google Scholar]
- Board, F.S. FinTech Credit: Market Structure, Business Models and Financial Stability Implications; Committee on the Global Financial System: New York, NY, USA, 2017. [Google Scholar]
- Fuster, A.; Plosser, M.; Schnabl, P.; Vickery, J. The role of technology in mortgage lending. Rev. Financ. Stud. 2019, 32, 1854–1899. [Google Scholar] [CrossRef] [Green Version]
- Peng, Z.; Ke, J. Spillover Effect of the Interaction between Fintech and the Real Economy Based on Tail Risk Dependent Structure Analysis. Sustainability 2022, 14, 7818. [Google Scholar] [CrossRef]
- Allen, F.; Qian, J.; Qian, M. Law, finance, and economic growth in China. J. Financ. Econ. 2005, 77, 57–116. [Google Scholar] [CrossRef] [Green Version]
- Zhou, G.; Zhu, J.; Luo, S. The impact of fintech innovation on green growth in China: Mediating effect of green finance. Ecol. Econ. 2022, 193, 107308. [Google Scholar] [CrossRef]
- Cen, T.; He, R. Fintech, green finance and sustainable development. In Proceedings of the 2018 International Conference on Management, Economics, Education, Arts and Humanities (MEEAH 2018), Barcelona, Spain, 7–9 December 2018; pp. 222–225. [Google Scholar]
- Carnegie, G.D.; Ferri, P.; Parker, L.D.; Sidaway, S.I.; Tsahuridu, E.E. Accounting as technical, social and moral practice: The monetary valuation of public cultural, heritage and scientific collections in financial reports. Aust. Account. Rev. 2022, 32, 460–472. [Google Scholar] [CrossRef]
- Puschmann, T.; Hoffmann, C.H.; Khmarskyi, V. How green FinTech can alleviate the impact of climate change—The case of Switzerland. Sustainability 2020, 12, 10691. [Google Scholar] [CrossRef]
- Liu, H.; Yao, P.; Latif, S.; Aslam, S.; Iqbal, N. Impact of Green financing, FinTech, and financial inclusion on energy efficiency. Environ. Sci. Pollut. Res. 2022, 29, 18955–18966. [Google Scholar] [CrossRef] [PubMed]
- Dorfleitner, G.; Braun, D. Fintech, digitalization and blockchain: Possible applications for green finance. In The Rise of Green Finance in Europe; Migliorelli, M., Dessertine, P., Eds.; Palgrave Studies in Impact Finance; Palgrave Macmillan: Cham, Switzerland, 2019; pp. 207–237. [Google Scholar]
- Yang, Y.; Su, X.; Yao, S. Nexus between green finance, fintech, and high-quality economic development: Empirical evidence from China. Resour. Policy 2021, 74, 102445. [Google Scholar] [CrossRef]
- Dwivedi, P.; Alabdooli, J.I.; Dwivedi, R. Role of FinTech adoption for competitiveness and performance of the bank: A study of banking industry in UAE. Int. J. Glob. Bus. Compet. 2021, 16, 130–138. [Google Scholar] [CrossRef]
- Yang, X. FinTech in Promoting the Development of Green Finance in China against the Background of Big Data and Artificial Intelligence. In Proceedings of the 2020 4th International Seminar on Education Innovation and Economic Management (SEIEM), Penang, Malaysia, 23–24 May 2020; Francis Academic Press: London, UK, 2020. [Google Scholar]
- Rizwan, A.; Mustafa, F. Fintech Attaining Sustainable Development: An Investor Perspective of Crowdfunding Platforms in a Developing Country. Sustainability 2022, 14, 7114. [Google Scholar] [CrossRef]
- Chorzempa, M.; Huang, Y. Chinese fintech innovation and regulation. Asian Econ. Policy Rev. 2022, 17, 274–292. [Google Scholar] [CrossRef]
- Alexander, K. Are environmental risks missing in Basel III? J. Int. Bank. Financ. Law 2015, 30, 67–68. [Google Scholar]
- Campiglio, E. Beyond carbon pricing: The role of banking and monetary policy in financing the transition to a low-carbon economy. Ecol. Econ. 2016, 121, 220–230. [Google Scholar] [CrossRef] [Green Version]
- Li, Y.; Ding, T.; Zhu, W. Can Green Credit Contribute to Sustainable Economic Growth? An Empirical Study from China. Sustainability 2022, 14, 6661. [Google Scholar] [CrossRef]
- Caragnano, A.; Mariani, M.; Pizzutilo, F.; Zito, M. Is it worth reducing GHG emissions? Exploring the effect on the cost of debt financing. J. Environ. Manag. 2020, 270, 110860. [Google Scholar] [CrossRef]
- Zhang, K.; Li, Y.; Qi, Y.; Shao, S. Can green credit policy improve environmental quality? Evidence from China. J. Environ. Manag. 2021, 298, 113445. [Google Scholar] [CrossRef]
- Ambec, S.; Lanoie, P. Does it pay to be green? A systematic overview. Acad. Manag. Perspect. 2008, 22, 45–62. [Google Scholar]
- Lemmon, M.; Roberts, M.R. The response of corporate financing and investment to changes in the supply of credit. J. Financ. Quant. Anal. 2010, 45, 555–587. [Google Scholar] [CrossRef]
- Nandy, M.; Lodh, S. Do banks value the eco-friendliness of firms in their corporate lending decision? Some empirical evidence. Int. Rev. Financ. Anal. 2012, 25, 83–93. [Google Scholar] [CrossRef] [Green Version]
- He, L.; Zhang, L.; Zhong, Z.; Wang, D.; Wang, F. Green credit, renewable energy investment and green economy development: Empirical analysis based on 150 listed companies of China. J. Clean. Prod. 2019, 208, 363–372. [Google Scholar] [CrossRef]
- Berg, T.; Burg, V.; Gombović, A.; Puri, M. On the rise of fintechs: Credit scoring using digital footprints. Rev. Financ. Stud. 2020, 33, 2845–2897. [Google Scholar] [CrossRef]
- Balyuk, T.; Berger, A.N.; Hackney, J. What Is Fueling FinTech Lending? The Role of Banking Market Structure. The Role of Banking Market Structure. Available online: https://papers.ssrn.com/sol3/papers.cfm?abstract_id=3633907 (accessed on 24 February 2023).
- Buchak, G.; Matvos, G.; Piskorski, T.; Seru, A. Fintech, regulatory arbitrage, and the rise of shadow banks. J. Financ. Econ. 2018, 130, 453–483. [Google Scholar] [CrossRef]
- Hauswald, R.; Marquez, R. Information technology and financial services competition. Rev. Financ. Stud. 2003, 16, 921–948. [Google Scholar] [CrossRef]
- He, Z.; Huang, J.; Zhou, J. Open banking: Credit market competition when borrowers own the data. J. Financ. Econ. 2023, 147, 449–474. [Google Scholar] [CrossRef]
- Jia, J.; Li, Z. Corporate environmental performance and financial distress: Evidence from Australia. Aust. Account. Rev. 2022, 32, 188–200. [Google Scholar] [CrossRef]
- Gutmayer, T.; Cerbone, D.; Maroun, W. An Evaluation of Business Model Disclosures in Integrated Reports. Aust. Account. Rev. 2022, 32, 220–237. [Google Scholar] [CrossRef]
- Hao, J.; Pham, V.T. COVID-19 Disclosures and Market Uncertainty: Evidence from 10-Q Filings. Aust. Account. Rev. 2022, 32, 238–266. [Google Scholar] [CrossRef]
- Chua, W.F.; James, R.; King, A.; Lee, E.; Soderstrom, N. Task Force on Climate-related Financial Disclosures (TCFD) Implementation: An Overview and Insights from the Australian Accounting Standards Board Dialogue Series. Aust. Account. Rev. 2022, 32, 396–405. [Google Scholar] [CrossRef]
- Zhou, S. Reporting and Assurance of Climate-Related and Other Sustainability Information: A Review of Research and Practice. Aust. Account. Rev. 2022, 32, 315–333. [Google Scholar] [CrossRef]
- Edge, B. Recent Developments in Sustainability Reporting. Aust. Account. Rev. 2022, 32, 151–155. [Google Scholar] [CrossRef]
- Ryan, J.; Tiller, D. A recent survey of GHG emissions reporting and assurance. Aust. Account. Rev. 2022, 32, 181–187. [Google Scholar] [CrossRef]
- Dhaliwal, D.; Li, O.Z.; Tsang, A.; Yang, Y.G. Corporate social responsibility disclosure and the cost of equity capital: The roles of stakeholder orientation and financial transparency. J. Account. Public Policy 2014, 33, 328–355. [Google Scholar] [CrossRef]
- Qiu, Y.; Shaukat, A.; Tharyan, R. Environmental and social disclosures: Link with corporate financial performance. Br. Account. Rev. 2016, 48, 102–116. [Google Scholar] [CrossRef] [Green Version]
- Liu, X.; Anbumozhi, V. Determinant factors of corporate environmental information disclosure: An empirical study of Chinese listed companies. J. Clean. Prod. 2009, 17, 593–600. [Google Scholar] [CrossRef]
- García, J.H.; Sterner, T.; Afsah, S. Public disclosure of industrial pollution: The PROPER approach for Indonesia? Environ. Dev. Econ. 2007, 12, 739–756. [Google Scholar] [CrossRef] [Green Version]
- Coulson, D.C.; Lacy, S. Journalists’ perceptions of how newspaper and broadcast news competition affects newspaper content. J. Mass. Commun. Q. 1996, 73, 354–363. [Google Scholar] [CrossRef]
- Peress, J. The media and the diffusion of information in financial markets: Evidence from newspaper strikes. J. Financ. 2014, 69, 2007–2043. [Google Scholar] [CrossRef]
- Bushman, R.M.; Piotroski, J.D.; Smith, A.J. What determines corporate transparency? J. Account. Res. 2004, 42, 207–252. [Google Scholar] [CrossRef]
- Lu, Y. Research on influence from investor focus and investor sentiment in on-line social media upon stock market. Mod. Econ. Manag. Forum 2022, 3, 111–114. [Google Scholar] [CrossRef]
- Xiaogang, C.; Skully, M.; Brown, K. Banking efficiency in China: Application of DEA to pre-and post-deregulation eras: 1993–2000. China Econ. Rev. 2005, 16, 229–245. [Google Scholar]
- Luo, D.; Yao, S. World financial crisis and the rise of Chinese commercial banks: An efficiency analysis using DEA. Appl. Financ. Econ. 2010, 20, 1515–1530. [Google Scholar] [CrossRef] [Green Version]
- Wang, K.; Huang, W.; Wu, J.; Liu, Y.N. Efficiency measures of the Chinese commercial banking system using an additive two-stage DEA. Omega 2014, 44, 5–20. [Google Scholar] [CrossRef]
- Berger, A.N.; Hasan, I.; Zhou, M. Bank ownership and efficiency in China: What will happen in the world’s largest nation? J. Bank. Financ. 2009, 33, 113–130. [Google Scholar] [CrossRef]
- Xie, X.; Zhu, X. FinTech and capital allocation efficiency: Another equity-efficiency dilemma? Glob. Financ. J. 2022, 53, 100741. [Google Scholar] [CrossRef]
- Anita, S.; Tasnova, N.; Nawar, N. Are non-performing loans sensitive to macroeconomic determinants? An empirical evidence from banking sector of SAARC countries. Futur. Bus. J. 2022, 7, 8. [Google Scholar] [CrossRef]
- Dirk, B.; Josh, R.; Frank, L.; Lu, Z. Credit policy and the ‘debt shift’ in advanced economies. Socio-Econ. Rev. 2021, 27, 437–478. [Google Scholar]
- Lee, C.C.; Li, X.; Yu, C.H.; Zhao, J. Does fintech innovation improve bank efficiency? Evidence from China’s banking industry. Int. Rev. Econ. Financ. 2021, 74, 468–483. [Google Scholar] [CrossRef]
- Wang, Y.; Xiuping, S.; Zhang, Q. Can fintech improve the efficiency of commercial banks?—An analysis based on big data. Res. Int. Bus. Financ. 2021, 55, 101338. [Google Scholar] [CrossRef]
- Shen, Y.; Guo, P. Internet finance, technology spillover and commercial banks TFP. J. Financ. Res. 2015, 417, 160–175. [Google Scholar]
- Hasan, B.T.; Chand, P.; Lu, M. Influence of auditor’s gender, experience, rule observance attitudes and critical thinking disposition on materiality judgements. Int. J. Audit. 2021, 25, 188–205. [Google Scholar] [CrossRef]
- Le, C.H.A.; Shan, Y.; Taylor, S. Executive compensation and financial performance measures: Evidence from significant financial institutions. Aust. Account. Rev. 2020, 30, 159–177. [Google Scholar] [CrossRef]
- Wang, M.X.; Zhao, H.H.; Cui, J.X.; Fan, D.; Lv, B.; Wang, G.; Li, Z.H.; Zhou, G.J. Evaluating green development level of nine cities within the Pearl River Delta, China. J. Clean. Prod. 2018, 174, 315–323. [Google Scholar] [CrossRef]
- Chen, X.; Lu, M.; Shan, Y.; Zhang, Y. Australian evidence on analysts’ cash flow forecasts: Issuance, accuracy and usefulness. Account. Financ. 2021, 61, 3–50. [Google Scholar] [CrossRef]
- Ali, S.; Ur Rehman, R.; Yuan, W.; Ahmad, M.I.; Ali, R. Does foreign institutional ownership mediate the nexus between board diversity and the risk of financial distress? A case of an emerging economy of China. Eurasian Bus. Rev. 2021, 29, 3633907. [Google Scholar] [CrossRef]
- Shahab, Y.; Ntim, C.G.; Chengang, Y.; Ullah, F.; Fosu, S. Environmental policy, environmental performance, and financial distress in China: Do top management team characteristics matter? Bus. Strategy Environ. 2018, 27, 1635–1652. [Google Scholar] [CrossRef]
- Xu, Z.; Chen, Z.; Deng, L.; Yu, Y. The Impact of Mandatory Deleveraging on Corporate Tax Avoidance: Evidence from a Quasi-experiment in China. Aust. Account. Rev. 2022, 32, 352–366. [Google Scholar] [CrossRef]
- Xiao, H.; Xi, J. The Impact of Institutional Cross-ownership on Corporate Tax Avoidance: Evidence from Chinese Listed Firms. Aust. Account. Rev. 2022. Forthcoming. [Google Scholar] [CrossRef]
- Fan, J.P.; Wong, T.J.; Zhang, T. Politically connected CEOs, corporate governance, and Post-IPO performance of China’s newly partially privatized firms. J. Financ. Econ. 2007, 84, 330–357. [Google Scholar] [CrossRef]
- Zhou, D.; Bai, M.; Liang, X.; Qin, Y. The Early-life Political Event Experience of the Chair of the Board and the Firm’s Innovation Decision. Aust. Account. Rev. 2021, 31, 186–212. [Google Scholar] [CrossRef]
- Nguyen, T.T.M.; Evans, E.; Lu, M. Perceptions of independent directors about their roles of and challenges on corporate boards: Evidence from a survey in Vietnam. Aust. Account. Rev. 2019, 27, 69–96. [Google Scholar] [CrossRef] [Green Version]
- Lu, M.; Simnett, R.; Zhou, S. Using the same provider for financial statement audit and assurance of extended external reports: Choices and consequences. Auditing J. Pract. Theory 2023, 42, 125–154. [Google Scholar] [CrossRef]
- Xu, S.; Wang, F.; Cullinan, C.P.; Dong, N. Corporate Tax Avoidance and Corporate Social Responsibility Disclosure Readability: Evidence from China. Aust. Account. Rev. 2022, 32, 267–289. [Google Scholar] [CrossRef]
- Kukurba, M.; Waszkiewicz, A.E.; Salwin, M.; Kraslawski, A. Co-created values in crowdfunding for sustainable development of enterprises. Sustainability 2021, 13, 8767. [Google Scholar] [CrossRef]
- Chong, T.T.L.; Lu, L.; Ongena, S. Does banking competition alleviate or worsen credit constraints faced by small-and medium-sized enterprises? Evidence from China. J. Bank. Financ. 2013, 37, 3412–3424. [Google Scholar] [CrossRef]
- Kendall, J. Local financial development and growth. J. Bank. Financ. 2012, 36, 1548–1562. [Google Scholar] [CrossRef] [Green Version]
- Zhong, X.; Liu, G.; Chen, P.; Ke, K.; Xie, R. The Impact of Internet Development on Urban Eco-Efficiency—A Quasi-Natural Experiment of “Broadband China” Pilot Policy. Int. J. Environ. Res. Pub. Health 2022, 19, 1363. [Google Scholar] [CrossRef] [PubMed]
- Guo, F.; Wang, J.; Wang, F.; Kong, T.; Zhang, X.; Cheng, Z. Measuring China’s digital financial inclusion: Index compilation and spatial characteristics. China Econ. Q. 2020, 19, 1401–1418. [Google Scholar]
- Wu, F.; Hu, H.; Lin, H.; Ren, X. Enterprise digital transformation and capital market performance: Empirical evidence from stock liquidity. Manag. World 2021, 37, 130–144. [Google Scholar]
- Li, C.; Yan, X.; Song, M.; Yang, W. Fintech and corporate innovation: Evidence from Chinese NEEQ–listed companies. China Indus. Econ. 2020, 1, 81–98. [Google Scholar]
- Moser, P.; Voena, A. Compulsory licensing: Evidence from the trading with the enemy act. Am. Econ. Rev. 2012, 102, 396–427. [Google Scholar] [CrossRef] [Green Version]
Figure 1.
Green credit and average number of FinTech companies.

Figure 2.
Mechanism design.

Figure 3.
Parallel trend test in “Broadband China”.


Table 1.
Descriptive statistics.
| VarName | Obs | Mean | SD | Min | Median | Max |
|---|---|---|---|---|---|---|
| Greencredit | 33,067 | 7.5300 | 49.5923 | 0.0000 | 0.7356 | 1371.9769 |
| FinTech | 33,067 | 3.5305 | 2.3875 | 0.0000 | 3.1355 | 10.3928 |
| Size | 33,067 | 3.6493 | 1.2028 | 0.3715 | 3.4453 | 10.2137 |
| ROE | 33,067 | 0.3391 | 0.2115 | 0.0000 | 0.3145 | 7.8800 |
| ROA | 33,067 | 0.0351 | 0.0413 | −0.5201 | 0.0246 | 0.5166 |
| AG_Rate | 33,067 | 0.1086 | 0.3308 | −0.6142 | 0.0443 | 18.4250 |
| MBIG_Rate | 33,067 | 0.2096 | 10.9130 | −2.8749 | 0.0222 | 1294.2190 |
| NPG_Rate | 33,067 | 1.1378 | 97.5819 | −7.90 × 10³ | −0.0689 | 5188.1436 |
| Tobin’s Q | 33,067 | 2.0719 | 1.3965 | 0.7093 | 1.6488 | 22.5725 |
| Stat_Own | 33,067 | 0.3085 | 0.4619 | 0.0000 | 0.0000 | 1.0000 |
| PCLevel | 33,067 | 1.0639 | 1.5953 | 0.0000 | 0.0000 | 4.0000 |
| Ind_Ratio | 33,067 | 39.6175 | 9.4813 | 0.0000 | 37.5000 | 83.3333 |
| Green_Fin | 33,067 | 0.7602 | 0.0601 | 0.6416 | 0.7621 | 0.8790 |
| GDP_Rate | 33,067 | 8.4726 | 2.7219 | −19.3800 | 8.0100 | 23.9600 |
| Solid_Rate | 33,067 | 85.5045 | 17.3228 | 0.3400 | 92.3700 | 100.0000 |
| Water_Rate | 33,067 | 90.0535 | 8.8779 | 22.0200 | 92.4100 | 100.0000 |
Table 2.
FinTech and green credit development.
| Green Credit | Short-Term Green Credit | Long-Term Green Credit | |
|---|---|---|---|
| (1) | (2) | (3) | |
| FinTech | 1.187 ** | 0.160 * | 1.027 *** |
| (1.81) | (0.72) | (2.17) | |
| Size | 15.656 *** | 5.330 *** | 10.325 *** |
| (60.92) | (61.73) | (55.75) | |
| ROE | −7.522 *** | 0.336 | −7.857 *** |
| (−6.42) | (0.85) | (−9.30) | |
| ROA | −26.686 *** | −9.301 *** | −17.385 *** |
| (−4.85) | (−5.04) | (−4.39) | |
| AG_Rate | −1.598 ** | −0.305 | −1.293 *** |
| (−2.57) | (−1.46) | (−2.88) | |
| MBIG_Rate | 0.006 | 0.002 | 0.004 |
| (0.32) | (0.28) | (0.31) | |
| NPG_Rate | −0.002 | −0.001 | −0.001 |
| (−0.81) | (−0.77) | (−0.77) | |
| Tobin’s Q | 1.762 *** | 0.556 *** | 1.206 *** |
| (9.84) | (9.25) | (9.34) | |
| Stat_Own | 2.959 *** | 0.921 *** | 2.037 *** |
| (4.96) | (4.59) | (4.74) | |
| PCLevel | −0.481 *** | −0.101 ** | −0.381 *** |
| (−3.35) | (−2.08) | (−3.67) | |
| Ind_Ratio | −0.028 | −0.025 *** | −0.004 |
| (−1.20) | (−3.11) | (−0.21) | |
| Green_Fin | 1.065 | −0.604 | 1.669 |
| (0.11) | (−0.19) | (0.24) | |
| GDP_Rate | −0.325 *** | −0.152 *** | −0.173 ** |
| (−2.76) | (−3.83) | (−2.04) | |
| Solid_Rate | 0.021 | 0.005 | 0.015 |
| (0.88) | (0.69) | (0.91) | |
| Water_Rate | 0.010 | -0.005 | 0.015 |
| (0.23) | (−0.38) | (0.50) | |
| Constant | −53.776 *** | −15.007 *** | −38.768 *** |
| (−6.13) | (−5.09) | (−6.13) | |
| Observations | 33,067 | 33,067 | 33,067 |
| Industry fixed effect | YES | YES | YES |
| City fixed effect | YES | YES | YES |
| Year fixed effect | YES | YES | YES |
| Observation | 33,067 | 33,067 | 33,067 |
Notes: T-value in parentheses; *, **, and *** denote statistical significance levels at 10%, 5%, and 1%, respectively.
Table 3.
FinTech, environmental information disclosure, and green credit development.
| Green Credit | Green Credit | Green Credit | |
|---|---|---|---|
| (1) | (2) | (3) | |
| FinTech | 1.156 * | 1.086 ** | 0.643 ** |
| (1.78) | (2.08) | (1.26) | |
| FinTech*Env_Report | 6.618 *** | ||
| (12.49) | |||
| Env_Report | −17.464 *** | ||
| (−6.26) | |||
| FinTech* Illegal_Info | −0.019 * | ||
| (−3.12) | |||
| Illegal_Info | 0.194 | ||
| (0.57) | |||
| FinTech* Env_Mission | 0.273 *** | ||
| (5.32) | |||
| Env_Mission | −1.702 *** | ||
| (−7.20) | |||
| Control | YES | YES | YES |
| Industry fixed effect | YES | YES | YES |
| City fixed effect | YES | YES | YES |
| Year fixed effect | YES | YES | YES |
| Observation | 33,067 | 28,541 | 28,541 |
Notes: T-value in parentheses; *, **, and *** denote statistical significance levels at 10%, 5%, and 1%, respectively.
Table 4.
FinTech, media and investor focus, and green credit development.
| Green Credit | Green Credit | Green Credit | Green Credit | Green Credit | |
|---|---|---|---|---|---|
| (1) | (2) | (3) | (4) | (5) | |
| FinTech | 19.633 *** | 25.066 *** | 7.112 *** | 1.717 ** | 2.244 * |
| (28.68) | (21.19) | (9.09 ) | (2.64) | (1.89 ) | |
| FinTech*Media | 4.086 *** | ||||
| (50.00) | |||||
| Media | −11.690 *** | ||||
| (−26.55) | |||||
| FinTech*Post | 2.826 *** | ||||
| (26.49) | |||||
| Post | −10.387 *** | ||||
| (−20.09) | |||||
| FinTech*Read | 1.667 *** | ||||
| (18.91) | |||||
| Read | −8.785 *** | ||||
| ( −18.53) | |||||
| FinTech*Comment | 4.610 *** | ||||
| (29.96) | |||||
| Comment | −16.659 *** | ||||
| (−23.07) | |||||
| FinTech*G_invest | 3.497 *** | ||||
| (13.06) | |||||
| G_invest | −14.927 *** | ||||
| (−14.07) | |||||
| Control | YES | YES | YES | YES | YES |
| Industry fixed effect | YES | YES | YES | YES | YES |
| City fixed effect | YES | YES | YES | YES | YES |
| Year fixed effect | YES | YES | YES | YES | YES |
| Observation | 33,043 | 33,051 | 33,051 | 33,051 | 19,740 |
Notes: T-value in parentheses; *, **, and *** denote statistical significance levels at 10%, 5%, and 1%, respectively.
Table 5.
FinTech, green credit allocation efficiency, and green credit development.
| Green Credit | Short-Term Green Credit | Long-Term Green Credit | |
|---|---|---|---|
| (1) | (2) | (3) | |
| FinTech | 1.249 ** | 0.104 * | 1.145 *** |
| (1.43) | (1.04) | (1.81) | |
| FinTech*CA_efficiency | 0.043 ** | 0.015 ** | 0.028 * |
| (2.18) | (2.32) | (1.95) | |
| CA_efficiency | −0.141 * | −0.052 ** | −0.090 * |
| (−1.90) | (−2.08) | (−1.67) | |
| Control | YES | YES | YES |
| Industry fixed effect | YES | YES | YES |
| City fixed effect | YES | YES | YES |
| Year fixed effect | YES | YES | YES |
| Observation | 26,428 | 26,428 | 26,428 |
Notes: T-value in parentheses; *, **, and *** denote statistical significance levels at 10%, 5%, and 1%, respectively.
Table 6.
Environmental objective heterogeneity analysis.
| High Protection Objective (2011–2015) | Low Protection Objective (2011–2015) | High Protection Objective (2016–2020) | Low Protection Objective (2016–2020) | |
|---|---|---|---|---|
| (1) | (2) | (3) | (4) | |
| FinTech | 1.596 *** | −0.286 | 1.069 *** | −0.847 |
| (2.12) | (−0.87) | (1.97) | (−0.12) | |
| Control | YES | YES | YES | YES |
| Industry fixed effect | YES | YES | YES | YES |
| City fixed effect | YES | YES | YES | YES |
| Year fixed effect | YES | YES | YES | YES |
| Observation | 28,596 | 4471 | 27,386 | 5681 |
| Chow test | 35.47 *** | 56.62 *** | ||
| (0.00) | (0.00) |
Notes: T-value in regression coefficient parentheses and p-value in Chowtest parentheses; *** denote statistical significance levels at 1%, respectively.
Table 7.
Environmental emission heterogeneity analysis.
| Small and Medium | Large-Scale | ||||
|---|---|---|---|---|---|
| High Carbon | Low Carbon | High Carbon | Low Carbon | ||
| (1) | (2) | (3) | (4) | ||
| FinTech | 0.278 | 0.232 *** | −0.003 | 0.107 ** | |
| (0.07) | (2.87 ) | (−0.28) | (3.07) | ||
| Control | YES | YES | YES | YES | |
| Industry fixed effect | YES | YES | YES | YES | |
| City fixed effect | YES | YES | YES | YES | |
| Year fixed effect | YES | YES | YES | YES | |
| Observations | 3686 | 21,483 | 5012 | 2878 | |
| Chow test | 56.23 *** | ||||
| (0.00) | |||||
Notes: T-value in regression coefficient parentheses and p-value in Chowtest parentheses; **, and *** denote
statistical significance levels at 5% and 1%, respectively.
Table 8.
ESG score heterogeneity analysis.
| HighWindG | LowWindG | HighWindE | LowWindE | HighWindS | LowWindS | |
|---|---|---|---|---|---|---|
| (1) | (2) | (3) | (4) | (5) | (6) | |
| FinTech | 0.695 ** | 0.571 | 0.713 ** | −0.553 | 0.663 ** | −1.805 |
| (1.92) | (0.72) | (1.93) | (1.56) | (1.89) | (−1.38) | |
| Control | YES | YES | YES | YES | YES | YES |
| Industry fixed effect | YES | YES | YES | YES | YES | YES |
| City fixed effect | YES | YES | YES | YES | YES | YES |
| Year fixed effect | YES | YES | YES | YES | YES | YES |
| Observations | 28,701 | 4,366 | 28,750 | 4,317 | 28,475 | 4,592 |
| Chow test | 39.92 *** | 41.84 *** | 34.08 *** | |||
| (0.00) | (0.00) | (0.00) |
Notes: T-value in regression coefficient parentheses and p-value in Chowtest parentheses; **, and *** denote statistical significance levels at 5%, and 1%, respectively.
Table 9.
Endogeneity test.
| Green Credit | PSM:1 to 1 | PSM:1 to 2 | PSM:Kernel | Broadband China DID | |
|---|---|---|---|---|---|
| (1) | (2) | (3) | (4) | (5) | |
| FinTech_IV | 2.024 *** | ||||
| (2.18) | |||||
| FinTech | 1.568 ** | 1.597 *** | 1.818 *** | ||
| (1.80) | (2.45) | (1.89) | |||
| Treat | 2.111 ** | ||||
| (2.53) | |||||
| Wald F test | 962.16 | ||||
| LM statistic | 962.16 | ||||
| r(ATT) | 4.518 *** | 3.784 *** | 3.378 *** | ||
| (7.23) | (7.30) | (7.52) | |||
| Placebo test | YES | ||||
| Control | YES | YES | YES | YES | YES |
| Industry fixed effect | YES | YES | YES | YES | YES |
| City fixed effect | YES | YES | YES | YES | YES |
| Year fixed effect | YES | YES | YES | YES | YES |
| Observation | 28,052 | 24,793 | 20,456 | 23,057 | 33,067 |
Notes: T-value in parentheses; **, and *** denote statistical significance levels at 5% and 1%, respectively.
Table 10.
Robustness test: changing the explanatory variable and time-varying method.
| Green Credit | Green Credit | Green Credit | Green Credit | Green Credit | Green Credit | Green Credit | Green Credit | |
|---|---|---|---|---|---|---|---|---|
| (1) | (2) | (3) | (4) | (5) | (6) | (7) | (8) | |
| FinTechlag2 | 1.275 ** | |||||||
| (2.26) | ||||||||
| FinTechEdu | 0.034 *** | |||||||
| (10.16) | ||||||||
| PKUCredit | 0.058 * | |||||||
| (1.70) | ||||||||
| DT_index | 0.103 *** | |||||||
| (9.24) | ||||||||
| DU_index | 0.109 *** | |||||||
| (7.49) | ||||||||
| FTNews_freq | 1.399 *** | |||||||
| (2.20) | ||||||||
| FTNews_prop | 39.223 *** | |||||||
| (2.74) | ||||||||
| FinTech | 0.940 * | |||||||
| (1.66) | ||||||||
| Control | YES | YES | YES | YES | YES | YES | YES | YES |
| Time-varying Control | No | No | No | No | No | No | No | YES |
| Industry fixed effect | YES | YES | YES | YES | YES | YES | YES | YES |
| City fixed effect | YES | YES | YES | YES | YES | YES | YES | YES |
| Year fixed effect | YES | YES | YES | YES | YES | YES | YES | YES |
| Observation | 33,067 | 33,067 | 33,067 | 33,067 | 33,067 | 24,502 | 24,502 | 33,067 |
Notes: T-value in parentheses; *, **, and *** denote statistical significance levels at 10%, 5%, and 1%, respectively.
Table 11.
Robustness test: changing the explained variable.
| Green_Creditgov | Green_Creditfin | Green_Creditfinemploy | |
|---|---|---|---|
| (1) | (2) | (3) | |
| FinTech | 3.373 *** | 0.026 * | 1.527 *** |
| (2.63) | (1.94) | (3.27) | |
| Control | YES | YES | YES |
| Industry fixed effect | YES | YES | YES |
| City fixed effect | YES | YES | YES |
| Year fixed effect | YES | YES | YES |
| Observation | 33,067 | 33,067 | 33,067 |
Notes: T-value in parentheses; *, and *** denote statistical significance levels at 10% and 1%, respectively.
Disclaimer/Publisher’s Note: The statements, opinions and data contained in all publications are solely those of the individual author(s) and contributor(s) and not of MDPI and/or the editor(s). MDPI and/or the editor(s) disclaim responsibility for any injury to people or property resulting from any ideas, methods, instructions or products referred to in the content. |
© 2023 by the authors. Licensee MDPI, Basel, Switzerland. This article is an open access article distributed under the terms and conditions of the Creative Commons Attribution (CC BY) license (https://creativecommons.org/licenses/by/4.0/).
Share and Cite
MDPI and ACS Style
Liu, Q.; You, Y. FinTech and Green Credit Development—Evidence from China. Sustainability 2023, 15, 5903. https://doi.org/10.3390/su15075903
AMA Style
Liu Q, You Y. FinTech and Green Credit Development—Evidence from China. Sustainability. 2023; 15(7):5903. https://doi.org/10.3390/su15075903
Chicago/Turabian StyleLiu, Qian, and Yiheng You. 2023. "FinTech and Green Credit Development—Evidence from China" Sustainability 15, no. 7: 5903. https://doi.org/10.3390/su15075903
Note that from the first issue of 2016, this journal uses article numbers instead of page numbers. See further details here.