
Integrated Fuzzy DEMATEL-ISM-NK for Metro Operation Safety Risk Factor Analysis and Multi-Factor Risk Coupling Study
Abstract
:1. Introduction
2. Materials and Methods
2.1. Framework for Analyzing Risk Factors in Metro Operations
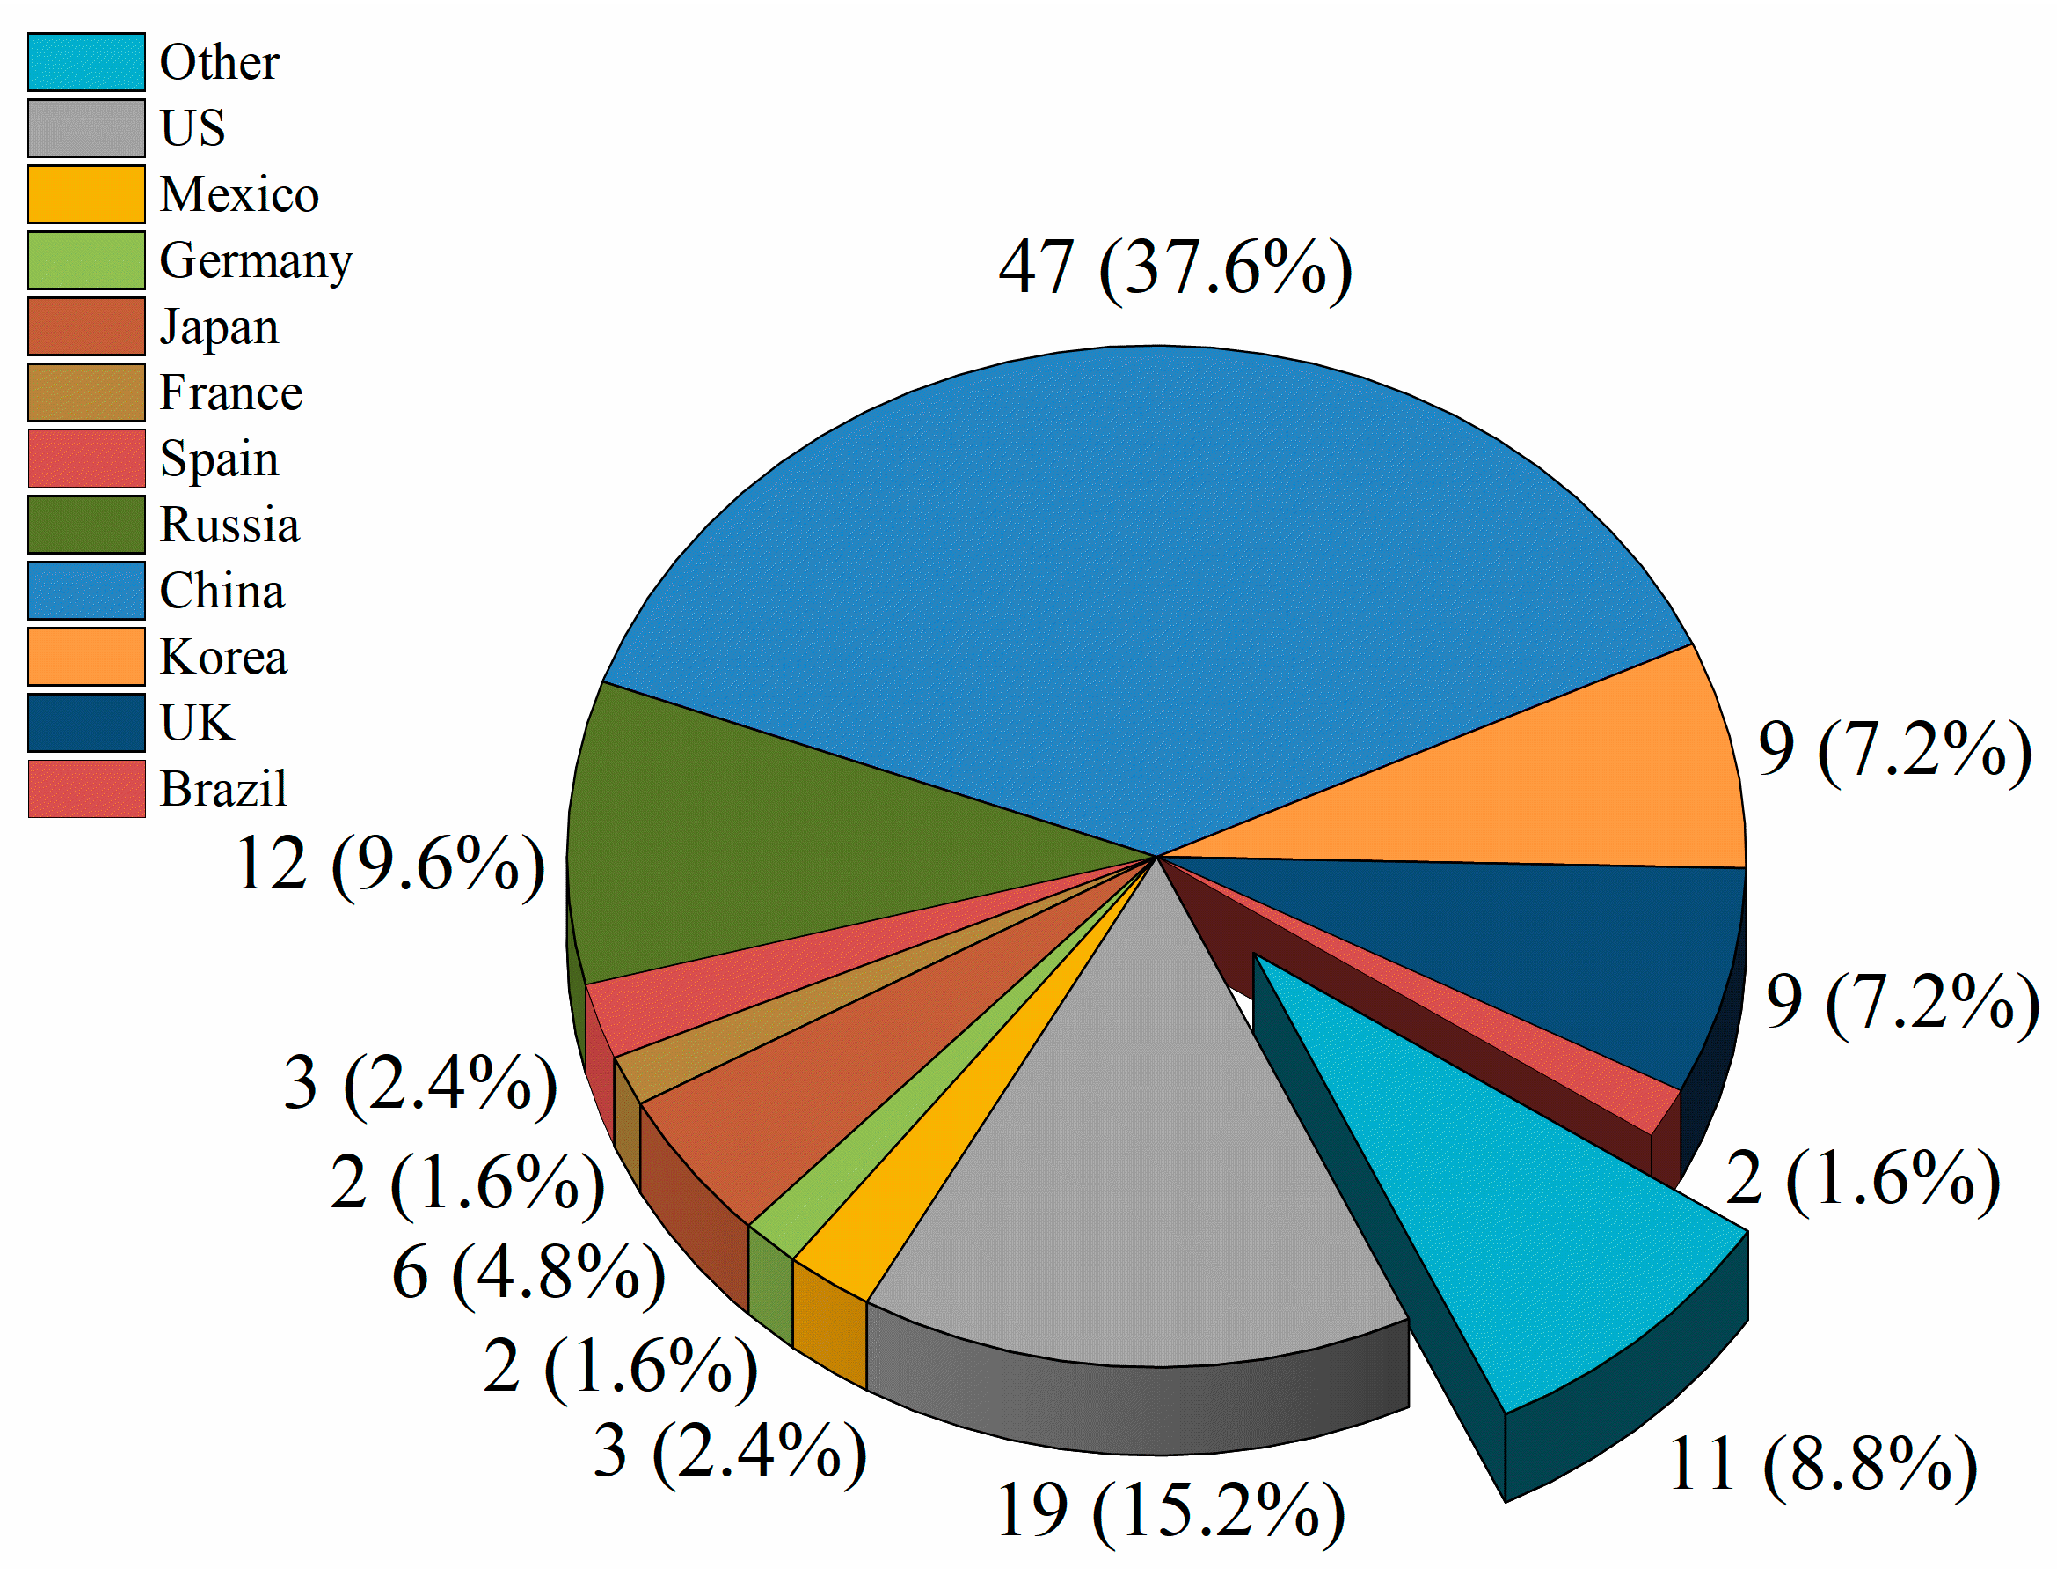
2.1.1. Subway Operation Accident Case Collection
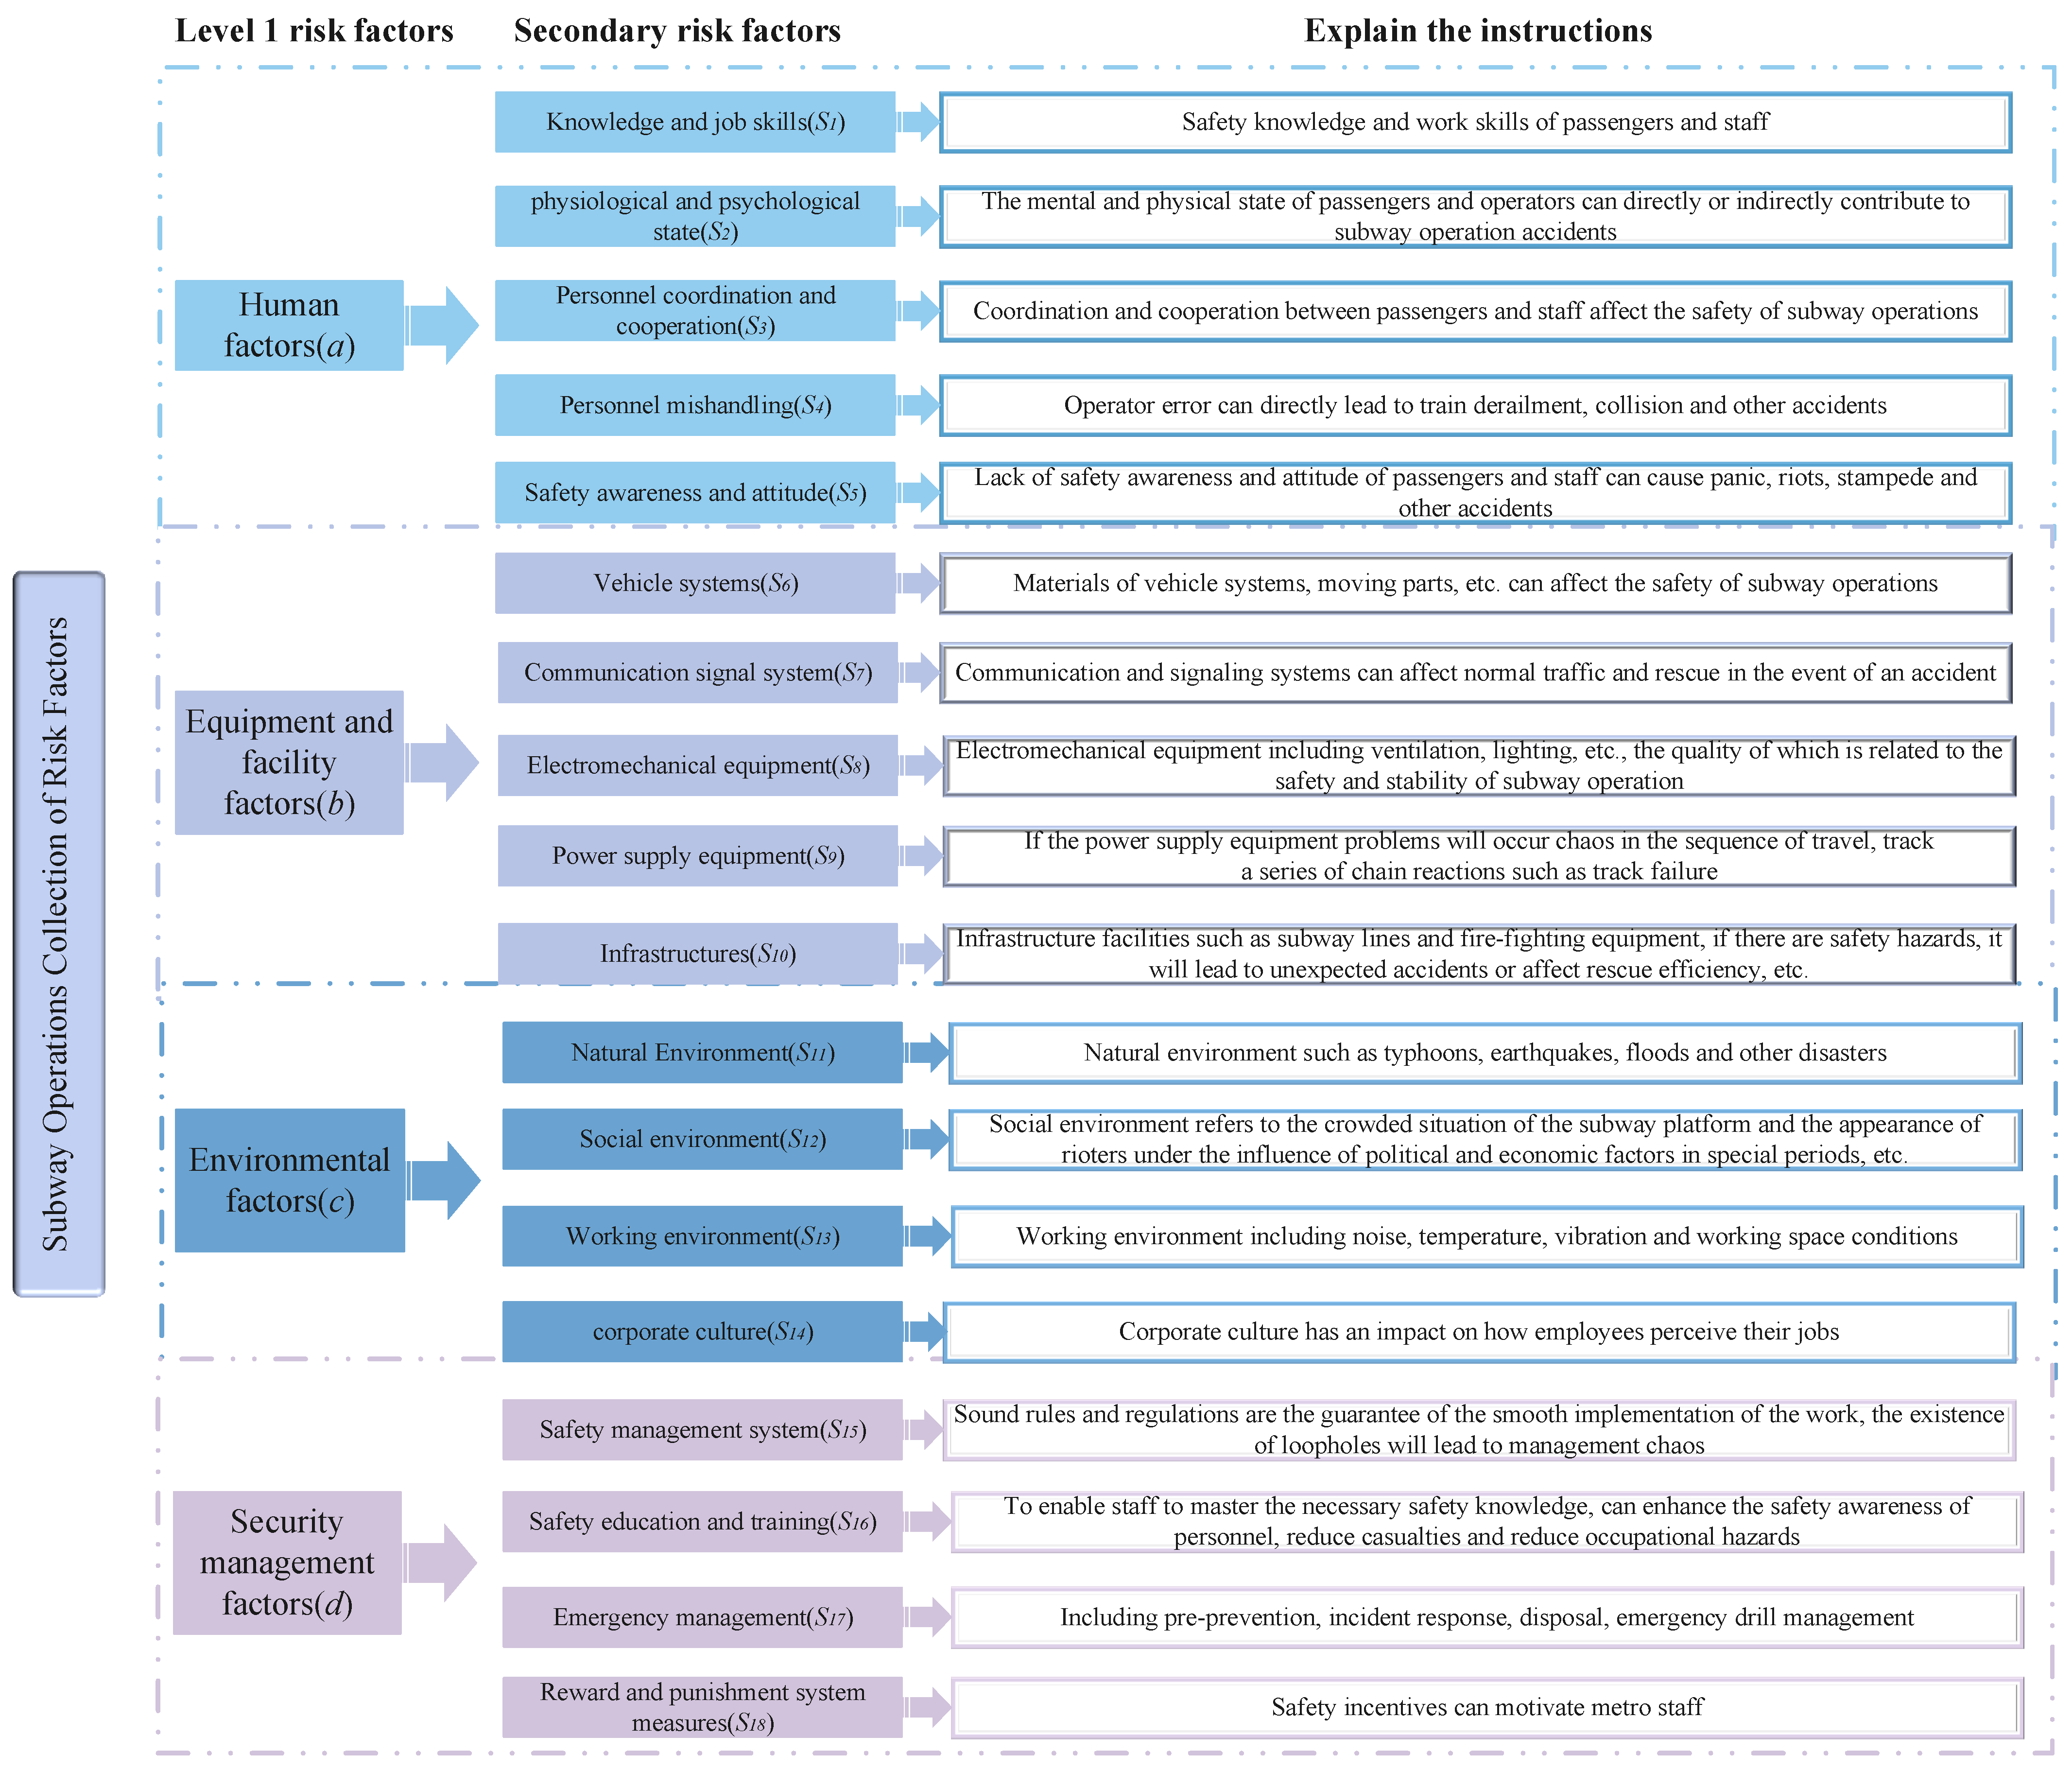
2.1.2. Identification of Safety Risk Factors for Metro Operations
- Personnel (a) risk factors, where the secondary risk factors are knowledge and job skills (S1), physiological and psychological state (S2), personnel coordination and cooperation (S3), personnel mishandling (S4) and safety awareness and attitude (S5). Personnel is divided into staff and passengers, and the process of subway operation requires staff control, so the unsafe behavior of staff may lead to accidents, which can be divided into individual unsafe behavior and non-individual unsafe behavior, that is, the risk arising from the cooperation of workers with each other, mainly: driver operating errors, dispatcher improper command, security personnel fatigue, station service The main risks are: driver’s error, dispatcher’s misconduct, security personnel’s fatigue, station staff’s negligence, etc. Passengers are an important factor in subway operation, and the risks caused by passengers’ lack of safety awareness include trampling behavior under heavy passenger flow, suicide by jumping on the rail, man-made arson, etc.
- Equipment and facilities (b) risk factors, including secondary risk factors for the vehicle system (S6), communication signal system (S7), electromechanical equipment (S8), power supply equipment (S9), and infrastructures (S10). The safety of metro operations is positively related to the reliability, degree of wear and tear, and maintenance level of equipment and facilities. The systems that constitute metro equipment and facilities are vehicle systems, communication signal systems, electromechanical equipment, infrastructure facilities, power supply system, etc. The common risks caused by equipment and facility factors are signal failure, vehicle failure, power outage, line short circuits, etc.
- Environmental factors (c) risk. The secondary risk factors are the natural environment (S11), social environment (S12), work environment (S13), and corporate culture (S14). The environment is divided into the external environment and internal environment; the external environment mainly includes the natural environment and social environment; the natural environment includes earthquakes, floods, typhoons, etc., and the social environment refers to the crowded situation of passengers boarding and alighting from the bus with a surge in passenger flow and the emergence of rioters under the influence of political and economic factors in special periods, etc.; the internal environment includes the work environment and corporate culture, the work environment includes noise, temperature, vibration, and workspace conditions, the corporate culture will make employees perceive the work. Corporate culture will make the employees’ perception of their work have an impact.
- Safety management (d) factors risk. The secondary risk factors are the safety management system (S15), safety education and training (S16), emergency management (S17), and reward and punishment system measures (S18). Safety management directly affects the safety status of the subway operation period. The factors affecting safety management are mainly: safety education and training of subway staff, the degree of perfection of the safety management system, emergency rescue management and evacuation drills, safety incentive mechanism, etc.
2.2. Model Overview and Coupling
2.2.1. Fuzzy DEMATEL-ISM Overview
2.2.2. Overview of the N-K Model
2.2.3. Coupling of Integrated Fuzzy DEMATEL-ISM-NK Models
2.3. Analysis of Risk Factors of Metro Operation Based on Fuzzy DEMATEL-ISM Model
2.3.1. Construction of a Comprehensive Impact Matrix of Risk Factors
- Construct the initial direct influence matrix D. The secondary risk factors of subway operation accidents were identified through literature research and the above risk identification as S1, S2, S3, …, and S18. To evaluate the degree of influence between risk factors, the authors conducted questionnaires or telephone interviews with senior engineers engaged in the metro operation industry, university teachers, and experts studying the field of metro operation safety; the expert group information is shown in Table 1, based on experience and professional perception of the relationship between the two influencing factors using the 0 (no influence), 1 (very low influence), 2 (low influence), 3 (high influence), 4 (very high influence). According to the scoring of the expert group, it was found that during the metro operation period, the operation manager paid more attention to both equipment and facilities (b) and safety management (d), among which vehicle system (S6), safety education and training (S16) and emergency management (S17) were more important. The academic group, on the other hand, paid more attention to the risk of personnel (a) factors, among which physiological and psychological state (S2), misuse (S4), and safety awareness and attitude (S5) received greater attention. Meanwhile, both academic and management groups paid more attention to the influence of environmental factors (c) on the safety of metro operations, such as social environment (S12) and work environment (S13).
- 2.
- 3.
- Construct the standardized, clear direct influence matrix G. Firstly, the clear, direct influence matrix F is constructed and defuzzified using the center of gravity method, and the triangular fuzzy number is expressed by Ai = (mi, ni, ri) [41], which is calculated as expressed in Equation (2), and the expert-rated clear values are calculated and shown in Table 2, followed by normalization of the matrix F according to Equation (3) to obtain the standardized matrix G.
- 4.
- Construct the combined influence matrix R. The combined influence matrix R indicates the degree of the combined influence of one factor on another factor and is calculated according to Equation (4) as shown in Table 3.
- 5.
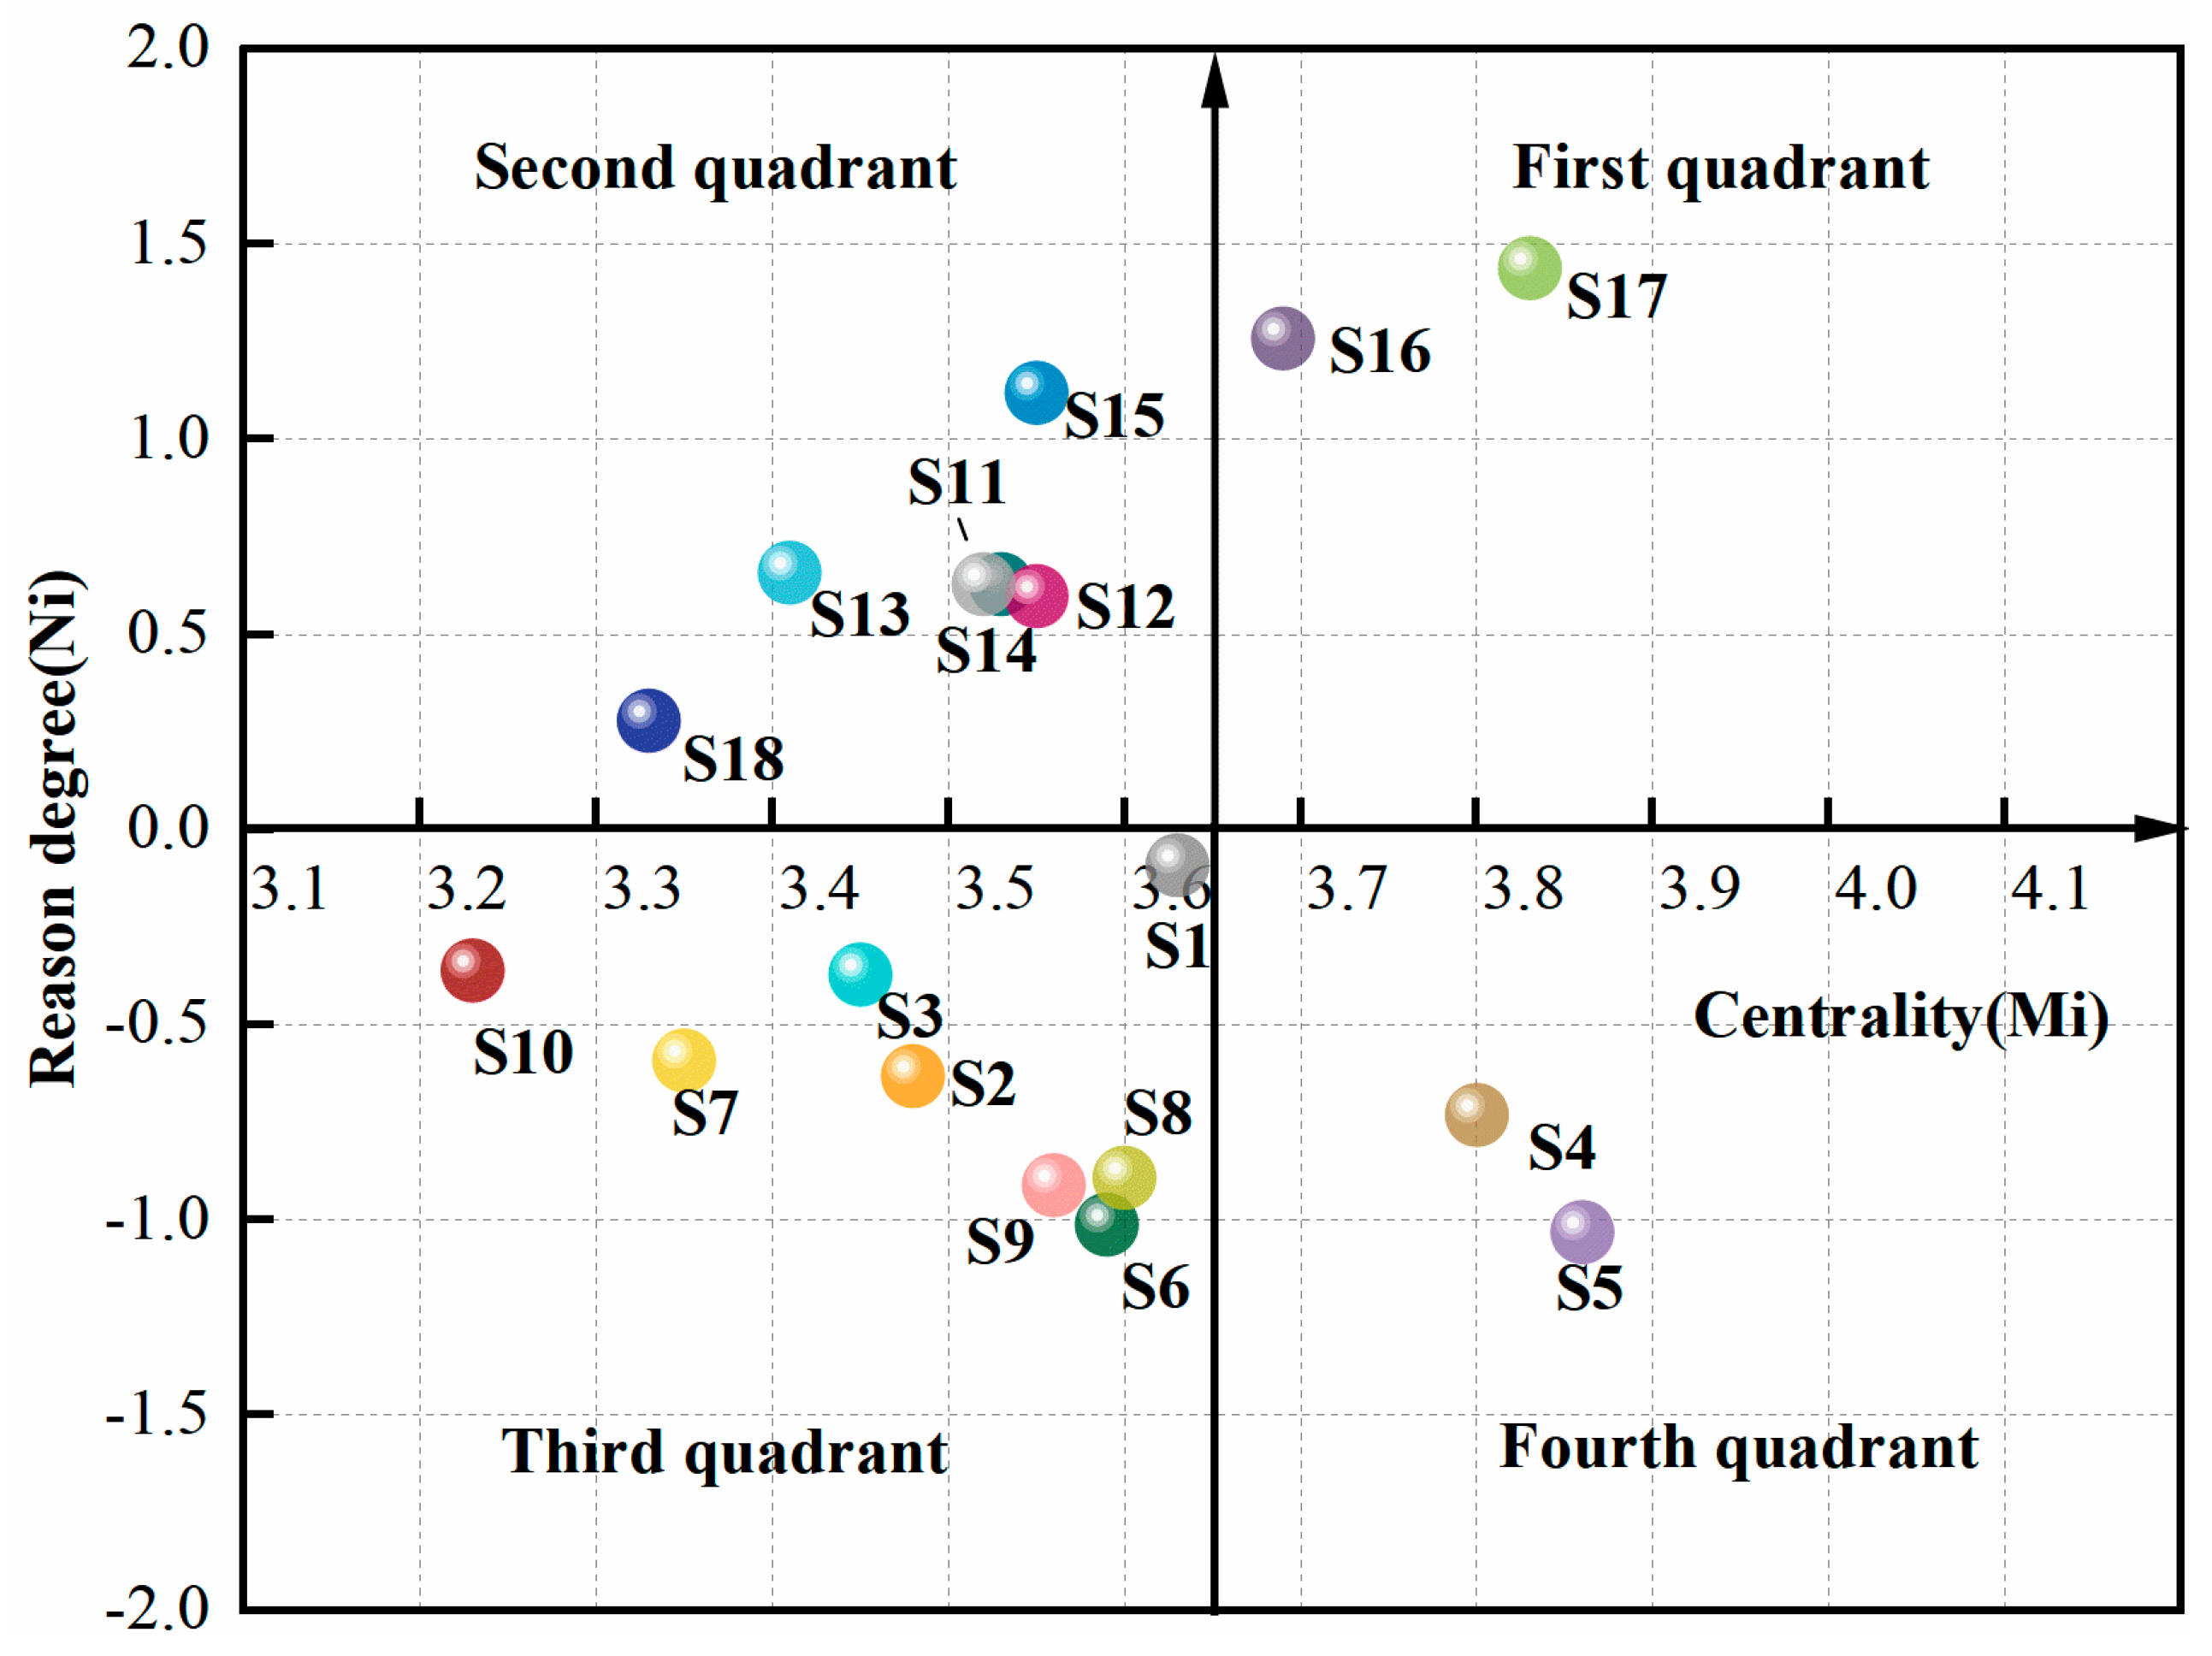
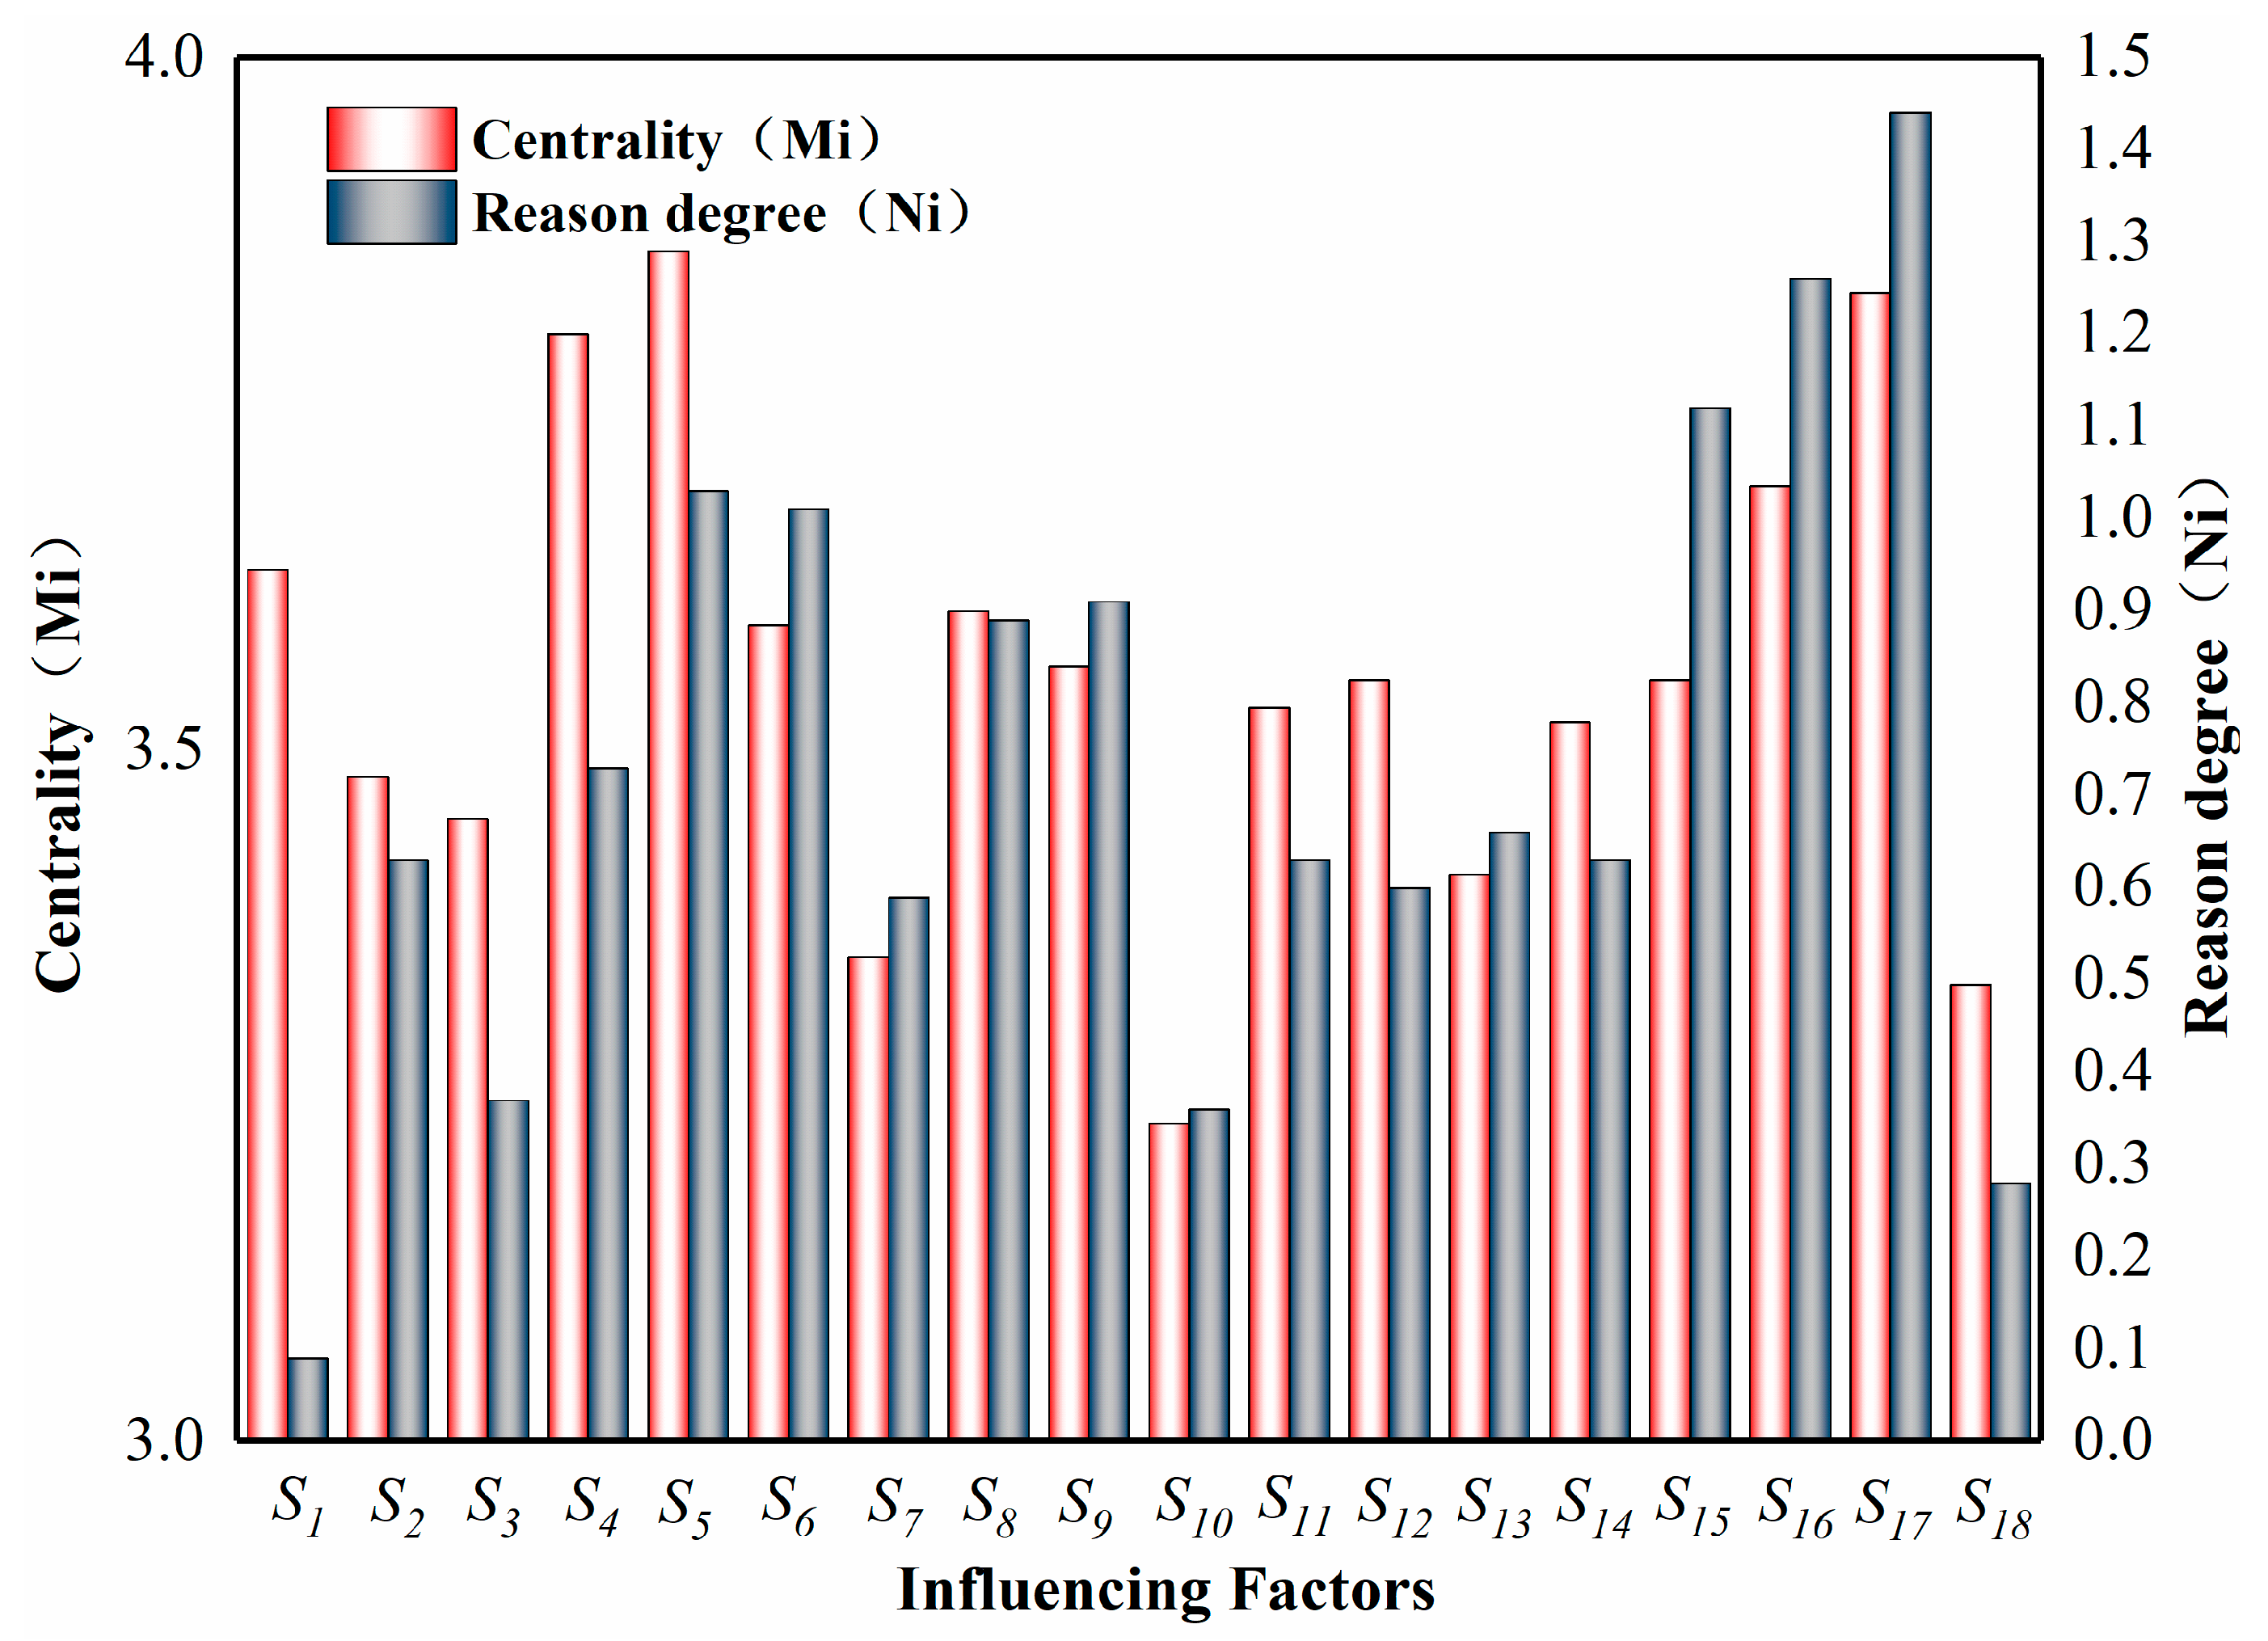
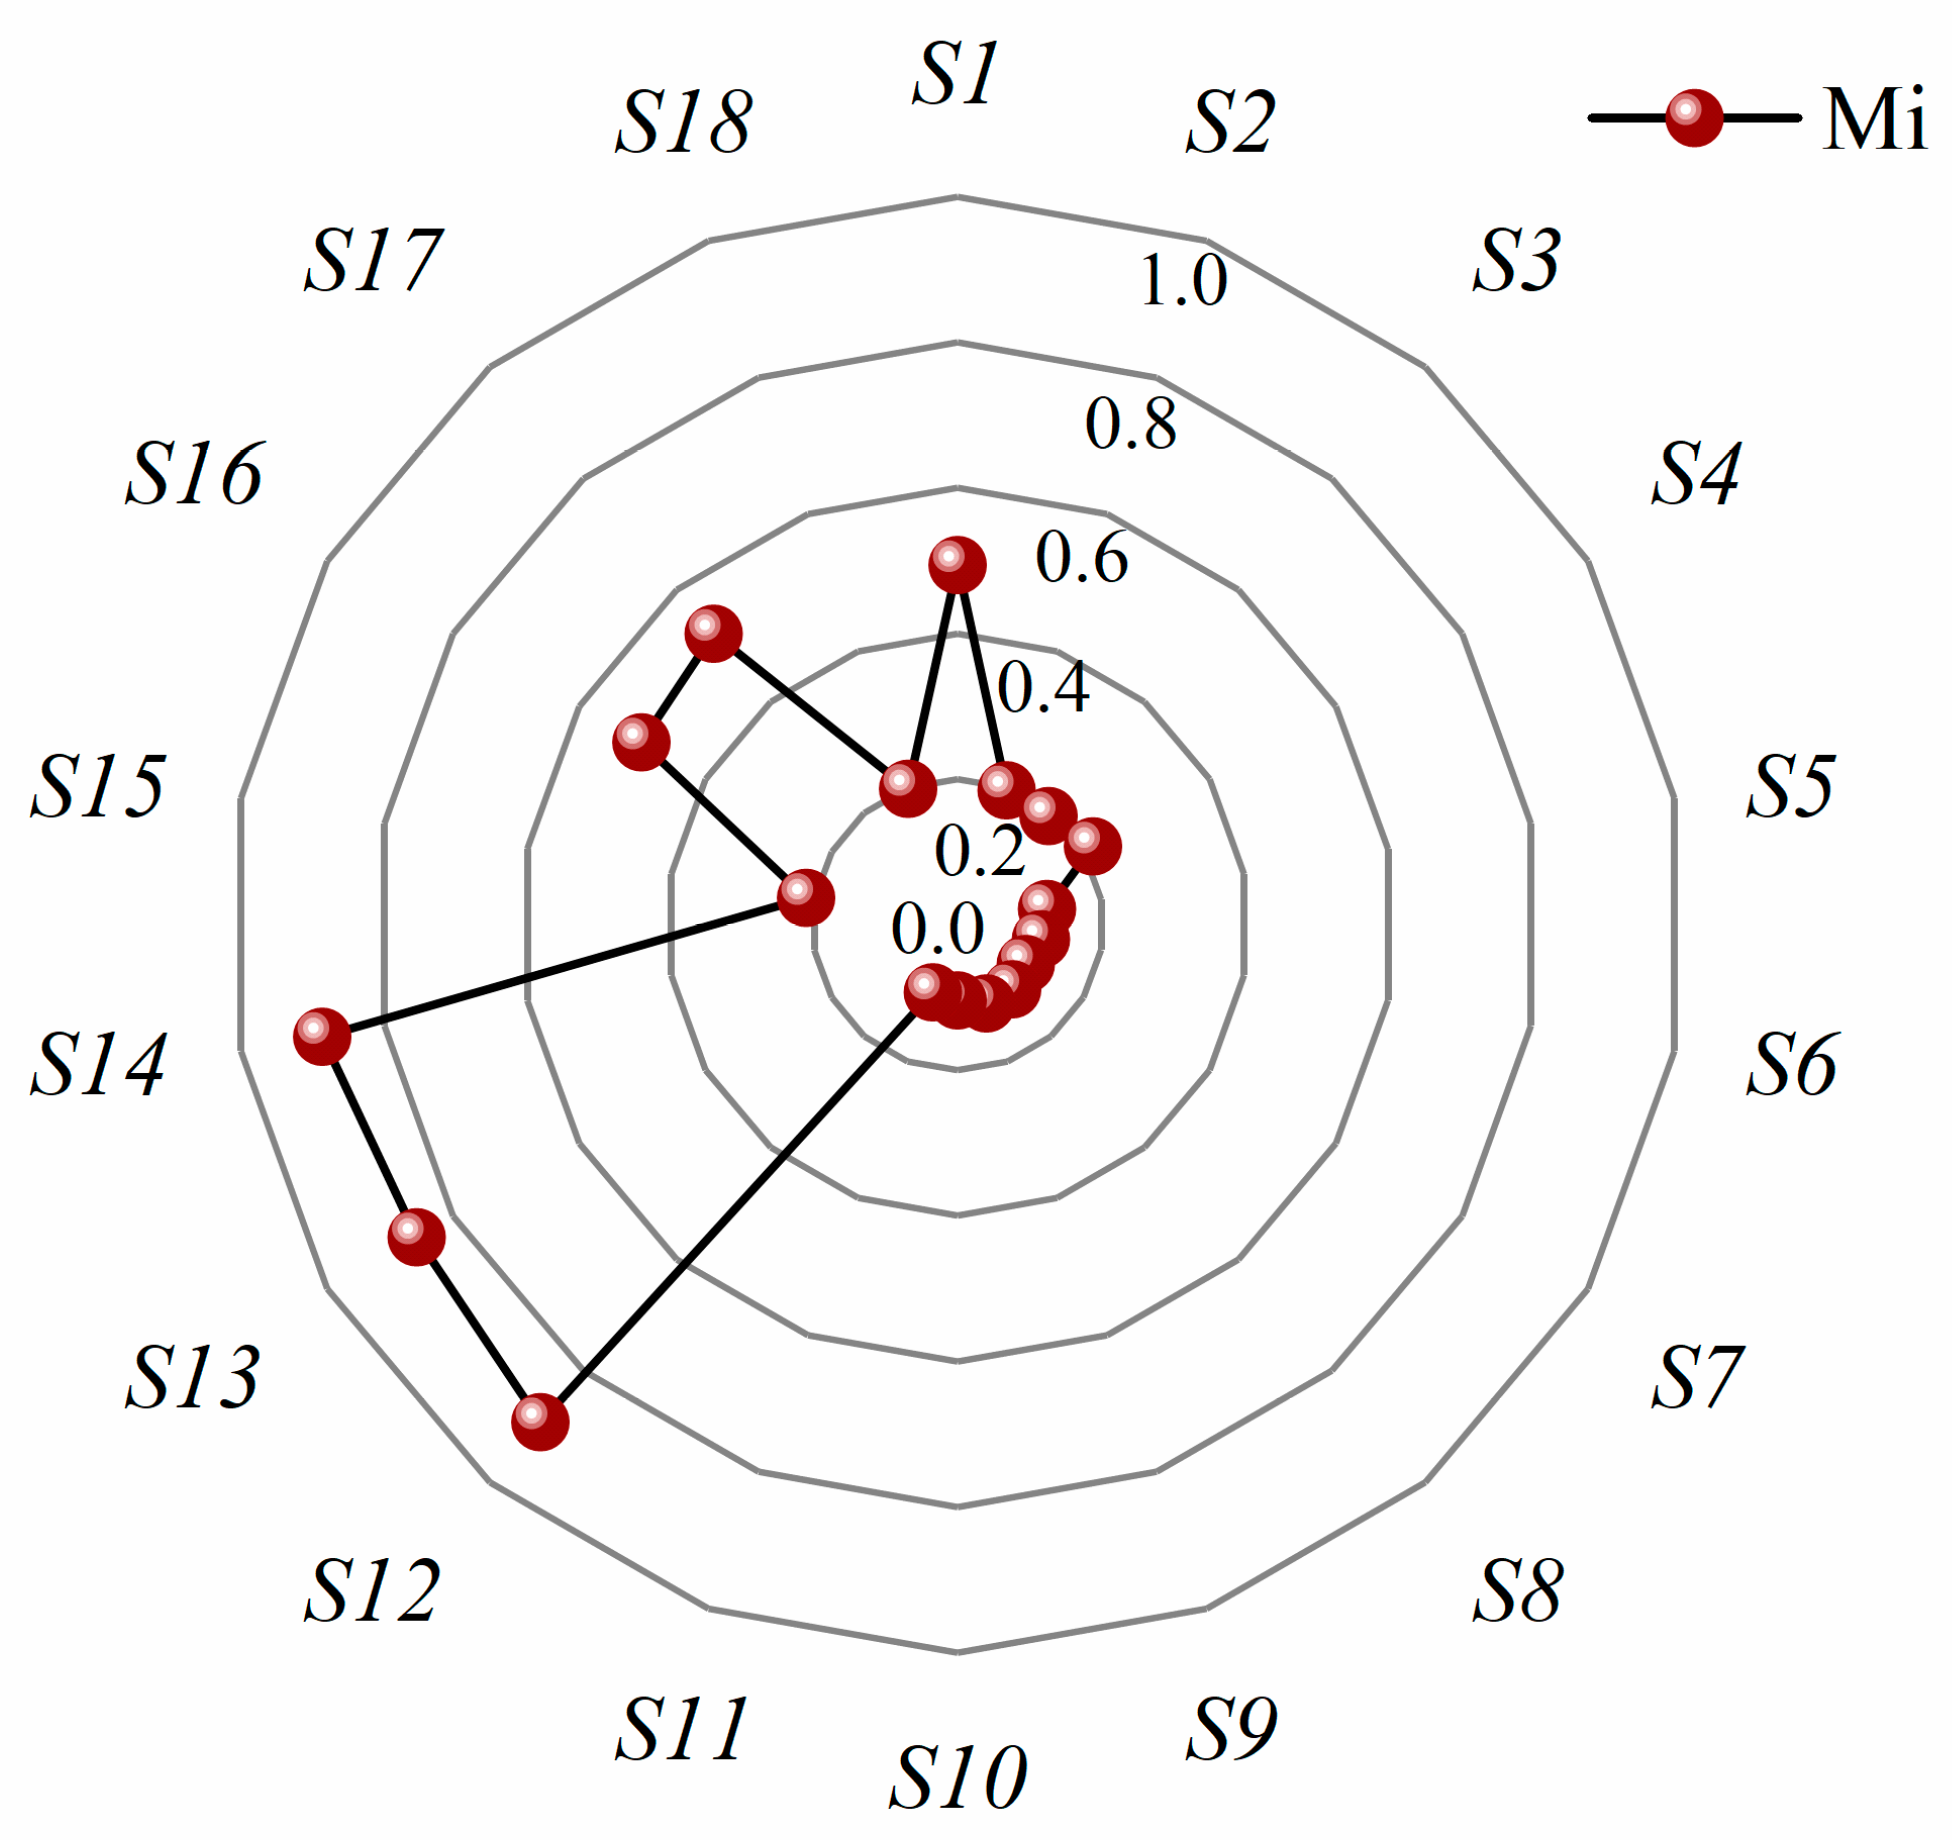
- Calculate the influence degree Ji, the influenced degree Li, the centrality degree Mi and the cause degree Ni of each factor using the integrated influence matrix R. The influence degree is the sum of the corresponding rows in the integrated influence matrix, and the influenced degree is the sum of the corresponding columns in the integrated influence matrix. The centrality indicates the importance of the risk factor in the system, and the higher the centrality, the more important the factor is. The cause degree refers to the net influence of a factor on other factors, and the causal factor and the resulting factor are divided according to the positive and negative values of the cause degree, if Ni > 0, it is the causal factor, which means that the factor is easy to influence other factors; if Ni < 0, it is the resulting factor, which means that the factor is easy to be influenced by other factors, and the calculation formula is as (5)–(8).
2.3.2. Construction of Risk Factor Reachability Matrix
2.4. Building a Coupled Model of Subway Operational Safety Risks
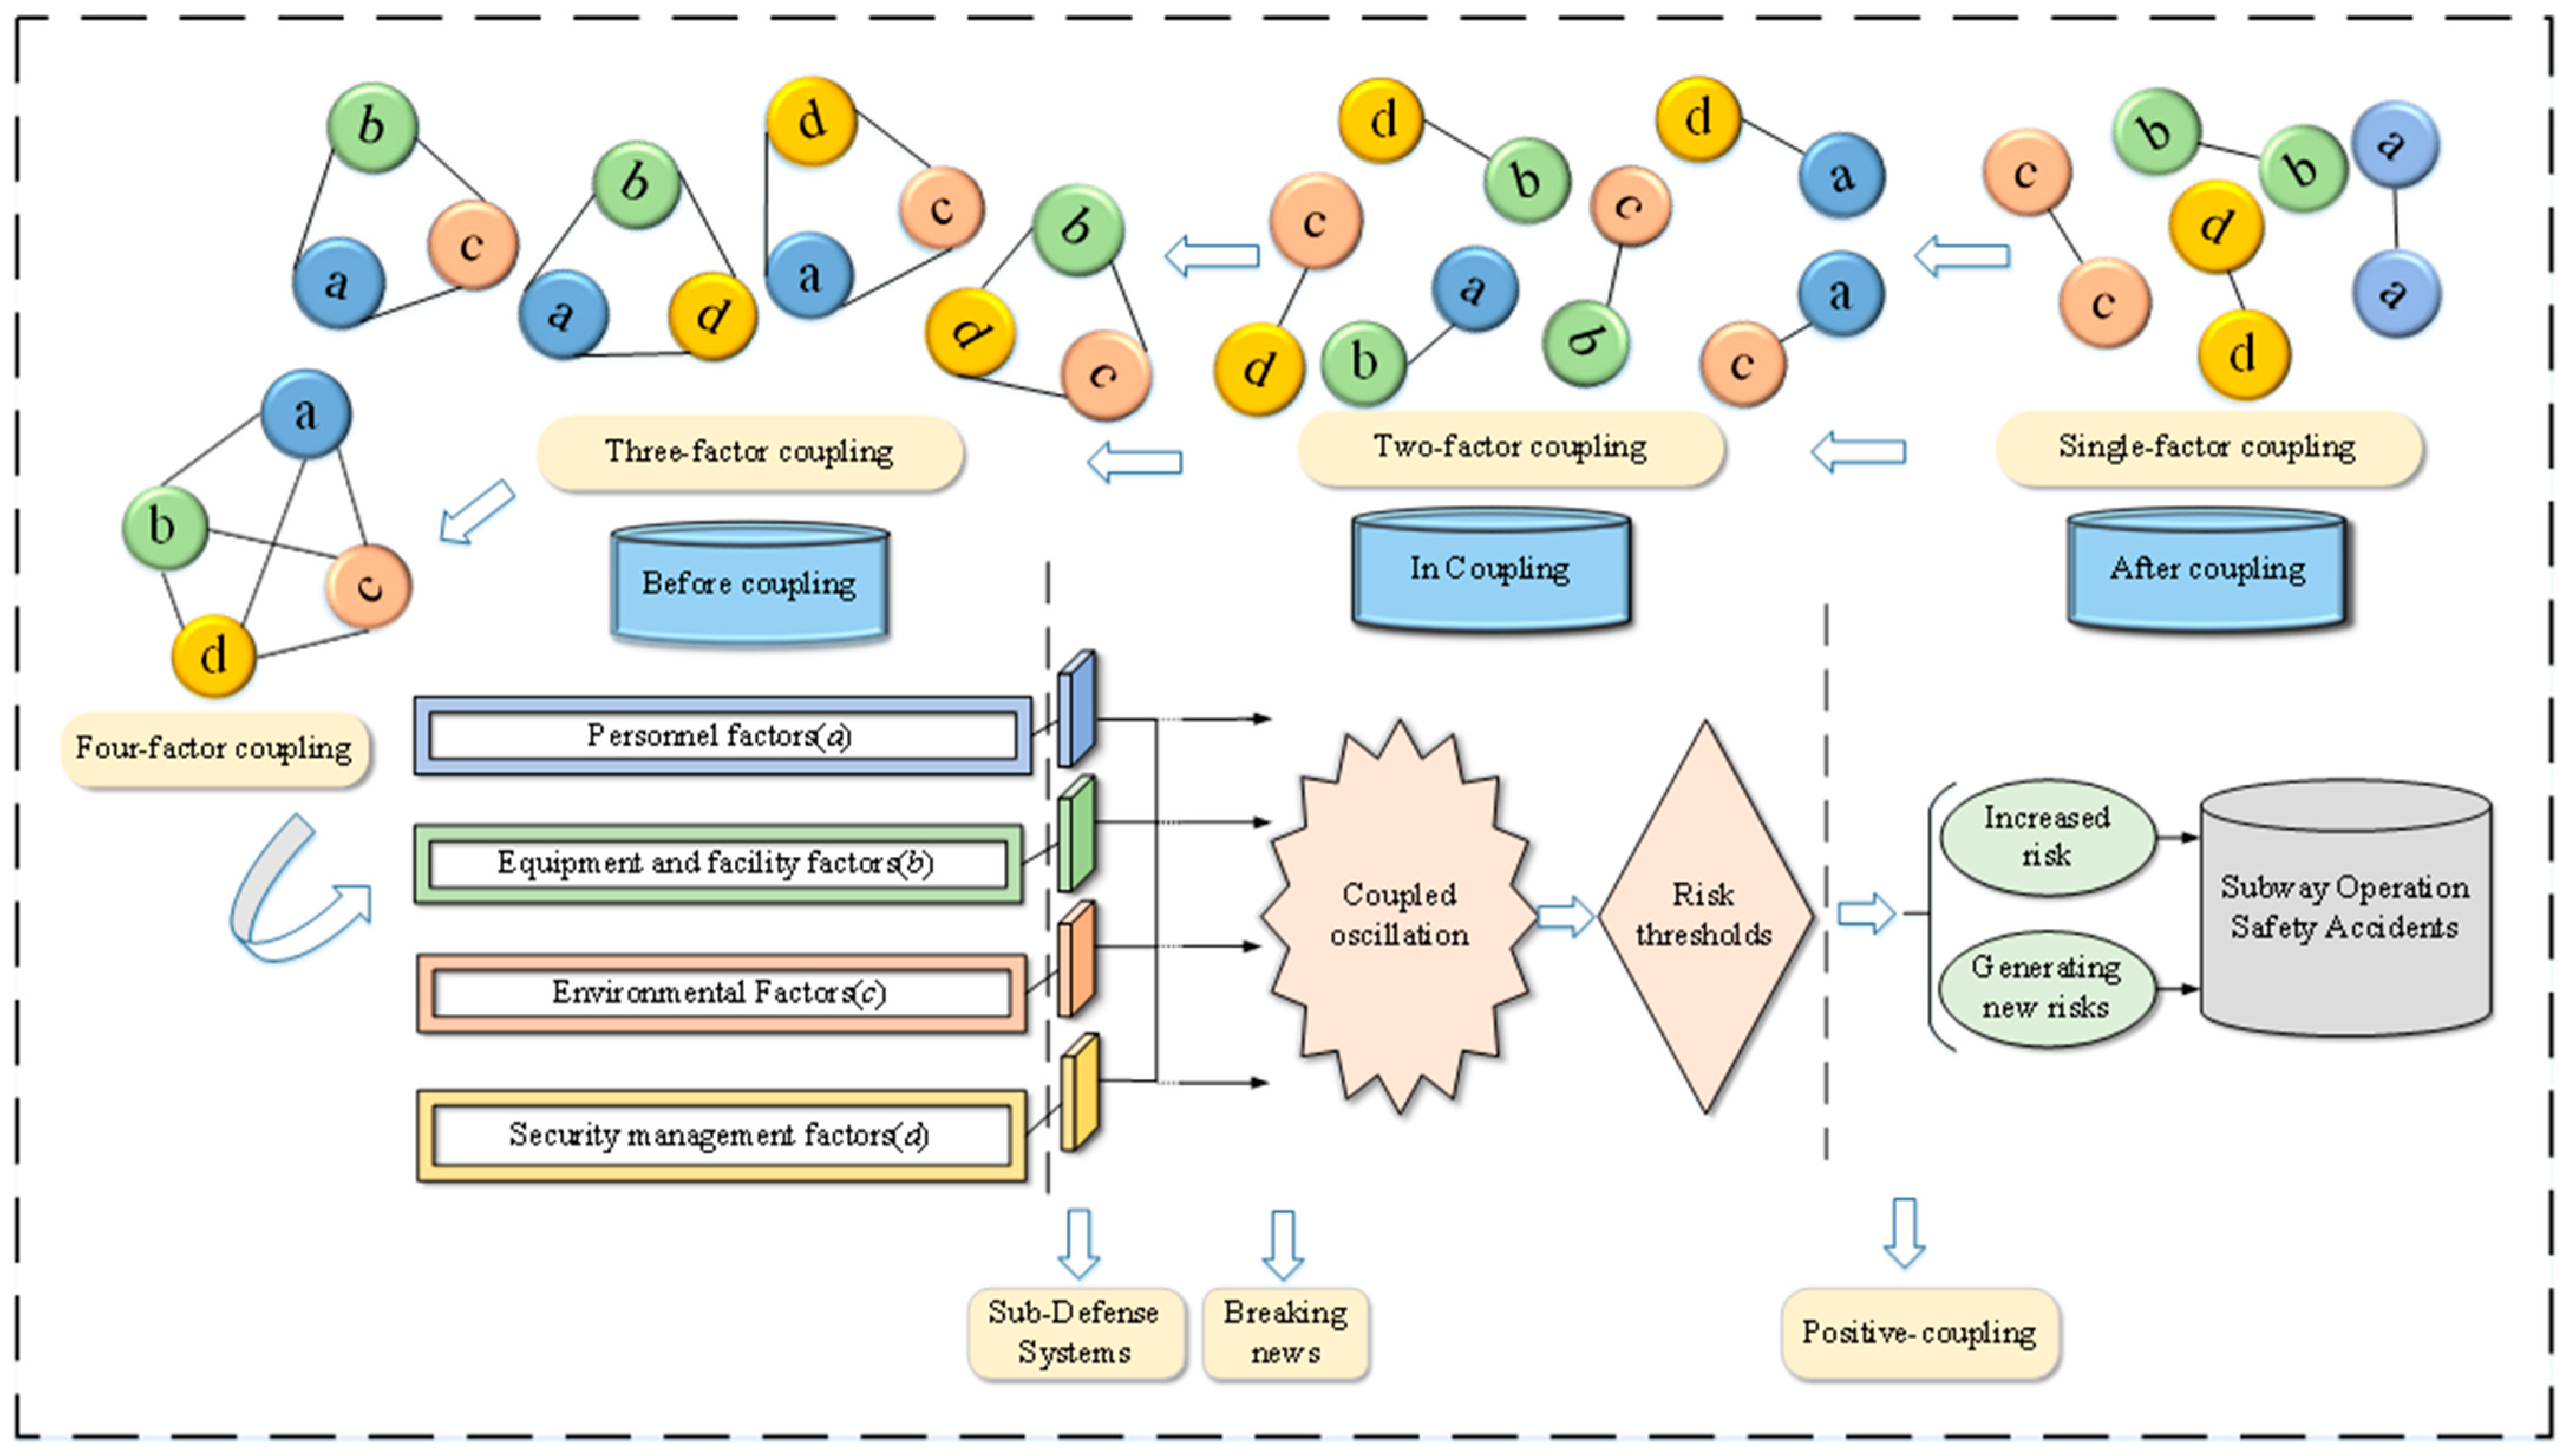
2.4.1. Subway Operation Safety Risk Coupling Mechanism and Interaction Scenarios
- Single-factor risk coupling. Individual risk factors affecting metro operations contain many risk factors, and a certain number of single-factor risk factors interacting with each other may lead to the occurrence of metro operation accidents. Single-factor coupled risk includes personnel factor-coupled risk, equipment, and facility factor-coupled risk, environmental factor-coupled risk, and safety-management factor-coupled risk, which are recorded as T11(a), T12(b), T13(c), T14(d), and the total value of coupled risk is recorded as T1.
- Two-factor risk coupling. Two-factor coupling refers to the interaction and influence between 2 different types of risk factors affecting metro operation. Two-factor coupling risk includes: personnel-equipment and facilities factors coupling risk, personnel-environmental factors coupling risk, personnel-safety-management factors coupling risk, equipment, and facilities-environmental factors coupling risk, equipment and facilities-safety-management factors coupling risk, and environmental-safety-management factors coupling risk, respectively recorded as T21(a, b), T22(a, c), T23(a, d), T24(b, c), T25(b, d), T26(c, d), and the total value of coupled risk is recorded as T2.
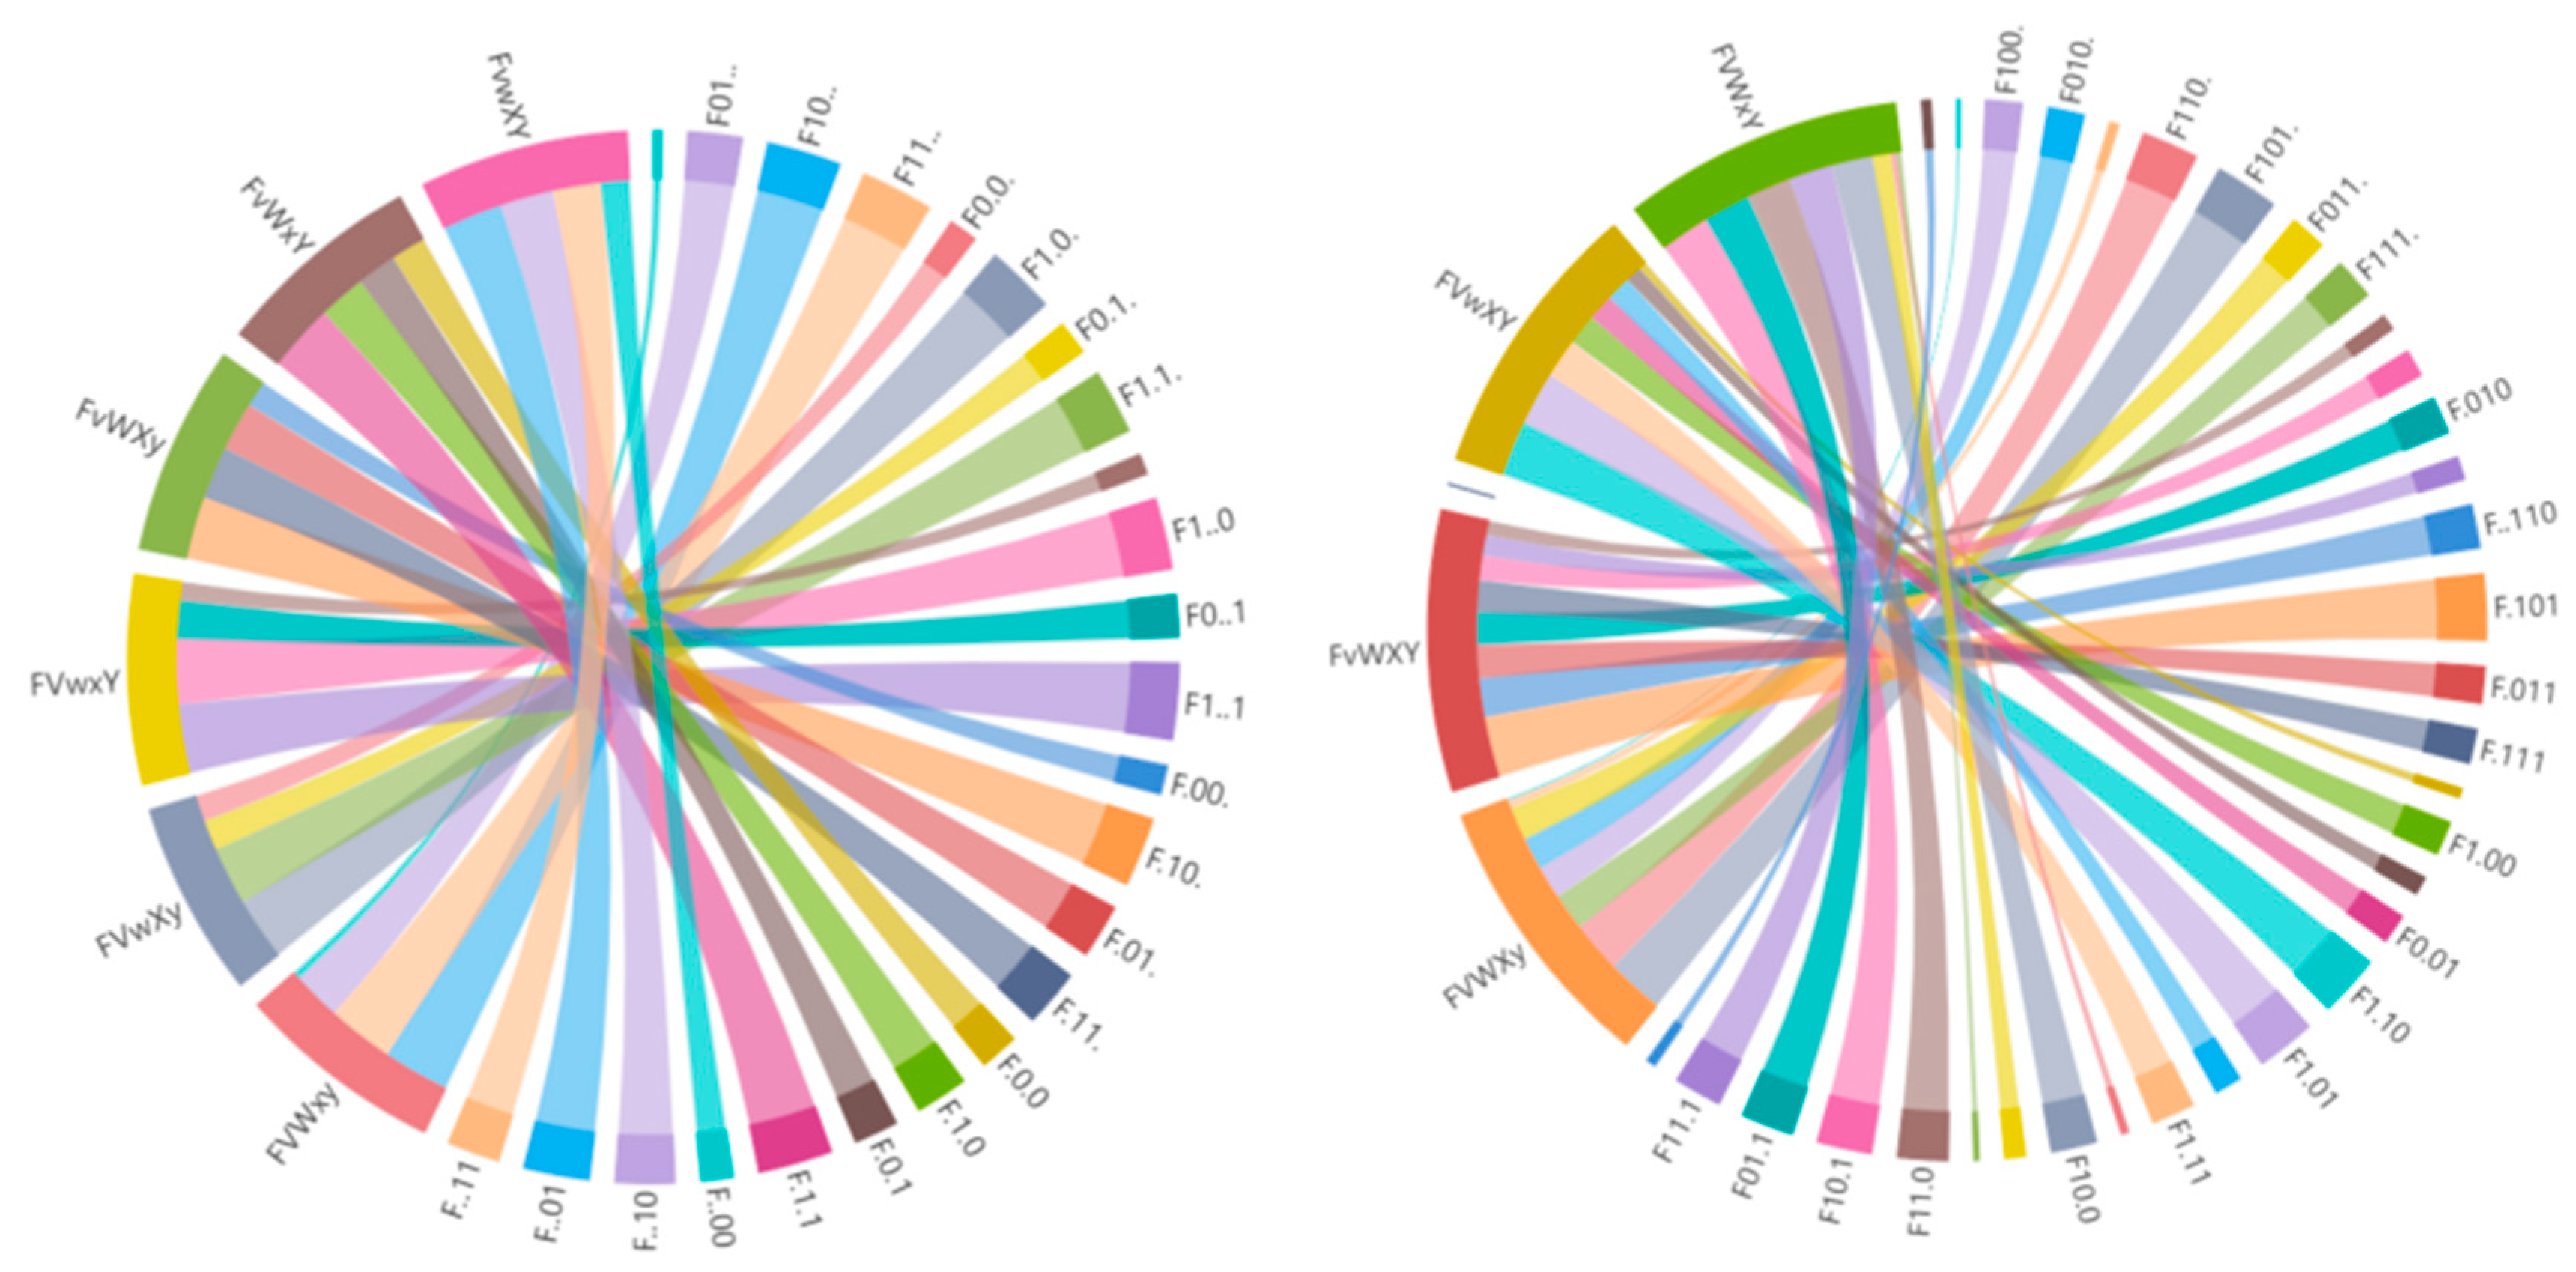
- Multi-factor risk coupling. Multi-factor coupling refers to the interaction and influence between 3 and more risk factors that affect metro operation. Multi-factor coupling risk includes personnel-equipment and facilities-environmental factors coupling risk, personnel-equipment, and facilities-safety-management factors coupling risk, personnel-environment-safety-management factors coupling risk, and equipment and facilities-environment-safety-management factors coupling risk, which are recorded as T31(a, b, c), T32(a, b, d), T33(a, c, d) and T34(b, c, d), respectively. The total value of coupled risk is recorded as T3. Four factors of personnel-equipment, and facilities-environment-safety-management factors, coupled risk value are recorded as T41(a, b, c, d), and the total value of coupled risk is recorded as T4. The risk coupling relationship is shown in Figure 6.
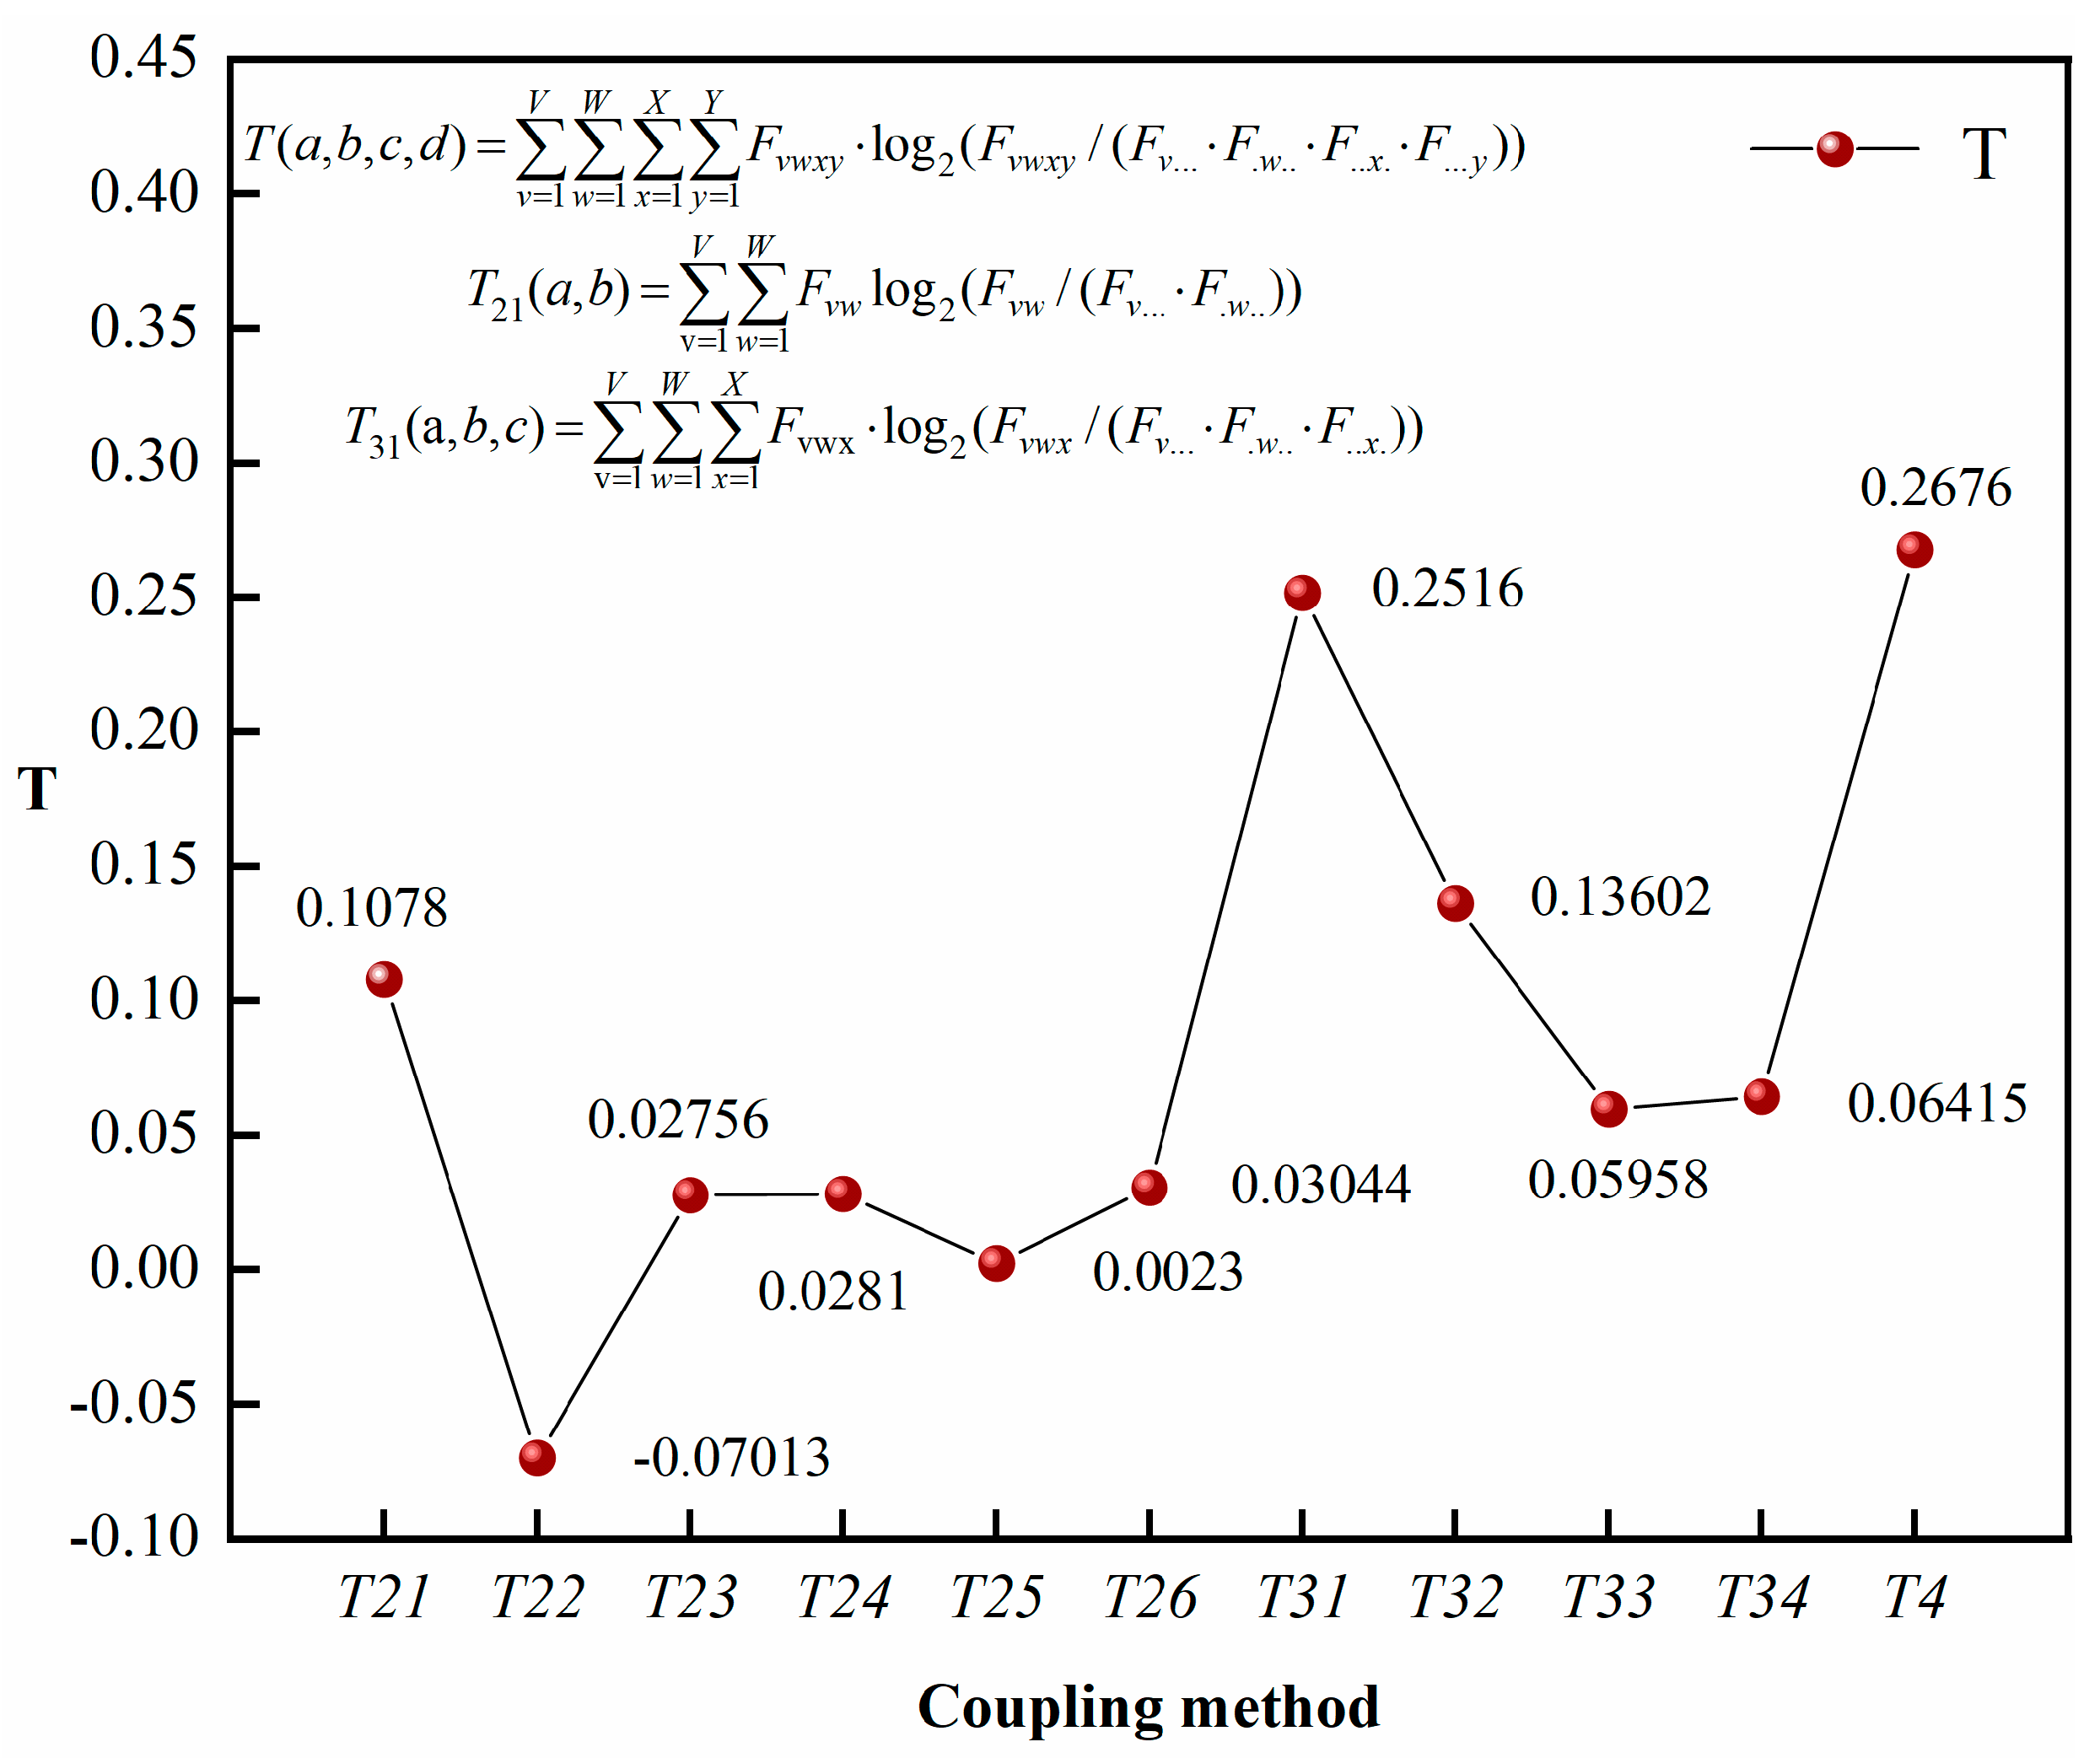
2.4.2. Determine the Formula of Coupled Information Interaction for Metro Operation Risk
2.4.3. Risk Coupling Calculation
3. Results
3.1. Analysis of the Results of the Fuzzy DEMATEL-ISM Model for Subway Operation Risk Factors
3.1.1. Risk Factor Analysis
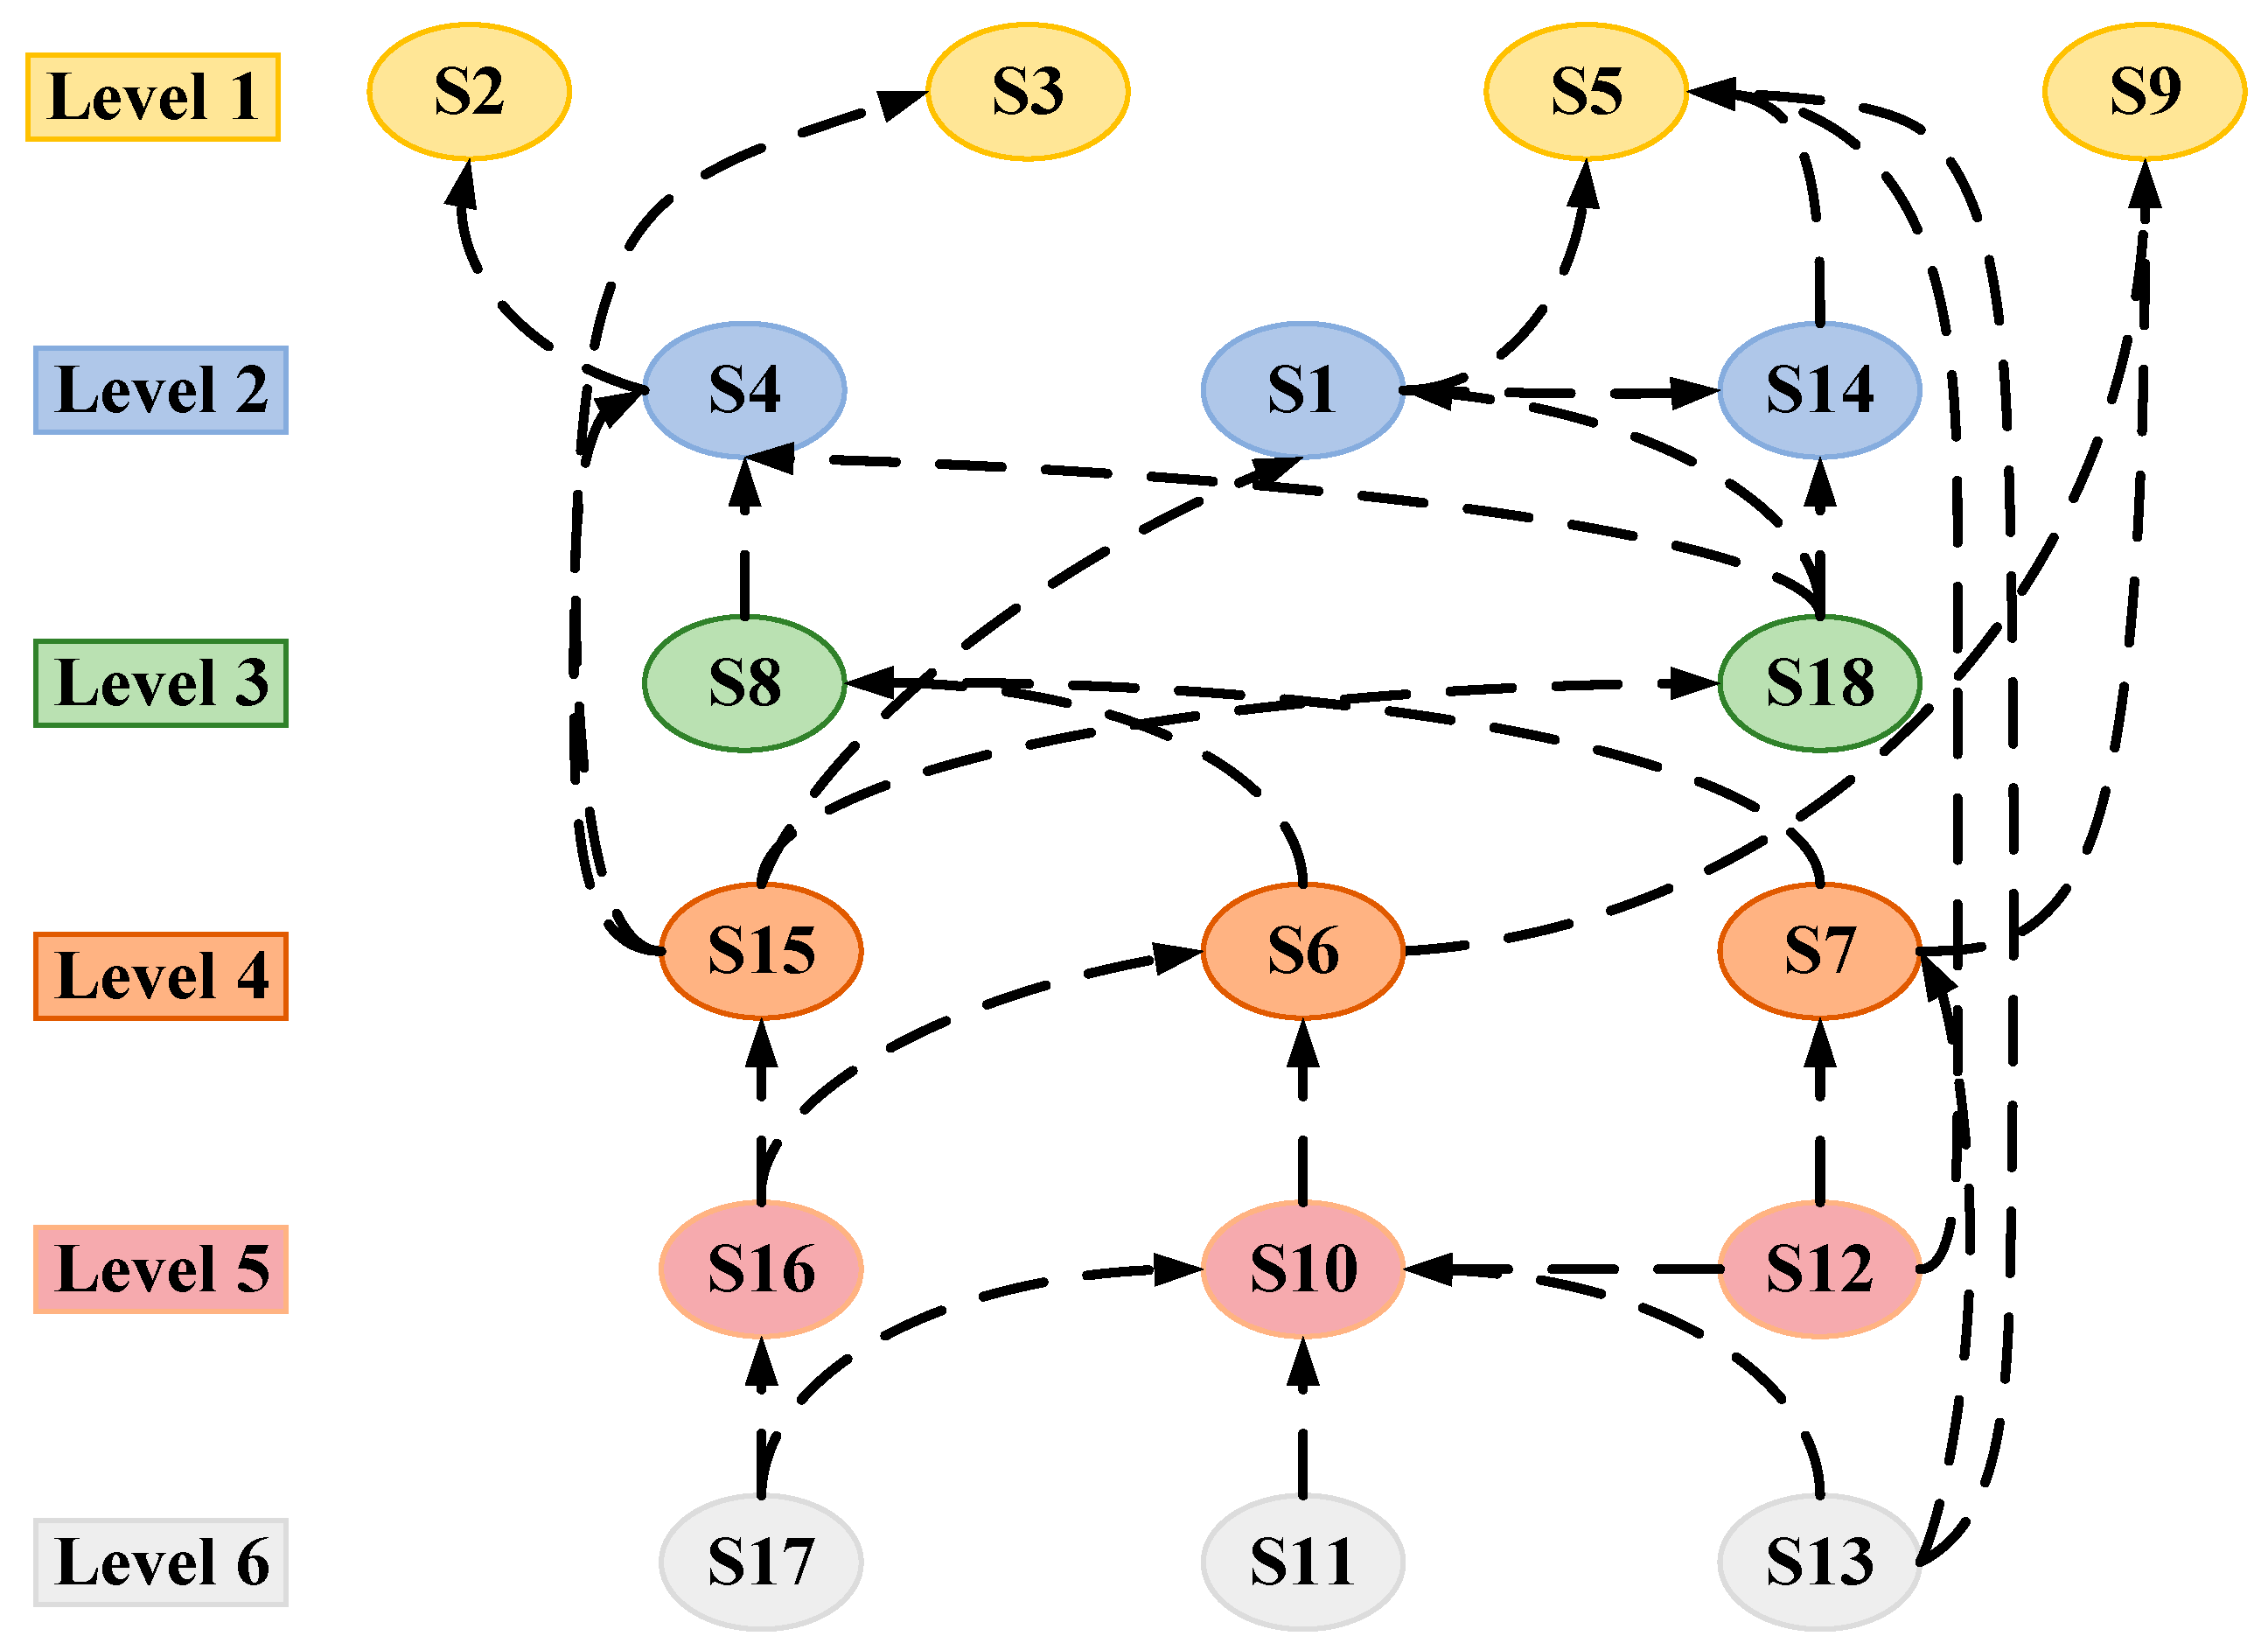
3.1.2. Hierarchy Analysis
3.2. N-K Model Calculation Results from Analysis
4. Analysis and Discussion of Model Result Correction
5. Conclusions and Future Research
- Based on the analysis results of the fuzzy DEMATEL-ISM model, it can be seen that among the 18 risk factors affecting the safety of subway operation, 4 factors, such as physiological and psychological state, safety awareness, and attitude are direct influencing factors, 3 factors such as natural environment and emergency management are deep influencing factors, and 11 factors such as knowledge and work skills are indirect causes of subway operation accidents. Seven factors, such as emergency management and safety education and training, have high centrality and are key influencing factors. Avoiding the occurrence of these risk factors can effectively cut off the connection of the risk network and avoid the formation of risk in the metro operation system.
- Based on the calculation results of the N-K model, it can be seen that the number of risk factors involved in coupling in the risk system of subway operation is proportional to the risk coupling value, and avoiding multiple factors involved in coupling is an effective means to reduce the occurrence of subway operation accidents. When checking risk factors, managers should also check other risk factors while avoiding single-factor coupling, and in the risk coupling of subway operation accidents, personnel and equipment, and facilities risk factors are key coupling factors, so they should give full play to the human initiative, strengthen safety education and training for staff, overhaul and monitoring of equipment and facilities, and timely deal with various hidden dangers encountered, and also monitor the environment in real-time. Real-time monitoring reduces the frequency of subway operation accidents.
- Based on the revised analysis results, it can be seen that six factors, such as emergency management and social environment, are the key risk factors in subway operation accidents, and the key risk factors that change more after the revision are personnel and equipment and facilities factors under the influence of high effectiveness factors (such as environmental factors), and considering from the perspective of system risk coupling, the coupling ability of environmental factors to induce risk is prominent and uncertain, for this reason, the subway should be improved system’s ability to respond to severe weather or adverse environmental emergency response, and Metro should also establish a good corporate culture and provide a good working environment to avoid the occurrence of subway operation accidents.
- The fuzzy DEMATEL-ISM model constructs a visualized multi-factor recursive structure model among the risk factors of metro operation, and the N-K model reveals the coupling degree of risk factors under different coupling types. The coupling of the integrated fuzzy DEMATEL-ISM-NK model is more suitable for describing the complex coupling interactions among risk factors during metro operation and identifying and analyzing key risk factors, which provides a theoretical basis for managers and decision-makers to formulate accident prevention measures and policies during metro operation.
- In this paper, the integrated fuzzy DEMATEL-ISM-NK model is used to explore the key risk factors and multi-factor risk coupling mechanism of subway operation accidents, and the findings are consistent with reality, so this method can be extended to future research in different fields. However, similar to other studies, this paper faces some limitations, such as constructing the set of subway operation safety risk factors with only 18 secondary risk factors considered, which is not exhaustive, and more studies should be conducted to refine the risk factors. Meanwhile, in the fuzzy DEMATEL model, in addition to using the triangular fuzzy affiliation function to convert the fuzzy semantic terms into specific values, other fuzzy affiliation functions can also be obtained, and subsequent studies can focus on this aspect to find a more suitable mathematical model for the research object and improve the accuracy of the research results.
Author Contributions
Funding
Institutional Review Board Statement
Informed Consent Statement
Data Availability Statement
Conflicts of Interest
Appendix A

| No. | Accident Time | Accident Location | Cause of Accident | Consequences of the Accident |
|---|---|---|---|---|
| 1 | April 1991 | Zurich, Switzerland | Fire | 32 dead and more than 100 injured |
| 2 | June 1991 | Berlin subway | Fire | 18 people were sent to the hospital for emergency treatment |
| 3 | August 1991 | Manhattan, New York City | Train derailment | Five people died and 155 were injured |
| 4 | January 1995 | Japan Subway | Earthquake | Damage to subway stations and subway tunnels |
| 5 | March 1995 | Tokyo Subway, Japan | Terrorist attack, the release of sarin gas | 12 dead, 5500 injured |
| 6 | July 1995 | Paris Metro, France | Bomb explosion | Eight people were killed and 117 were injured |
| 7 | October 1995 | Baku metro, capital of Azerbaijan | Fire | 558 people died and 269 were injured. |
| 8 | January 1996 | Beijing Subway | Power outage | Over 2000 passengers trapped |
| 9 | June 1996 | Moscow Metro, Russia | Terrorist attack | Four people died and seven people were injured |
| 10 | January 1998 | Moscow Metro, Russia | Terrorist attack | 3 people died |
| 11 | May 1999 | Belarus metro stations | Trampling accident | 54 deaths |
| 12 | June 1999 | St. Petersburg Metro Station, Russia | Explosion | 6 deaths |
| 13 | July 1999 | Guangzhou Metro Dongshankou Station | Fire | Direct fire damage of RMB 206,000 |
| 14 | August 1999 | Cologne subway train, Germany | Impact | 67 people were injured, 7 of them seriously |
| 15 | October 1999 | Seoul Subway | Fire | 55 deaths |
| 16 | November 1999 | Beijing Metro Fubax Line | Flooding | Personnel casualties |
| 17 | March 2000 | Nakameguro Station, Japan | Train derailment | 5 dead, 60 injured |
| 18 | April 2000 | Washington Metro | Fire | More than 10 people were injured |
| 19 | June 2000 | US subway from Brooklyn to Manhattan | Train derailment | 89 people were injured |
| 20 | August 2000 | Pushkin Station, Moscow | Terrorist attack | Thirteen people died and more than 90 were injured |
| 21 | November 2000 | Saarzburg metro, Austria | Fire | 155 people died and 18 were injured. |
| 22 | February 2001 | Moscow Belarusian Station | Bomb explosion | 15 people were injured |
| 23 | December 2001 | Beijing Subway Line 1 | Passenger fall | One person died |
| 24 | August 2001 | London Underground | Explosion | 6 people were injured |
| 25 | August 2001 | São Paulo Metro, Brazil | Fire | One person died and 27 people were injured |
| 26 | September 2001 | Taipei Metro | Typhoon Lily | Some subway lines were shut down for six months, leaving hundreds of thousands of people without transportation. |
| 27 | Dec. 2001 | Shanghai Metro People’s Square Station | Passenger fall | One death |
| 28 | January 2003 | London Underground Central Line | Train derailment | 32 people were injured |
| 29 | January 2003 | Sydney Metro | Train derailment | Personnel casualties |
| 30 | February 2003 | Korea Metro Line 1 Jungangno Station | Man-made intentional arson | 198 dead, 146 injured |
| 31 | July 2003 | Shanghai Metro Line 4 | Pipe surge collapse accident | The direct economic loss of RMB 150 million |
| 32 | August 2003 | London Underground | Major power outages | 250,000 people trapped in the subway |
| 33 | September 2003 | Shanghai Metro Xinzhuang Station | Escalator failure | More than forty people fell |
| 34 | January 2004 | Hong Kong MTR Admiralty Station | Man-made intentional arson | 14 people were sent to the hospital |
| 35 | February 2004 | Moscow Metro Line 2 | Terrorist attack | 50 dead and more than 100 injured |
| 36 | March 2004 | Madrid, Spain | Terrorist attack | 191 dead and 2050 injured |
| 37 | May 2004 | London Underground Central Line | Train derailment | More than 30 people were injured |
| 38 | July 2004 | Seoul Subway Daelim Station | Fire | Operational interruptions |
| 39 | August 2004 | Moscow Metro Line 6 Riga Station | Suicide bombing attack | Personnel casualties |
| 40 | October 2004 | Barcelona Metro, Spain | Train collision | More than 50 people were injured |
| 41 | January 2005 | New York Manhattan Subway Station | Fire | Line shutdown |
| 42 | January 2005 | Bangkok Metro | Train collision | 212 people were injured |
| 43 | April 2005 | Japan Subway Fukuchiyama Line | Train derailment | 107 people died and 562 were injured |
| 44 | July 2005 | London, England | Terrorist attack | 56 deaths |
| 45 | August 2005 | Shanghai Metro Line 1 | Waterlogged subway tunnel | Subway shutdown |
| 46 | August 2005 | Beijing Subway Chaoyangmen Station | Fire | Driver Injured |
| 47 | December 2005 | Shanghai Metro Line 1 | Parking accidents | A large number of passengers stranded |
| 48 | December 2005 | Beijing Metro Line 2 | A man entered the inner ring tunnel | Injured by train, the train stopped running |
| 49 | July 2006 | Chicago Metro “Blue Line” | Train derailment | 152 people were injured |
| 50 | August 2006 | Valencia Metro Line 1 | Subway derailment | 34 people died and more than 20 were injured |
| 51 | August 2006 | New York Subway Line B | Fire | 15 people were injured and 4000 passengers were evacuated in an emergency |
| 52 | October 2006 | Beijing Metro Chongwenmen Station | People jumping the track | 1 person died |
| 53 | October 2006 | Subway Line A, Rome, Italy | Train collision | 1 person was killed, and 236 people injured |
| 54 | July 2007 | Shanghai Metro Shanghai Stadium Station | Getting caught in the car | 1 person died |
| 55 | July 2007 | Venezuela Metro | Train collision | One person died and 12 people were injured |
| 56 | July 2007 | London Bethnal Green Underground Station | Train derailment | 37 people were injured |
| 57 | October 2007 | Tokyo Metro Toei Oedo Line | Power outage | 1300 people were trapped on the train, and 9.3 million people were affected by the trip |
| 58 | March 2008 | Beijing Metro Dongdan Station | Trampling accident | 11 people were injured |
| 59 | April 2008 | Chicago Subway | Traffic accidents | Two people died and 18 people were injured |
| 60 | September 2008 | Los Angeles Metro | Collision with a truck | 25 deaths |
| 61 | December 2008 | Xi’an, China | Fire | 19 people were injured |
| 62 | May 2009 | Boston Subway | Train collision | 49 people were injured |
| 63 | June 2009 | Washington Metro | Train collision | Nine people died and more than 70 were injured |
| 64 | July 2009 | Beijing Metro Line 1 | A man committed suicide by jumping on the rail | Subway operations were severely disrupted |
| 65 | September 2009 | New Delhi Metro, India | Train derailment | 21 people died and 17 were injured |
| 66 | December 2009 | Shanghai Metro Line 1 | Train collision | Train stop |
| 67 | February 2010 | Washington | Train derailment | Personnel casualties |
| 68 | March 2010 | Moscow Metro Line 1 | Explosion | 40 dead, nearly 100 injured |
| 69 | May 2010 | Shenzhen Metro Huaqiang Road Station | Trampling accident | 15 people were injured |
| 70 | June 2010 | Nanjing Metro Line 2 | Power outage | Subway delays |
| 71 | July 2010 | Shanghai Metro Zhongshan Park Station | Door failure | 1 person died |
| 72 | October 2010 | London Underground | Power outage | Many people were trapped for hours and 4000 people were affected by the travel |
| 73 | December 2010 | Shenzhen Metro Line 1 Guomao Station | Elevator failure | 24 passengers were injured |
| 74 | April 2011 | Minsk Metro Line 1 October Station | Bomb attack | 12 people lost their lives and about 200 people were injured |
| 75 | July 2011 | Beijing Metro Line 4 Zoo Station | Escalator failure | 1 dead, 2 seriously injured, and 26 were slightly injured |
| 76 | August 2011 | Nanjing Metro Line 2 | Floating on the seepage channel bed | Misalignment of train cars |
| 77 | September 2011 | Beijing Metro Xidan Station | Escalator failure | Passenger crush injuries |
| 78 | September 2011 | Shanghai Metro Xintiandi Station | Train rear-end | 295 people were injured |
| 79 | May 2012 | São Paulo Metro, Brazil | Train collision | At least 40 people were injured |
| 80 | July 2012 | Beijing Metro Xidan Station | Escalator failure | Five passengers were injured |
| 81 | August 2012 | Busan, Korea | Fire | More than 40 people were injured |
| 82 | September 2012 | Bowery Street Subway Station, New York | Fire | More than 500 passengers were evacuated |
| 83 | October 2012 | New York Subway, USA | Hurricane Sandy | New York’s entire subway system is down |
| 84 | November 2012 | Busan Subway Line 1 Daeti Station | Subway rear-end | Over 100 passengers injured |
| 85 | November 2012 | Shenzhen Metro | Signal interference | Emergency train braking |
| 86 | November 2012 | Guangzhou Metro Line 8 | Fire | 4 people were injured |
| 87 | January 2013 | Kunming Metro | Train derailment | One person was killed and one person was injured |
| 88 | March 2013 | Moscow Metro 110th Street Subway Station | Fire | 59 people were injured |
| 89 | March 2014 | Guangzhou Metro Line 5 | Trampling accident | Many people were injured |
| 90 | March 2014 | Chicago O’Hare International Airport Subway Station | Train derailment | 32 people were injured |
| 91 | April 2014 | Shanghai Metro Jing’an Temple Station | Escalator retrograde | 12 passengers were injured |
| 92 | May 2014 | New York Subway Line F | Train derailment | 19 people were injured and more than 1000 passengers were evacuated |
| 93 | May 2014 | Seoul Subway Line 3 | Deliberate arson | Train suspension |
| 94 | May 2014 | Seoul Subway Line 2 | Train rear-end | 249 people were injured |
| 95 | July 2014 | Busan Subway, Korea | Fire | Four passengers were injured and more than 400 passengers were evacuated in an emergency |
| 96 | November 2014 | Beijing Metro Huixinxijie South Exit Station | Getting caught in the car | 1 person died |
| 97 | January 2015 | Washington Metro | Fire | One person was killed and two people were seriously injured |
| 98 | February 2015 | Beijing Subway Wukesong Station | People falling off the track | One death |
| 99 | April 2015 | Shenzhen Metro Huangbeiling Station | Trampling accident | 12 injured |
| 100 | May 2015 | Mexico Metro | Train collision | 12 people were injured |
| 101 | July 2015 | Beijing Airport Line | Fire | Train suspension |
| 102 | December 2015 | London Leytonstone Underground Station | Terrorist attack | 3 people were injured |
| 103 | December 2015 | Beijing Subway Chaoyangmen Station | fall off the track | One death |
| 104 | January 2016 | Guangzhou Sanyuanli Metro Exit | Knife-wielding slashers | 1 woman injured |
| 105 | January 2016 | Tokyo Ginza Subway | Fire | 68,000 people travel disrupted |
| 106 | March 2016 | Metro stations near the EU headquarters in Brussels | Terrorist attack | 35 dead, 340 injured (62 seriously injured) |
| 107 | June 2016 | Nanning Metro Line 1 Baihualing Station | Flooded subway | Subway shutdown |
| 108 | January 2017 | Beijing Subway Babaoshan Station | Fall off the track | 1 person died |
| 109 | February 2017 | Hong Kong MTR | Man-made arson | 22 passengers were injured |
| 110 | April 2017 | St. Petersburg Metro Line 2 | Terrorist attack | 16 people died and 49 people were injured |
| 111 | June 2017 | New York Subway Line A | Train derailment | 34 people were slightly injured |
| 112 | September 2017 | London Parsons Green Underground Station | Terrorist attack | 29 people were injured |
| 113 | November 2017 | Singapore Subway | Train collision | 25 people were injured |
| 114 | April 2018 | Shanghai Metro Line 2 | Signal failure | Train suspension |
| 115 | August 2018 | Paris Metro Line 1 | Power outage | Hundreds of passengers evacuated as multiple driverless trains stop running |
| 116 | March 2020 | Northern Manhattan, New York, USA | Fire | Train driver dies, at least 16 people injured |
| 117 | May 2020 | Shanghai Metro Line 1 | Power supply equipment failure | Train speed limit |
| 118 | June 2020 | Seoul Subway Line 4 Sanggye Station | Train rear-end | Some trains are suspended |
| 119 | November 2020 | Union Square Subway Station, Manhattan, New York | Malicious injury | Adverse social effects |
| 120 | January 2021 | Mexico City Rail Transit Control Center | Fire | One death, massive subway shutdown |
| 121 | April 2021 | Shanghai Metro Line 2 | Fall off the track | 1 person died |
| 122 | May 2021 | Mexico Metro Line 12 | Elevated railroad track collapse | 23 people died and 79 people were injured |
| 123 | July 2021 | Zhengzhou Metro Line 5 | Flooding | 12 people died |
| 124 | November 2021 | Shenyang Metro Line 9 Shengli South Street Station | Stabbing people with knives | 1 person died |
References
- Chen, X.; Wu, S.; Shi, C.; Huang, Y.; Yang, Y.; Ke, R.; Zhao, J. Sensing Data Supported Traffic Flow Prediction via Denoising Schemes and ANN: A Comparison. IEEE Sens. J. 2020, 20, 14317–14328. [Google Scholar] [CrossRef]
- Xiao, G.; Xiao, Y.; Ni, A.; Zhang, C.; Zong, F. Exploring influence mechanism of bike-sharing on the use of public transportation-A case of Shanghai. Transp. Lett. 2022. [Google Scholar] [CrossRef]
- Statistics of Global Opened and Operated Metro Systems. Tunn. Constr. 2022, 42, 1814–1819, (In Chinese and English).
- Fan, W.; Miao, H.; Yuan, L.; Zhou, F.; Zhang, L.; Liu, N.; Zhong, M. Research on the development strategy of China’s safety science and engineering discipline in the 14th Five-Year Plan. China Sci. Found. 2021, 35, 864–870. [Google Scholar] [CrossRef]
- Graziano, A.D.; Marchetta, V.; Grande, J.; Fiore, S. Application of a decision support tool for the risk management of a metro system. Int. J. Rail Transp. 2022, 10, 352–374. [Google Scholar] [CrossRef]
- Chen, J.; Xu, H.; Gao, W.; Gao, J. Application of Artificial Neural Network in Course Design of Safety System-Taking a rail transit operation safety evaluation as an example. J. Phys. Conf. Ser. 2021, 1885, 52065. [Google Scholar] [CrossRef]
- Li, Z.; Guo, Z.; Su, D.; Wu, H.; Li, X. Study on risk management of metro construction and operation from stakeholders’ perspective. J. Saf. Environ. 2022, 1–13. [Google Scholar] [CrossRef]
- Zhang, M. Evaluation of subway operational safety risks under G1-EW combined empowerment cloud model. Chin. J. Saf. Sci. 2022, 32, 163–170. [Google Scholar] [CrossRef]
- Huang, Y.; Li, S.; Li, Y.; Zheng, H. Comprehensive evaluation of metro operational safety resilience based on DEMATEL-ISM-ANP. Chin. J. Saf. Sci. 2022, 32, 171–177. [Google Scholar] [CrossRef]
- Zhao, L.; Wang, Q. Mechanism of vulnerability formation of subway system under storm disturbance. Chin. J. Saf. Sci. 2022, 32, 193–199. [Google Scholar] [CrossRef]
- Wang, Y.; Luo, Y.; Yu, H.; Chen, J.; Huang, X. Safety risk evaluation method for crowded subway stations. J. Transp. Eng. 2020, 20, 198–207. [Google Scholar] [CrossRef]
- Li, X. Analysis of subway operation safety risks. J. Eng. Manag. 2017, 31, 83–88. [Google Scholar] [CrossRef]
- Zhu, Y.; Li, X.; Li, L. Research on vulnerability risk evaluation of subway network. J. Harbin Univ. Commer. 2021, 37, 450–455. [Google Scholar] [CrossRef]
- Li, Y.; Zhao, K.; Zhang, F. Identification of key influencing factors to Chinese coal power enterprises transition in the context of carbon neutrality: A modified fuzzy DEMATEL approach. Energy 2023, 263 Pt A, 125427. [Google Scholar] [CrossRef]
- Chu, F.; Zhu, C. Single-Item Dynamic Lot-Sizing Models with Bounded Inventory and Outsourcing. IEEE Trans. Syst. Man Cybern. Part A Syst. Hum. 2008, 38, 70–77. [Google Scholar] [CrossRef]
- Liu, Z.; Ma, Q.; Cai, B.; Shi, X.; Zheng, C.; Liu, Y. Risk coupling analysis of subsea blowout accidents based on dynamic Bayesian network and NK model. Reliab. Eng. Syst. Saf. 2022, 218 Pt A, 108160. [Google Scholar] [CrossRef]
- Yang, T.; Shuai, B.; Huang, W. Coupled risk analysis of road hazardous materials transportation system based on N-K model. Chin. J. Saf. Sci. 2019, 29, 132–137. [Google Scholar] [CrossRef]
- Pan, D.; Li, Y.; Luo, F. A study of aircraft operational safety risk coupling based on the N-K model. J. Saf. Environ. 2022, 22, 606–614. [Google Scholar] [CrossRef]
- Wang, H.; Liu, Z. Coupled analysis of maritime traffic safety risk factors based on N-K model. J. Saf. Environ. 2021, 21, 56–61. [Google Scholar] [CrossRef]
- Zhou, H.; Yang, Q.; Yang, Z.; Chen, C.; Ji, M. Analysis and control of tower crane safety risk factors based on complex network and N-K model. J. Saf. Environ. 2020, 20, 816–823. [Google Scholar] [CrossRef]
- Wu, X.; Wu, K.; Shen, M.; Chen, Y.; Zhang, L. Study on the coupling of subway construction safety risks based on the N-K model. Chin. J. Saf. Sci. 2016, 26, 96–101. [Google Scholar] [CrossRef]
- Fu, B.; Jiang, H.; Xu, T.; Yao, A. Coupling analysis of failure possibility factors of city gas pipelines based on the N-K model. China Sci. Technol. Saf. Prod. 2018, 14, 145–149. [Google Scholar]
- Zhao, J.; Xu, D.; Tian, J.; Dai, G. Study on the coupling of risk factors of fire and explosion accidents in oil tank areas based on the N-K model. Press. Vessel. 2019, 36, 49–55. [Google Scholar]
- Yang, D.; Zheng, Y.; Peng, K.; Pan, L.; Zheng, J.; Xie, B.; Wang, B. Characteristics and Statistical Analysis of Large and above Hazardous Chemical Accidents in China from 2000 to 2020. Int. J. Environ. Res. Public Health 2022, 19, 15603. [Google Scholar] [CrossRef]
- Ren, G.; Chen, J.; Gao, J.; Wang, Y.; Yuan, C.; Jiang, Q. An evaluation method for operational safety of subway stations based on improved topological element method. Urban Rail Transit Res. 2020, 23, 136–139. [Google Scholar] [CrossRef]
- Huang, H.; Ye, Y.; Hu, Q. Analysis of the current situation of subway operation safety risk management. Chin. J. Saf. Sci. 2008, 18, 55–62. [Google Scholar] [CrossRef]
- Han, L.; Li, Y.; Yang, Y. Study on the safety of subway operation and countermeasures. Chin. J. Saf. Sci. 2004, 14, 46–50. [Google Scholar] [CrossRef]
- Pan, K.; Wang, H.; Shi, J. Application of multi-level topological evaluation method in subway operation safety evaluation. J. Railw. 2011, 33, 14–19. [Google Scholar]
- Ma, Y.; Sun, J.; Wang, H. Risk assessment of metro operation safety based on OWA-AHP and entropy power method. J. Dalian Jiaotong Univ. 2019, 40, 86–91. [Google Scholar] [CrossRef]
- Sun, Y.; Huang, Z.; Li, Y. A review of recent advances in DEMATEL complex factor analysis algorithm. Comput. Sci. Explor. 2022, 16, 541–551. [Google Scholar]
- Mohammadfam, I.; Khajevandi, A.A.; Dehghani, H.; Babamiri, M.; Farhadian, M. Analysis of Factors Affecting Human Reliability in the Mining Process Design Using Fuzzy Delphi and DEMATEL Methods. Sustainability 2022, 14, 8168. [Google Scholar] [CrossRef]
- Yeganeh, R.; Mohammadfam, I.; Soltanian, A.; Mirzaei Aliabadi, M. An integrative fuzzy Delphi decision-making trial and evaluation laboratory (DEMATEL) study on the risk perception-influencing factors. Int. J. Occup. Saf. Ergon. 2022. [Google Scholar] [CrossRef]
- Li, R.J. The fuzzy method in group decision-making. Comput. Math. Appl. 1999, 38, 91–101. [Google Scholar] [CrossRef] [Green Version]
- Chen, J.; Huang, T. The Multi-Level Hierarchical Structure of the Enablers for Supply Chain Resilience Using Cloud Model-DEMATEL-ISM Method. Sustainability 2022, 14, 12116. [Google Scholar] [CrossRef]
- Zhu, J.; Chen, G.; Cao, E.; Dai, Z. Study on the influencing factors of deepwater good blowout risk based on DEMATEL/ISM. China Saf. Prod. Sci. Technol. 2020, 16, 5–10. [Google Scholar]
- Liang, Y.; Wang, H.; Zhao, X. Analysis of factors affecting the economic operation of electric vehicle charging station based on DEMATEL-ISM. Comput. Ind. Eng. 2022, 163, 107818. [Google Scholar] [CrossRef]
- Chen, Y.; Zhou, R.; Zhou, Y. Analysis of Critical Factors for the Entrepreneurship in Industries of the Future Based on DEMATEL-ISM Approach. Sustainability 2022, 14, 16812. [Google Scholar] [CrossRef]
- Weinans, H. The origins of order-self-organization and selection in evolution. J. Biomech. 1996, 29, 835–837. [Google Scholar] [CrossRef] [Green Version]
- Kuzu, A.C. Risk analysis of break-in-two accident of ships using fuzzy DEMATEL method. Ocean. Eng. 2021, 235, 109410. [Google Scholar] [CrossRef]
- Pan, L.; Zheng, Y.; Zheng, J.; Xu, B.; Liu, G.; Wang, M.; Yang, D. Characteristics of Chemical Accidents and Risk Assessment Method for Petrochemical Enterprises Based on Improved FBN. Sustainability 2022, 14, 12072. [Google Scholar] [CrossRef]
- Chen, F.; Han, M. Identification of ATC risk factors in airborne hazardous approach events. J. Saf. Environ. 2021, 21, 1583–1591. [Google Scholar] [CrossRef]
- Liu, J.; Yang, G.; Wang, W.; Zhou, H.; Hu, X.; Ma, Q. Based on ISM-NK Tunnel Fire Multi-Factor Coupling Evolution Game Research. Sustainability 2022, 14, 7034. [Google Scholar] [CrossRef]


| Expert Type | Work Unit | Title | Access Time | Access Mode | Duration |
|---|---|---|---|---|---|
| Faculty Specialist A | Beijing Jiaotong University | Professor | September 2022 | 10 min | |
| Faculty Specialist B | Southwest Jiaotong University | Professor | September 2022 | Telephone interview | 15 min |
| Faculty Specialist C | Kunming University of Science and Technology | Associate Professor | September 2022 | On-site | 30 min |
| Operations Manager D | Beijing Rail Transit Construction Management Co. | Senior Engineer | October 2022 | 15 min | |
| Operations Manager E | Kunming Metro Group Co. | Senior Engineer | October 2022 | on-site | 30 min |
| Operations Manager F | China Railway 16th Bureau | Senior Engineer | October 2022 | 15 min | |
| Security Engineer G | Emergency Management Agency | Senior Engineer | November 2022 | Telephone interview | 12 min |
| Security Engineer H | Emergency Management Agency | Senior Engineer | November 2022 | on-site | 25 min |
| Security Engineer I | Transportation Bureau | Senior Engineer | November 2022 | 15 min | |
| Subway Operations Safety Specialist J | Transportation Bureau | Division Chief | November 2022 | Telephone interview | 15 min |
| Expert Evaluation Semantics | Numerical Value | Fuzzy Scale | Clarity Value |
|---|---|---|---|
| No effect | 0 | (0,0,0.25) | 0.0833 |
| Very low impact | 1 | (0,0.25,0.75) | 0.2500 |
| Low impact | 2 | (0.25,0.5,0.75) | 0.5000 |
| High impact | 3 | (0.5,0.75,1) | 0.7500 |
| The impact is high | 4 | (0.75,1,1) | 0.9166 |
| rij | S1 | S2 | S3 | S4 | - | S15 | S16 | S17 | S18 |
|---|---|---|---|---|---|---|---|---|---|
| S1 | 0.08 | 0.09 | 0.08 | 0.08 | - | 0.06 | 0.13 | 0.11 | 0.12 |
| S2 | 0.07 | 0.07 | 0.08 | 0.13 | - | 0.04 | 0.04 | 0.08 | 0.05 |
| S3 | 0.09 | 0.11 | 0.07 | 0.09 | - | 0.05 | 0.06 | 0.08 | 0.12 |
| S4 | 0.10 | 0.14 | 0.10 | 0.08 | - | 0.08 | 0.05 | 0.06 | 0.12 |
| - | - | - | - | - | - | - | - | - | - |
| S18 | 0.14 | 0.10 | 0.10 | 0.15 | - | 0.12 | 0.06 | 0.07 | 0.07 |
| Si | Ji | Li | Mi | Ni | Factor Properties | Mi Sort |
|---|---|---|---|---|---|---|
| S1 | 1.77 | 1.86 | 3.63 | −0.09 | Resulting factors | 5 |
| S2 | 1.43 | 2.05 | 3.48 | −0.63 | Resulting factors | 13 |
| S3 | 1.54 | 1.91 | 3.45 | −0.37 | Resulting factors | 14 |
| S4 | 1.54 | 2.26 | 3.80 | −0.73 | Resulting factors | 3 |
| S5 | 1.41 | 2.45 | 3.86 | −1.03 | Resulting factors | 1 |
| S6 | 1.29 | 2.30 | 3.59 | −1.01 | Resulting factors | 7 |
| S7 | 1.38 | 1.97 | 3.35 | −0.59 | Resulting factors | 16 |
| S8 | 1.35 | 2.24 | 3.60 | −0.89 | Resulting factors | 6 |
| S9 | 1.32 | 2.24 | 3.56 | −0.91 | Resulting factors | 8 |
| S10 | 1.43 | 1.79 | 3.23 | −0.36 | Resulting factors | 18 |
| S11 | 2.08 | 1.45 | 3.53 | 0.63 | Causal factors | 11 |
| S12 | 2.07 | 1.47 | 3.55 | 0.60 | Causal factors | 10 |
| S13 | 2.04 | 1.37 | 3.41 | 0.66 | Causal factors | 15 |
| S14 | 2.08 | 1.45 | 3.52 | 0.63 | Causal factors | 12 |
| S15 | 2.33 | 1.22 | 3.55 | 1.12 | Causal factors | 9 |
| S16 | 2.47 | 1.22 | 3.69 | 1.26 | Causal factors | 4 |
| S17 | 2.64 | 1.19 | 3.83 | 1.44 | Causal factors | 2 |
| S18 | 1.81 | 1.53 | 3.33 | 0.28 | Causal factors | 17 |
| kij | S1 | S2 | S3 | S4 | - | S15 | S16 | S17 | S18 |
|---|---|---|---|---|---|---|---|---|---|
| S1 | 1 | 0 | 0 | 0 | - | 0 | 0 | 0 | 0 |
| S2 | 0 | 1 | 0 | 0 | - | 0 | 0 | 0 | 0 |
| S3 | 0 | 0 | 1 | 0 | - | 0 | 0 | 0 | 0 |
| S4 | 0 | 1 | 0 | 1 | - | 0 | 0 | 0 | 0 |
| - | - | - | - | - | - | - | - | - | - |
| S18 | 1 | 0 | 0 | 1 | - | 0 | 0 | 0 | 1 |
| Si | Ai | Bi | Ci | Levels |
|---|---|---|---|---|
| S1 | 1, 5, 14 | 1, 11, 14, 15, 16, 17, 18 | 1, 14 | 2 |
| S2 | 2 | 2, 4, 12, 13, 15, 16, 17 | 2 | 1 |
| S3 | 3 | 3, 14, 15, 16, 17 | 3 | 1 |
| S4 | 2, 4 | 4, 8, 12, 13, 15, 16, 17, 18 | 4 | 2 |
| S5 | 5 | 1, 5, 11, 12, 13, 14, 15, 16, 17, 18 | 5 | 1 |
| S6 | 6, 8, 9 | 6, 10, 11, 12, 13, 16, 17 | 6 | 4 |
| S7 | 7, 8, 9 | 7, 11, 12, 17 | 7 | 4 |
| S8 | 4, 8 | 6, 7, 8, 10, 11, 12, 13, 17 | 8 | 3 |
| S9 | 9 | 6, 7, 9, 10, 11, 12, 13, 17 | 9 | 1 |
| S10 | 6, 8, 9, 10 | 10, 11, 13, 17 | 10 | 5 |
| S11 | 1, 5, 6, 8, 9, 10, 11 | 11 | 11 | 6 |
| S12 | 2, 4, 5, 6, 7, 8, 9, 12 | 12 | 12 | 5 |
| S13 | 2, 4, 5, 6, 7, 8, 9, 10, 13 | 13 | 13 | 6 |
| S14 | 1, 3, 5, 14 | 1, 14, 15, 18 | 1, 14 | 2 |
| S15 | 1, 2, 3, 4, 5, 14, 15, 18 | 15, 16 | 15 | 4 |
| S16 | 1, 2, 3, 4, 5, 6, 15, 16 | 16, 17 | 16 | 5 |
| S17 | 1, 2, 3, 4, 5, 6, 7, 8, 9, 10, 16, 17 | 17 | 17 | 6 |
| S18 | 1, 4, 5, 14, 18 | 15, 18 | 18 | 3 |
| Single-Factor Coupling | Two-Factor Coupling | Multi-Factor Coupling | |||
|---|---|---|---|---|---|
| Number of Times | Frequency | Number of Times | Frequency | Number of Times | Frequency |
| 0000 = 0 | F0000 = 0.0000 | 1100 = 8 | F1100 = 0.0645 | 1110 = 14 | F1110 = 0.1129 |
| 1000 = 7 | F1000 = 0.0565 | 1010 = 13 | F1010 = 0.1048 | 1101 = 17 | F1101 = 0.1371 |
| 0100 = 4 | F0100 = 0.0323 | 1001 = 9 | F1001 = 0.0726 | 1011 = 15 | F1011 = 0.1210 |
| 0010 = 3 | F0010 = 0.0242 | 0110 = 5 | F0110 = 0.0403 | 0111 = 11 | F0111 = 0.0887 |
| 0001 = 1 | F0001 = 0.0081 | 0101 = 12 | F0101 = 0.0968 | 1111 = 4 | F1111 = 0.0322 |
| 0011 = 1 | F0011 = 0.0081 | ||||
| Fv… | F.w.. | F..x. | F…y | ||||
|---|---|---|---|---|---|---|---|
| F0… | 0.2904 | F.0.. | 0.3953 | F..0. | 0.4679 | F…0 | 0.4355 |
| F1… | 0.7016 | F.1.. | 0.6047 | F..1. | 0.5321 | F…1 | 0.5645 |
Disclaimer/Publisher’s Note: The statements, opinions and data contained in all publications are solely those of the individual author(s) and contributor(s) and not of MDPI and/or the editor(s). MDPI and/or the editor(s) disclaim responsibility for any injury to people or property resulting from any ideas, methods, instructions or products referred to in the content. |
© 2023 by the authors. Licensee MDPI, Basel, Switzerland. This article is an open access article distributed under the terms and conditions of the Creative Commons Attribution (CC BY) license (https://creativecommons.org/licenses/by/4.0/).
Share and Cite
Liu, J.; Wan, L.; Wang, W.; Yang, G.; Ma, Q.; Zhou, H.; Zhao, H.; Lu, F. Integrated Fuzzy DEMATEL-ISM-NK for Metro Operation Safety Risk Factor Analysis and Multi-Factor Risk Coupling Study. Sustainability 2023, 15, 5898. https://doi.org/10.3390/su15075898
Liu J, Wan L, Wang W, Yang G, Ma Q, Zhou H, Zhao H, Lu F. Integrated Fuzzy DEMATEL-ISM-NK for Metro Operation Safety Risk Factor Analysis and Multi-Factor Risk Coupling Study. Sustainability. 2023; 15(7):5898. https://doi.org/10.3390/su15075898
Chicago/Turabian StyleLiu, Jie, Liting Wan, Wanqing Wang, Guanding Yang, Qian Ma, Haowen Zhou, Huyun Zhao, and Feng Lu. 2023. "Integrated Fuzzy DEMATEL-ISM-NK for Metro Operation Safety Risk Factor Analysis and Multi-Factor Risk Coupling Study" Sustainability 15, no. 7: 5898. https://doi.org/10.3390/su15075898