1. Introduction
People are compelled to reconsider how they manage resources in the face of changing living expenses as a result of the fluctuation in energy prices brought on by energy shortages or oversupply as well as political unrest among suppliers [
1]. In the event of an energy shortage, the inevitable price increase will have a significant impact on a variety of loads, including electric vehicles (EVs) [
2]. The automatic tariff adjustment (Ft) in Thailand, which is updated every four months, increased four times in the fourth quarter of 2022 as a result of the rising cost of energy. The energy charge per kWh would increase by about 16 percent if an EV owner used the residential progressive rate of electricity tariff and used more than 400 kWh per month [
3]. On the other hand, the excess energy supply during COVID-19 was beneficial for owners of gasoline-powered vehicles while having a significant negative impact on energy suppliers [
4]. In addition to the energy cost, the environmental impact of driving gasoline-powered vehicles is compelling evidence for users to abandon them. Vehicle owners should be cautious when purchasing a new vehicle in the coming decade due to the volatility of energy prices and environmental concerns.
Solar energy self-consumption is an appealing option for owners of renewable energy resource (RES) plants rather than selling the energy to the grid for low revenue and a long payback period [
5]. However, when compared to the consistent availability of the grid power supply, the intermittent nature of RES poses a significant problem of utilization in the face of arbitrary load requirements [
6]. As a result, the use of an energy buffer, such as a battery energy storage system (BESS), for solar PV generation influences users’ decisions [
7]. This is due to advancements in battery technology, which allows the battery’s capabilities for supplying or recapturing power among loads while maintaining safety, efficiency, and endurance [
8]. However, the current cost of a new BESS is high, whereas the cost of energy generated by solar PV is mature and economically viable; thus, users are still unmotivated by the hybrid energy storage (HESS) between solar PV and a new battery (NB). In [
9], the estimated Li-ion battery projection cost between 2021 and 2030 was reduced from USD 120 to 40/kwh, which is close to the cost reported by the International Energy Agency (IEA) in the year 2021 of about USD 132/kWh [
10]. However, when a battery is used in a BESS, the engineering, procurement, and construction (EPC) cost, which is roughly twice as much as the cost of the battery, is included; as a result, the high cost of the application demotivated the user.
One option for deploying this outlook is to directly use a second-life EV battery (SLEB) dismantled from an EV or another large BESS application, such as a data center backup power supply [
11]. According to [
12], the literature indicates that by 2025, there will be 26 GWh of second-life batteries, with Li-ion batteries accounting for almost half of that total. The battery in an EV is typically replaced when they reach 80% state-of-health (SOH) or roughly after 8 years or 160,000 km to maintain the driving range and vehicle performance. In the case of a data center, a time-based battery replacement, e.g., every three years, is used to protect against unforeseeable losses [
13]. Focusing on the EV battery, the battery chemistries are mostly lithium-ion battery based, including lithium-ion phosphate (LFP), lithium nickel manganese cobalt oxide (NMC), lithium nickel cobalt aluminum oxide (NCA), and they are safe, technically accepted, economical, and perform well [
14]. As a result, the residual capacity of the dismantled EV batteries enables repurposing in systems that require a less stressful application, such as a stable charge and discharge for a specific depth-of-discharge (DOD) throughout the entire second life. This allows the degraded life evaluation to be numerically calculated effectively [
15]. In contrast, recycling first-life batteries too quickly using manufacturer processing would result in unnecessary carbon emissions for the EV’s cradle-to-grave life cycle. Furthermore, refurbishing the used battery pack is a difficult and costly task, which may result in a non-benefit of reuse [
16]. Thus, repurposing a used battery in another implementation is not only a cost-effective way to deal with fluctuating energy prices but is also environmentally friendly [
17].
The aim of this research is to evaluate the technical and economic perspectives of the SLEB combined with solar PV use in a specific condition that should benefit residential EV charging and household loads. The battery degradation model that is influenced by any technical factors affecting the battery lifetime, i.e., operating temperature, DOD, average SOC level, and the number of cycles is utilized to evaluate the SOH against the varieties of SOC restrictions [
18,
19]. The varieties of SOC operating ranges are evaluated for a proper lifetime of the repurposing battery and coherence with the other electronics equipment lifetime for sustainable replacements. The cost of an NB and SLEB is explored along with our previous works to establish the levelized cost of electricity (LCOE) of the hybrid power source. The revenue is calculated against the energy cost supplied by the electrical grid. To observe the benefit of the proposed system, the operating condition is specified based on the possible real-world application, i.e., the SOH used in the second use battery is restricted between 80 and 40% of the initial capacity. Lastly, an economic analysis based on net present value (NPV), internal rate of return (IRR), and the payback period was adopted.
2. Literature Review
Despite the fact that using EVs diminishes greenhouse gas (GHG) emissions, higher levels of human toxicity are being experienced due to the increased use of metals, chemicals, and energy in the production of high-voltage batteries and powertrains [
18]. With a life expectancy of 150,000 km, a battery electric vehicle (BEV) service life CO2-eq emission levels are 48% lower than those of a petrol internal combustion engine vehicle (ICEV). However, using BEVs will result in higher levels of fine particulate matter creation, human carcinogenic and non-carcinogenic toxicity, and land-based, surface water, and oceanic ecotoxicity. By 2050, the toxicity of BEVs could be comparable to that of ICEVs due to battery manufacturing [
16].
In order to immediately increase the environmental advantages of BEVs, the recycling process, reusing, repurposing, and remanufacturing of the retired batteries are beneficial [
19]. The terms “reuse” and “repurpose” have different definitions. The former refers to using something in the same application without making any modifications, such as in smaller vehicles, whereas the latter refers to using something for a different purpose, such as stationary energy storage [
20]. Reusing and repurposing the SLEB raise the question of how long it will last in any operating conditions, whereas disposing of EV batteries that still have 80% of their initial state-of-charge (SOC) presents an appealing alternative [
21].
For almost a decade, studies on the feasibility of processing the low-cost retired EV battery have been initiated and continuously conducted, thus increasing the battery value and enhancing the recycling period [
20]. The authors of [
22] assessed the technical and financial viability of SLEB use in a large-scale power system while taking into account the battery deterioration model. Instead of using chemistry theories or empirical models, the model uses a semi-empirical approach to determine how long a battery will last. This is because chemistry theories have difficulties incorporating real battery data into life predictions, whereas empirical models are only capable of evaluating regular patterns in aging rather than calendar and cycle life. As a result, the so-called semi-empirical deterioration models and a model that combines the theoretical stress factor analysis and implementation of the measured coefficients data of the battery are suggested. The stress-related variables are the number of cycles and average SOC, DOD, C-rate, average cell temperature, and time. To construct the temporal stress model, the temperature and SOC stress models must first be determined using the Arrhenius and Millner equations, respectively. The DoD and C-rate models are fitted to the battery data obtained from the supplier and the experiment data, respectively. As a result, the life is computed, and the deterioration model based on calendar and cycle aging is realized. Later on, it was found by the same author that the C-rate can be overpassed by thermal influence, thus the C-rate is not required to be incorporated into the degradation model [
15].
This work was extended by the authors of [
22] where battery degradation was then implemented for a techno-economic analysis of utility-scale solar plus SLEB. The benefit-cost ratio was used for economic analysis, whereas it is suitable for various types of revenue created by different system architectures. In practice, such an analysis should be undertaken at the end of every phase of the life cycle to ensure that the project is still viable. In addition, quantifying the benefits is a challenging task to translate into money, even though the benefit–cost ratio is appropriate for various forms of income generated by individual projects.
In [
23], the off-grid solar PV and SLEB hybrid power sources were studied using simulation and experiment setup to observe the benefits compared to using NB energy storage. The validation of system modeling simulation with the experiment setup was satisfied, and the modeling was used for any performance evaluation. However, calendar aging was not included in the SLEB aging test, and the cycle charge and discharge current were not exactly evaluated using either simulation or experiment along with the operating temperature. Thus, the economic benefit of the proposed system could be doubted.
According to [
24], who conducted an economic analysis of the SLEB for household load and load leveling, implementation reduces greenhouse gas emissions while also saving homeowners money on their electricity bills. The economic analysis evaluated the SLEB round-trip efficiency as 64% perceived from the experiment, which was used to declare the daily maximum discharge of 8.5 kWh. Nevertheless, the capacity fading during the second life operating of 10 years based on the maximum DOD of 80% in the use phase was not declared explicitly. Certainly, the calendar degradation of a battery occurs every second, and the cycle aging, which depends on the operating temperature, SOC, DOD, and the number of cycles, requires a numerical battery life degradation calculation [
25]. Therefore, an economic analysis may not be convincing if those factors are absent from the evaluation. Furthermore, the solution requires government incentive support campaigns to achieve energy savings and environmental sustainability.
The feasibility study of a hybrid power source that supplies a household load under an energy exchange scheme was carried out in [
26]. The techno-economic analysis showed the cost-effectiveness of a small-size SLEB application over a large-size SLEB and NB. Although, the degradation equation in the technical analysis of the battery seems unconvincing compared to the referred work in [
15]. Furthermore, the designated minimum capacity limit of the retired SLEB in this work was defined as 25% of the deliverable energy of the battery (equivalent to 16% of the initial capacity), and this created a competitive energy exchange benefit from the small SLEB compared to the large SLEB and the NB along with a lower system cost and operation and maintenance cost. Therefore, the small SLEB had the shortest payback period. The minimum capacity limit, however, was too low. According to recent studies, the minimum SOC of retired SLEB should be between 30% and 40% of their initial capacity in order to reduce carbon emissions and maximize the value of Li-ion batteries during the recycling process [
27,
28].
Without taking into consideration economic issues and battery aging, the authors of [
29] claim that a feasibility analysis of BESS applications would provide unlikely findings. In the study, the difference between a real electric bill and a simulated electric bill was used to calculate the savings. The return on investment (ROI) was then evaluated. Even in the best-case scenario, the ROI was close to the battery life duration, which was set at 60% of its initial capacity to avoid system failures. The investment in the project, therefore, appears unattractive. This is because of the investment’s high capital cost, which was incurred due to the inclusion of several pricy components, as opposed to the little savings. In addition, the ROI calculation does not take into consideration the investment’s cash flow, which, in a real situation, may change year over year [
30]. The study suggested taking the environment into account even though the economic advantages of EV adoption are not strong. Based on simulation results, it is possible to attain a 10-year life of the SLEB, which may be a reliable working set point for SLEB use in real-world circumstances.
The author of [
31] studied a repurposed SLEB based on a technological and environmental point of view. The battery system was installed and managed in a sophisticated infrastructure, and the results of those tests, which were conducted on real-world applications, were only meant to serve as a demonstration and not as an economic decision. The lifetime of the battery was predicted using the equivalent model for predicting the life over different usages, whereas the SLEB could not be used once the DOD reached 85% influence in different applications. Undoubtedly, the mixing of use, i.e., area regulation and self-consumption, generated the fastest degradation of 4.7 years at 60% SOH, which was caused by the ripple power requirement in area regulating compared to other applications. The lifetime of self-consumption was also discovered to be close to other studies at the point of 6 years, when the SOH had reached 60%, and the final lifetime for this application was 11.6 years at 40% SOH. Because the power profile in self-consumption is smooth, it had a lower rate of degradation and, therefore, took longer to reach 85% DOD. It was advised not to use the SLEB for grid services or area regulation from an environmental perspective and that investigation for appropriate applications was needed. The SLEB is a better option than a brand-new, pricey Li-ion battery for use in a less demanding application, according to these studies that found the SLEB life is influenced by different uses. In this work, the investment is illogical, though, because the economic analysis was not performed.
The authors of [
32] proposed size estimates for hybrid batteries and solar PV systems based on an off-grid power infrastructure for charging electric vehicles. It is clear that the EV load contributes to system instability, but the addition of several battery packs and PVs might lessen the interference. However, the study did not contain any empirical experiments to validate the battery model, and the outcome may get worse.
In our work, we hope to fulfill all the research gaps in the past decade by proposing an economic analysis based on an NPV, IRR, and payback period, whereas the yearly cash flow is incorporated. The revenue is calculated as the difference between the electricity unit price and the LCOE of the PV and battery hybrid power source considering the battery life degradation. The sensitivity analysis of the SLEB price is explored to search for a range in the maximum price that could attract investment. From the technical perspective, the life of SLEBs is investigated using the varieties of SOC ranges for creating the highest revenue whilst the SOH in retirement is not lower than 40% for the usage life of 10 years. These parameters are beneficial for the battery value in the recycling process [
28] and coherent with the lifetime of other power electronics devices, i.e., a hybrid converter [
33]. In addition, the C-rate and average operating temperature are designated at 1 C and 30 °C, respectively. The low C-rate is intended to prevent the battery from overheating when operating in the natural air flow mode without an additional cooling system for energy saving. This is possible in Thailand when the battery is installed in a shaded area in a house that has a daily temperature varying between 25 °C and 35 °C [
34]. Then, the battery aging calculation based on a semi-empirical assumption requiring average SOC, DOD, the number of cycles, and temperature is used because the degradation models based on chemical approaches are numerically impossible [
22]. The obstacle in our work is the high voltage of the SLEB in which the hybrid converter in the market must be modified.
Table 1 presents the overall works of the past decade in terms of their findings, methodology, viability, and limitations.
3. Research Methodology
This section demonstrates the research methodology for the feasibility study of PV-SLEB for EV charging applications. To start, the costs of PV and new lithium-ion batteries obtained from China’s PV cost prediction including engineering, procurement, and construction costs are implemented in this study [
9]. To eliminate consumer concerns regarding untraceable SLEBs purchased from suppliers and to lengthen the battery life cycle, the retired battery in the driver’s EV is utilized as a SLEB [
12]. Once the battery passport project is released, the SLEB in the market may be used with confidence [
35]. Based on the Nissan Leaf EV used in this study, the approximate cost of the SLEB at USD 44/kWh is used in this study for the first year of evaluation [
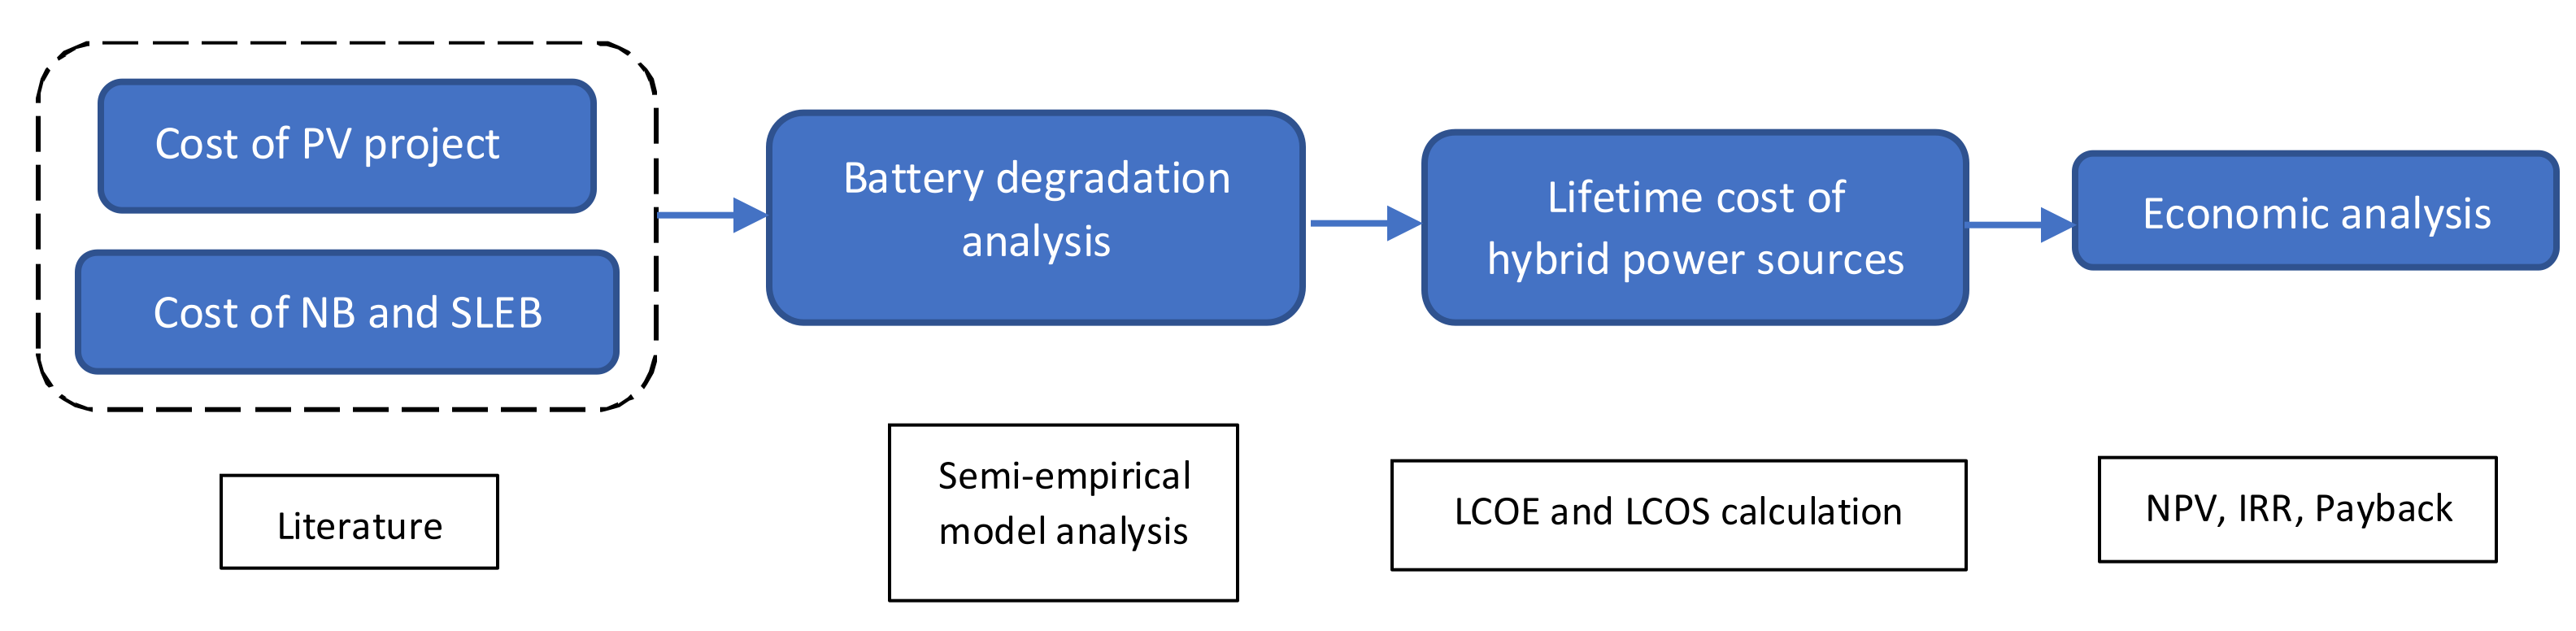
36]. For the consecutive year, the reduction tendency factor of an NB is applied for the prediction cost of the SLEB from the year 2023 to the year 2031. To consider the useful life of the battery during the use phase, the battery life degradation evaluation of the NB and SLEB has been incorporated using the semi-empirical degradation model-based technical analysis under DOD variants. Next, LCOE and LCOS are used to calculate the lifetime costs of alternative energy production. Finally, the revenue received from hybrid power sources using NB and SLEB is economically assessed for the project’s viability based on the NPV, IRR, and payback period.
Figure 1 depicts the flow of the proposed study.
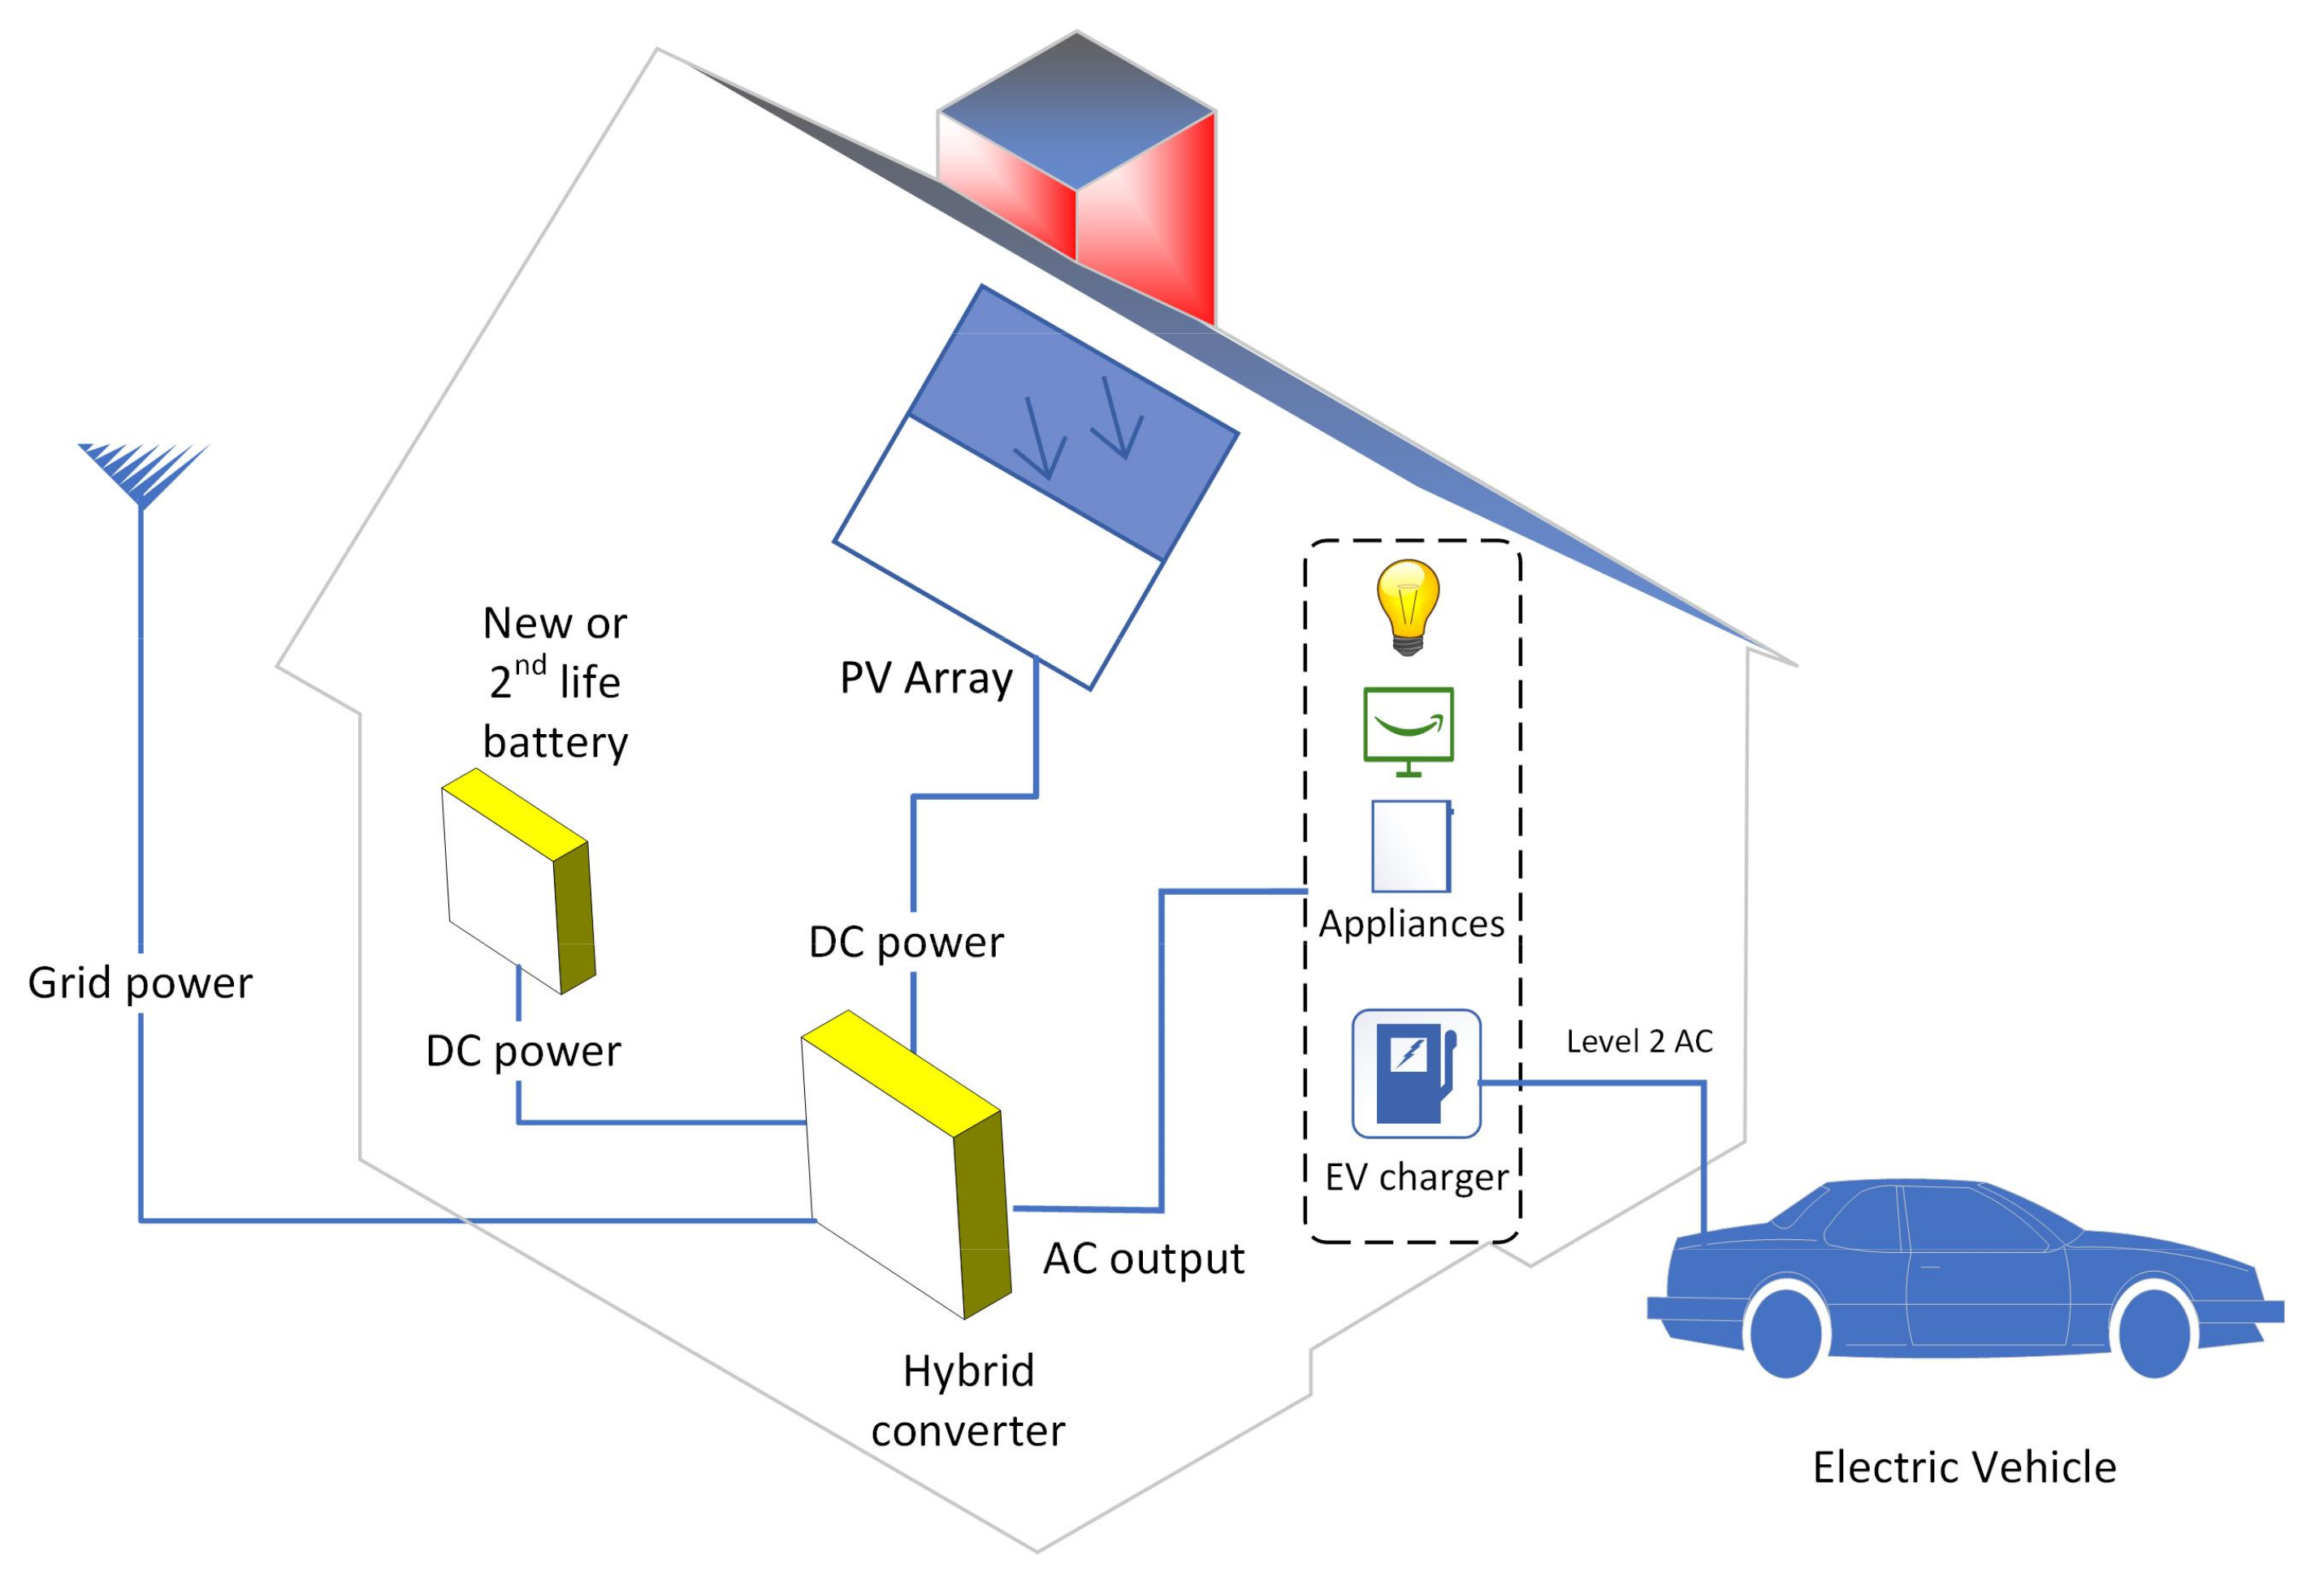
Figure 2 depicts the architecture of the proposed system in this study. The system consists of PV arrays installed on the roof of the EV owner’s home to provide power to a hybrid converter that is linked to the NB or SLEB and grid power. The power from the grid is allotted to provide the household loads where the electricity produced by the hybrid power source is appropriately designed for the EV load which is described in
Section 3. Therefore, this allows a focused evaluation of the hybrid power source viability for EV charging. In practice, the hybrid converter can transfer electricity to the EV charger when the PV generation is insufficient. On the other hand, once the solar energy stored in the battery has not been consumed by the EV, the energy can be delivered to household loads by controlling the hybrid converter. As a result, the battery will operate at a specific condition gradually, and the battery’s life can be accurately evaluated. In addition to the SLEB, the decreased specific energy (Wh/kg) makes it better suited for stationary uses; however, reuse in mobility applications, such as in a three-wheel vehicle, may be inefficient. With a mass of hundreds of kg, the battery may be placed on the ground under natural air flow conditions and controlled to operate at the nominal current rating to minimize heat rising rather than delivering high current for mobile purposes. The EV charger is an AC level 2 device with a capacity rating of about 7 kW. The Nissan Leaf EV’s driving economy of 175 W/km is applied [
37]. This vehicle is expected to travel 50–100 km each day, thus 8.75 kWh to 17.5 kWh would be consumed [
38].
3.1. Battery Degradation Analysis
There are two types of battery degradation models referred to in this study: theoretical models and empirical models. The former models are good at explaining degradation, but it is challenging to connect the charge and discharge schemes to the battery’s molecular process. In contrast, the latter models can be concisely applied after searching the coefficients throughout the experiment, but experimental testing requires a lot of time within expensive facilities. Thus, to address the shortcomings of these models, semi-empirical models are introduced in which battery theory and experimental data are combined to provide accurate and workable models for any operating conditions [
15].
When starting to use a fresh battery, there are two phenomena that happen before the end of the first life at 80% SOH or SOH = 0.8 per unit system. The first phenomenon is non-linear degradation in which the battery life decreases rapidly during the early years of operation. This is because of the electrochemical formation of the SEI in calendric aging, mechanical stress during cycle aging that accelerates the SEI formation and crack, and the electrode dry-out that causes the loss of active material [
39]. After that, the battery will be in the linear degradation stage where the SEI film has already been formed [
15]. Therefore, the battery aging life of the new battery
based on experimental coefficient data, in which aging the life L = 0 and the SOH = 1 − L, can be expressed by a two-term exponential of the SEI formation stage and normal stage as in Equation (1):
where
is the portion of lithium consumed in SEI formation as 0.0575,
is the ratio of SEI degradation of 121 for the NMC battery, and
is the linearized battery degradation rate [
25].
After passing the SEI formation stage, the battery undergoes a steady degradation until reaching a specified recycle state, i.e., 40% of the SOH [
22]. Therefore, we can ignore the first term of the SEI film formation and simply use the prior battery aging life,
, which is 0.2 in this study. The battery aging equation in the second life
is as follows:
In order to calculate the linearized battery deterioration rate
, the charge and discharge cycle per day or year during operation and storing time during non-operation—also known as cycle aging (
and calendar aging (
, respectively—are utilized in the stress models. Battery aging over time with respect to the average SOC and cell temperature is depicted by calendar aging. Cycle aging offers life fading in the charge and discharge process, which depends on the number of cycles
, DOD, average SOC of the cycle, and average operating temperature. The stress models of a battery are independent of each other, whereas a Lithium Nickel Manganese Cobalt Oxide (NMC) battery can be obtained by the following equations, in which the coefficients were derived from the experiment [
22]:
The DOD stress model is a quadratic function for the NMC battery used in this study, and it is expressed by (4):
where
and
are the DOD stress coefficients, which are
) and 2.03, respectively.
The time stress model
used in calendar aging refers to the products of time of battery aging in seconds
with a time stress coefficient
of
. The equation is shown below:
The SOC stress model,
, can be obtained based on Millner’s stress model as in (6):
where
is the SOC stress coefficient of 1.04,
is the average SOC for a cycle, and
is the reference level of SOC, where 0.6 is used in this study [
25].
The temperature stress model,
, can be obtained using the Arrhenius equation as is shown in (7):
where
is the temperature stress coefficient of
,
is the average operating temperature, and
is the reference operating temperature in degrees Kelvin, where
or
is used in this study.
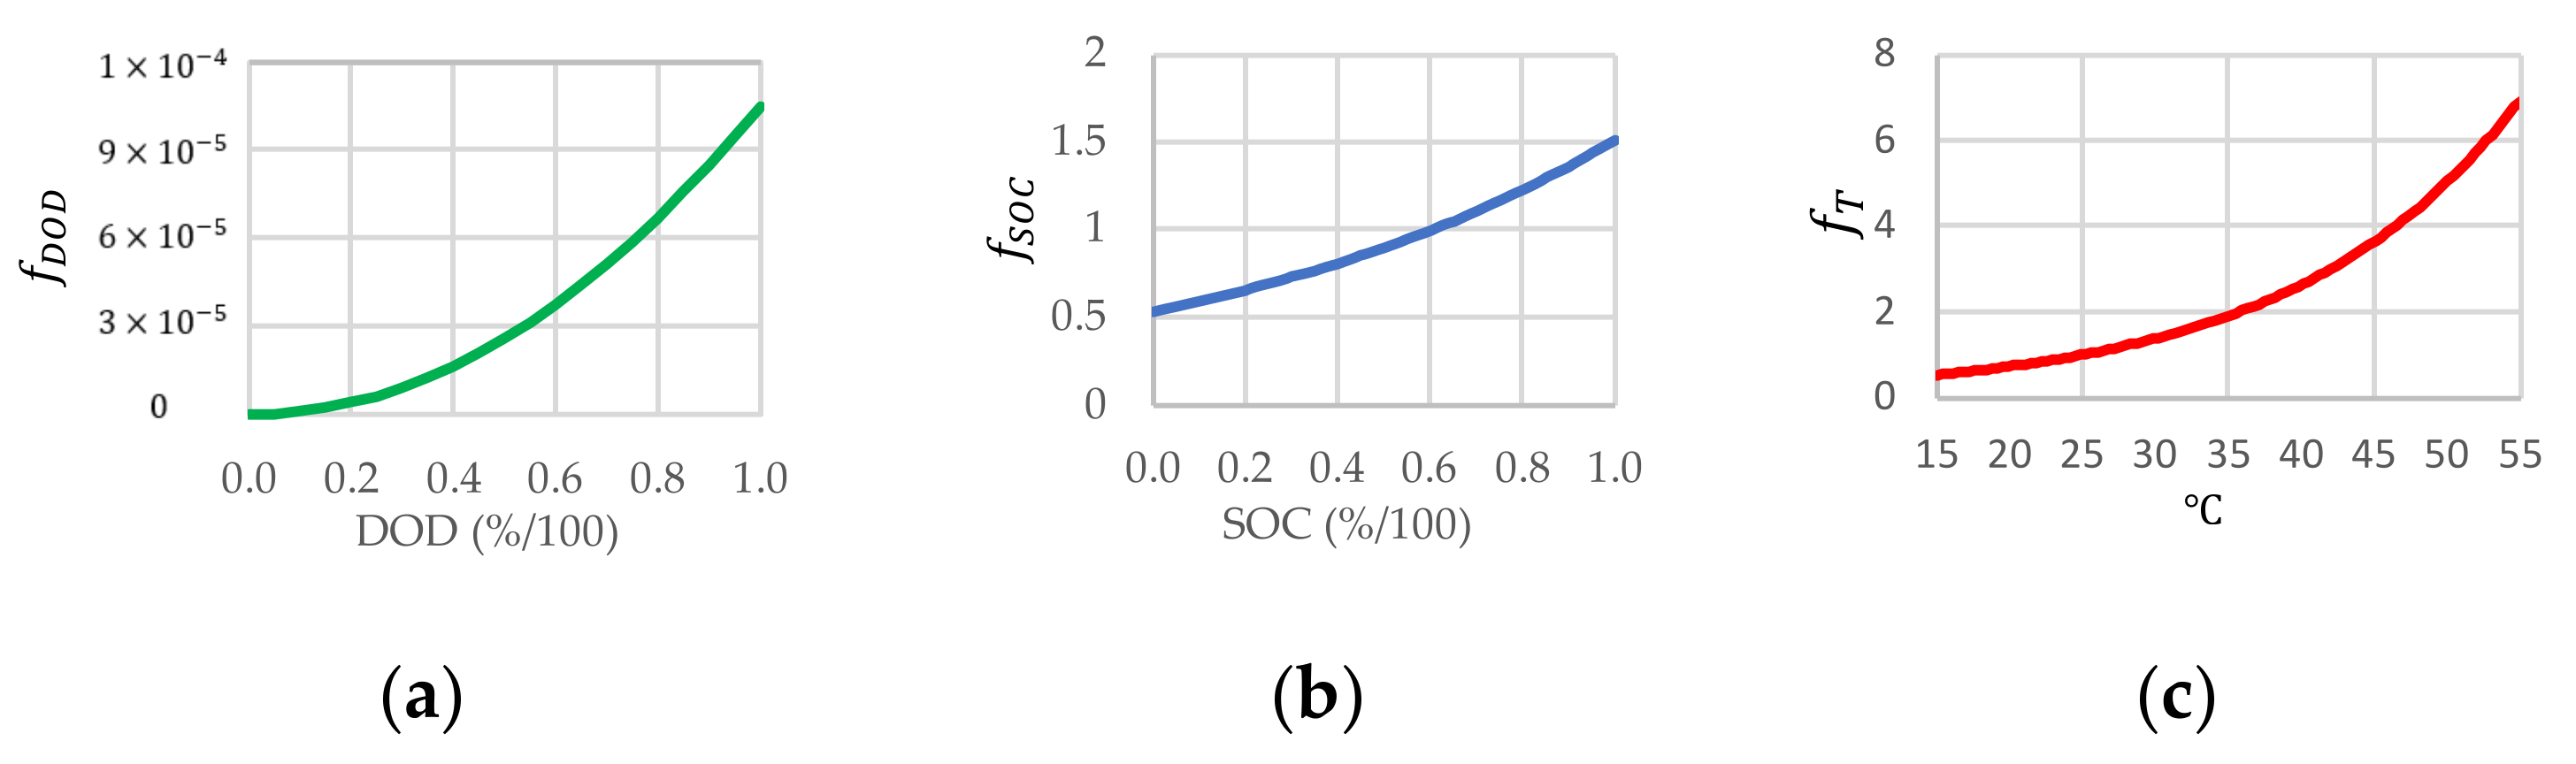
The recommended stress models are calculated and illustrated in
Figure 3, where the temperature has the greatest impact on battery aging followed by SOC and DOD.
In this aspect, the semi-empirical models are acceptable in our study. The charge and discharge profiles, as well as the temperature, have a symmetrical profile within an operation period, i.e., the battery is charged during the day from 20 to 90% SOC at 35 °C and discharged to the EV from 90 to 20% SOC at 25 °C; thus, the SOC and temperature average are same value used in both calendar and cycle aging calculations. This work keeps the battery’s charge and discharge currents at 1 C to retain its operating temperature, as well as the study’s average ambient temperature of 30 °C. We investigate battery deterioration over a range of SOC operating windows for both an NB and SLEB in order to predict life fading for economic evaluation. The different SOC windows for batteries are 65–15% (50% DOD, 45% ), 85–20% (65% DOD, 52.5% ), and 95–10% (85% DOD, 52.5% ). The varied DODs simulate user behaviors in a real-world driving situation where each driver could have distinctive charge preferences that differ from the others.
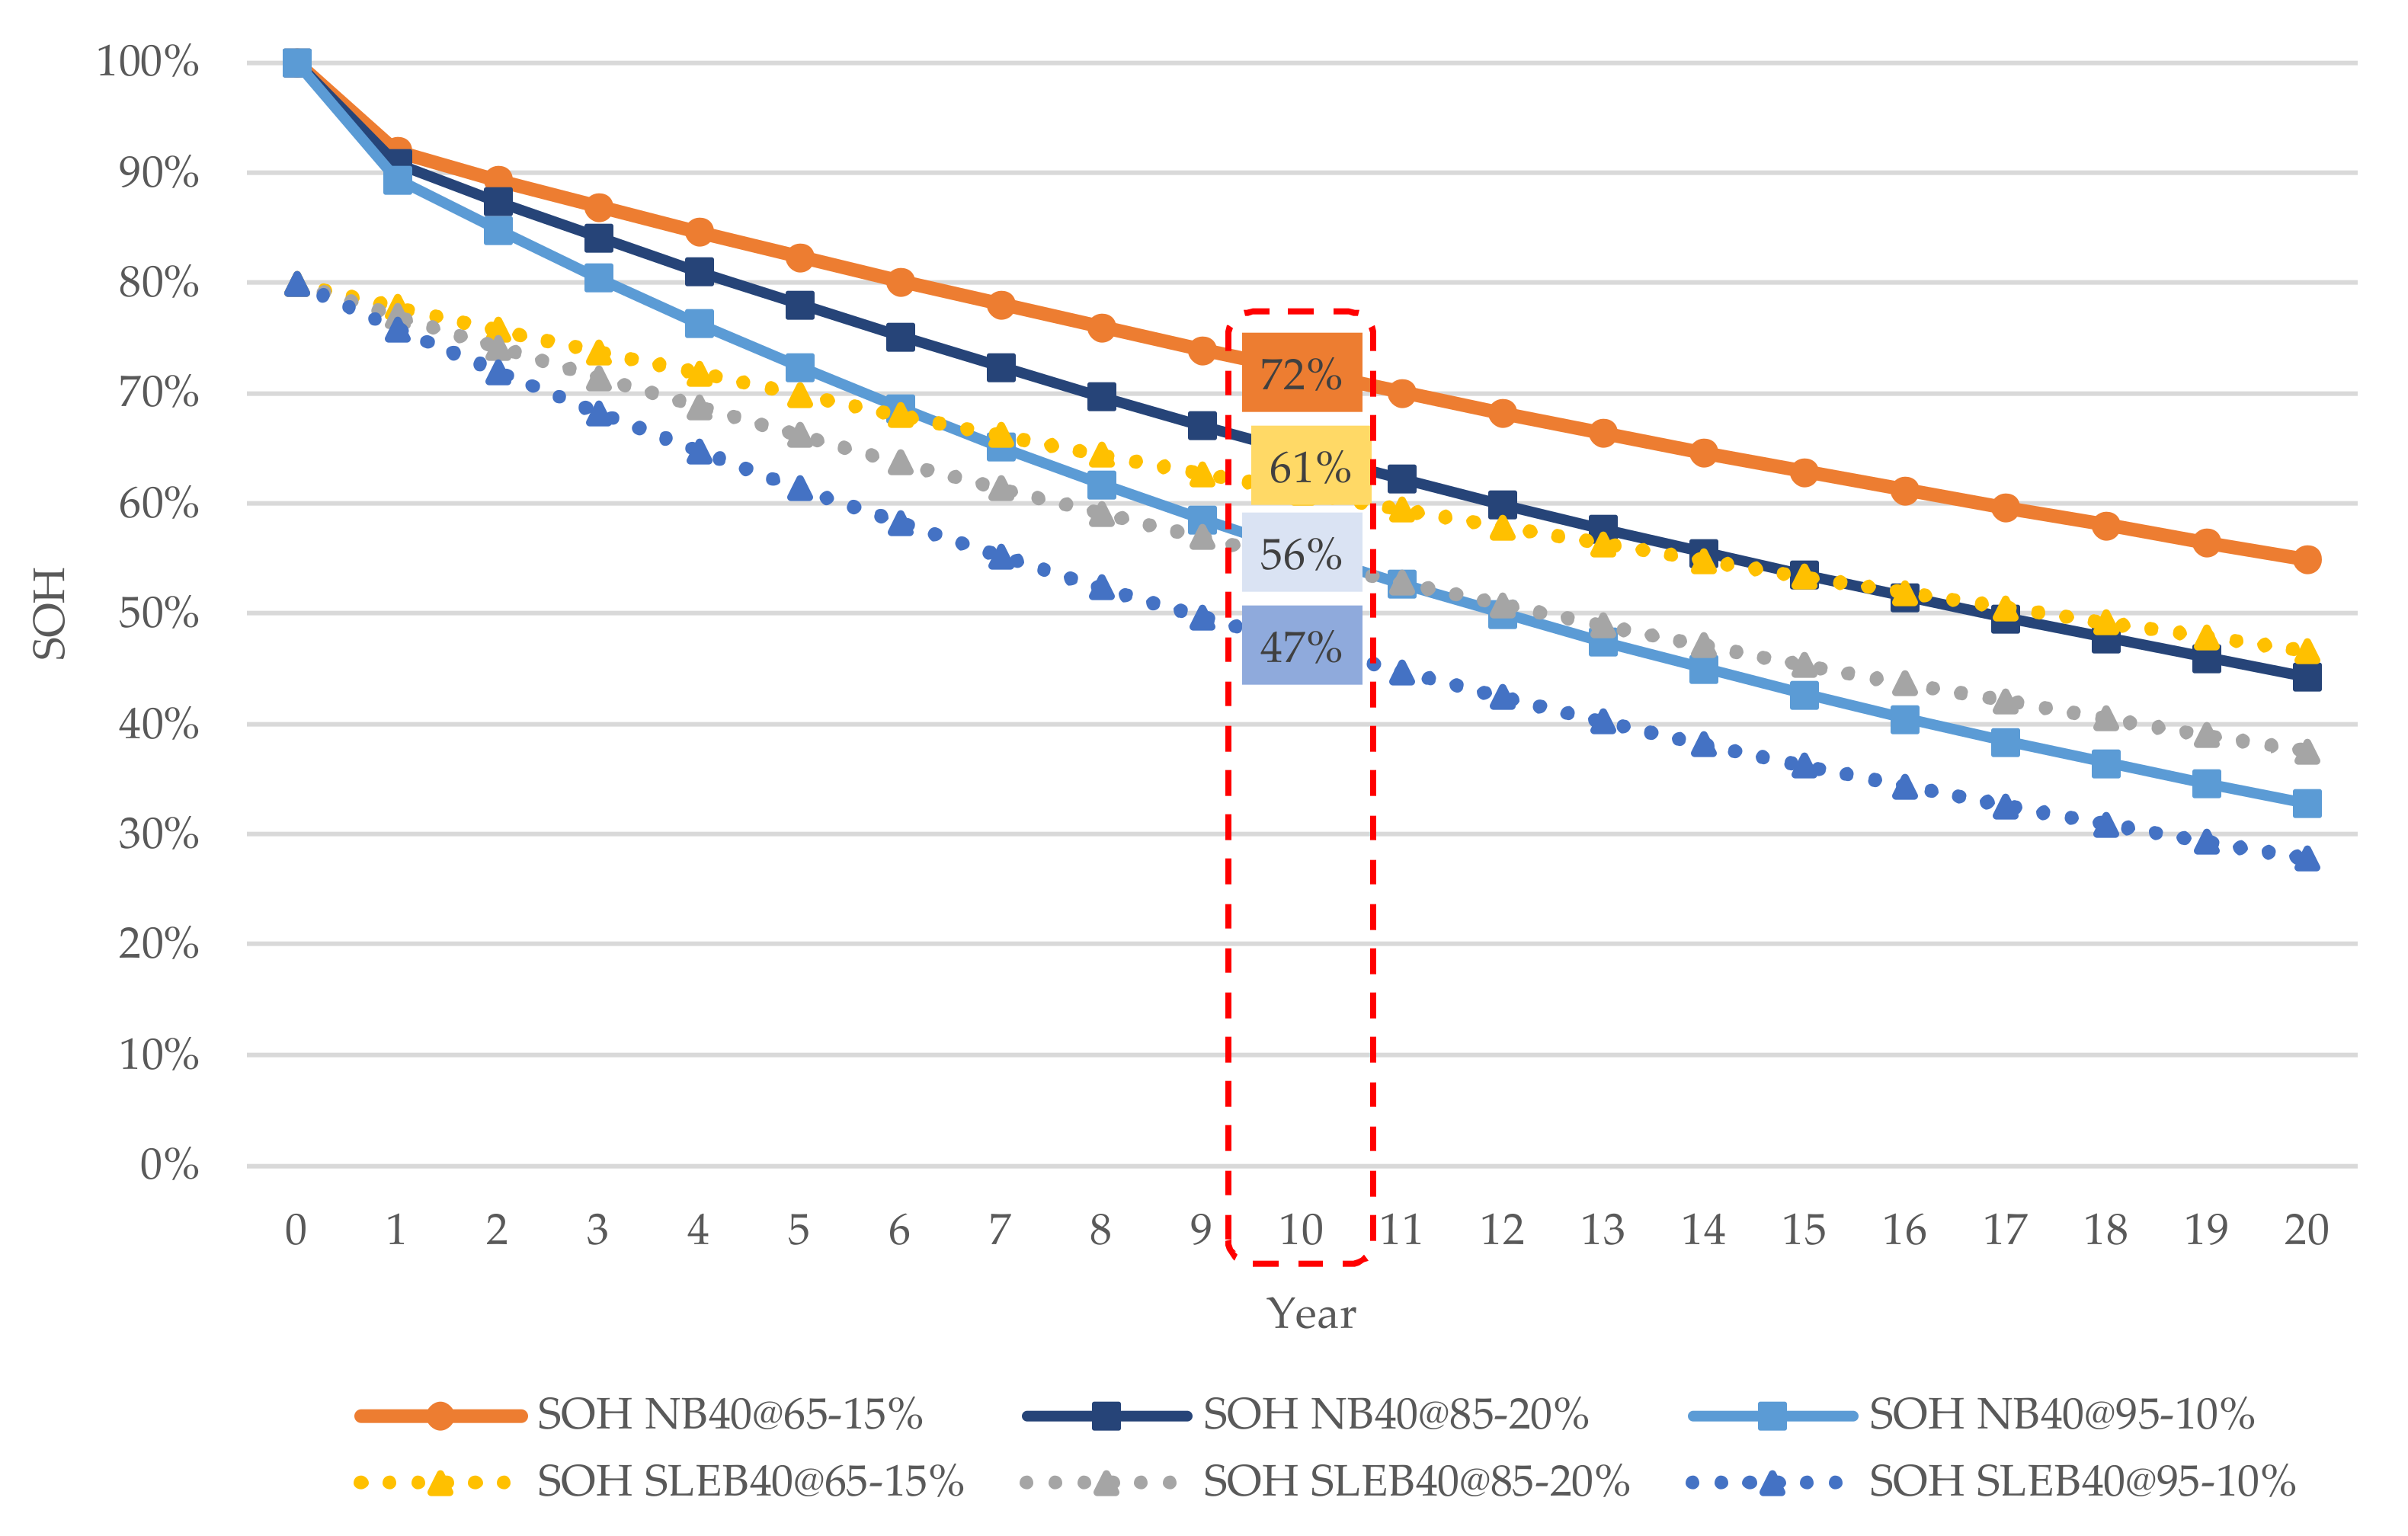
The numerical calculations of battery degradation are shown in
Figure 4. Whether in an NB or SLEB, the battery life falls when the SOC operating window widens at the same operating temperature. However, non-linear battery aging, which is a natural occurrence brought on by SEI development, causes a significant loss of life in the first year of an NB, according to Equation (1), before steadily diminishing over the subsequent years. After passing the SEI development based on the equation, the battery’s SOH starts at 80% compared to the SLEB (2). The SLEB operated at 65–15% SOC has a 19 percent life loss throughout the 10-year period, whereas the NB has a 28% life loss. The SLEB life decreases by 33% and the NB life decreases by 44% throughout the same period when the SOC varies between 95% and 10% for large DOD activity. Because the aging life of the NB and SLEB working at SOC 85–20% DOD falls between the largest and the smallest DOD activities in this regard, this DOD strategy will not be targeted. In conclusion, within the same time span, the SLEB made a larger contribution to the technological approval for a stationary application than the NB. This study also demonstrates that, despite the SLEB being used in the largest DOD operation for 10 years, it is still useful in recycling processes where retired SLEB should have SOH levels above 40%. Moreover, the SLEB replacement period will align with the lifetime of power electronics equipment, such as a hybrid converter, promoting sustainability with savings.
3.2. Levelized Cost of Electricity of the Renewable Hybrid Power Source
The annualized lifetime cost of electricity production, which is often represented in dollars per kWh for a small power plant, is the cost incurred over the life of power producing systems. It takes into account the cost of the equipment, the cost of operation and maintenance, the efficiency of energy conversion, the capacity factor, and the discount rate, but it does not take into account equipment life degradation or annual benefit [
39]. The LCOE offers a period when the cost of energy generation technologies can challenge the grid tariff, and it is calculated by (8):
where:
is the cost of the PV project including PV module cost, hybrid converter, installation, and engineering;
is the capital recovery factor of PV, which is the constant annuity to the present value of the annual receiving for the project lifetime in years () along with the discount rate (), the minimum lending rate () of Thailand, and can be obtained by: ;
is the fixed operation and maintenance cost;
is the vary operation and maintenance cost;
is the fraction of the average power production of PV over one year.
The battery is utilized as an energy storage device, storing solar energy to recharge the EV for the zero-emission charging power program. This plan is based on a 4.5 h average solar power generation period,
[
40]. As previously stated, the energy stored in the battery can discharge for appliances when the EV is not present, hence retaining the battery’s capacity factor. The levelized cost of storage (LCOS) declares the lifetime cost of the storage used in receiving and supplying the energy as obtained by:
where:
is the battery capital cost;
is the capital recovery factor of the battery;
is the yearly operation and maintenance cost;
is the fraction of the average power supplied by the battery over one year;
is the cost of energy used to charge the battery;
is the energy conversion efficiency.
Table 2 lists the parameters used for LCOE and LCOS calculation obtained from the literature and chosen for this study from the years 2022 to 2031. The parameters are explained as follows: (1) PV lifetime is approximately used at 20 years, and the battery life received from the degradation study is 10 years, (2) energy conversion efficiency and capital cost of PV, NB, and SLEB are obtained from the aforementioned literature, (3) O&M costs are obtained from the current values provided by the US Department of Energy, and (4) capacity factor is Thailand’s sunshine period, and it is used for battery discharge hours. Because solar energy is used to recharge the battery, the LCOE of a hybrid power source is the sum of LCOE and LCOS [
41].
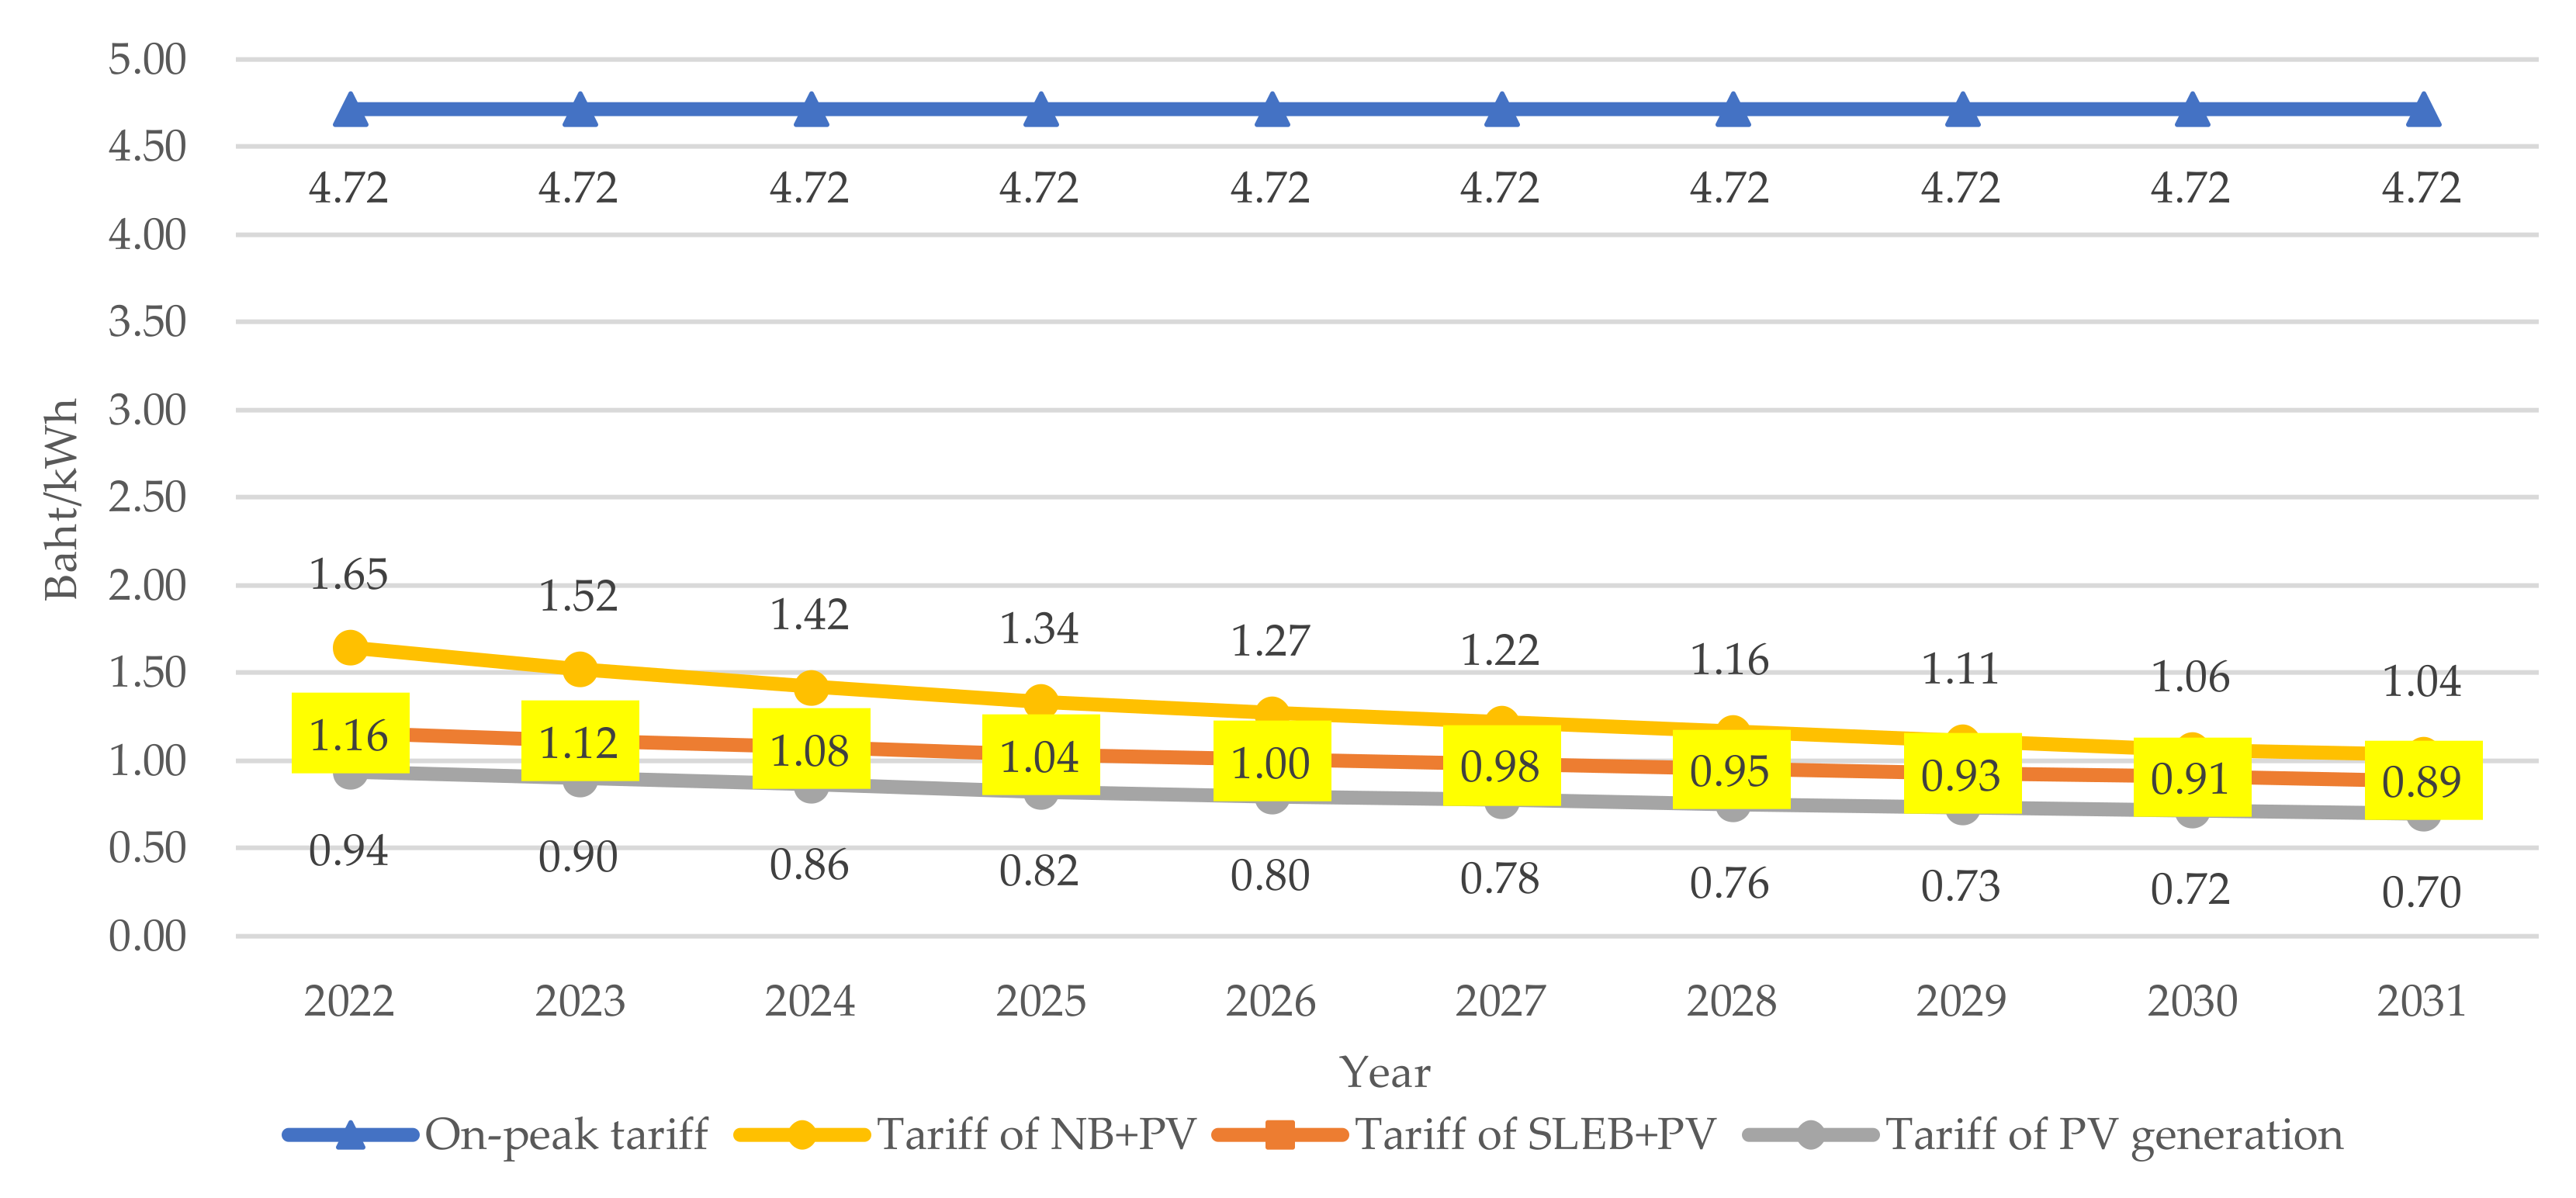
In Thailand, the grid price for household usage exceeding 400 kWh has been set at 4.72 baht/kWh, with a 7% tax, beginning in late 2022. In this study, the grid tariff is compared to the various LCOEs to determine the most cost-effective charging power for EVs. The tariff comparison in
Figure 5 shows that the PV tariff is the cheapest, followed by the SLEB+PV and NB+PV pricing from 2022 to 2031 [
9,
43]. As a result, it is likely a good time to deploy renewable energy sources with storage, either as new or used batteries. However, the LCOE calculation does not account for the loss in battery capacity over time. Therefore, a cash flow analysis is necessary to determine investment viability by calculating the IRR, NPV, and payback period.
3.3. Economic Analysis
To achieve a fair assessment of the profitability of the investment, the initial investment is calculated based on the real-world condition of equipment used in the hybrid power source to supply the EV load, which is capable of consuming 8.75–17.5 kWh/day.
Table 3 shows an initial investment (
calculation based on the capital cost of PV and batteries converted to Thai baht (THB) using US currency conversion
) at THB 35.4/USD. The rating capacity of PV array
, in kW, is calculated using the charging energy
, in kWh, over the average solar power production period and the conversion efficiency. To determine
, the available capacity
of the NB and SLEB is utilized to compute the energy required by the EV under various SOC constraints. The initial investment is calculated using the battery rating
of both NB and SLEB.
Once the initial investment cost has been received, it is necessary to investigate the annual revenue and expense, where the former takes into account the battery degradation rate for the consideration period, as determined using Equations (1) and (2), and the latter is the expense for year
, which uses an approximate miscellaneous constant value of THB 57/year (0.1% of the investment). It should be noted that the O&M cost is included in the LCOE and LCOS. As a result, the revenue declines in accordance with the SOH reduction along with year
. This may be determined by comparing the grid tariff with hybrid power sources using the NB or SLEB at various DODs for each year. Since the definition of charging an electric vehicle in this study is once daily, 365 days are utilized to evaluate the revenue for year
(
as follows:
where
is the LCOE of hybrid power source for year
and
is the charging energy for year
.
After that, cash flow, which is the difference between investment, revenue, and expense in each year is calculated as in (11):
where
is the cash flow of the project lifetime,
is revenue for year
, and
is the expense for year
.
The Net Present Value (NPV) is the difference between the value being recovered and the cost of a project. It is evaluated using the expression given by Equation (12):
where
is the cash flow for year
.
The NPV drops as the discount rate increases, as shown by Equation (12). As a result, the discount rate must ultimately fall to the point where the NPV equals zero. At this point, the project is no longer feasible, and the internal rate of return (IRR) is the discount rate. The IRR is what causes the NPV to be zero, as shown in Equation (13):
After accounting for all the project’s operational and overhead costs, payback is the amount of time needed to return the project’s capital investment. Payback may be determined by simply adding up all net earnings until the sum surpasses the original investment. Knowing the payback is particularly important when the capital must be recovered as quickly as possible, as would be the case in short-term projects. Payback is easily calculated by summarizing all the net revenue until the total equals the original investment, as is shown in Equation (14):
where
is the number of years accumulated until the NPV becomes positive,
is the NPV before it becomes positive, and
is the NPV after it becomes positive.
The numerical calculations based on the criteria utilized in the economic assessment of the hybrid power sources that applied the NB and SLEB at SOC 95–15% are shown in
Table 4. This is recognized because it offers the most advantage in comparison to other schemes, even though the methodology can be used for those strategies. The data reveal that using an NB at SOC 95–15% could not offer economic satisfaction since the payback would have surpassed the consideration time and the NPV would have been negative. Using a SLEB at the same SOC limit, however, the economic conclusion confirms project viability, with NPV becoming positive after 5 years, a payback period of 5.71 years, and an IRR of 15.35%. The initial charging energy of the SLEB operating in the 15–95% SOC range is larger than the expected maximum EV use per day of 17.5 kWh; however, this keeps the demand going until 2031. As a result, the designer could see the availability of energy during the stipulated period; otherwise, the project could not be implemented properly. To power household equipment, leftover energy from earlier times may be used.
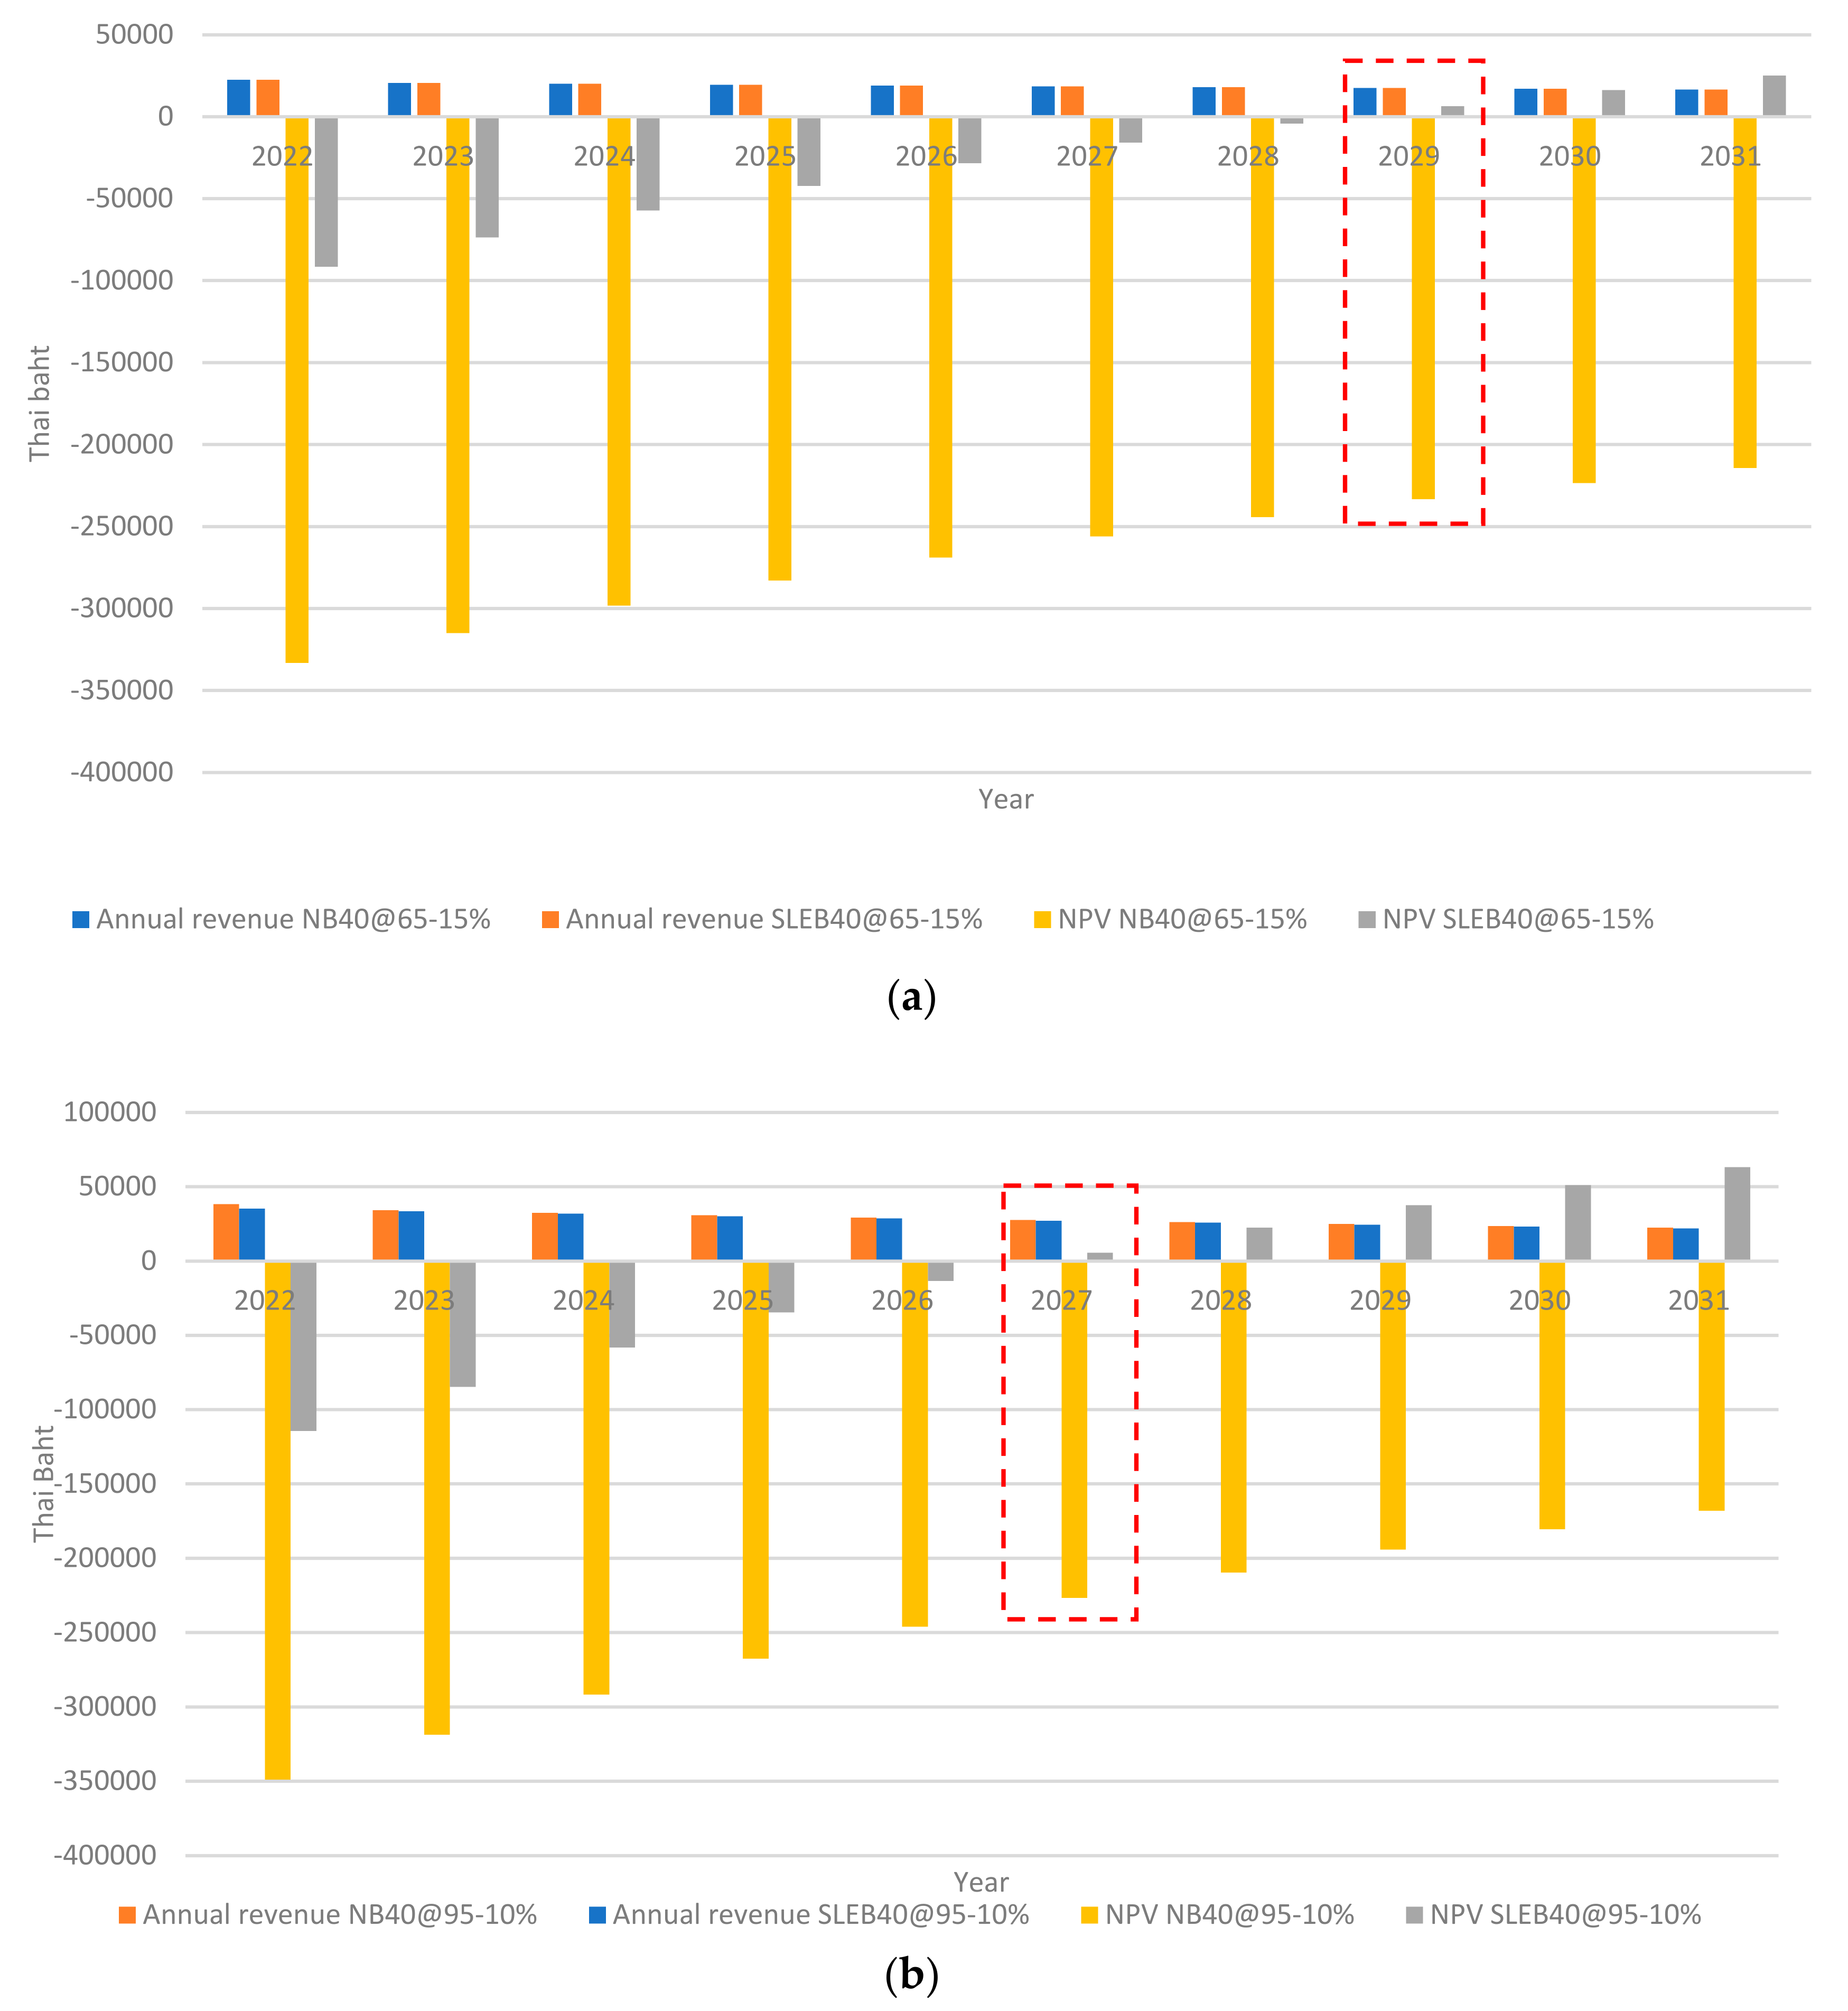
The economic evaluations for additional SOC restrictions applied to the NB and SLEB are depicted in
Figure 6a,b. The former image depicts the shallower DOD operation of the NB and SLEB, in which the SLEB offers a positive NPV after 7 years, whereas the latter figure depicts a deeper DOD operation, in which the SLEB delivers a quicker positive NPV after 5 years of deployment. The yearly revenues generated by the NB or SLEB applications in shallow or deep DOD are not very different, and therefore have no significant impact on the payback period other than the cost of the investment. It is clear that the SLEB offers a competitive advantage over the NB in terms of lesser investment and faster payback, both of which support project feasibility.
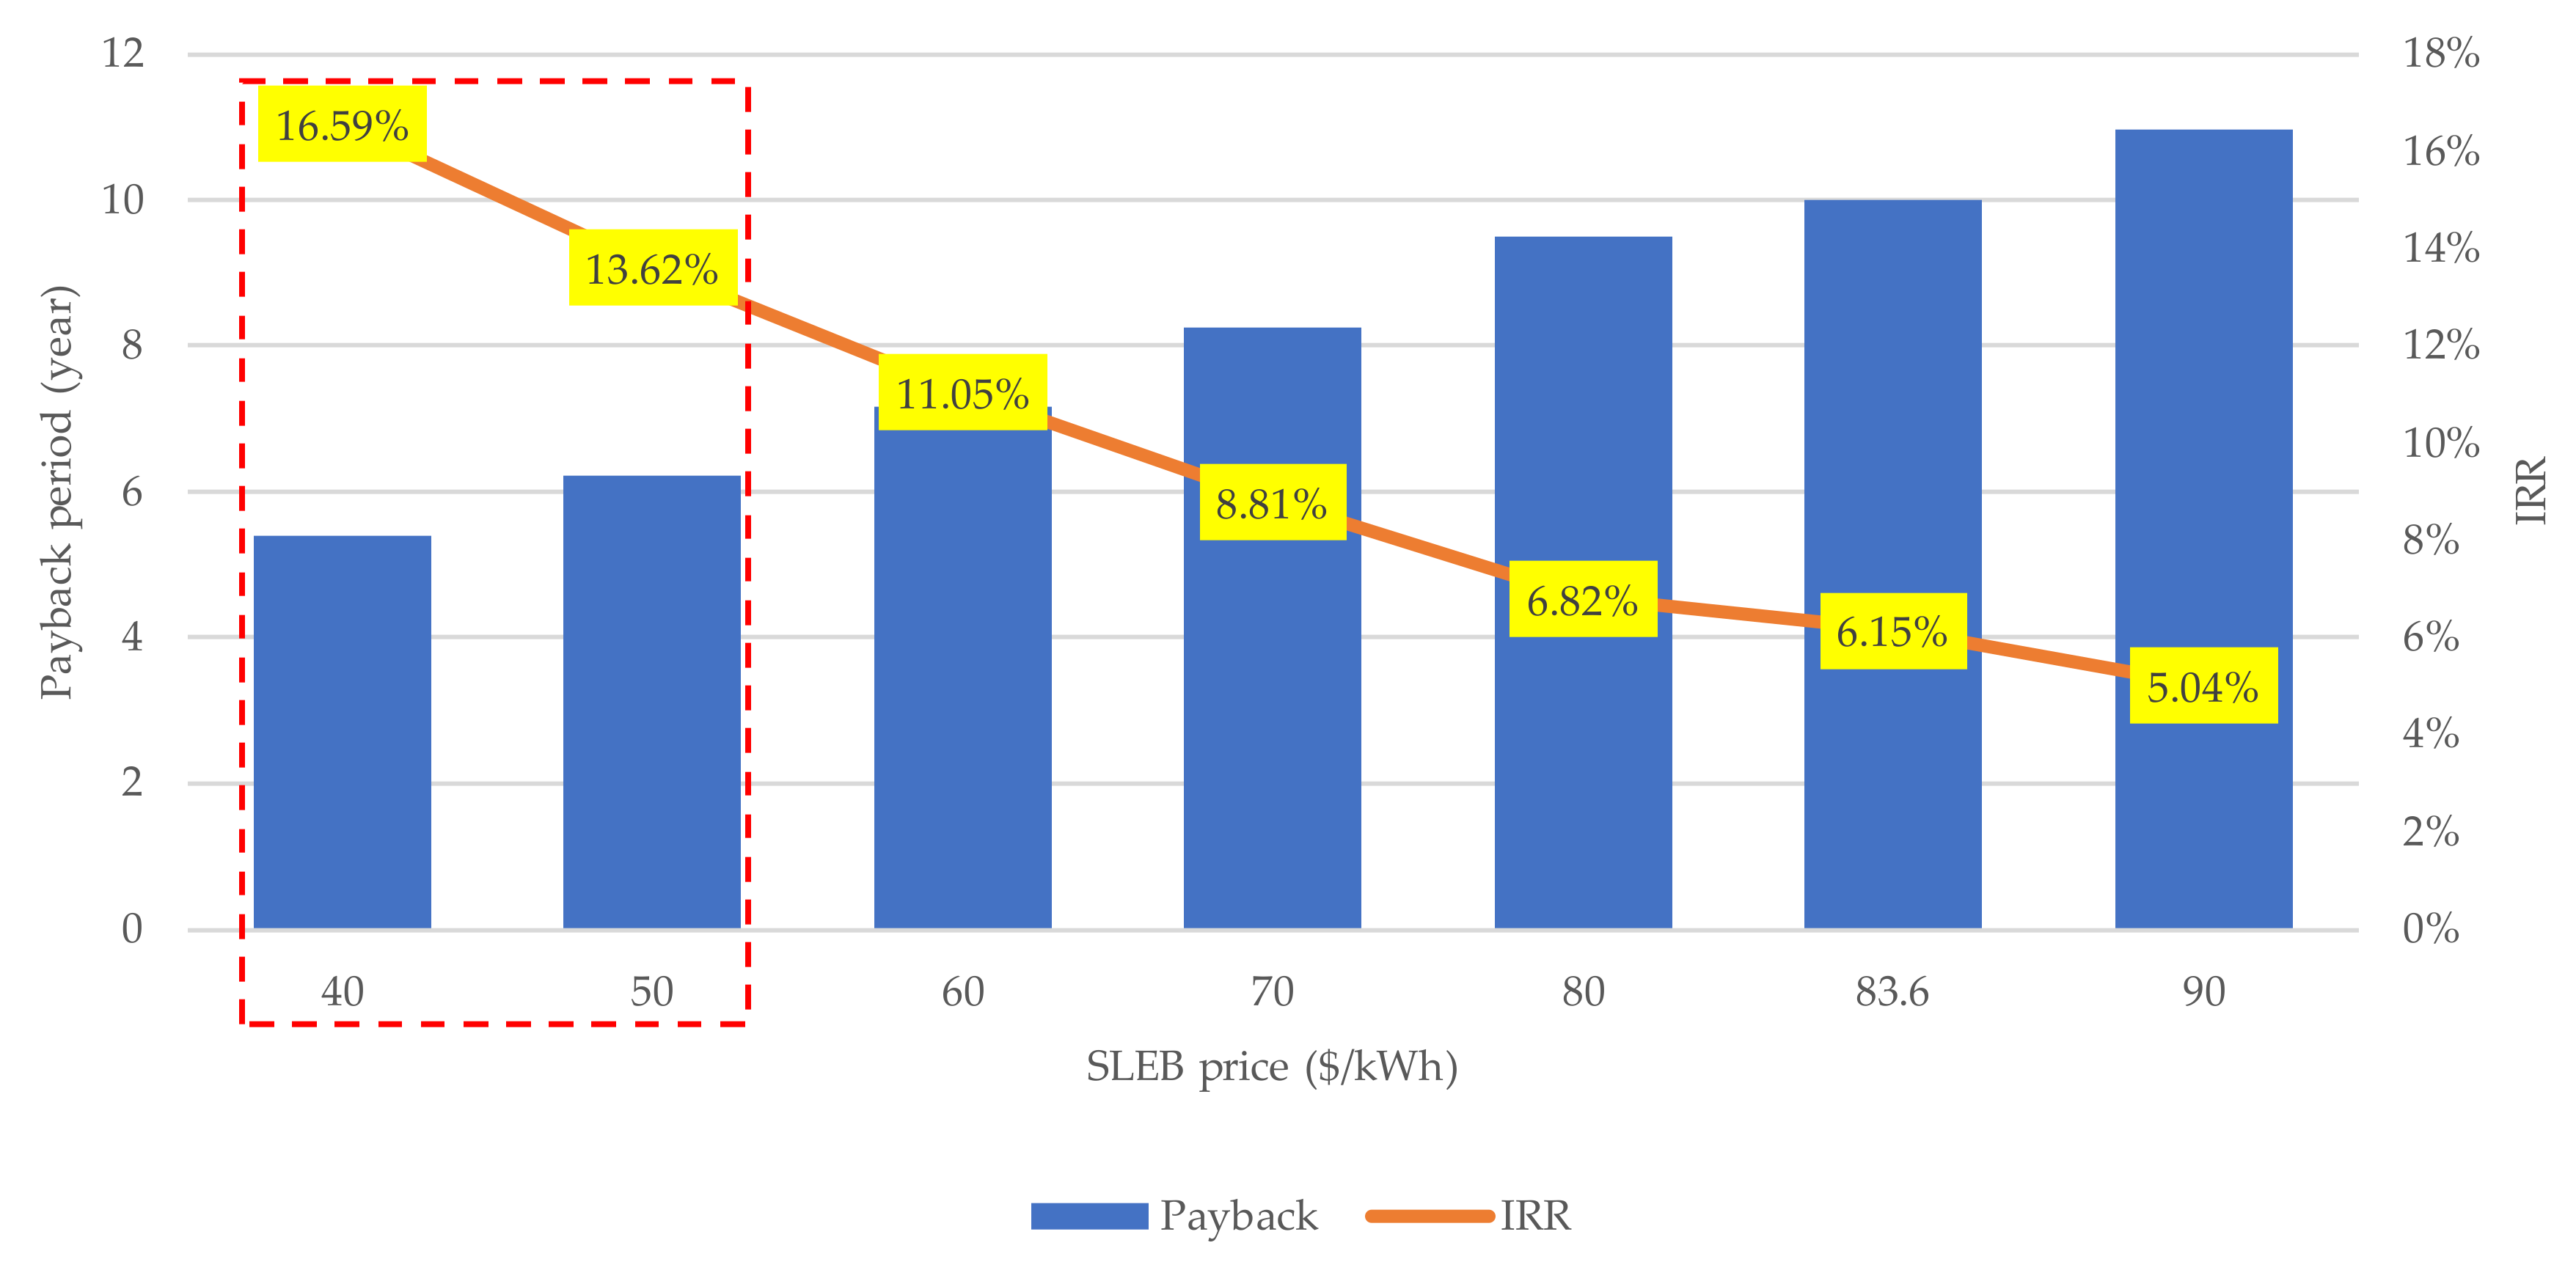
As soon as the SLEB presents a workable application, it is important to determine if the project’s feasibility is impacted by the sensitivity of the SLEB price. Using the same technique but a different battery price as is shown in
Figure 7, the fluctuation in the SLEB between USD 40 and 90/kWh is assessed. When the battery cost is as low as possible, about USD 40–50/kWh, it is found that the IRR is by far the MLR. This is a favorable option for those interested in deploying this project; nevertheless, the price of the battery at USD 83.6/kWh produces an equalization between the IRR and MLR where the payback is the same as the project lifespan, 10 years, and the NPV might be zero. Above this battery price, the project outcome is a non-benefit.
4. Result and Discussion
The outcomes of this study indicate that a SLEB is a potential application for harnessing solar energy to recharge EVs at home. The PV arrays located on the roof of the EV owner’s home and grid power supply electricity to a hybrid converter linked to the NB or SLEB. Instead of supplying high current in mobile applications, the battery can be put on the ground under natural air flow conditions and managed to run at the nominal current rating to prevent heat rise. To maintain the battery’s working temperature and the study’s average ambient temperature of 30 °C, the charge and discharge currents are kept at 1 C in this work. Battery theory and experimental data are merged to provide accurate and practical models for all operating conditions. It is found that the temperature, which is influenced by the C-rate, has the greatest impact on battery aging, followed by SOC and DOD. However, keeping temperature, time, and cycle of use constant, the average SOC level and DOD are the main factors, with the higher SOC average level resulting in quicker battery deterioration. It was discovered that a SLEB contributed more to the technical approval of a stationary application than an NB. Despite being used in the largest DOD operation over the past ten years, the SLEB is still valuable in recycling procedures. It might be time to implement renewable energy sources that also include storage, such as new or used batteries. However, because the LCOE calculation does not account for battery capacity fading over time, an economic cash flow analysis is required for project feasibility.
To conduct the economic analysis, the initial investment in both the NB and SLEB is calculated under real-world conditions. Year after year, the yearly revenue decreases in line with the SOH reduction. Other than the cost of the investment, the yearly revenues have no substantial influence on the payback period. According to this study, the NB application at SOC 95–15% could not deliver economic satisfaction since the payback period would have surpassed the assessment period. The SLEB, on the other hand, validates project feasibility at the same SOC limit. This is revealed by the sustainable recycling constraint of the battery, in which a specified SOH, i.e., 40%, might be an appropriate alternative to utilize until the battery creates a significant advantage in recycling.
In addition, the designer might check to verify if energy is available within the timeframe indicated; otherwise, the project may not be implemented properly. It is obvious that a SLEB has a competitive advantage over an NB in terms of lower investment and faster payback, both of which contribute to project viability. With a SLEB of about USD 40–50/kWh, it has been found that the IRR is still by far the MLR. This is a good option for those who want to implement this project.
However, direct SLEB use necessitates hybrid converter modification if the EV battery has a DC output of 100 or 300 V, which is higher than the off-the-shelf product. Comparatively speaking, altering the hybrid converter layout for an EV battery is preferable to using a buck converter, which would be big, costly, and inefficient. The following are only a few of the challenges to the project’s viability:
SLEB high voltage level adaption with the current hybrid converter;
SLEB cost that is as low as the results of the study;
Testing for SLEB preparedness using affordable and practical, yet reliable methods.
5. Conclusions
The fluctuation in energy costs forces people to reevaluate how they manage resources in the face of variable living expenditures. Instead of selling electricity to the grid, solar energy self-consumption is an interesting option for owners of renewable energy resource (RES) facilities. BESS for solar PV production affects customers’ choice but costly application discouraged users. As a result, one method for implementing this strategy is to use SLEBs that have been separated from an EV. Recycling used batteries for new uses is not only a practical way to deal with variable energy costs but is also good for the environment.
The usage of NBs and SLEBs in a net-zero emission EV home charging infrastructure is discussed in this paper. Based on the period chosen for sustainable replacement and the value of the retired battery in the recycling process, the study determines if the energy is still sufficient for EV everyday use by accounting for battery degradation over operating years. The battery life loss model states that temperature, SOC, DOD, length of time, and the cycle of use all have an impact on how quickly batteries degrade.
Using the largest DOD throughout the course of 10 years validates the feasibility of the project since the residual life of the SLEB can be increased by implementing a less demanding application for EV charging. This study uses the biggest SOC band in conjunction with the least expensive SLEB, for instance, not exceeding USD 50/kWh, to deliver the most benefit in terms of the payback period, which is around half of the project lifespan of 10 years. The techno-economic study is completed, and policymakers could be encouraged to support the SLEB stationary application campaign for net-zero charging power and to prepare for future energy variations.


