Article

Occurrence and Distribution of Long-Term Variability in Precipitation Classes in the Source Region of the Yangtze River

1
Department of Civil Engineering, National University of Computer and Emerging Sciences, Foundation for Advancement of Science and Technology, Lahore 54000, Pakistan
2
Key Laboratory of Mountain Surface Process and Ecological Regulations, Institute of Mountain Hazards and Environment, Chinese Academy of Sciences, Chengdu 610041, China
3
College of Geography and Environmental Science, Henan University, Kaifeng 475001, China
4
State Key Laboratory of Hydraulics and Mountain River Engineering, College of Water Resource and Hydropower, Sichuan University, Chengdu 610065, China
5
Low-Carbon and Climate Impact Research Centre (LCCIC), School of Energy and Environment, City University of Hong Kong, Kowloon, Hong Kong, China
6
College of Resources and Environment, University of Chinese Academy of Sciences, Beijing 100049, China
7
Faculty of Forestry, Universitas Gadjah Mada, Yogyakarta 55281, Indonesia
8
International Water Management Institute (IWMI), Lahore 54000, Pakistan
*
Author to whom correspondence should be addressed.
Sustainability 2023, 15(7), 5834; https://doi.org/10.3390/su15075834
Submission received: 24 November 2022 / Revised: 3 March 2023 / Accepted: 4 March 2023 / Published: 28 March 2023
(This article belongs to the Special Issue Hydro-Meteorology and Its Application in Hydrological Modeling)

Abstract

:
Various precipitation-related studies have been conducted on the Yangtze River. However, the topography and atmospheric circulation regime of the Source Region of the Yangtze River (SRYZ) differ from other basin parts. Along with natural uniqueness, precipitation constitutes over 60% of the direct discharge in the SRYZ, which depicts the decisive role of precipitation and a necessary study on the verge of climate change. The study evaluates the event distribution of long-term variability in precipitation classes in the SRYZ. The precipitation was classified into three precipitation classes: light precipitation (0–5 mm, 5–10 mm), moderate precipitation (10–15 mm, 15–20 mm, 20–25 mm), and heavy precipitation (>25 mm). The year 1998 was detected as a changing year using the Pettitt test in the precipitation time series; therefore, the time series was divided into three scenarios: Scenario-R (1961–2016), the pre-change point (Scenario-I; 1961–1998), and the post-change point (Scenario-II; 1999–2016). Observed annual precipitation amounts in the SRYZ during Scenario-R and Scenario-I significantly increased by 13.63 mm/decade and 48.8 mm/decade, respectively. The same increasing trend was evident in seasonal periods. On a daily scale, light precipitation (0–5 mm) covered most of the days during the entire period, with rainy days accounting for 83.50%, 84.5%, and 81.30%. These rainy days received up to 40%, 41%, and 38% of the annual precipitation during Scenario-R, Scenario-I, and Scenario-II, respectively. Consequently, these key findings of the study will be helpful in basin-scale water resources management.

1. Introduction

Hydrologic extreme events (flash floods, severe drought, rain storms, etc.) are the most major and devastating natural disasters with the significant character of great socio-economic losses [1,2,3]. These events have accelerated the occurrence and magnitude of devastation with climate change and human activities [4,5,6,7,8,9]. Precipitation extremes are of great importance among extreme events as they control all hydrological extremes [10,11,12,13]. In the shadow of climate change, extreme precipitation events have increased the risk of flash floods and landslides, threatening socio-economic infrastructures [14]. Extreme precipitation events are more critical than average events (floods, droughts, excessive soil erosion, etc.). They may severely impact human settlement, vegetation growth, and ecological disorder [15,16,17,18,19,20,21,22,23]. Thus, a clear understanding of the precipitation events and changes in their extreme events at regional and global scales is required.
Various precipitation-related studies have been conducted on the Yangtze River. The Yangtze River in China originates from the Qinghai–Tibetan Plateau (QTP), also known as “the Water Towers of Asia”. Yangtze River Basin (YRB) has been important in maintaining regional ecological balance (Zhang et al., 2014) [24]. However, the basin has aggravated climate change and large-scale afforestation activities as it is considered one of China’s most ecologically sensitive regions (Zhou et al., 2018) [9]. Several studies have been conducted in the YRB and Yangtze River Delta for the past two decades focusing on the trends in climatic variables, climate change, water balance, and climate extremes. For instance, Hu et al. [25] investigated the trends in the extreme precipitation indices in the Yangtze River Delta region using the non-parametric Mann–Kendall test and found that most of the indices demonstrated a rising trend through heavy precipitations (≥50 mm/day), which dramatically increased from 1960 to 2015. Chen et al. [26] analyzed the trends and return periods in the precipitation daily time series of 1960–2009 and reported that the probability of extreme events is higher in lower regions of the YRB. More specifically, Su et al. [27] explored the increased tendency of precipitation extremes in the middle and lower reaches in June during 1960–2003. Likewise, spatiotemporal trends in the climate extremes (e.g., temperature and precipitation) and their impacts on vegetation were identified by Cui et al. [28], and they concluded that there is a dramatic increase in heavy precipitation in the basin. The changes in the precipitation regimes were analyzed by Zhang et al. [24], and future trends in the precipitation extremes were explored [29]. However, the topography and atmospheric circulation regime of the SRYZ are different from other parts of the basin. The attenuation of the East Asian monsoon at high altitudes and large distances from the ocean causes the diverse nature of the monsoon circulation. Also, continuous shifting occurs of the influences between the western and the Indian monsoon [30], resulting in a complex spatial and temporal variation precipitation pattern. Along with natural uniqueness, precipitation constitutes over 60% of the direct discharge [24] in the SRYZ, which depicts the decisive role of precipitation on the ecological ecosystem and its health and socio-economic growth [31]. As a stepping stone for understanding precipitation patterns, few studies have been carried out [9,30,32,33,34], among which most studies focus on the linkages among variations in the temperature, precipitation, streamflows’ behaviors, ecology, and glacier metling. However, these studies are limited in conclusions based on climate extreme indices and also lack the detailed exploration of precipitation classes (e.g., light, moderate, and heavy precipitation) for the better understanding of the possible disaster occurrences of droughts and sustainable water resources management in the downstream area of the SRYZ.
Considering the above limitations, the study aims to provide a detailed view of the frequency and distribution of precipitation classes in the SRYZ. Particularly, the study focuses on the spatio-temporal variation at seasonal and annual scales, trends of the distribution, and percentage of rainy days, as well as total precipitation for each defined precipitation class and their relation. In addition, the trends in short-term (long-term) dry and wet spells for all prescribed scenarios are also explored. The findings from these analyses can be helpful references to water resource and eco-environment management, which is essential for effective water decision making across the SRYZ basin.

2. Materials and Methods
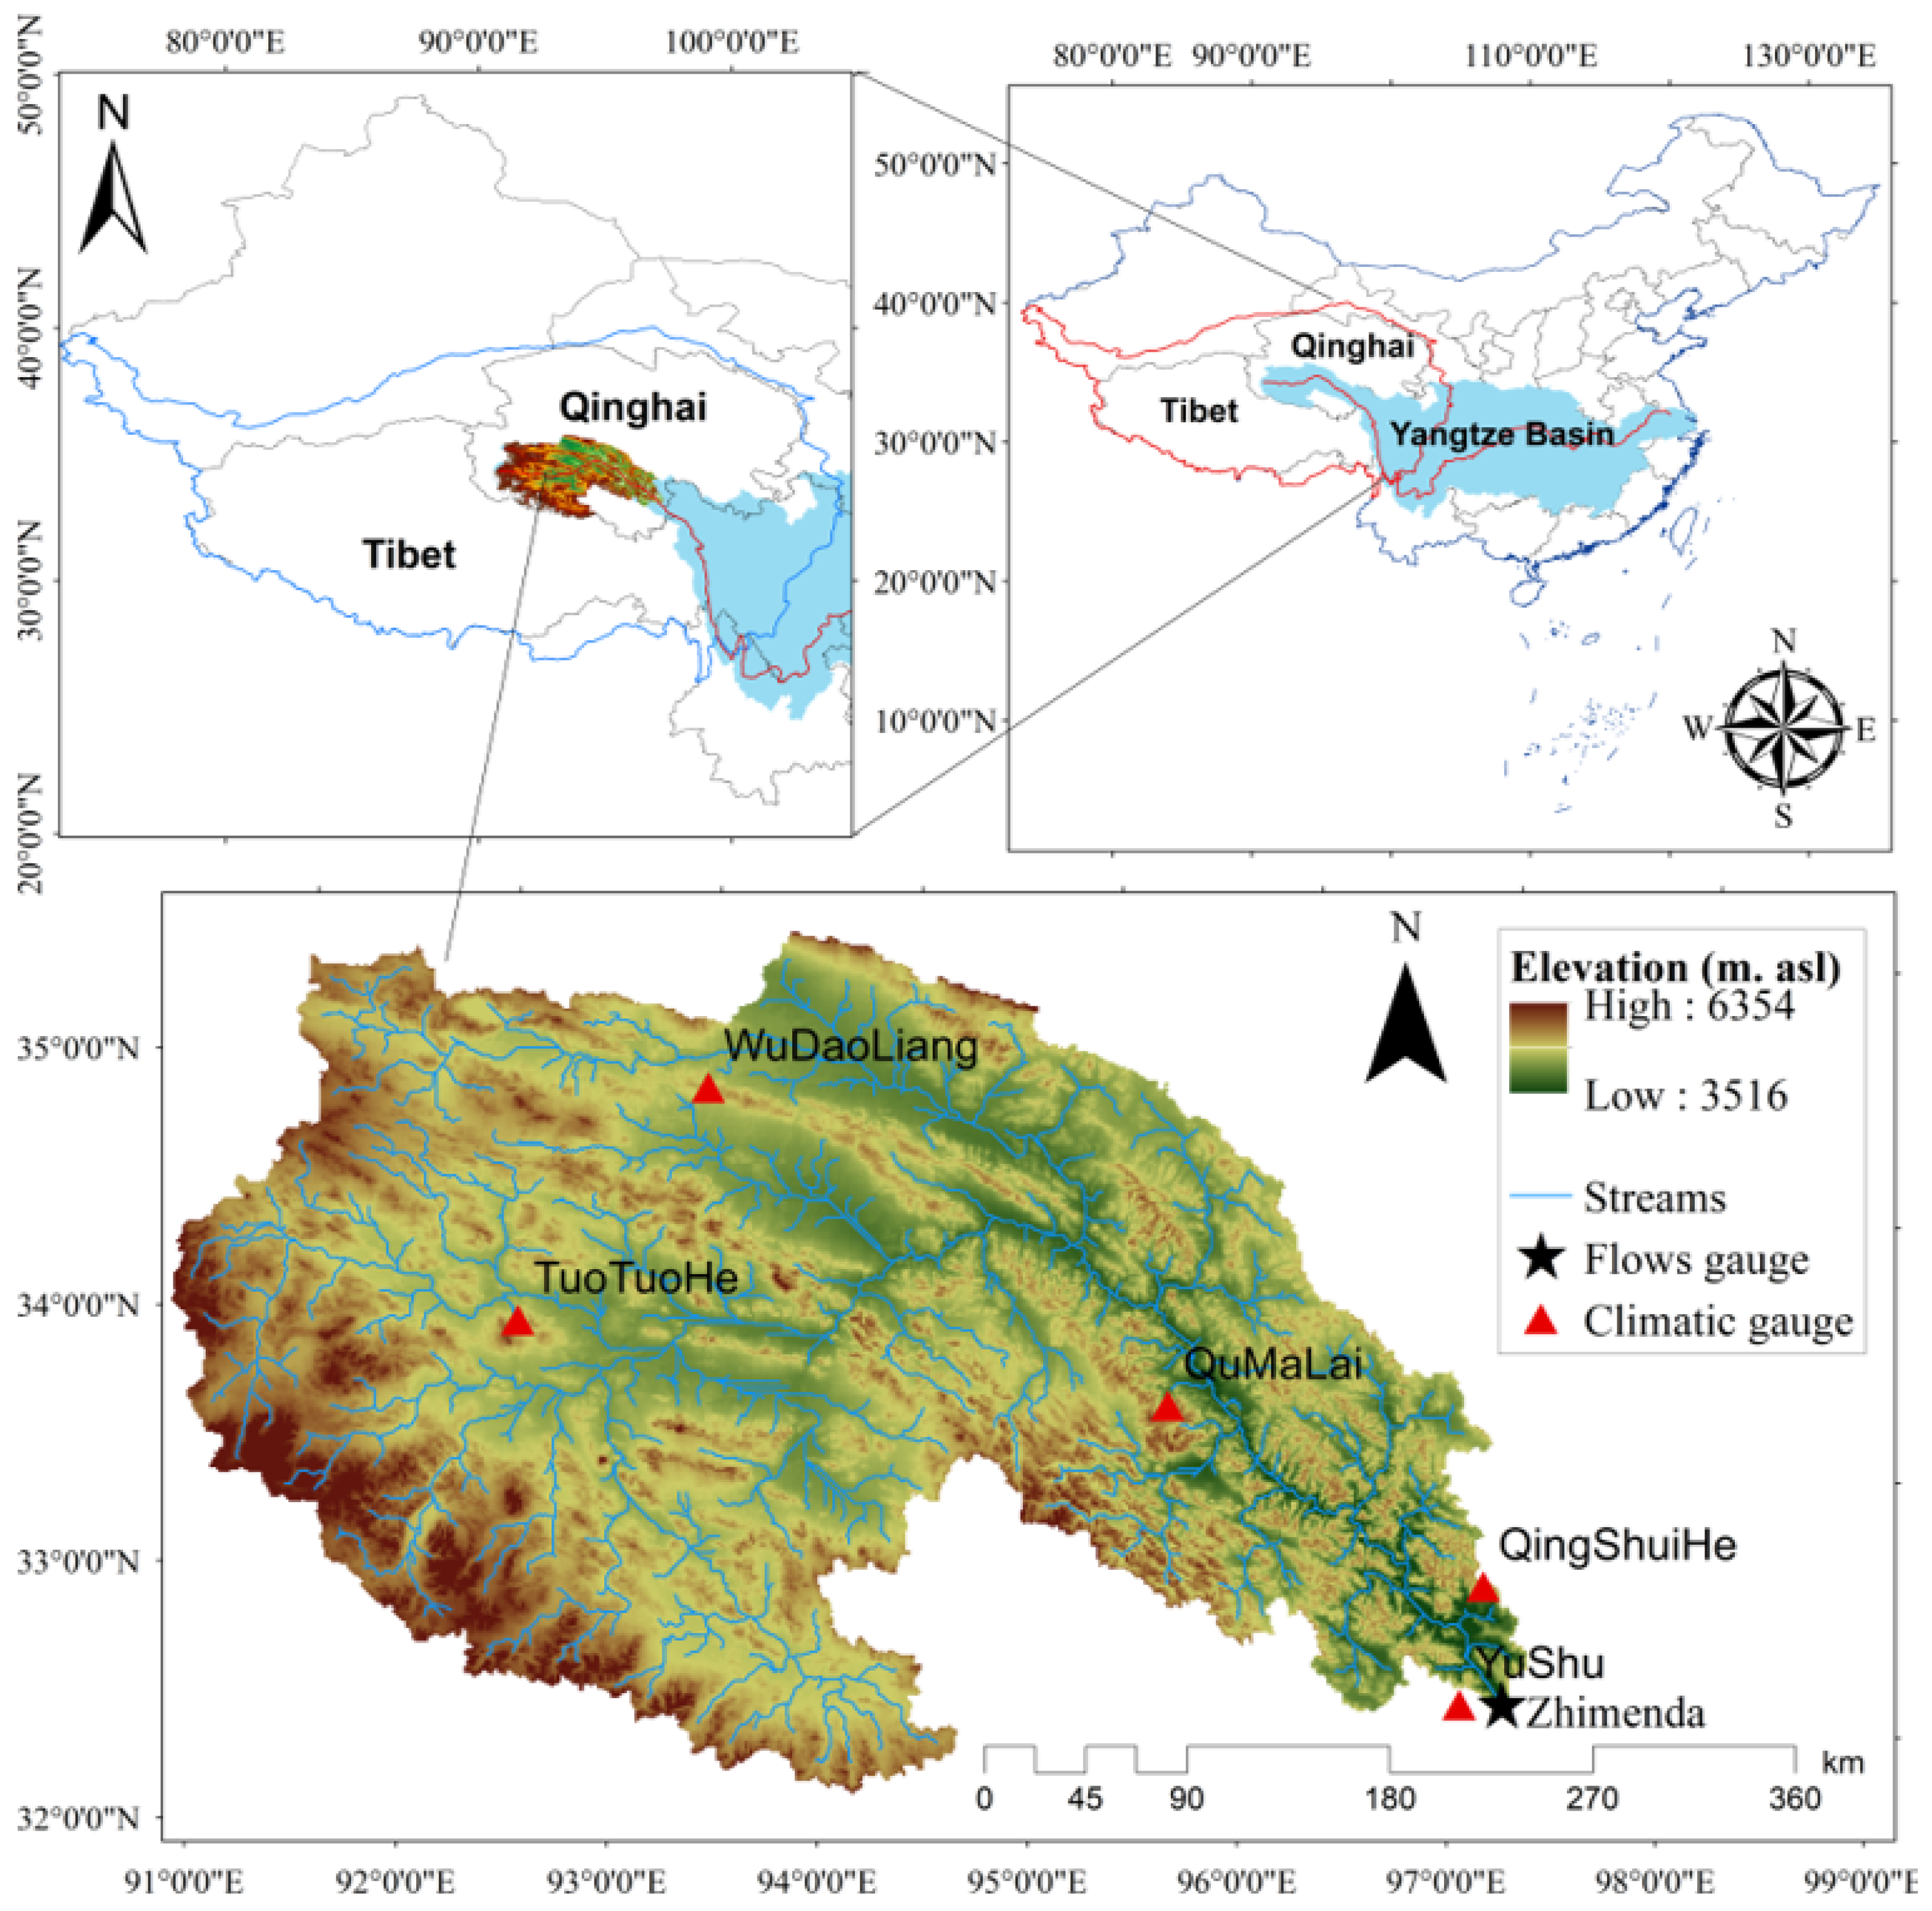
2.1. Study Area

The Yangtze River is the world’s third largest river and is the largest in China, with a length of 6300 kilometres. The SRYZ is located between longitude (90°30′ E to 9715′ E) and latitude (32°30′ N to 3550′ N) in the middle of the QTP (Figure 1). The SRYZ covers an area of 135,700 km2, which is 17% of the whole area of the QTP, there are 753 glaciers located in the SRYZ [35], and its water share is 20% of the total volume of water of the Yangtze River [36]. The land cover of the SRYZ is medium to high grassland, forests, barren land, glaciers, permanently frozen soil, and lakes [37,38]. Ahmed et al. [39] reported that the precipitation and river flows have an increasing trend with a magnitude of 1.2 mm/year and 1.32 m3/s/year. The high flow records are observed from July to August, and the highest flow of 2533 m3/s was observed in 2005 [39].

2.2. Data and Methods

The long-term (1961–2016) daily precipitation data of eight meteorological stations were collected from the China Meteorological Administration (Figure 1). The salient features of these climatic stations are provided in Table 1. The Pettitt test [40] was used to detect the change year in the precipitation time series. When the exact time of change is uncertain, the Pettitt test is used, which is a rank-based test for detecting substantial changes in the mean of time series data. The test is regarded as resilient to changes in time series distributional form and is relatively powerful when compared to the Wilcoxon–Mann–Whitney test, cumulative sum, and cumulative deviations. Furthermore, the Pettitt test has been widely used to detect changes in time series meteorological and hydrological data [39,41,42,43].
The alternative and null hypotheses is reformulated as follows [42]:
Ho: The T variables are distributed according to one or more distributions with the same location parameter.
The two-tailed test: for the Ha, there is a time t when the location parameter in the variables is changed.
Test with two tails: for the Ha, there is a moment t when D reduces the location parameter in the variables.
The right-tail test: for the Ha, there is a moment t when the variable’s location parameter is increased by D.
The statistic used for the Pettitt’s test is computed as follows [44]:
Let D i j = 1   i f   x i x j > 0 ,   D i j = 0   i f   x i x j = 0 ,   D i j = 1   i f   x i x j < 0 , U t , T = i = 1 t j = i + 1 T D i j .
The Pettitt’s statistic for the various alternative hypotheses is given by:
K T = U 1 , T 1 t T m a x , for the two-tailed case
K T = U 1 t T m a x t , T , for the left-tailed case
K T + = U 1 t T m a x t , t , T , for the left-tailed case
Using the Pettit test, a change point occurred at a 95% confidence level in 1998; with this knowledge, the whole time series was divided into the time scale for further analysis: Scenario-R (1961–2016); pre-change point, i.e., Scenario-I (1961–1998); and post-change point, i.e., Scenario-II (1999–2016). Linear trend analysis with a one-way ANOVA test (95% significant level) was used to identify the statistical significance of the trend magnitudes.
This study considered a daily precipitation amount of ≥0.1 mm/day as a rainy day [45], where dew, frost, sleet, and fog were not considered. Annual, seasonal, and daily data were analyzed during prescribed scenarios and precipitation classes, as summarized in Table 2. Following the works of [45], the classified daily precipitation amount is presented in Table 2.

3. Results

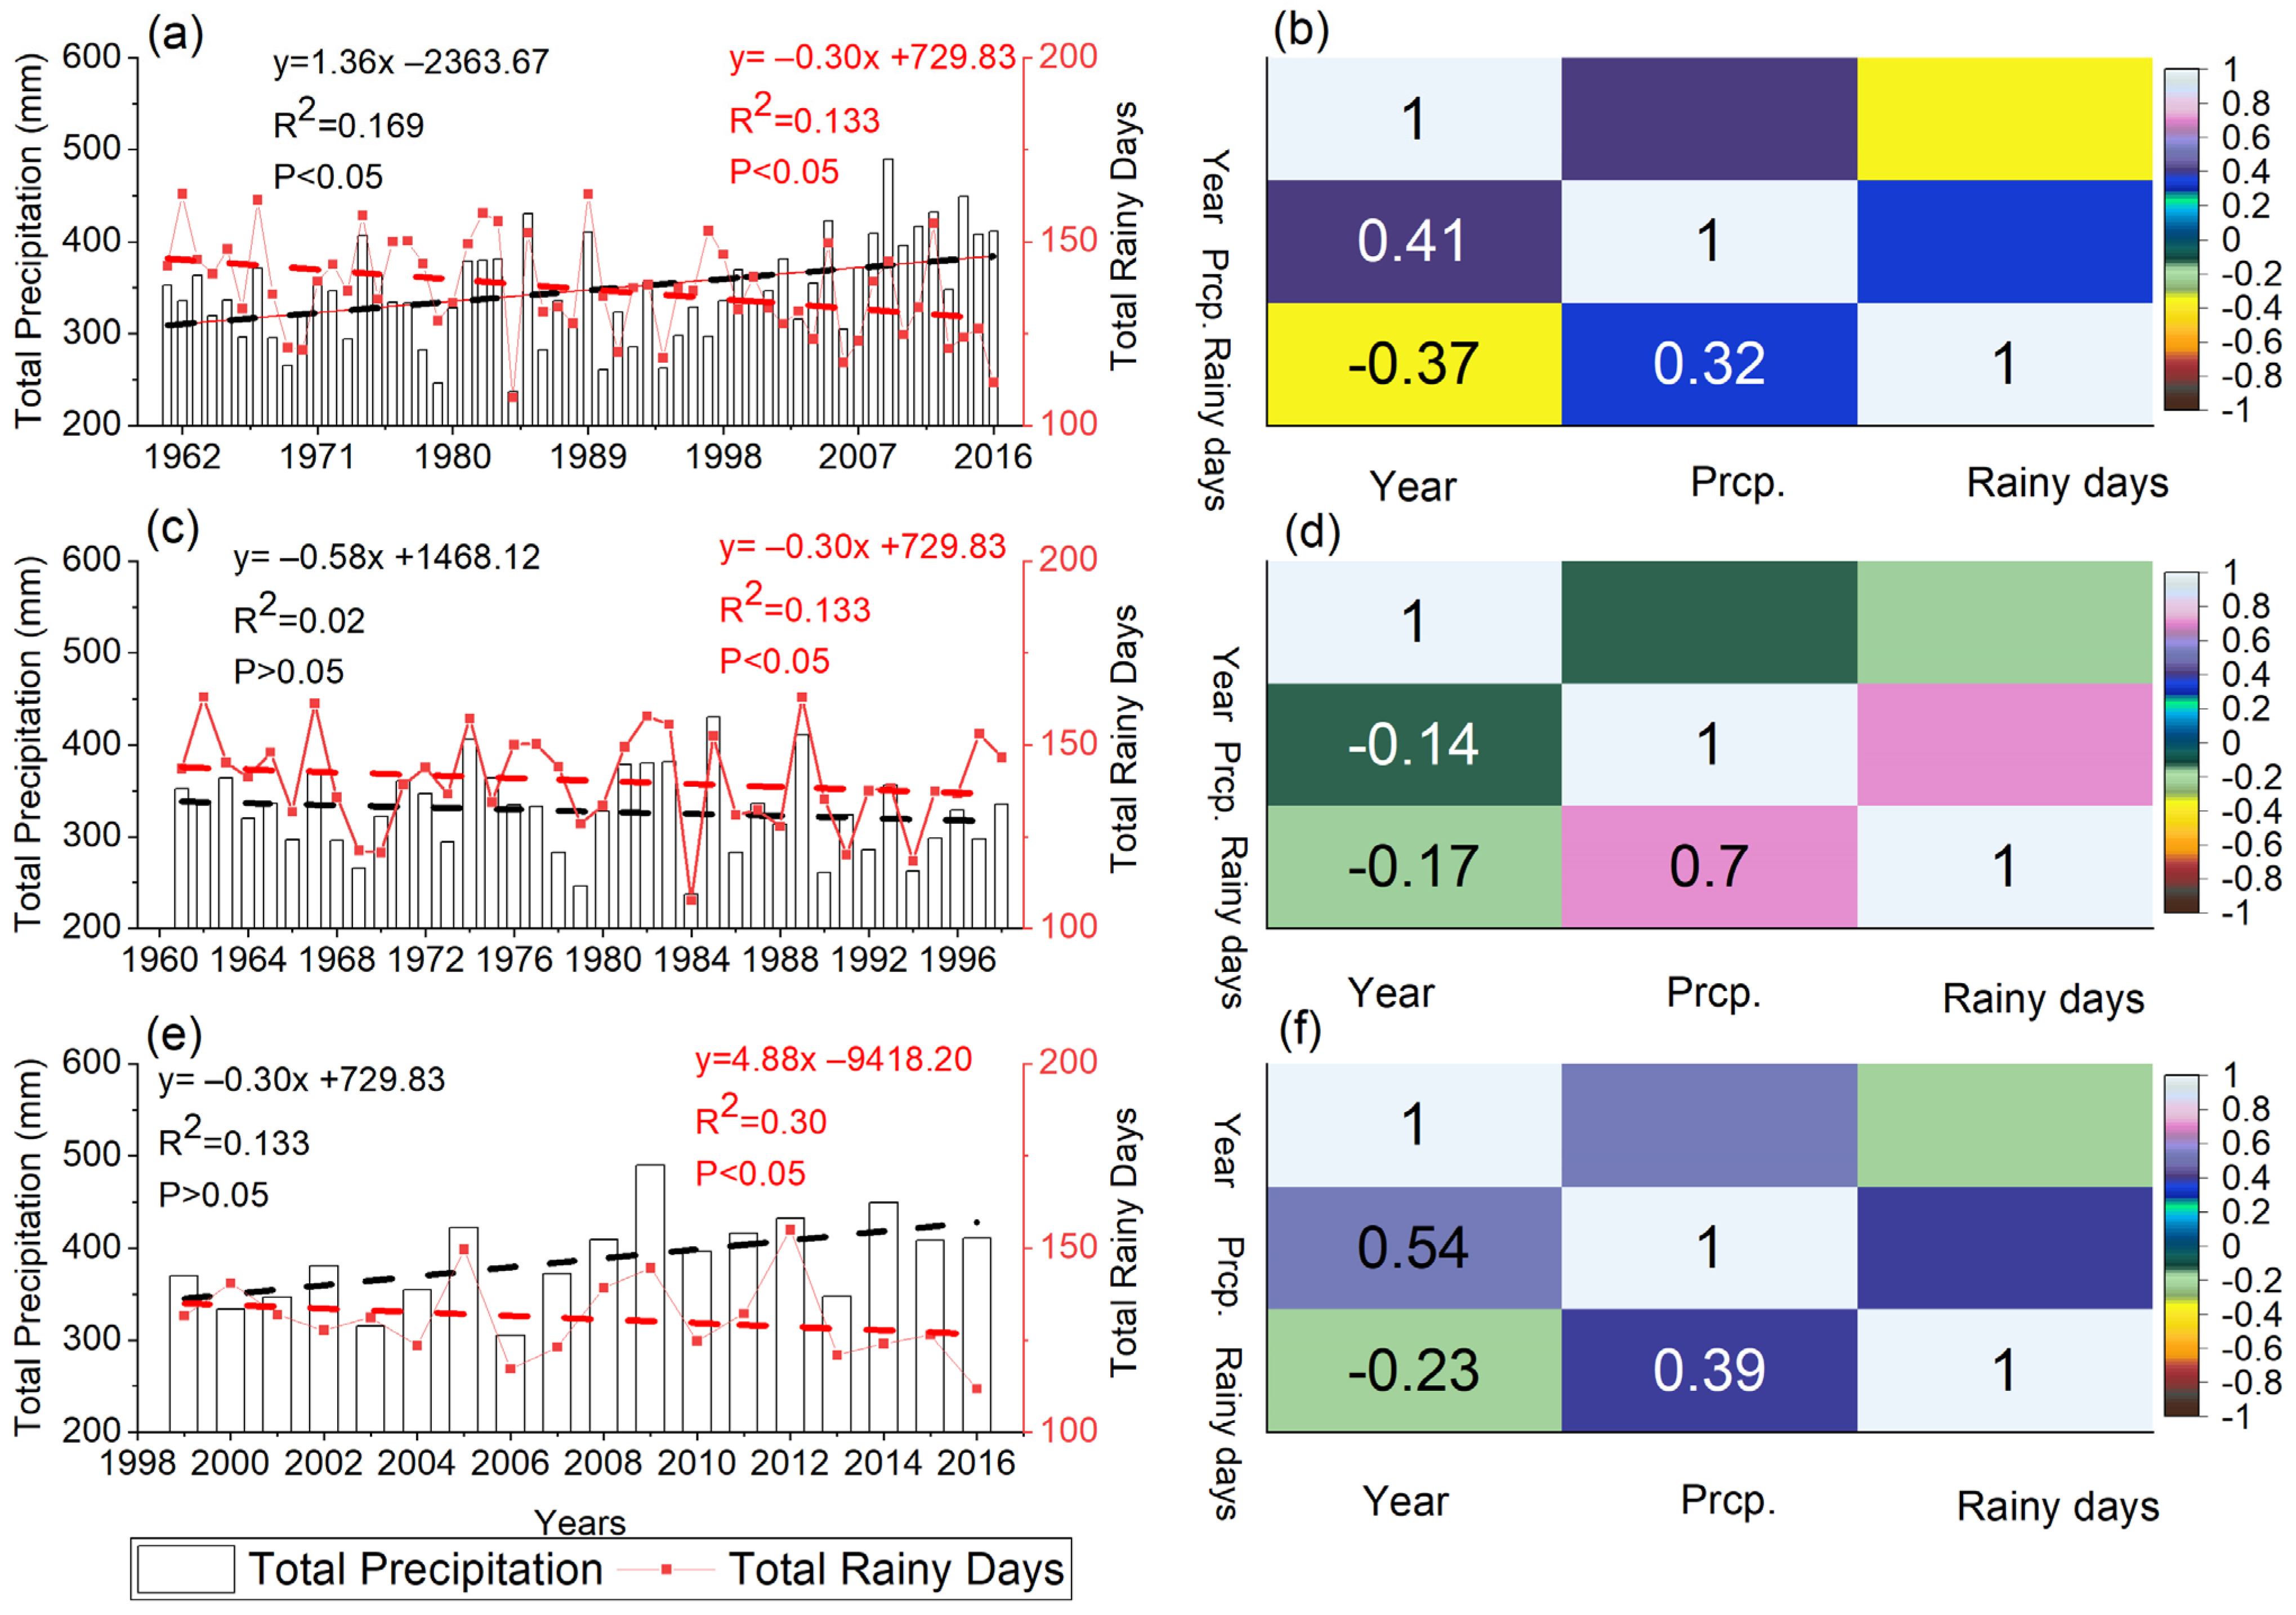
3.1. Spatio-Temporal Distribution of Precipitation and Rainy Days

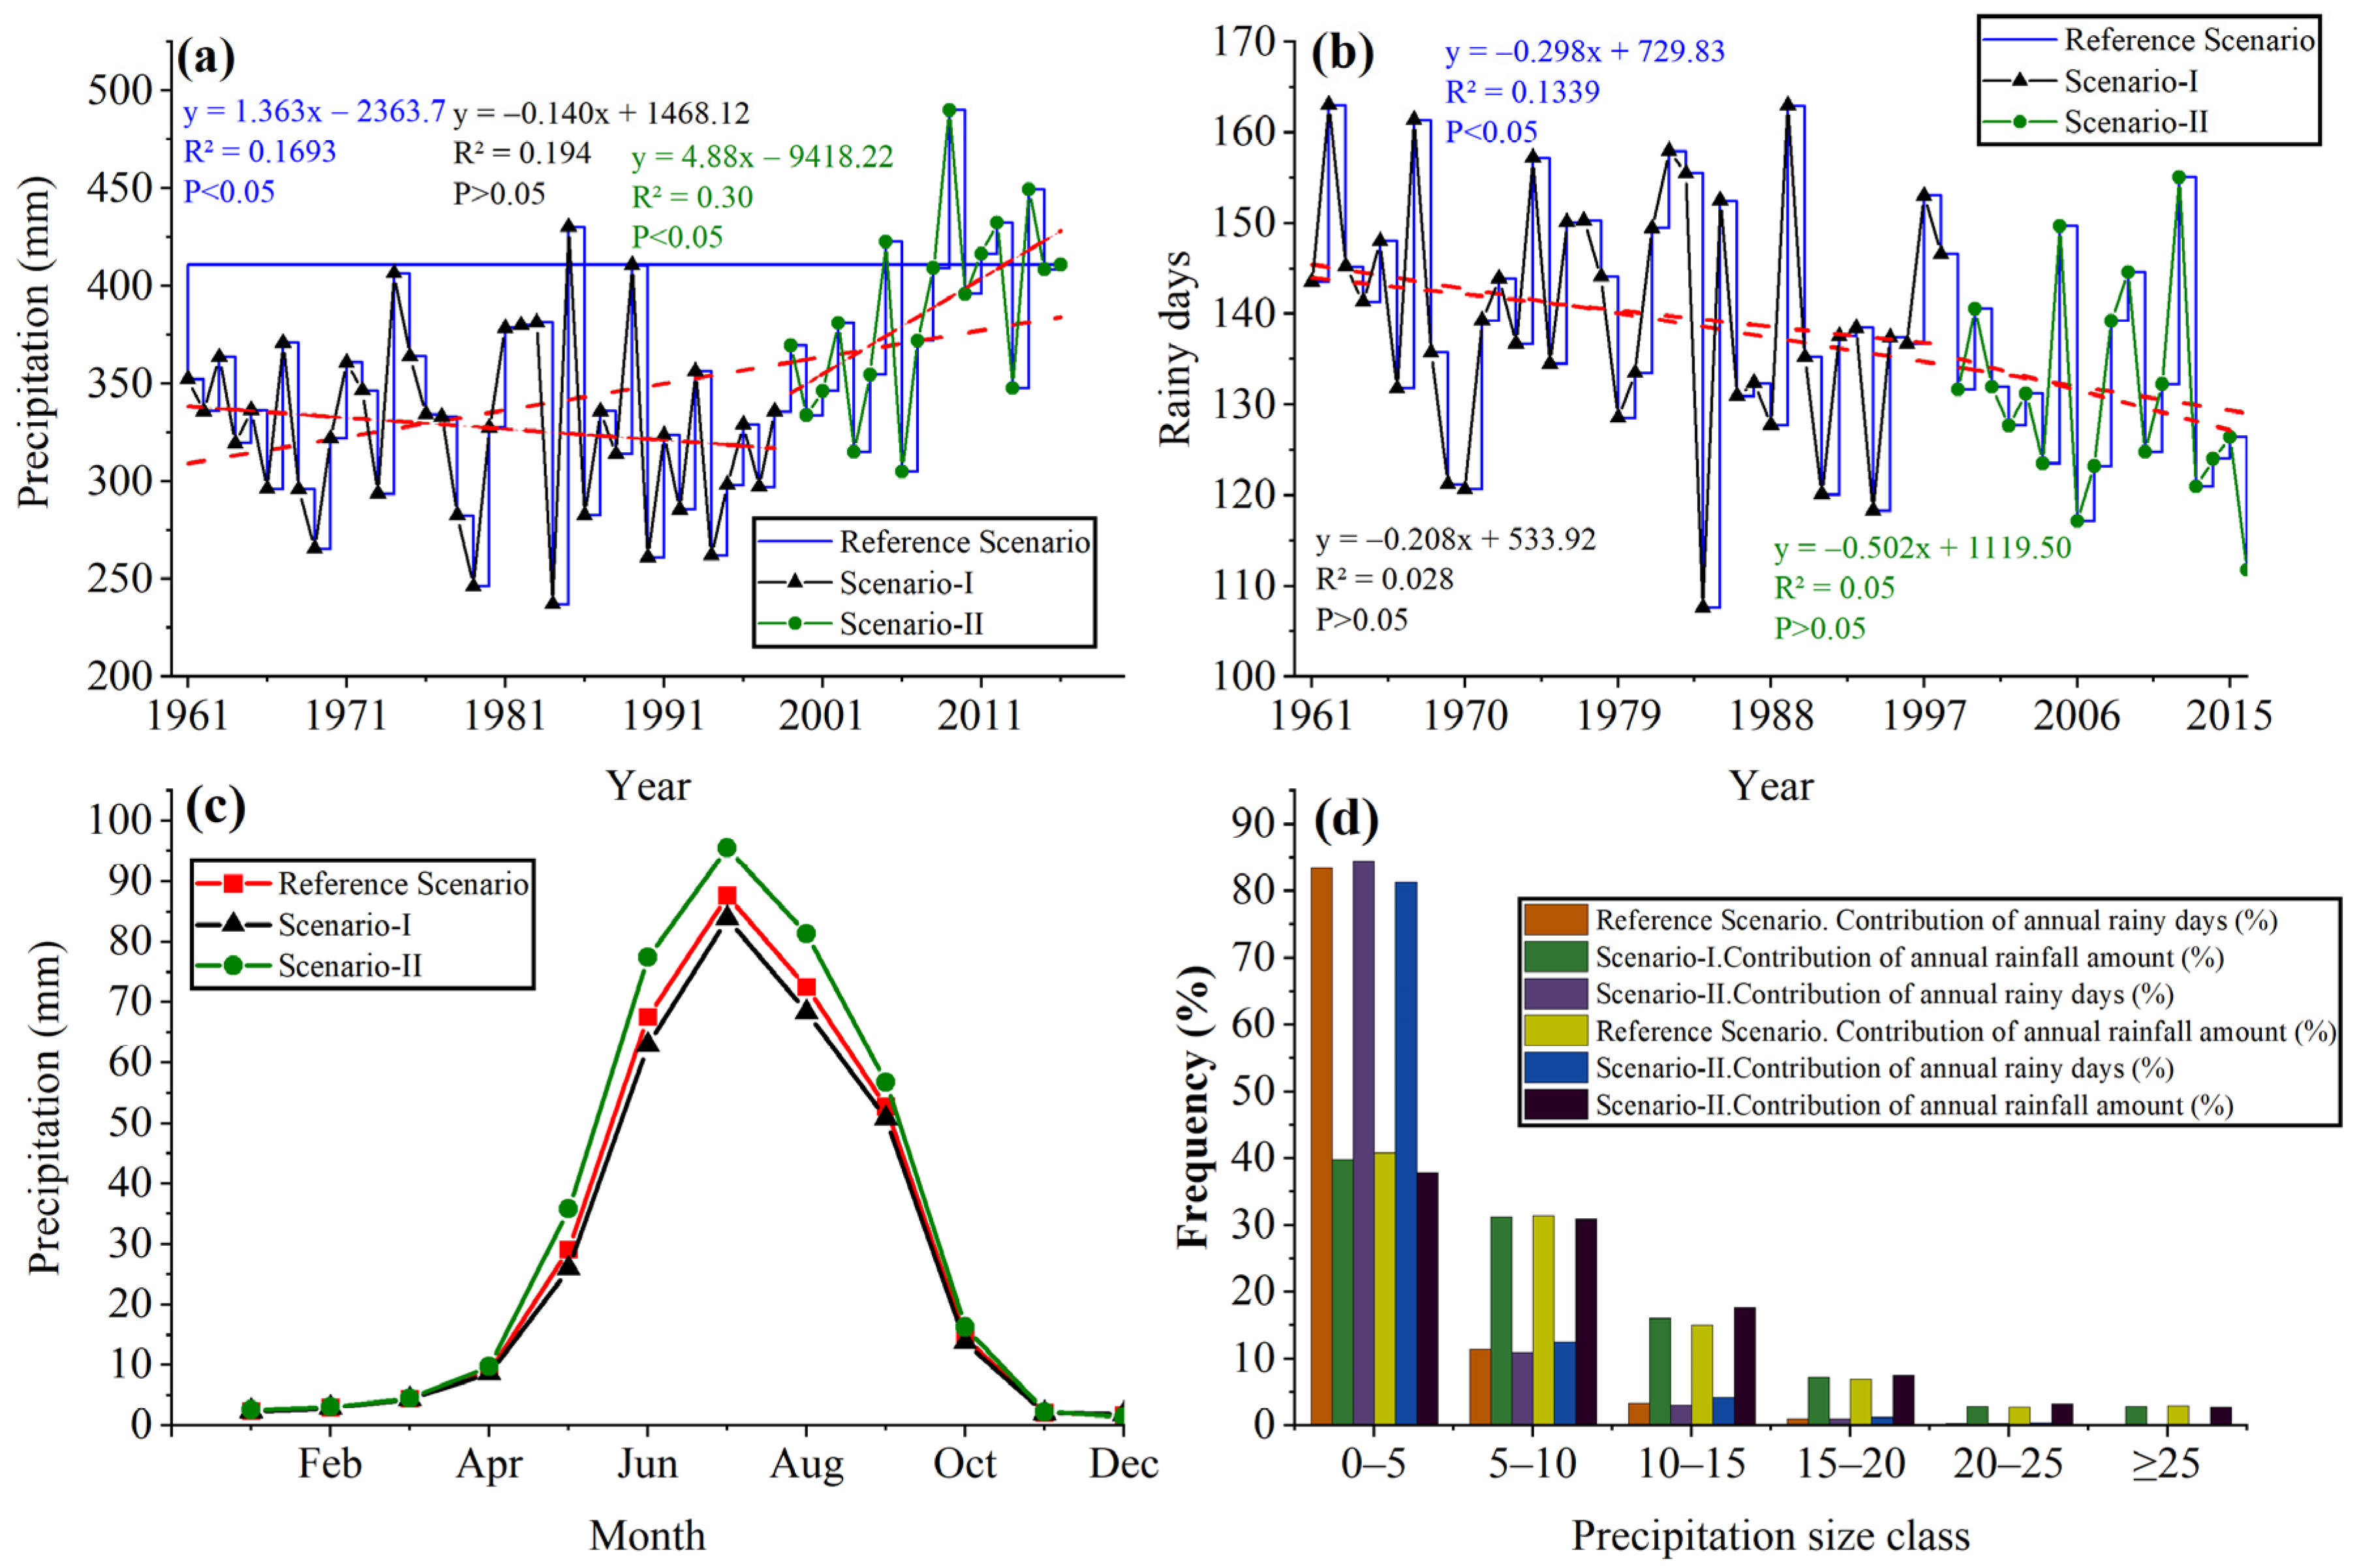
3.1.1. Annual Temporal Variations

In the SRYZ, mean annual precipitation ranged from 230 to 490 mm (Scenario-R), 237 to 430 mm (Scenario-I), and 305 to 490 mm (Scenario-II). Precipitation had a statistically significant increasing trend of 13.6 mm/decade (Scenario-R) and 48.8 mm/decade (Scenario-II), while the Scenario-I precipitation decrease was statistically insignificant (Figure 2a). Scenario-R and Scenario-II recorded 107–163 rainy days each year, with an average of 137 days. The Reference Scenario shows a significant decrease of 2.98 days/decade (Figure 2b). Monthly precipitation for Scenario-R, Scenario-I, and Scenario-II was recorded between the ranges 0.03–158.80 mm (Scenario-R), 0.03–138.14 mm (Scenario-I), and 0.18–158.80 (Scenario-II) with an average of 28.88 mm, 27.30 mm, and 32.22 mm, respectively (Figure 2c). The highest and lowest precipitation values were observed during July and December for all scenarios, where Scenario-II was the highest in magnitude among all scenarios.
Precipitation amounts and rainy days are presented in Figure 2d, which describes that for the 0–5 mm precipitation class, the rainy days are directly related to precipitation amount. In contrast, for the other precipitation classes, the corresponding number of rainy days decreases for all scenarios as the amount of precipitation increases. Precipitation classes and their contribution to precipitation days and amounts are presented in Table 3. It is evident that the light precipitation class (0–50 mm) falls on most days of the year and accounts for the highest amount of precipitation during all scenarios.

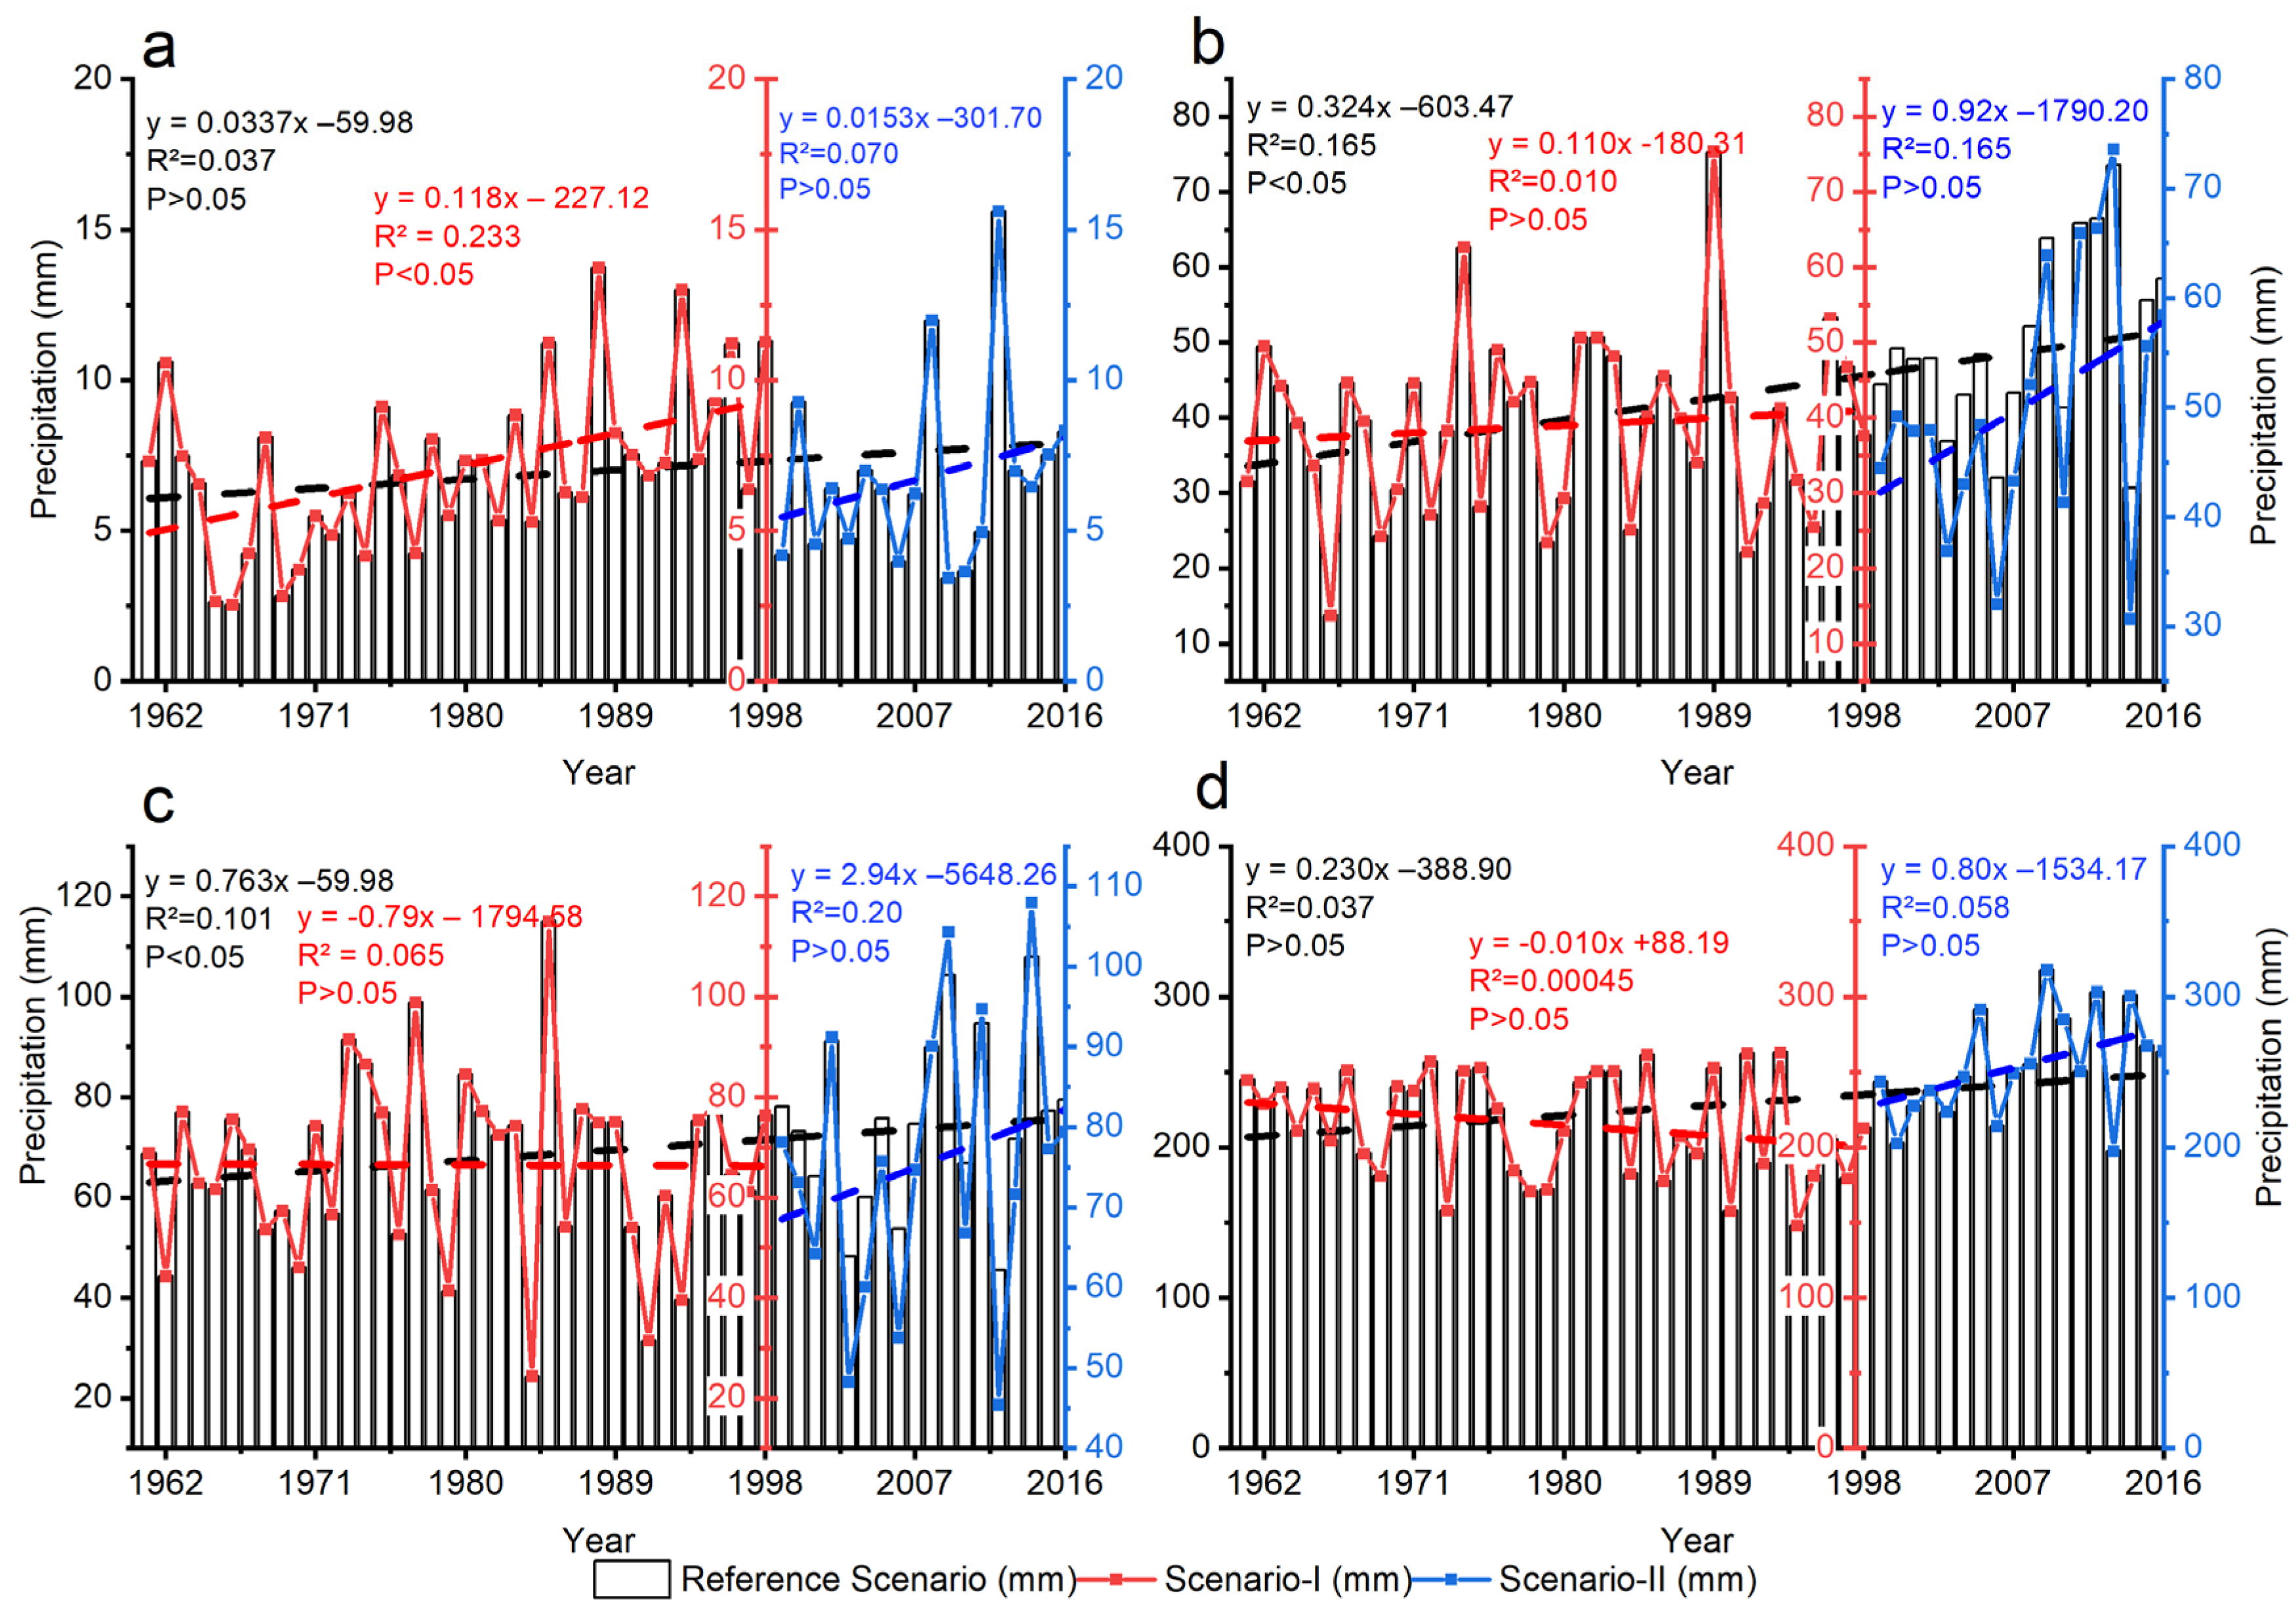
3.1.2. Variabilities in Seasonal Precipitations

The daily precipitation time series was divided into four seasons: winter (December to Feb), spring (March to May), summer (June to August), and autumn (September to November). Each season’s daily precipitation variations were analyzed for all scenarios (Figure 3). All seasons have increasing trends during Scenario-R and Scenario-II, with significant increasing (decreasing) trends only during the summer (autumn) seasons for Scenario-I. Precipitation during the spring season ranged from 13.76–75.34 mm with an average of 42.51 mm, and statistically significant increasing trends exist at a rate of 3.24 mm/decade (Scenario-R) (Figure 3b). A significantly increasing trend (Figure 3c) was also observed during the summer season, 7.63 mm/decade (Scenario-R). The autumn season had an increasing precipitation trend of 2.33 mm/decade. Among all seasons, the highest statistical non-significant increasing trend (29.4 mm/decade) was observed in the summer season (Scenario-II), as shown in Figure 3c.

3.1.3. The Spatial Distributions of Precipitation Trends and Rainy Days

The spatial distribution of the total precipitation amounts and rainy days with corresponding trend magnitudes for each scenario in the SRYZ are presented in Figure 4. Precipitation amounts for all stations have increasing trends, but statistically significant increasing trends only exist for Wudaoliang (21.14 mm/decade), Tuotuohe (13.40 mm/decade), and Qumalai (12.96 mm/decade) during Scenario-R. The precipitation amounts in Scenario-I show a statistically significant decreasing trend for Qumalai (−7.63 mm/decade) and Qingshuihe (10.40 mm/decade). The number of rainy days has significantly increased for Yushu station (3.92 days/decade). For Scenario-II, the highest increasing trend in precipitation amount was recorded for Wudaoliang (49.32 mm/decade), while Qumalai observed a statistically significant decreasing trend of 29.30 mm/decade.
Rainy days show both increasing and decreasing trends on a spatial basis. Qumalai and Qingshuihe stations during Scenario-R exhibit statistically significant decreasing trends of 13.69 and 16.46 days/decade, respectively, while Golmud has a statistically significant positive trend of 1.6 days/decade. There were statistically insignificant positive trends on rainy days for Scenario-I (except Qumail and Qingshuihe). There was a dramatic rise in the rainy days during Scenario-II for Qingshuihe (111.70 days/decade), followed by Qumalai (73.5 days/decade), which is statistically significant.

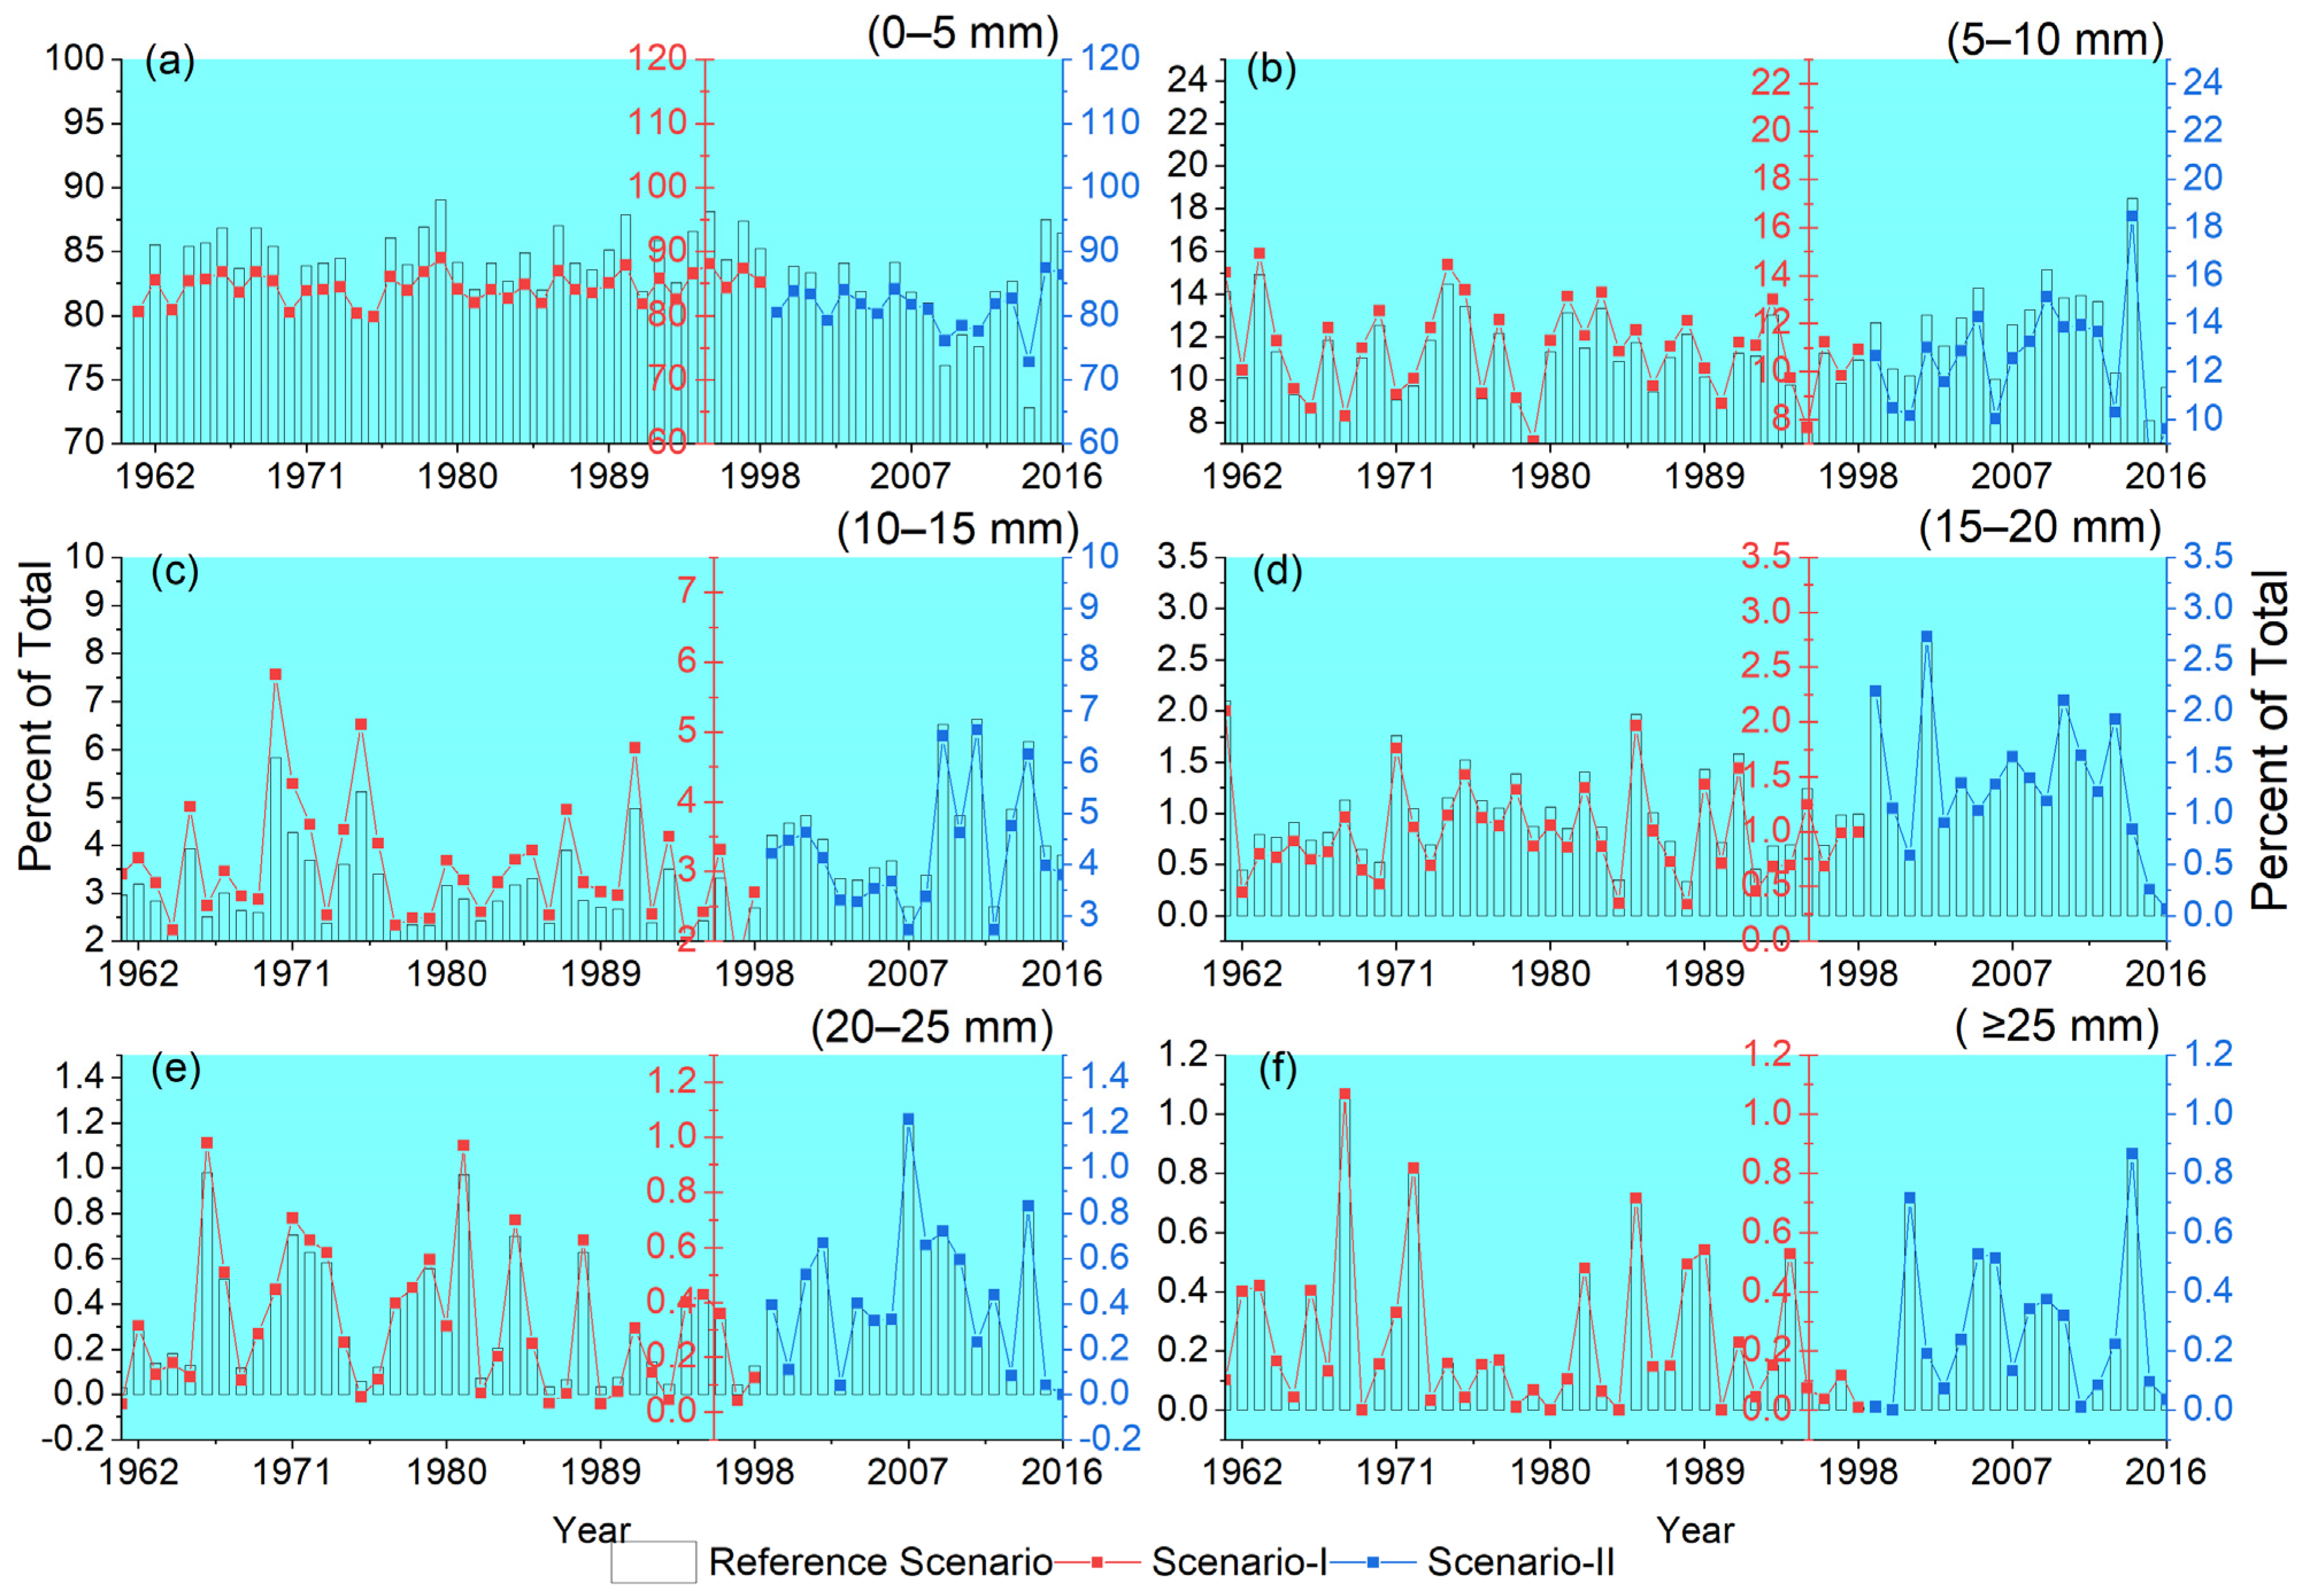
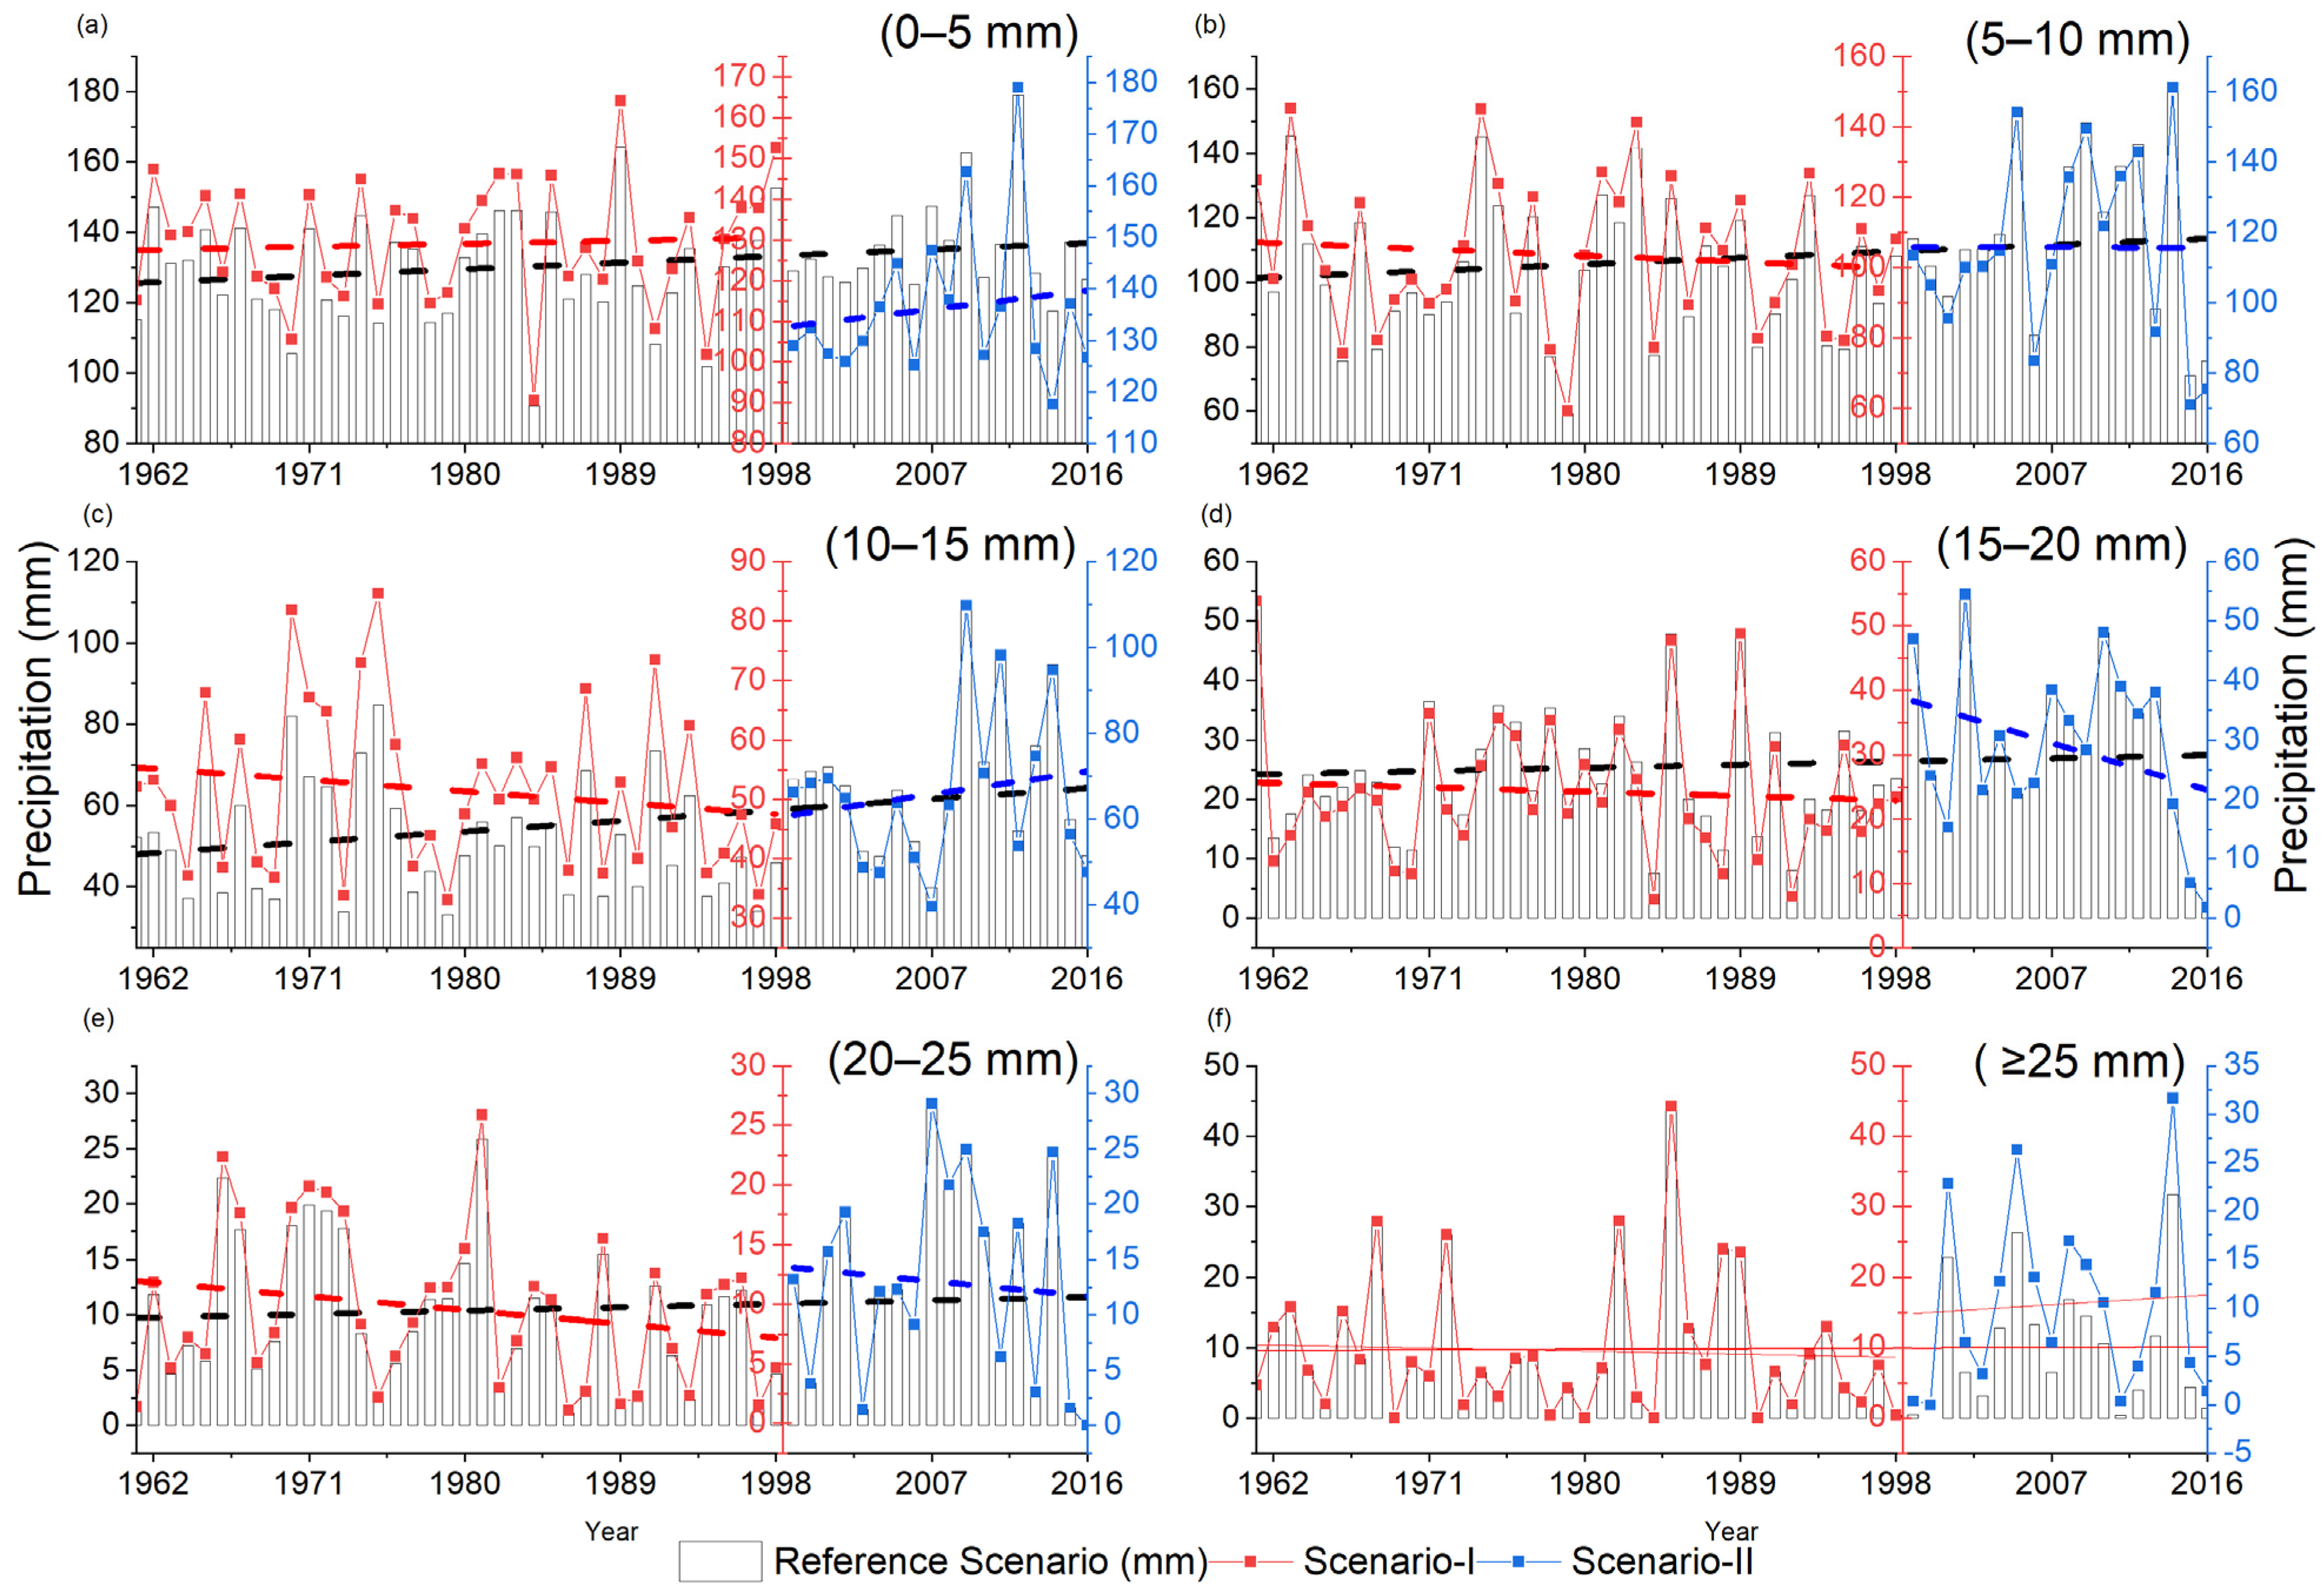
3.2. Rainy Day Percentages for Each Precipitation Class

Rainy day percentages for total rainy days during 1961–2016 in each precipitation class are shown in Table 3 and Figure 4. Light precipitation (0–5 mm) was observed on rainy days as 83.50%, 84.50%, and 81.30%, and 5–10 mm was recorded on rainy days as 11.40%, 10.90%, and 12.50% for Scenario-R, Scenario-I, and Scenario-II, respectively. Precipitation amounts ≥ 10 mm are inconsistent, and very few events and contributions occurred from 1961 to 2016. Moreover, 10%, 20%, 30%, and 40% of the year had moderate to heavy precipitation events during the defined scenarios in the SRYZ. Therefore, only light precipitation of 0–5 mm occurred throughout the year and contributed to most rainy days, while inconsistency exists in moderate and heavy precipitation events in all scenarios.

3.3. Variations of Precipitation Amount in Each Precipitation Class

Light precipitation (0–5 mm) comprised up to 40%, 41%, and 38% of annual precipitation, while the 5–10 mm precipitation comprised 31.20%, 34.40%, and 30.80% of the annual rainfall during Scenario-R, Scenario-I, and Scenario-II, respectively, as presented in Table 3. The linear trends in total annual precipitation amounts in each class are presented in Figure 5. All precipitation classes have increasing trends during Scenario R. The precipitation class of 10–15 mm has a significant increasing trend at the rate of 2.95 mm/decade, while the classes of 0–5, 5–10, 15–20, and 20–25 mm had statistically insignificant increasing trends with magnitudes of 2.07, 2.23, 0.59, and 0.34 mm decad-1, respectively. There was a statistically non-significant decreasing trend observed during Scenario-I, while in Scenario-II, both increasing and decreasing trends were observed (Figure 5).

3.4. Relationship between Precipitation Amount and Rainy Days

The daily precipitation amount >0.1 mm/day was considered a rainy day [45,46,47,48]. During Scenario-R, the precipitation amount continuously increased statistically significantly by 13.62 mm/decade, while rainy days continuously decreased significantly with a 3.0 days/decade slope in the SRYZ (Figure 6a). Figure 6b illustrates the weak correlation between precipitation amount and rainy days during Scenario-R. Precipitation amount and rainy days continuously decreased in Scenario-I; however, the trend is statistically insignificant with negative slopes of 5.8 mm/decade and 3.0 days/decade, respectively. There was a statistically significant increasing trend found in precipitation during Scenario-II (48.8 mm/decade), while for rainy days, it was a statistically non-significant decreasing trend (5.0 days/decade). This shows the consistency with Kwarteng et al.’s [44] findings in Oman and Du et al. [48] in Northwest China. A stronger correlation (0.7) was observed in Scenario-I as compared to Scenario-R and Scenario-II.

3.5. Wet Spell Variations

The analysis showed that in the SRYZ, most precipitation occurred in showers during all scenarios (Figure 7). However, some precipitation falls on consecutive days. Short-duration precipitation events continuously increased during all scenarios, while statistical significance exists only for Scenario-R (Figure 7a). The rate of the increasing trend was observed more during Scenario-I (8.0 times/decade) as compared to Scenario-R (0.82 times/decade per decade) and Scenario-II (0.90 times/decade). However, the long-duration precipitation events also increased non-significantly during Scenario-R (0.25 times/decade) and decreased for Scenario-I (0.24 times/decade). Long-duration precipitation events had a statistically significant increasing trend (1.63 times/decade) during Scenario-II in the SRYZ (Figure 7b).

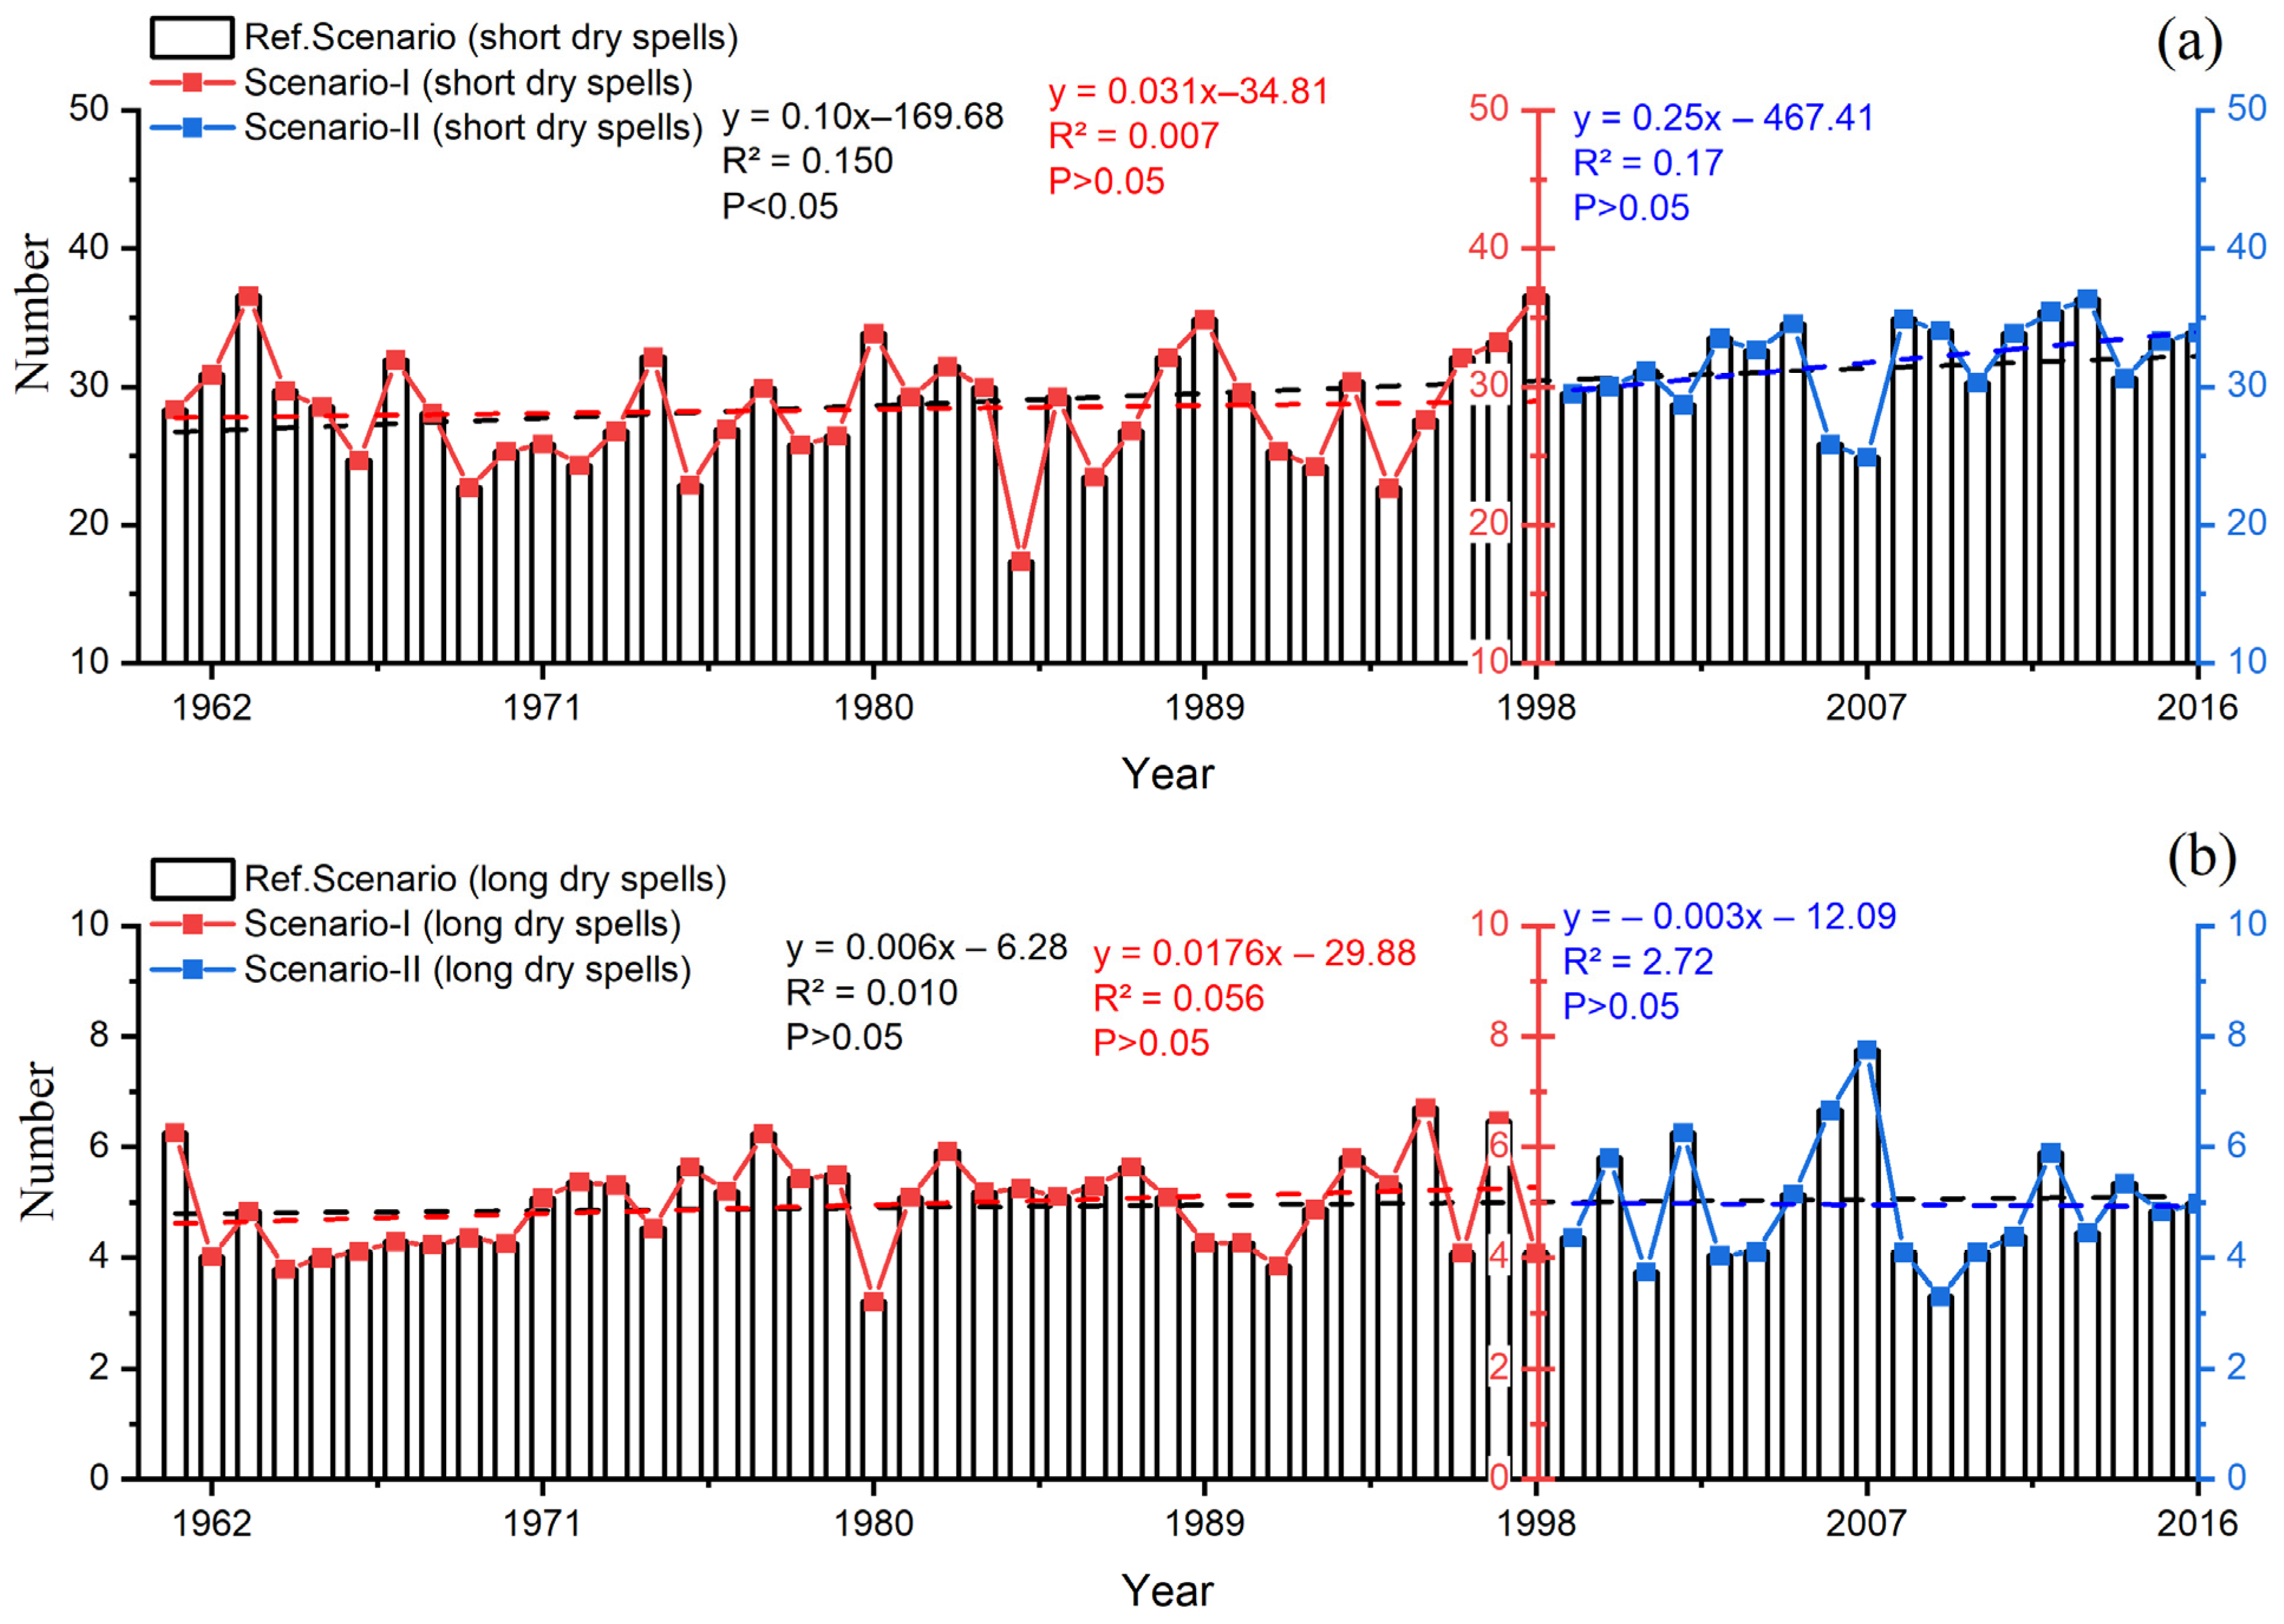
3.6. Dry Spell Variations

In the SRYZ during Scenario-R, Scenario-I, and II, when no precipitation event occurred for ten consecutive days, it was referred to as a short-duration drought; if no precipitation event happened in >10 days, it was defined as a long-duration drought. These drought classifications have been defined by [45] and deployed by [48]. Figure 8a describes that the short-duration droughts had a statistically significant increasing trend (1.0 times/decade), while the rate of long-duration dry spells also increased gradually non-significantly (0.06 times/decade) during Scenario-R (Figure 8b). Short- and long-duration drought events had a non-significantly increasing trend during Scenario-I, while for Scenario-II, short-duration drought events were increasing and long-duration droughts were decreasing non-significantly.

4. Discussion

The trends in the precipitation amount, rainy days, and frequency of wet (dry) spells increasing in the SRYZ during 1961–2016 showed an agreement with the global findings [49], China [50], and neighbor regions [51,52,53]. However, some of the present study’s trends also varied from those in the Loess Plateau of China [54]. Total annual precipitation increased in Scenario-R (1961–2016) and Scenario-II (1999–2016) in the SRYZ, which is consistent with the study conducted by Zhang et al. [24] and Su et al. [33]. The trends reported by Zhang et al. [24] and Su et al. [33] were 7.8 mm/decade (1960–2002), which is lower than our findings of 13.63 mm/decade (Scenario-R) and 48.8 mm/decade (Scenario-II). This difference is because they considered the whole Yangtze River basin as compared to the SRYZ and may be due to approaches deployed and differences in the duration of data used for investigation. Zhang et al. [24] reported that the annual mean number of rainy days during 1960–2005 increased significantly in the upper reaches of the Yangtze River, while, in our findings, they decreased significantly at a rate of 2.98 days/decade during Scenario-R (1961–2016). An increase in the rainy days and precipitation amount led to an increase in the intensity of the precipitation in the SRYZ, and this increase in intensity would be greater after 1998. The seasonal analysis revealed that the summer (June to August) and winter (December to February) seasons showed significantly increasing trends for Scenario-R and Scenario-II, as reported by [9,33]. An increase in precipitation in the winter will ultimately shift the snowfall, leading to streamflow alterations [30]. A significantly increasing high trend magnitude was found in the summer season (7.63 mm/decade), followed by the spring season (3.24 days/decade) during Scenario-R, and contributed to rising streamflow in the SRYZ [39].
Light precipitation (0–5 mm) occurred on the maximum number of precipitation days in a year as 161.3 days (Scenario-R), 161.2 days (Scenario-I), and 131.3 days (Scenario-II) among all other precipitation classes. Thus, these findings agree with [9], showing that this light precipitation class is more critical for vegetation restoration, ecological regulations, and hydrological cycles due to its occurrence most days a year. The ecological importance of small precipitation events has been pointed out by Wang and Tang [55] and Du et al. [48]. Therefore, it was continuously decreased during Scenario-R, Scenario-I, and Scenario-II, while the rate of decrease was found to be high after 1998 (p > 0.05; 5.10 days/decade) followed by Scenario-R (p < 0.05; –3.58 days/decade). This decrease in the light precipitation class (0–5 mm) will ultimately reduce the rate of vegetation restoration and grassland cover, as concluded by Li et al. [20], Petrie et al. [34], and Li et al. [20]. Moderate and heavy precipitation classes plays an important role in regulating surface runoff, improving vegetation cover [56,57].
The massive precipitation events increased during Scenario-R (1961–2016) and Scenario-II (1999–2016), showing consistency with the findings of [53], which can increase the leaching of the nutrients and water into root zones [34]. Chen et al. [26] reported the trends in the heavy precipitation in the Yangtze River Basin from 1960–2009 and found a significant increase, which is in agreement with this study. In arid and semi-arid regions, ecosystems are mainly affected by the magnitude of the precipitation and its frequency [32,58,59]. Light precipitation (0–5 mm) occurred as 83%, 84%, and 81% of total precipitation in Scenario-R, Scenario-I, and II, respectively, in the SRYZ. This precipitation occurred throughout the year and on most of the days. The alpine grassland is degrading in the SRYZ, which covers about 35% of the area as compared to other grassland types [31]. These trends are probably the main reason for vegetation that depends on deep soil water being greatly degraded [48]. As the precipitation class increased, its contribution to rainy days decreased during Scenario-R, Scenario-I, and Scenario-II. These light precipitation amounts are vital for ecosystem restoration, as reported by Ouyang et al. [60] and Yao et al. [19], and maintain the soil water in arid to semi-arid regions [17]. Short-duration precipitation events increased throughout the study period, and the rate of the increasing trend of short-duration rainfall events was greater during Scenario-II (0.90 times/decade) as compared to Scenario-R and Scenario-II having the same trend magnitude (0.82 times/decade), which indicates that the trends after 1998 are more remarkable. The magnitude of long-term precipitation events is greater in Scenario-II (1.63 times/decade) followed by Scenario-R (0.25 times/decade). Short dry spells only increased significantly during Scenario-R (1.0 times/decade). However, the magnitude of the increasing trends was high during Scenario-II (2.5 times/decade). Long dry spells (prolonged droughts) also have the same trend during entire scenarios.

5. Conclusions

This study was conducted to understand the precipitation class variation under the changing climate in the SRYZ during 1961–2016. The precipitation changed on a spatiotemporal scale in the SRYZ from 1961–2016, which can alter the natural hazards (floods and droughts) and hydrological processes within the basin. The total annual precipitation significantly increased during Scenario-R (1961–2016) and Scenario-II (199–2016), but the rate was tremendously higher in Scenario-II, whereas rainy days were decreasing for all scenarios. Precipitation gradually increased from January to July and decreased from July to December. The seasonal analysis revealed that the summer (June to August) and winter (December to February) seasons showed significantly increasing trends in Scenario R and Scenario-II. An increase in precipitation in the winter will ultimately change the snowfall, leading to streamflow alterations.
Light precipitation (0–5 mm) covered most of the days, and its probability was higher during all scenarios. This high amount showed that the 0–5 mm precipitation class is more critical for vegetation restoration, ecological regulations, and hydrological cycles due to its occurrence most days a year. However, it had a continuously decreasing trend during the entire study period. The massive precipitation events were also increasing, which can increase the leaching of nutrients and water into root zones. A strong correlation between precipitation amount and rainy days occurred from 1961 to 2016. Short- and long-duration precipitation events are continuously increasing in the SRYZ. Short dry spells increased after 1998 at a higher rate, meaning the drought conditions will be prolonged over time. The study’s findings will be substantial in basin-scale sustainable water resources management and understanding the regional hydrological responses to changing climate at regional scales.

Author Contributions

N.A. designed the research, highlighted the problem, and formulated the research plan. N.A. and O.E.A. analyzed the data. L.Z. and G.W. supervised the study. S.S., S.A. and S.M. helped in the development and analysis of results. The original draft was written by N.A., whereas S.M., S.S. and H.M. reviewed the draft paper. N.A., L.Z. and G.W. finalized the research paper. L.Z. financially supported the article. All authors confirm the final version of the paper for submission to the journal. All authors have read and agreed to the published version of the manuscript.

Funding

This research was financially supported by the National Key Research and Development Program Project (2021 YFE0106700).

Informed Consent Statement

Not applicable.

Data Availability Statement

The data are the property of the China Meteorological Administration, are available only for research purposes, and can be accessed by proper request.

Acknowledgments

The authors are thankful to the College of Geography and Environmental Science, Henan University, Kaifeng, China for providing the financial support to this article. The authors thank the China Meteorological Administration (CMA) for sharing the data used in this study. The authors would also like to extend its gratitude to the reviewers and editorial office for comments and improving the quality of the manuscript.

Conflicts of Interest

The authors declare no conflict of interest.

References

  1. Wang, Z.; Sun, S.; Song, C.; Wang, G.; Lin, S.; Ye, S. Variation characteristics of high flows and their responses to climate change in permafrost regions on the Qinghai-Tibet Plateau, China. J. Clean. Prod. 2022, 376, 134369. [Google Scholar] [CrossRef]
  2. Saeed, U.; Ahmad, S.R.; Mohey-ud-din, G.; Butt, H.J.; Ashraf, U. An Integrated Approach for Developing an Urban Livability Composite Index—A Cities’ Ranking Road Map to Achieve Urban Sustainability. Sustainability 2022, 14, 8755. [Google Scholar] [CrossRef]
  3. Zheng, G.; Allen, S.K.; Bao, A.; Ballesteros-Cánovas, J.A.; Huss, M.; Zhang, G.; Li, J.; Yuan, Y.; Jiang, L.; Yu, T.; et al. Increasing risk of glacial lake outburst floods from future Third Pole deglaciation. Nat. Clim. Chang. 2021, 11, 411–417. [Google Scholar] [CrossRef]
  4. Ahmed, N.; Wang, G.; Booij, M.J.; Ceribasi, G.; Bhat, M.S.; Ceyhunlu, A.I.; Ahmed, A. Changes in monthly streamflow in the Hindukush–Karakoram–Himalaya Region of Pakistan using innovative polygon trend analysis. Stoch. Environ. Res. Risk Assess. 2022, 36, 811–830. [Google Scholar] [CrossRef]
  5. Ahmed, N.; Wang, G.; Booij, M.J.; Xiangyang, S.; Hussain, F.; Nabi, G. Separation of the Impact of Landuse/Landcover Change and Climate Change on Runoff in the Upstream Area of the Yangtze River, China. Water Resour. Manag. 2022, 1, 1–21. [Google Scholar] [CrossRef]
  6. Marhaento, H.; Booij, M.J.; Ahmed, N. Quantifying relative contribution of land use change and climate change to streamflow alteration in the Bengawan Solo River, Indonesia. Hydrol. Sci. J. 2021, 66, 1059–1068. [Google Scholar] [CrossRef]
  7. Hu, W.; Zhang, G.; Zeng, G.; Li, Z. Changes in Extreme Low Temperature Events over Northern China under 1.5 °C and 2.0 °C Warmer Future Scenarios. Atmosphere 2018, 10, 1. [Google Scholar] [CrossRef] [Green Version]
  8. Ma, L.; Xia, H.; Sun, J.; Wang, H.; Feng, G.; Qin, F. Spatial–Temporal Variability of Hydrothermal Climate Conditions in the Yellow River Basin from 1957 to 2015. Atmosphere 2018, 9, 433. [Google Scholar] [CrossRef] [Green Version]
  9. Zhou, B.; Liang, C.; Zhao, P.; Dai, Q. Analysis of Precipitation Extremes in the Source Region of the Yangtze River during 1960–2016. Water 2018, 10, 1691. [Google Scholar] [CrossRef] [Green Version]
  10. Yuan, F.; Berndtsson, R.; Zhang, L.; Uvo, C.B.; Hao, Z.; Wang, X.; Yasuda, H. Hydro Climatic Trend and Periodicity for the Source Region of the Yellow River. J. Hydrol. Eng. 2015, 20, 05015003. [Google Scholar] [CrossRef]
  11. Li, Q.; Yang, M.; Wan, G.; Wang, X. Spatial and temporal precipitation variability in the source region of the Yellow River. Environ. Earth Sci. 2016, 75, 594. [Google Scholar] [CrossRef]
  12. Nabeel, A.; Athar, H. Classification of precipitation regimes in Pakistan using wet and dry spells. Int. J. Climatol. 2018, 38, 2462–2477. [Google Scholar] [CrossRef]
  13. Thériault, J.M.; Hung, I.; Vaquer, P.; Stewart, R.E.; Pomeroy, J. Precipitation characteristics and associated weather conditions on the eastern slopes of the Rocky Mountains during March–April 2015. Hydrol. Earth Syst. Sci. Discuss. 2018, 2018, 1–35. [Google Scholar] [CrossRef]
  14. Mishra, A.K.; Singh, V.P. Changes in extreme precipitation in Texas. J. Geophys. Res. Atmos. 2010, 115, D14. [Google Scholar] [CrossRef]
  15. Pan, W.; Li, L.A.; Tsai, M.J. Temperature extremes and mortality from coronary heart disease and cerebral infarction in elderly Chinese. Lancet 1995, 345, 353–355. [Google Scholar] [CrossRef]
  16. You, Q.; Kang, S.; Aguilar, E.; Pepin, N.; Flügel, W.-A.; Yan, Y.; Xu, Y.; Zhang, Y.; Huang, J. Changes in daily climate extremes in China and their connection to the large scale atmospheric circulation during 1961–2003. Clim. Dyn. 2011, 36, 2399–2417. [Google Scholar] [CrossRef]
  17. Petrie, M.D.; Brunsell, N.A.; Nippert, J.B. Climate change alters growing season flux dynamics in mesic grasslands. Theor. Appl. Climatol. 2012, 107, 427–440. [Google Scholar] [CrossRef]
  18. Fu, G.; Yu, J.; Yu, X.; Ouyang, R.; Zhang, Y.; Wang, P.; Liu, W.; Min, L. Temporal variation of extreme rainfall events in China, 1961–2009. J. Hydrol. 2013, 487, 48–59. [Google Scholar] [CrossRef]
  19. Yao, Y.; Wang, X.; Zeng, Z.; Liu, Y.; Peng, S.; Zhu, Z.; Piao, S. The Effect of Afforestation on Soil Moisture Content in Northeastern China. PLoS ONE 2016, 11, e0160776. [Google Scholar] [CrossRef] [Green Version]
  20. Li, J.; Liu, D.; Wang, T.; Li, Y.; Wang, S.; Yang, Y.; Wang, X.; Guo, H.; Peng, S.; Ding, J.; et al. Grassland restoration reduces water yield in the headstream region of Yangtze River. Sci. Rep. 2017, 7, 2162. [Google Scholar] [CrossRef] [Green Version]
  21. Katz, R.; Brown, B. Extreme Events in a Changing Climate: Variability Is More Important Than Averages. Clim. Chang. 1992, 21, 289–302. [Google Scholar] [CrossRef]
  22. Tank, A.; Konnen, G.P. Trends in indices of daily temperature and precipitation extremes in Europe, 1946–99. J. Clim. 2003, 16, 3665–3680. [Google Scholar] [CrossRef]
  23. Alexander, L.; Hope, P.; Collins, D.; Trewin, B.; Lynch, A.; Nicholls, N. Trends in Australia’s climate means and extremes: A global context. Aust. Meteorol. Mag. 2007, 56, 1–18. [Google Scholar]
  24. Zhang, Q.; Peng, J.; Xu, C.-Y.; Singh, V.P. Spatiotemporal variations of precipitation regimes across Yangtze River Basin, China. Theor. Appl. Climatol. 2014, 115, 703–712. [Google Scholar] [CrossRef]
  25. Hu, C.; Xu, Y.; Han, L.; Yang, L.; Xu, G. Long-term trends in daily precipitation over the Yangtze River Delta region during 1960–2012, Eastern China. Theor. Appl. Climatol. 2015, 125, 131–147. [Google Scholar] [CrossRef]
  26. Chen, Y.D.; Zhang, Q.; Xiao, M.; Singh, V.P.; Leung, Y.; Jiang, L. Precipitation extremes in the Yangtze River Basin, China: Regional frequency and spatial–temporal patterns. Theor. Appl. Climatol. 2014, 116, 447–461. [Google Scholar] [CrossRef]
  27. Su, B.; Xiao, B.; Zhu, D.; Jiang, T. Trends in frequency of precipitation extremes in the Yangtze River basin, China: 1960–2003. Hydrol. Sci. J. 2005, 50, 492. [Google Scholar] [CrossRef]
  28. Cui, L.; Wang, L.; Qu, S.; Singh, R.P.; Lai, Z.; Yao, R. Spatiotemporal extremes of temperature and precipitation during 1960–2015 in the Yangtze River Basin (China) and impacts on vegetation dynamics. Theor. Appl. Climatol. 2019, 136, 675–692. [Google Scholar] [CrossRef]
  29. Huang, J.; Zhang, J.; Zhang, Z.; Sun, S.; Yao, J. Simulation of extreme precipitation indices in the Yangtze River basin by using statistical downscaling method (SDSM). Theor. Appl. Climatol. 2012, 108, 325–343. [Google Scholar] [CrossRef]
  30. Yao, Z.; Liu, Z.; Huang, H.; Liu, G.; Wu, S. Statistical estimation of the impacts of glaciers and climate change on river runoff in the headwaters of the Yangtze River. Quat. Int. 2014, 336, 89–97. [Google Scholar] [CrossRef]
  31. Zhou, H.; Zhao, X.; Tang, Y.; Gu, S.; Zhou, L. Alpine grassland degradation and its control in the source region of the Yangtze and Yellow Rivers, China. Grassl. Sci. 2005, 51, 191–203. [Google Scholar] [CrossRef]
  32. Fay, P.A.; Carlisle, J.D.; Knapp, A.K.; Blair, J.M.; Collins, S.L. Altering Rainfall Timing and Quantity in a Mesic Grassland Ecosystem: Design and Performance of Rainfall Manipulation Shelters. Ecosystems 2000, 3, 308–319. [Google Scholar] [CrossRef]
  33. Su, B.D.; Jiang, T.; Jin, W.B. Recent trends in observed temperature and precipitation extremes in the Yangtze River basin, China. Theor. Appl. Climatol. 2006, 83, 139–151. [Google Scholar] [CrossRef]
  34. Petrie, M.D.; Collins, S.L.; Litvak, M.E. The ecological role of small rainfall events in a desert grassland. Ecohydrology 2015, 8, 1614–1622. [Google Scholar] [CrossRef]
  35. Shi, Y.; Liu, C.; Wang, Z.; Liu, S.; Ye, B. Concise Glacier Inventory of China; Shanghai. Ann. Glaciol. 2005, 50, 1–4. [Google Scholar] [CrossRef] [Green Version]
  36. Mao, T.; Wang, G.; Zhang, T. Impacts of Climatic Change on Hydrological Regime in the Three-River Headwaters Region, China, 1960–2009. Water Resour. Manag. 2016, 30, 115–131. [Google Scholar] [CrossRef]
  37. Wang, G.; Cheng, G. Characteristics of grassland and ecological changes of vegetations in the Source Regions of Yangtze and Yellow Rivers. J. Desert Res. 2001, 21, 101–107. [Google Scholar]
  38. Wang, G.; Li, Y.; Wang, Y.; Shen, Y. Impacts of alpine ecosystem and climatic changes on surface runoff in the source region of Yangtze River. J. Glaciol. Geocryol. 2007, 29, 159–168. [Google Scholar]
  39. Ahmed, N.; Wang, G.; Booij, M.J.; Oluwafemi, A.; Hashmi, M.Z.-u.-R.; Ali, S.; Munir, S. Climatic Variability and Periodicity for Upstream Sub-Basins of the Yangtze River, China. Water 2020, 12, 842. [Google Scholar] [CrossRef] [Green Version]
  40. Pettit, A.N. A non-parametric approach to the change point problem. J. R. Stat. Soc. Ser. C (Appl. Stat.) 1979, 28, 126–135. [Google Scholar] [CrossRef]
  41. Citakoglu, H.; Minarecioglu, N. Trend analysis and change point determination for hydro-meteorological and groundwater data of Kizilirmak basin. Theor. Appl. Climatol. 2021, 145, 1275–1292. [Google Scholar] [CrossRef]
  42. Adeyeri, O.; Lamptey, B.; Lawin, A.; Sanda, I. Spatio-temporal precipitation trend and homogeneity analysis in Komadugu-Yobe basin, Lake Chad region. J. Climatol. Weather. Forecast. 2017, 5, 1000214. [Google Scholar]
  43. Zhang, S.; Lu, X. Hydrological responses to precipitation variation and diverse human activities in a mountainous tributary of the lower Xijiang, China. Catena 2009, 77, 130–142. [Google Scholar] [CrossRef]
  44. Kwarteng, A.Y.; Dorvlo, A.S.; Kumar, G.T.V. Analysis of a 27-year rainfall data (1977–2003) in the Sultanate of Oman. Int. J. Climatol. 2009, 29, 605–617. [Google Scholar] [CrossRef]
  45. Gong, D.-Y.; Shi, P.-J.; Wang, J.-A. Daily precipitation changes in the semi-arid region over northern China. J. Arid. Environ. 2004, 59, 771–784. [Google Scholar] [CrossRef]
  46. Tarhule, A.; Woo, M.K. Changes in rainfall characteristics in northern Nigeria. Int. J. Climatol. 1998, 18, 1261–1271. [Google Scholar] [CrossRef]
  47. Seleshi, Y.; Zanke, U. Recent changes in rainfall and rainy days in Ethiopia. Int. J. Climatol. 2004, 24, 973–983. [Google Scholar] [CrossRef]
  48. Du, J.; Ping, Y.; Yuxiang, D. Precipitation characteristics and its impact on vegetation restoration in Minqin County, Gansu Province, northwest China. Int. J. Climatol. 2011, 31, 1153–1165. [Google Scholar] [CrossRef]
  49. Donat, M.G.; Alexander, L.V.; Yang, H.; Durre, I.; Vose, R.; Caesar, J. Global Land-Based Datasets for Monitoring Climatic Extremes. Bull. Am. Meteorol. Soc. 2013, 94, 997–1006. [Google Scholar] [CrossRef] [Green Version]
  50. Wu, X.; Wang, Z.; Zhou, X.; Lai, C.; Lin, W.; Chen, X. Observed changes in precipitation extremes across 11 basins in China during 1961–2013. Int. J. Climatol. 2016, 36, 2866–2885. [Google Scholar] [CrossRef]
  51. Wang, B.; Zhang, M.; Wei, J.; Wang, S.; Li, S.; Ma, Q.; Li, X.; Pan, S. Changes in extreme events of temperature and precipitation over Xinjiang, northwest China, during 1960–2009. Quat. Int. 2013, 298, 141–151. [Google Scholar] [CrossRef]
  52. Wang, S.; Zhang, M.; Wang, B.; Sun, M.; Li, X. Recent changes in daily extremes of temperature and precipitation over the western Tibetan Plateau, 1973–2011. Quat. Int. 2013, 313, 110–117. [Google Scholar] [CrossRef]
  53. Ge, G.; Shi, Z.; Yang, X.; Hao, Y.; Guo, H.; Kossi, F.; Xin, Z.; Wei, W.; Zhang, Z.; Zhang, X.; et al. Analysis of Precipitation Extremes in the Qinghai-Tibetan Plateau, China: Spatio-Temporal Characteristics and Topography Effects. Atmosphere 2017, 8, 127. [Google Scholar] [CrossRef] [Green Version]
  54. Yan, G.; Qi, F.; Wei, L.; Aigang, L.; Yu, W.; Jing, Y.; Aifang, C.; Yamin, W.; Yubo, S.; Li, L.; et al. Changes of daily climate extremes in Loess Plateau during 1960–2013. Quat. Int. 2015, 371, 5–21. [Google Scholar] [CrossRef]
  55. Wang, Y.-T.; Tang, L.-S. Responses of different life-form plants in Garbantunggut Desert to small rainfall events. Chin. J. Ecol. 2009, 28, 1028. [Google Scholar]
  56. Jiang, L.; Liu, Y.; Wu, S.; Yang, C. Analyzing ecological environment change and associated driving factors in China based on NDVI time series data. Ecol. Indic. 2021, 129, 107933. [Google Scholar] [CrossRef]
  57. Xiao, D.; Chen, Y.; He, X.; Xu, Z.; Bai, S.H.; Zhang, W.; Cheng, M.; Hu, P.; Wang, K. Temperature and precipitation significantly influence the interactions between arbuscular mycorrhizal fungi and diazotrophs in karst ecosystems. For. Ecol. Manag. 2021, 497, 119464. [Google Scholar] [CrossRef]
  58. Heisler-White, J.L.; Knapp, A.K.; Kelly, E.F. Increasing precipitation event size increases aboveground net primary productivity in a semi-arid grassland. Oecologia 2008, 158, 129–140. [Google Scholar] [CrossRef]
  59. Wang, S.; Ding, Y.; Jiang, F.; Anjum, M.N.; Iqbal, M. Defining Indices for the Extreme Snowfall Events and Analyzing their Trends in Northern Xinjiang, China. J. Meteorol. Soc. Japan Ser. II 2017, 95, 287–299. [Google Scholar] [CrossRef] [Green Version]
  60. Ouyang, Z.; Zheng, H.; Xiao, Y.; Polasky, S.; Liu, J.; Xu, W.; Wang, Q.; Zhang, L.; Xiao, Y.; Rao, E.; et al. Improvements in ecosystem services from investments in natural capital. Science 2016, 352, 1455–1459. [Google Scholar] [CrossRef]
Figure 1. Source Region of Yangtze River (SRYZ) with meteorological stations.
Sustainability 15 05834 g001
Figure 2. Precipitation characteristics in the SRYZ during each period. (a) Annual precipitation, (b) rainy days, (c) mean monthly precipitation, and (d) frequency of different precipitation classes.
Sustainability 15 05834 g002
Figure 3. Seasonal variation in precipitations and trend lines in the SRYZ during Scenario-R, Scenario-I, and Scenario-II. (a) Winter, (b) spring, (c) summer, and (d) autumn seasons.
Sustainability 15 05834 g003
Figure 4. Percentage of rainy days in each precipitation class to the total rainy days.
Sustainability 15 05834 g004
Figure 5. Precipitation amount in each precipitation class during Scenario-R, Scenario-I, and Scenario-II in the SRYZ.
Sustainability 15 05834 g005
Figure 6. Relationship between precipitation days and precipitation amount. The total precipitation amount, rainy days (left column), and correlation plot (right column). (a,b) shows the Scenario-R, (c,d) for Scenario-I, (e,f) for Scenario-II.
Sustainability 15 05834 g006
Figure 7. Persistence of the precipitation events during Scenario-R, Scenario-I, and Scenario-II. The number of short-duration precipitation events (a) and long-duration precipitation events (b).
Sustainability 15 05834 g007
Figure 8. Variations in the dry spells during Scenario-R, Scenario-I, and Scenario-II. (a) The number of short-duration dry spells and (b) long-duration dry spells.
Sustainability 15 05834 g008
Table 1. Observation stations with mean, minimum, and maximum annual precipitation and temperature during 1961–2016.
SNStations ElevationsPrecipitation (mm)
MinimumMeanMaximum
1Xiaozaohuo27676.127.767.5
2Golmud2807.611.442.8101.8
3Yushu3681.2321.7488.9638.3
4Zaduo4066.4411.7537.6700.8
5Qumalai4175296.2425.2568.4
6Qingshuihe4415.4348.2524.2675
7Tuotuohe4533.1162.7294.7503
8Wudaoliang4612.2136.3291.9429.4
Table 2. Precipitation classes analyzed in the SRYZ.
SNPrecipitation ClassesPrecipitation Type (mm)
1Light precipitation0–5 and 5–10
2Moderate precipitation10–15, 15–20, and 20–25
3Heavy precipitation≥25
Table 3. Percentage of different precipitations classes contributing to the annual number of rainy days and amount during 1961–2016 in the SRYZ.
Precipitation Class (mm)Contribution of Annual Rainy Days (%)Contribution of Annual Rainfall Amount (%)
Scenario-Scenario-
RIIIRIII
0–583.4984.4781.3039.7840.8737.87
5–1011.4210.9612.5131.2131.4330.87
10–153.423.034.2216.0215.0417.67
15–201.081.001.287.186.967.56
20–250.340.310.432.912.723.29
≥250.240.230.262.882.972.75
Disclaimer/Publisher’s Note: The statements, opinions and data contained in all publications are solely those of the individual author(s) and contributor(s) and not of MDPI and/or the editor(s). MDPI and/or the editor(s) disclaim responsibility for any injury to people or property resulting from any ideas, methods, instructions or products referred to in the content.

