1. Introduction
In recent decades, the population of cities has increased tremendously, and cities have encountered a growth in urbanization and motorization. The percentage of the world’s population living in urban areas is projected to increase from 54% in 2015 to 60% in 2030 and 66% by 2050 [
1]. Today, daily trips are an essential part of every citizen’s life. Trips with various purposes, such as work, education, recreation, shopping, business, return to home, etc., are being accomplished in each city [
2]. Such trips are inevitable and vital to fulfill the necessities of citizen life. Thus, it is one of the main duties of administrations to provide proper systems for moving passengers efficiently. Groups of citizens who do not have access to transportation systems with standard requirements might need to disarrange their daily trips. Subsequently, this would make other troubles in their routine activities, especially concerning their mandatory trips. Of course, this is a problem only for some groups of citizens, while for others this situation does not exist. This is where the equity concept is posed.
In sociology, psychology, philosophy, and economics, different basic theories are proposed about equity. Among these theories are Simple Equality, Formal Equality, Proportional Equality, Utilitarian, Libertarian, Marx, Smith, Pareto, Rawls, al-Sadr, Capabilities Approach, Suffcientarian, Prioritarian, and Intuition [
3]. The concept of simple equality assumes that all members receive equal resources. While formal equality takes into account differences between different people when distributing resources, similar people share the same amount. According to proportional equality, resources should be distributed according to each person’s income [
4]. Based on utilitarian theory, the distribution should maximize the welfare of the entire society regardless of any other constraints. Individuals should be free to trade freely and be self-possessed according to libertarian philosophy [
5]. In Marx’s view, resources should be distributed based on need and from those with abilities to those in need [
6]. According to Smith, each person can use resources accordingly to what they pay [
7]. In a modified version of utilitarianism, Pareto proposed the allocation of resources to maximize welfare while still keeping in mind the constraint that other groups’ welfare must not be negatively affected [
3]. Additionally, Rawls believed in unequal distribution but based on need, benefiting the least advantaged, or when, despite the unequal distribution, it is accessible to everyone [
8]. In al-Sadr’s view, resources must be distributed so that poverty in a society is reduced and eradicated. The capabilities approach focuses on distributing resources in a way that maximizes individual opportunities [
9]. According to sufficient rain theory, equal distribution of resources is not fair, but the basic needs of each individual must be met [
10]. Based on the prioritarian theory, low-income groups have more priority over others in improving their welfare. It is difficult to provide one theory that can fully explain what equity means, and individuals must become morally minded to understand the best course of action in each circumstance [
11].
Transportation equity is the object of an important debate among planners and policymakers [
3]. The assessment of equity in transportation facilities can help policymakers, service providers, and urban planners decide on the different aspects of a project in the planning phase [
4]. A major question is how the transportation equity status can be determined for a specific part of a city. It would be great if there were indicators to calculate the equity for each transportation system. Hereby, by equity, we mean the proportion between the frequency of long and short-distance trips, air pollution conditions, the number of available parking lots, and the volume-to-capacity ratio on one side and the transportation supply condition on the other side. The new definition is based on a combination of Formal Equality, Marx, Rawls, the Capabilities Approach, Sufficientarian, and Prioritarian theories. A transportation system must take into account the needs of individuals, such as the frequency of long and short trips (Formal Equality and Marx). Different zones in a city have different traffic, environmental, and land use conditions, and when distributing transportation systems, these variations must be considered (Formal Equivalence). People living in areas with poor transportation infrastructure, poor air quality and congested traffic deserve more priority and attention from transportation systems (Rawls and Prioritarian). As a way to gain access to opportunities, transportation systems must be distributed in each zone of a city to maximize opportunities for people (Capabilities Approach). In order to meet the basic movement needs of each person in each zone of a city, a minimum level of transportation systems is essential (Sufficientarian).
The condition of the transportation supply for passenger cars is determined by the ratio between the costs associated with using them and the average income of the family that owns the car. There are various parameters taken into account from both the passengers’ and administrations’ perspectives for bus service and bicycle service.
In this paper, an equity score measures the fairness of a situation. Transport systems are examined from both a supply and demand perspective, as well as from a traffic and environmental perspective. By considering variables such as environmental and traffic conditions (v/c), the equity score determines whether transportation supply is fair based on traveler demand but also considers the benefits to other citizens. The proposed method could result in different equity scores for two similar demand and supply scenarios depending on the environment or traffic conditions. In two similar scenarios with similar environmental, traffic, and demand conditions, the equity score could be different because of the supply of a transport mode.
Locus et al. (2016) stated that determining the equity of policies in each transport development project can help promote accessibility and mobility in a cost–benefit approach, especially for the groups with less income [
12]. Thus, the main contribution of this paper is to introduce a new possible way to define/assess equity, different from what has been done in the previous literature. We propose a method to calculate the equity in a quantitative form for transportation systems in a city by considering the aforementioned variables.
Transportation systems, which have been considered in our case study, are passenger cars, regular buses (RB), and cycling. However, the method can be generalized and applied in other contexts. To calculate the equity of bus, cycling, and passenger cars, firstly, the condition of transportation supply (costs associated with using passenger cars, buses, and cycling infrastructure condition) must be specified. Then, based on the environmental and traffic conditions, trip frequencies, and the condition of the transportation supply, and with the help of a fuzzy inference system (FIS), it is possible to obtain a number that represents the equity score for that mode. This paper and its data collection were conducted before the COVID-19 outbreak.
Briefly, the main research questions are as follows:
RQ1—Whether transport modes (buses, cycling, and passenger cars) are fair in a particular city zone based on supply; demand; and traffic, environmental, and social factors.
RQ2—Does the present supply of a mode of transportation (buses, cycling, and passenger cars) meet traveler demand, traffic conditions (v/c), and environmental conditions (air quality)?
RQ3—Does a transport mode (buses, cycling, and passenger cars) have an oversupply based on traffic, environmental conditions, and travel demand?
RQ4—Do citizens’ comments about the fairness of a transportation mode differ from the proposed method?
The paper has five sections. In the following one, a literature review of transportation equity is discussed. The research method is presented in
Section 3. Data and results are studied in
Section 4, followed by a discussion about the outputs. The paper ends with a discussion about the assessment of the model outputs and a comparison with citizens’ comments.
2. Literature Review
Equity is one of the main issues in each society, and it is a desirable situation for most people. Equity and justice are the goals of governments in most countries [
5]. Equity means an equal and fair distribution of resources, services, benefits, and costs among individuals, stakeholders, and society [
6,
7,
8,
9]. There are various viewpoints about transportation equity; however, a standard and uniform definition has not yet been presented for it [
10,
11]. Litman introduced equity as the proper distribution of benefits and costs between all members of a society [
13,
14,
15]. Transportation equity can involve different aspects such as public facilities and services, user costs and benefits, service quality, external impacts, economic impacts, regulation, and enforcement [
13]. There are different definitions for transportation equity from the points of view of users, stakeholders, and the community [
16]. Thus, it is not clear how the equity level can be estimated based on the provided level of services [
17]. Equity can be considered in relation to procedures, geographical areas, or demographic groups. Procedural equity relates to the time and location in which public resources are provided. Furthermore, it refers to the languages in which information is distributed [
18]. Geographical equity refers to the distribution of costs and benefits in different parts of a country. Social equity refers to the distribution of costs and benefits across demographic groups. In other words, geographic equity seeks to determine where inequities occur, but social equity tries to understand who benefits more or less [
19]. Transportation equity is the prerequisite for social inclusion and reducing social discrimination [
20,
21]. There are pieces of evidence which indicate that sometimes there are inequities concerning transportation systems. In some cities, specific groups such as those with disabilities, low-income groups, women, old people, socially disadvantaged people, students, and children confront some sort of inequity in relation to transportation accessibility [
22,
23,
24].
The subject of transportation equity has been studied in a variety of ways due to the fact that transportation equity is one of the Sustainable Development Goals [
25]. In most cases, equity has been considered in strategic transport planning, and few researchers investigated use this concept in a quantitative manner [
3]. For example, Shi and Zhou (2012) tried to develop models to quantify the equity in transportation projects investment. They considered equity in four aspects as equity among diverse traffic mode users, different social groups, different regions, and different generations [
26]. Tahmasbi et al. (2019) tried to evaluate the accessibility-based equity of urban facility distribution. They measured the accessibility of different regions in a city to public facilities. Pedestrians, public transit, and passenger cars have been considered as transportation modes [
4]. Zhang and Waller (2019) tried to consider the equity in transportation network design problems based on the energy consumption in a link [
6]. The Gini coefficient was used to specify the level of equity in the accessibility of these modes among people with different incomes [
4]. The Gini index has also been used in other papers to evaluate the equity of distribution of services or accessibility among users [
12,
27,
28,
29]. Pereira et al. (2017) suggested that equity in transportation must be determined based on accessibility to certain destinations [
11]. Benenson et al. (2011) mentioned transport modes, land use, time, and individual people as the main components for accessibility measurement [
30]. Qi et al. (2020) tried to determine public transportation equity based on the relative accessibility to CBD, public transportation needs, and population density [
17]. Zhao and Zhang evaluated the equity in public transportation systems based on their fares. They established an affordability index to measure transit equity [
31]. Transportation equity indicators as measurable variables can help to identify how much progress has occurred based on the objectives. Guo et al. (2020) studied the equity of emerging transportation technologies using accessibility, traffic emissions, and safety [
32]. Chen and Wang (2020) assessed transportation equity based on the concept of transit and cycling accessibility. To meet social equity needs, it is necessary to promote green transport for regions with lower incomes [
33]. Ghosh et al. (2022) assessed equity for public transportation in India based on an accessibility index [
25]. The necessary terms for equitable electric vehicle charging are evaluated by Carlton and Sultana (2022) [
34]. Based on accessibility to job opportunities at different times, Raza et al. (2023) proposed a method for assessing public transport equity in Wuhan (China) [
35].
The literature review indicates a gap in previous studies in quantifying the proportionality between the condition of different transportation systems (ratio of costs associated with using passenger cars, bus, and cycling infrastructure quality) on the one side and environmental, traffic (v/c), and demand (frequency of long and short distance trips) conditions on the other side. A framework to calculate an equity score for buses, cycling, and passenger cars in different situations has not yet been presented. Therefore, this paper proposes a possible way to quantify equity for transport modes including buses, cycling, and private cars within a connected transportation system in a city.
3. Method
In this section, we are going to present the methodology for calculating the equity score for buses, cycling and passenger cars. For this purpose, first, the Fuzzy Inference System (FIS) is introduced and its application within the method is explained. Then, for cycling, regular buses (RB), and passenger cars, the procedures to calculate the input variables for the FIS model are described.
3.1. Fuzzy Inference System and Selected Variables
In this paper, we suggest the use of FIS to calculate equity scores. An FIS is a system that can systematically describe human knowledge, infer, and make a proper decision. Furthermore, it attempts to achieve a specific output based on the same pattern and according to the human brain. FIS tries to give an output based on imprecise terms as the inputs, the same as human knowledge. Rather than using real numbers, fuzzy systems use fuzzy numbers as variables. Variables of this type are called linguistic variables. Linguistic variables have values in the form of words or sentences [
36]. It is therefore appropriate for human language to use fuzzy logic when using imprecise or vague terms [
37]. Five elements make up a linguistic variable: its name; its linguistic terms; its base variable (a closed interval of real numbers); its semantic rules, which determine the meaning of linguistic terms; and its syntactic rules, which generate linguistic terms from primitive terms [
38]. Using fuzzy inference, the input vector is interpreted and the output vector is assigned values according to some sets of rules [
39]. By using fuzzy logic, fuzzy inference establishes a mapping between an input and an output. Decisions can then be made or patterns can be discerned based on the mapping [
39].
Here, the Mamdani-type of FIS is applied to determine the equity score. Mamdani-type inference expects the output membership functions to be fuzzy sets. After the aggregation process, there is a fuzzy set for each output variable that needs defuzzification [
40]. The basic structure of FIS consists of three conceptual parts. The first part is the rules, which explain the relationship between different combinations of input variables with output variables in the form of linguistic variables. Fuzzy rules are in the form of If–Then statements: the “If” part is called the antecedent and the “Then” part is called the consequent. In the Mamdani fuzzy inference system, there are two operations, which are “And” (“min”) and “Or” (“max”). The second part is the membership functions for input and output variables. Finally, the third part is the inference mechanism that carries out the inference procedure using the existing rules to provide a consistent output. Different membership functions, such as triangular, trapezoidal, Gaussian, sigmoid, and bell-shape, among others, can be used for input variables [
41]. There are no specific rules or guides for developing membership functions. In this paper, membership functions are made based on the direct rating. In this approach, for each variable, different random values are produced [
42]. We have asked 20 experts to tell us how much the membership degree to each category. These experts have at least a degree of Master of Science in transportation planning (work as a traffic engineer in Kerman), know Kerman well, and are familiar with the concept of equity. There is a difference between fuzzy sets and classical sets when it comes to membership. Members of classical sets may or may not belong to set A. As a result, membership is either 0 or 1. However, in fuzzy sets, the membership degree quantifies the degree of an element’s membership in a set. A value of 0 means that it is not a member of the fuzzy set; a value of 1 means it is fully a member. Those fuzzy members who belong only partially to the fuzzy set have values between 0 and 1.
There are two approaches to the generation of fuzzy rules. In the first approach, rules are determined based on real data and what happened. The second approach is based on the opinions of experts and individuals who are familiar with the input characteristics and the effect of their combination on output. In the present paper, the second approach is used.
In this paper, the input variables that have been chosen for each transport mode are:
- (1)
Frequency of short (RFTsh) and long trips (RFTl);
- (2)
Environmental (air quality) and traffic (v/c) conditions;
- (3)
Indicators for describing the condition of transportation supply (C/I, TI and CI).
Trip frequency is regarded in two categories for short and long trips. Short trips are those less than 3.5 km, while long trips are more than 3.5 km (distance appropriate for cycling: [
43,
44]). The output is the equity score for a transportation mode and it can vary between −1 to +1. The values less than zero indicate that the supply of a transport mode is not sufficient to meet the demand (negative equity). On the other hand, values greater than zero imply that the supply is greater than the demand (positive equity). In fact, in both cases, there is a disproportion between the transportation system supply and the input variables. To describe the environmental and traffic conditions, variables demonstrated in
Table 1 are considered. The volume-to-capacity ratio (v/c) is an indicator used in traffic studies to determine the congestion in streets. When v/c is very small, it means that the demand is low or the capacity is surplus and there is a waste of capacity. Larger values of v/c mean that there are jam densities in streets [
45]. The Air Quality Index (AQI) has no dimension, and it considers those pollutants that have an acute impact on health, such as PM
10, PM
2.
5, CO, NO
2, O
3, and SO
2. When the AQI is greater than 150, it means that the situation is unhealthy for all citizens [
46]. The Average Parking Index (API) is an indicator developed by the authors to assess the status of the availability of parking spaces in a zone.
Finally, to develop the indicators that describe the condition of transportation supply (C/I, TI and CI), we suggest following these steps:
For passenger cars, the ratio of costs (C) associated with using this mode and the average income (I) of the residents in a zone of a city is used (C/I). The costs consist of fuel price, parking cost, congestion pricing, insurance cost, traffic fines and taxes. There are no weights associated with costs because they are all equal. As for all costs, we use a uniform dimension, which is the amount in USD, and we add all costs up in a year. A cost for each zone was asked of each respondent and then an average value was derived for each zone;
For public transportation systems (buses) and cycling, the indicators are calculated based on the passengers’ and administrations’ viewpoints, simultaneously. The indicators are named Transit Index (TI) and Cycling Index (CI). From the administrators’ viewpoint, Transit Opportunity Index (TOI) and Cycling Opportunity Index (COI) will be used to represent the opportunity to access public transit and cycling facilities in each zone (
Section 3.1). Transit Service Quality Index (TSQI) and Cycling Service Quality Index (CSQI) also are indicators, which reflect the opinions of passengers about the status of public transit and cycling in each zone (
Section 3.2). In the following, more explanations are presented about the calculations of TI and CI.
3.2. Opportunity Index
Previously, Mamun et al. (2013) proposed a method to determine an opportunity index for public transportation systems. In their method, first, a city is divided into several zones. Then, in each zone, public transport (PT) lines are identified, and spatial coverage, temporal coverage, and trip coverage are considered for each line and the overall zone. Equations (1)–(6) are used to calculate TOI for each zone [
47].
where:
i: Set of origins (zones)
j: Set of destinations (zones)
l: Set of transit lines
Pi: Population of origin i
U: Capacity of a vehicle
Ril: Spatial coverage score of origin i for transit line l
Bi,l,buffer: A 400 m buffer area of origin i for transit line l
i,total: Total area of origin i
Sijl: Service frequency score from origin i to destination j for transit line l
Vijl: Daily vehicle runs from origin i to destination j for transit line l
Aijl: Transit accessibility score from origin i to destination j for transit line l
: Binary connectivity parameter
fijl: Connectivity decay factor from origin i to destination j for transit line l
TOIij: Transit Opportunity Index from origin i to destination j
TOIi: Transit Opportunity Index of origin i
For COI, the same procedure as what has been proposed for TOI is used. However, for cycling, it is important to preliminarily identify the routes that have standard requirements.
Table 2 indicates the prerequisites to recognize a cycling route [
48].
For each zone, after the identification of suitable routes for bicycles, Equations (7)–(12) will be used to calculate COI.
where:
l: Set of cycling lanes (or paths)
: Daily capacity of each cycling path
: An 800 m buffer area of origin i for cycling lane l (47)
: Cycling Opportunity Index from origin i to destination j
: Cycling Opportunity Index of origin i
The remaining variables are the same as described in the TOI calculation.
3.3. Service Quality Index
The satisfaction of travelers is important for TSQI and CSQI because such systems are designed for passengers and they must be sufficiently attractive for them. To determine TSQI and CSQI, first, the attributes that might be important for travelers in each mode should be specified. It should be noted that these attributes must be evaluated from the passengers’ points of view. Each attribute is considered an ordinal variable with five levels, and as the level number goes up, the utility of the attribute would increase for passengers.
After the identification of important attributes for TSQI and CSQI, the weight of each attribute is determined. For this purpose, a pairwise comparison is conducted in each group based on
Table 3. This is the same procedure performed in the Analytic Hierarchy Process to determine the weights of criteria for decision-making [
49,
50].
After obtaining preference matrices based on travelers’ opinions, then, by the eigenvalue method, the aforementioned weights can be calculated [
50]. Now, TSQI and CSQI can be calculated as demonstrated in
Table 4 and
Table 5 [
48,
51,
52].
At last, after calculating TOI, TSQI, COI, and CSQI, TI and CI can be determined based on Equations (13) and (14).
3.4. Equity Score
After the identification of RFTsh, RFTl, TI, CI, v/c, AQI, and API, all of the inputs are ready. The main novelty of this paper is to consider these proportionalities for each mode:
- -
For passenger cars, C/I from one side and RFTl, v/c, AQI and API from the other side;
- -
For buses, TI from one side and RFTl, v/c, AQI, API, and C/I from the other side;
- -
For cycling, CI from one side and RFTl, RFsh, v/c, AQI, API, TI, and C/I from the other side.
The transportation systems and infrastructure of a city can be judged by an individual who has lived in the area for several years. Thus, FIS model results are compared to what people think about the equity score of each transportation system in an interview. Indeed, a person can compare the specifications of transportation systems with the necessities for daily trips (Marx theory and Sufficientarianism) to gain access to basic opportunities (Capabilities Approach), and what is already provided in similar zones (Formal equality and Prioritarian), or zones with the greatest and least advantages (Rawls). A person can compare the distance between what he or she needs, what is available in this zone, and what is available elsewhere. The intuition theory of equity is also somewhat close to what each person states as the equity score.
Based on an online survey in South Carolina, Wang et al. (2021) also attempted to determine the relationship between perceived transportation disadvantage and opportunity inaccessibility to improve transportation equity [
53].
The results of a case study are presented in
Section 4.
4. Case Study
In this paper, the focus is on regular buses (RB), cycling, and passenger cars since they are the most prominent transport modes in our case study. The equity scores for passenger cars, RBs, and cycling are named ESP, ESRB, and ESC, respectively. ESP, ESRB, and ESC can vary between −1 and +1. This is one of the other novelties of this paper: in the calculation of equity, we consider negative and positive values for equity with different meanings. The values less than zero indicate that the supply of a transport mode is not sufficient to meet the demand (negative equity). On the other hand, values greater than zero imply that the supply is greater than the demand (positive equity). In fact, in both cases, we have a disproportion between the transportation system supply and RFTsh, RFTl, AQI, API, and v/c.
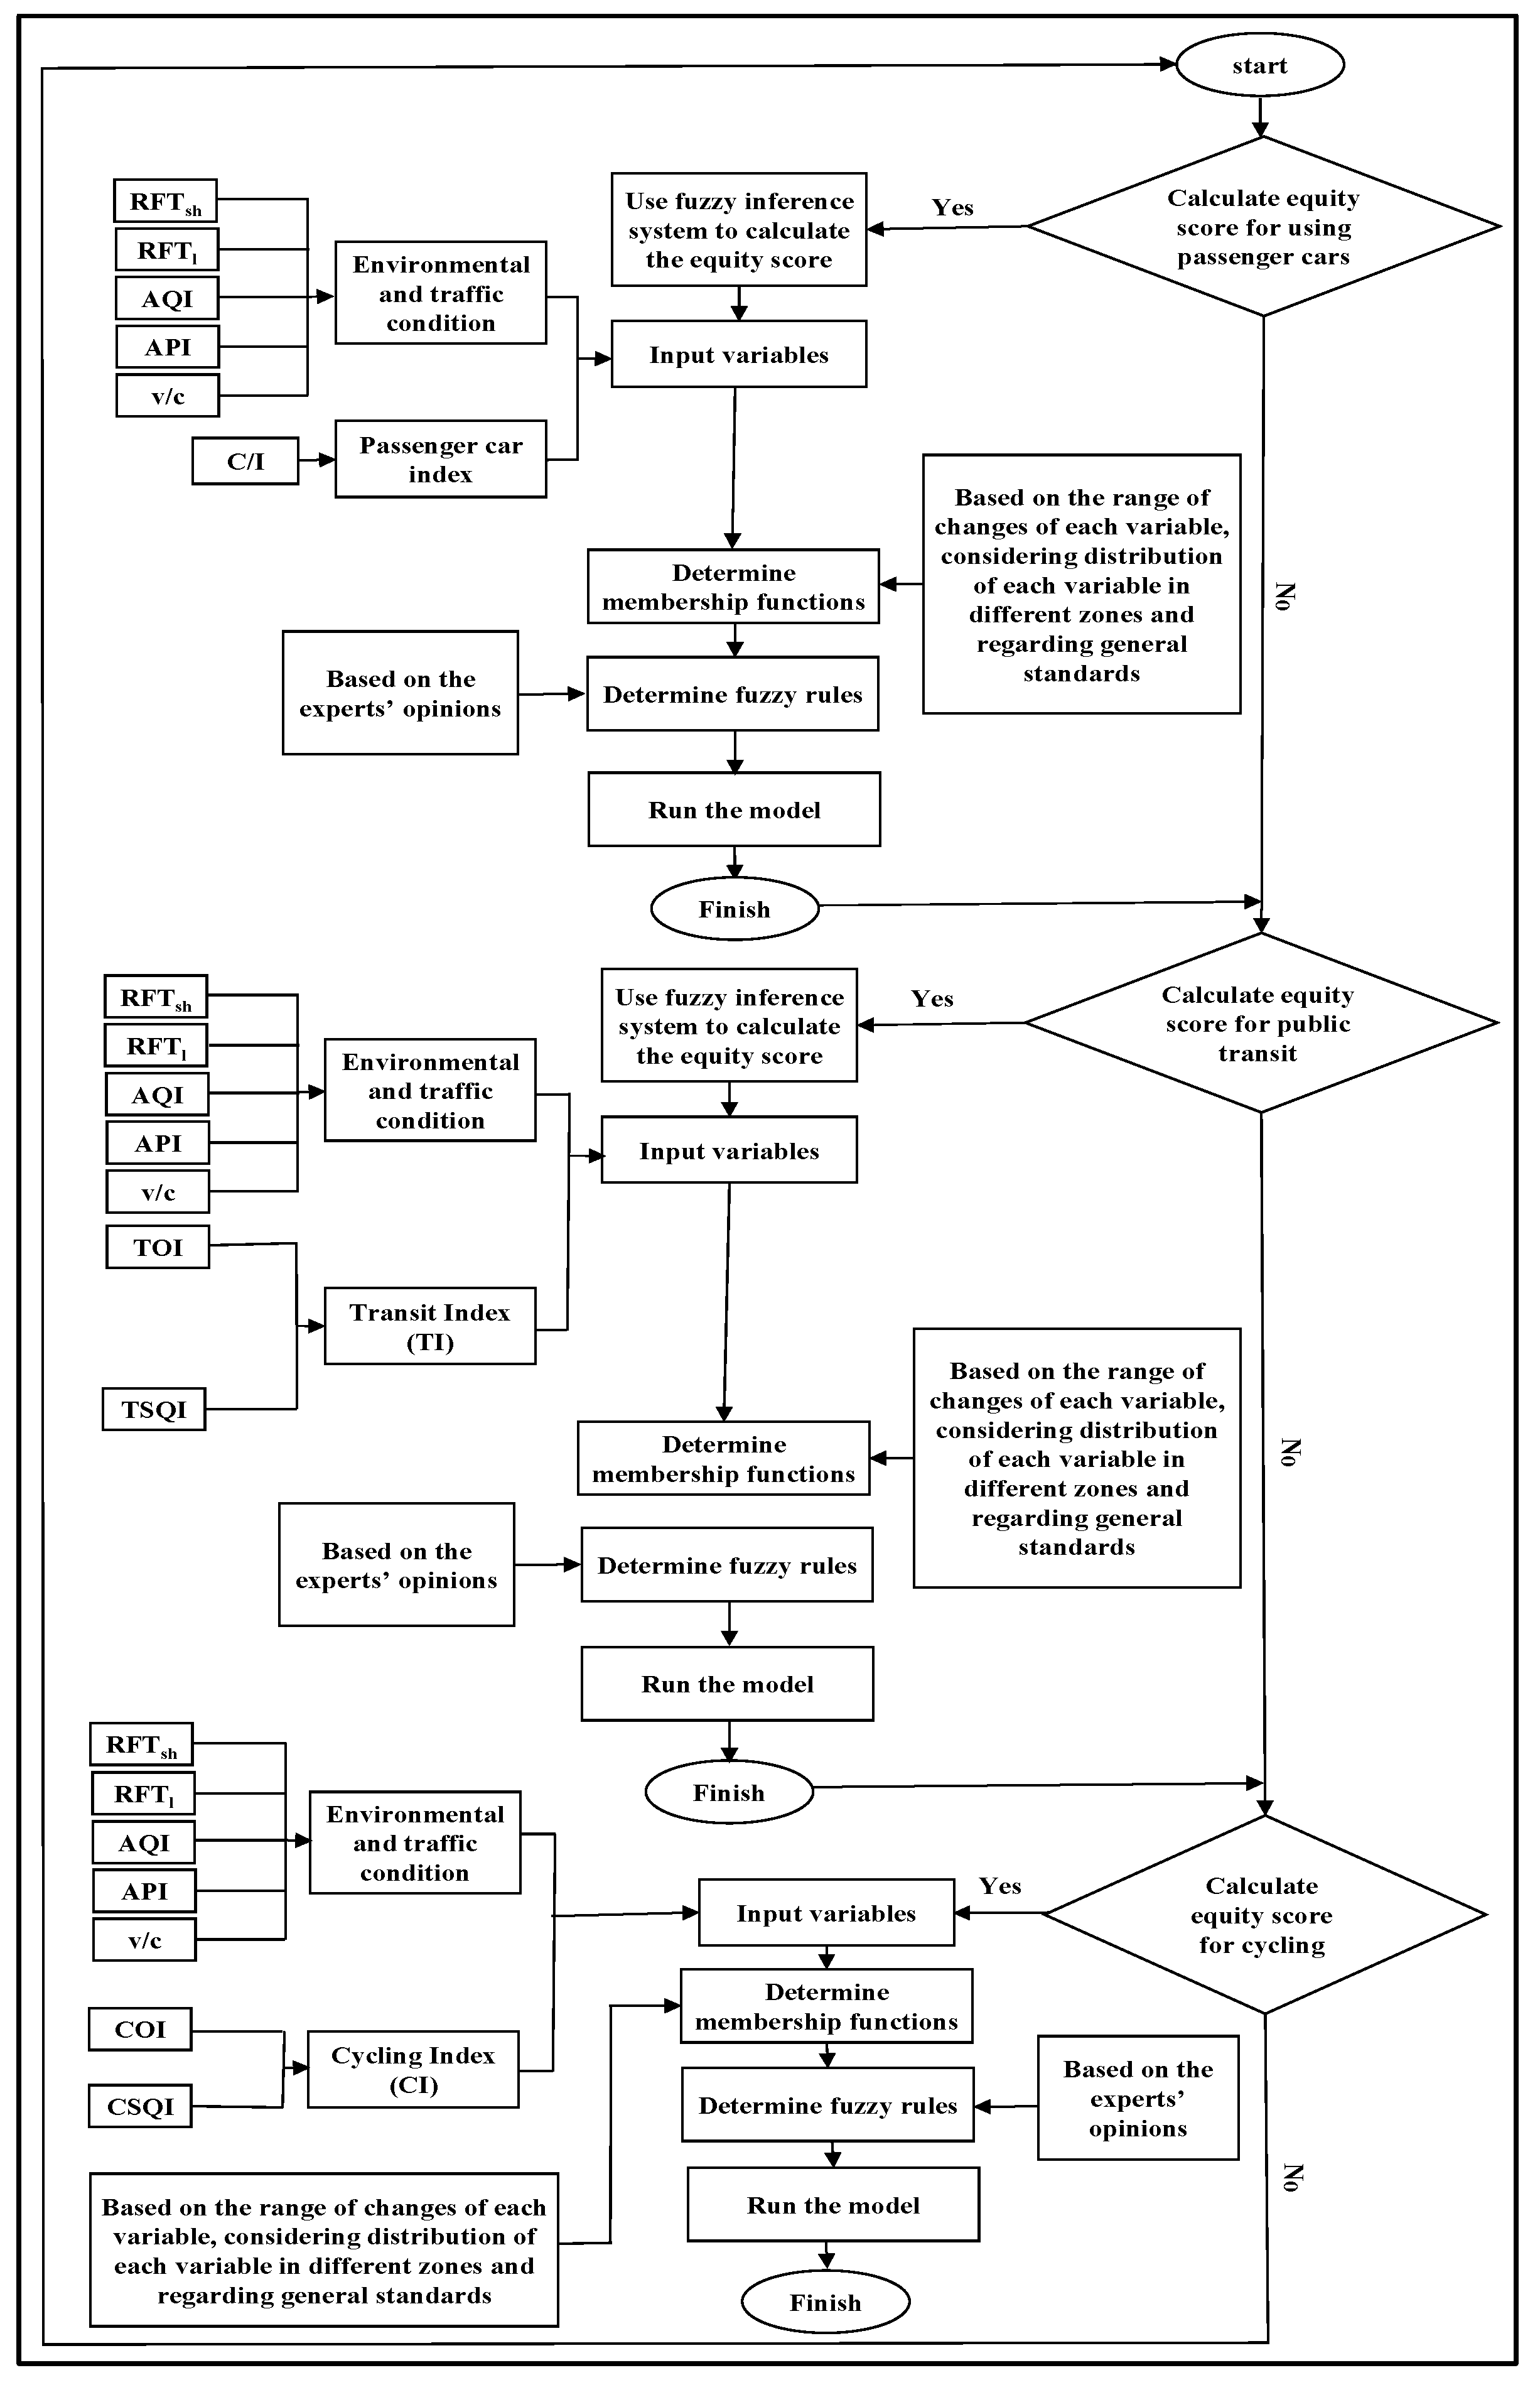
According to comments made by 20 experts in Kerman’s field of transportation planning and traffic engineering, rules are determined based on the different combinations of input variables in the three categories chosen for this paper (RB, cycling, and passenger cars). After determining the membership functions and fuzzy rules, the three FISs can be constructed for RB, cycling, and passenger cars in MATLAB for our case study. Then, the model will be run for different zones of the city, and equity scores can be achieved for them. At the same time, when collecting data in relation to variables outlined in
Table 4, we should ask the citizens (those 30 citizens in each zone) to give us a number between −1 and +1 for ES
P, ES
RB, and ES
C based on their previous experiences in using these modes. At last, the equity scores which have been provided by FIS models will be compared with the scores that citizens have determined for each mode in each zone. To have a review of the paper methodology, a flowchart is presented in
Figure 1.
The proposed method to calculate ES
P, ES
RB, and ES
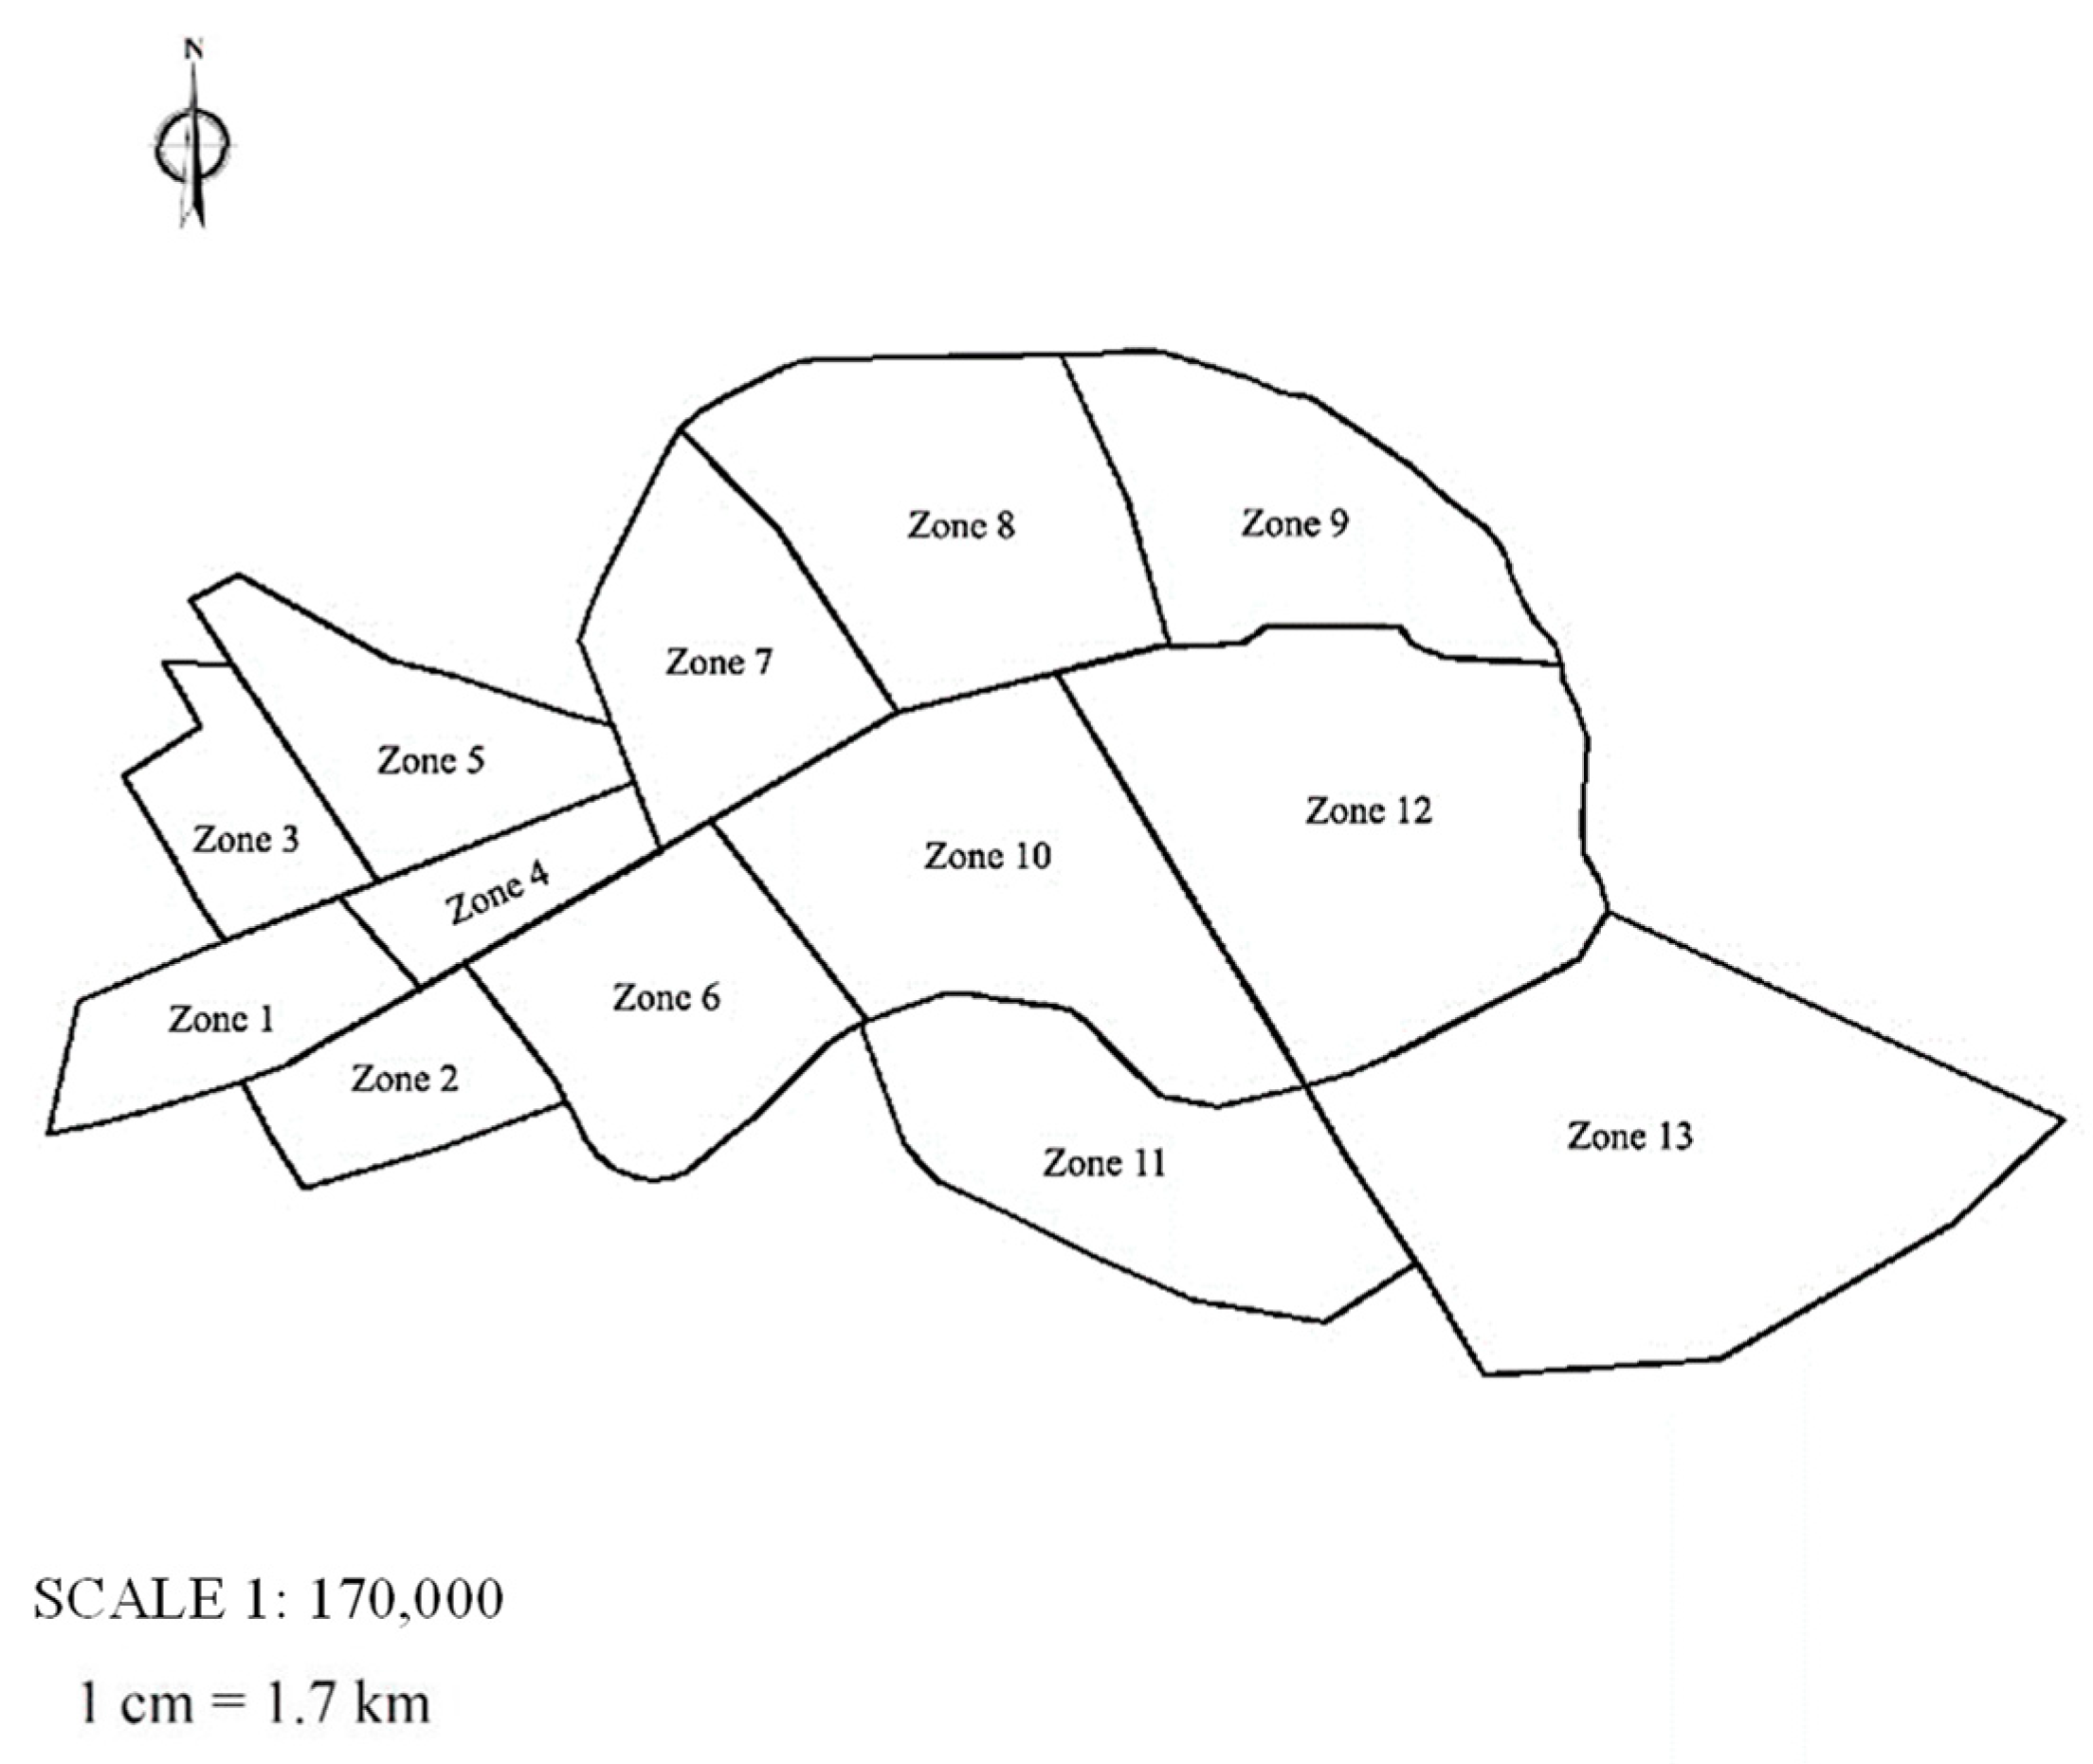
C is used for Kerman city as the case study. Kerman is a city in the southeast of Iran. It is one of the metropolitan cities of Iran with a 240 square kilometer area and more than 600,000 inhabitants. First, the city has been divided into thirteen homogenous zones. The homogeneity of zones refers to population, average family income of residents, and road types.
Figure 2 presents the city map and its related zones. In each zone, there are approximately people with similar incomes, jobs, trip frequencies, and trip purposes. The land use and the status of transportation systems are almost constant throughout a zone.
The input variables used to calculate the ES
P, ES
RB, and ES
C, consisting of RFT
sh, RFT
l, v/c, AQI, API, and C/I for each zone, are presented in
Table 6.
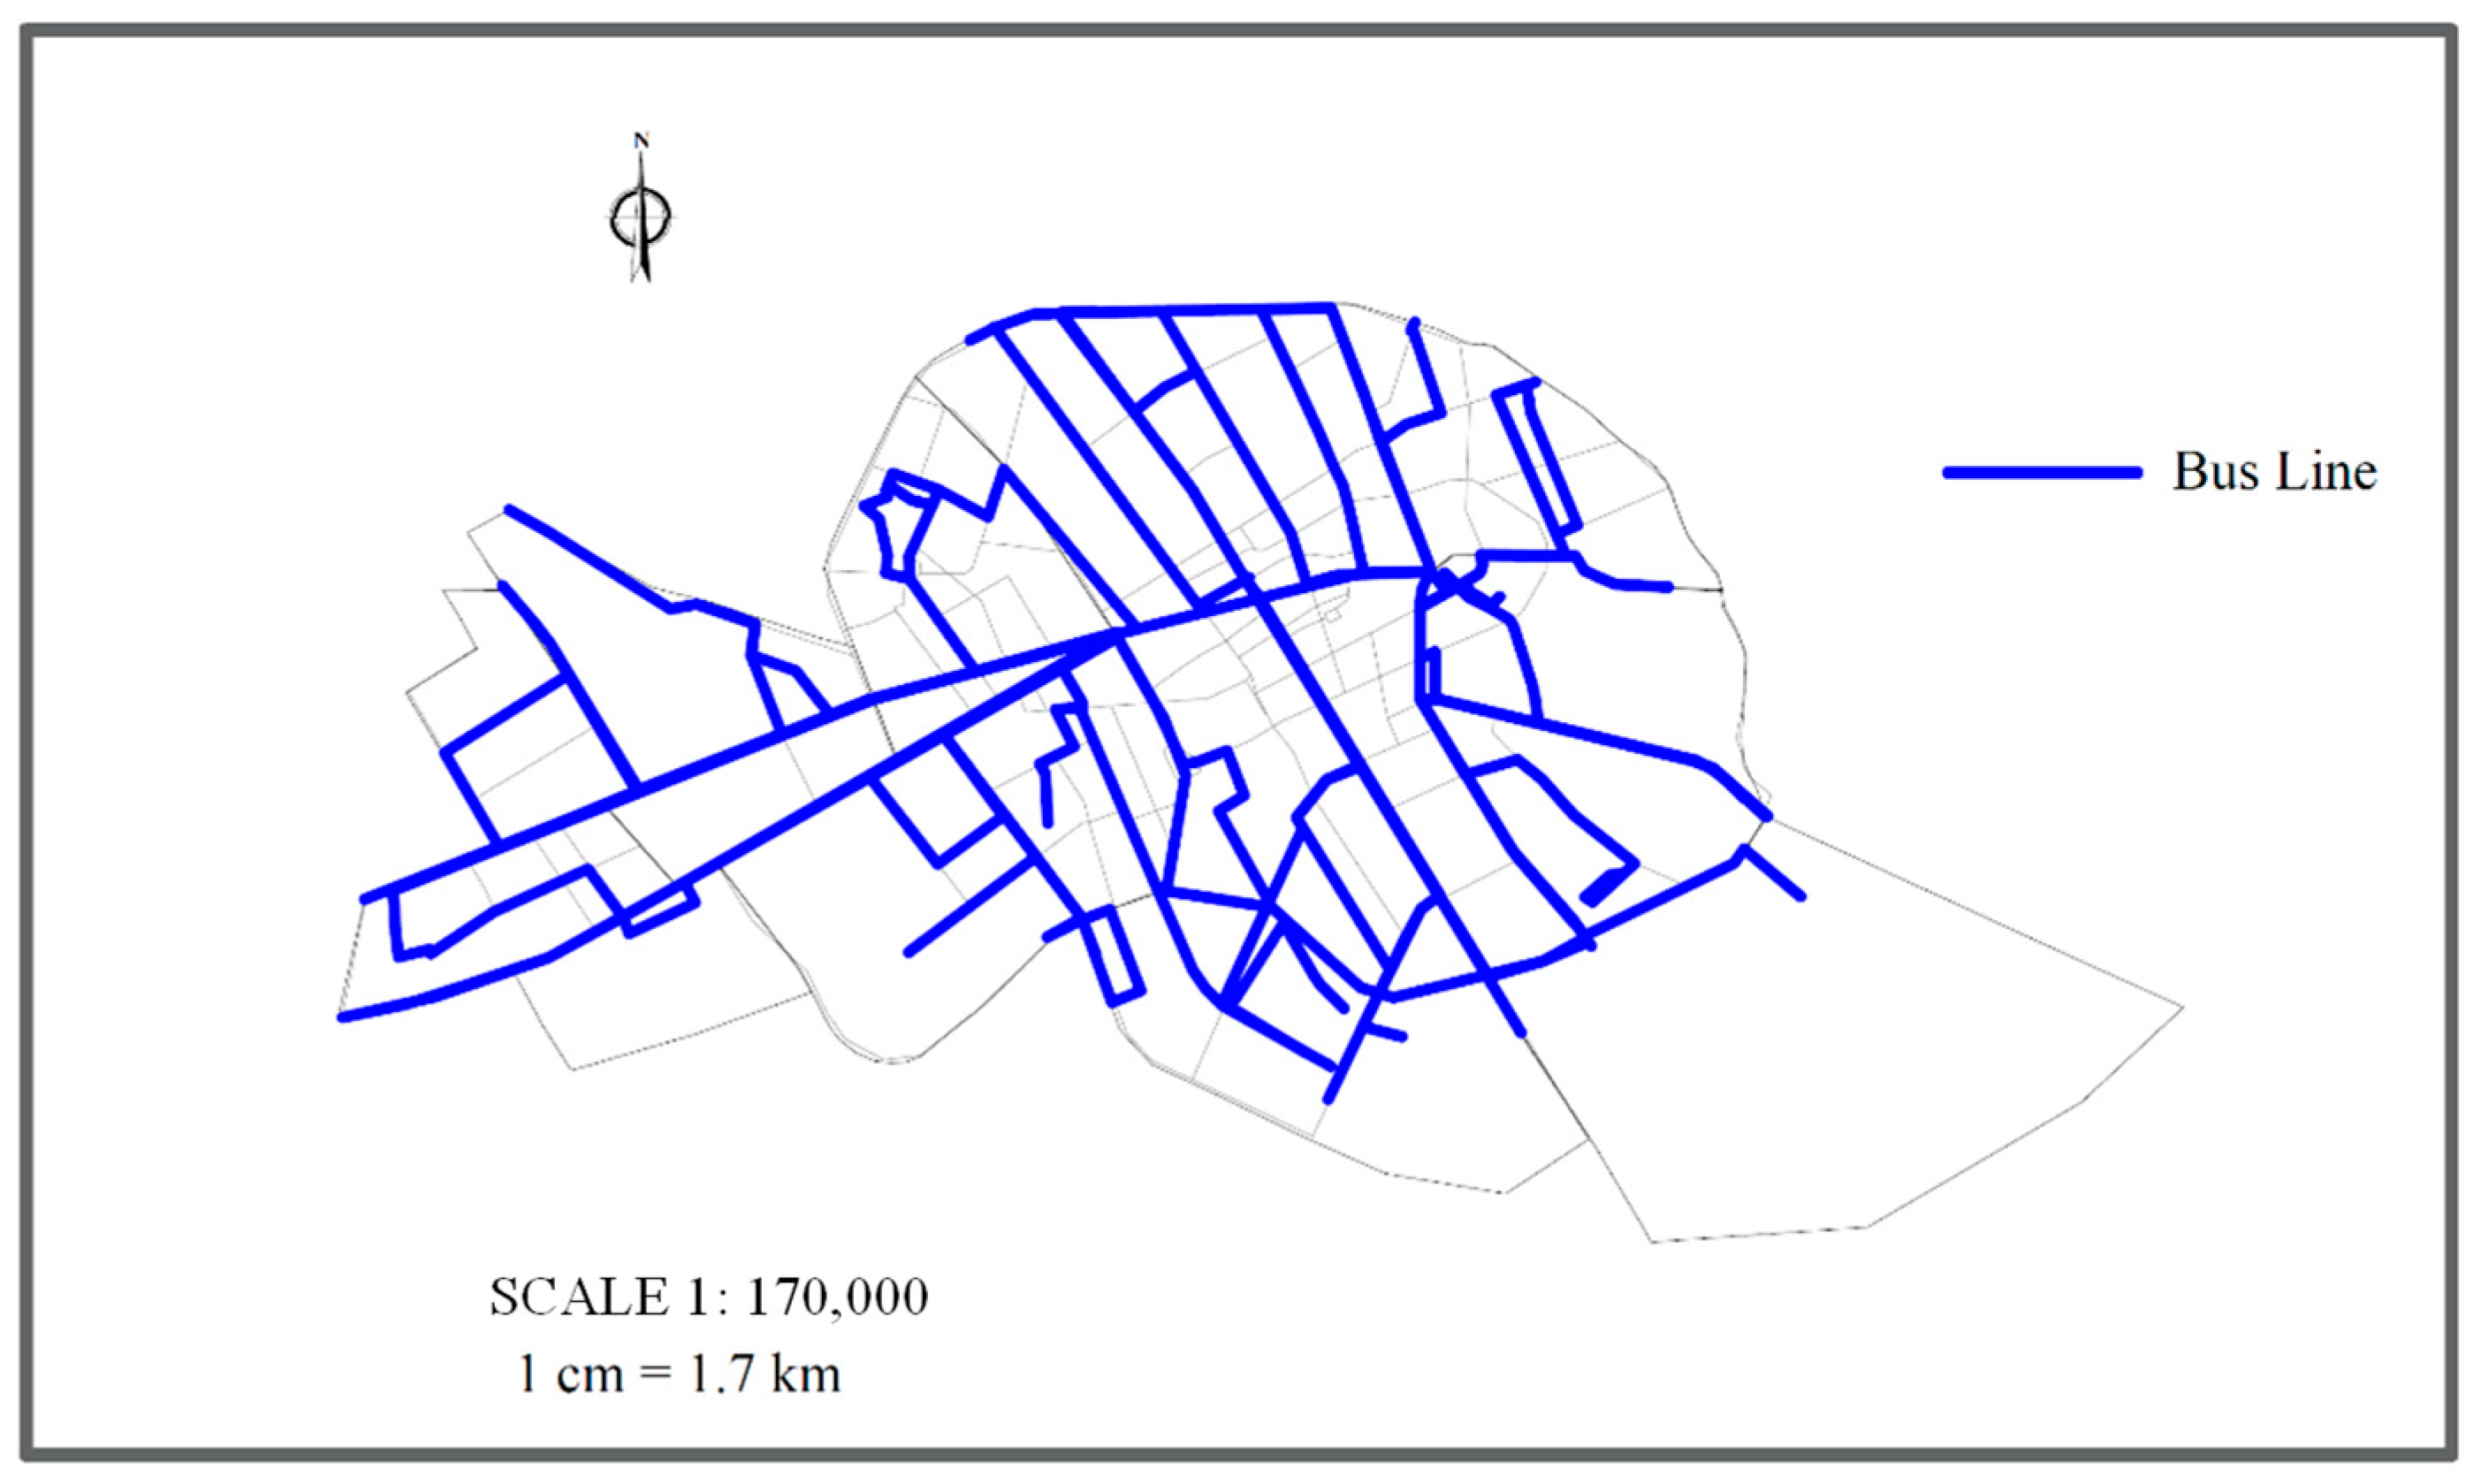
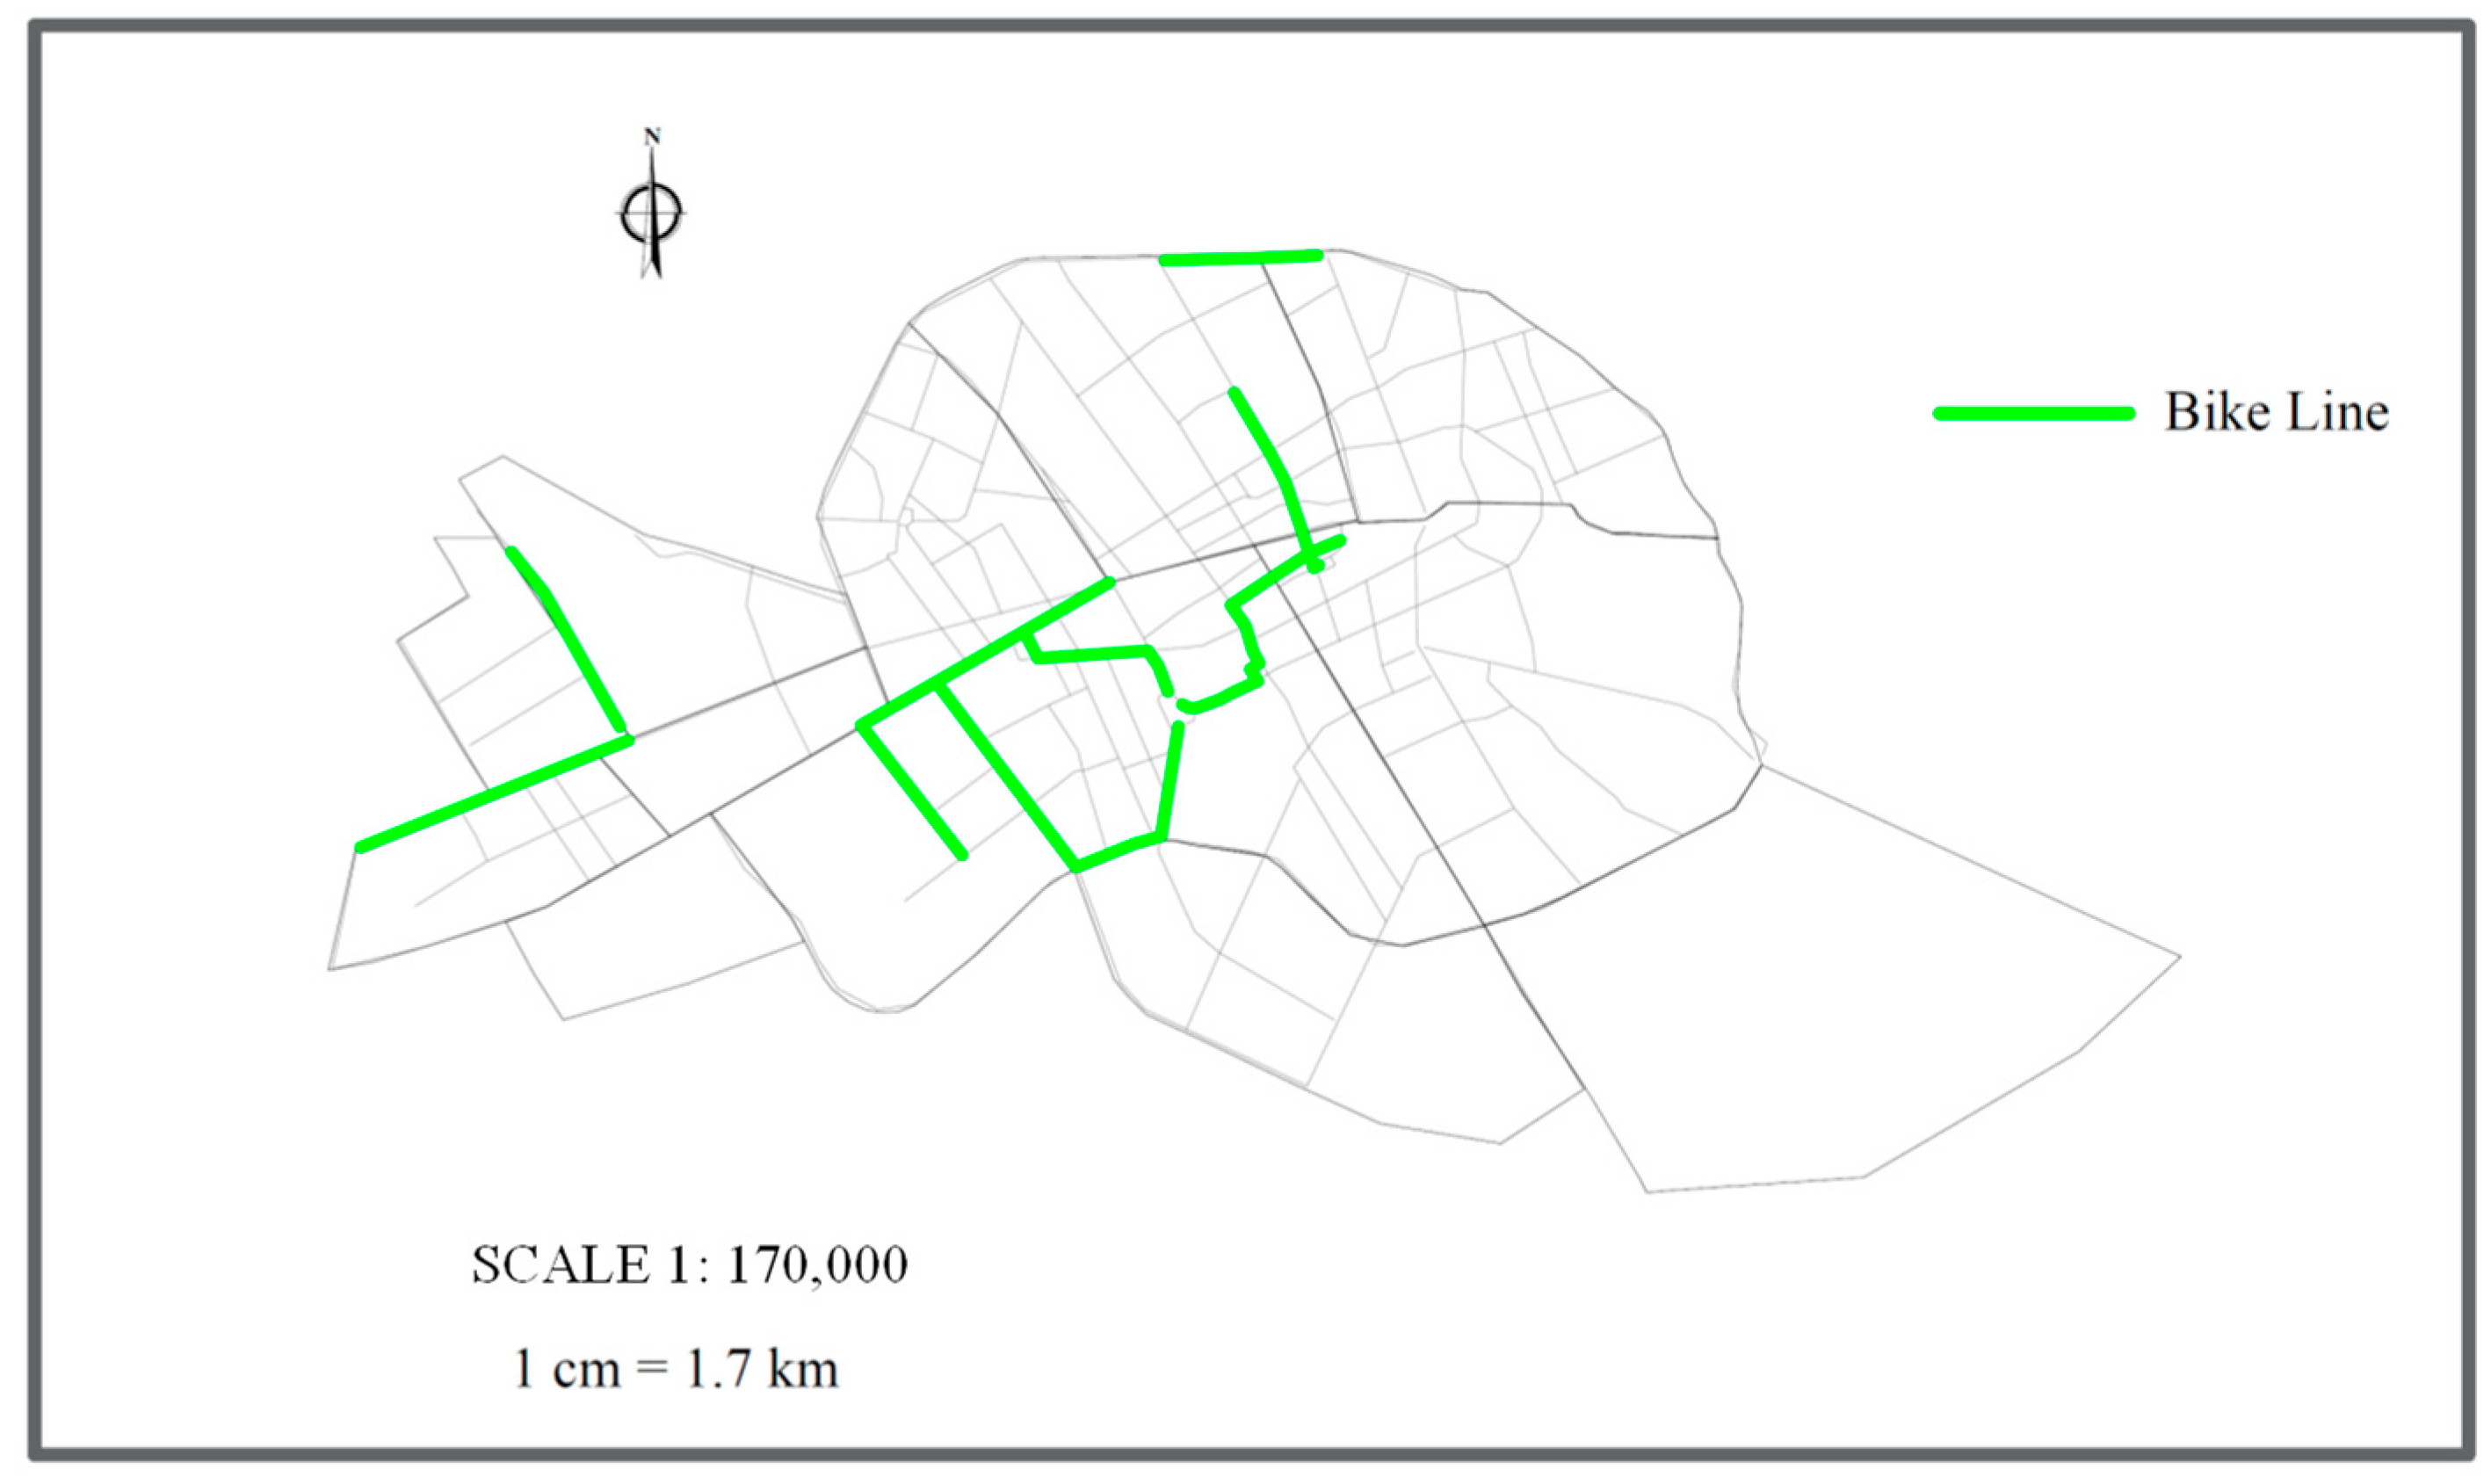
To determine TI and CI for each zone, TOI, TSQI, COI, and CSQI are calculated. For TOI and COI, the transit and cycling infrastructures are determined as demonstrated in Equations (1)–(6) and (7)–(12), respectively. Kerman does not have a Metro or Bus Rapid Transit (BRT), and the only public transportation available is the RB.
Figure 3 and
Figure 4 show the RB lines and cycling paths in each zone.
Table 7 indicates the results for TOI, COI, TSQI, CSQI, TI, and CI in each zone.
To calculate TSQI and CSQI, interviews were performed with citizens (based on the parameters in
Table 3 and
Table 4). For this purpose, in each zone of Kerman city, 30 people were surveyed (the total number of respondents is 390).
The sample size that is necessary for this survey is 384 by Equation (15) [
54].
where:
n: Sample size, the number of citizens to be surveyed
N: Population size, the total number of citizens in Kerman (600,000)
Z: 1.96 for 95% confidence level
p, q: The quality characteristics which are to be measured. Where no previous experience exists, the value of p is taken as 0.5 and q = 1 − p = 0.5
d: The desired level of precision. It is considered 5%.
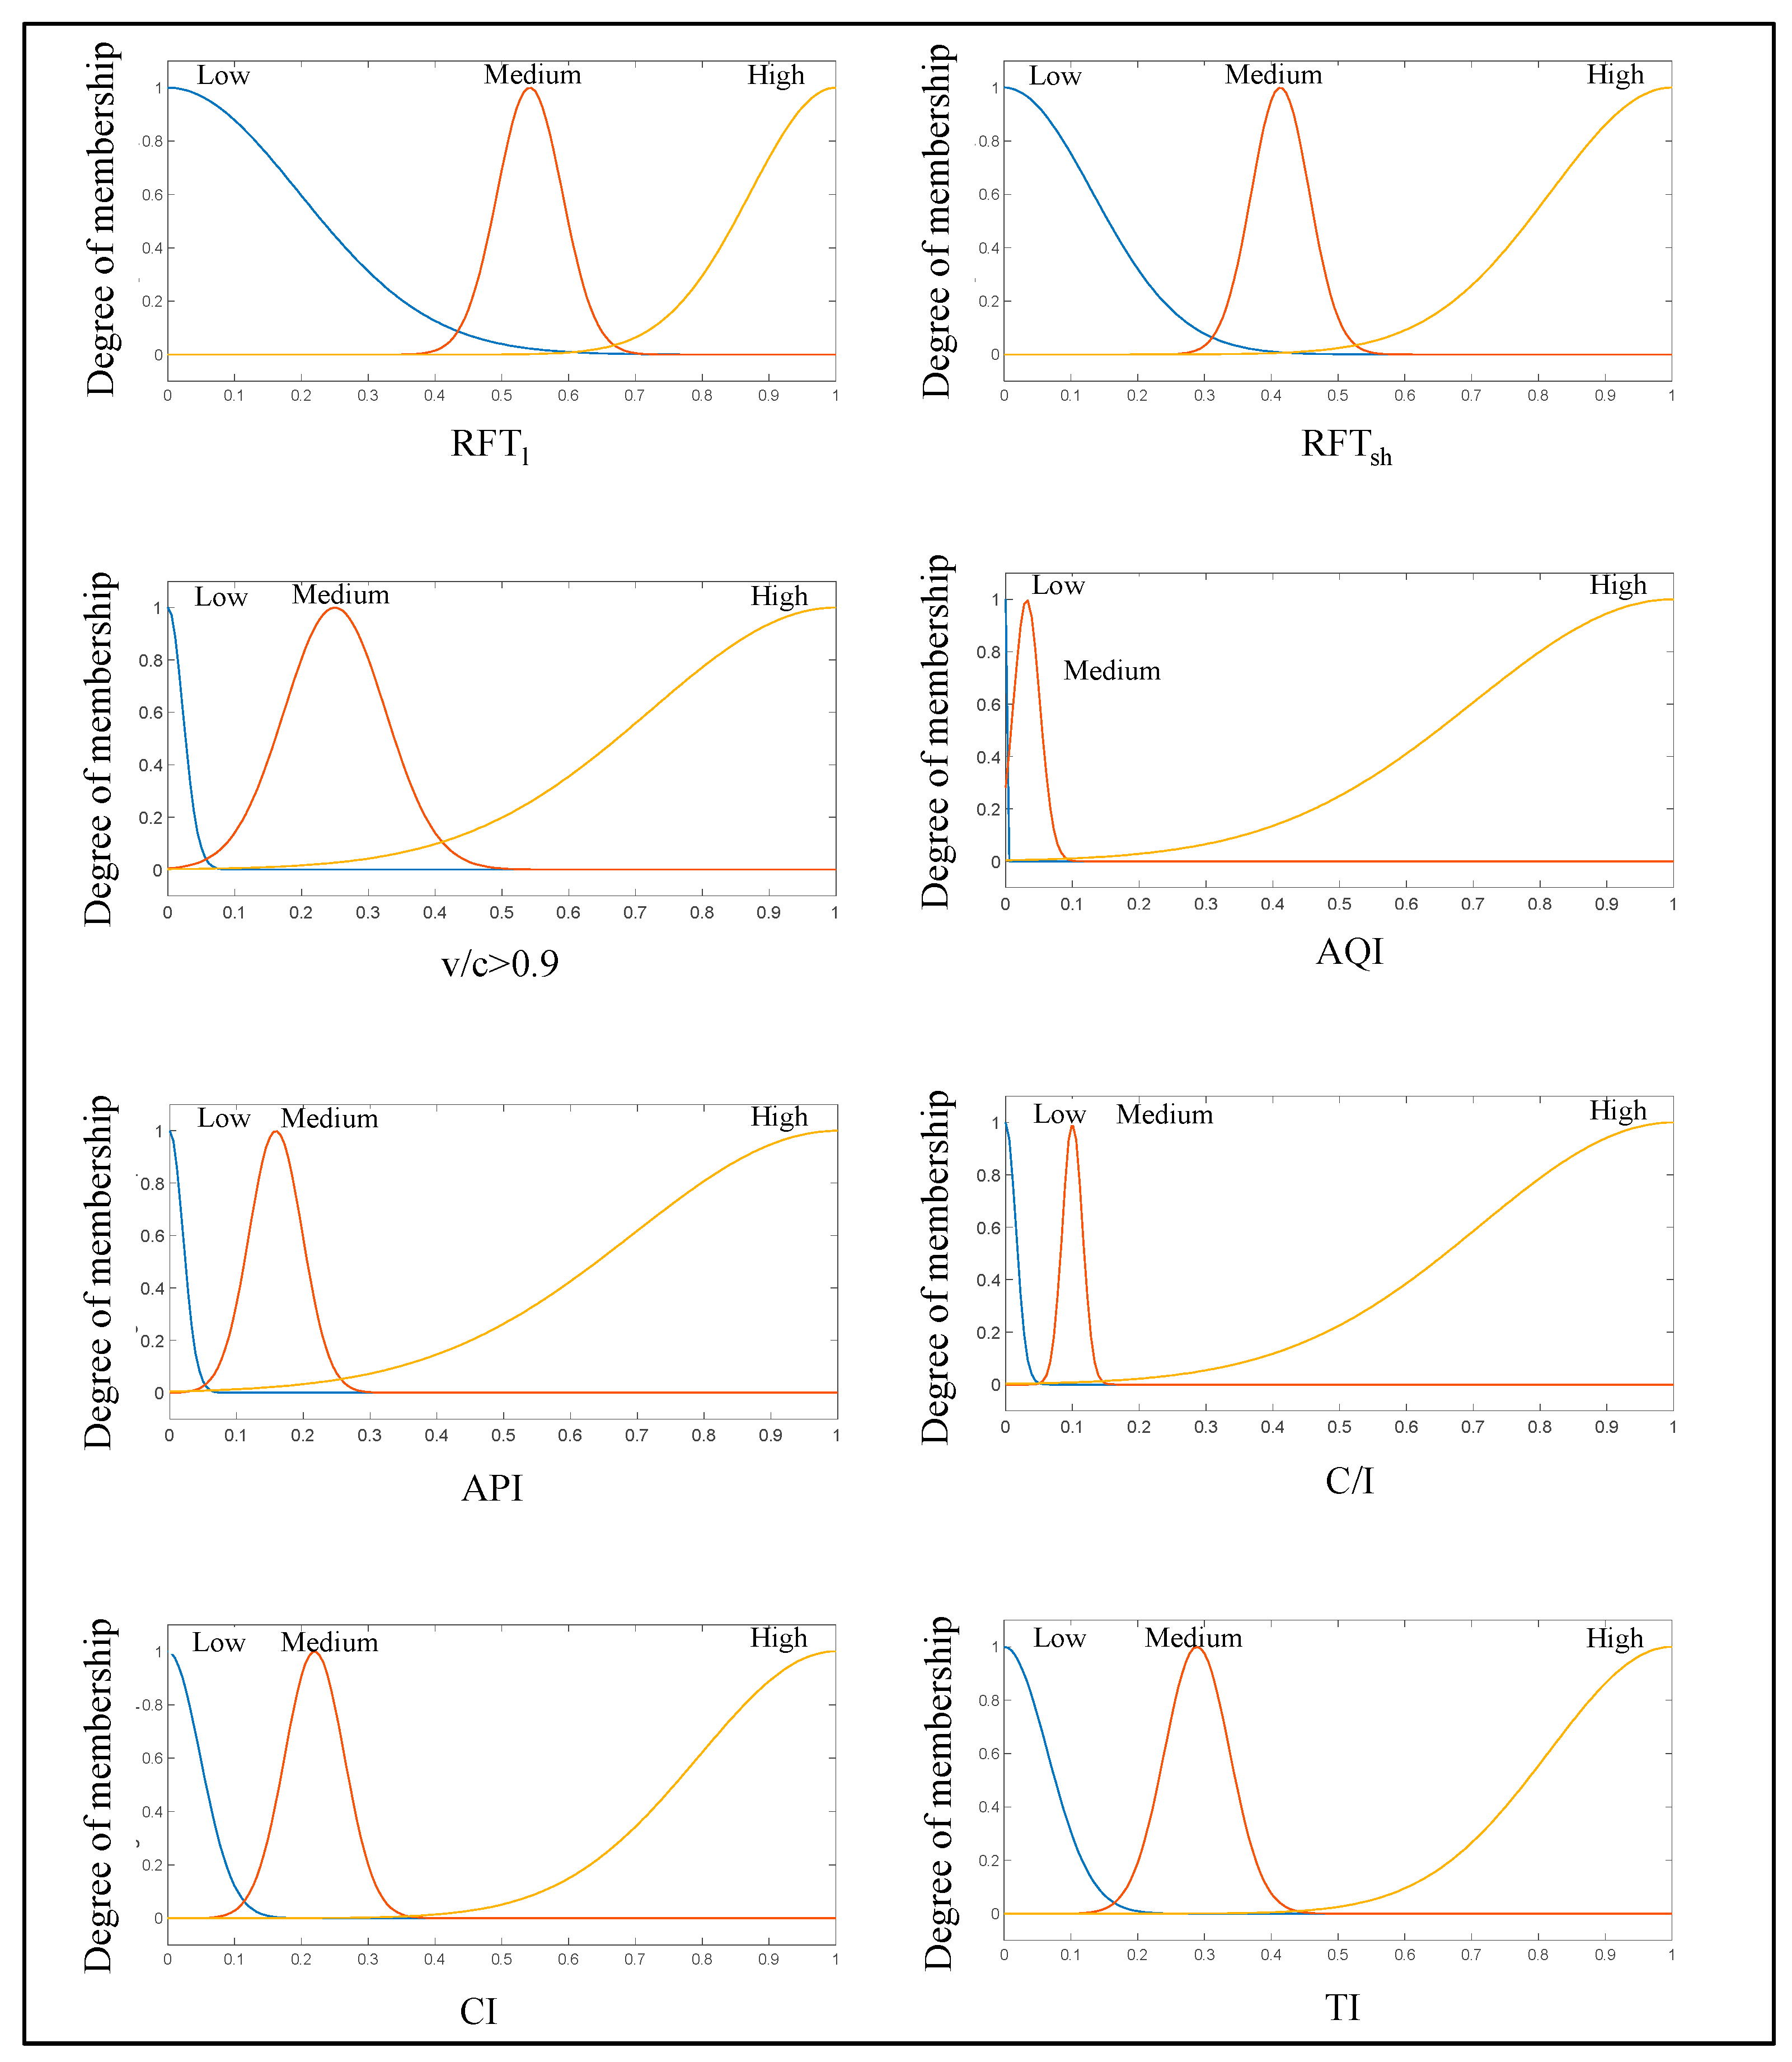
The Gaussian membership functions, as displayed in
Figure 5, are used for these variables. Gaussian functions have a feature that considers changes in the target function softly and slowly for each of the input variables. These membership functions were made based on the direct rating technique. In this technique, different values for each variable are made randomly and repeatedly. Then, for each input variable, we asked 20 experts (those we asked for their comments to construct fuzzy rules) to tell us the membership degree for each value [
42]. For example, it was asked how much you think API = 0.5 belongs to the category of low, medium, and high. At last, the average of results has been used and shown in
Figure 5.
The experts’ opinions also have been used to develop the fuzzy rules. In each interview, different combinations of the input variables have been provided, and experts have been asked about the equity of transportation systems. For the aim of brevity, just some examples of FIS rules for ESP, ESRB, and ESC are presented here:
For ESP:
- -
If RFTl is high, RFTsh is high, TI is high, and C/I is low, there is very positive equity for passenger cars;
- -
If RFTl is high, RFTsh is high, TI is high, and C/I is high, there is equity for passenger cars;
- -
If v/c is low, AQI is low, API is low, TI is medium, and C/I is medium, there is negative equity for passenger cars;
- -
…
For ESRB:
- -
If RFTl is high, v/c is high, and TI is high, there is equity for RBs;
- -
If RFTl is high, v/c is high, and TI is low, there is very negative equity for RBs;
- -
If RFTl is low, RFTsh is medium, v/c is low, AQI is low, API is low, TI is high, C/I is low and CI is low, there is very positive equity for RBs;
- -
…
For ESC:
- -
If RFTsh is high, v/c is high, TI is low, and CI is low, there is very negative equity for cycling;
- -
If RFTsh is high, v/c is high, TI is high, and CI is low, there is negative equity for cycling;
- -
If RFTsh is medium, v/c is low, AQI is low, PI is low, TI is medium, C/I is medium, and CI is medium, there is equity for cycling;
- -
…
Now, the FIS models are run for each transport mode (bus, cycling, and passenger car).
The ES
P, ES
RB, and ES
C values are presented in
Figure 6a–c for each zone based on the FIS models and the citizens’ opinions. In this figure, as previously mentioned, zero means that there is equity (answer to RQ1). Negative values mean that there are deficiencies in the transportation mode based on RFT
sh, RFT
l, AQI, API, and v/c (answer to RQ2). Positive values indicate that the provided facilities for the mode are higher than what is necessary based on RFT
sh, RFT
l, AQI, API, and v/c (answer to RQ3).
Based on
Figure 6a, the citizens thought that equity has been established for passenger cars in most zones. For ES
RB and ES
C, there is negative equity based on the model outputs and the citizens’ comments. This refers to the deficiencies concerning public transit, cycling infrastructure, and service quality in all regions of the city (answer to RQ2). However, citizens have overestimated these inequities in all zones.
To compare the results, a mean difference by t-test is performed for ES
P, ES
RB, and ES
C.
Table 8 shows the statistical analysis. Based on the outputs, it can be declared that there is a significant difference between the equity scores identified by citizens and what has been calculated by the FIS models (answer to RQ4). The differences between cycling and RBs are greater than those for passenger cars (answer to RQ4). Furthermore, the FIS models indicate that although the calculated ES
RB and ES
C are greater than what has been declared by citizens, the overall status of sustainable transportation systems is not good in Kerman (answer to RQ4).
Figure 6 and
Table 8 indicate that the citizens often underestimate the provided transportation facilities and infrastructures. They expect more services for RBs and cycling, and, thus, the average scores (ES
RB and ES
C) for each zone are lower than what has been calculated by the FIS models (answer to RQ4). On the other hand, the FIS model has shown that, in some zones, the suitability of conditions for using passenger cars was higher than what was needed for the ES
P (answer to RQ3). However, the citizens have announced that the equity for using passenger cars is established and even that some zones need more attention to facilitate passenger cars’ movement.
The objective of the study was to determine if transportation supply is fair when it is considered in light of conditions related to traffic (v/c), the environment (air quality), and demand (long and short distance trips). A transportation planner would be able to determine whether or not the transportation supply in each region of a city is sufficient based on the response to this question. The supply of bicycles in all parts of the city, for example, is not equitable when considering the needs of citizens (answer to RQ1). The lack of cycling infrastructure is not as severe as most people think. According to
Figure 6, Kerman’s cycling supply should be improved in zones 8, 9, and 12. As can be seen in
Figure 6, RB in most zones has deficiencies, but those in zones 7, 10, and 8 are less problematic (answer to R1 and RQ2). For transportation planners, improving RB in zones 11, 13, and 6 is a top priority. In most zones, the suitability of conditions for using passenger cars is fair. From another perspective, transportation planners need to rethink the situation. Passenger cars may be preferred in zones 7, 9, and 12 because the conditions are too favorable for this mode of transportation (answer to RQ3). This may lead to a shift in demand from sustainable transportation systems to this mode.
This paper was primarily motivated by providing a logical approach to calculating equity scores for different modes of transportation. Previously, it had been mentioned that the citizens usually have problems judging the status of resources provided by administrations, and they feel exposed to inequities [
26]. The results of this paper also proved the difference between the judgment of citizens about transportation equity scores and what is provided in the real world (answer to RQ4). Hence, the citizens’ comments can be misleading when they are used to developing transportation systems (buses, cycling, and passenger cars), and it is necessary to have logical measures to calculate the equity for each mode, and then decide what to do (answer to RQ4).
The limitations of this paper are as follows. First, for each society, the fuzzy rules and membership function must be calibrated based on the regional conditions (v/c, air quality, frequency of long and short trips, population, car-ownership rate, costs associated with using passenger cars, quality of transportation infrastructures) [
42,
55]. Secondly, the proposed method for calculating equity scores must take into account all society members. The current model cannot determine equity scores for specific groups such as low-income groups, people with disabilities, the elderly, children, and women, among others. It is possible to use the idea for these groups; however, the input variables, rules, and membership functions in the FIS models must be calibrated. Thirdly, we did not consider other modes, such as walking, BRT, Metro, etc. This paper’s overall idea and
Figure 1 can also be applied to other modes of transportation. In other words, calculating equity score using the FIS model using traffic condition (v/c), air quality, and variables describe each mode’s service quality. However, further research is needed to identify the input variables for the FIS model. Input variables such as RFTsh, RFTl, AQI, API, and v/c can be applied to other transport modes. The characteristics of supply must be taken into account according to the specifications of each mode. In addition, we have not compared the model outputs with the comments of stakeholders regarding each mode’s equity. Last but not least, the model does not differentiate between trips based on what they are for.
5. Conclusions
Urban transportation in different modes is an inseparable part of each city and essential for the fulfillment of the daily activities of the citizens. Without appropriate transportation systems, the life of citizens might be disturbed. Different modes must have specific capabilities, and the expectations from a unique mode are not constant in different situations.
In this work, equity is measured by the proportion between long- and short-distance trips, air pollution conditions, parking space availability, and the volume-to-capacity ratio, compared with the status of transportation systems. Based on some input variables, a method based on FIS is proposed to quantify equity in transportation systems. Using passengers’ and administrations’ perspectives, we described the condition of transportation supply (C/I, TI, and CI). Three FIS-based models have been run for passenger cars, RBs, and cycling in a case study in Kerman, Iran, in each zone. They were compared with the comments of citizens about the equitability of these systems. This method of calculating equity scores for transportation modes can be applied to other case studies. However, this method must be calibrated for each one.
According to the results of this study, citizens are generally concerned about equity issues in public transportation systems. A further problem is that citizens tend to promote car-related conditions, which are incompatible with sustainable development. Thus, when planning and making transportation policies in developing countries, it can be misleading to rely on their comments.
The main limitations of this paper consist of the need for the calibration of fuzzy rules and membership functions for each case study, the need for a large sample size to calibrate the model, the model’s inability to determine the equity score for vulnerable groups in the city, disregarding other modes, such as walking, BRT, Metro, etc.; disregarding the comments of stakeholders about the equity of each mode; and finally disregarding each trip in terms of its purpose.
The voice of citizens is, however, important from a political standpoint, and we cannot simply disregard it. Considering what has emerged from our model, a compromise should be reached to keep citizens relatively happy while distributing resources in a more equitable way. This extends beyond the scope of this paper (to adequately inform and educate citizens so they can better understand the situation). However, it seems essential for the city’s better management. This topic is proposed as further research for the future.


 ,
, 


