Article

Compaction Quality Inspection and Uniformity Analysis of Soil-Rock Mixed Subgrade

1
Zhong Jiao Jian Ji Jiao Highway Investment Development Co., Ltd., Shijiazhuang 050000, China
2
State Key Laboratory of Mechanical Behavior and System Safety of Traffic Engineering Structures, Shijiazhuang Tiedao University, Shijiazhuang 050043, China
3
School of Civil Engineering, Shijiazhuang Tiedao University, Shijiazhuang 050043, China
4
School of Traffic and Transportation, Shijiazhuang Tiedao University, Shijiazhuang 050043, China
*
Author to whom correspondence should be addressed.
Sustainability 2023, 15(7), 5809; https://doi.org/10.3390/su15075809
Submission received: 7 March 2023 / Revised: 25 March 2023 / Accepted: 26 March 2023 / Published: 27 March 2023

Abstract

:
GeoGauge is a portable instrument for rapid determination of the stiffness and modulus of compacted soil, which can quickly, safely, and nondestructively evaluate the quality of each compacted layer. In order to deeply study the effectiveness of the detection instrument and equipment used in the soil-rock mixed subgrade, based on the construction project of Beijing-Qinhuangdao Expressway, the influence of water content and compaction degree on the test results and the correlation between GeoGauge detection stiffness and settlement difference were studied and analyzed by indoor model test and field test. Finally, the subgrade compaction uniformity is evaluated according to the measured data of the test section and the predicted value obtained by the ordinary Kriging interpolation method. The results show that: The GeoGauge detection stiffness value shows a trend of first increasing and then decreasing as the water content increases. When the water content is 8%, the detection stiffness value of the earth rock mixture reaches the maximum value. There is a good exponential relationship between the compactness of soil-rock mixture and the stiffness value of GeoGauge detection, and the correlation coefficient is 0.9231, which indicates that the stability of GeoGauge detection results is high. The GeoGauge detection stiffness value increases with the increase of the number of rolling passes. When the number of rolling passes is greater than five, the increase in the detection stiffness of subgrade soil decreases, indicating that the subgrade filler has approached the compaction standard after five passes of rolling. The regression equation between GeoGauge detection stiffness value and settlement difference is established, and the specific index of subgrade stiffness is calculated according to the regression equation when the compactness meets the design conditions, which provides reference for practical engineering.

1. Introduction

During the construction of expressway subgrade, the settlement control and overall stability are the main concerns. The effective detection and control of subgrade compaction is important to ensure the road quality [1]. Some of the subgrade during operation in China has caused severe cracking and large uneven settlement since the compaction of subgrade is not uniform during construction [2,3]. Therefore, it is essential to evaluate the compaction uniformity of subgrade in highways. In order to ensure the compaction quality and smooth construction, convenient and accurate detection technology should be adopted to detect the compaction quality of subgrade [4,5,6]. A soil stiffness modulus compaction tester (GeoGauge), as a rapid non-destructive testing equipment for subgrade compaction quality, can effectively monitor the compaction process of subgrade and pavement, ensure that the compaction quality meets the engineering requirements, and avoid the damage caused by over-compaction [7].
The engineering application shows that GeoGauge stiffness measurement is more practical than the commonly used compaction quality detection method [8]. Nazzal [9] measured the stiffness parameters of highway materials and subgrade soil during construction and post-construction observation. The results show that GeoGauge can be used to evaluate the stiffness characteristics of different pavement layers and roadbeds, and the device can also determine the thickness of the measured soil layer and detect the weak points of the compacted soil. Dwivedi [10] analyzed the correlation between GeoGauge detection modulus value, dry density and CBR value. The research shows that there is a good nonlinear relationship between the rebound modulus obtained by the nondestructive testing equipment and the destructive test results, and the model is verified by statistical analysis, which proves that there is a significant correlation between the observed values and the predicted values of various parameters. Sawangsuriya [11,12,13] found that the detection depth of loose sand with a GeoGauge can reach 300 mm through laboratory tests and finite element analysis. However, if the detection object is a multi-layer structure with different stiffness values, the detection depth of the GeoGauge is 125 mm. Lim [14] tested and evaluated embankment materials composed of sand, gravel, and rock using PBT, LWDT, and a Geogauge. The results showed that the correlation between GeoGauge test results and other test equipment on gravel soil subgrade was poor. According to the experimental research conducted by Jozef Vlcek [15], the GeoGauge has a wider range of applications, and its detection results are consistent with those of a lightweight dynamic deflectometer when evaluating the quality of earthworks. The GeoGauge instrument can evaluate the quality of earthwork projects, and the accuracy of the test results is close to the level of the widely used Light Dynamic Deflectometer. Shubhm Dwivedi [16] shows that GeoGauge detection technology can effectively evaluate the quality of pavement layer during construction and quickly measure and analyze relevant data, so as to carry out quality maintenance on specific sections of expressway. Visvanathan Anusudha [17] tested the compaction quality of subgrade using the Benkelman Beam Deflection (BBD) test, the GeoGauge test, and static plate load tests, and proved that the GeoGauge test results are consistent with other detection methods, which can reflect the compaction quality of the subgrade.
Compared with the traditional subgrade compaction quality control method, the GeoGauge is more widely used and more practical in terms of stiffness evaluation and pavement structure damage identification. However, there are few applications of GeoGauge detection technology in China, and there are few studies on the accuracy evaluation of GeoGauge subgrade compaction quality test results. Therefore, based on the construction project of Beijing-Qinhuangdao Expressway, this paper first studies the impact of changes in moisture content and compactness of subgrade fillers on test results based on indoor model tests. Then, in the field test, the GeoGauge and the settlement difference method are used for point-to-point detection, and the correlation between GeoGauge subgrade detection index and conventional compaction quality evaluation index is studied. The compaction effect of subgrade is evaluated using a regression analysis of detection data. Finally, based on the ordinary Kriging interpolation method, the subgrade compaction uniformity of the field measured data is evaluated, which provides a reference for the practical application of GeoGauge detection technology. The flowchart of the research method of the paper is shown in Figure 1.

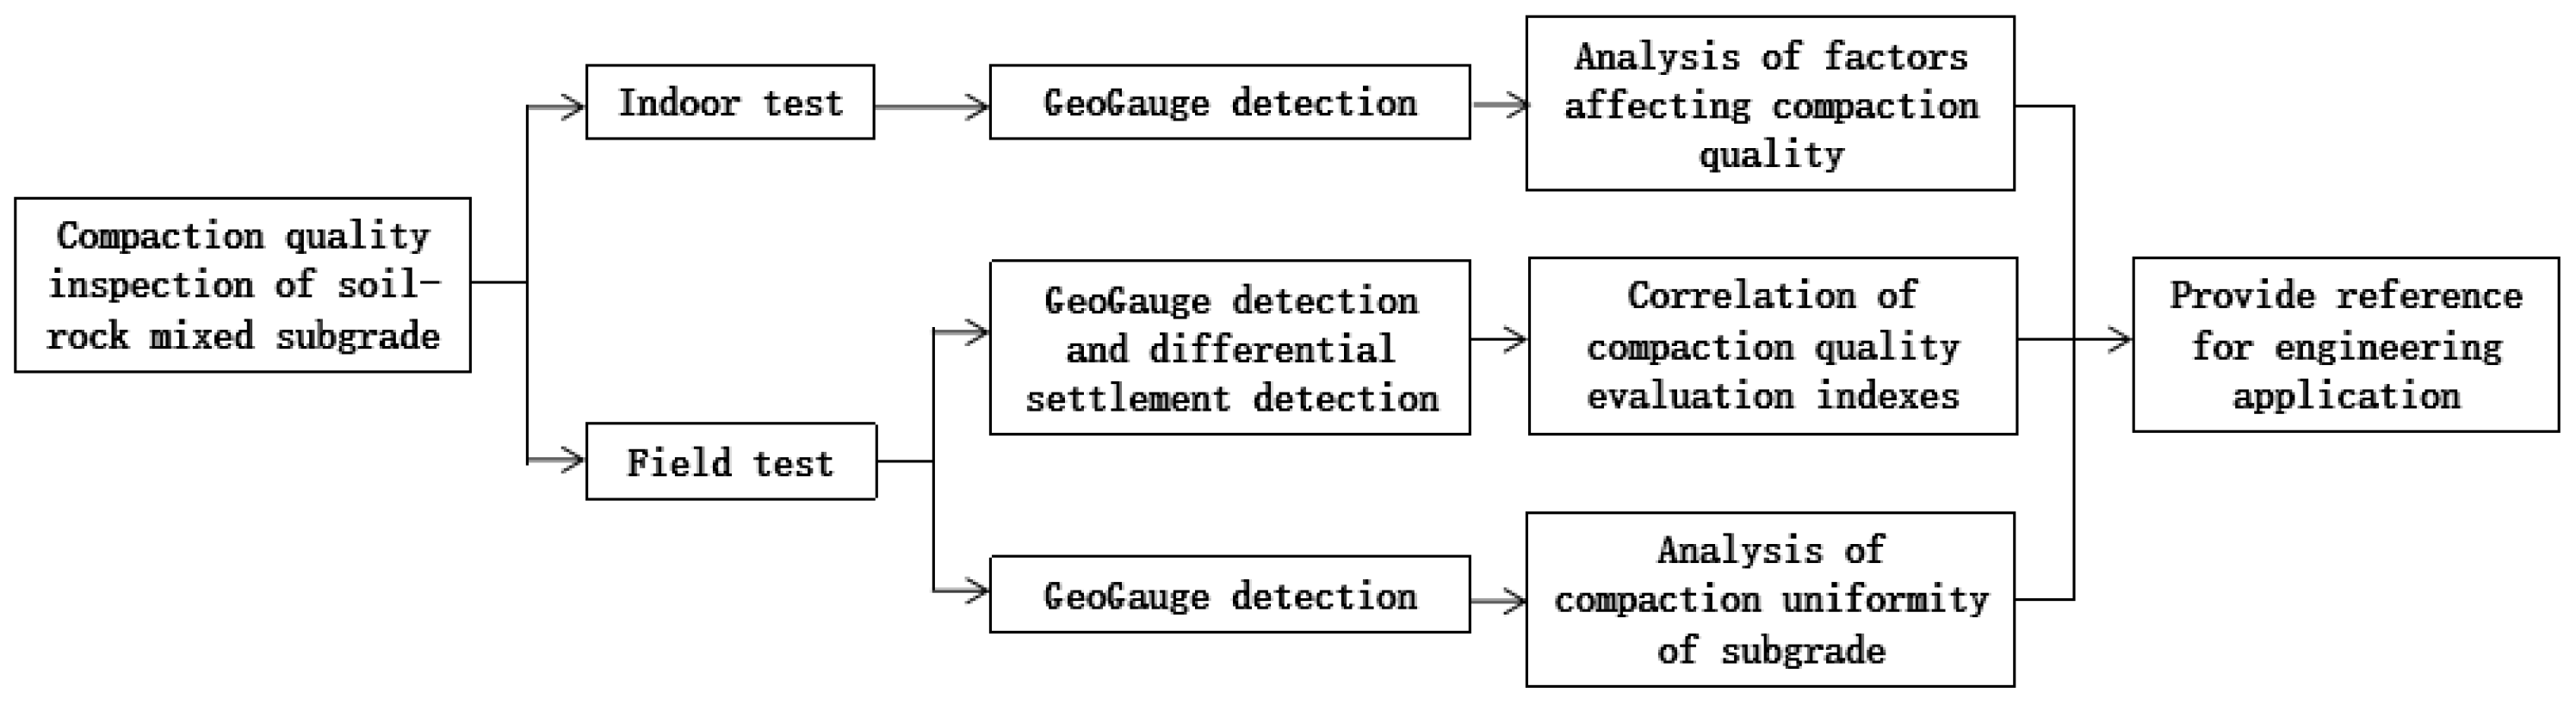
2. Compaction Quality Test Method

The detection of compaction quality is an important work in the process of filling construction. GeoGauge detection method evaluates the compaction quality of subgrade through mechanical indexes (Stiffness and Young’s modulus), while the settlement difference method evaluates the compaction quality of subgrade through physical indexes (differential settlement). The principle of GeoGauge detection and the principle of differential settlement detection are as follows.

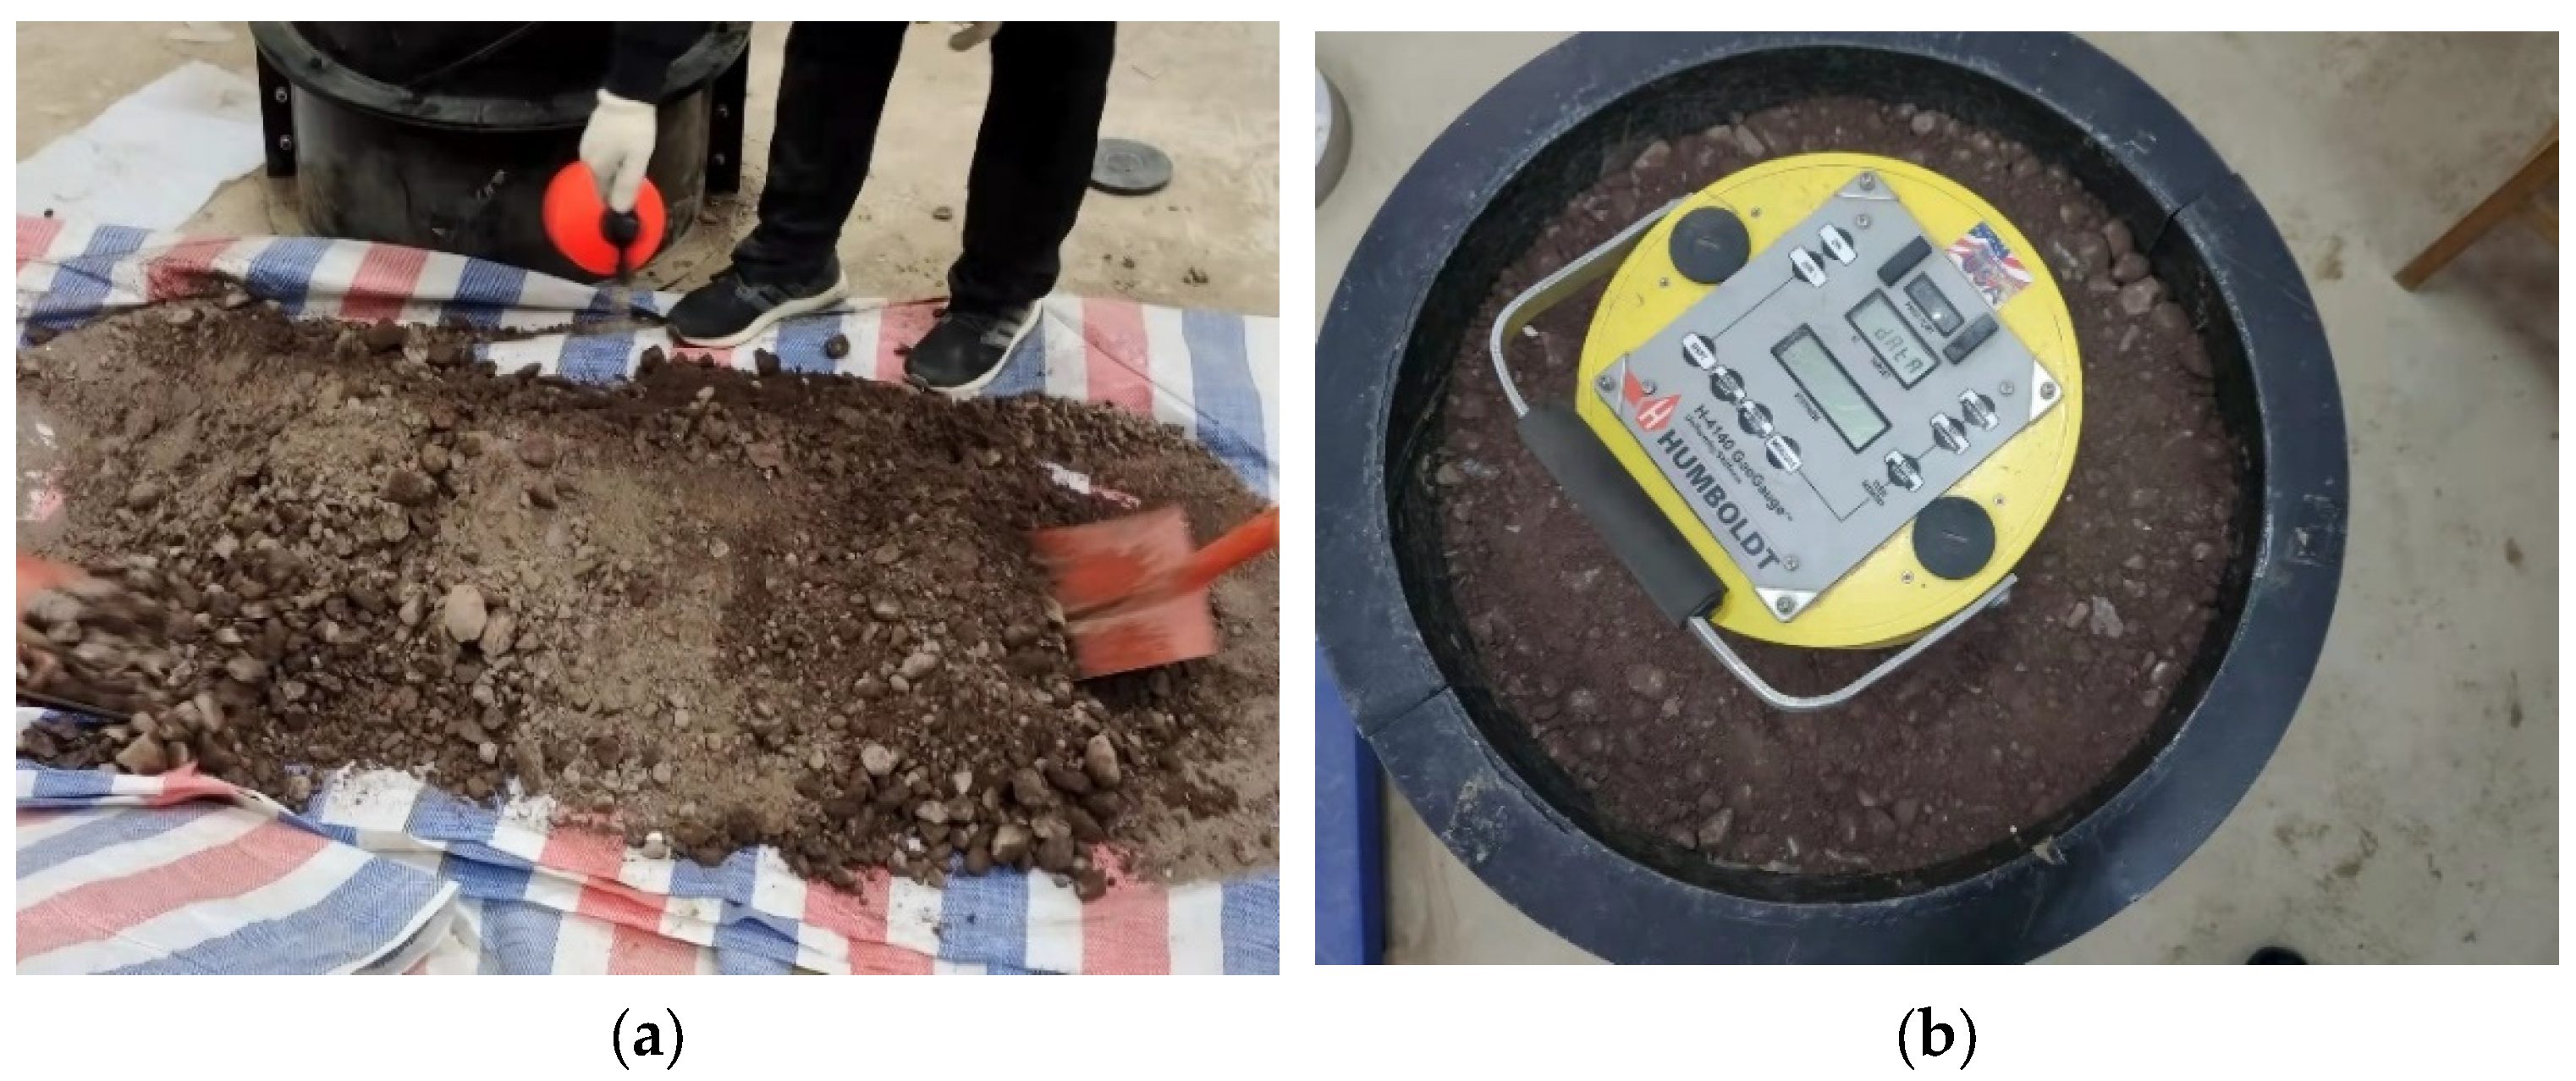
2.1. GeoGauge Detection Principle

GeoGauge measures the resulting displacement by applying a constant vibration force to the subgrade surface. This dynamic technology well simulates the actual application conditions and dynamically reflects the engineering characteristics of compacted subgrade, thus improving the quality control and evaluation level [18,19]. GeoGauge can detect the stiffness and modulus of the subgrade structure layer. Based on the assumption of linear elasticity and isotropic half space, the stiffness K and Young’s modulus E satisfy the following functional relationship:
K = 1.77 E R 1 μ 2
where E is Young’s modulus (MPa); R is the radius (m) of the GeoGauge base ring; and μ is Poisson’s ratio.
Young’s modulus E and shear modulus G have the following functional relationship:
E = 2 G ( 1 + μ )
The relationship between soil stiffness K and soil shear modulus G is:
K = 3.54 G R 1 μ

2.2. Differential Settlement Detection Principle

The settlement difference method is a method to test the compaction degree of the earth-rock subgrade or rock-filled subgrade by measuring the settlement variation of the earth-rock subgrade or rock-filled subgrade during the rolling process and combining it with the construction process parameters [20,21,22]. The settlement difference detection requires setting an observation section every 20 m along the longitudinal direction of the road. Settlement observation points are evenly distributed on each observation section at intervals of 5 m~10 m. A fixed object is set at each observation point to ensure that the horizontal position remains unchanged during construction and testing. The construction is carried out according to the established rolling machinery combination and process parameters. After rolling, a level gauge is used to measure the top surface elevation of the fixture Hi1, Hi2Hij point by point, accurate to 0.1 mm. The above rolling and measurement process is repeated until the settlement data meet the requirements.
The calculation formula of settlement difference Δ H is:
Δ H i ( i + 1 ) j = H ( i + 1 ) j H i j
In the formula, Δ H i ( i + 1 ) j is the settlement difference of the jth fixture after the (i) th and (i + 1) th rolling, (0.1 mm); H ( i + 1 ) j is the top surface elevation of the jth fixture after (i + 1) repetitions of rolling, (0.1 mm); and H i j is the elevation of the jth fixture after i repetitions of rolling, (0.1 mm).

3. Indoor Model Test

In mountainous and hilly areas, highway subgrade fillers are mainly soil-rock mixtures. This type of filler has good road performance and can save construction costs by using local materials. The soil-rock mixture used in the test is the roadbed filler of the test section. The basic mechanical indexes of the material are determined by geotechnical test. According to the screening test, the gradation curve of the subgrade filler can be obtained (as shown in Figure 2a). According to the vibration hammer test, the compaction curve of the subgrade filler can be obtained (as shown in Figure 2b). According to the uniaxial saturated compressive strength test, the compressive strength of the embankment filler is determined. The basic mechanical indexes of the test materials are shown in Table 1.

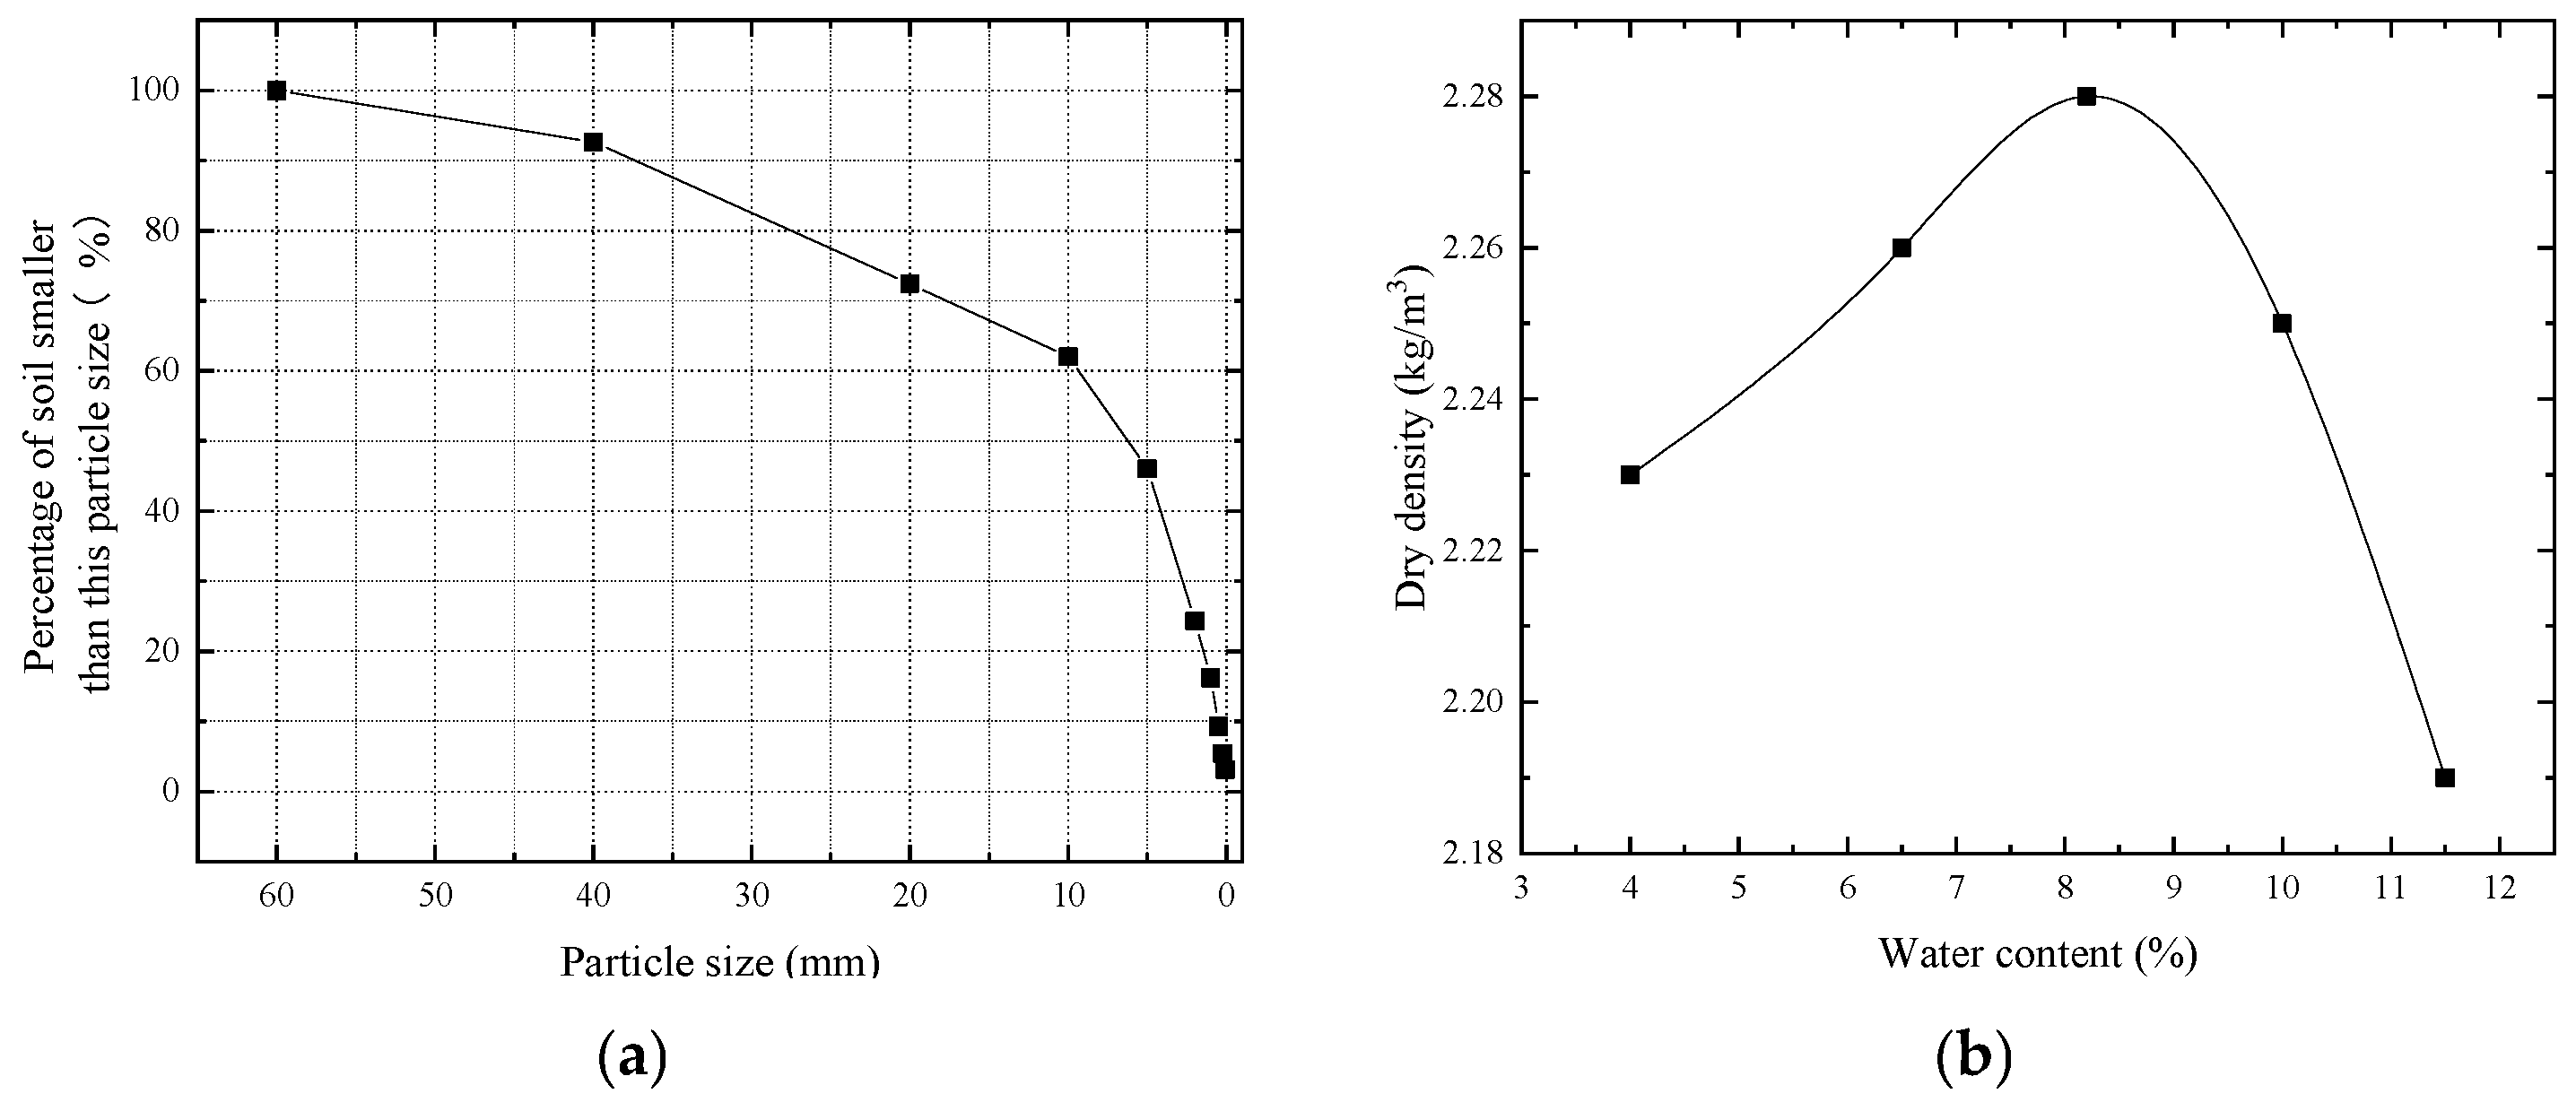
3.1. Indoor Model Test Scheme

The GeoGauge detector has a weight of about 10 kg, a diameter of 280 mm, and a height of 254 mm. The diameter of the annular base in contact with the soil surface is 114 mm. Considering the influence range and boundary effect of the instrument test, the self-designed model cylinder was used for the test. The inner diameter of the cylindrical steel barrel was 610 mm and the height was 600 mm. In order to facilitate disassembly, the model barrel is composed of four semi-circular steel plates. After the test, the samples in the barrel can be quickly demoulded, saving manpower and improving work efficiency.
During the test, the soil-rock mixed fill shall be backfilled in layers in the model cylinder according to the set compactness (93%, 94%, 96%) and water content (taking two points above and below the optimum water content at the interval of 2% water content). The quality method is used to control the compaction degree. After reaching the designed compaction degree, GeoGauge is used to detect the compaction quality. Each point is detected three times, and the average value is used as the final detection result. The model test is shown in Figure 3.

3.2. Test Result Analysis

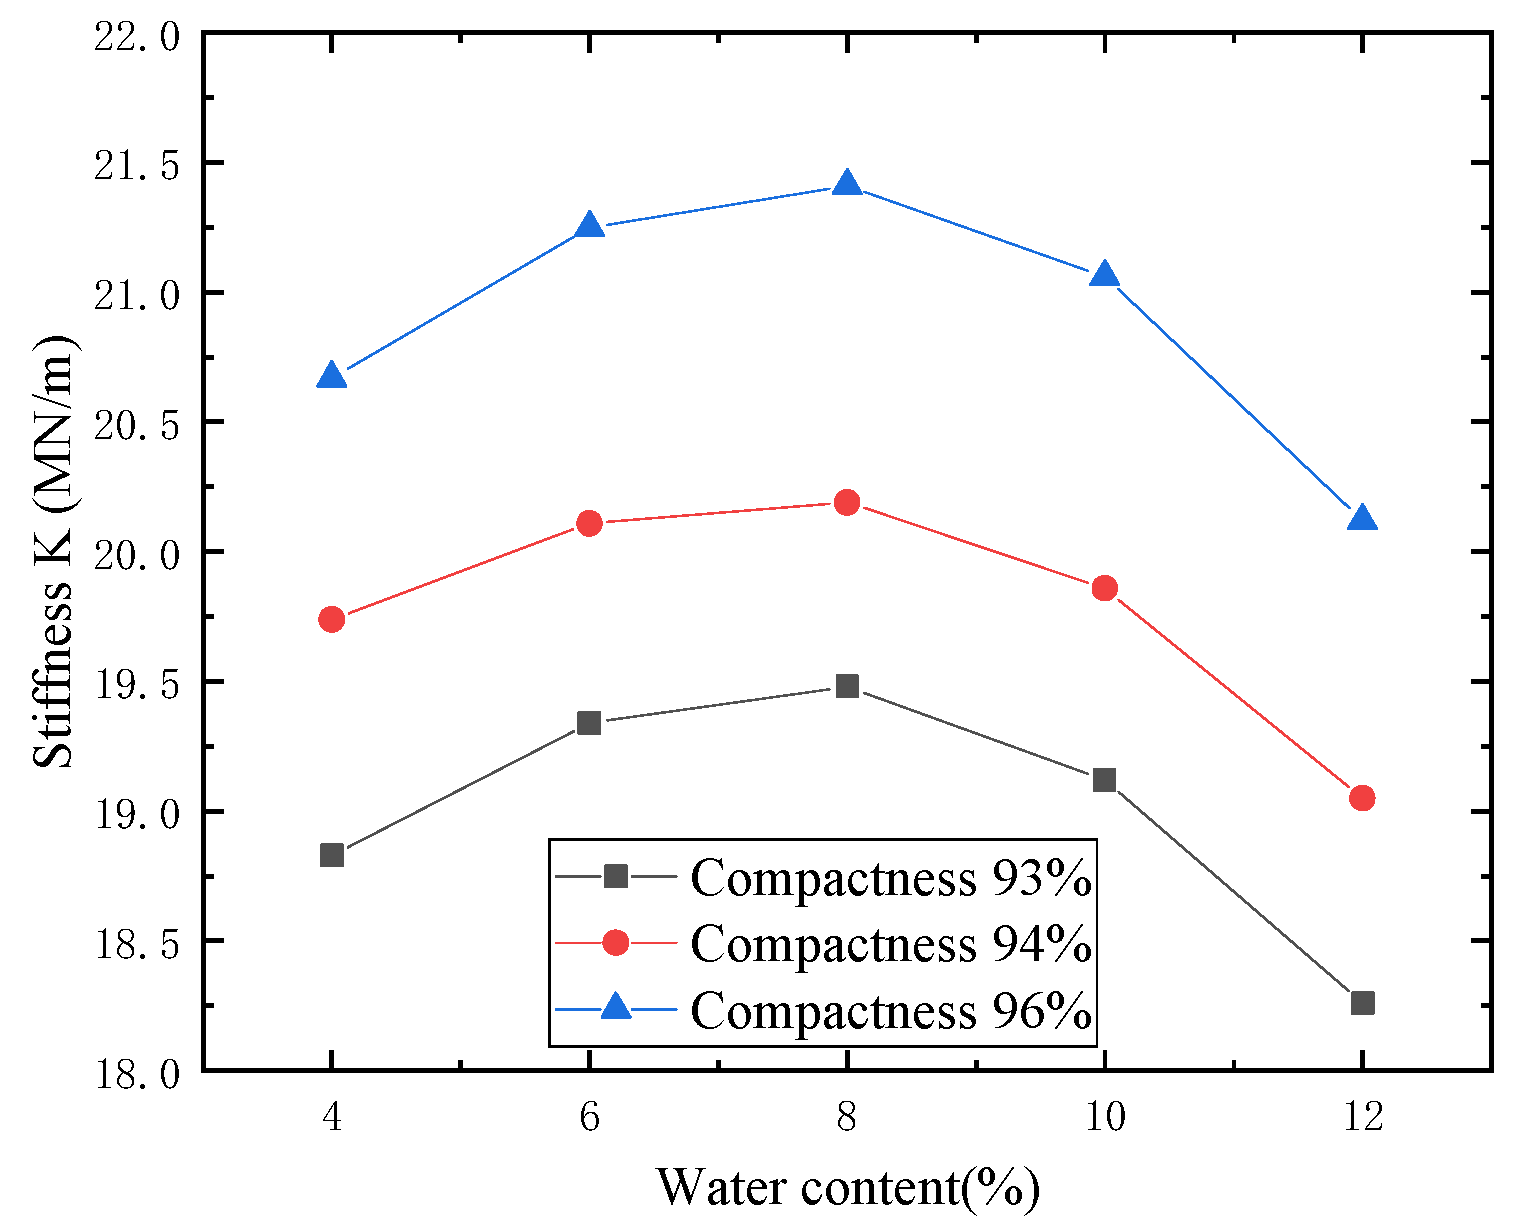
3.2.1. Influence of Water Content on Test Results

In order to avoid an accidental test, the test was carried out under 93%, 94%, and 96% compaction conditions, respectively. The test results are shown in Figure 4. It can be seen that:
(1)
When the degree of compaction is constant, the stiffness value of soil-rock mixture increases first and then decreases with the increase of water content. When the water content is lower than 8%, the stiffness curve under the influence of water content changes slightly, which indicates that the water content has little influence on the rigidity of compacted soil-rock mixture within this range. When the water content is higher than 8%, the variation amplitude of the stiffness curve increases, which indicates that when the water content is higher, the stiffness of the compacted soil-rock mixture is greatly affected.
(2)
The quadratic polynomial was used to fit the test results. When the compactness is 93%, the moisture content corresponding to the maximum rigidity of the soil-rock mixture is 8.0%. When the compactness is 94%, the water content corresponding to the maximum rigidity is 7.7%. When the compactness is 96%, the water content corresponding to the maximum rigidity is 8.0%. The above results show that the maximum stiffness of the soil-rock mixture is near the optimum moisture content.
(3)
When the water content of the soil is fixed, the stiffness value of the soil increases with the increase of the compactness. Under the optimum moisture content, the stiffness of the soil with a compactness of 94% is 3.6% higher than that with a compactness of 93%. The rigidity of soil with compactness of 96% is 9.9% higher than that with compactness of 93%.

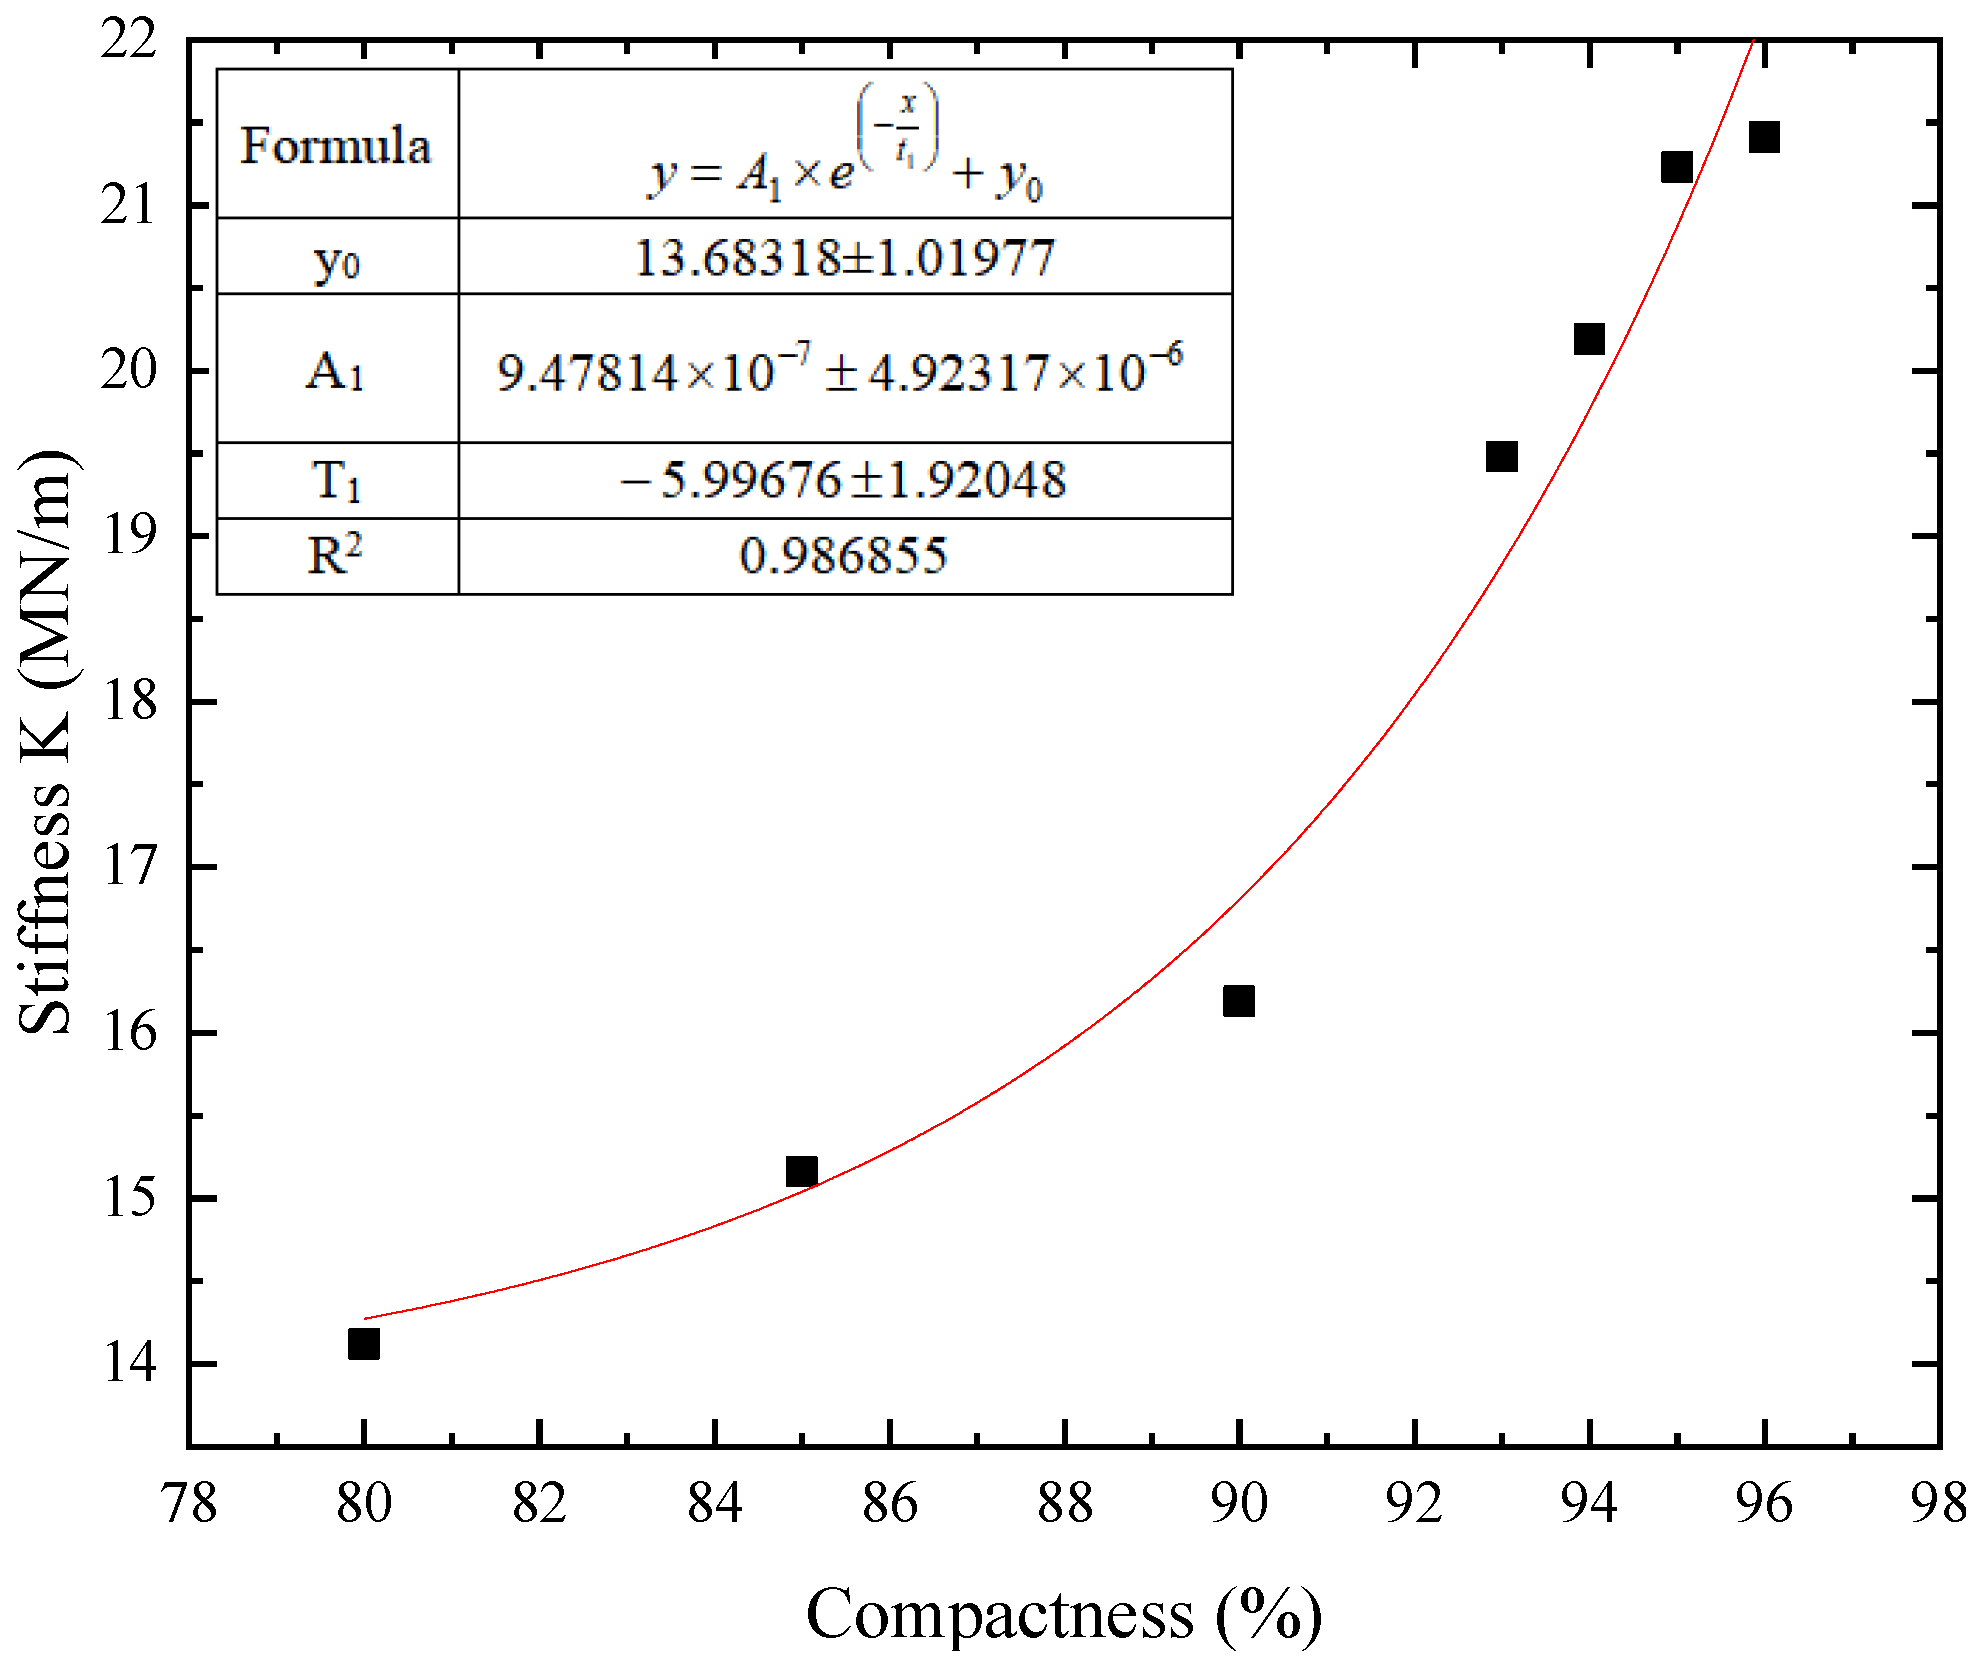
3.2.2. Influence of Compactness on Test Results
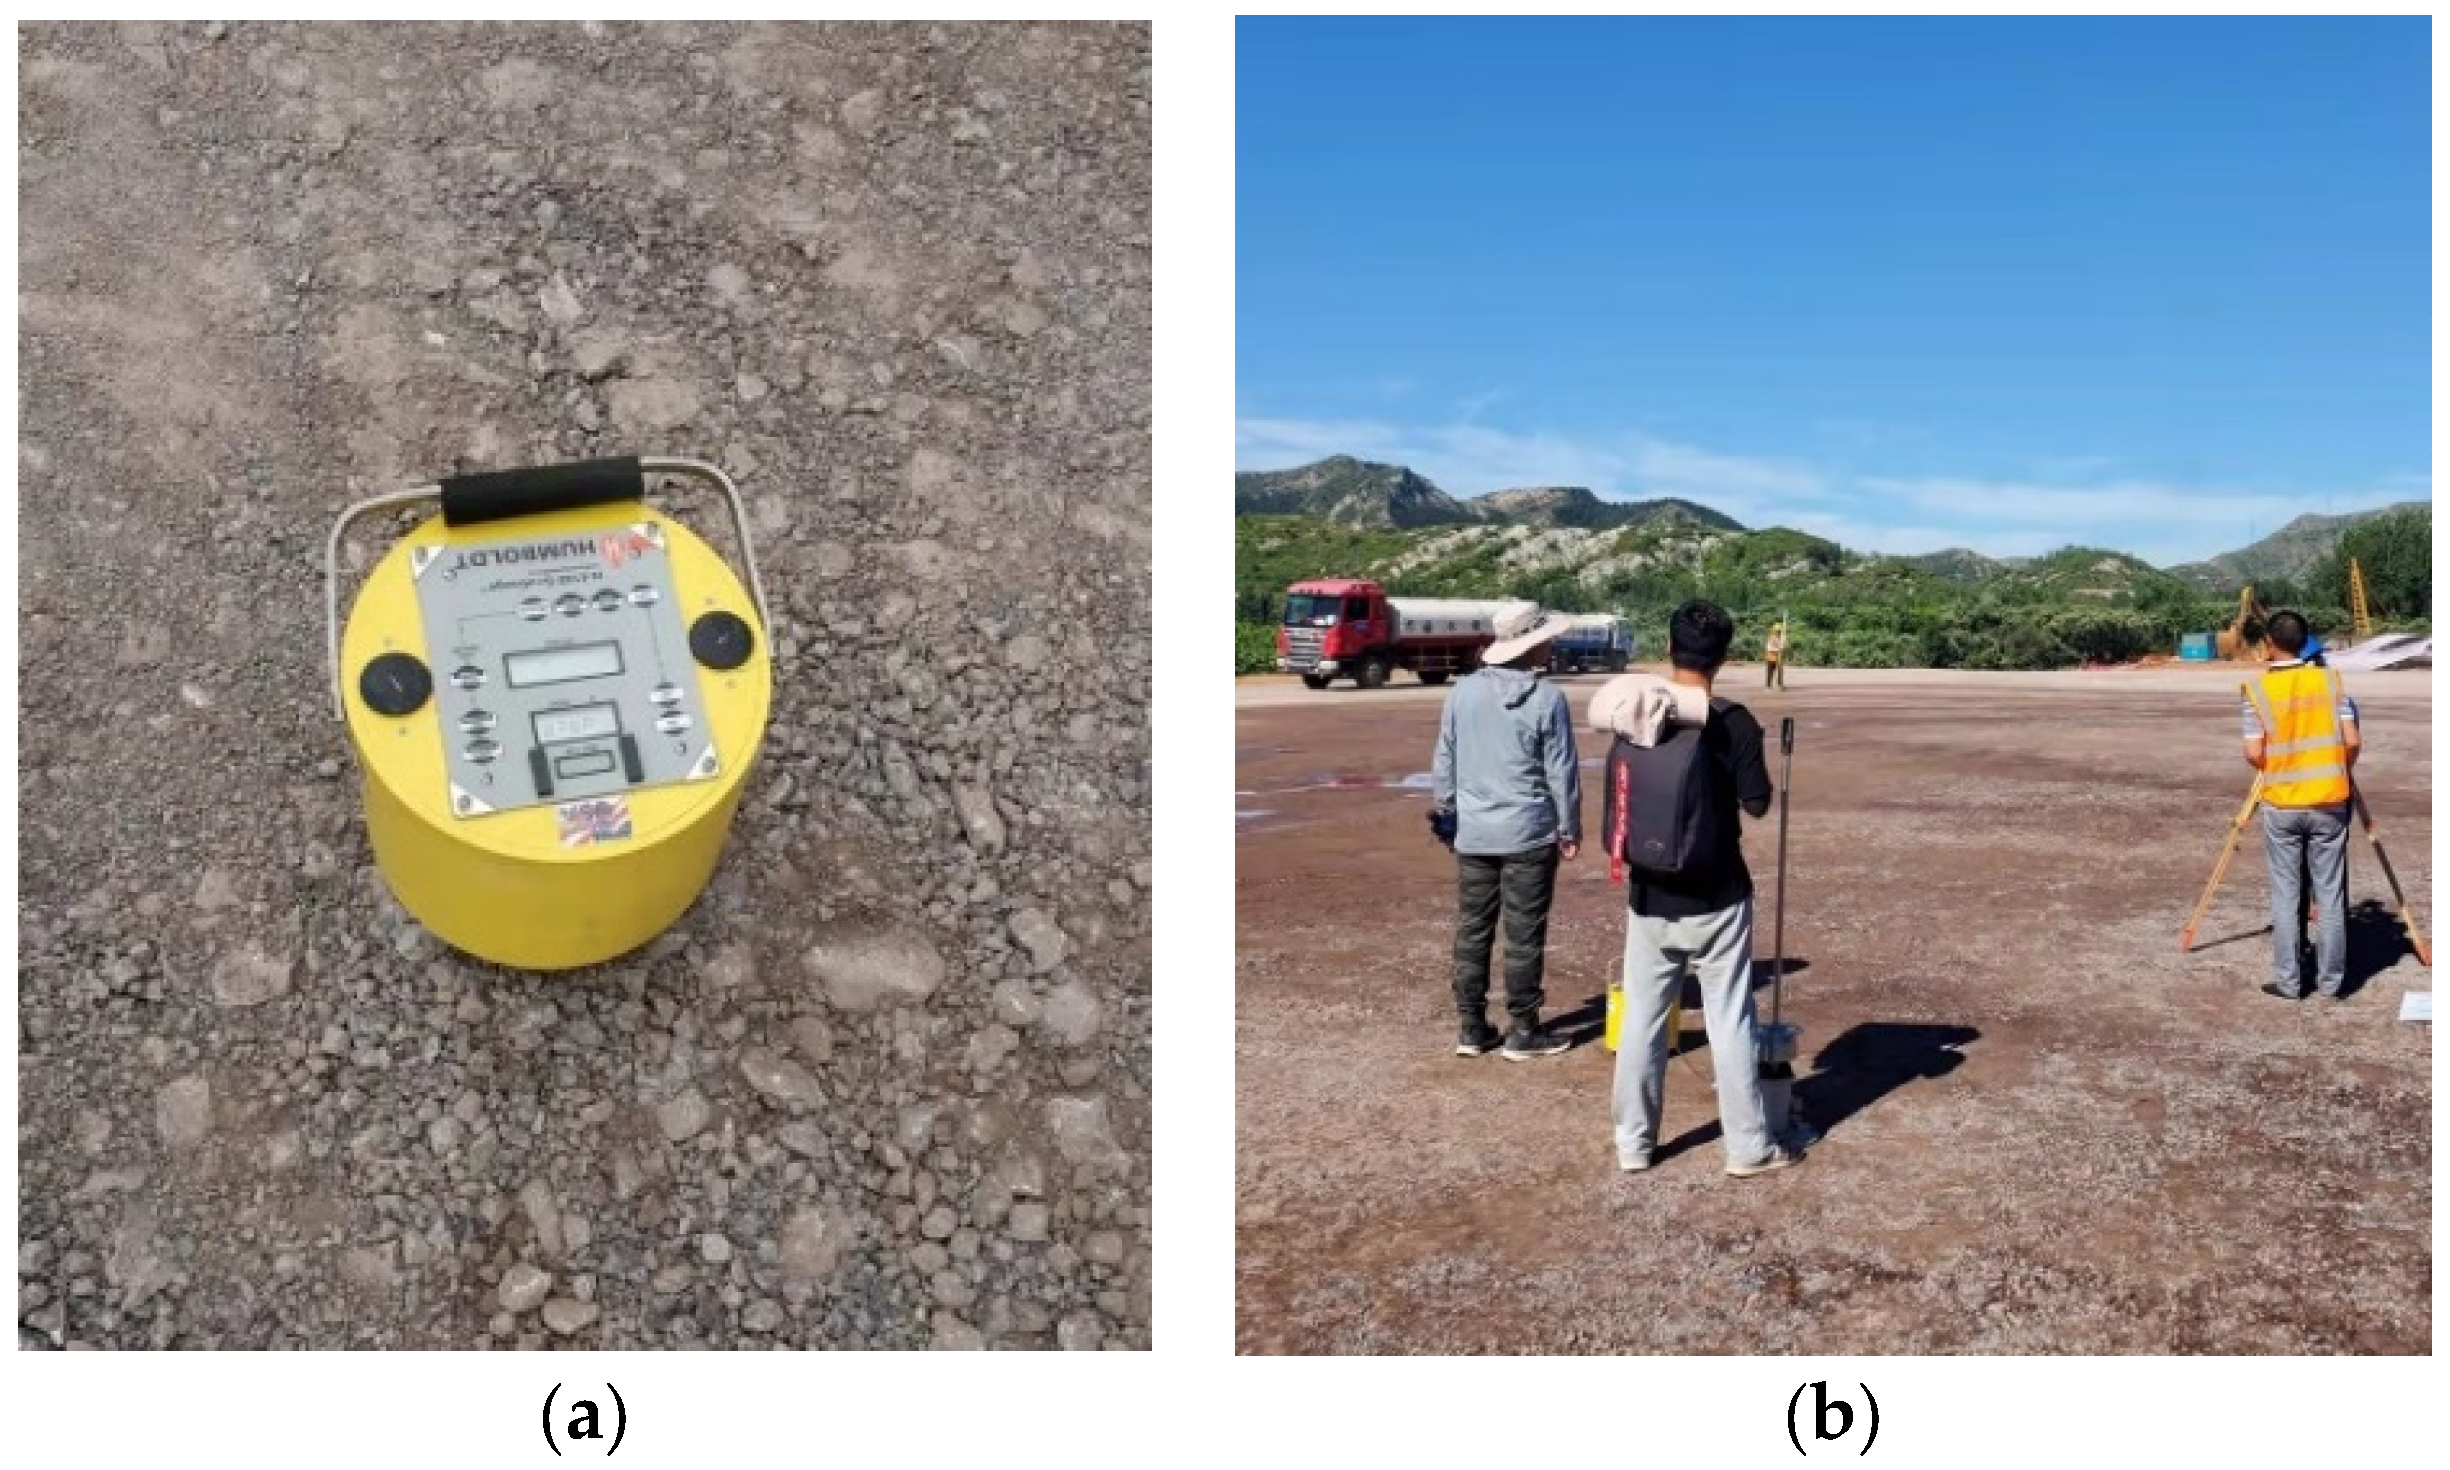
In order to analyze the influence of compaction degree on GeoGauge test results, the soil-rock mixture under the optimal moisture content condition was put into the model cylinder and compacted in layers. After each layer is compacted, the soil height is measured, and the compaction degree of the filler is calculated according to the mass and volume of the soil-rock mixed filler, and then GeoGauge is used to detect the center position of the model bucket. Figure 5 shows the corresponding stiffness values of earth-rock mixture under different levels of compactness.
As shown in the figure, the GeoGauge detection stiffness value increases with the increase of the compactness of the soil-rock mixture, and there is a good exponential relationship between the compactness of the soil-rock mixture and the GeoGauge detection stiffness value. The correlation coefficient is 0.96855. It can be seen that the regression equation has a high degree of fitting, indicating that the GeoGauge test results have high stability and small dispersion. It shows that it is feasible to use GeoGauge to detect the compactness of soil-rock mixture subgrade.

4. Field Test

4.1. Field Test General Introduction

The field test section of the Beijing-Qinhuangdao Expressway is located at the K27 + 860~K28 + 000 section. The subgrade filling in the test section is earth-rock mixture. The settlement difference detection method and GeoGauge detection method are used to control the compaction quality of subgrade during site construction. Starting from K27 + 860 section, one test section is set every 10 m, and five test points are set for each section, and each test point is uniformly numbered. A total of 20 detection points were set up in the test section. The 36t vibratory roller is used for rolling. The elevation value of the inspection point is recorded every time, and then the stiffness of the point is measured with GeoGauge, and the data are collected throughout the construction process. The on-site detection is shown in Figure 6.

4.2. Analysis of Test Results

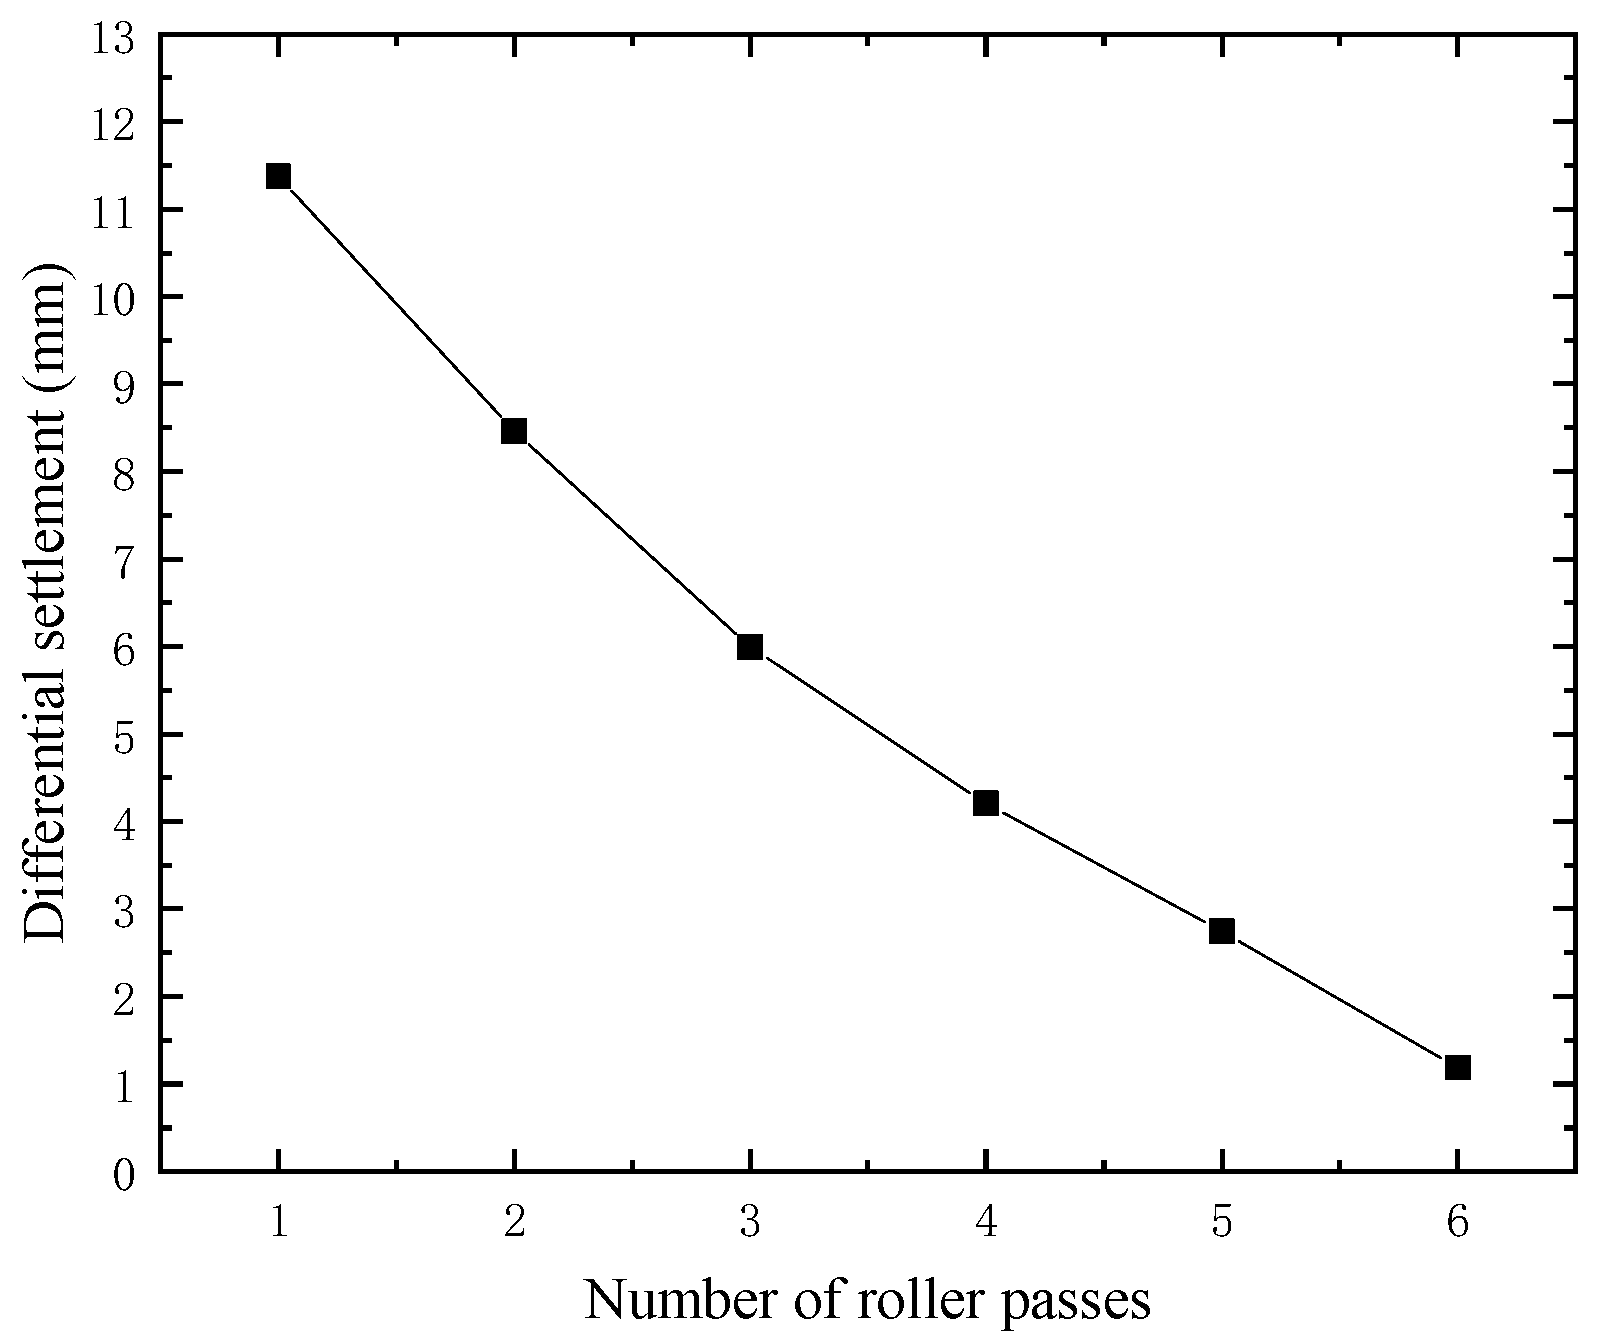
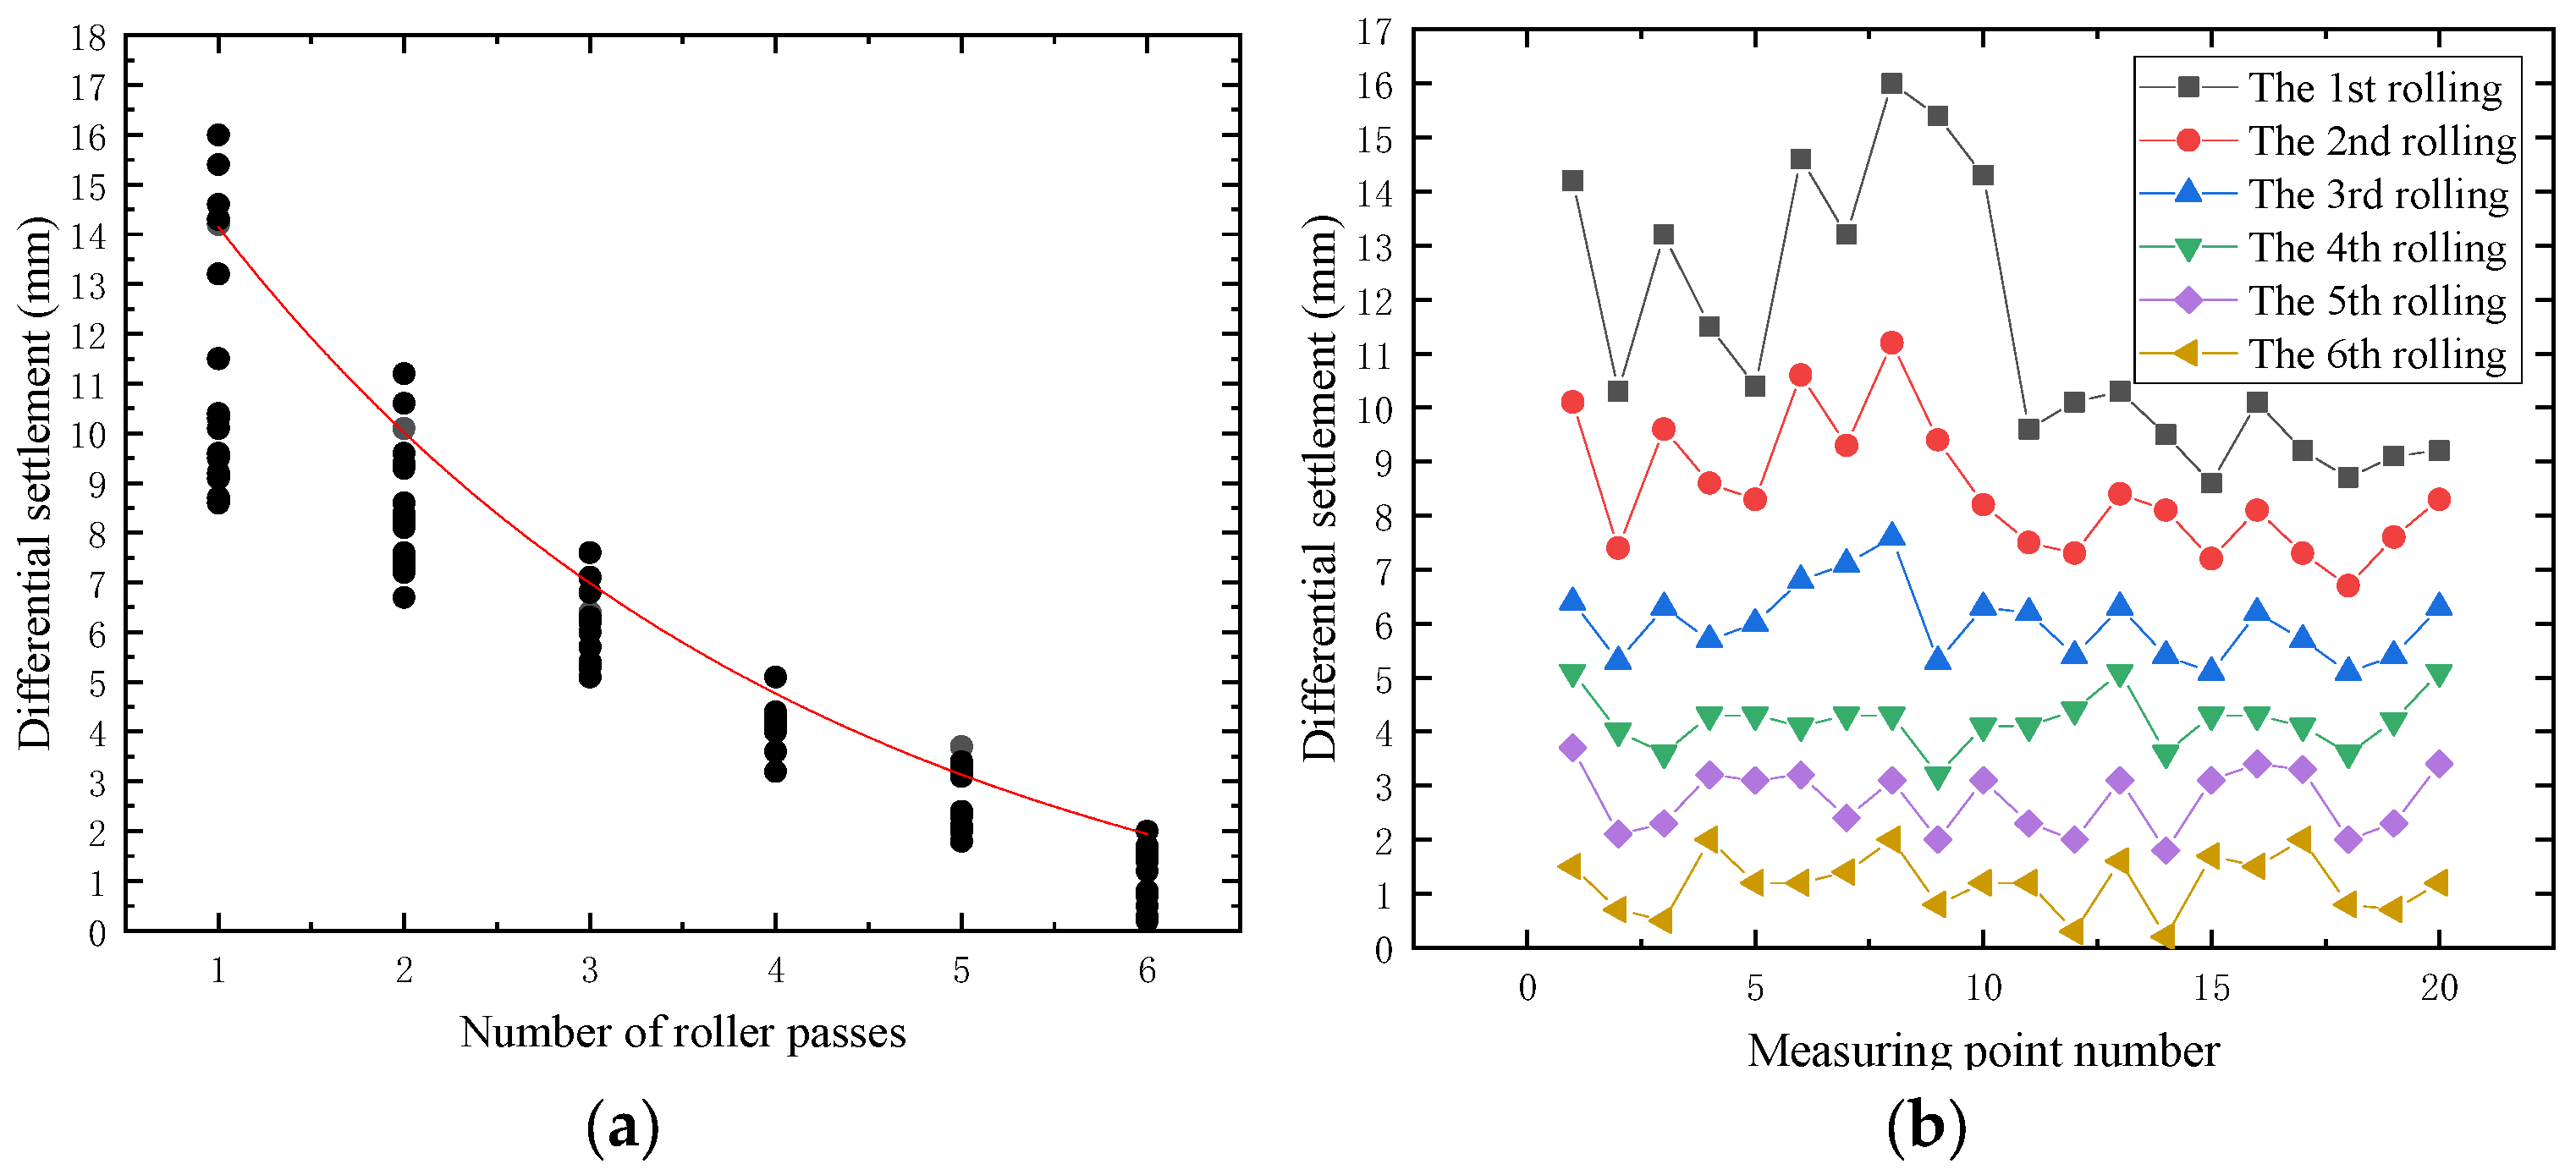
4.2.1. Relationship between Settlement Difference and Rolling Repetitions

Figure 7 is the relationship between the number of rolling passes and the average settlement difference of each measuring point. It can be seen that with the increase of rolling repetitions, the average settlement difference of measuring points gradually decreases, and the decrease rate of settlement difference gradually decreases with the increase of rolling variable. It shows that the settlement difference changes greatly in the previous rolling process. After 4–5 rolling passes, the compaction degree of subgrade soil is relatively large, and the change range of settlement difference decreases. The main reason is that after a certain number of passes of rolling, the soil particles are compacted with each other, and the space for soil particles to reassemble is small. When the soil reaches a certain degree of compaction, the ability of subgrade soil to resist deformation gradually increases, resulting in a gradual reduction of settlement difference.
In order to more accurately reflect the change rule of rolling repetitions and settlement difference, Figure 8 shows the change trend of settlement difference of each detection point with the increase of rolling repetitions. It can be seen from the diagram that the settlement difference decreases with the increase of the number of rolling passes, and the dispersion of the settlement difference of each observation point gradually decreases. It shows that with the increase of rolling repetitions, the compactness of subgrade soil is improved, the variability of subgrade construction is reduced, and the uniformity of subgrade compaction is improved.

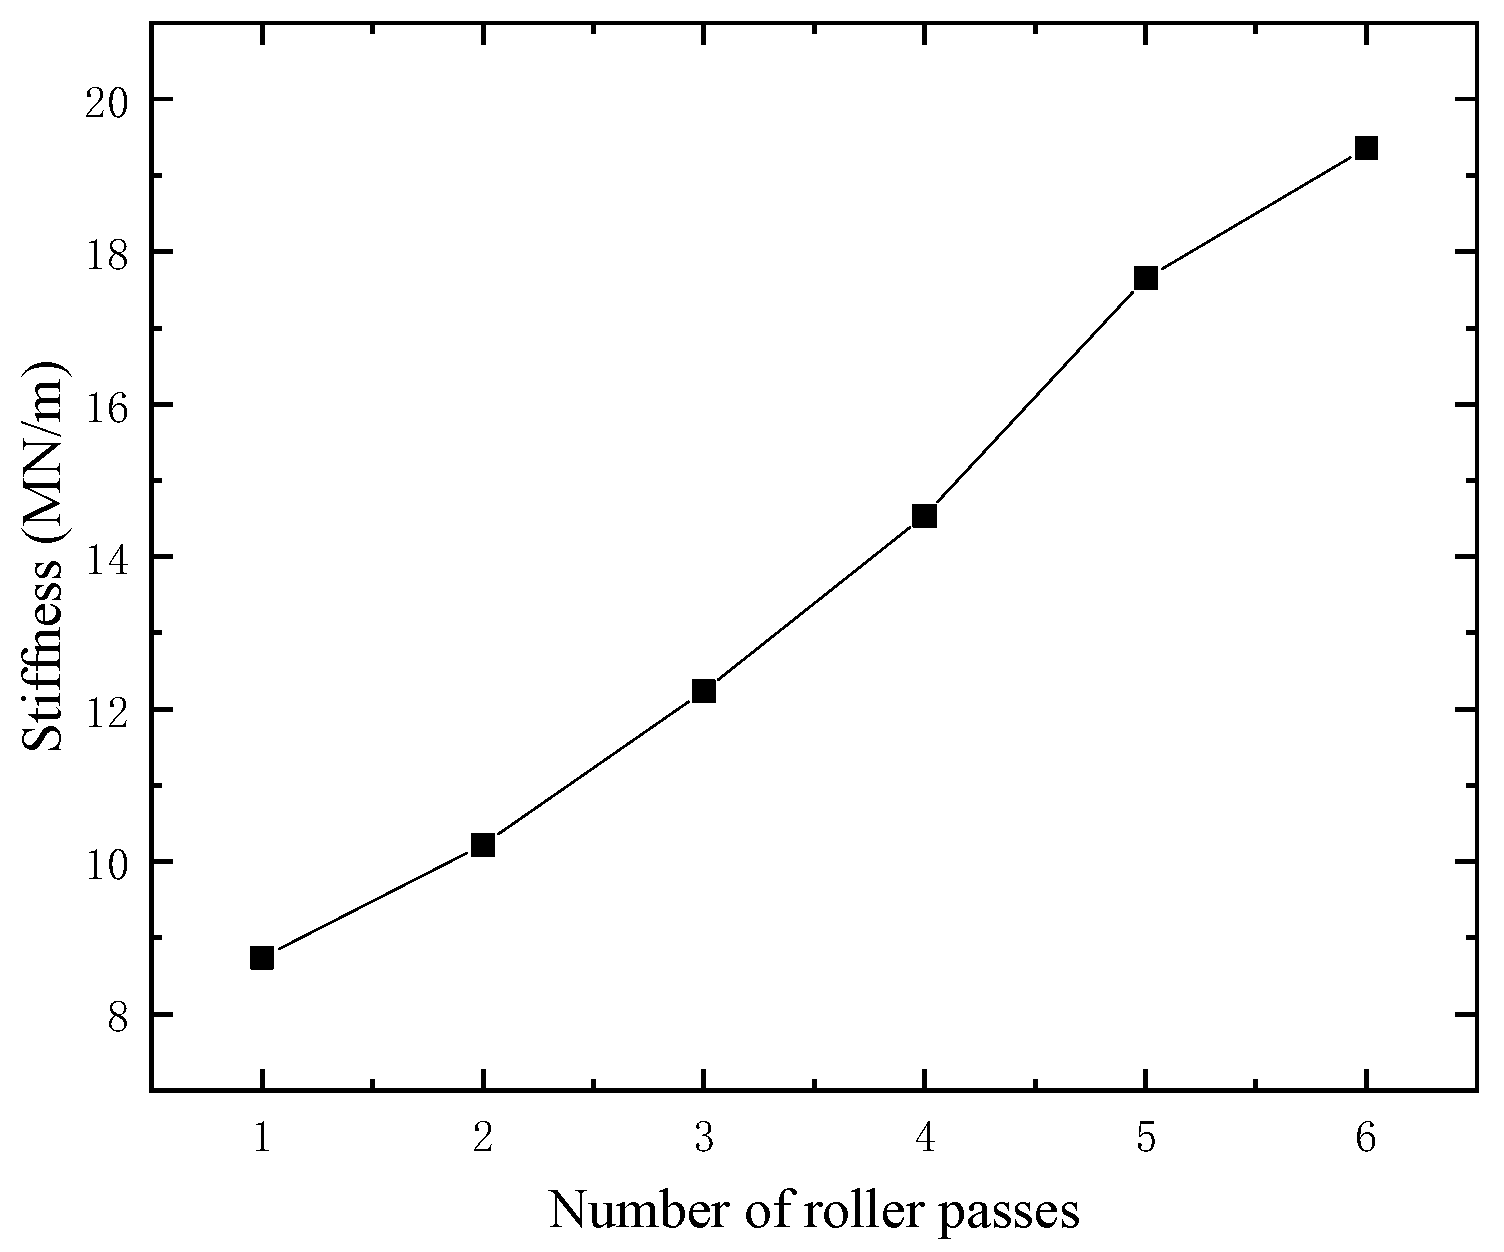
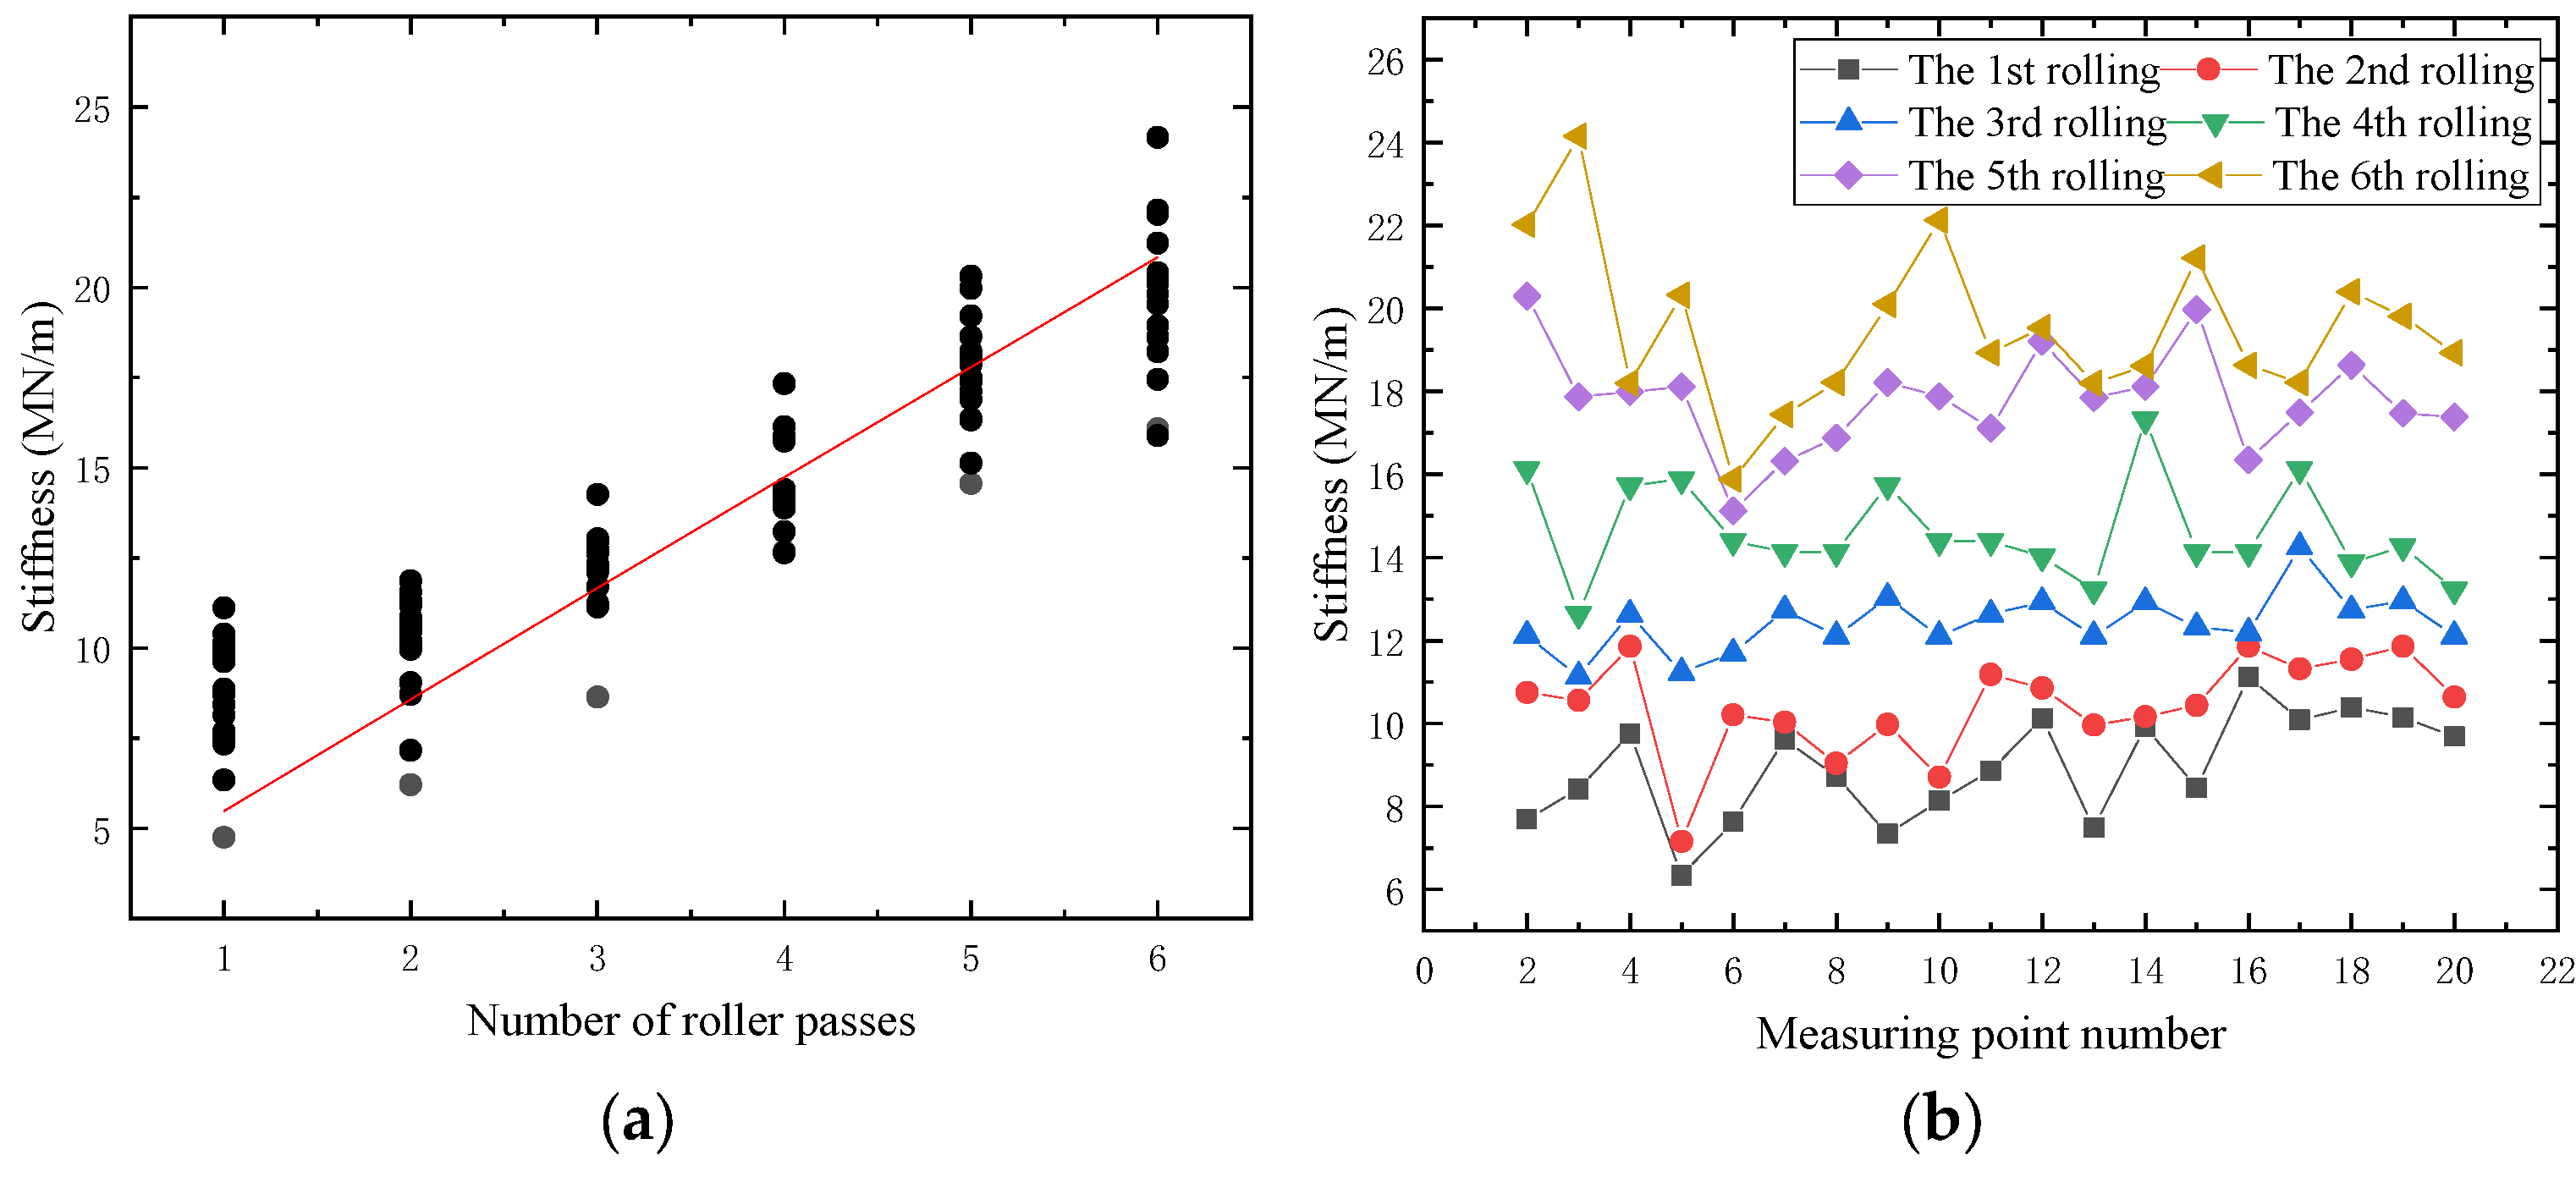
4.2.2. Relationship between Stiffness and Rolling Times

By comparing and analyzing the stiffness values and their changing trends between different rolling passes, the compaction quality of subgrade is evaluated. Figure 9 shows the variation rule of rolling variables and average stiffness of each section inspection point. It can be seen that with the increase of rolling times, the average stiffness of each section detection point gradually increases, which is opposite to the change rule of settlement difference (as shown in Figure 8). Compared with the first rolling, the average stiffness of the subgrade after the second rolling is increased by 16.9%. Compared with the second rolling, the average stiffness of the subgrade increased by 19.7% after the third rolling. Compared with the third rolling, the average stiffness of the subgrade after the fourth rolling is increased by 18.8%. Compared with the fourth rolling, the average stiffness of the subgrade increased by 21.4% after the fifth rolling. Compared with the fifth rolling, the average stiffness of the subgrade increased by 9.7% after the sixth rolling. It can be seen that when the number of rolling passes is small (less than 5), the growth rate of subgrade soil compaction stiffness is large, while the growth rate of subgrade stiffness decreases during the sixth rolling. It shows that the subgrade filler has been close to the compaction standard after 5 repetitions of rolling, and the compaction degree will not be improved after the second rolling. This is consistent with the result of differential settlement method.
In order to more accurately reflect the change rule of rolling times and compaction stiffness, Figure 10 shows the change trend of the stiffness value of each test point with the increase of rolling repetitions. Compared with the settlement difference detection results of each observation point (as shown in Figure 8a), the stiffness values detected by GeoGauge have certain discreteness. The main reason is that due to the inhomogeneity of the embankment filler, the sensitivity and accuracy of GeoGauge are high, and the change of the relative position between the filler particles will cause the deviation of the test results.

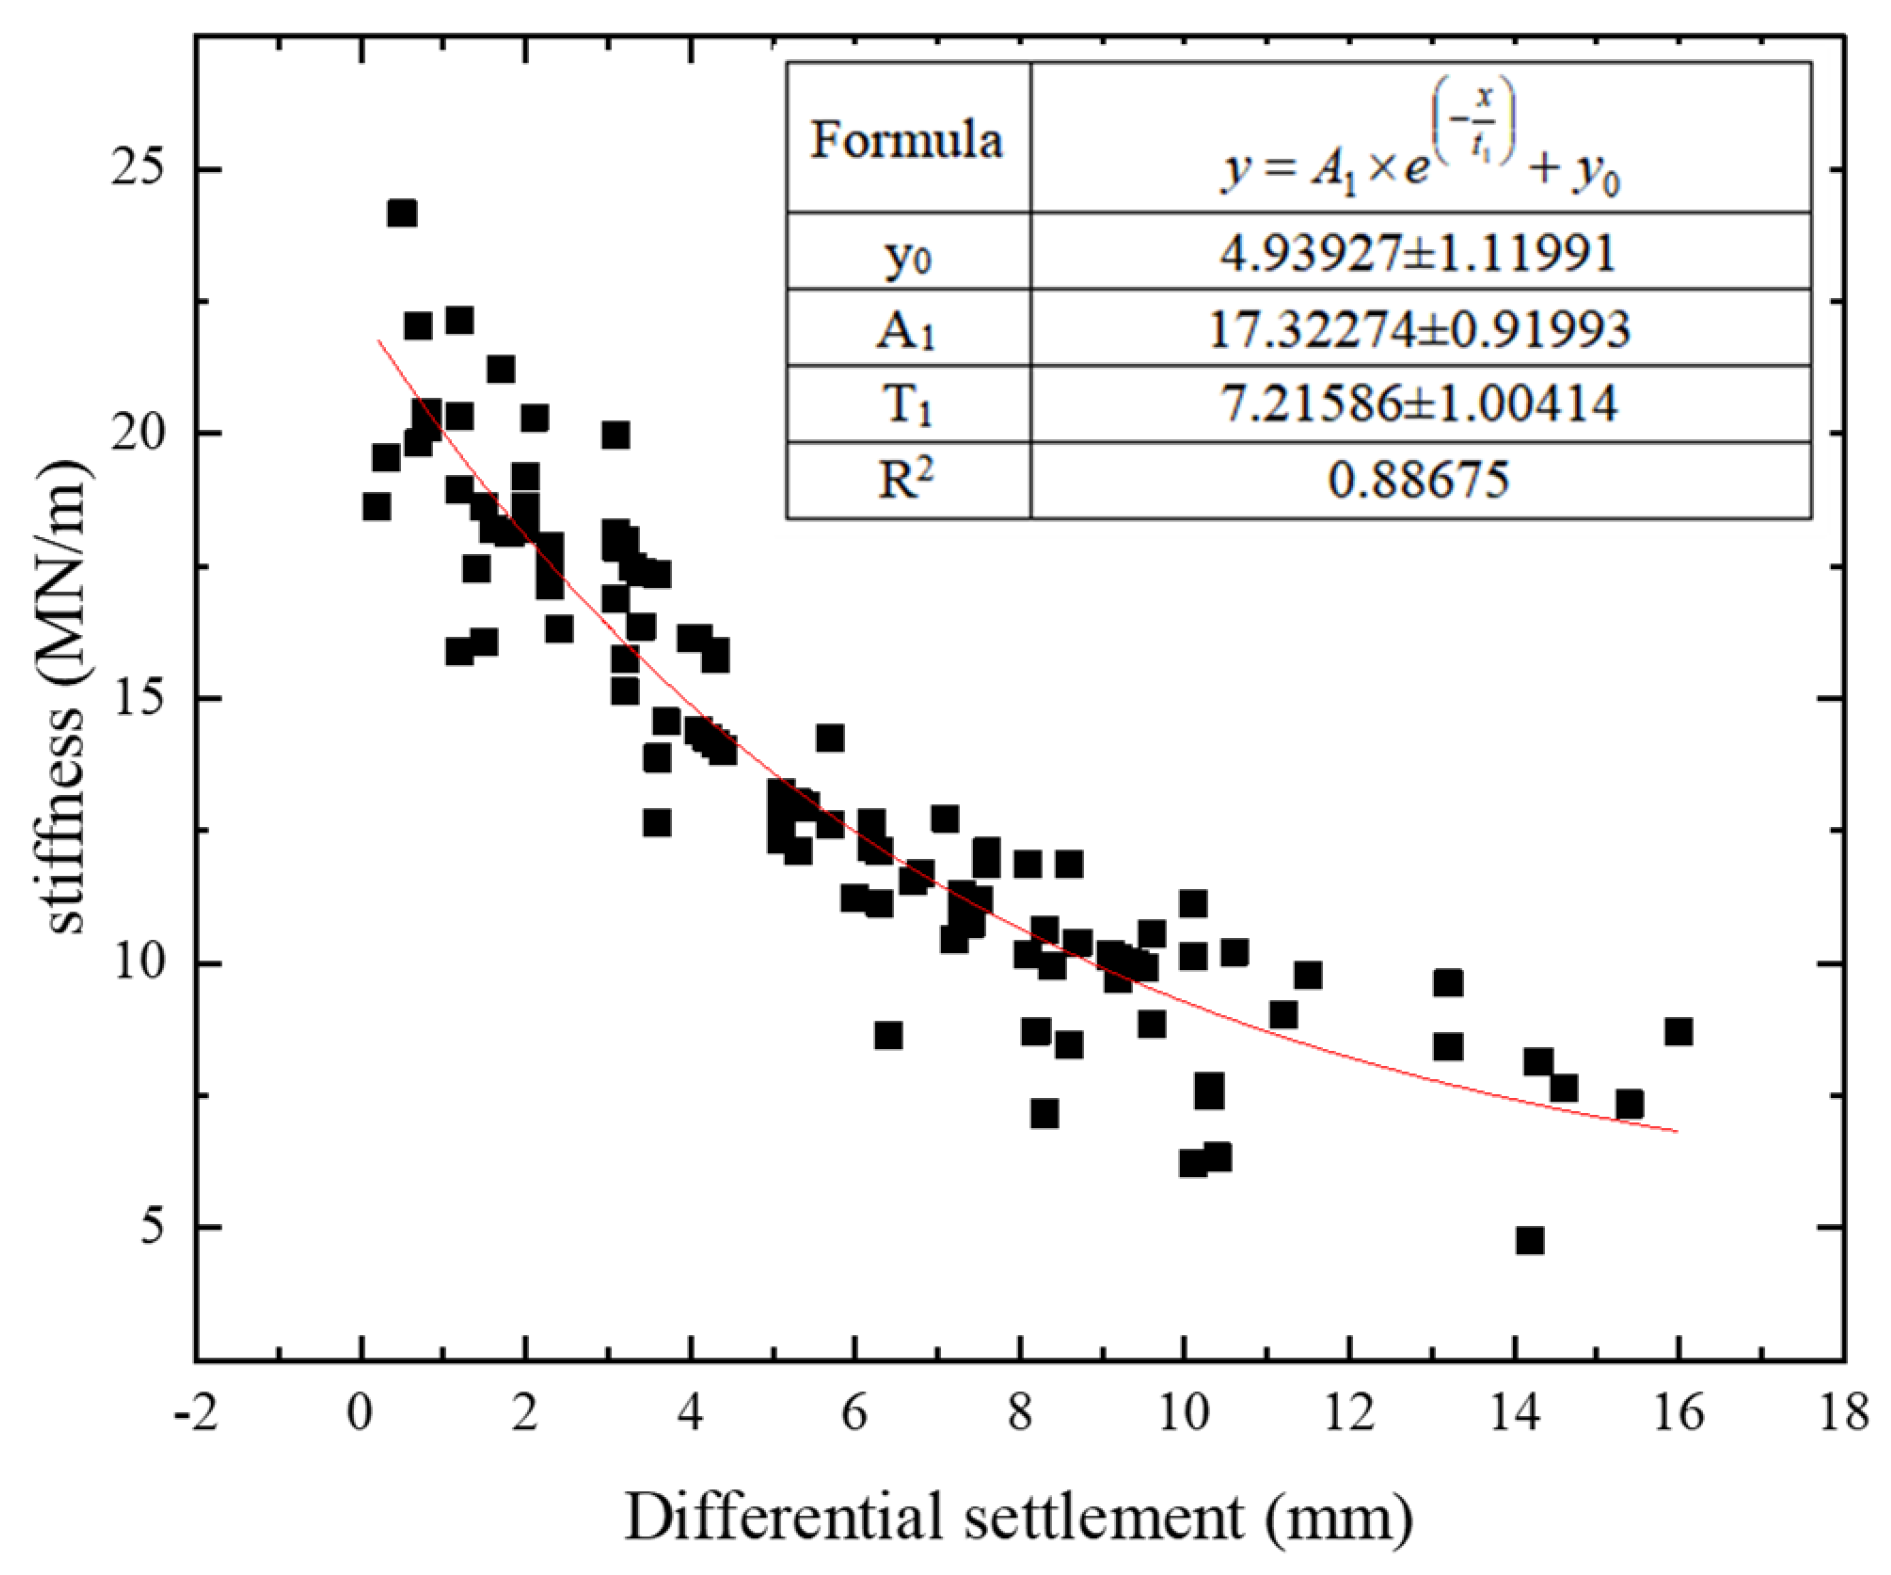
4.2.3. Relationship between Stiffness and Settlement Difference

In order to analyze the relationship between GeoGauge soil stiffness instrument and settlement observation method, the correlation between the two methods was studied. Carry out regression analysis on the point-to-point test results in the above compaction process, and the analysis results are shown in Figure 11. It can be seen from the figure that there is a good exponential relationship between the GeoGauge detection stiffness value and the settlement difference, and the correlation coefficient is 0.88675. The current specification only introduces the detection method of settlement difference of stone subgrade and soil-rock mixed subgrade, and does not give the specific index of foundation stiffness detection [23]. According to the site construction experience, the compaction control index of settlement difference of soil-rock fill subgrade is generally between 2 mm and 5 mm. According to the regression equation, the stiffness value corresponding to the settlement difference of the soil-rock mixture subgrade during the rolling process of the 36t vibratory roller can be obtained. The results are shown in Table 2.

5. Analysis of Subgrade Compaction Uniformity Based on Ordinary Kriging Method

In the process of expressway construction, due to the large variability in the spatial distribution of construction technology and subgrade fillers, the evaluation of subgrade compaction uniformity has always been a major problem in the inspection and control of subgrade compaction quality. Due to the limited number of test points in the test section and the uneven distribution of subgrade compaction test data, this section uses the Kriging interpolation method to evaluate the uniformity of subgrade.

5.1. Ordinary Kriging Interpolation

The Kriging interpolation method is based on spatial statistics. The semivariogram is used to calculate the spatial relationship between data points, which not only considers the spatial distance relationship between the predicted point and the adjacent sampling point, but also considers its position relationship. This method is based on the theoretical analysis of regionalized variables, and uses the semivariogram as a tool to make a linear unbiased optimal estimation of the value of regionalized variables in a limited area. The ordinary Kriging method is a local linear optimal unbiased estimation method for a single variable. Assume that Z ( x ) is a random process that satisfies the intrinsic assumption, and the random process has n observation values Z ( x i ) ( i = 1 , 2 , , n ) . To predict the value at the unsampled point x 0 , the linear Z * ( x 0 ) prediction model is:
Z * ( x 0 ) = i = 1 n λ i z ( x i )

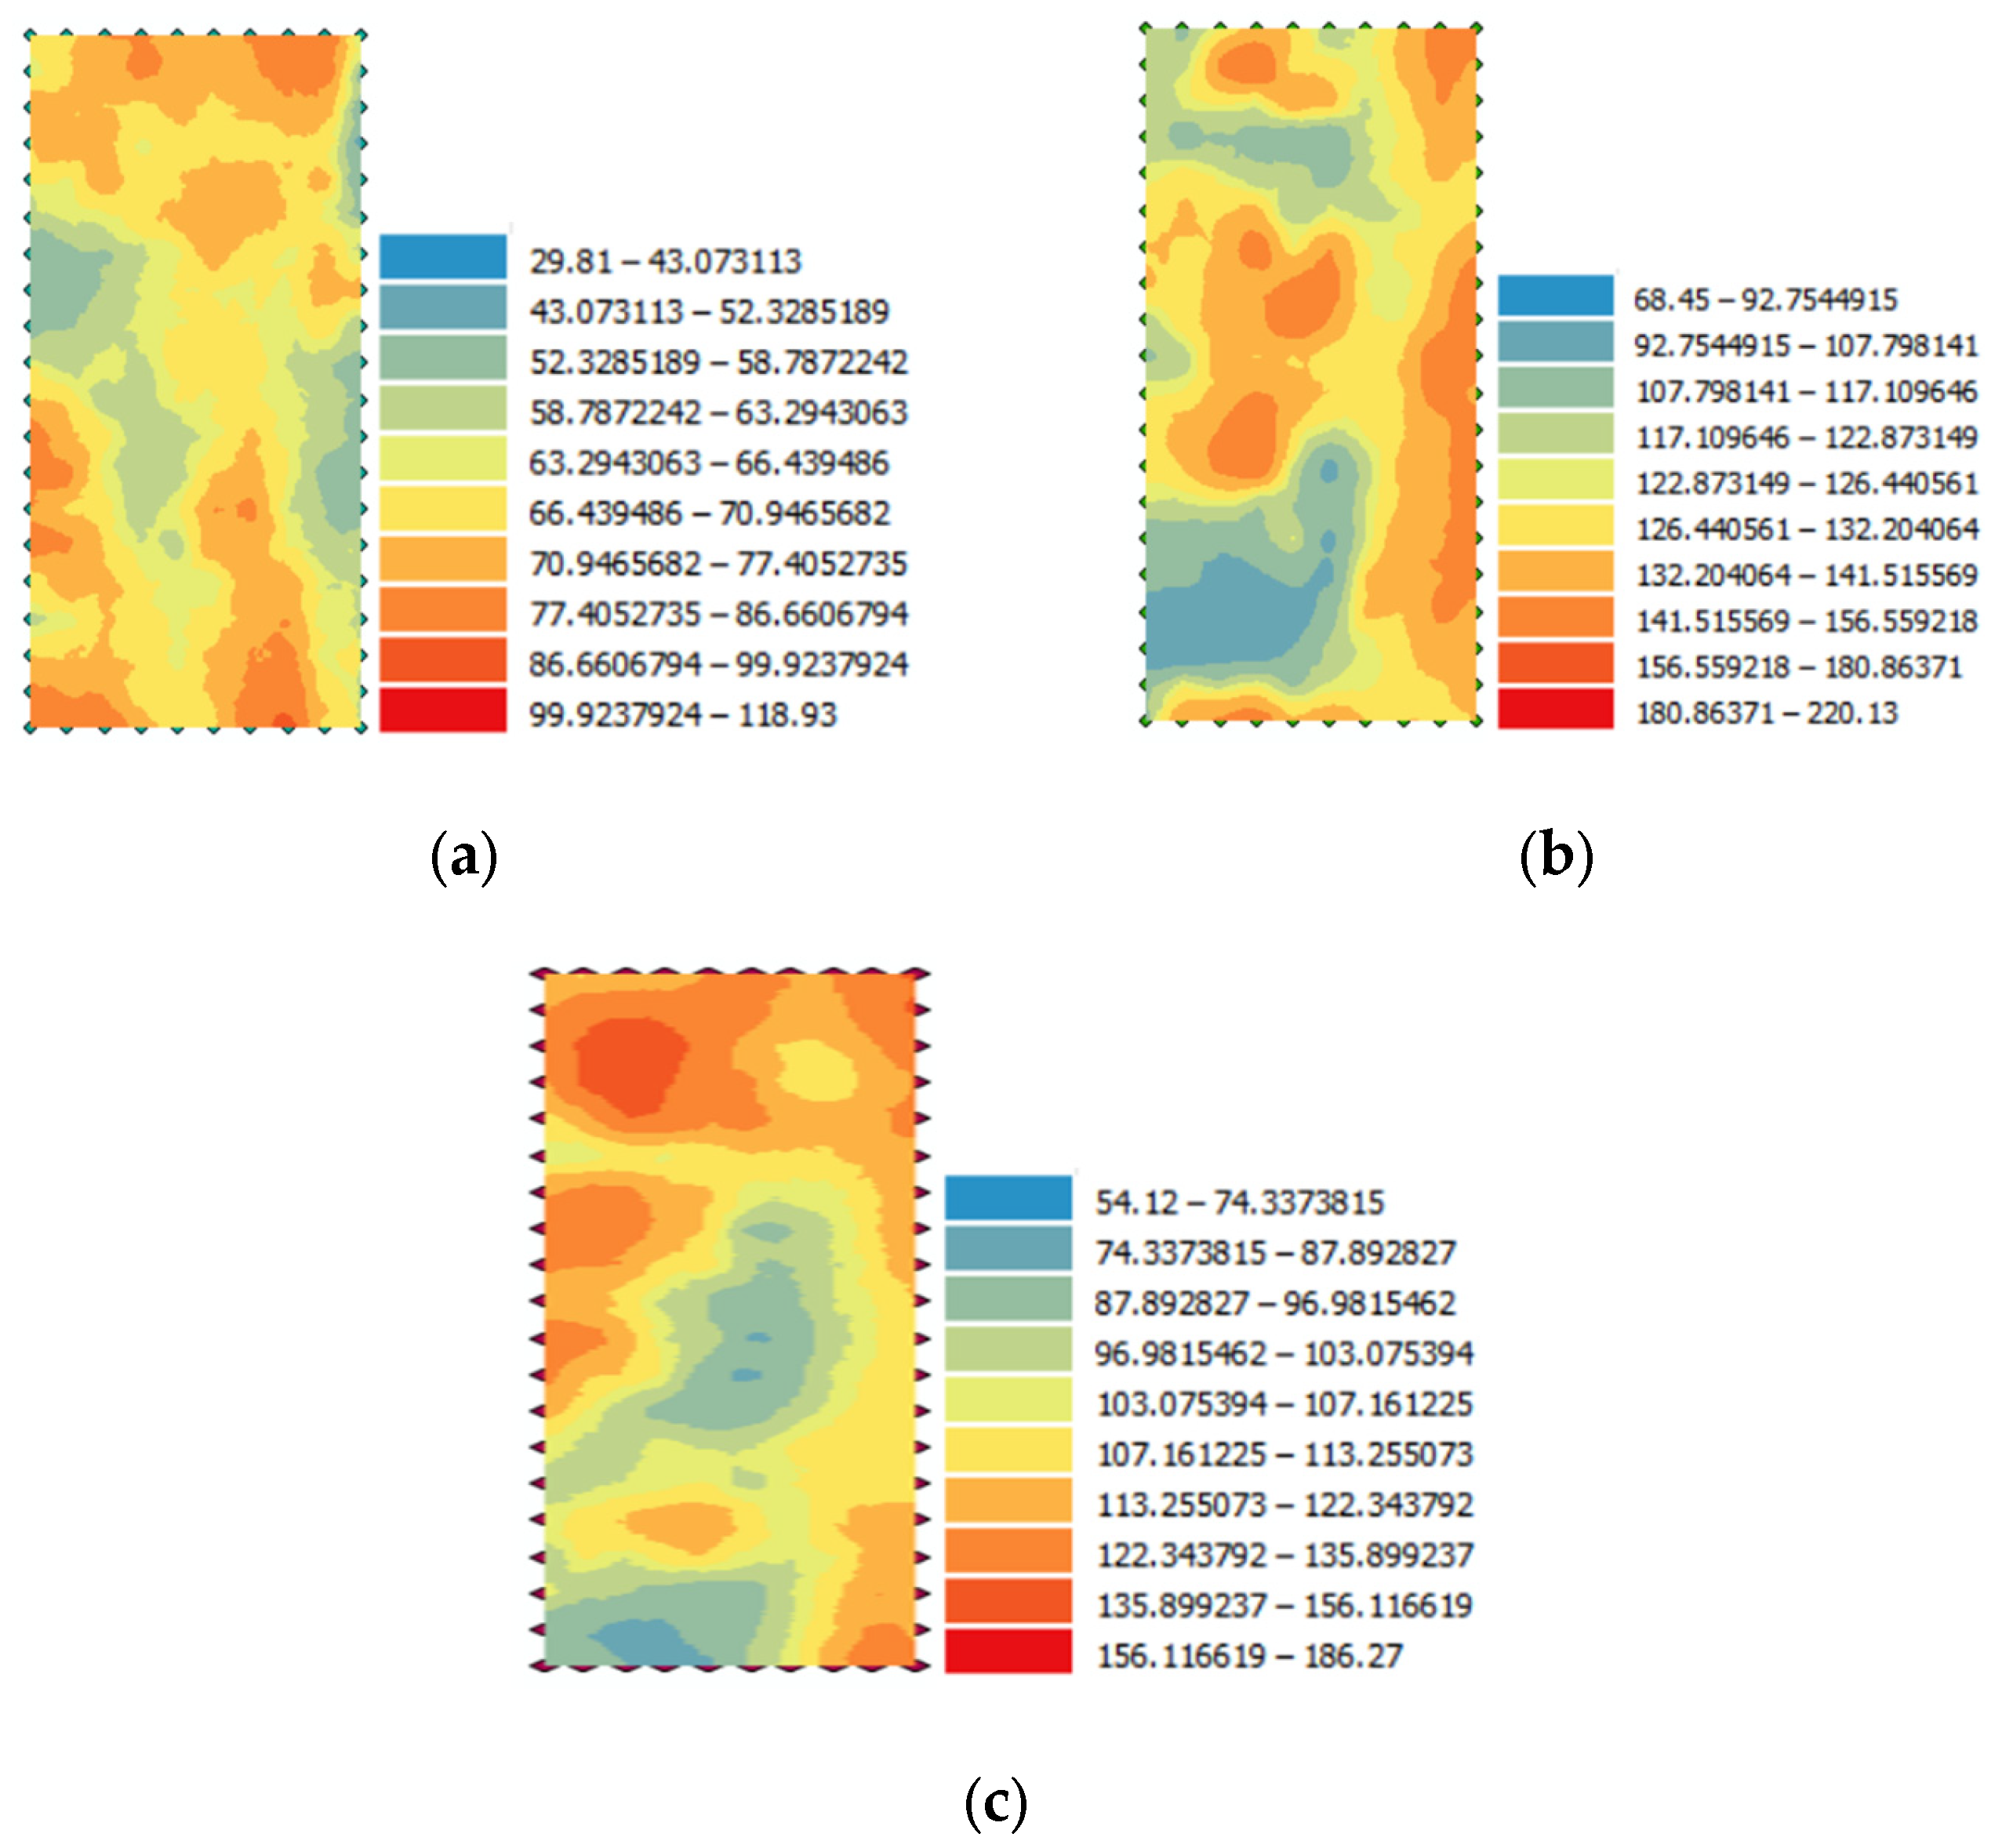
5.2. Analysis of Interpolation Prediction Results

The field test data were visualized through ArcGIS geostatistical analysis software, and the interpolation results were mapped to obtain the spatial interpolation distribution images of Young’s modulus of different subgrade sections, as shown in Figure 12. The subgrade compaction quality meets the specification requirements (compaction degree is greater than 90%). It can be seen that the prediction result of ordinary Kriging interpolation is relatively smooth, and the extreme value of the detection index only appears at the sampling point, However, there are many isolated abnormal spots on the edges of both sides of the test section, which are different from the actual detection values, and the predicted values at different positions are quite different. The main reason is that the subgrade filling, rolling parameters, and rolling surface at different detection locations are different, so the predicted value changes greatly. However, in general, the results of ordinary Kriging interpolation have a good transition, which can reflect the spatial variation trend of subgrade compaction quality. The above analysis shows that even if measures are taken to ensure the consistency of rolling parameters according to the specification requirements, the change of compaction quality parameters still has a certain impact on the predicted value, and the Kriging interpolation method can be used to predict the continuous change of the actual compaction degree.

6. Conclusions

Based on the field test of the Beijing-Qinhuangdao Expressway, this paper adopts the research method of combining an indoor model test and field test. The influence of water content and compaction degree on compaction stiffness is analyzed, and the correlation between GeoGauge detection stiffness and settlement difference is analyzed. Finally, the compaction quality uniformity is evaluated according to the ordinary Kriging method. The results show that:
(1)
When the degree of compaction is constant, the stiffness value of soil-rock mixture increases first and then decreases with the increase of water content. The compaction stiffness is the largest near the optimal water content. When the water content of soil is lower than the optimum water content, the change of water content has a relatively small impact on the stiffness of the filler. When the soil moisture content is greater than the optimum moisture content, the change of moisture content has a relatively large impact on the stiffness of the filler.
(2)
The GeoGauge detection stiffness value increases with the increase of the compactness of the soil-rock mixture, and there is a good exponential relationship between the compactness of the soil-rock mixture and the GeoGauge detection stiffness value. The correlation coefficient is 0.96855. It can be seen that the regression equation has a high degree of fitting, indicating that the GeoGauge test results have high stability and small dispersion.
(3)
In the field test, with the increase of the number of rolling passes, the settlement difference of the foundation decreases gradually, and the compaction stiffness value increases gradually. At the same time, the compaction uniformity of the subgrade has also been improved.
(4)
There is a good exponential relationship between the GeoGauge detection stiffness value and the settlement difference, which indicates that the GeoGauge detection method is feasible for the compaction quality detection of soil-rock mixed subgrade. According to the regression equation, the specific index of subgrade stiffness when the compactness meets the design conditions is calculated, which provides a reference for the practical engineering.
(5)
The subgrade compaction uniformity is evaluated according to the measured data of the detection indicators in the study area and the predicted value obtained by the ordinary Kriging interpolation method. The results show that Kriging interpolation prediction has good accuracy and can better evaluate the compaction uniformity of subgrade.
In summary, this paper studies the application of the GeoGauge detection method in soil-rock mixed subgrade through a model test and field test. The test results show that the GeoGauge detection method can accurately measure the compaction quality of the subgrade, and the GeoGauge detection results have a good regression relationship with the settlement difference detection results. Because the GeoGauge detection technology is rarely used in China, there is no clear evaluation index in the current specification. Therefore, the evaluation index of subgrade stiffness calculated according to the regression equation in this paper has a certain guiding significance for the actual project. However, due to the limitation of the test conditions, only the stiffness of the soil-rock fill subgrade is analyzed, and the research results have certain limitations. Therefore, the application of GeoGauge detection technology in this study’s geological conditions should be supplemented and analyzed in the follow-up work.

Author Contributions

Writing—original draft preparation, X.Z.; funding acquisition, G.Y.; writing—review & editing, X.W.; validation, H.C. All authors have read and agreed to the published version of the manuscript.

Funding

This research was funded by the Science and Technology Project of Hebei Provincial Department of Transportation (TH1-202017).

Data Availability Statement

The data used to support the findings of this study are available from the corresponding author upon request.

Conflicts of Interest

The authors declare no conflict of interest.

References

  1. Xu, C.; Li, T.; Li, X.; Yang, G. Compaction Uniformity Evaluation of Subgrade in Highway Based on Principal Components Analysis and Back Propagation Neural Networks. Sustainability 2023, 15, 1067. [Google Scholar] [CrossRef]
  2. Liu, W.; Zhou, H.; Wang, B.; Zhao, Y.; Leng, Z.; Chen, X.; Li, L.; Wang, S.; Chen, Z. A subgrade cracking monitoring sensor based on optical fiber sensing technique. Struct. Control Health Monit. 2018, 25, e2213. [Google Scholar] [CrossRef]
  3. Yu, H.; Wang, Y.; Zou, C.; Wang, P.; Yan, C. Study on subgrade settlement characteristics after widening project of highway built on weak foundation. Arab. J. Sci. Eng. 2017, 42, 3723–3732. [Google Scholar] [CrossRef]
  4. Mackiewicz, P.; Krawczyk, B. Influence of the Load and Time Conditions on the Results of the Static Plate Load Test. J. Test. Eval. 2020, 48, 2963–2980. [Google Scholar] [CrossRef]
  5. Krawczyk, B.; Mackiewicz, P. Impact of reinforcement layer material and thickness on deflections measured in the static and dynamic plate load tests. Roads Bridg.—Drog. I Mosty 2016, 15, 87–102. [Google Scholar]
  6. Krawczyk, B.; Mackiewicz, P.; Dobrucki, D. Use of plastic waste in materials for road pavement construction and improved subgrade. Roads Bridg.—Drog. I Mosty 2022, 21, 203–216. [Google Scholar]
  7. Yu, J.; Zhao, Y.; Liu, W.; Liu, Z.; Yang, G. Research on geogauge instrument for testing the quality of subgrade filling process. In Advances in Civil Engineering: Structural Seismic Resistance, Monitoring and Detection; CRC Press: Boca Raton, FL, USA, 2023; pp. 361–365. [Google Scholar]
  8. Maia, C.L.; Silva, C.A.U.; Barroso, S.H.A. Comparative analysis of resilience modules obtained in field with geogauge and those obtained in the laboratory. In Proceedings of the 13th Internacional Society for Asphalt Pavements (ISAP) Conference, Fortaleza, Brazil, 19–22 June 2018. [Google Scholar]
  9. Nazzal, M.D.; Mohammad, L.N. Estimation of resilient modulus of subgrade soils for design of pavement structures. J. Mater. Civ. Eng. 2010, 22, 726–734. [Google Scholar] [CrossRef]
  10. Dwivedi, S.; Suman, S.K. Quality Assessment of Road Shoulders using Light Weight Deflectometer and Geogauge. Int. J. Recent Technol. Eng. 2019, 8, 3107–3155. [Google Scholar] [CrossRef]
  11. Sawangsuriya, A.; Bosscher, P.J.; Edil, T.B. Laboratory evaluation of the soil stiffness gauge. Transp. Res. Rec. J. Transp. Res. Board 2002, 1808, 30–37. [Google Scholar] [CrossRef]
  12. Sawangsuriya, A.; Edil, T.B.; Bosscher, P.J. Relationship between soil stiffness gauge modulusand other test moduli for granular soils. Transp. Res. Rec. J. Transp. Res. Board 2003, 1849, 3–10. [Google Scholar] [CrossRef]
  13. Sawangsuriya, A.; Bosscher, P.J.; Edil, T.B. Application of soil stiffness gauge in assessing small-strain stiffness of sand with different fabrics and densities. Geotech. Test. J. 2006, 29, 207–216. [Google Scholar]
  14. Lim, S.-Y.; Song, H.-S.; Ryu, H.-R. Applicability Estimation Compaction Method of Embankment using LWDT and Geogauge. J. Korean Soc. Agric. Eng. 2016, 58, 85–95. [Google Scholar]
  15. Vlcek, J.; Vondráčková, T.; Plachý, J.; Nývlt, V.; Kučerka, D. Comparative Analysis of Dynamic Methods for Earthwork Controlling. Procedia Eng. 2016, 161, 483–488. [Google Scholar] [CrossRef]
  16. Dwivedi, S.; Suman, S.K. A comprehensive review on non-destructive testing using LWD and Geogauge for quick QC/QA of pavement layers. Innov. Infrastruct. Solut. 2023, 8, 101. [Google Scholar] [CrossRef]
  17. Anusudha, V.; Sunitha, V.; Mathew, S. Evaluation of coir geotextile reinforcement for low-volume roads. J. Nat. Fibers 2022, 19, 2402–2413. [Google Scholar] [CrossRef]
  18. Pestana, R.M.M. Contribuição ao Estudo do Comportamento Mecânico de Resíduos de Construção e Demolição Aplicados em Estradas de Baixo Tráfego. Master’s Thesis, Departamento de Engenharia Civil do IST da Universidade Técnica de Lisboa, Lisboa, Portugal, 2008. [Google Scholar]
  19. Ministry of Transport of the People’s Republic of China. JTG 3430-2020; Test Methods of Soils for Highway Engineering. China Communications Press Co., Ltd.: Beijing, China, 2020. [Google Scholar]
  20. The Professional Standards Compilation Group of Peoples Republic of China. JTG D30-2015; Specifications for design of highway subgrades. China Communications Press: Beijing, China, 2015. [Google Scholar]
  21. The Professional Standards Compilation Group of Peoples Republic of China. JTG E40-2007; Test methods of soil for highway engineering. China Communications Press: Beijing, China, 2007. [Google Scholar]
  22. Sha, Q. Road Compaction and Compaction Standard; China Communications Press: Beijing, China, 1999; pp. 181–205. [Google Scholar]
  23. Luo, H. Compactness Testing Technology of Soil-Rock Mixture Subgrade and Its Engineering Application. Ph.D. Thesis, Hunan University, Changsha, China, 2015. [Google Scholar]
Figure 1. Flowchart of the research methodology.
Sustainability 15 05809 g001
Figure 2. Basic mechanical properties of test materials: (a) gradation curve of soil-rock mixture; (b) compaction curve of soil-rock mixture.
Sustainability 15 05809 g002
Figure 3. Indoor model test: (a) preparation of test filler; (b) GeoGauge detection.
Sustainability 15 05809 g003
Figure 4. Relation curve between water content and stiffness.
Sustainability 15 05809 g004
Figure 5. Relation curve between compactness and rigidity of soil-rock mixture.
Sustainability 15 05809 g005
Figure 6. Field test photos: (a) GeoGauge detection; (b) differential settlement detection.
Sustainability 15 05809 g006
Figure 7. Relationship between rolling repetitions and average settlement difference.
Sustainability 15 05809 g007
Figure 8. Relationship between rolling repetitions and compactness of soil-rock mixture: (a) variation trend of compaction degree; (b) relationship between rolling times and settlement difference of each inspection point.
Sustainability 15 05809 g008
Figure 9. Relationship between rolling times and average stiffness.
Sustainability 15 05809 g009
Figure 10. Relationship between rolling repetitions and stiffness: (a) variation trend of compaction degree; (b) relationship between rolling repetitions and compaction degree of each detection point.
Sustainability 15 05809 g010
Figure 11. Relationship curve between stiffness and settlement difference.
Sustainability 15 05809 g011
Figure 12. Kriging interpolation results of detection indicators in different subgrade sections: (a) top of embankment of general subgrade section; (b) top of roadbed section of general roadbed; (c) top of roadbed of platform back.
Sustainability 15 05809 g012
Table 1. Basic mechanical indexes of test materials.
Coefficient of Uniformity C u Coefficient of Curvature C c Optimum Moisture Content ω o p t [%]Maximum Dry Density ρ d max [g/cm3]Uniaxial Saturated Compressive Strength [MPa]
soil-rock mixture14.831.468.0%2.2862.9
Table 2. Corresponding relationship between settlement difference and stiffness value after fitting.
Differential settlement (mm)2345
Stiffness (MN/m)17.5716.2315.0013.86
Disclaimer/Publisher’s Note: The statements, opinions and data contained in all publications are solely those of the individual author(s) and contributor(s) and not of MDPI and/or the editor(s). MDPI and/or the editor(s) disclaim responsibility for any injury to people or property resulting from any ideas, methods, instructions or products referred to in the content.

