Article

Comprehensive Evaluation of Resource and Environmental Carrying Capacity at a National Scale: A Case Study of Southeast Asia

1
State Key Laboratory of Resources and Environmental Information System, Institute of Geographic Sciences and Natural Resources Research, Chinese Academy of Sciences, Beijing 100101, China
2
University of Chinese Academy of Sciences, Beijing 100049, China
3
School of Geography and Information Engineering, China University of Geosciences (Wuhan), Wuhan 430074, China
4
Institute of Geographic Sciences and Natural Resources Research, Chinese Academy of Sciences, Beijing 100101, China
*
Author to whom correspondence should be addressed.
Sustainability 2023, 15(7), 5791; https://doi.org/10.3390/su15075791
Submission received: 23 February 2023 / Revised: 22 March 2023 / Accepted: 24 March 2023 / Published: 27 March 2023
(This article belongs to the Special Issue Environmental Economics and Sustainability Policy)

Abstract

:
Country-level resource and environmental carrying capacity (RECC) assessments can reveal which countries are off-track on ongoing adaptive management towards the sustainability goals. However, fewer effective methods exist to conduct a comprehensive assessment of RECC at the country-level. We implemented the Analytic Hierarchy Process (AHP) to comprehensively evaluate the spatial and temporal evolution of RECC from 1990 to 2020, based on the construction of evaluation indicators of regional characteristics derived from remote sensing (RS) and statistical data for 11 Southeast Asian countries. The results show that: (1) In terms of per capita level, most countries in Southeast Asia show a trend of increasing and then decreasing RECC, with lower RECC levels in the east and north, such as Myanmar and Vietnam, and higher levels in the west and south, such as Indonesia and Brunei. (2) In terms of absolute total, most countries in Southeast Asia show a slow increase in RECC, except for Thailand, which slightly decreases, with lower RECC in northern and central counties, such as Laos and Singapore, and higher in other regions, such as Indonesia and the Philippines. Therefore, we recommend that policymakers pay more attention to the control of population size and adhere to a green economic growth model to alleviate the declining trend of recent RECC. This study proposed a comprehensive evaluation method of RECC that address the challenge of assessing different countries with resource and ecological imbalance, which provides potential GIS solutions for in-depth RECC assessment of other countries in the world. Meanwhile, this paper provides insights for Southeast Asian countries to achieve better sustainable development from the perspective of RECC.

1. Introduction

According to the World Health Organization (2018), Southeast Asia is at risk of extremely high levels of environmental pollution [1]. Many developing countries in the middle or early stages of economic growth, such as Association of Southeast Asian Nations (ASEAN), have achieved rapid economic growth at the cost of environmental degradation, thus facing critical challenges related to the environment [2,3]. These issues have become essential constraints to the progress and development of human society [4]. With this regard, the concept of sustainable development has been proposed to harmonize human-land relations and explore a new economic growth pathway [1]. Sustainable development has long been an indispensable and crucial part of national and international strategies [5]. Despite the growing body of research on SDGs, few state governments have completed their sustainability progress assessments [6]. These official government-led reviews tend to be narrative and not proof-based [7]. There is an urgent need to develop comprehensive assessment methods of national sustainability progress based on SDGs and indicators. Resource environmental carrying capacity (RECC) provides a solution to address such needs.
RECC is a multifactorial, integrated concept that has evolved from single-factor carrying capacity studies. It has emerged as an influential criterion for judging regional sustainable development [8,9]. RECC covers the carrying capacity of a single environmental factor and considers the reuse of regional resources and changes in the ecological environment [10]. A country-level RECC assessment can identify the goals and targets a country is currently off-track on, help prioritize goals and resource allocation, and guide ongoing adaptive management. Hence, a comprehensive evaluation of RECC is essential for coordinating resources, environmental and economic development, and promoting sustainable development of countries and regions [11].
The use of carrying capacity originated in the engineering domain and was earlier applied to ecology, demography, etc. Today, it has infiltrated many disciplines, such as geography and resource sciences [10,12]. Since 1798, when Malthus emphasized the limiting influence of food on population in his An Essay on the Principle of Population, researchers have gradually linked carrying capacity to population and economy [13]. While not being an internationally recognized connotation, resource and environmental carrying capacity is generally accepted as the scale of population and economy that can be carried by the resource endowment and the environmental capacity within a specific geographical space [8].
Resource and environmental carrying capacity covers many aspects, such as resource carrying capacity, environmental carrying capacity, social carrying capacity, etc. RECC emphasizes studying the problem from an integrated perspective in the context of earth sciences. Research on RECC can be divided into two types depending on the research objectives and focus. That is, the single dimensional carrying capacity based on a certain element and the comprehensive carrying capacity of multiple elements with systemic significance. The former, mainly from a single dimension, was studied. Many scholars have assessed the RECC [9] from ecology [14,15,16,17,18], tourism [19,20], resources [21,22,23,24,25,26,27], minerals [28], human [29,30,31], and aquaculture [32], thus constructing a variety of typical evaluation methods and evaluation index systems, which have played a positive role in the formulation of national strategies and the development and planning of practical projects. For instance, Cisneros et al. (2016) assessed the Beach Carrying Capacity (BCC) and actual beach use levels in the coastal city of Monte Hermoso, Argentina, using real-time data including field information and video processing [33]. Cupul-Magana (2017) assessed the tourism carrying capacity of the Islas Marietas National Park by examining two activities: scuba diving and snorkeling [20]. With the continuous development of RECC, it is gradually found that a single carrying capacity dimension can no longer meet the needs of complex social evaluation [34]. It is necessary to evaluate various factors collectively and comprehensively to better simulate and estimate development patterns [35]. Therefore, the second type of RECC, which integrates various factors from multiple dimensions, has become a research spotlight among researchers [36].
Regarding the research topic, each RECC study has its characteristics and focus. Zhang et al. (2019) developed a RECC evaluation index system for 36 major cities covering five aspects: resource, environment, society, economy, and ecotope, in a coupled pressure-support state [37]. Wei et al. (2019) constructed an indicator system from nine aspects, including water resources, land resources, and disaster risks, and then derived the RECC of Fengxian County by comprehensive weighting [38]. Wang et al. (2022) used the Driving-Pressure-State-Impact-Response-Management (DPSIRM) framework to comprehensively assess the ecological carrying capacity (ECC) of the East Liaoning River Basin in China by selecting 22 evaluation indicators from social, economic, and environmental aspects [39]. Tehrani and Makhdoum (2013) developed the Urban Carrying Capacity Load Number (UCCLN) model to monitor the environmental load on the urban ecosystem of Tehran, the capital of Iran, through 30 indicators related to the state of nature, population, energy, water, etc. [40]. Irankhahi et al. (2017) assessed the urban environmental carrying capacity of Shemi-ran city in Iran in terms of both ecological and socio-economic carrying capacity based on a GIS-based model combining the TOPSIS and fuzzy model [41]. All of these case studies have considered multiple factors to comprehensively evaluate carrying capacity, which has laid a solid foundation for the development of RECC.
From the methodological point of view, RECC evaluation can be performed with several types of methods, including the System dynamics (SD) method [24,42], TOPSIS method [4,43,44], Ecological footprint method [45,46], Energy analysis method [25], Comprehensive evaluation method [37,47,48], Geographic information system (GIS) method [49,50], etc. Each method has its own pros and cons, and none of them can be applied to all kinds of situations. Therefore, it takes case-specific examinations to decide which method should be used. Table 1 outlines the advantages and disadvantages of major research methods for RECC evaluation.
In terms of the level of research scale, most current studies related to RECC are based on regional [16,19,21,24,28,33,43], provincial [15,23,47,52,53], municipal [12,34,37,54], and county [40,41] levels. Based on our review of environmental carrying capacity studies, regional-level studies have been the most common, followed by state-level studies, and only a few national-level studies have been conducted (Table 2). Wang et al. (2022) assessed the relationship between resource abundance and green economic growth in 40 resource-rich developing countries in Asia, Africa, and Latin America by calculating the Green Economy Growth Index [55]. Shang et al. (2022) adopted the advanced Panel techniques to assess the role of renewable energy consumption and health expenditure in increasing the load capacity factor in ASEAN countries from 1980 to 2018 [26]. Du et al. (2022) assessed the ecosystem pressures in countries along the Belt and Road from 2000 to 2017 based on the supply (NPP provided by ecosystems)consumption (consumption of NPP by human activities) equilibrium relationship of ecological resources [56]. Kong (2016) suggested that a combination of AHP and integrated evaluation methods could be used to assess the level of sustainable development of a country [57]. However, none of these studies have taken the perspective of RECC, which considers resources, the environment, and humans in an interactive and systematic way.
Nowadays, RECC evaluation can be performed from both single and multiple dimensions. With the more comprehensive knowledge of single-dimensional RECC and the improved evaluation accuracy, the comprehensive evaluation of RECC has become more scientific and effective, and it is time to take advantage of such advancement and put it into use. Therefore, this study aims to evaluate sustainable development by country through a comprehensive assessment of RECC.
The research objectives of this paper include: (1) to construct a comprehensive national-level RECC evaluation system and explore its feasibility; (2) to evaluate the scale and spatio-temporal evolution pattern of RECC in Southeast Asia countries for multiple periods from 1990 to 2020 based on model analysis; and (3) to clarify the future development potential and trends of Southeast Asian countries and make feasible suggestions.

2. Methodology

2.1. Study Area

Southeast Asia borders two oceans and two continents (Figure 1) and has a total area of about 4.57 million square kilometers. The total population of Southeast Asia (11 countries) reached 655 million in 2018, accounting for about one-tenth of the world’s population at the time. The Strait of Malacca is a vital pathway for global shipping traffic. With an overall length of about 900 km, it is an essential route for Europe, the east coast of Africa, West Asia, South Asia, and the countries on the west coast of the Pacific Ocean. In terms of topography, Southeast Asia has a higher elevation in the north and a lower elevation in the south overall. Mountains range from north to south, forming a fan shape. It can be divided into two parts by topography (Figure 1b), the Indo-China Peninsula and the Malay Archipelago. The Indo-China Peninsula can be subdivided into several geographical units enclosed by the mountains running from north to south, and the Malay Archipelago consists of thousands of islands. The traffic shows poor connectivity, which is not conducive to the city’s internal and external transportation links. As a result, the fragmented landscape has also increased the cost of developing infrastructure, such as transportation facilities and communications in Southeast Asia, thus severely limiting economic development. Southeast Asia is still dominated by labor-intensive industries, which are constantly transforming into high-level industrial structures. This region has rich mineral resources, supporting very high oil and tin production. For example, Malaysia is the top-ranking country in producing tin and contributes to about half of the total global production. Neighboring by the sea with a long coastline, Southeast Asia has rich resources such as seafood and gas. Although it is relatively underdeveloped at this moment, it has enormous potential for future development.

2.2. Data Source

This study mainly used open-sourced statistics data and remote sensing interpretation thematic data products. Table 3 has outlined the source, spatial resolution, and the acquisition time of the data in detail.

2.3. RECC Evaluation Method

The main technical flowchart of this study is shown in Figure 2.

2.3.1. Construction of a RECC Evaluation Index System

For the selection of indicators, we considered the contextual characteristics and data availability of the Southeast Asian region from a regional perspective and referred to relevant studies [16,24,48]. Finally, based on the principle of the Analytic Hierarchy Process (AHP), we developed an index system (Table 4), which was divided into the target layer, criterion layer, and indicator layer.
The evaluation index system of RECC proposed in this study consists of 3 subsystems and 24 specific indicators. The indicators were decided per subsystem or criteria type. First, to cover the criteria of natural resource endowment (B1) in terms of land and water resources, we introduced indicators such as per capita arable land area, per capita inland freshwater, and aquaculture production to measure. Second, we considered the ecological and environmental status (B2) of the Southeast Asian region in terms of ecological, atmospheric, and water environment. Accordingly, we selected indicators of mangrove cover, greenhouse gas emissions, and average annual precipitation. Finally, socio-economic conditions (B3) were taken into account by incorporating indicators such as population density, economic density, urbanization rate, and total fertility rate.

2.3.2. Weight Calculation Using AHP

Referring to the RECC studies in China for resource and environmental considerations [52], the relative importance ratio of natural resource endowment (B1), ecological environment (B2), and socio-economic development (B3) was set to 5:3:2 in this study. With this setting, the importance of each indicator was measured and compared using the AHP method under specific conditions of the study area. Finally, each indicator’s weight coefficients were obtained and are displayed in Table 5.

2.3.3. Standardization of Indicators

A series of pre-processing has been conducted for the indicators. First, the indicators were divided into two types: the positive type with large weight values and the negative type with small weight values, and then the data were standardized following the three steps below:
  • Consistency processing (forwarding): evaluation indicators were unified by their type so that the better the scheme under any attribute in the data, the greater the transformed attribute value (i.e., very large);
  • Dimensionless processing: Different indicators and different units were processed to eliminate the influence of dimensionality and facilitate the calculation and analysis of data;
  • Normalization: Different indicators with different value ranges were stretched to fit the value range between 0 and 1. The extreme difference method was used to normalize the data for the four periods of Southeast Asia 1990–2020 as follows.
If x is a very large (positive type) indicator:
X i j = ( x i j x j m i n ) ( x j m a x x j m i n )
If x is a very small (negative type) indicator:
X i j = ( x j m a x x i j ) ( x j m a x x j m i n )
xij and Xij are the values before and after normalization of the metrics, and xjmax and xjmin are the maximum and minimum values for i metrics, respectively.

2.3.4. Comprehensive Evaluation of RECC

After standardization of indicators, the RECC value of Southeast Asia was calculated with the evaluation model shown in Equation (3):
S = i = 1 n W i X i j
where S is the evaluation value of the comprehensive RECC; Wi is the weight value of each indicator; Xij is the standardized value of each indicator data; and n is the total number of indicators. The normalized value of the indicator is between 0 and 1, with a minimum value of 0 and a maximum value of 1. The greater the calculated value of a region’s comprehensive evaluation, the higher its level of RECC and the greater its potential for population or future development.

2.3.5. Correction Based on Population Size

This study differs from previous studies in that RECC is calculated and analyzed in a large region at a national level. In China, city levels are usually determined by population size and land use conditions. Therefore, most previous studies on RECC in China are based on provincial and municipal units which share similar and comparable populations and resources. In contrast, the 11 Southeast Asian countries in this study do not have equal status in terms of population and resources as well as environment due to the vast differences in land area. Moreover, they are more unevenly developed under the general trend of global urbanization [66] and show polarization, so it is only possible to compare the level rank but hard to measure their relative carrying capacity size.
Resources and population are closely related since resource supply is essential for population growth. Therefore, to make the carrying capacity of different countries more comparable and thus measure the relative magnitude of each country’s RECC and its potential value that can be exploited, this paper uses the quantitative relationship between the population of each country and Brunei (which has the smallest population and is treated as the base 1) to make corrections.
Q = S i j T
In the formula, Q is the assessed value of RECC after correction; Sij is the value of RECC before each correction; and T is the multiplicative factor between countries and Brunei’s population. The larger the calculated value of Q for a region, the larger the population it can carry.

3. Results

3.1. RECC Comprehensive Evaluation in Southeast Asia, 1990–2020

3.1.1. Evaluation of Natural Resource Endowment Subsystem

The results of the Southeast Asia Natural Resources Endowment subsystem carrying capacity evaluation 1990–2020 are presented in three main areas. They are presented in terms of spatial distribution, carrying capacity level, and development trend.
Figure 3 shows the spatial distribution of natural resource carrying capacity levels in Southeast Asia. Overall, the natural resource carrying capacity levels are consistent during 1990–2000, with highs in the south and lows in the north; the southwest has higher values than the northeast in general. Malay Archipelago shows higher values than Indo-China Peninsula, which barely changed over time and is consistent with the perception of the evolution of the regional environmental resource endowment. In the Indo-China Peninsula, the natural resource carrying capacity levels in Thailand and Cambodia are significantly higher than those in Myanmar, Laos, and Vietnam. In the Malay Archipelago, Indonesia has the highest natural resource carrying capacity level, while Malaysia, Brunei, Singapore, the Philippines, and East Timor have lower natural resource carrying capacity levels. The trough in the upper limit of the natural resource carrying capacity level appears in 1990 and peaks in 2000, which is the historical highest point of the natural resource level. (The upper and lower limits refer to the maximum and minimum values for different countries in each year (period)).
The values of natural resource carrying capacity levels are shown in Table A1, where East Timor shows the smallest values and Brunei reports the largest values during 1990–2010. In 2020, the smallest natural resource carrying capacity level is still East Timor; while Indonesia shows the largest value, the difference between Indonesia, Cambodia, and Brunei is not significant. In the past 30 years, Brunei, Indonesia, and Cambodia have been in the top three in Southeast Asia many times in terms of natural resource carrying capacity, while East Timor and Vietnam constantly fell into the last three.
The development trend of the natural resource carrying capacity level can be seen in Figure 4. During the period 1990–2020, all countries have shown increased value to some extent compared to 1990, except for the Philippines, East Timor, and Malaysia, where the rate of change is negative. Among them, Philippines reports the greatest and fastest decline of −34.37%. On the contrary, Vietnam shows the most rapid increase by 41.60%. During 1990–2010, except for the Philippines, the rest of the countries showed an increasing trend in the natural resource carrying capacity level. Among the indicators, the per capita construction land, crop production index, and aquaculture production have increased substantially, which has driven the natural resource carrying capacity level to rise continuously, even under the burden of population increase in Southeast Asia.
In the last decade, the natural resource carrying capacity levels of most countries in Southeast Asia have declined to some extent, except for Singapore, Cambodia, and Indonesia; East Timor and Malaysia even show lower levels than they were in 1990. Among the indicators, the per capita arable land area, per capita construction land, and per capita inland fresh water in Southeast Asian countries have generally decreased drastically, which explains the decrease in the natural resource carrying capacity level. During this decade, the increase in population has outweighed the increase in arable land area, built-up area, and agricultural production, resulting in decreasing per capita values of these factors, thus affecting the natural resource carrying capacity level.

3.1.2. Evaluation of Ecological Environment Condition Subsystem

The results of the Southeast Asia Ecological Environment Condition subsystem carrying capacity evaluation 1990–2020 are presented in three main aspects: spatial distribution, carrying capacity level, and development trend.
The spatial distribution of ecological carrying capacity levels in Southeast Asia is shown in Figure 5. Laos has shown a high ecological carrying capacity level in the Indo-China Peninsula of Southeast Asia during 1990–2020. In addition, with the Mekong River basin as the boundary, it shows a distribution pattern of high in the middle and low around. That is, Laos and Cambodia’s ecosystem carrying capacity levels are higher than those of other states in the Indo-China Peninsula. In the Malay Archipelago, the ecological carrying capacity is higher in the northwest than in the northeast, and the ecological conditions are better in Malaysia, Brunei, and Indonesia than in the other countries. The ecological carrying capacity of Brunei is the highest in Southeast Asia. The levels of ecological carrying capacity and the distribution of natural resource carrying capacity in Southeast Asia are relatively similar. In these 30 years in Southeast Asia, the lower limit of ecological carrying capacity level peaked in 2010 and reached its lowest point in 1990. On the other hand, the upper limit peaks in 2020 and drops to the lowest value in 1990. This indicates that Southeast Asia’s overall ecological carrying capacity was worst in 1990 and best in 2020.
The values of ecological carrying capacity levels are summarized in Table A2. The Philippines had the smallest values in 1990–2000, then Singapore became the smallest in 2000–2020. Their differences are insignificant, indicating that their ecological environments’ background conditions are very similar. In foreign cooperation and trade, all countries except East Timor are members of ASEAN, and the countries are developing together for mutual benefit. Brunei, Malaysia, and Indonesia have been in the top three in the ecological carrying capacity level over the past 30 years, while Vietnam and Singapore have been in the bottom three.
The development trend of the ecological carrying capacity level is manifested in Figure 6. During 1990–2020, the ecological carrying capacity level kept increasing in Southeast Asia, except Singapore. Notably, the ecological carrying capacity level increased by more than 90% in Vietnam, Philippines, and East Timor; the change rate in Philippines and Vietnam has reached about 160%.
During 1990–2000, there was a significant increase in the overall ecological carrying capacity level of the Southeast Asian region. The factors affecting ecological carrying capacity are mainly changes in the mangrove cover and per capita coastline length indicators. During 2000–2020, the change in the ecological carrying capacity levels in Southeast Asia is milder than before. Singapore, Laos, and Cambodia experienced a decline at rates of −6.69%, −0.39%, and −3.56%, respectively. The main reasons for the decline are related to greenhouse gas emissions and the decrease in forest cover, while other countries maintained their increasing trend. On the ecological side, economic activities such as reclamation should be weakened, as in Singapore, to reduce the damage to the marine ecosystem. It is necessary to give full play to Southeast Asia’s favorable geographical location, inherent sea transport routes, ports, and other superior conditions, and vigorously develop tourism and other cultural industries.

3.1.3. Evaluation of Socio-Economic Development Subsystem

The results of the Southeast Asia Socio-economic Development subsystem carrying capacity evaluation 1990–2020 are also presented in three main aspects: spatial distribution, carrying capacity level, and development trend.
The spatial distribution of the socio-economic carrying capacity levels in Southeast Asia is displayed in Figure 7. During the period 1990–2020, the socio-economic carrying capacity level on the Indo-China Peninsula in the Southeast Asian region has been at a higher point than countries in the Malay Archipelago. While the socio-economic carrying capacity levels on the Indo-China Peninsula show a distribution of low in the middle and high around, the socio-economic carrying capacity levels in Laos and Thailand are relatively high. The socio-economic carrying capacity level in the Malay Archipelago gradually decreases from north to south. Singapore and Brunei are the only two developed countries in the Southeast Asian region with relatively high socio-economic carrying capacity levels, distributed in the northern part of the Malay Archipelago. The peak of the lower limit of the socio-economic carrying capacity level in Southeast Asia in 30 years appeared in 2000, and the historical lowest point appeared in 2020. The trough of the upper limit emerged in 1990, and the highest historical level of socio-economic carrying capacity occurred in 2020. Both the highest and lowest points appeared in 2020, showing the polarization of socio-economic development in the Southeast Asian region, which is very unbalanced.
The values of the socio-economic carrying capacity levels are summarized in Table A3. Singapore’s leading socio-economic carrying capacity during 1990–2020 is strongly related to its highest GDP per capita. Myanmar and Brunei have similar levels of socio-economic carrying capacity, while the Philippines, Cambodia, and Malaysia have the same size of socio-economic carrying capacity. In 1990, Laos was at the lowest socio-economic carrying capacity level. Between 2000 and 2020, East Timor has seen relatively limited socio-economic development and has been at the lowest socio-economic carrying capacity level of the entire Southeast Asian region. During the 30 years, Singapore and Brunei have been in Southeast Asia’s top three socio-economic carrying capacity levels, while East Timor and Laos have been in the bottom three.
The trend of the socio-economic carrying capacity level in Southeast Asia is shown in Figure 8. During 1990–2020, the socio-economic carrying capacity levels steadily increased in most of Southeast Asia, with only East Timor, Myanmar, and Brunei showing a decreasing trend. Among them, East Timor has the fastest decreasing trend, reaching −22.99%. Indonesia and Laos were two countries with a rapid socio-economic development rate of 44.60% and 52.30%, respectively, with great potential for future development.
During the period 1990–2010, the socio-economic carrying capacity of most countries in Southeast Asia showed an increasing trend, while the socio-economic carrying capacity of East Timor and Brunei showed a decreasing trend at a rate of more than 10%. The main factors contributing to the increase in socio-economic carrying capacity during these 20 years were the growth in GDP per capita, economic density, urbanization rate, and road network density.
From 2010 to 2020, Indonesia and Singapore have maintained a growth trend, while other countries have declined from the previous 20 years due to the ongoing population growth, posing a critical challenge to keep the socio-economic carrying capacity. In addition, the lack of infrastructure significantly hinders Southeast Asia’s economic development. The excessive number of islands in Southeast Asia has far exceeded the demand for use, fragmenting the land parcels into irregular shapes, and seriously affecting various production and living activities. Government departments should strengthen the investment in infrastructures such as transportation and medical care and allocate them reasonably to suit the local conditions. Only well-developed infrastructure can improve the socio-economic, resource, and environmental carrying capacity.

3.1.4. Comprehensive Evaluation of RECC

The comprehensive evaluation of RECC is a weighted sum of the carrying capacity of the three subsystems (natural resource endowment, ecological and environmental conditions, and socio-economic development), and was eventually derived as the comprehensive RECC of Southeast Asia. According to the experimental results, the RECC index between 1990 and 2020 ranges from 0.08 to 2.28. Based on the statistical principle, this paper used the equal spacing method to divide the RECC values of Southeast Asia into four levels, which is shown in Table 6.
The results of the Southeast Asia RECC comprehensive evaluation 1990–2020 are presented in three main aspects: spatial distribution, carrying capacity level, and development trend.
The spatial distribution of the RECC levels in Southeast Asia can be seen in Figure 9. The RECC levels in the eastern and northern parts of the Southeast Asian region are relatively lower in the western and higher in the southern parts during the period 1990–2020. In the Indo-China Peninsula, the level of RECC is higher in the central south and most areas in the Malay Archipelago, and lower only in the Philippines and East Timor. In these 30 years, the peak of the lower limit of the RECC level in Southeast Asia occurred in 2010, with a medium level of carrying capacity, and reached its lowest point in 1990. For the upper limit, the historical highest point happened in 2000, while the lowest occurred in 1990.
The values of the RECC levels are listed in Table A4. From 1990 to 2020, Brunei’s RECC level was at its highest level, while East Timor’s RECC reached its lowest level. Brunei is a developed country. With rich natural resources, a better environment, and a more suitable population size, Brunei’s RECC level is high, ensuring a long-term stable development without resource and environmental constraints. The ecological environment of East Timor is relatively good, but its natural resources are relatively scarce, so tourism and other green economy industries can be the focus for future development. In general, Laos, Myanmar, the Philippines, and East Timor have lower levels of RECC in Southeast Asia.
In 1990, Indonesia, Malaysia, Brunei, and Singapore had higher levels of RECC, while Myanmar, Laos, Vietnam, Thailand, Cambodia, East Timor, and the Philippines had low to medium levels of RECC. In 2000, Myanmar, Laos, Vietnam, the Philippines, and East Timor had low to medium levels of carrying capacity, while the remaining six countries had a high level of carrying capacity or above. In 2010, Vietnam, Myanmar, the Philippines, and East Timor were still at low to medium carrying capacity levels, while the remaining seven countries were at high carrying capacity levels and above. In 2020, Laos, Vietnam, Myanmar, the Philippines, and East Timor were at low to medium carrying capacity levels, while the remaining six Southeast Asian countries were at high carrying capacity levels and above. During the past 30 years, the top three countries in terms of RECC in Southeast Asia are Brunei, Malaysia, and Indonesia, while the bottom three countries are East Timor and Myanmar.
The trend of RECC is shown in Figure 10. During 1990–2020, the RECC levels in Southeast Asia are increasing, with Vietnam and Myanmar showing higher RECC levels. Between 1990 and 2010, the ecological conditions and socio-economic aspects have been sufficiently improved to make the RECC levels increase rapidly for Southeast Asian countries. While in 2010–2020, most countries displayed a decreasing trend in the RECC levels. Based on changes in the three subsystems from 1990 to 2020, regardless of the impact of the 2020 epidemic on global economic development, the most significant cause of the decline in the RECC levels is the contradiction between rapid population growth and the under-exploitation of natural resources.

3.2. The Results of the Carrying Capacity Evaluation after Population Correction

3.2.1. Correction of Natural Resource Carrying Capacity Values

The values of natural resource carrying capacity after the correction of the population relationship are shown in Table 7. The low natural resource carrying capacity of East Timor and Brunei indicates the relative scarcity of their natural resources under the current conditions. On the other hand, Indonesia has the highest natural resource carrying capacity with its vast territory and abundant reserves that can be further explored. The natural resources of the Philippines, Thailand, and Vietnam are also very considerable and can be developed and utilized to a greater extent, the natural resource carrying capacity of the Philippines is about 160 times that of Brunei and East Timor; the natural resource carrying capacity of Indonesia is about 600 times that of East Timor and Brunei; the natural resource carrying capacity of other countries is relatively small. The countries that have been in the top three in terms of natural resource carrying capacity over the 30 years are Indonesia, the Philippines, and Thailand; the countries that have been in the bottom three in terms of natural resource carrying capacity are East Timor, Brunei, and Singapore.

3.2.2. Correction of Ecological Carrying Capacity Values

The ecological carrying capacity based on the correction of the population relationship is shown in Table 8. The ecological carrying capacity of the Philippines, Malaysia, Myanmar, Thailand, and Vietnam have similar favorable values, and Indonesia has the highest ecological carrying capacity. East Timor, Cambodia, Laos, Brunei, and Singapore have relatively worse ecological environments. The ecological carrying capacity of Indonesia is about 400 times that of East Timor and Brunei. Thailand’s ecological carrying capacity is approximately 70 times that of East Timor and Brunei. During the 30 years, the top three countries in Southeast Asia in terms of ecological carrying capacity are Indonesia, the Philippines, and Vietnam; the last three are Brunei, Singapore, and East Timor.

3.2.3. Correction of Socio-Economic Carrying Capacity Values

The socio-economic carrying capacity corrected for demographic relationships is shown in Table 9. Among them, East Timor, Brunei, and Laos have low socio-economic carrying capacity, whereas Myanmar, Vietnam, Thailand, Indonesia, and the Philippines have relatively high socio-economic carrying capacity and a high potential for future development. The socio-economic carrying capacity value of Indonesia is about 300 times higher than that of Brunei and East Timor. The socio-economic carrying capacity value of Indonesia is about 300 times higher than that of Brunei and East Timor. The socio-economic carrying capacity value of Vietnam and Thailand is about 170 times higher than that of East Timor and Brunei. The socio-economic carrying capacity value of the Philippines is more than 140 times higher than that of East Timor and Brunei. During the 30-year period, the top three Southeast Asian countries in socio-economic carrying capacity are Indonesia, Thailand, and Vietnam; the last three are Brunei, East Timor, and Laos.

3.2.4. Correction of Resource and Environmental Carrying Capacity Values

Table 10 summarizes the value of Southeast Asia’s RECC after population-based correction. While the RECC of East Timor, Brunei, and Singapore are low, large values were found in the Philippines, Thailand, Vietnam, Myanmar, and Indonesia, which indicate their great potential for future sustainable development. The country with the largest RECC is Indonesia, and the smallest is Brunei. Indonesia’s RECC is more than 500 times higher than that of East Timor and Brunei; the Philippines, Thailand, and Vietnam are about 150 times higher than that of East Timor and Brunei; the RECC values of Myanmar and Malaysia are about 100-75 times higher than those of East Timor and Brunei. During the 30 years, among the Southeast Asian countries, Indonesia, the Philippines, and Thailand are in the top three in terms of RECC; the last three in terms of RECC are Brunei, East Timor, and Singapore.

4. Discussion

4.1. Comparison of RECC with Other Sustainability Assessment Indexes

Currently, few country-scale-based RECC assessments exist to explore the sustainability of different countries. To guide urban development towards a more sustainable state [67], some relatively simple composite indices have been actively attempted in national sustainability evaluation. However, most of the indicators in these evaluation methods are calculated in the aggregate, with less attention to per capita quantities. This is conflicting in the current context of the significant differences in individual countries’ total socio-economic and regional development levels. Therefore, using only one aggregate indicator to evaluate all regions without demographic corrections is fundamentally flawed [68]. Still, there are no robust and practical methods for quantitative evaluation of sustainable development [5].
Human Sustainable Development Index (HSDI) and the Human Green Development Index (HGDI) are more comprehensive indices that have been used and referred to internationally, but these evaluation indices are still relatively simple. Some scholars have proposed a new National Sustainable Development Index (NSDI) based on the Human Development Index (HDI) (created by the United Nations Development Programme), the Human Sustainable Development Index (HSDI), and the Human Green Development Index (HGDI) for a more comprehensive analysis of national sustainability [61]. The NSDI attempts to consider economic, social, and environmental factors in an integrated manner, but there are still some shortcomings. First, concerning indicators, although the national sustainable development index considers the three elements of resources, environment, and economy, some more representative indicators are inevitably sacrificed to facilitate the collection of indicator data, and the number is not large enough to reflect reality. Secondly, in terms of weight setting, although the more objective entropy weighting method is used, which is indeed a significant improvement over the HDI and other index evaluation methods with equal weights. However, it also does not consider the regional context and has little significance in guiding specific regions.
In the past, excessive emphasis was placed on economic development and short-term benefits, while environmental limitations were largely neglected. With a better understanding of sustainable development, people started to realize that economic indicators alone are insufficient to measure the sustainability index. This is well illustrated by the development of many sustainability assessment methods, such as the evolution from HDI to NSDI. Therefore, further integration of resource and environmental elements to achieve comprehensive and coordinated development of resources, environment, and socio-economy is the future trend, reflecting the continuous evolution and development of the human-land relationship.
Similarly, this study has considered the limitations of resources and the environment on human development, but incorporates a more comprehensive list of significant factors to assess RECC in Southeast Asia. To determine the weight for each indicator, we used expert scoring based on existing research cases and also considered local characteristics. From 
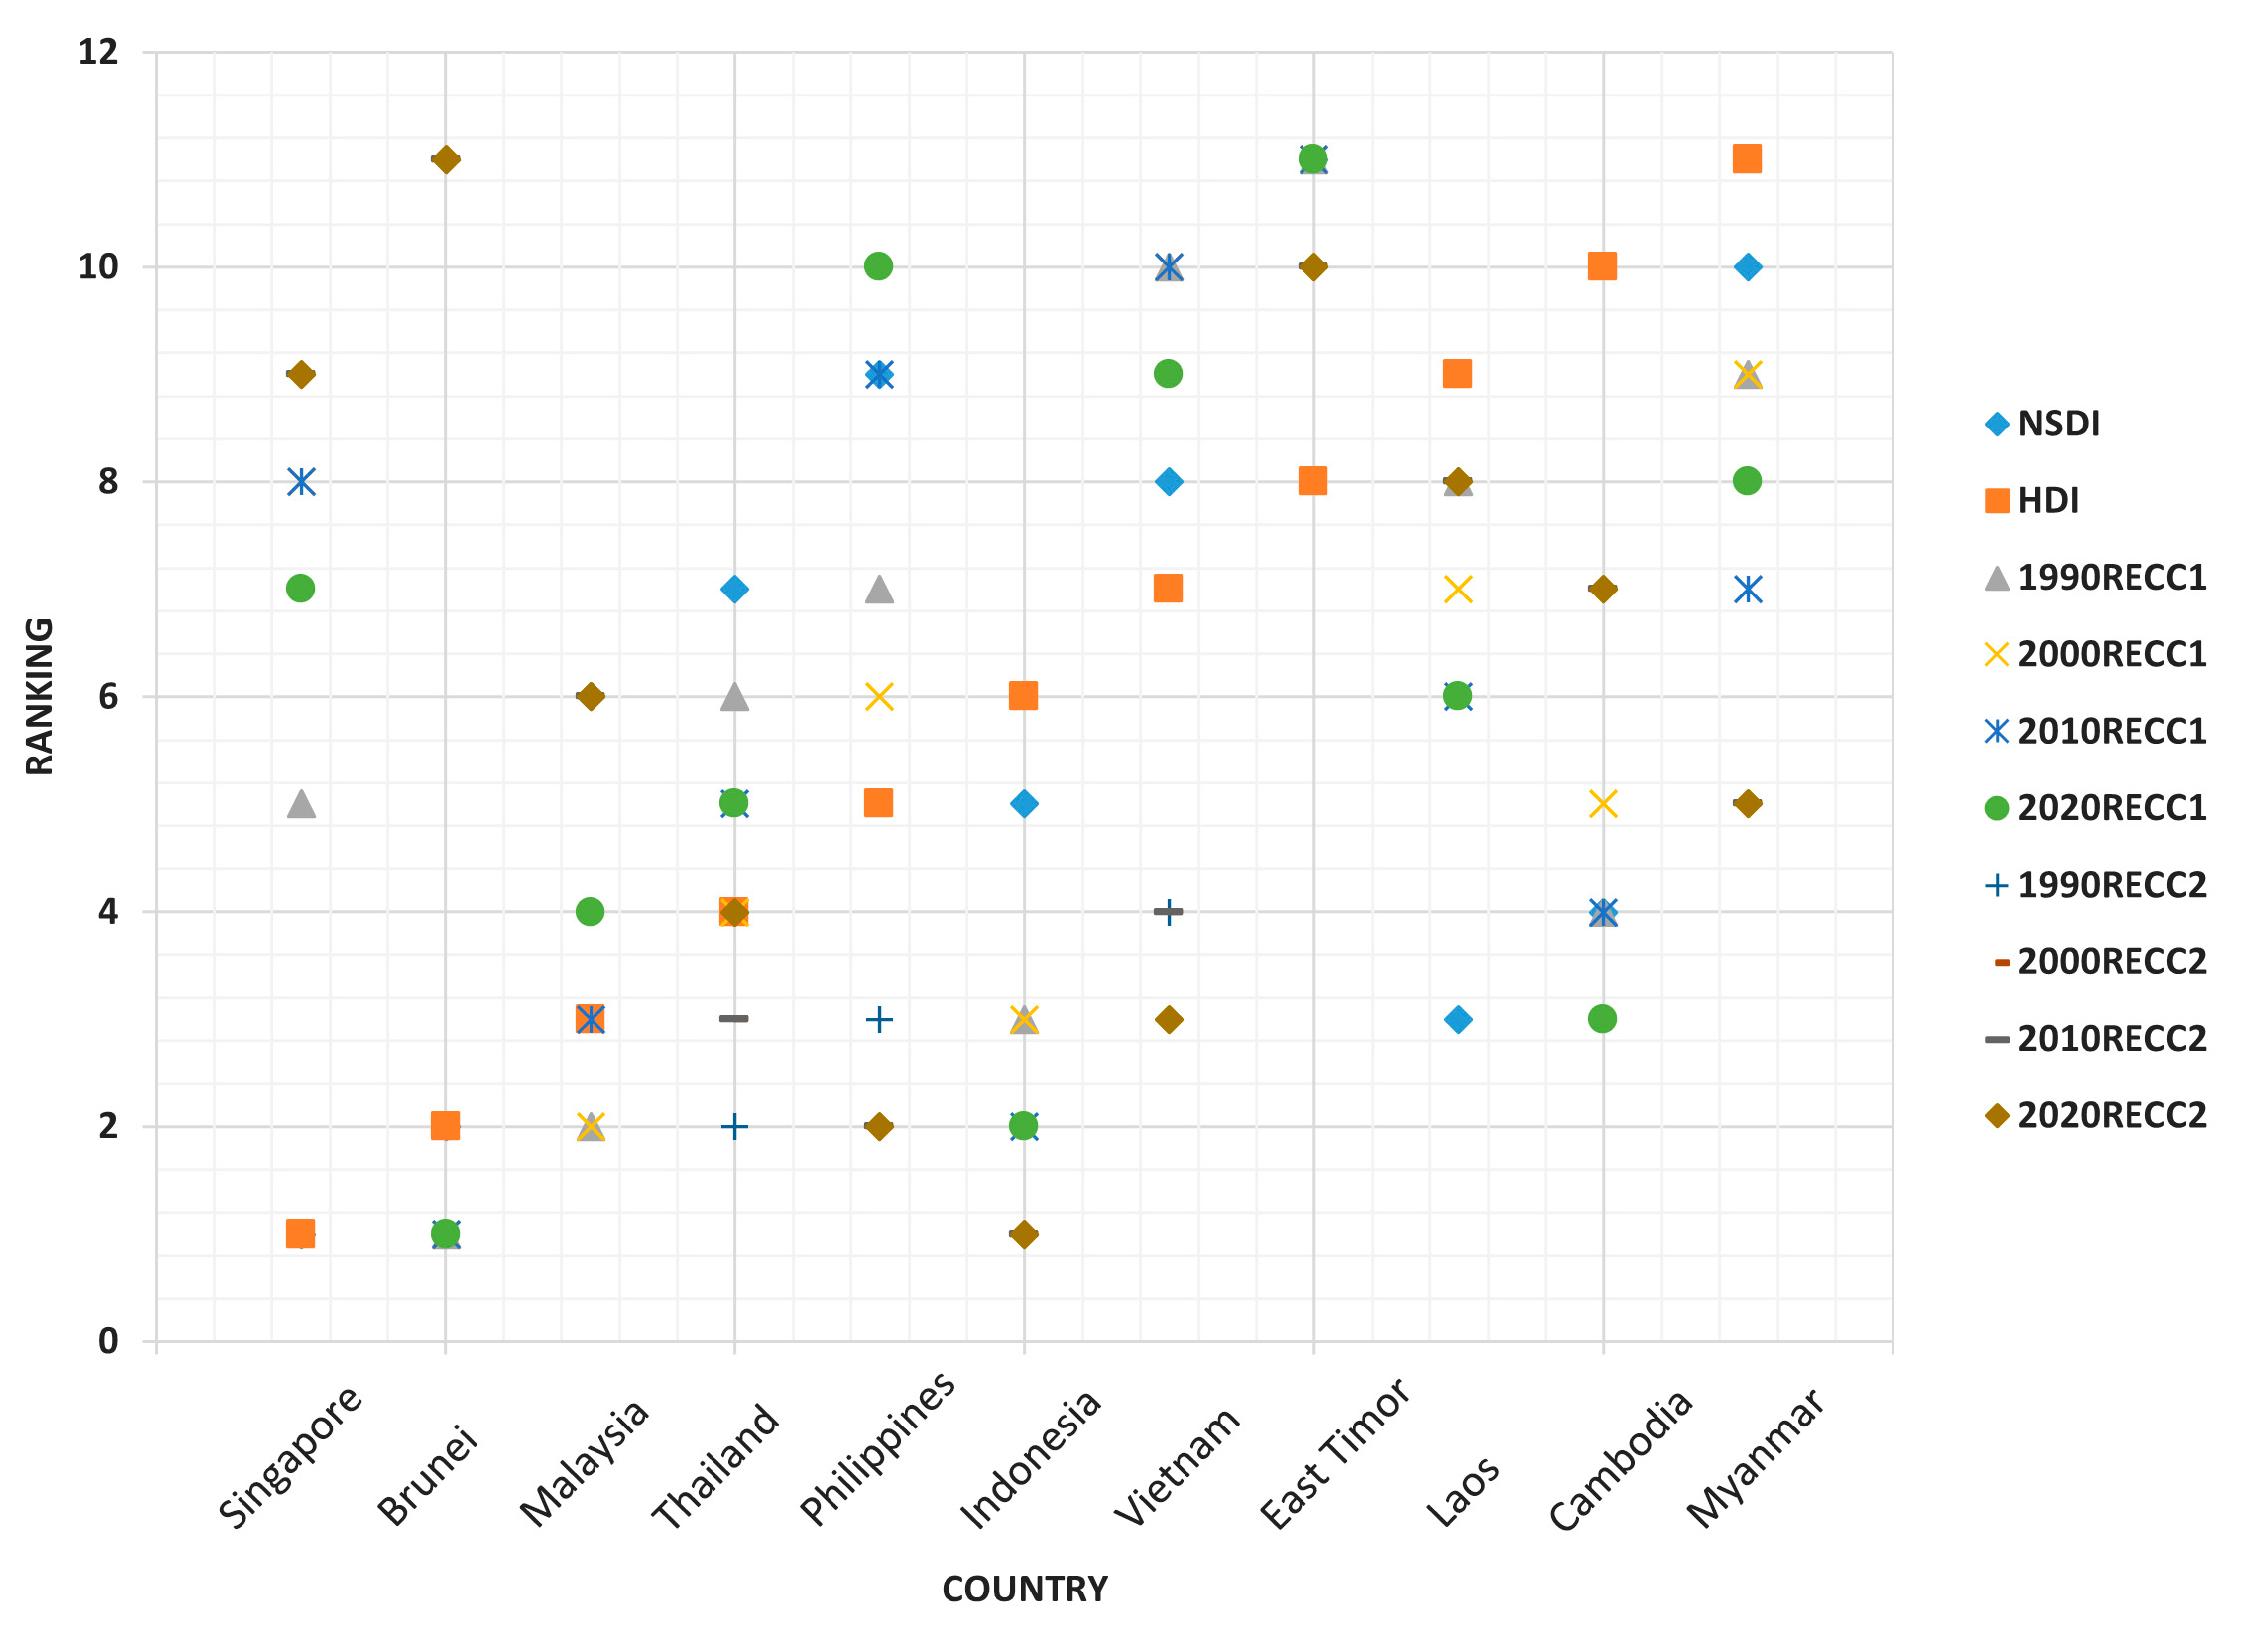
Figure 11, there is a strong correlation in the ranking relationship between RECC, NSDI, and HDI for all countries in Southeast Asia. The horizontal axis represents the 11 countries, and the vertical axis represents their sustainability ranking. The HDI is relatively simple and only considers economic factors, thus showing a linear change in the end. By contrast, the NSDI tries to integrate resource, environmental, and economic factors, showing complex volatility. From the comparison of NSDI with the pre-correction RECC1 and post-correction RECC2 and HDI scatter plots (Table A7), the fluctuation trend is closer to the RECC. Compared with NSDI, RECC has considered the characteristics of resources and environment more fully, so the reason for the difference with NSDI is also mainly reflected in this aspect. After the population correction, RECC2 has enlarged the quantitative relationship between resources and the environment, which makes the evaluation result change more obvious and closer to the real situation. For example, Brunei has a high per capita economic share, and its resource and environmental carrying capacity level is ranked among the top in Southeast Asia. After the correction of the population relationship, Brunei carries an insufficient total population, so the resource and environment carrying capacity ranking are lower. In this paper, the significance of population correction is also revealed in the assessment of the comparative carrying capacity or potential of the population of different countries, which is consistent with the principal connotation of sustainable development.
In summary, the fluctuations of RECC, HDI, NSDI, and other sustainability assessment indices are generally consistent with each other, except for the focus and difference in resource environment, which also indirectly indicates the direction of focus and feasibility of this study. In a large regional sustainability assessment, there are not only cities, but also vast unused and unexploited resources, and the future survival and development are precisely dependent on the collection and use of these resources. Therefore, based on this principle, it is reasonable and meaningful to shift the focus of RECC’s resource and environmental carrying capacity from economy to resource and environment.

4.2. Analysis of RECC before and after the Correction and Its Focus Countries

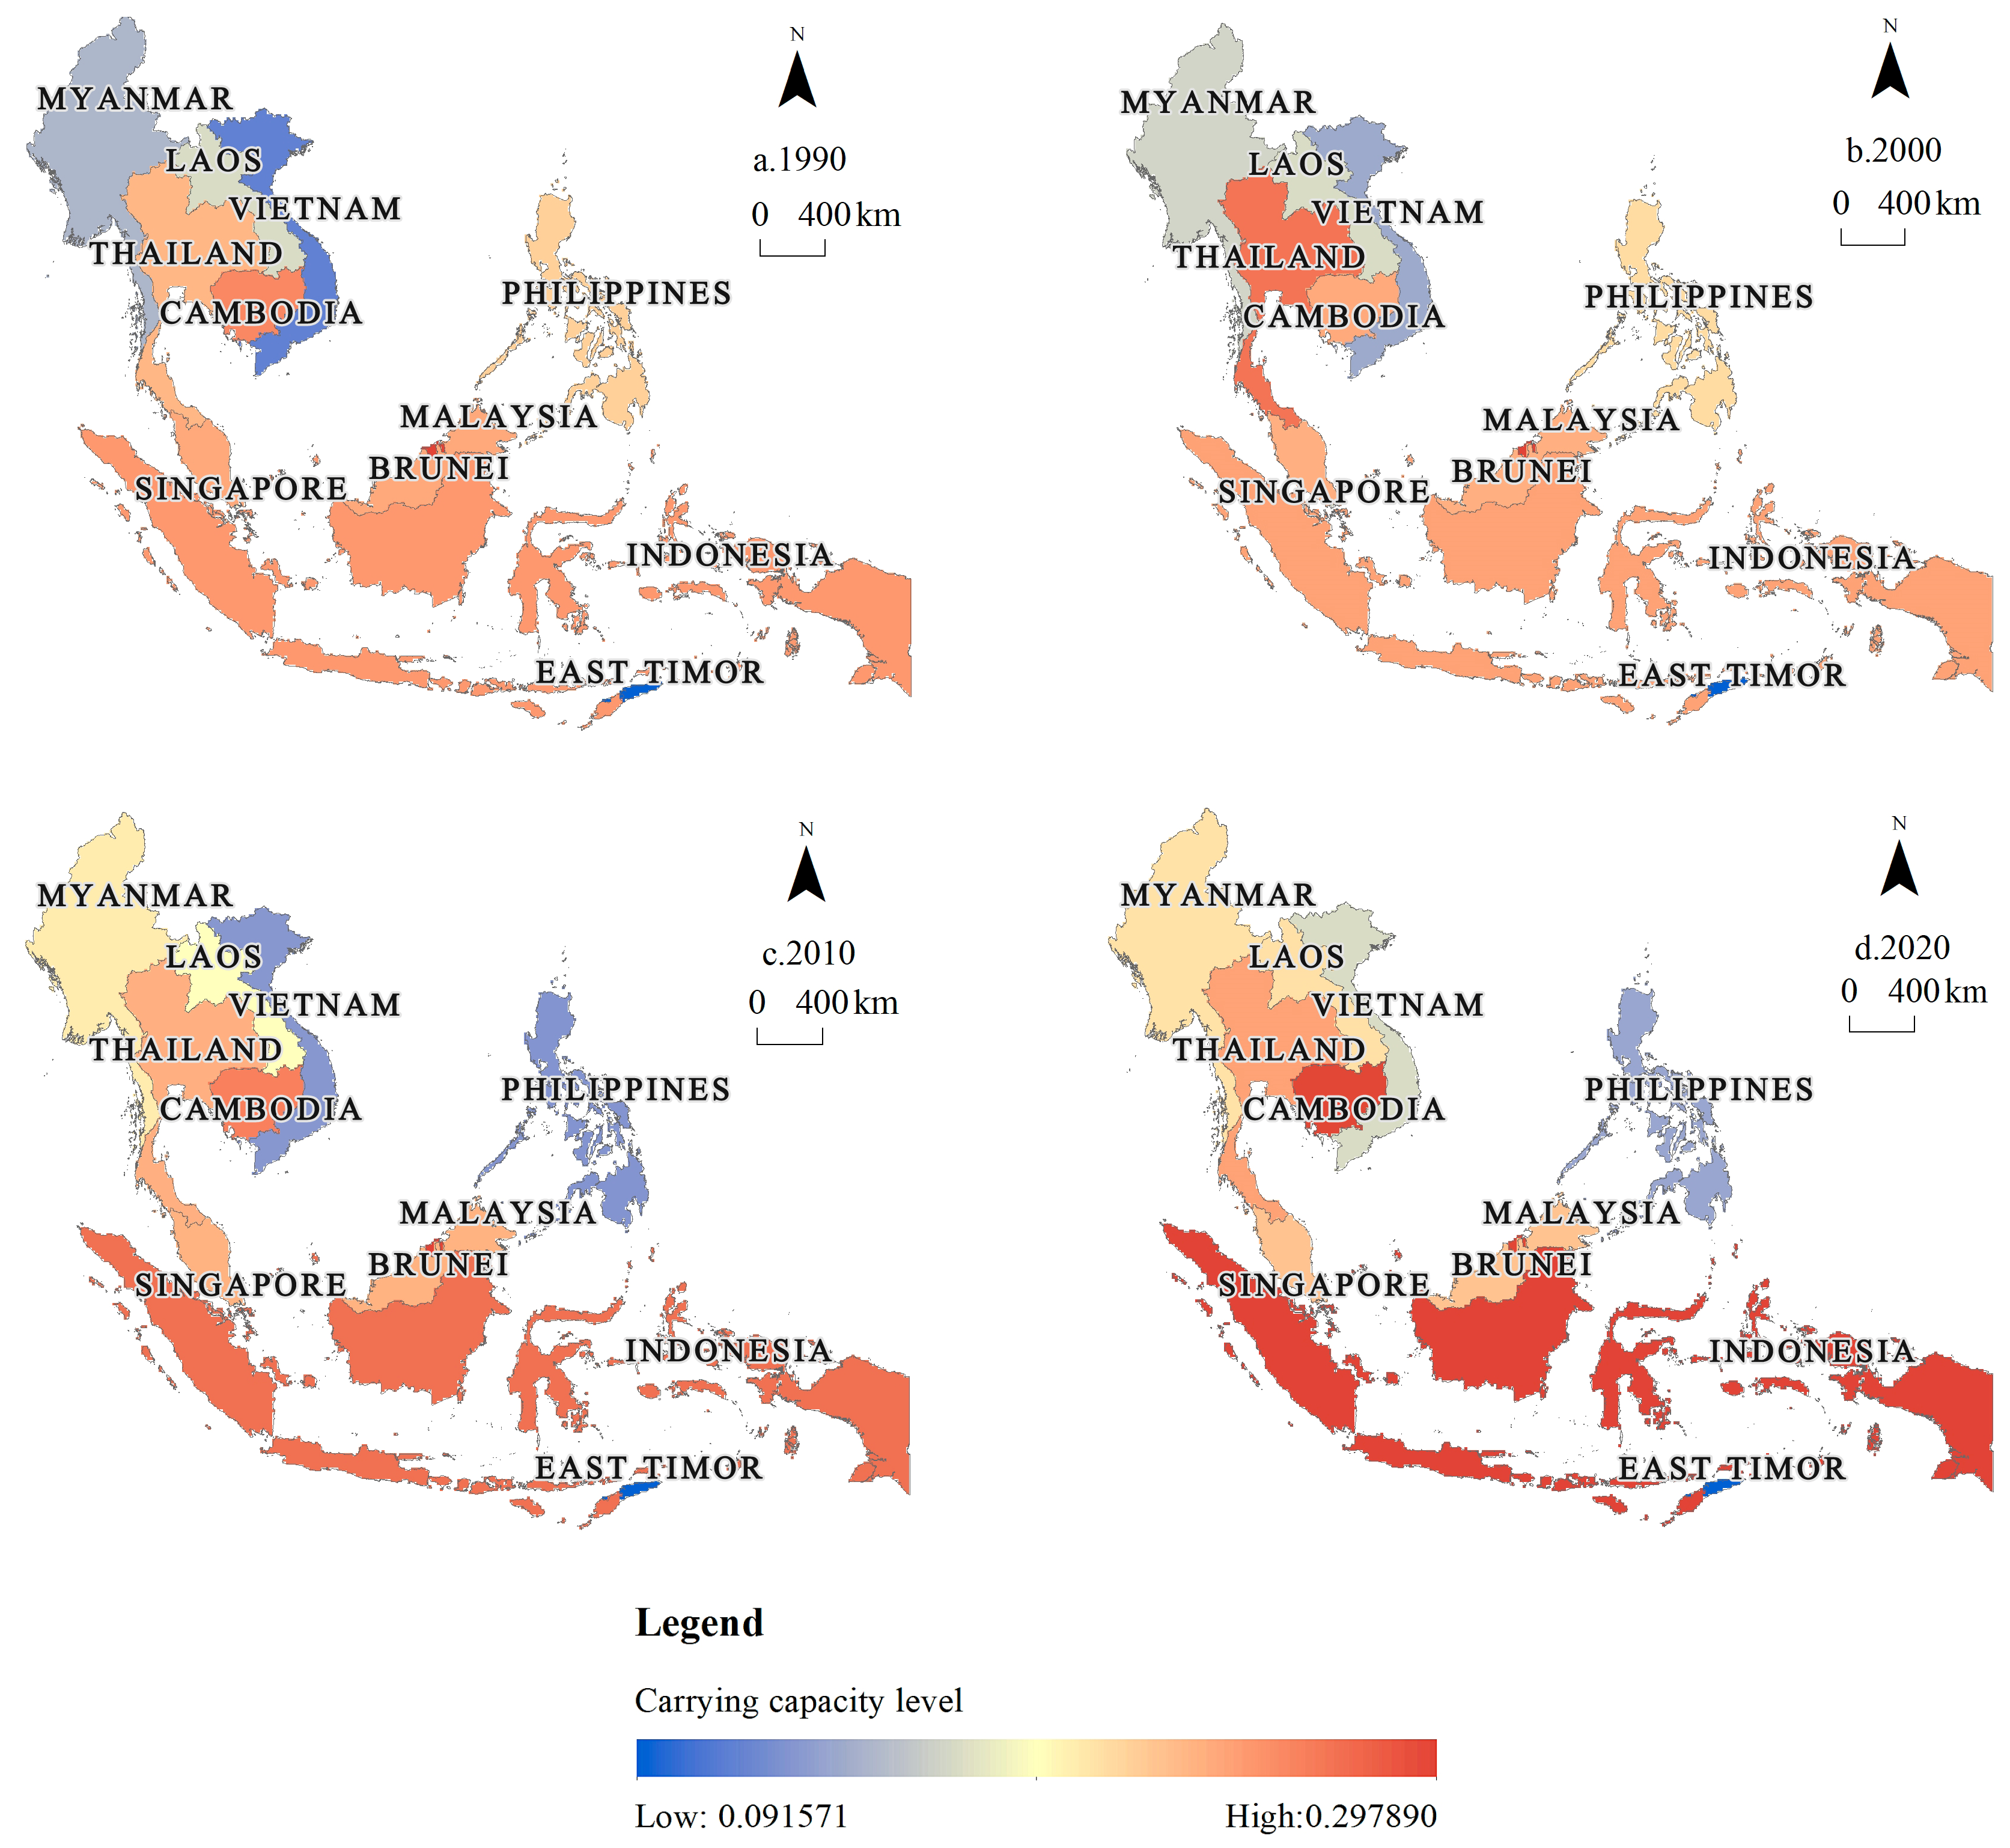
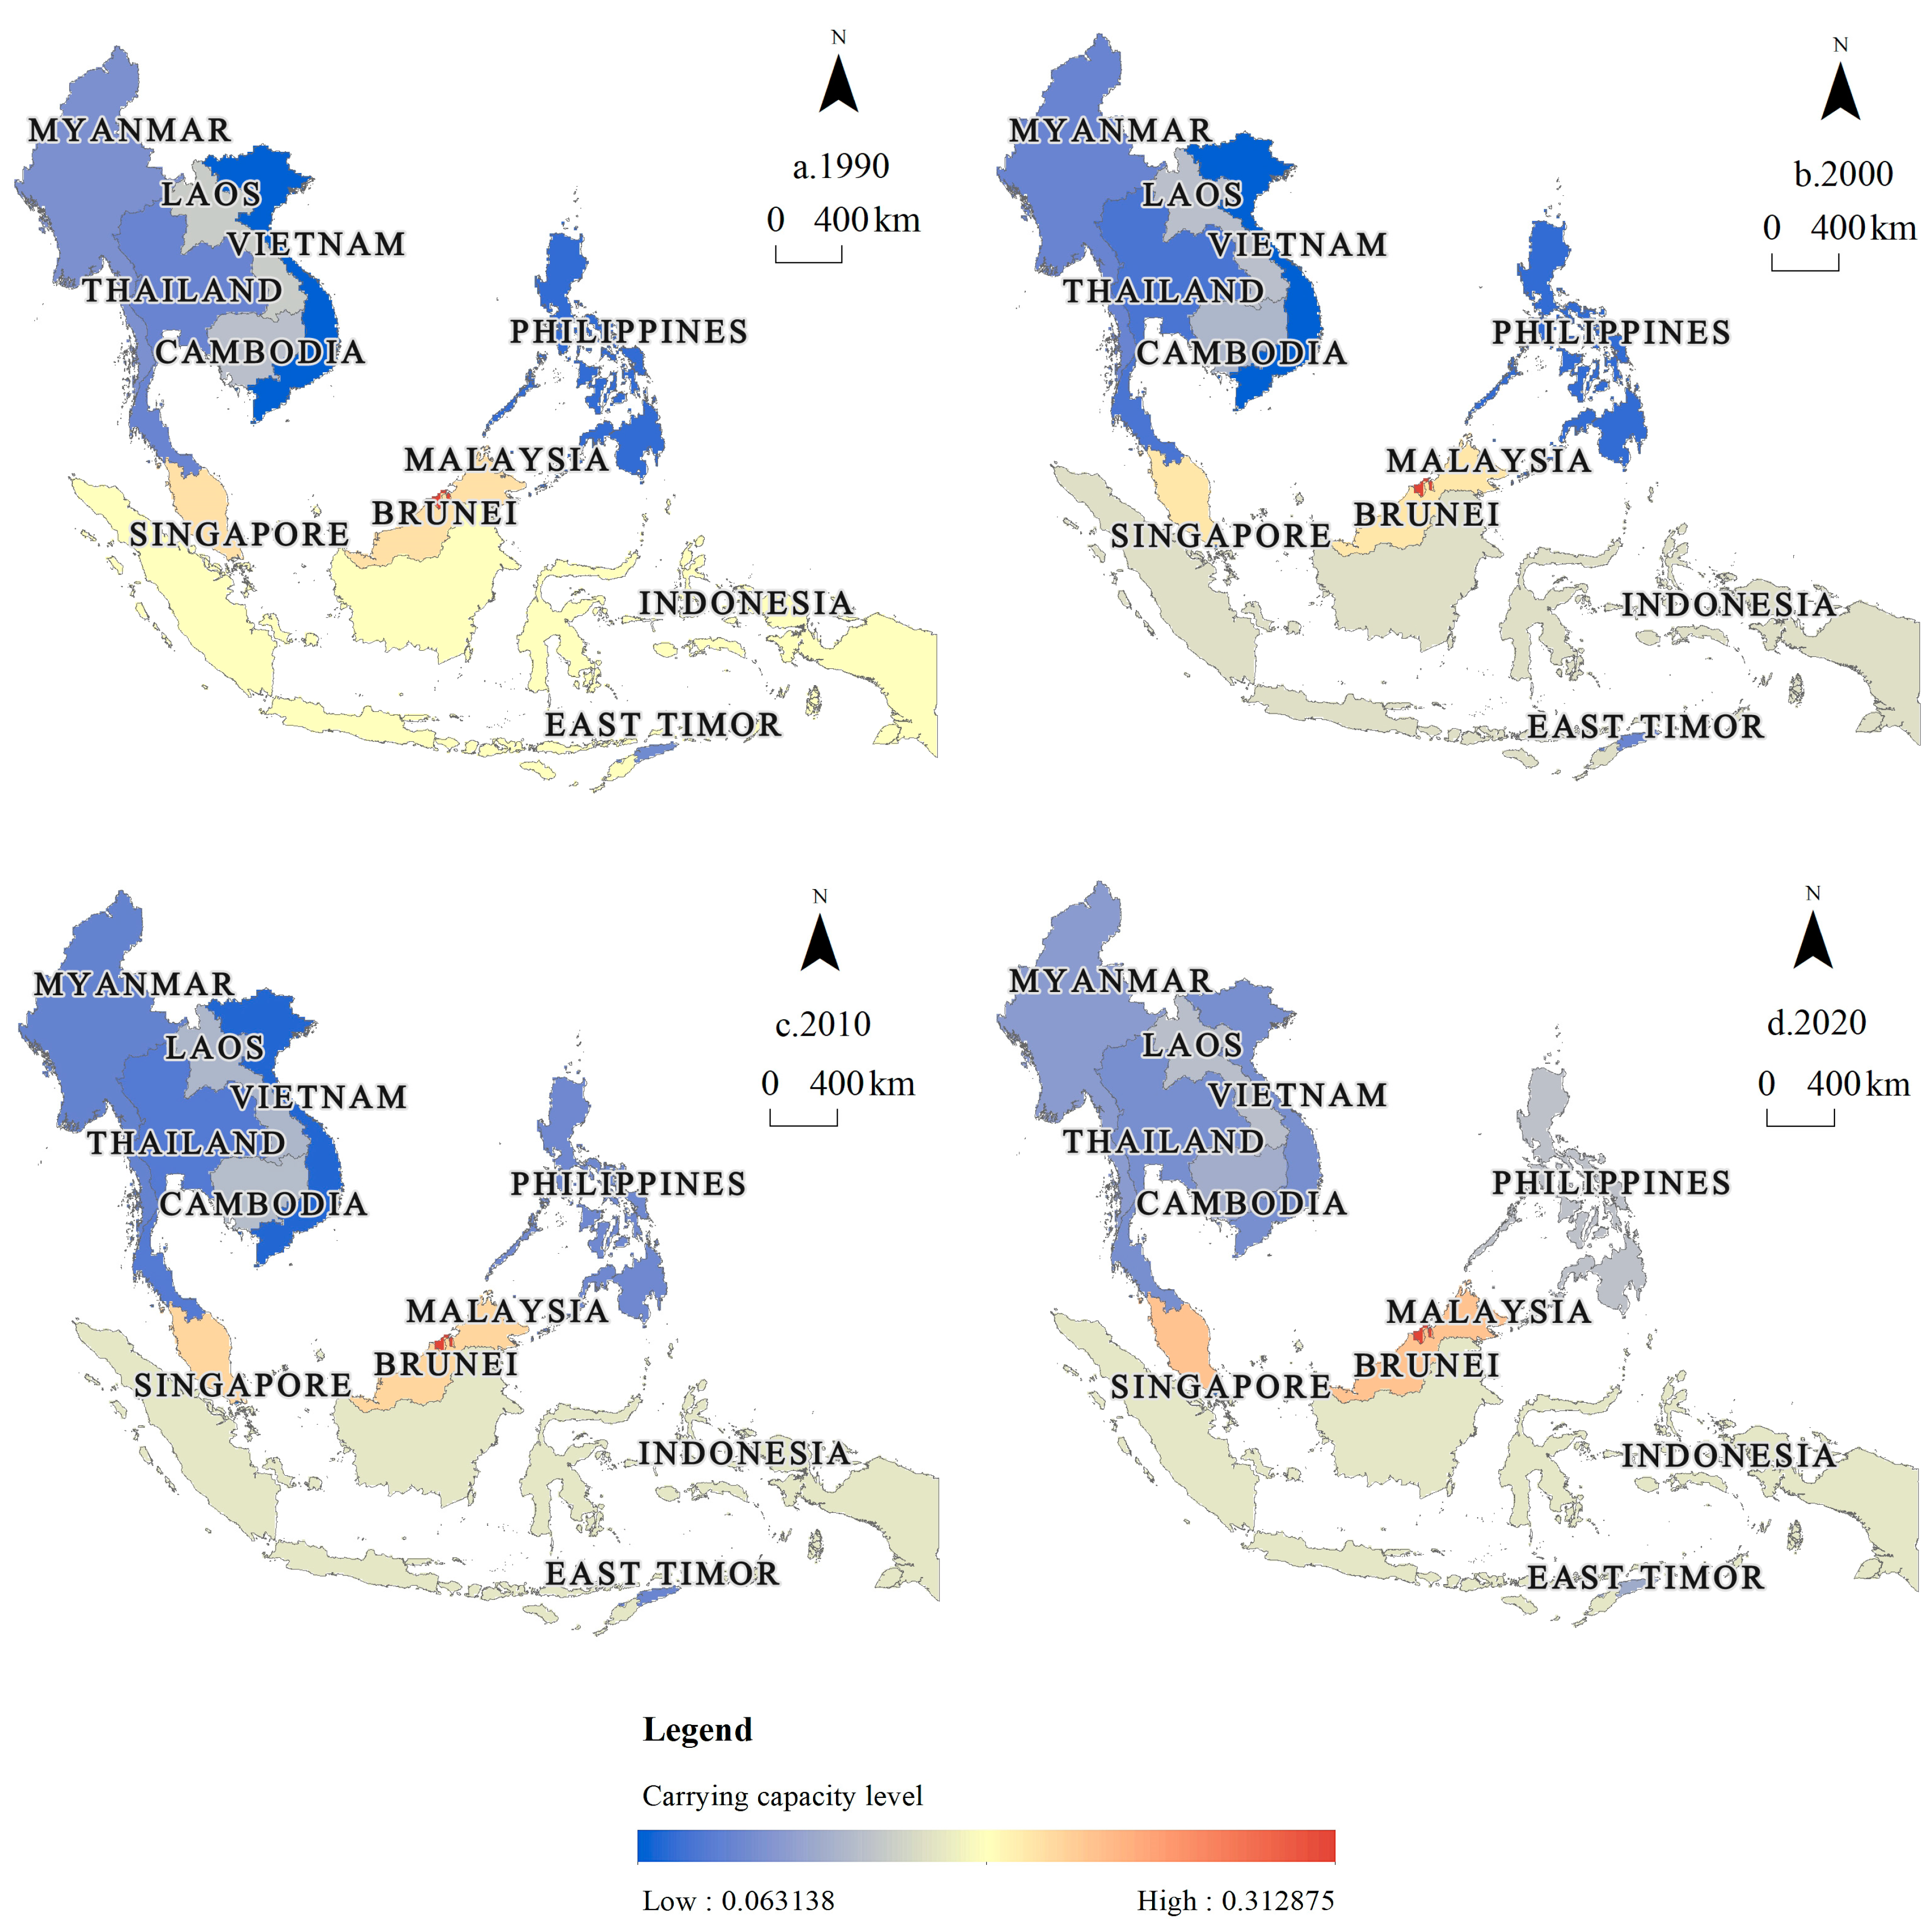
In this paper, pre-correction and post-correction carrying capacities were both calculated. Before the correction, we can identify the rise or fall in each country’s RECC level during the 30-year evolution. It is a valuable reference for governments to determine trends in their countries of change and to help policy development. Direct comparisons are less scientific because of the significant differences in resource and environmental conditions and imbalances between different countries. Thus, these inequalities can be mitigated by the population correction, making horizontal comparisons of RECC at different country scales more meaningful.
In Figure 12, 
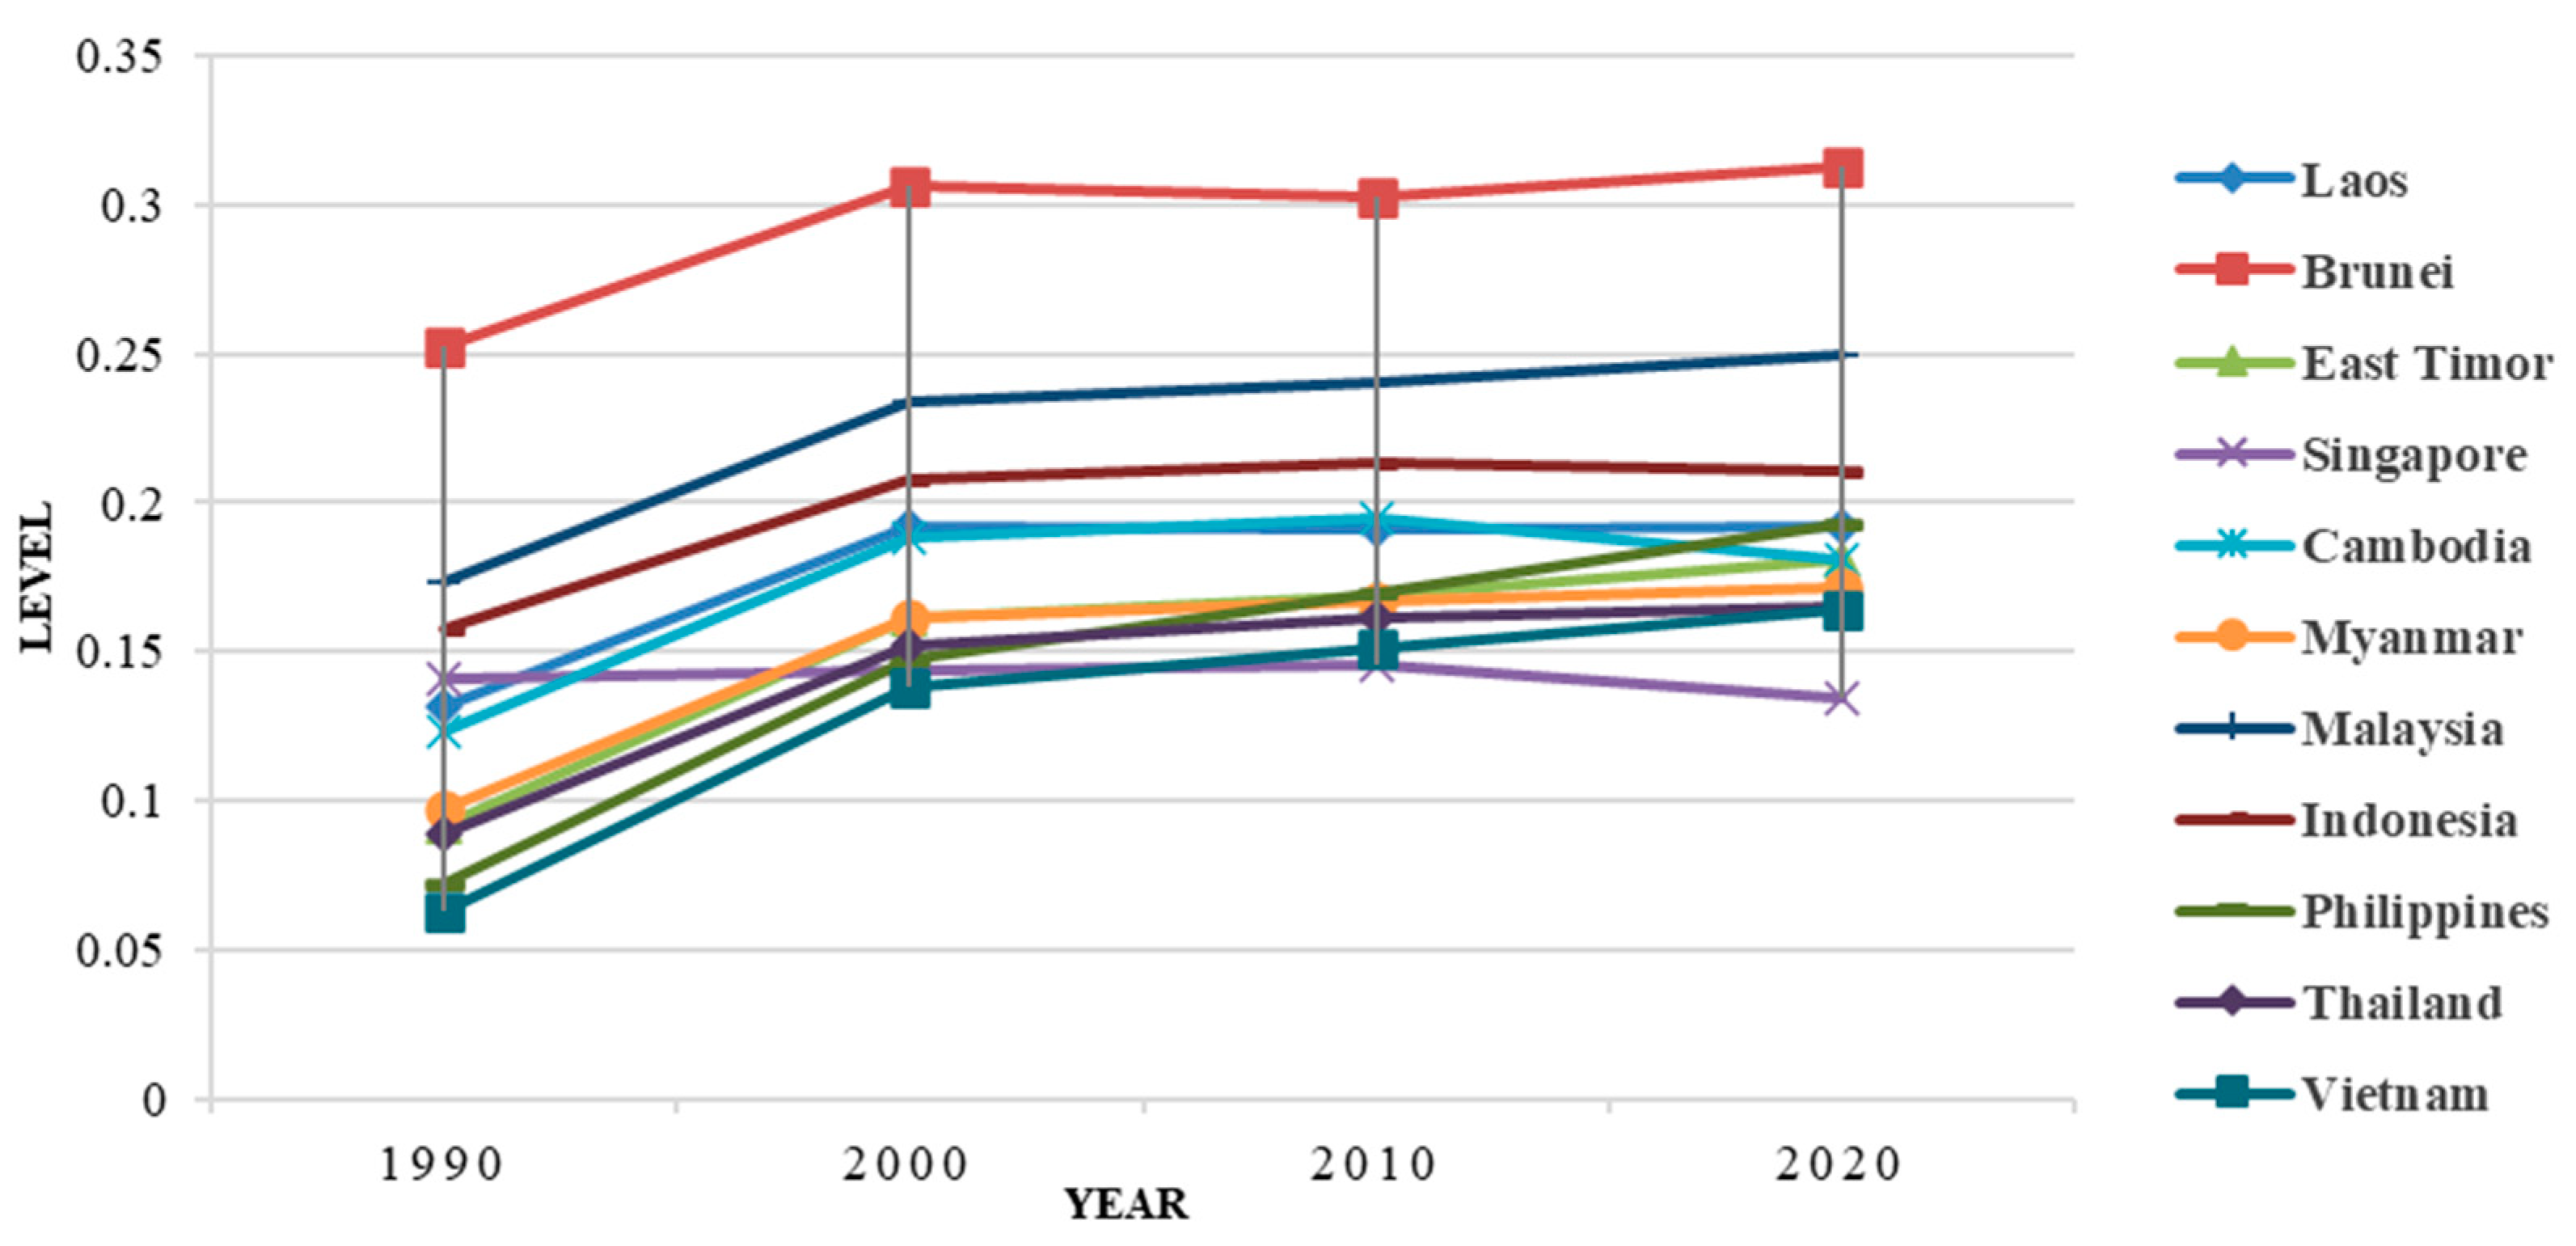
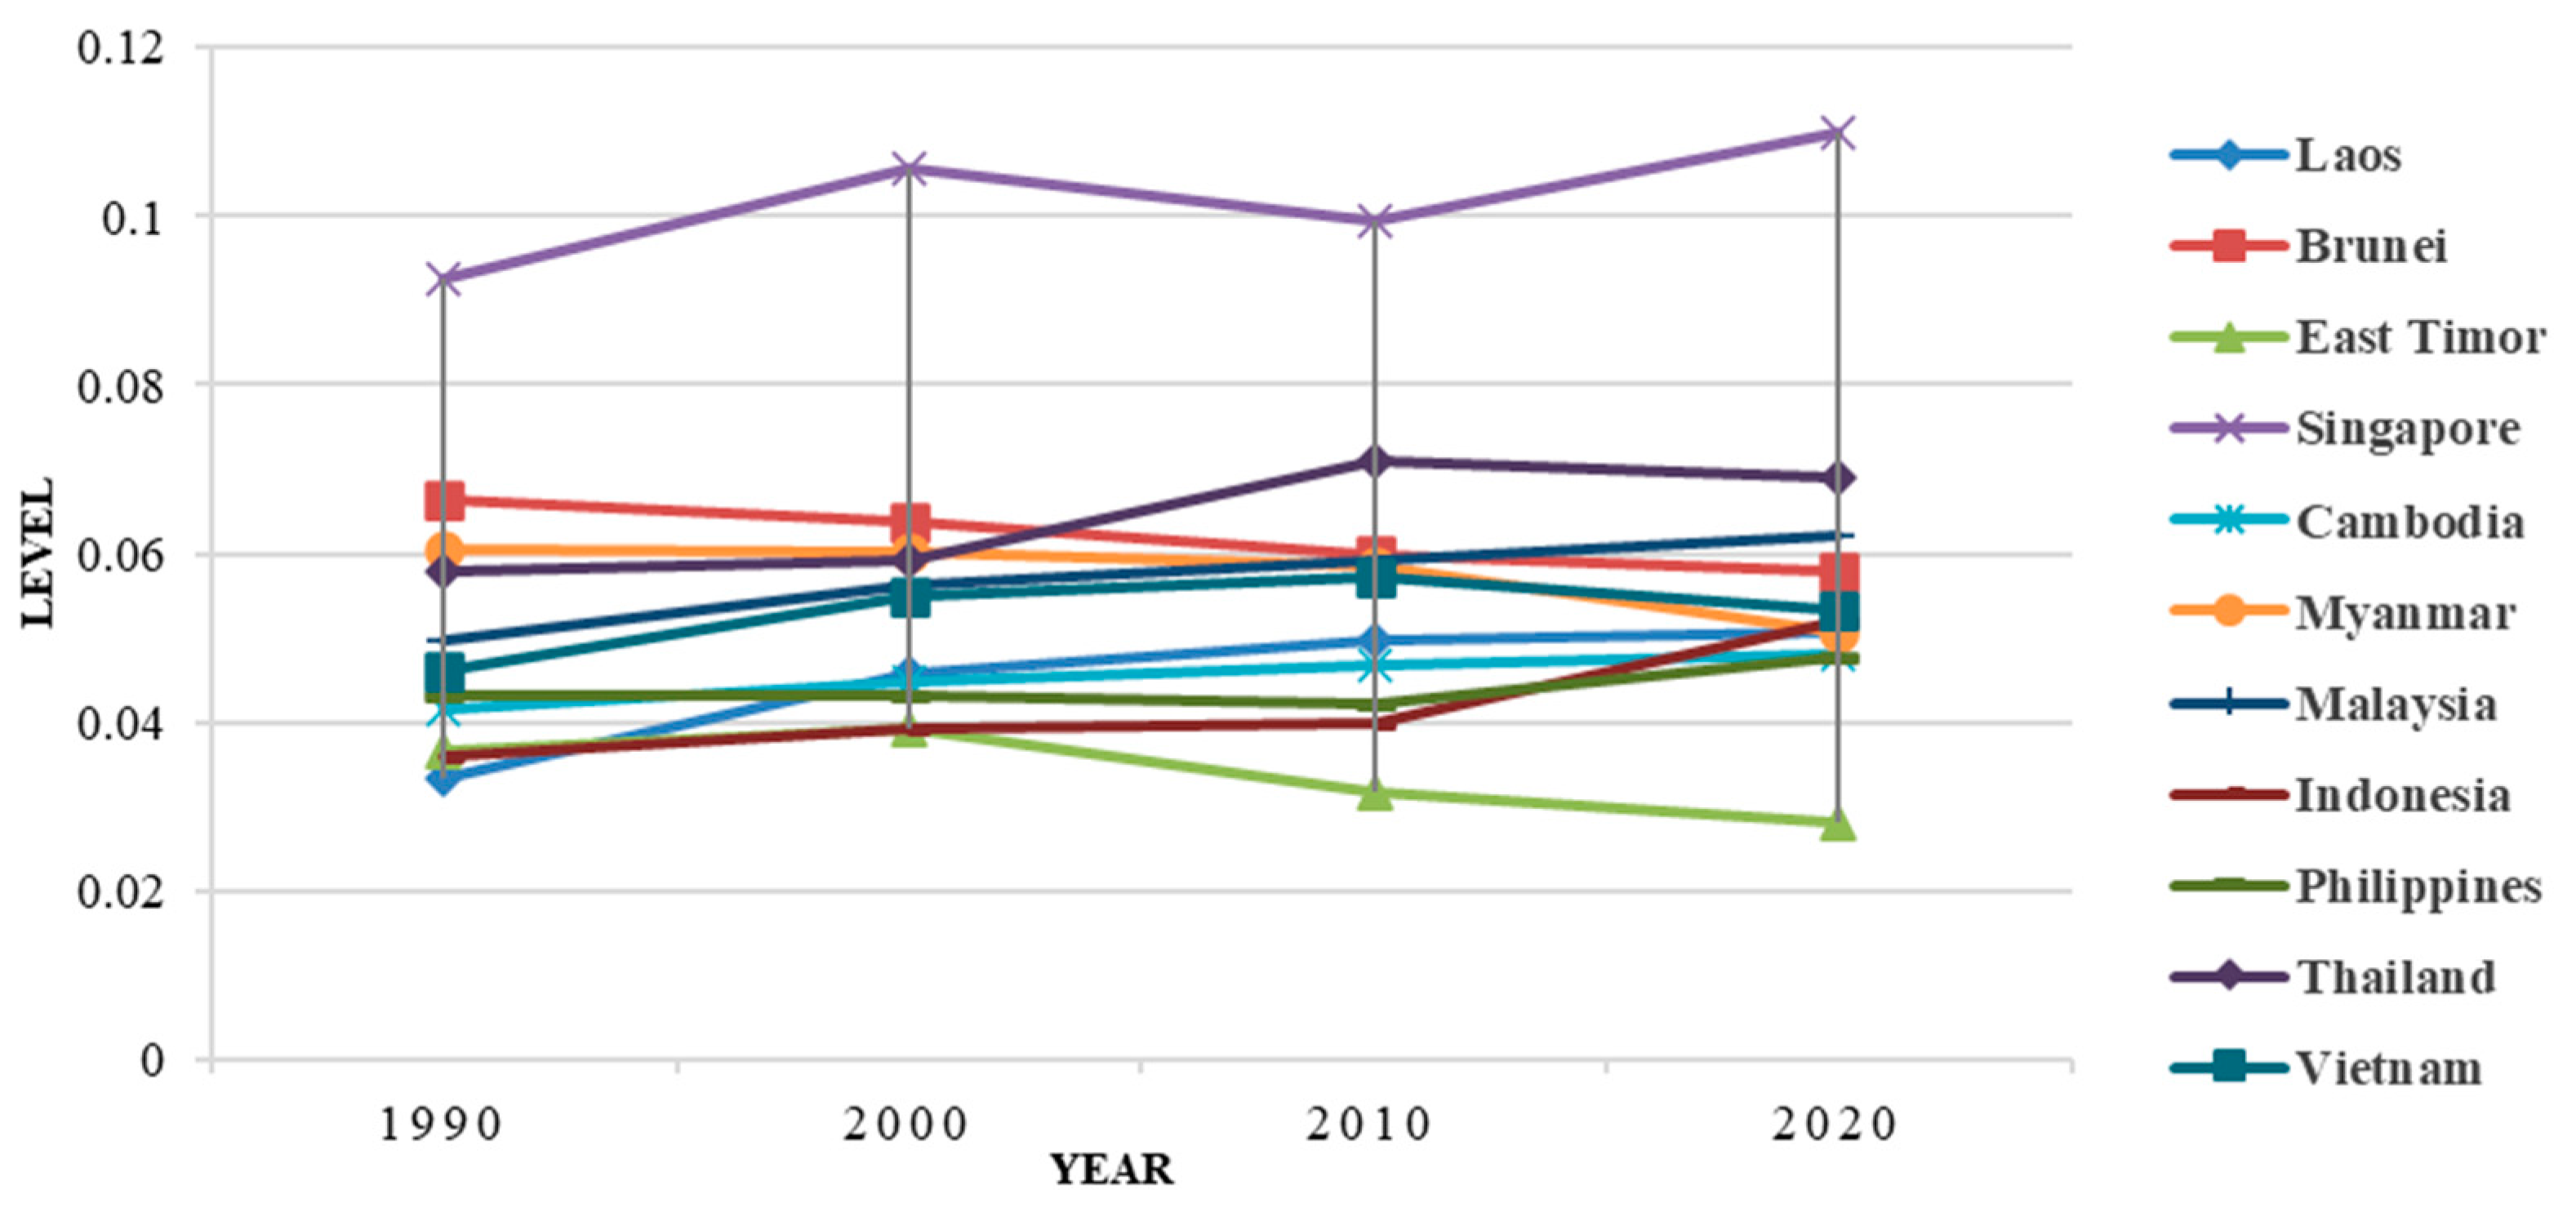
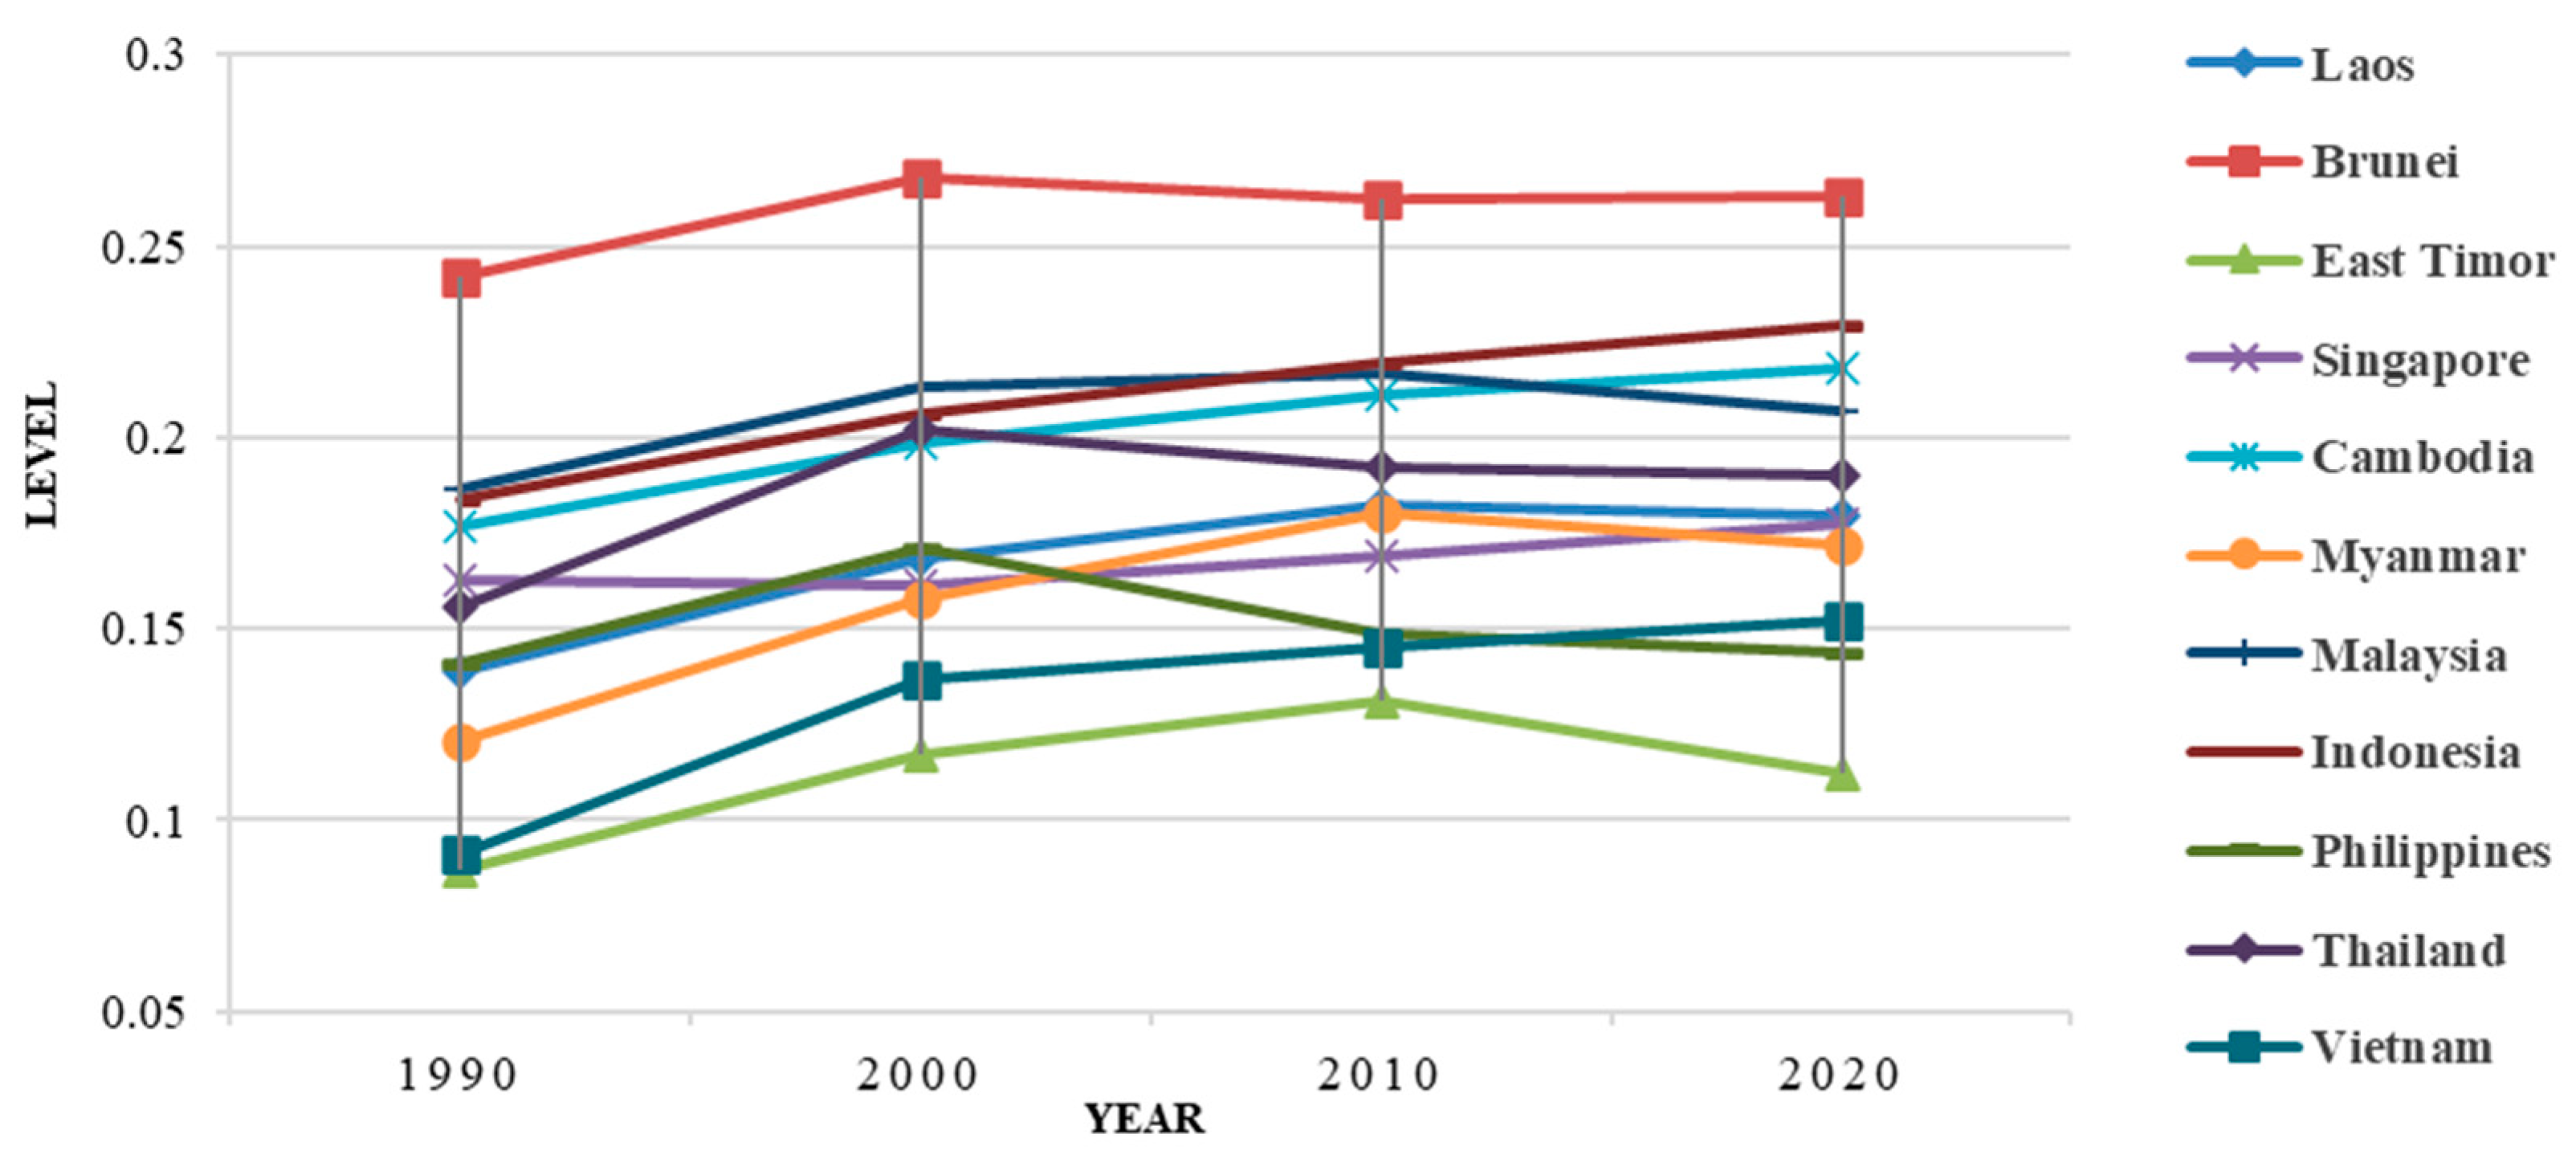
Figure 12a,c,e,g are natural resources, ecological environment, socio-economic, and resource and environment carrying capacity before correction. The Figure 12b,d,f,h are the corrected natural resources, ecological environment, socio-economy, and resource and environment carrying capacity.
Taking Brunei as an example, in the pre-correction result (Figure 12a,c,e,g), Brunei reports a high ranking in all aspects of carrying capacity, suggesting that its natural resources, ecological conditions, and level of socio-economic development can meet the needs of national development at a high sustainability level. However, the post-correction result (Figure 12b,d,f,h) shows a lower ranking for Brunei in carrying capacity, indicating a smaller population size it can carry with the same welfare benefits under current resource and environmental conditions. In the case of Indonesia, a large population country, its pre-correction and post-correction natural resource carrying capacity and ecological carrying capacity are ranked higher in 30 years. As for its socio-economic carrying capacity, its ranking is lower before correction and significantly higher after correction. The results indicate that the RECC assessment in this experimental model is more focused on observing a country’s per capita resource and environmental carrying capacity after correction.
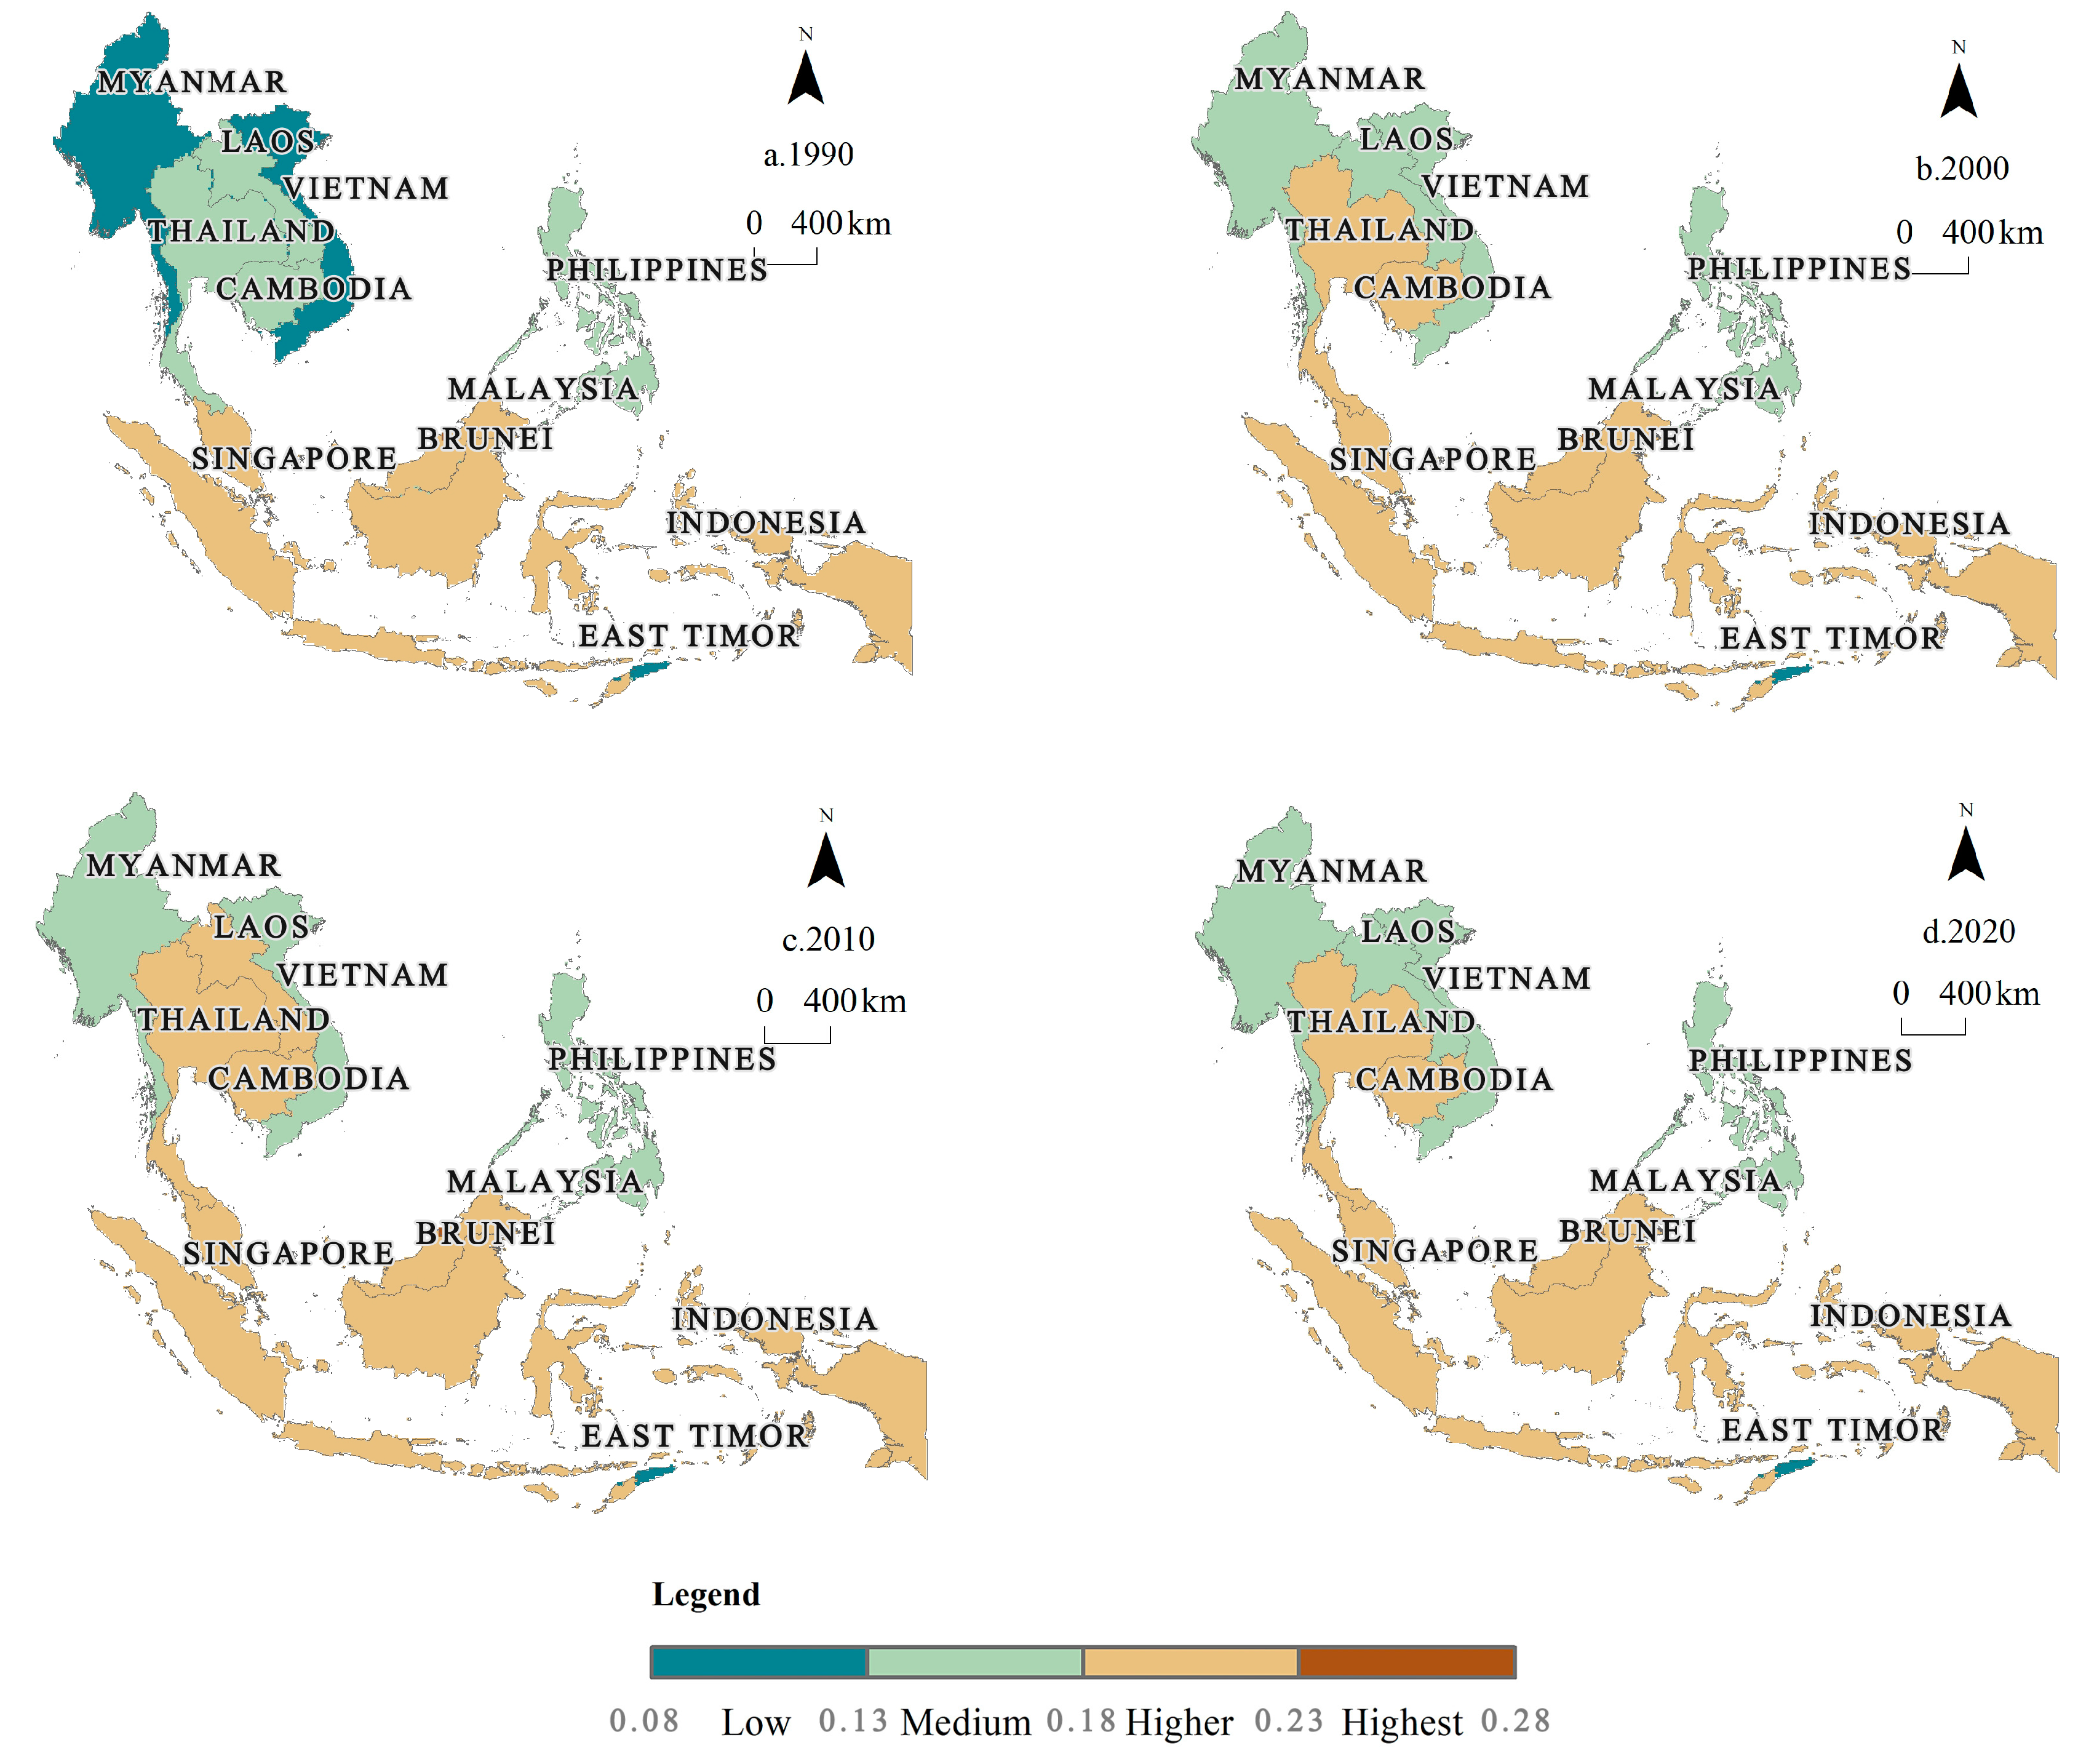
During these 30 years, all countries show an increasing trend in natural resource carrying capacity level except for the Philippines, East Timor, and Malaysia. Philippines has the fastest negative change rate of −34.37%, and Vietnam reports the highest positive change rate of 41.60% (Table A5). The ecological carrying capacity of Southeast Asia showed an upward trend, with only Singapore experiencing a relative deterioration in ecological conditions, while Vietnam and the Philippines showed the largest increase, with a rate of change of over 160%. During the 30 years, the socio-economic carrying capacity levels in most Southeast Asian regions showed an increasing trend, with only East Timor, Myanmar, and Brunei showing a decreasing trend. Among them, East Timor has the fastest decline, reaching −22.99%, while Indonesia and Laos have a rapid increase in socio-economic carrying capacity level, reaching 45%. The RECC levels in Southeast Asia have shown an upward trend, with relatively higher increases in Vietnam and Myanmar. After a simple linear projection, the RECC levels of most countries will still maintain an upward trend after 2020. The increasing trend is more evident in Singapore, Myanmar, Brunei, and Vietnam, while the RECC level in the Philippines has a decreasing trend.
After correction (Table A6), most countries maintain the increasing trend for 30 years, except Thailand, which has a decreasing trend with a rate of −11.07%. Based on (Table/Figure/our results …), Thailand’s resources and socio-economic aspects are the obstacle factors for its low RECC, while the small amount per capita is the main reason. From 2010 to 2020, most of the countries have a negative rate of change in RECC, which shows a decline in all aspects of resources, ecology, and economy.
During 1990–2020, for countries with better or worse pre- and post-correction rankings in the Southeast Asia RECC, such as Indonesia, the Philippines, Brunei, Singapore, and East Timor, specific analyses are discussed below.
First, Indonesia has a high level of natural resource carrying capacity, with a revised average carrying capacity of 170 and rich relative reserves, ranking among the highest in Southeast Asia, which can support a larger population and economic scale in the future. However, Indonesia is also extremely unevenly developed across regions within the country. The island of Java is home to 55% of the country’s population and contributes approximately 58.98% of GDP on only 6.6% of Indonesia’s surface area. The central and eastern islands occupy more than 60% of the land but constitutes only 17% of the GDP. In addition to the economic aspect, its capital, Jakarta, has suffered critical urban crises such as traffic congestion, urban pollution, ground subsidence, and flooding, which have taken a dramatic toll on the city’s economy, society, resources, and environment. For these serious resource and environmental problems, Indonesia also actively adopts strategies such as capital relocations to relieve some burden for Java. In the long run, this strategy is still more conducive to sustainable urban development. In addition, the socio-economic carrying capacity has changed by −1.30%, but the ecological carrying capacity has changed by 20.16%, which has been increasing. In the past ten years, Indonesia’s economy has developed rapidly, but the environmental damage has become more serious, making the ecological carrying capacity change from 20.16% growth to −0.81% decline. One of the major causes of environmental disasters in Indonesia is the problem of environmental management [69], i.e., neglecting the development of a balanced environment, which leads to destruction and pollution. Therefore, it is necessary to pay more attention to ecological protection, accelerating the transformation, upgrading industrial structures, and exploring the path of green development.
Secondly, the Philippines, whose pre-correction natural resource carrying capacity level ranks at the bottom, but the post-correction natural resource carrying capacity average is 43, ranking in the top three among Southeast Asian countries. It indicates that, while the total reserves are abundant, the carrying capacity is poor. There are many reasons for the decline in the natural resource carrying capacity in the Philippines, with the population being the main reason. In 2011, the Philippines continued to grow faster than the global average population growth rate of 1.19%, even more than India and China. Over the next 20 years, the Philippines will have the highest relative population growth in Southeast Asia [70]. The Philippines has adopted a family planning policy [71] to control population growth and has tried to bring in foreign investment and expand trade cooperation in response to the severe lack of infrastructure such as electricity. Although the Philippines is not well developed at the moment, it has great potential for future development. It has rich mineral and aquatic resources, as well as a large number of English-speaking labor force, and labor costs are significantly lower than the level of developed countries. In the World Economic Forum’s Global Competitiveness Report 2017–2018, the Philippines ranked the 56th among the most competitive countries and territories in the world [72].
Third, Brunei and Singapore are the only two developed countries in Southeast Asia with a high level of socio-economic development. Brunei takes the lead in all aspects of carrying capacity, and it has a large number of oil resources in the country, which has driven the development domestic social economy from all aspects and ensured its people’s well-being. However, it is worrying that some studies show that Brunei’s oil and gas reserves will be completed within 17 and 30 years [73]. Among Southeast Asian countries, its per capita GDP is only second to Singapore. A small population and a high per capita GDP can lead to a high carrying capacity level. Therefore, combining various resource reserves and other factors, Brunei does not have the advantages of RECC, and its total socio-economic volume can hardly carry a large population. This also applies to Singapore, even though its per capita GDP ranks the top in Southeast Asia. The electronics industry, petrochemical industry, precision engineering industry, and other high-tech industries are Singapore’s main industries. Singapore’s natural resources are relatively scarce and relies heavily on imports, making it a foreign trade-driven economy. Singapore’s ecological carrying capacity has declined over the last decade, at a decreasing rate of −8.46%. The decline is mainly due to land reclamation activities, which have significantly impacted the ecological environment [74]. Mangroves are an essential indicator of ecological status, but most of Singapore’s mangroves had disappeared by the 1990s. Other reef creatures, such as coral reefs, have also died in intense reclamation activities, and other aquatic species have been negatively affected by turbid waters. Notably, its growth trend in RECC has also slowed down, calling for more attention to ecological conservation aspects in future development.
Fourth, East Timor has an ideal ecological and environmental carrying capacity and has been developing in a good direction. While its socio-economic status, natural resources, and RECC are unfavorable, there is great potential for future development. The three main factors limit East Timor’s RECC are: (1) a weak national foundation, imperfect infrastructure, and a high dependence on external assistance in hydrocarbon and other development technologies; (2) a large population and a high birth rate make insufficient food supply even worse; and (3) its social activities of education are far behind from the world [75]. However, East Timor will get better, in the long run, giving its good ecological environment. Truthfully, the good ecological environment of East Timor is its crucial asset. In 2011, the National Development Strategic Plan 2011–2030, adopted by the Parliament of East Timor, clearly indicated the goals for the next 20 years regarding infrastructure development and investment attraction. This is a good signal for the further development of East Timor. However, East Timor should consider environmental protection in its economic development process and strive to develop green economy industries such as tourism to fill the domestic tourism gap and maximize ecological values and benefits. At the same time, attention should be paid to controlling the population size, vigorously developing education, cultivating modern technical personnel, and realizing strategies such as fewer and better births.

4.3. Comprehensive Evaluation Discussion

This study calculated the three subsystems of natural resources, ecology, and socio-economics for a comprehensive RECC assessment. Our evaluation method not only considers RECC in an integrated way as a reference for decision-making but also tracks the carrying capacity of its subsystems and their evolution. In this way, different perspectives were examined integratively and separately. A comparative analysis of the combined findings with other studies leads us to conclude that the present methodology is robust and efficient for supporting relevant decisions and studies.
With the rapid development of GIS and remote sensing technology, imagery at a high spatial and temporal resolution has become increasingly available to the public, providing solutions to data shortage to some extent. These technologies provide excellent technical support and visualization approaches for resource and environment-related evaluation, including urban ecological safety, habitat, and carrying capacity evaluation [50]. The comprehensive intelligent evaluation system integrating remote sensing, GIS, and big data in the future will definitely be a significant trend in the development of the information science field [49]. Some researchers have actively tried to apply RS and GIS technologies to evaluate the carrying capacity in recent years [16,50,76]. The development of remote sensing technology has provided the basis for and facilitated the regional comprehensive and dynamic analysis of geography. It also increases the value and effectiveness of the application of evaluation. Of course, remote sensing also has shortcomings. For example, the obtained after image interpretation and decoding is often a rough estimate, which can be different from the actual situation. Field sampling is needed to improve the accuracy rate. From the information obtained, remote sensing can only obtain intuitive visual messages, but not the social attributes of things.
In this study, the information extraction of mangroves, shoreline, reclamation, and surface undulation is inseparable from remote sensing technology and intelligent interpretation methods. The severe fragmentation of land parcels in Southeast Asia, the large number of islands, the inconvenience of transportation, and the poor socio-economic level in general, are more unfavorable to the acquisition of statistical information and make it difficult to conduct relevant scientific research. There are many other places in the world with similar situations as Southeast Asia, such as South Africa and India. Evaluations related to their sustainability can use this evaluation method, considering regional specificities and integrating remote sensing and statistical data to perform comprehensive assessments. In general, this study has significant feasibility and advantages in global scale sustainability evaluation.

4.4. Limitations and Future Work

This study has developed a RECC evaluation system with regional characteristics by integrating remote sensing data and making population corrections, which can obtain more scientific evaluation results. However, there are some shortcomings.
  • Regarding the indicator system, although the lack of data has been partially solved by using RS data, this evaluation system does not cover every aspect that affects the carrying capacity. In future studies, the interaction between human-land systems and their mechanisms of action will be considered in a more integrated way;
  • In the evaluation process, the inequality of development level and total resources and environment among countries can be solved by population correction, which is helpful to enhance the guiding significance of the results. However, the simple population correction, without the coupled coordination of economic scale, inevitably still has some shortcomings.

5. Conclusions

This paper constructs a comprehensive country-scale RECC-based evaluation system based on the basic principles of hierarchical analysis and implements it in 11 countries in Southeast Asia. The system consisted of 24 indicators, including three subsystems of natural resource endowment, ecological and environmental conditions, and socio-economic development. The selection of indicators takes into full consideration the regional characteristics, and RECC is measured by integrating remote sensing data in the context of data scarcity with population correction. In this regard, the weight of each indicator was calculated by using hierarchical analysis, and a comprehensive evaluation of the resource and environment carrying capacity of Southeast Asia from 1990 to 2020 was conducted by combining GIS technology and analyzing its spatial and temporal changes. The main conclusions can be drawn as follows:
  • A set of comprehensive evaluation index systems of resource and environment carrying capacity with regional characteristics were developed for a national-level evaluation. After comparing with the global evaluation of related sustainable development, it is found that the comprehensive evaluation method of resource and environmental carrying capacity proposed in this paper can provide a reference for sustainable development evaluation at the national level. It provides a good idea and case for solving the assessment in the context of unbalanced resource and environment conditions in different countries, and also provides some possibilities for the next step to carry out the evaluation of resource and environment carrying capacity of countries in different regions of the world in depth combined with GIS. Countries can support and optimize resource and environment-related policies and regulations by assessing the balance and coordination among the three subsystems of RECC. For example, the result can identify which resources are being used at unsustainable rates and help policymakers prioritize resource management efforts;
  • The main findings of the assessment are: (a) In terms of per capita level, most countries in Southeast Asia show a trend of increasing and then decreasing RECC, with lower RECC levels in the east and north, such as Myanmar and Vietnam, and higher levels in the west and south, such as Indonesia and Brunei. (b) In terms of absolute total, most countries in Southeast Asia show a slow increase in RECC, except for Thailand, which slightly decreases, with lower RECC in northern and central counties, such as Laos and Singapore, and higher in other regions, such as Indonesia and the Philippines;
  • Based on the results of the study, we draw the following policy recommendations. The decline in the RECC levels in Southeast Asia over the last decade is strongly related to its relatively rapid population growth, and the government authorities may be able to improve the regulation of population numbers. Countries with good per capita RECC levels but small totals, such as Singapore and Brunei, are less resilient to external adverse environmental changes, so they should always adhere to and improve ecological conservation-related strategies. Countries with poorer per capita RECC but with the larger total population, such as the Philippines and Vietnam, in the development process, should adhere to the green economic growth mode and give full play to the advantages of their marine resources to better realize the sustainable development of the region.

Author Contributions

Conceptualization, X.Z. and Z.W.; methodology, Z.W., X.Z. and S.Z.; software, D.M. and X.Z.; validation, K.G. and X.Z.; formal analysis, X.Z.; investigation, X.Z.; resources, Y.D.; data curation, Y.D. and D.M.; writing—original draft preparation, X.Z.; writing—review and editing, X.Y., Z.W. and S.Z.; visualization, X.Z.; supervision, Z.W., X.Y. and S.Z.; project administration, X.Y. and Z.W.; funding acquisition, X.Y., Z.W. and S.Z. All authors have read and agreed to the published version of the manuscript.

Funding

This research was funded by the National Key R&D Program of China (Grant No. 2021YFB3900501); the National Natural Science Foundation of China (Grant No. 42071281; 41901354); Key program of International Cooperation, Bureau of International Cooperation, Chinese Academy of Sciences (Grant No. 131551KYSB20210030); Key Project of Innovation LREIS (KPI001) and Youth Project of Innovation LREIS (YPI004).

Data Availability Statement

Not applicable.

Acknowledgments

We would like to express our respect and gratitude to the anonymous reviewers and editors for their valuable comments and suggestions. We also thank Feilin Lai for content and language assistance with this manuscript.

Conflicts of Interest

The authors declare no conflict of interest.

Appendix A

Table A1. Original calculated values of natural resource carrying capacity in Southeast Asia, 1990–2020.
Country1990 Carrying Capacity2000 Carrying Capacity2010 Carrying Capacity2020 Carrying Capacity1990–2020 Rate of Change
Philippines0.2109000.2202550.1633900.138419−34.37%
East Timor0.0974010.1093770.1337960.091572−5.99%
Malaysia0.2307110.2417720.2430380.218377−5.35%
Brunei0.2816700.2978900.2901930.2860081.54%
Thailand0.2237360.2717410.2434970.2374426.13%
Singapore0.1948600.1877290.2016000.22205613.96%
Cambodia0.2467900.2455780.2642800.28600915.89%
Laos0.1713750.1851980.2117960.20572220.04%
Indonesia0.2390100.2496670.2704080.28774920.39%
Myanmar0.1513610.1812120.2204850.20382934.66%
Vietnam0.1203190.1578860.1649570.17036841.60%
Table A2. Original calculated values of ecological carrying capacity in Southeast Asia, 1990–2020.
Country1990 Carrying Capacity2000 Carrying Capacity2010 Carrying Capacity2020 Carrying Capacity1990–2020 Rate of Change
Singapore0.1410720.1436930.1457380.134087−4.95%
Brunei0.2528440.3067520.3029100.31287523.74%
Indonesia0.1574620.2074620.2132060.21048733.68%
Malaysia0.1735380.2337090.2404630.24989044.00%
Laos0.1319010.1923790.1914430.19163745.29%
Cambodia0.1233860.1880780.1950900.18138347.00%
Myanmar0.0969010.1610920.1665460.17136476.84%
Thailand0.0888820.1522490.1616280.16479785.41%
East Timor0.0922110.1618490.1684180.18064795.91%
Vietnam0.0631380.1385390.1510590.164332160.27%
Philippines0.0721500.1471640.1693560.192801167.22%
Table A3. Original calculated values of socio-economic carrying capacity in Southeast Asia, 1990–2020.
Country1990 Carrying Capacity2000 Carrying Capacity2010 Carrying Capacity2020 Carrying Capacity1990–2020 Rate of Change
East Timor0.0365600.0391590.0316600.028154−22.99%
Myanmar0.0604020.0602850.0585170.050829−15.85%
Brunei0.0664780.0638170.0597740.057877−12.94%
Philippines0.0430900.0430370.0419910.04774410.80%
Vietnam0.0462420.0548530.0573130.05339715.47%
Cambodia0.0416250.0447790.0467560.04817315.73%
Singapore0.0926840.1055810.0993140.10989518.57%
Thailand0.0578650.0592880.0710010.06904519.32%
Malaysia0.0498040.0560940.0592080.06201124.51%
Indonesia0.0359750.0393090.0400110.05201844.60%
Laos0.0331760.0455930.0497010.05052652.30%
Table A4. Original calculated values of RECC in Southeast Asia, 1990–2020.
Country1990 Carrying Capacity2000 Carrying Capacity2010 Carrying Capacity2020 Carrying Capacity1990–2020 Rate of Change
Laos0.1389410.1680780.1823790.17935329.09%
Brunei0.2420160.2681300.2622260.2630658.70%
East Timor0.0871720.1170100.1310360.11232728.86%
Singapore0.1626920.1616000.1687270.1771268.87%
Cambodia0.1770920.1984030.2108820.21799123.09%
Myanmar0.1205400.1576220.1799170.17165542.40%
Malaysia0.1864230.2131460.2164950.20700511.04%
Indonesia0.1835280.2062430.2191980.22912324.84%
Philippines0.1413180.1711910.1484100.1438291.78%
Thailand0.1557190.2023240.1921710.18975621.86%
Vietnam0.0909530.1370540.1452930.15201567.14%
Table A5. Rate of change of resource environment and subsystems before correction.
CountryRate of Change of Natural ResourcesRate of Change of Ecological EnvironmentSocio-Economic Change RateRate of Change of Resources and Environment
1990–20202010–20201990–20101990–20202010–20201990–20101990–20202010–20201990–20101990–20202010–20201990–2010
East Timor−5.99%−31.56%37.37%95.91%7.26%83%−22.99%−11.08%−13.40%28.86%−14.28%50.32%
Philippines−34.37%−15.28%−22.53%167.22%13.84%135%10.80%13.70%−2.55%1.78%−3.09%5.02%
Cambodia15.89%8.22%7.09%47.00%−7.03%58%15.73%3.03%12.32%23.09%3.37%19.08%
Laos20.04%−2.87%23.59%45.29%0.10%45%52.30%1.66%49.81%29.09%−1.66%31.26%
Malaysia−5.35%−10.15%5.34%44.00%3.92%39%24.51%4.73%18.88%11.04%−4.38%16.13%
Myanmar34.66%−7.55%45.67%76.84%2.89%72%−15.85%−13.14%−3.12%42.40%−4.59%49.26%
Thailand6.13%−2.49%8.83%85.41%1.96%82%19.32%−2.76%22.70%21.86%−1.26%23.41%
Brunei1.54%−1.44%3.03%23.74%3.29%20%−12.94%−3.17%−10.08%8.70%0.32%8.35%
Singapore13.96%10.15%3.46%−4.95%−7.99%3%18.57%10.65%7.15%8.87%4.98%3.71%
Vietnam41.60%3.28%37.10%160.27%8.79%139%15.47%−6.83%23.94%67.14%4.63%59.74%
Indonesia20.39%6.41%13.14%33.68%−1.28%35%44.60%30.01%11.22%24.84%4.53%19.44%
Table A6. Rate of change of resource environment and subsystems after correction.
CountryRate of Change of Natural ResourcesRate of Change of Ecological EnvironmentSocio-Economic Change RateRate of Change of Resources and Environment
1990–20202010–20201990–20101990–20202010–20201990–20101990–20202010–20201990–20101990–20202010–20201990–2010
East Timor−26.70%35.53%107.02%14.88%80.20%−18.62%−4.76%−14.56%36.17%−8.19%48.31%−26.70%
Philippines−12.24%−21.70%179.78%17.94%137.22%16.00%17.79%−1.51%6.56%0.40%6.14%−12.24%
Cambodia12.30%13.67%61.93%−3.52%67.84%27.48%6.92%19.23%35.59%7.27%26.40%12.30%
Laos0.46%20.73%46.79%3.53%41.79%53.87%5.14%46.35%30.42%1.71%28.23%0.46%
Malaysia−8.41%9.72%52.87%5.92%44.32%32.18%6.75%23.82%17.88%−2.54%20.95%−8.41%
Myanmar−11.69%18.71%37.66%−1.72%40.06%−34.49%−17.03%−21.05%10.85%−8.87%21.63%−11.69%
Thailand−10.02%−13.92%35.32%−5.91%43.82%−12.92%−10.26%−2.96%−11.07%−8.88%−2.40%−10.02%
Brunei−1.44%3.03%23.74%3.29%19.80%−12.94%−3.17%−10.08%8.70%0.32%8.35%−1.44%
Singapore9.59%14.75%4.88%−8.46%14.58%30.84%10.09%18.84%20.14%4.44%15.02%9.59%
Indonesia6.92%0.40%19.19%−0.81%20.16%28.93%30.63%−1.30%11.31%5.02%5.99%6.92%
Vietnam1.52%18.09%120.36%6.93%106.07%−2.23%−8.42%6.75%41.51%2.85%37.59%1.52%
Table A7. Sustainable ranking of RECC with NSDI and HDI in Southeast Asia (11 countries).
CountryNSDIHDIBefore CorrectionAfter Correction
1990RECC12000RECC12010RECC12020RECC11990RECC22000RECC22010RECC22020RECC2
Singapore30758879999
Brunei 4136111111111111
Laos4411787668888
Cambodia5912645437777
Indonesia649833221111
Malaysia735622346666
Thailand757764552334
Vietnam799910101094443
Philippines8094769103222
Myanmar8212799785555
East Timor951111111111110101010

References

  1. Khan, S.A.R. The nexus between carbon emissions, poverty, economic growth, and logistics operations-empirical evidence from southeast Asian countries. Environ. Sci. Pollut. Res. 2019, 26, 13210–13220. [Google Scholar] [CrossRef] [PubMed]
  2. Nathaniel, S.; Khan, S.A.R. The nexus between urbanization, renewable energy, trade, and ecological footprint in ASEAN countries. J. Clean. Prod. 2020, 272, 122709. [Google Scholar] [CrossRef]
  3. Ahmad, F.; Draz, M.U.; Chandio, A.A.; Su, L.; Ahmad, M.; Irfan, M. Investigating the myth of smokeless industry: Environmental sustainability in the ASEAN countries and the role of service sector and renewable energy. Environ. Sci. Pollut. Res. 2021, 28, 55344–55361. [Google Scholar] [CrossRef] [PubMed]
  4. Tang, J.; Zhu, H.-l.; Liu, Z.; Jia, F.; Zheng, X.-x. Urban Sustainability Evaluation under the Modified TOPSIS Based on Grey Relational Analysis. Int. J. Environ. Res. Public Health 2019, 16, 256. [Google Scholar] [CrossRef] [Green Version]
  5. Barnard, S.; Elliott, M. The 10-tenets of adaptive management and sustainability: An holistic framework for understanding and managing the socio-ecological system. Environ. Sci. Policy 2015, 51, 181–191. [Google Scholar] [CrossRef]
  6. Allen, C.; Reid, M.; Thwaites, J.; Glover, R.; Kestin, T. Assessing national progress and priorities for the Sustainable Development Goals (SDGs): Experience from Australia. Sustain. Sci. 2020, 15, 521–538. [Google Scholar] [CrossRef]
  7. Allen, C.; Metternicht, G.; Wiedmann, T. Initial progress in implementing the Sustainable Development Goals (SDGs): A review of evidence from countries. Sustain. Sci. 2018, 13, 1453–1467. [Google Scholar] [CrossRef]
  8. Feng, Z.; Yang, Y.; Yan, H.; Pan, T.; Li, P. A review of resources and environment carrying capacity research since the 20th Century: From theory to practice. Resour. Sci. 2017, 39, 379–395. [Google Scholar]
  9. Gao, Q.; Fang, C.; Cui, X. Carrying capacity for SDGs: A review of connotation evolution and practice. Environ. Impact Assess. Rev. 2021, 91, 106676. [Google Scholar] [CrossRef]
  10. Feng, Z.; Li, P. The Genesis and Evolution of the Concept of Carrying Capacity: A View of Natural Resources and Environment. J. Nat. Resour. 2018, 33, 1475–1486. [Google Scholar]
  11. Wang, T.; Xu, S. Dynamic successive assessment method of water environment carrying capacity and its application. Ecol. Indic. 2015, 52, 134–146. [Google Scholar] [CrossRef]
  12. Gao, Q.; Fang, C.; Liu, H.; Zhang, L. Conjugate evaluation of sustainable carrying capacity of urban agglomeration and multi-scenario policy regulation. Sci. Total Environ. 2021, 785, 147373. [Google Scholar] [CrossRef] [PubMed]
  13. Malthus, T.R.; Winch, D.; James, P. Malthus: An Essay on the Principle of Population; Cambridge University Press: Cambridge, UK, 1992. [Google Scholar]
  14. Wu, X.L.; Hu, F. Analysis of ecological carrying capacity using a fuzzy comprehensive evaluation method. Ecol. Indic. 2020, 113, 106243. [Google Scholar] [CrossRef]
  15. Zhu, M.C.; Shen, L.Y.; Tam, V.W.Y.; Liu, Z.; Shu, T.H.; Luo, W.Z. A load-carrier perspective examination on the change of ecological environment carrying capacity during urbanization process in China. Sci. Total Environ. 2020, 714, 17. [Google Scholar] [CrossRef] [PubMed]
  16. Wu, T.; Sang, S.; Wang, S.; Yang, Y.; Li, M. Remote sensing assessment and spatiotemporal variations analysis of ecological carrying capacity in the Aral Sea Basin. Sci. Total Environ. 2020, 735, 139562. [Google Scholar] [CrossRef] [PubMed]
  17. Pata, U.K.; Isik, C. Determinants of the load capacity factor in China: A novel dynamic ARDL approach for ecological footprint accounting. Resour. Policy 2021, 74, 102313. [Google Scholar] [CrossRef]
  18. Prato, T. Fuzzy adaptive management of social and ecological carrying capacities for protected areas. J. Environ. Manag. 2009, 90, 2551–2557. [Google Scholar] [CrossRef]
  19. Ruan, W.Q.; Li, Y.Q.; Zhang, S.N.; Liu, C.H. Evaluation and drive mechanism of tourism ecological security based on the DPSIR-DEA model. Tour. Manag. 2019, 75, 609–625. [Google Scholar] [CrossRef]
  20. Cupul-Magana, A.L.; Rodriguez-Troncoso, A.P. Tourist carrying capacity at Islas Marietas National Park: An essential tool to protect the coral community. Appl. Geogr. 2017, 88, 15–23. [Google Scholar] [CrossRef]
  21. Zhang, J.; Zhang, C.; Shi, W.; Fu, Y. Quantitative evaluation and optimized utilization of water resources-water environment carrying capacity based on nature-based solutions. J. Hydrol. 2019, 568, 96–107. [Google Scholar] [CrossRef]
  22. Zhou, X.-Y.; Zheng, B.; Khu, S.-T. Validation of the hypothesis on carrying capacity limits using the water environment carrying capacity. Sci. Total Environ. 2019, 665, 774–784. [Google Scholar] [CrossRef] [PubMed]
  23. He, Y.; Wang, Z. Water-land resource carrying capacity in China: Changing trends, main driving forces, and implications. J. Clean. Prod. 2022, 331, 130003. [Google Scholar] [CrossRef]
  24. Wang, Y.; Zhou, X.; Engel, B. Water environment carrying capacity in Bosten Lake basin. J. Clean. Prod. 2018, 199, 574–583. [Google Scholar] [CrossRef]
  25. Yang, Z.; Song, J.; Cheng, D.; Xia, J.; Li, Q.; Ahamad, M.I. Comprehensive evaluation and scenario simulation for the water resources carrying capacity in Xi’an city, China. J. Environ. Manag. 2019, 230, 221–233. [Google Scholar] [CrossRef] [PubMed]
  26. Shang, Y.F.; Razzaq, A.; Chupradit, S.; An, N.B.; Abdul-Samad, Z. The role of renewable energy consumption and health expenditures in improving load capacity factor in ASEAN countries: Exploring new paradigm using advance panel models. Renew. Energy 2022, 191, 715–722. [Google Scholar] [CrossRef]
  27. Lane, M.; Dawes, L.; Grace, P. The essential parameters of a resource-based carrying capacity assessment model: An Australian case study. Ecol. Model. 2014, 272, 220–231. [Google Scholar] [CrossRef] [Green Version]
  28. Wang, R.; Cheng, J.; Zhu, Y.; Lu, P. Evaluation on the coupling coordination of resources and environment carrying capacity in Chinese mining economic zones. Resour. Policy 2017, 53, 20–25. [Google Scholar] [CrossRef]
  29. Kessler, J.J. Usefulness of the human carrying capacity concept in assessing ecological sustainability of land-use in semi-arid regions. Agric. Ecosyst. Environ. 1994, 48, 273–284. [Google Scholar] [CrossRef]
  30. Graymore, M.L.M.; Sipe, N.G.; Rickson, R.E. Sustaining Human Carrying Capacity: A tool for regional sustainability assessment. Ecol. Econ. 2010, 69, 459–468. [Google Scholar] [CrossRef]
  31. Cohen, J.E. Population Growth and Earth’s Human Carrying Capacity. Science 1995, 269, 341–346. [Google Scholar] [CrossRef] [Green Version]
  32. Weitzman, J.; Filgueira, R. The evolution and application of carrying capacity in aquaculture: Towards a research agenda. Rev. Aquac. 2020, 12, 1297–1322. [Google Scholar] [CrossRef]
  33. Cisneros, M.A.H.; Sarmiento, N.V.R.; Delrieux, C.A.; Piccolo, M.C.; Perillo, G.M.E. Beach carrying capacity assessment through image processing tools for coastal management. Ocean. Coast. Manag. 2016, 130, 138–147. [Google Scholar] [CrossRef]
  34. Shen, L.; Shu, T.; Liao, X.; Yang, N.; Ren, Y.; Zhu, M.; Cheng, G.; Wang, J. A new method to evaluate urban resources environment carrying capacity from the load-and-carrier perspective. Resour. Conserv. Recycl. 2020, 154, 104616. [Google Scholar] [CrossRef]
  35. Sun, T.; Feng, Z.; Yang, Y.; Lin, Y.; Wu, Y. Research on Land Resource Carrying Capacity: Progress and Prospects. J. Resour. Ecol. 2018, 9, 331–340. [Google Scholar]
  36. Feng, Z.; Sun, T.; Yang, Y.; Yan, H. The Progress of Resources and Environment Carrying Capacity: From Single-factor Carrying Capacity Research to Comprehensive Research. J. Resour. Ecol. 2018, 9, 125–134. [Google Scholar]
  37. Zhang, F.; Wang, Y.; Ma, X.J.; Wang, Y.; Yang, G.C.; Zhu, L. Evaluation of resources and environmental carrying capacity of 36 large cities in China based on a support-pressure coupling mechanism. Sci. Total Environ. 2019, 688, 838–854. [Google Scholar] [CrossRef]
  38. Wei, L.Y.; Jin, C.; Lu, Y.Q. Exploring resources and environmental carrying capacities at the county level: A case study of China’s Fengxian County. PLoS ONE 2019, 14, e0225683. [Google Scholar] [CrossRef] [Green Version]
  39. Wang, A.Y.; Liao, X.Y.; Tong, Z.J.; Du, W.L.; Zhang, J.Q.; Liu, X.P.; Guo, E.L.; Liu, M.S. Spatiotemporal variation of ecological carrying capacity in Dongliao River Basin, China. Ecol. Indic. 2022, 135, 108548. [Google Scholar] [CrossRef]
  40. Tehrani, N.A.; Makhdoum, M.F. Implementing a spatial model of Urban Carrying Capacity Load Number (UCCLN) to monitor the environmental loads of urban ecosystems. Case study: Tehran metropolis. Ecol. Indic. 2013, 32, 197–211. [Google Scholar] [CrossRef]
  41. Irankhahi, M.; Jozi, S.A.; Farshchi, P.; Shariat, S.M.; Liaghati, H. Combination of GISFM and TOPSIS to evaluation of Urban Environment Carrying Capacity (Case study: Shemiran City, Iran). Int. J. Environ. Sci. Technol. 2017, 14, 1317–1332. [Google Scholar] [CrossRef]
  42. Wang, S.; Xu, L.; Yang, F.; Wang, H. Assessment of water ecological carrying capacity under the two policies in Tieling City on the basis of the integrated system dynamics model. Sci. Total Environ. 2014, 472, 1070–1081. [Google Scholar] [CrossRef]
  43. Wu, M.; Wu, J.; Zang, C. A comprehensive evaluation of the eco-carrying capacity and green economy in the Guangdong-Hong Kong-Macao Greater Bay Area, China. J. Clean. Prod. 2021, 281, 124945. [Google Scholar] [CrossRef]
  44. Xu, X.; Zhang, Z.; Long, T.; Sun, S.; Gao, J. Mega-city region sustainability assessment and obstacles identification with GIS-entropy-TOPSIS model: A case in Yangtze River Delta urban agglomeration, China. J. Clean. Prod. 2021, 294, 126147. [Google Scholar] [CrossRef]
  45. Collins, A.; Galli, A.; Patrizi, N.; Pulselli, F.M. Learning and teaching sustainability: The contribution of Ecological Footprint calculators. J. Clean. Prod. 2018, 174, 1000–1010. [Google Scholar] [CrossRef]
  46. Liang, L.; Lal, R.; Wu, W.; Ridoutt, B.G.; Du, Z.; Li, L.; Feng, D.; Wang, L.; Peng, P.; Hang, S.; et al. The water footprint and validity analysis of ecological engineering in North Beijing, China. J. Clean. Prod. 2018, 172, 1899–1909. [Google Scholar] [CrossRef]
  47. Liu, K.; Xie, X.; Zhou, Q. Research on the Influencing Factors of Urban Ecological Carrying Capacity Based on a Multiscale Geographic Weighted Regression Model: Evidence from China. Land 2021, 10, 1313. [Google Scholar] [CrossRef]
  48. Sun, C.W.; Chen, L.T.; Tian, Y. Study on the urban state carrying capacity for unbalanced sustainable development regions: Evidence from the Yangtze River Economic Belt. Ecol. Indic. 2018, 89, 150–158. [Google Scholar] [CrossRef]
  49. Shi, Y.; Wang, H.; Yin, C. Evaluation method of urban land population carrying capacity based on GIS-A case of Shanghai, China. Comput. Environ. Urban Syst. 2013, 39, 27–38. [Google Scholar] [CrossRef]
  50. Pu, J.W.; Zhao, X.Q.; Miao, P.P.; Li, S.N.; Tan, K.; Wang, Q.; Tang, W. Integrating multisource RS data and GIS techniques to assist the evaluation of resource-environment carrying capacity in karst mountainous area. J. Mt. Sci. 2020, 17, 2528–2547. [Google Scholar] [CrossRef]
  51. Świąder, M.; Lin, D.; Szewrański, S.; Kazak, J.K.; Iha, K.; van Hoof, J.; Belčáková, I.; Altiok, S. The application of ecological footprint and biocapacity for environmental carrying capacity assessment: A new approach for European cities. Environ. Sci. Policy 2020, 105, 56–74. [Google Scholar] [CrossRef]
  52. Long, Y. Research on the Evaluation of the Carrying Capacity of China’s Resources and Environment; JiLin University of Finance and Economics: Changchun, China, 2019. [Google Scholar]
  53. Zheng, F.Y.; Xiao, C.W.; You, Z.; Feng, Z.M. Evaluating the Resources and Environmental Carrying Capacity in Laos Using a Three-Dimensional Tetrahedron Model. Int. J. Environ. Res. Public Health 2022, 19, 18. [Google Scholar] [CrossRef] [PubMed]
  54. Zhang, M.; Liu, Y.; Wu, J.; Wang, T. Index system of urban resource and environment carrying capacity based on ecological civilization. Environ. Impact Assess. Rev. 2018, 68, 90–97. [Google Scholar] [CrossRef]
  55. Wang, S.H.; Wang, X.Q.; Lu, B.B. Is resource abundance a curse for green economic growth? Evidence from developing countries. Resour. Policy 2022, 75, 102533. [Google Scholar] [CrossRef]
  56. Du, W.P.; Yan, H.M.; Feng, Z.M.; Zhang, C.; Yang, Y.Z. Spatio-temporal Pattern of Ecosystem Pressure in Countries Along the Belt and Road: Combining Remote Sensing Data and Statistical Data. Chin. Geogr. Sci. 2022, 32, 745–758. [Google Scholar] [CrossRef]
  57. Kong, Z.F. A Comprehensive Evaluation Approach to Measure Sustainable Development of Countries. In Proceedings of the 2016 International Conference on Modeling, Simulation and Optimization Technologies and Applications (MSOTA2016), Xiamen, China, 18–19 December 2016; Volume 58, pp. 364–368. [Google Scholar]
  58. Ait-Aoudia, M.N.; Berezowska-Azzag, E. Water resources carrying capacity assessment: The case of Algeria’s capital city. Habitat Int. 2016, 58, 51–58. [Google Scholar] [CrossRef]
  59. Martire, S.; Castellani, V.; Sala, S. Carrying capacity assessment of forest resources: Enhancing environmental sustainability in energy production at local scale. Resour. Conserv. Recycl. 2015, 94, 11–20. [Google Scholar] [CrossRef]
  60. Sevegnani, F.; Giannetti, B.F.; Agostinho, F.; Almeida, C.M.V.B. Assessment of municipal potential prosperity, carrying capacity and trade. J. Clean. Prod. 2017, 153, 425–434. [Google Scholar] [CrossRef]
  61. Jin, H.; Qian, X.Y.; Chin, T.C.; Zhang, H.J. A Global Assessment of Sustainable Development Based on Modification of the Human Development Index via the Entropy Method. Sustainability 2020, 12, 3251. [Google Scholar] [CrossRef] [Green Version]
  62. NASA/METI/AIST/Japan Spacesystems; U.S./Japan ASTER Science Team. ASTER Global Digital Elevation Model V003 [Data Set]; NASA EOSDIS Land Processes DAAC: Sioux Falls, SD, USA, 2019. [CrossRef]
  63. Huang, X.; Li, J.; Yang, J.; Zhang, Z.; Li, D.; Liu, X. 30 m global impervious surface area dynamics and urban expansion pattern observed by Landsat satellites: From 1972 to 2019. Sci. China Earth Sci. 2021, 64, 1922–1933. [Google Scholar] [CrossRef]
  64. Xiao, H.; Su, F.; Fu, D.; Yu, H.; Ju, C.; Pan, T.; Kang, L. 10-M Global Mangrove Classification Products of 2018-2020 Based on Big Data. In Science Data Bank: 2021; Computer Network Information Center, Chinese Academy of Sciences: Beijing, China, 2021. [Google Scholar]
  65. Ding, Y.; Yang, X.; Jin, H.; Wang, Z.; Liu, Y.; Liu, B.; Zhang, J.; Liu, X.; Gao, K.; Meng, D. Monitoring Coastline Changes of the Malay Islands Based on Google Earth Engine and Dense Time-Series Remote Sensing Images. Remote Sens. 2021, 13, 3842. [Google Scholar] [CrossRef]
  66. Zhou, J.Y.; Chang, S.S.; Ma, W.Q.; Wang, D.Y. An unbalance-based evaluation framework on urban resources and environment carrying capacity. Sustain. Cities Soc. 2021, 72, 103019. [Google Scholar] [CrossRef]
  67. Shen, L.-Y.; Ochoa, J.J.; Shah, M.N.; Zhang, X. The application of urban sustainability indicators—A comparison between various practices. Habitat Int. 2011, 35, 17–29. [Google Scholar] [CrossRef]
  68. Zarghami, E.; Fatourehchi, D. Comparative analysis of rating systems in developing and developed countries: A systematic review and a future agenda towards a region-based sustainability assessment. J. Clean. Prod. 2020, 254, 120024. [Google Scholar] [CrossRef]
  69. Yahman, Y.; Setyagama, A. Government policy in regulating the environment for development of sustainable environment in Indonesia. Environ. Dev. Sustain. 2022, 1–12. [Google Scholar] [CrossRef]
  70. Talabis, D.A.; Manay, E.J.; Babierra, A.; Flores, J.J.; Rabajante, J. A Numerical Model of Philippine Population Growth: Child Policy, Quantitative Insights and Challenges; University Library of Munich: Munich, Germany, 2013. [Google Scholar]
  71. Lee, K.; Lush, L.; Walt, G.; Cleland, J. Family planning policies and programmes in eight low-income countries: A comparative policy analysis. Soc. Sci. Med. 1998, 47, 949–959. [Google Scholar] [CrossRef] [PubMed]
  72. Global Investment Competitiveness Report 2017/2018: Foreign Investor Perspectives and Policy Implications; The World Bank: Washington, DC, USA, 2017; p. 182.
  73. Ahmed, A.; Bakar, M.S.A.; Azad, A.K.; Sukri, R.S.; Mahlia, T.M.I. Potential thermochemical conversion of bioenergy from Acacia species in Brunei Darussalam: A review. Renew. Sustain. Energy Rev. 2018, 82, 3060–3076. [Google Scholar] [CrossRef]
  74. Lai, S.; Loke, L.H.L.; Hilton, M.J.; Bouma, T.J.; Todd, P.A. The effects of urbanisation on coastal habitats and the potential for ecological engineering: A Singapore case study. Ocean. Coast. Manag. 2015, 103, 78–85. [Google Scholar] [CrossRef]
  75. Ministry of Commerce of the People’s Republic of China. Outbound Investment Cooperation Country (Region) Guide to East Timor. 2020. Available online: https://www.yidaiyilu.gov.cn/wcm.files/upload/CMSydylgw/202012/202012221140052.pdf (accessed on 21 February 2023).
  76. Wang, S.X.; Shang, M.; Zhou, Y.; Liu, W.L.; Wang, F.; Wang, L.T. Resources and Environmental Carrying Capacity Using RS and GIS. Pol. J. Environ. Stud. 2017, 26, 2793–2800. [Google Scholar] [CrossRef]
Figure 1. Location map of the study area. (a) Administrative District Map; (b) Geographical Location Map.
Sustainability 15 05791 g001
Figure 2. Technical flowchart.
Sustainability 15 05791 g002
Figure 3. Distribution of the size of the carrying capacity of natural resource subsystems from 1990 to 2020.
Sustainability 15 05791 g003
Figure 4. Folding line graph of changes in the level of carrying capacity of natural resource subsystems from 1990 to 2020.
Sustainability 15 05791 g004
Figure 5. Distribution of the size of the carrying capacity of the ecosystem subsystem from 1990 to 2020.
Sustainability 15 05791 g005
Figure 6. Folding line graph of changes in the level of carrying capacity of ecological environment subsystems from 1990 to 2020.
Sustainability 15 05791 g006
Figure 7. Distribution of the size of the carrying capacity of the socio-economic subsystem from 1990 to 2020.
Sustainability 15 05791 g007
Figure 8. Folding line graph of changes in the level of carrying capacity of socio-economic subsystems from 1990 to 2020.
Sustainability 15 05791 g008
Figure 9. A comprehensive evaluation of RECC of Southeast Asia, 1990–2020.
Sustainability 15 05791 g009
Figure 10. Folding Line Chart of Changes in the RECC Levels in Southeast Asia, 1990–2020.
Sustainability 15 05791 g010
Figure 11. Scatter plot comparison of NSDI, HDI, and RECC for Southeast Asian countries. Note: The horizontal axis represents the 11 countries, and the vertical axis represents their sustainable ranking.
Sustainability 15 05791 g011
Figure 12. Heat map of carrying capacity ranking of different countries over 30 years. (a) is the pre-correction natural resource carrying capacity; (b) is the post-correction natural resource carrying capacity; (c) is the pre-correction ecological environment carrying capacity; subfigure; (d) is the post-correction ecological environment carrying capacity; (e) is the pre-correction socio-economic carrying capacity; (f) is the post-correction socio-economic carrying capacity; (g) is the pre-correction resource environment carrying capacity; (h) is the post-correction resource environment carrying capacity.
Sustainability 15 05791 g012
Table 1. Summary of typical research methods for RECC.
ApproachResearch CharacteristicsLimitationsReferences
Comprehensive evaluation methodA multi-level indicator system was constructed, and RECC was studied by a linear weighting method.
This method is widely used to assess resource carrying capacity because of its simplicity of calculation and implementation.
Interactions between indicators could not be observed, and it was not probable to determine whether the assessed RECC was overloaded[37,47,48]
Ecological footprint methodQuantifying the land area, while assessing the carrying capacity in terms of both supply and demand, determines the ecological deficit or surplus of the area
A study of the additivity and comparability of land for biological production in each region can be conducted
It is not possible to predict future sustainable development trends. The simplification of the functions of various types of land allows the functional diversity of land to be ignored
The spatial exclusion of various types of land and the conversion of resource and waste equivalents into the productive area are too idealistic to be realistic
[45,46,51]
System dynamics methodDetermine the target system and each subsystem; model the system, determine the functional relationship between variables, and simulate the system modelThe selection of parameter metrics is difficult, and a large number of parameters are difficult to quantify accurately. The feedback process of the model structure is complex[24,42]
TOPSIS methodConstruct a system of indicators to calculate the extent to which the target is close to or deviates from the positive or negative ideal solution
Objective and subjective metrics can be used simultaneously
Based on subjective and holistic evaluation criteria, the classification criteria lack explanatory and persuasive power
Only two or more research subjects can be used. The classification criteria lack credibility
[4,43,44]
Energy analysis methodEconomic, resource, and environmental factors are measured by the solar value as a unified standard
A standard of measurement is provided for the rational use of resources and the assessment of resource and environmental values
The energy conversion rate calculation is complicated, and the regional and dynamic nature of the study object is not well considered in the energy value calculation process[25]
Geographic information system (GIS) methodA model that can dynamically monitor the resource environmentAdequate, high-quality data is required, as well as expertise in resource and environmental management, and the level of GIS application is poor[41,49,50]
Table 2. Scales, Types, and Dimensions of RECC.
AuthorScaleTimeTypeDimensionsReferences
Zhu et al.Provincial2020ECCSingle[15]
Wu et al.Reservoir2020ECCSingle[14]
Wu et al.Basin2020ECCSingle[16]
Prato et al.Protected Areas2009ECCSingle[18]
Wang et al.Basin2022ECCSingle[39]
Tehrani et al.County2013ECCSingle[40]
Wang et al.County2014WECCSingle[42]
Zhang et al.Small area2019WECCSingle[21]
He et al.Provincial2022WECCSingle[23]
Wang et al.basin2018WECCSingle[24]
Ait-Aoudia et al.Municipal2016WECCSingle[58]
Yang et al.Municipal2019WRCCSingle[25]
Shen et al.Municipal2020WECCSingle[34]
Pata et al.China2021ELCCSingle[17]
Cupul-Magana et al.Small area2017TCCSingle[20]
Cisneros et al.Small area2016BCCSingle[33]
Martire et al.Small area2015FRCCSingle[59]
Lane et al.Australia2014RCCSingle[27]
Świąder et al.Municipal2020ELCCSingle[51]
Sevegnani et al.Municipal2017CCCSingle[60]
Kessler et al.Small area1994HCCSingle[29]
Graymore et al.Small area2010SHCCMultiple[30]
Cohen et al.Earth1995HCCMultiple[31]
Zheng et al.Provincial2022RECCMultiple[53]
Zhang et al.Municipal2019RECCMultiple[37]
Wei et al.County2019RECCMultiple[38]
Wang et al.Small area2017RECCMultiple[28]
Wu et al.Greater Bay Area2021RECCMultiple[43]
Gao et al.City Cluster2021SCCMultiple[12]
Sun et al.Small area2018UCCMultiple[48]
Irankhahi et al.County2017ELCCMultiple[41]
Du et al.Country2022EPSingle[56]
Jin et al.Country2020SEMultiple[61]
In the Type column, “CC” stands for carrying capacity, while other types are distinguished by abbreviations. “EP” denotes ecological pressure and “SE” denotes sustainability evaluation.
Table 3. Data source.
Data Name *Data SourceSpatial ResolutionTime
Global DEM Datahttps://lpdaac.usgs.gov/products/astgtmv003/ (accessed on 20 January 2022) [62]30 m;
ASTER GDEM 30 m V3
2019
Road Network Datahttps://data.aseanstats.org (accessed on 18 January 2022) (ASEANstats)
https://download.geofabrik.de/ (accessed on 17 January 2022) (OSM)
2008–2020
Global Impervious Datahttp://irsip.whu.edu.cn/resources/dataweb.php (accessed on 16 January 2022) [63]Landsat 30 m;1990/2000/2010/2019
Mangrove datahttps://www.scidb.cn/ (accessed on 16 January 2022) [64]1990/2020
Shoreline data, reclamation dataAccessed by reviewing the literature and contacting the authors [65]1990/2020
Other socio-economic data https://data.worldbank.org.cn/ (accessed on 15 January 2022) (World Bank)1990/2000/2010/2020
* The missing data for some years were processed by linear interpolation. ”—” means not present.
Table 4. Comprehensive Evaluation Index System of Resource and Environmental Carrying Capacity in Southeast Asia.
Target Layer ACriterion Layer BIndicator Layer CUnitType of Indicator *
Comprehensive evaluation of RECCNatural Resource Endowment
(B1)
C1 Average elevationm
C2 Average slope
C3 Reclamation index
C4 Arable land area per capitahm2/person+
C5 Construction land area per capitahm2/person+
C6 Crop production index+
C7 Renewable inland freshwater per capitam3/person+
C8 Aquaculture production datametric ton+
Ecological environment condition
(B2)
C9 Greenhouse gas emissions%
C10 Average annual precipitationmm+
C11 PM2.5µg/m3
C12 Shoreline length per capitam/person
C13 Topographic relief
C14 Reclamation intensity index
C15 Mangrove coverage%+
C16 Forest Cover data %+
Socio-economic development
(B3)
C17 Population Density person/hm2
C18 Population growth rate %
C19 GDP per capitadollar/person+
C20 Economic Density104 dollar/hm2+
C21 Proportion of unemployed working population%
C22 Total fertility rate%+
C23 Urbanization Rate%+
C24 Road network density km/km2+
* In the indicator types, “−” indicates the cost indicator, and the smaller the better; “+” indicates a benefit indicator, and the bigger the better. The dollars in GDP per capita and economic density are in constant 2010 dollars.
Table 5. Weights of indicators.
Target Layer ACriterion Layer BCriterion Layer WeightsIndicator Layer CIndicator Layer Weights
Comprehensive evaluation of RECCB10.5278C1 0.0240
C20.1320
C30.0271
C4 0.0709
C50.0419
C6 0.0410
C70.0906
C8 0.1003
B20.3325C9 0.0240
C10 0.0252
C11 0.0376
C12 0.0240
C13 0.0179
C14 0.0618
C15 0.0814
C16 0.0606
B30.1396C17 0.0136
C18 0.0109
C19 0.0170
C200.0224
C210.0266
C22 0.0096
C23 0.0317
C24 0.0078
Table 6. Carrying capacity classification table.
Carrying Capacity Index RangeGrade Name
[0.08,0.13]Low
(0.13,0.18]Medium
(0.18,0.23]Higher
(0.23,0.28]Highest
Table 7. Calculated natural resource carrying capacity of Southeast Asia based on population correction for 1990–2020.
Country1990 Carrying Capacity2000 Carrying Capacity2010 Carrying Capacity2020 Carrying Capacity
East Timor0.28 0.29 0.38 0.28
Philippines50.46 51.56 39.51 34.67
Cambodia8.56 8.96 9.73 10.93
Laos2.82 2.96 3.41 3.42
Malaysia16.08 16.83 17.64 16.16
Myanmar24.18 25.41 28.71 25.35
Thailand48.91 51.35 42.10 37.88
Brunei0.28 0.30 0.29 0.29
Singapore2.30 2.27 2.63 2.89
Indonesia167.60 158.50 168.27 179.91
Vietnam31.62 37.87 37.34 37.91
Table 8. Calculated ecological carrying capacity of Southeast Asia for 1990–2020 based on population correction.
Country1990 Carrying Capacity2000 Carrying Capacity2010 Carrying Capacity2020 Carrying Capacity
East Timor0.26 0.43 0.47 0.54
Philippines17.26 34.45 40.95 48.29
Cambodia4.28 6.86 7.18 6.93
Laos2.17 3.07 3.08 3.19
Malaysia12.09 16.27 17.45 18.49
Myanmar15.48 22.59 21.68 21.31
Thailand19.43 28.77 27.95 26.29
Brunei0.25 0.31 0.30 0.31
Singapore1.66 1.74 1.90 1.74
Indonesia110.41 131.71 132.67 131.60
Vietnam16.59 33.23 34.19 36.56
Table 9. Calculated socio-economic carrying capacity of Southeast Asia for 1990–2020 based on population correction.
Country1990 Carrying Capacity2000 Carrying Capacity2010 Carrying Capacity2020 Carrying Capacity
East Timor0.10 0.10 0.09 0.08
Philippines10.31 10.07 10.15 11.96
Cambodia1.44 1.63 1.72 1.84
Laos0.55 0.73 0.80 0.84
Malaysia3.47 3.91 4.30 4.59
Myanmar9.65 8.45 7.62 6.32
Thailand12.65 11.20 12.28 11.02
Brunei0.07 0.06 0.06 0.06
Singapore1.09 1.28 1.30 1.43
Indonesia25.23 24.96 24.90 32.52
Vietnam12.1513.1612.9711.88
Table 10. Comprehensive calculation of resource and environmental carrying capacity of Southeast Asia based on population correction for 1990–2020.
Country1990 Carrying Capacity2000 Carrying Capacity2010 Carrying Capacity2020 Carrying Capacity
East Timor0.25 0.31 0.37 0.34
Philippines33.81 40.07 35.88 36.03
Cambodia6.14 7.24 7.77 8.33
Laos2.29 2.69 2.93 2.98
Malaysia12.99 14.84 15.71 15.31
Myanmar19.26 22.10 23.43 21.35
Thailand34.04 38.23 33.23 30.28
Brunei0.24 0.27 0.26 0.26
Singapore1.92 1.95 2.20 2.30
Indonesia128.69 130.94 136.40 143.25
Vietnam23.90 32.87 32.89 33.82
Disclaimer/Publisher’s Note: The statements, opinions and data contained in all publications are solely those of the individual author(s) and contributor(s) and not of MDPI and/or the editor(s). MDPI and/or the editor(s) disclaim responsibility for any injury to people or property resulting from any ideas, methods, instructions or products referred to in the content.

