Article

Ecological River Water Quality Based on Macroinvertebrates Present in the Ecuadorian Amazon

by
Tannia Vargas-Tierras
1,
Sandra Suárez-Cedillo
2,
Vanessa Morales-León
3,
Yadira Vargas-Tierras
4,
Leider Tinoco-Jaramillo
4,
William Viera-Arroyo
5 and
Wilson Vásquez-Castillo
6,*
1
Research Group YASUNI-SDC, Sede Orellana, Escuela Superior Politécnica de Chimborazo (ESPOCH), El Coca 220001, Ecuador
2
Research Group INFOSO, Sede Orellana, Escuela Superior Politécnica de Chimborazo (ESPOCH), El Coca 220001, Ecuador
3
Research Group GIMA, Facultad de Recursos Naturales, Escuela Superior Politécnica de Chimborazo (ESPOCH), Panamericana Sur Km 1.5, Riobamba 060106, Ecuador
4
Central Amazon Research Site (EECA), National Institute of Agricultural Research (INIAP), Joya de los Sachas 220350, Ecuador
5
Santa Catalina Research Site, Tumbaco Experimental Farm, National Institute of Agricultural Research (INIAP), Tumbaco 170902, Ecuador
6
Ingeniería Agroindustrial, Universidad de Las Américas (UDLA), Redondel del Ciclista, Vía a Nayón, Quito 170124, Ecuador
*
Author to whom correspondence should be addressed.
Sustainability 2023, 15(7), 5790; https://doi.org/10.3390/su15075790
Submission received: 23 January 2023 / Revised: 6 March 2023 / Accepted: 17 March 2023 / Published: 27 March 2023
(This article belongs to the Special Issue Sustainable River Water Resource Assessment, Modelling and Protection)

Abstract

:
The Yanaquincha River is one of the tributaries that crosses the canton of La Joya de los Sachas from north to south, where the increase in human activities is affecting the quality of water used for agricultural activities and in tourist resorts. The purpose of this research was to determine the biological quality of the water through the BMWP-Col index and physicochemical parameters. Five sampling sites were selected along the length of the river for this assessment. Relatively intact sites were classified as reference sites (BR and FR), moderately impacted sites (EPC and EFPC), and severely impacted sites (PC). Biological and physicochemical data were collected to examine the quality of the water. The Biological Monitoring Working Party Colombia (BMWP-Col) biotic index and Functional Feeding Group (FFG) grouping were used to evaluate river quality. The results showed that water temperature, depth, width, and turbidity are important parameters in the composition of families. In the sampling sites, the BMWP-Col index was a determinant for river water quality (moderate, poor, or bad). Good quality water was not found in any of the sampling sites. The composition of the macroinvertebrate community changes from the source of the river until it ends its journey in the city. In addition, the family abundance and the composition of the feeding group were observed in the sites that showed similar or the same quality of water. The diversity of families and FFGs was generally higher at sites of moderate water quality. Chironomidae and Annelida were the most abundant families while Leptoceridae was the least abundant. The diversity of families was higher in BR while it was lower in PC and EFPC, grouped in six and four (both PC and EFPC) FFGs, respectively. It is important to carry out this type of study in the Ecuadorian Amazon because there is a lack of knowledge about taxonomic and functional diversity and the physicochemical variables with water quality.

1. Introduction

Worldwide, it has been projected that demand in water will augment in 2030 by 40% [1]. In recent years, water pollution in protected ecosystems has increased due to accelerated urbanization [2]. This has resulted in 90% of wastewater from anthropogenic (urban, rural, and industrial) and diffuse (agricultural and livestock) activities in developing countries [3] being poured into rivers, lakes, and oceans [4], thus deteriorating the quality of water. The Constitution of the Republic of Ecuador states that access to water is a human right [5]; however, the non-application of environmental policies has meant that the processes that cause water pollution are able to continue. Borja-Serrano et al. [6] point out that one alternative that could help minimize these contamination processes is to include civil society in decision-making to reduce morbidity and mortality rates resulting from contaminated water consumption.
The Amazon region is not exempt from this problem, as anthropogenic activities have not only damaged the health of the region’s ecosystems but have also affected the human population’s access to clean natural resources. Water resources in the region are under constant threat, mainly due to the scarce coverage of sewage systems and wastewater treatment plants in urban and rural areas [2]. Given this situation, the need has arisen to evaluate the biological health of the Yanaquincha River, which has agricultural and recreational use, due to the Autonomous Decentralized Provincial Government (GAD) of Orellana reporting an uncertain water quality index (BMWP-Col of 35–60) in this river in 2019 [7].
In Ecuador and other parts of the world, physicochemical parameters are applied to determine water quality; nevertheless, the results obtained provide the state of that ecosystem at that moment but not over the course of time [3]. For this reason, several biotic indices based on the presence of macroinvertebrates have been developed to address water quality in a comprehensive and ecological manner [8]. The Biological Monitoring Working Party (BMWP) index is a water quality index used to assess the overall health of a body of water according to the existence and richness of aquatic macroinvertebrates, such as insects, mollusks, and crustaceans. These organisms are used as indicators of water quality because they are sensitive to changes in the physical and chemical conditions of the water, as well as to pollution [3]. BMWP is an important index in the neotropical region because it uses benthic invertebrates as indicators of the quality of water [3]; it has been used in the United Kingdom to determine the degree of contamination of aquatic systems [2]. However, this method has been adjusted in several countries in order to develop their own biological index [9]. This index uses metrics (species abundance and trophic composition) and score values (1 plus degradation and 10 minus degradation) to determine water quality [2]. Gabriels [10] points out that taxonomic composition, abundance, and proportion of sensitive disturbance to insensitive families should be considered and included in the analysis with hydro-morphological, chemical, and physical elements that support the biological parameters. However, the results have been disputed because the indices of abundance and family diversity are associated with factors such as history, geography, climate, and ecology rather than the direct influence of anthropogenic factors [11].
In a complementary way, the classification according to Functional Feeding Group (FFG) is also an important tool, since it combines morphological and behavioral characteristics, allowing the evaluation of functional differences in this community both in time and space [5,12]. Regarding the latter, it is already known from the River Continuum Concept (RCC) that the direction of water flow and the abiotic changes that occur from the headwaters of a river to its mouth define the longitudinal gradient of distribution and diversity that ultimately affect aquatic metabolism and nutrient cycling in the river [13].
In Ecuador, there are some studies that show that the BMWP-Col (adjusted by Colombia) and the FFG together with hydromorphological and chemical variables help to determine the biological quality of water in rivers of the Coastal and Amazon regions [3,8,9]. For this reason, the objective of this study was to determine the water quality of the Yanaquincha River, which crosses the County of La Joya de los Sachas from north to south, using the BMWP-Col index, the structure of the FFG, and physicochemical parameters.

2. Materials and Methods

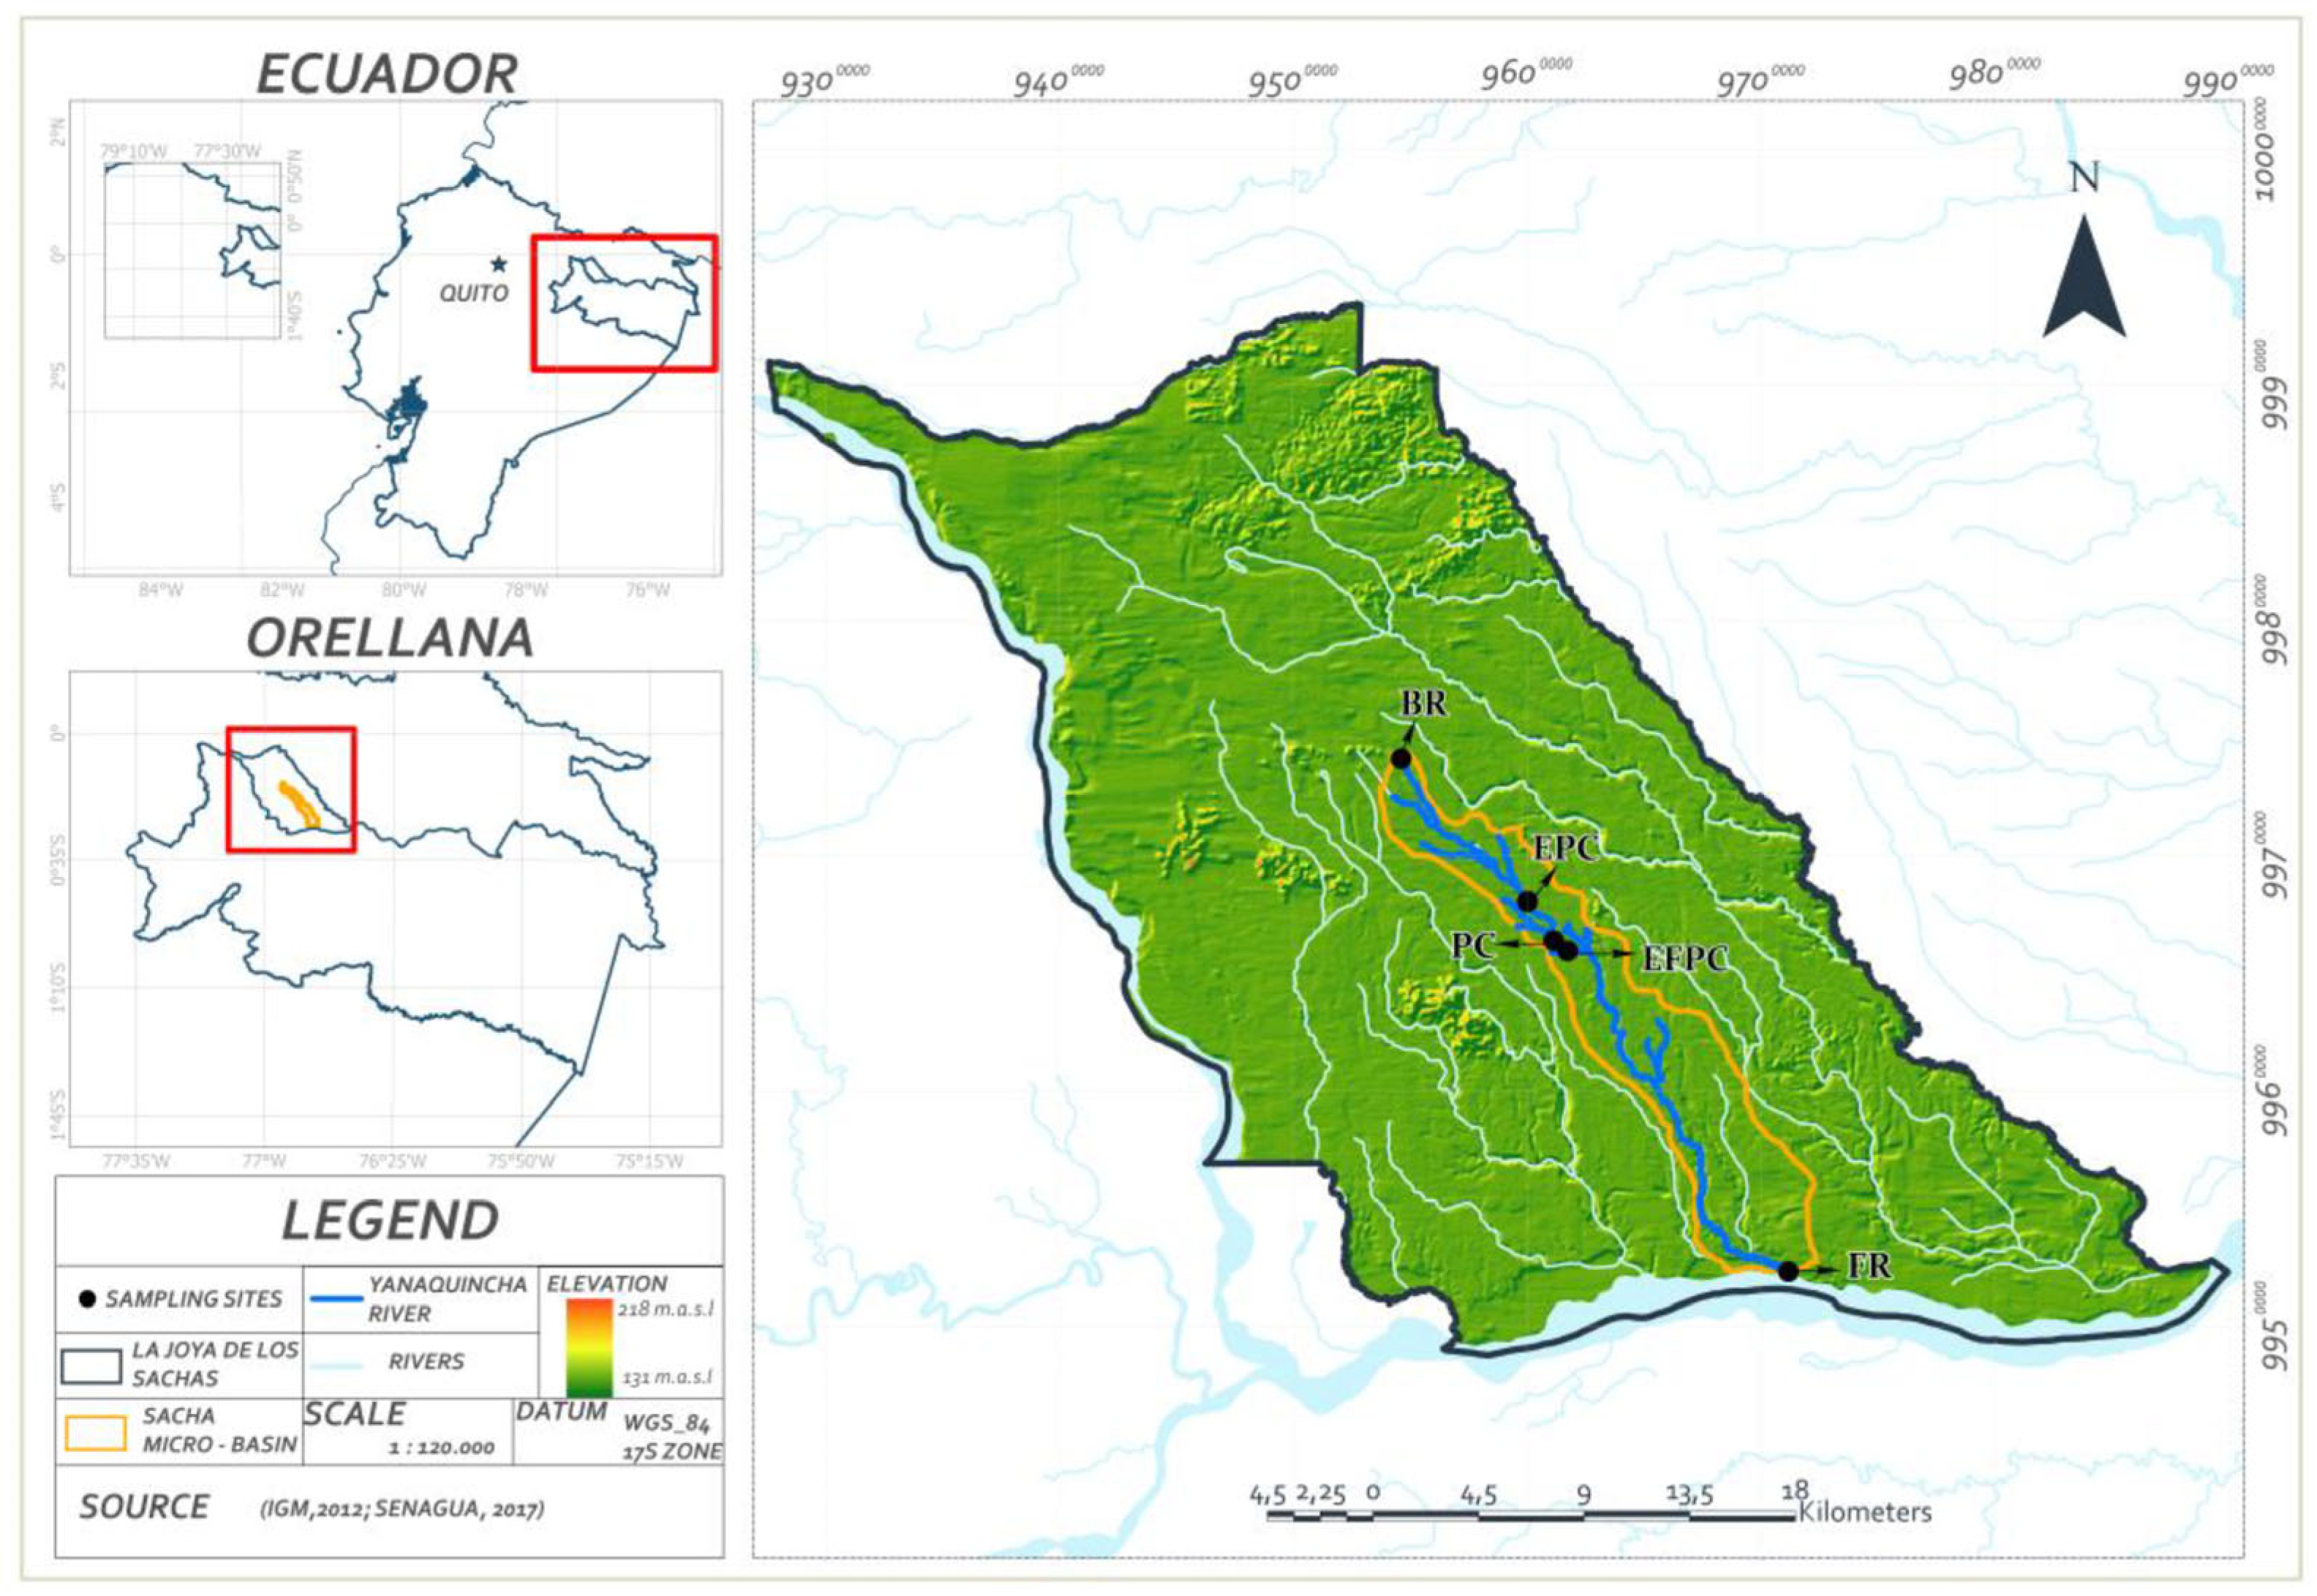
2.1. Study Area and Site Selection

The Yanaquincha River is a tributary of the lowest point of the Coca River (218 m.a.s.l.). In the dry season, there is an average discharge of 219 m3 s −1, and it increases its flow rate up to 389 m3 s −1 in the rainy season [3]. This river crosses the city of La Joya de los Sachas from north to south. According to the Köppen climatic classification, this region is a tropical rainforest [14]. To select the most suitable months for sampling, the recommendations of Gabriels et al. [10] were followed, who mention that extreme conditions such as hydrological regime and temperature (especially in winter) must be avoided during macroinvertebrate sampling to obtain a reliable evaluation of the water quality. Four samplings were taken in the Yanaquincha River (51 km). They were taken during September and October 2021 (every 15 days) during the period of least rainfall (4 samplings). The annual average rainfall during the year exceeds 3000 mm at this site and the season with minor rainfall occurs in the months of September and October (233 to 236 mm, respectively) [15]. A total of 5 sampling sites were selected from the entrance of the river to the La Joya de los Sachas canton to its exit. The sites were located as follows: beginning of the river (BR), entrance to the population center (EPC), population center (PC), exit from the population center (EFPC), and end of the river (FR) (Figure 1). For the selection of the sites, in situ observations were carried out and the methodology reported by Helson and Williams [16] was followed, who stated that relatively intact sites should be chosen as reference sites; in this study, the intact sites were the BR and FR, moderately impacted sites were the EPC and EFPC, and the severely impacted site was the PC.

2.2. Data Collection

2.2.1. Physicochemical Analysis

In situ, the temperature of the water was measured with a digital thermometer (ST9215, ATM limited, Hong Kong, China). Water samples were collected in sterile amber glass bottles (1250 mL) to analyze inorganic and organic compounds and stored at 4 °C until analysis. Samples were collected in three zones of the river section (left, right, and central) [17]. The analyses were performed according to the methods for the analysis of drinking and wastewater (APHA-AWWA-WPCF) suggested by Ann and Franson [18]. The standard method 4500- PE was used for the determination of phosphate (PO4-P), standard method 4500 NO3 B was used to determine nitrates, and standard method 2130 B was used to determine turbidity. These were performed with UV-visible spectrophotometry (80-2106-20 Pharmacia Biotech, Des Moines, Iowa, USA). The standard method 5220 D was used to determine dissolved oxygen (DO) and chemical oxygen demand (COD) by employing spectrophotometry (DR 2000, HACH, Des Moines, Iowa, USA). The standard method 5210 B was used to determine biochemical oxygen demand (BOD5) with WTW OxiTop IS 12 (Oxitop, Madrid, Spain). The standard method 2510B was used to determine dissolved solids (TDS) with a conductivity meter (51800-18, HACH, Des Moines, Iowa, USA). The standard method 2017 Ed 23 4500 H+B was used to determine pH by electrometry (51910-18, HACH, Des Moines, Iowa, USA). The standard method 9222 D was used to determine fecal coliforms using membrane filtration (Memmert, Incubator, Núremberg, Germany). The EPA (Environmental Protection Agency) methods 418.1, 1978 and 1664, 1999 were used to determine the presence of total petroleum hydrocarbons (TPH) using infrared spectrophotometry (HART-T2 and CH, INFRACAL, Boston, USA). The flow velocity was measured using the flotation method, where a length of 5 m was considered [9]. In addition, the depth and width (hydromorphological variables) of the river were measured manually. The physicochemical parameters selected for the study of the Yanaquincha River were selected from studies conducted by Sinche et al., Cabrera et al. and Rodríguez Badillo et al. [2,3,19] in the Ecuadorian Amazon.

2.2.2. Macroinvertebrate Sampling

Samples were collected using a D net with a 500 µm mesh. This net was placed in the opposite direction of the water flow and the substrate was gently moved for 5 min. This procedure was repeated three times at each sampling site, i.e., 15 min in total at each sampling site [10,20]. The samples were placed in plastic trays and an initial selection was made of branches, sticks, and leaf litter. Subsequently, macroinvertebrates were placed in small jars with 70% ethanol. In the laboratory with a stereoscope (IVU-5000, Labomed, New York, NY, USA), the specimens were counted and identified (families) using the keys developed by Dominguez et al. and Trop and Rogers [21,22].

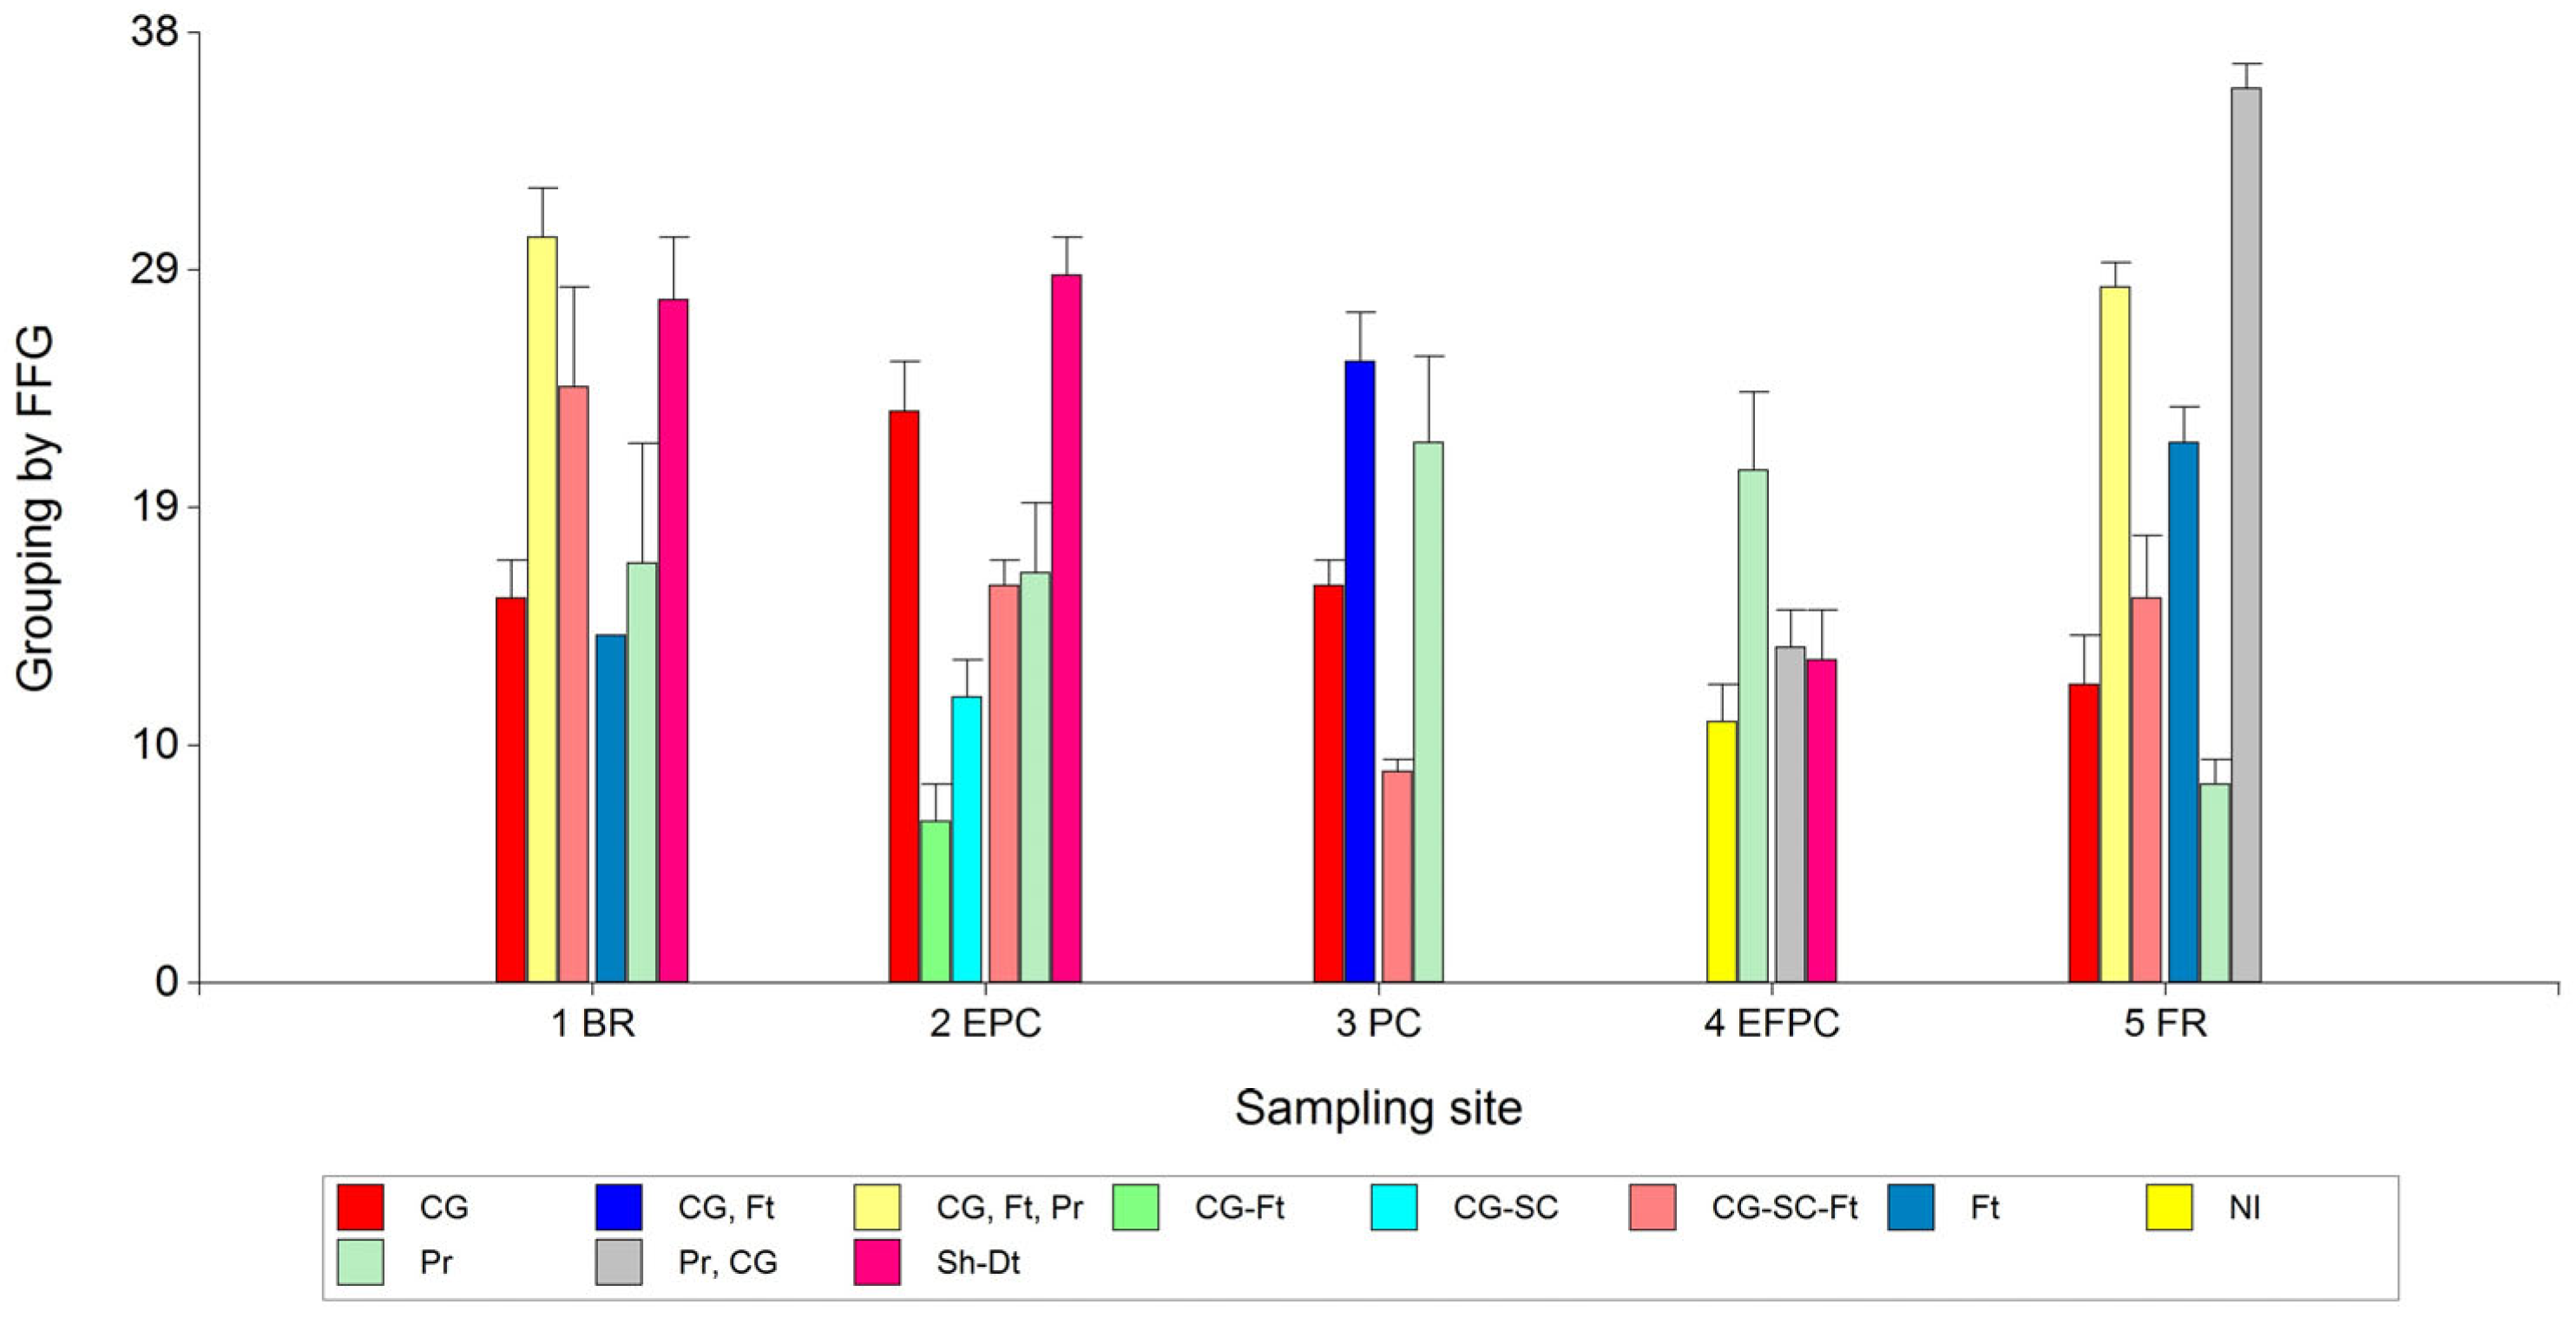
2.2.3. Determination of the BMWP-Col Index and Grouping according to Functional Feeding Group

The ecological quality of the water was assessed with the BMWP-Col [9] at each sampling site, and it was based on a tolerance score assigned to the macroinvertebrate community composition. This score ranged from 1 to 10 (low tolerant scores and high sensitive scores). Subsequently, the total BMWP-Col score for each sampling site was obtained by adding together the scores of all families that were present at the sampling site. The ecological quality of the water was set according to the BMWP-Col value, as follows: ≥100 (good), 61–100 (moderate), 36–60 (poor), 16–35 (bad), and 0–15 (very bad) [3].
The identified families were grouped according to FFG as outlined by Ramírez et al., Coccia et al. and Wakhind et al. [12,23,24]. The assignment of more than one FFG per family reflects the diversity within the same family and they were grouped into CG = Collectors, Ft = Filtrators, Pr = Predators, Sh = Shredders, SC = Scratchers, and Dt = Detritivores. To analyze the longitudinal gradient of the FFGs, the sampling sites were also grouped into three regions: upstream (the BR and EPC), middle (the PC), and downstream (the EFPC and FR).

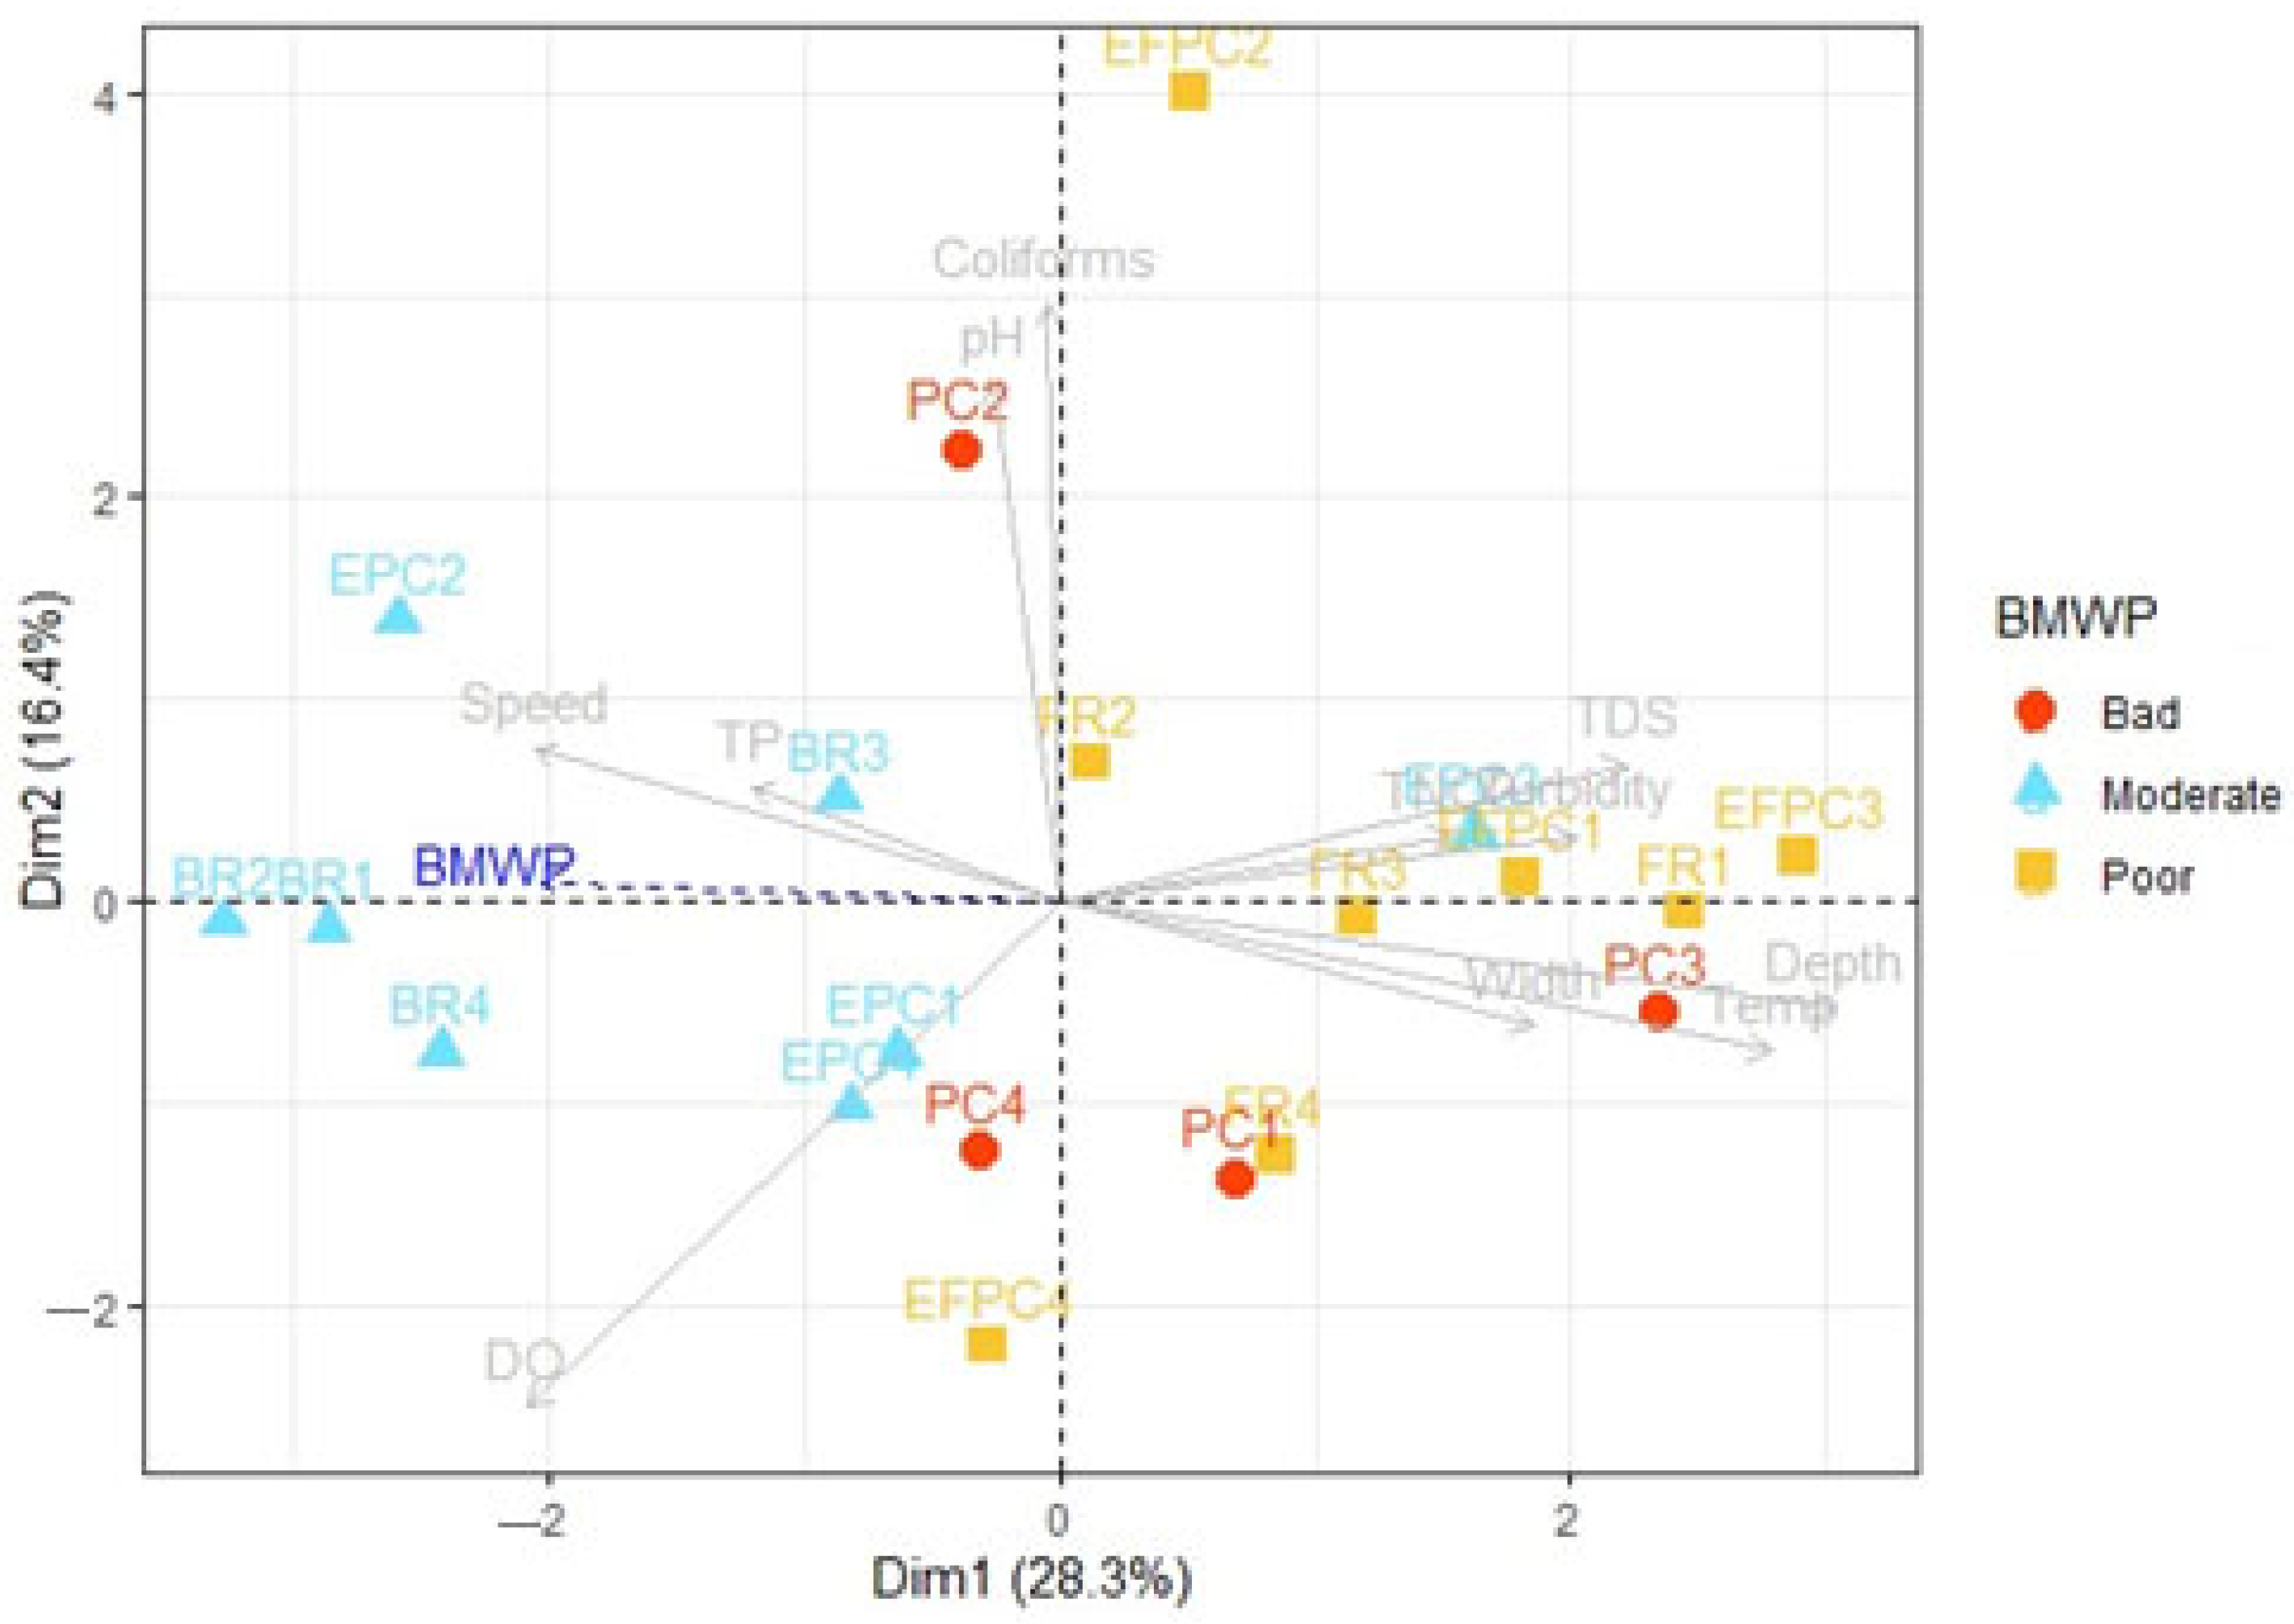
2.2.4. Data Analysis

The analyses were carried out using the software Rv4.1.1-R-Core.Team, 2021 [25]. Data were normalized prior to the analysis. A principal component analysis was carried out to analyze the similarity among sampling locations, BMWP-Col index, and physicochemical variables. The correlation between the hydromorphological, physicochemical variables, and the BMWP-Col index was analyzed using the Spearman coefficient. Bar graphs were prepared to show the relative abundance exiting in the sites grouped according to family and FFG.

3. Results

3.1. Physicochemical Analysis

The results of the descriptive analysis are presented in Table 1 and data of each sampling time is shown in Table S1. In the sampling sites, the minimum temperature varied from 23.5 °C (BR) to 24.9 °C (FR) and the maximum temperature varied from 24.5 °C (BR) to 27.5 °C (PC). A highly significant positive correlation was found between temperature with depth and width (0.70, p < 0.01) and also between temperature and COD (0.46, p < 0.05). In addition, a significant negative correlation between temperature and BOD and velocity was found (−0.49 and −0.31, p < 0.05). The slowest water velocity was at the EFPC (12.26 m*s−1) and the fastest was at the BR (26.08 m s−1). Water velocity had a negative correlation between depth and dissolved solids (−0.57 and −0.58, p < 0.01).
In addition, turbidity was low at the BR (2.59) and high at the FR (8.68 FTU). A positive correlation of depth with water turbidity was found (0.57 FTU, p < 0.01). The mean pH at all sampling points remained near 7 and had a significant negative correlation with DO (−0.43, p < 0.05) and a positive correlation with BOD5 (0.53, p < 0.05). On the other hand, there was a significant positive correlation between COD and BOD with the presence of hydrocarbons (0.44 and 0.50, p < 0.05), between COD and PO4-P with fecal coliforms (0.50 and 0.44, p < 0.05), and nitrates with turbidity (0.40, p < 0.05). Table 2 shows the Spearman correlation coefficients between variables.

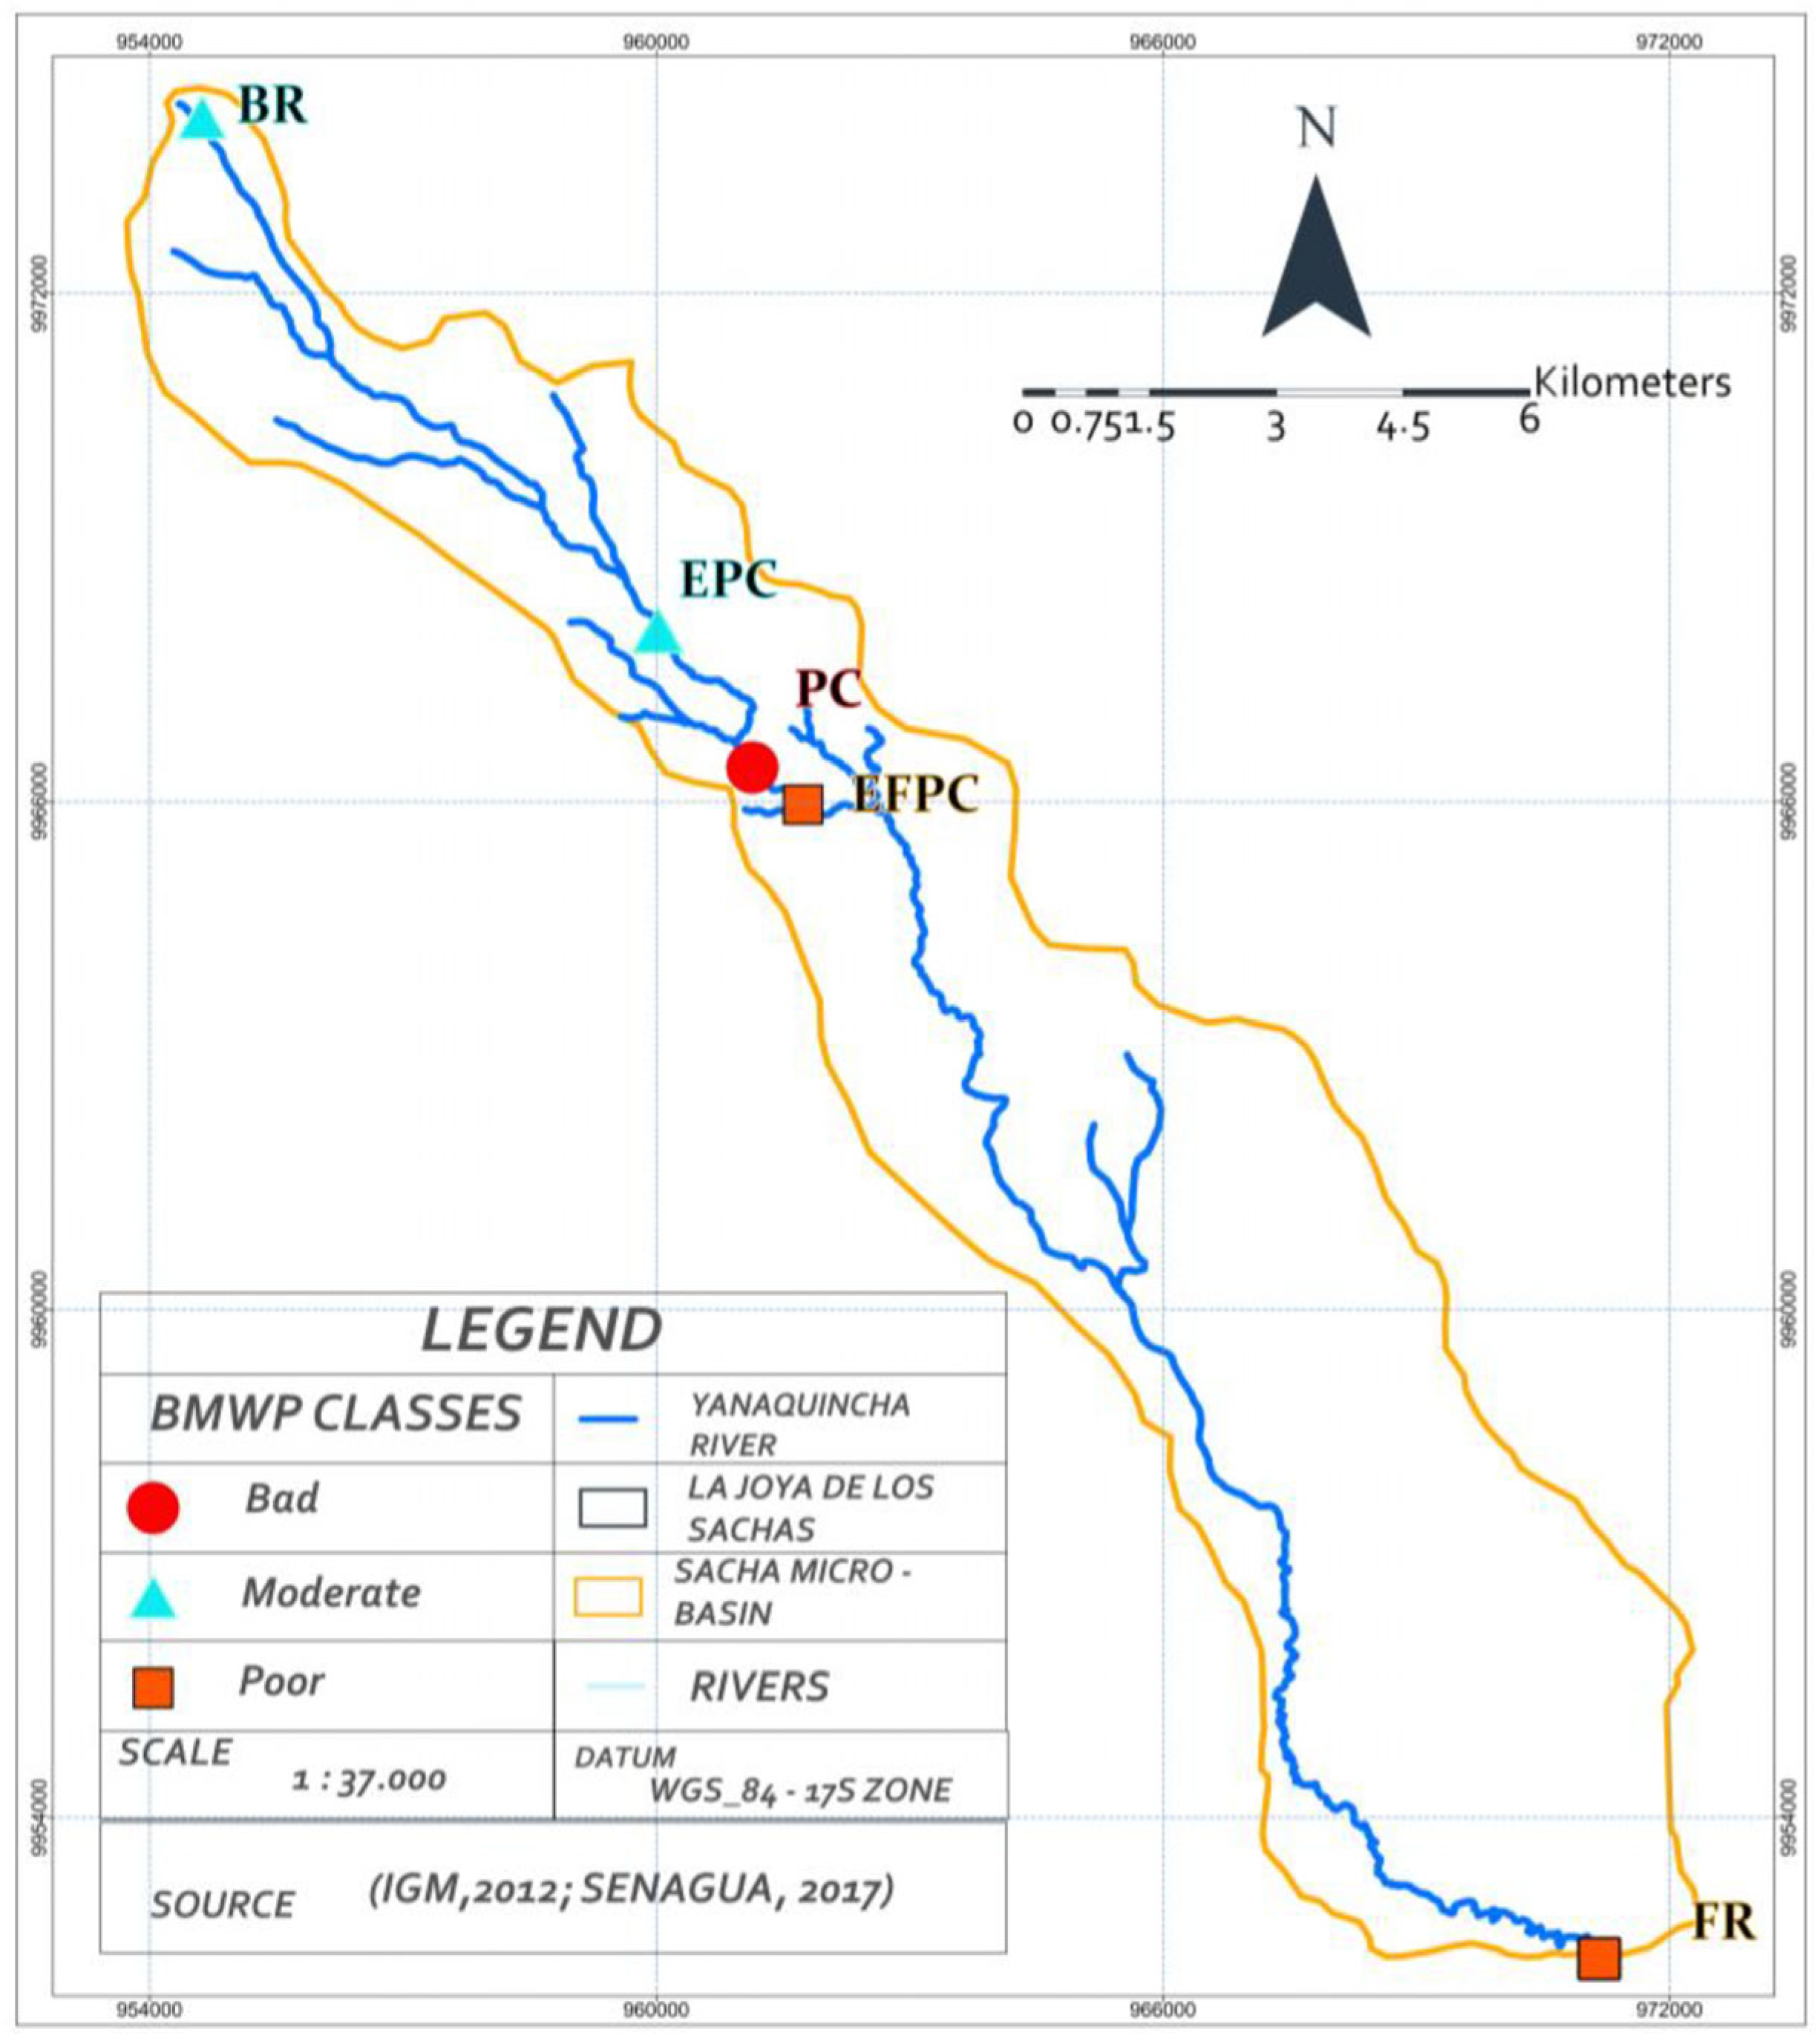
3.2. Calculation of the BMWP-Col Score for River Evaluation

A total of 1488 macroinvertebrates were classified and identified, grouped in 28 different families. The BR and EPC showed the highest abundance and diversity, with 391 and 302 individuals, respectively, grouped into 10 and 6 different families, respectively. At the EPC and FR, 270 and 286 individuals belonging to 8 and 7 different families were found, respectively. The EFPC was the site where the lowest number of individuals (239) was found, grouped into seven different families. Anelida and Perlidae (126 and 91 individuals, respectively) were the most abundant families at the PC and BR, followed by Staphylinidae and Coenagrionidae (72 and 64, respectively) in the FR and EFPC, and Ptilodactylida (57 individuals) at the EPC. Table 3 shows the list of families found in the different sampling sites and the tolerance scores according to the BMWP-Col.
At the five sites sampled, the BMWP-Col index was 72 and 67 (slightly polluted water where some effect of pollution is noticeable), 19 (heavily polluted waters), and 44 and 46 (moderately polluted water), respectively (Figure 2). Moderate biological water quality was found at the BR and EPC, coinciding with high species abundance. The BMWP-Col index showed opposite correlation with depth and turbidity (−0.66 and 0.64, p < 0.01) and a significant correlation between river width and temperature (−0.45, −0.53, p < 0.05) (Table 2).
The BMWP-Col score determined for this study was related to the hydromorphological variables: river velocity, width, depth, and turbidity. When the velocity was >24 m s−2, moderate ecological water quality (BMWP-Col > 61) was observed. This same quality value was obtained when the DO content was >5 and pH was >7. The ecological water quality was also found to be poor or critical at the PC (19) and poor or doubtful at the exit of the population center (EPC) and FR (46 and 44, respectively).
In the PCA analysis, the first two components explained 44.7% of the total variance of the samples (Figure 3). There was clustering of sites classified as poor or bad (except point EPC3, 3 = third sampling) on the right side of the graph associated with higher values of depth, temperature, width, turbidity, total nitrogen, and total dissolved solids. The characteristics of the water sample taken at EPC3 might be related to the fact that this site showed the lowest values of PO4 and fecal coliforms (Table S1) and possibly these values influenced the contrast with the rest of the samples. The sites classified as moderate, on the other hand, were grouped on the left side of the graph, associated with higher values of BMWP index, velocity, total phosphorus, and dissolved oxygen. A few sites deviated from this pattern, especially PC2 (2 = second sampling) and EFPC2, which were associated with higher values of pH and fecal coliforms, while sites PC4 (4 = fourth sampling), PC1 (1 = first sampling), FR4, and EFPC4 were associated with lower values of these variables.
The distribution of FFGs based on invertebrate community is shown in Figure 4. The BR and EPC had the highest diversity and there was a predominance of CG, Ft, Pr, and Sh-Dt. CG, Ft, and Pr predominated in the PC, while Pr was present in the EFPC and Pr and CG were present in the FR. The abundance of macroinvertebrates varied according to the sampling site. Upstream, there was a greater diversity of families and downstream, the number decreased. At the BR, the most representative family was Perlidae, while Ptilodactylidae and Hydraenidae predominated at the EPC. At the PC, the number of families decreased with respect to the BR and EPC, and the most abundant family was Annelida. Downstream, at the EFPC and FR, the most representative families were Coenagrionidae and Staphylinidae. The family Chironmidae was present at the BR, PC, and FR.
Figure 5 shows the distribution of FFGs in the upstream, center, and downstream sections of the river. Upstream (the BR and EPC) and downstream (the EFPC and FR) sections showed the highest diversity and there was a predominance of Pr followed by Sh-Dt. Downstream, Pr also dominated, followed by CG-SC and Ft. In the center section of the river (the PC), the lowest diversity was observed and Pr was also the most predominant group, followed by Ft.

4. Discussion

The mean temperature of the water in the Yanaquincha River was 24.7 °C, ranging from 23.9 °C to 25.4 °C. The highest temperature values were determined in waters where riparian vegetation is sparse. These values are similar to those obtained in the Orienco stream (23.5 to 27 °C) located in the northern Ecuadorian Amazon, where the climatic characteristics are similar to those of La Joya de los Sachas [2]. It was determined that at the FR, river width (8.34 m) and temperature (24.5 °C) were related to poor water quality. This finding is similar to that reported by Cabrera et al. [3], who note that the higher the temperature and the wider the river (>5 m), the poorer the water quality. In general, average invertebrate abundance decreased downstream, despite the slight improvement in richness at the EFPC site compared to the previous site.
The pH was practically neutral and did not show variation; it had a slightly positive relationship with poor water quality at the EPC, and this behavior is similar to that reported by Sinche et al. [2] who found little pH variation (6.74 to 7.35) and by Braga et al. [26] who determined a neutral pH in the Munin and Iguará rivers. The pH values ranged from 7.02 to 7.25 (neutral pH), which are similar to the values reported by Sinche et al. [2] in the Orienco stream.
The presence of nitrates is possibly due to the fact that the organic nitrogen produced decreased and nitrate values increased: a situation that generally occurs in urban areas due to the presence of domestic wastewater and industrial effluents [27].
The DO level also had a partial positive influence on water quality at the BR and EPC, where the concentrations of oxygen-consuming substances were low and strong phytoplankton photosynthesis was occurring [28]. The DO levels ranged from 4.08 to 5. 72 mg L−1; these levels are within the ranges reported by Sinche et al. [2] (4 and 12 mg L−1) in the Orienco stream and below the levels reported by Cabrera et al. [3] (8 and 9 mg L−1) in the Aguarico and Coca rivers (Ecuadorian Amazon).
The mean COD concentration was 12. 2 mg L−1 and BOD was 0.93 mg L−1; these values possibly indicate reduced aerobic and oxidation activities in the watercourse [2]. The concentration of BOD and nitrites were below the minimum values reported by Sinche et al. and Mena-Rivera et al. [2,20] (10.15 and 11 mg L−1, 1.95 and 4 mg L−1) in studies conducted in the northeastern part of the Costa Rican Valley and the Ecuadorian Amazon (average temperature of 25 °C and 25.5 °C, respectively).
Turbidity and dissolved solids showed an increasing trend in the industrialized and urbanized area, and their fluctuation and increase could be associated to dischargers of wastewater into the river. Braga et al. and Huey and Meyer [29,30] point out that turbidity and dissolved solids are indicators that help explain water quality; for example if the levels of these parameters increase, it is because excessive effluent drainage is occurring. The values of turbidity in this study are lower (2.59–BR, 3.93–EPC, 7.34–PC, 7.77–EFPC, and 8.68 FR) than those reported by Mena-Rivera et al. [20] (10.59 NTU). The turbidity values determined at the EPC, PC, and FR sites were above the limit (>5 NTU) reported for human consumption, and this is possibly due to the fact that wastewater discharges occur at these sites, causing a greater accumulation of solid matter and a reduction of light transmission in the water [31]. In addition, the hydromorphological variables such as depth and turbidity (clay, suspended particles of silt, plankton, organic compounds, and other microorganisms) are related to the poor quality of the water, indicating that the deeper the river is, the greater the turbidity. This same behavior was reported by Cabrera et al. [3], who point out that the worst water quality occurs at greater depths.
The PC site showed a bad water quality index (worst quality); this may be due to the fact that the river downstream has experienced a cumulative impact of anthropogenic activities. The PC site also showed relatively higher turbidity than the other points (brown water), which could be attributed to the presence of sediments due to the constant discharge of waste into the river. Furthermore, in this study, these parameters are closely related to the presence of PO4-P at the PC. This behavior is similar to that found by Gad et al. [32], who stated that the presence of phosphorus is directly related to water turbidity due to the presence of natural colloids (1–1000 nm), Fe oxides, and clay minerals.
In this study, the TPH analysis at the five sampling points was less than <0.06 mg L−1; these are values below the permitted limits (0.5 mg l−1) for freshwater aquatic life preservation sites [33]. At the BR and EPC, the water quality was moderate and the water velocity was 26 and 25 m s−2, respectively. A probable explanation is that velocity is considered to be a diffusion phenomenon, since it causes pollutants to be carried and decompose along the river, as long as there are no more pollutants present downstream [34]. In addition, the presence of coliforms at the PC is possibly due to domestic wastewater discharges.
The macroinvertebrate community identified in this study showed a more realistic state of the Yanaquincha River ecosystem during its course through La Joya de los Sachas. Macroinvertebrate composition is generally related to chemical (oxygen, nitrates, phosphorus, dissolved solids, and pH), environmental (temperature), and site-specific (velocity, width, depth, and turbidity) interactions as potential variables to explain the composition of the biota [3].
When applying the BMWP-Col index, it was determined that the water quality index was better when there was more diversity of macroinvertebrates regardless of the number of individuals; thus, the water quality improves as more families increase [19]. At the BR and EPC, the number of families was 10 (391 individuals) and 8 (270 individuals), respectively, and the water quality was moderate; in contrast, the PC showed poor water quality with 6 families. A probable reason of the reduction of the quality of water at the PC is the existence of pollution-tolerant families and the disappearance of species susceptible to pollution episodes, such as Perlidae and Ptilodactylidae. This disappearance of species at the PC may have been caused by wastewater discharges, because the highest discharges of wastewater occur there. Downstream sites showed a diffusion effect (self-cleaning), possibly due to the water pollutants (nitrites, phosphates, etc.) being carried by the river continuing its course; thus, the water becomes cleaner in this sampling site, causing the presence of species such as Coenagrionidae [34]. Similar behavior was determined in the Juma River in the city of Beijing, where upstream, the water was polluted and its quality was poor, but downstream, the river was clean and the water quality was good, which means that this river possessed self-purification capacities, possibly through physical and chemical actions in the flow such as dilution, deposition, and adsorption [35]. In addition, the presence of plant species and their interactions with the microorganisms present in the decomposition, assimilation, denitrification, sorption (adhesion between substances), root entrapment, and sedimentation of the river cause the river downstream to become cleaner [36].
This study identified aquatic food chains in the sampling sites including collecting organisms (CG), predators (Pr), filter feeders (Ft), and shredder-detritivores (Sh-Dt) that have a strong dependence on the presence of organic matter and sediments. Regarding this behavior, Cabrera et al. [3], pointed out that the association of FFG with water quality is clear, since the diversity and supremacy of several feeding traits vary as the degree of disturbance rises. For example, all FFGs are present in sites with good water quality, with a slight dominance of SC and Pr, while in sites with bad water quality, the diversity of FFGs is reduced, with a dominance of GC. In addition, it was observed that Pr were found to be the predominant group in all upstream, downstream, and center sections of the river, and that FFG groups in upstream and downstream sections were similar but not same in terms of the abundances of each group. The latter findings agree with the RRC hypothesis [13], which states that benthic communities in a given river segment may be similar to communities upstream or downstream and in neighboring reaches, and that taxa richness is heterogeneous in the longitudinal profile of a river; this trend was observed in this study. Families with a lower tolerance to contamination were found upstream, favoring the development of predatory groups such as the family Perlidae (BMWP-Col = 10), which is present in waters slightly contaminated with organic matter [19,37]. Chironomidae was present at the EFPC, where the amount of DO was 4.08 mg L−1, possibly because this family has the ability to survive in contaminated and anoxic environments, and they are considered a collecting, filtering, and predatory group [37]. Tomanova and Tedesco [38] mention that this family eliminates up to 70 g of organic matter per m2 day−1, due to its biomass rising with nutrient concentration [39]. Hydropsychidae was present at the BR; this family is capable of filtering fine organic matter and is regularly found in moderate and high discharges [20]. At the EPC, the Ptilodactylidae family (shredders/detritivores) was found, which includes specimens that are not tolerant to organic contamination [40]. The presence of this family is possibly due to the fact that downstream, the river undergoes a purification process, and thus the water is moderately polluted [41]. At the PC, the most representative family is Annelida, belonging to the predator group. This family adapts very well to decomposing organic material and it has been found mainly in urbanized areas in domestic sewage systems and industrial effluents [2]. Coenagrionidae (predators), a family that prefers cleaner water [42], was present at the BR and EFPC, and this could be due to there being fewer contaminants at those sampling sites [34]. Staphylinidae was present at the FR. Hamid et al. [41] notes that this family is associated with riparian habitats (leaf litter), but it may be susceptible to water quality.
The results of this study could help the GADs of the Orellana Province to formulate public policies that help to conserve water sources such as the Yanaquincha River because its water is used for irrigation and recreational activities. In addition, it is important that the GAD apply the Sustainable Development Goals that include: eliminating landfills, minimizing chemical release and hazardous materials, decreasing the disposal of untreated wastewater by 50%, and augmenting recycling and reuse practices; this will improve water quality and satisfy the population’s need for clean and safe water for recreational, hygienic, domestic, and industrial uses [43].

5. Conclusions

The ecological water quality of the Yanaquincha River in Joya de los Sachas (Ecuadorian Amazon) was determined according to the indicators represented by macroinvertebrate families as well as the standard water quality parameters of the physicochemical methods. The BMWP-Col index was a determinant in setting the water quality of the river, which presented moderate, poor, and bad quality, without finding good quality water at any sampling site. At the BR and EPC, the water quality was moderate (slightly polluted) because it showed a BMWP-Col index > 60. At the PC, the water quality was bad (very polluted waters), with a BMWP-Col of 19, and at the EPC and FR, the water quality was poor (moderately polluted waters) because it presented BMWP-Col values of 46 and 44, respectively.
It was determined that velocity, DO, and pH explain the distribution and abundance of families in moderate water quality, while downstream at greater depths, turbidity and dissolved solids correlated with poor water quality. e Bad water quality was linked to the presence of fecal coliforms, thus limiting macroinvertebrate diversity.
The diversity of families and abundance of the individuals was higher at the BR (6 families/391 individuals) and lower at the EFPC (4 families/239 individuals). CG was the FFG present at most of the sampling sites (the EPC, BR, PC, and FR). Chironomidae and Annelida were the most abundant families and Leptoceridae was the least abundant. Heterogeneous FFG variations along the river were determined; however, further research considering spatiotemporal approaches involving ecological traits, environmental data, and soil cover and other characteristics that help to confirm what occurs in river ecosystems is needed.
Finally, it is important to carry out this type of study in the rivers of the Ecuadorian Amazon to promote alternatives for the protection and conservation of water sources, especially those that are used by the population for agricultural purposes or recreational activities.

Supplementary Materials

The following supporting information can be downloaded at: https://www.mdpi.com/article/10.3390/su15075790/s1, Table S1: Hydromorphological and chemical data from the four samplings times (M) in the five sites of the Yanaquincha River. BR = Beginning of the river, EPC = Entrance to the population center, PC = Population center, EFPC = Exit from the population center, and FR = End of the river.

Author Contributions

Conceptualization, T.V.-T., S.S.-C., V.M.-L. and Y.V.-T.; methodology, T.V.-T. and L.T.-J.; statistical analysis, T.V.-T. and Y.V.-T.; writing—original draft preparation, T.V.-T., V.M.-L., S.S.-C., W.V-A., W.V.-C. and Y.V.-T.; writing—review and editing, T.V.-T., S.S.-C., V.M.-L., W.V.-A., W.V.-C. and Y.V.-T. All authors have read and agreed to the published version of the manuscript.

Funding

This research was financed by the Escuela Superior Politécnica de Chimborazo (ESPOCH).

Institutional Review Board Statement

Not applicable.

Informed Consent Statement

Not applicable.

Data Availability Statement

Data is contained within the article.

Acknowledgments

We thank Fernando Paredes for his collaboration in the preparation of the maps. Authors thanks reviewers for their valuable comments and suggestions for this manuscript.

Conflicts of Interest

The authors declare no conflict of interest.

References

  1. Martínez-Austria, P.F. Los retos de la seguridad hídrica. Tecnol. Cienc. Agua 2013, 4, 165–180. [Google Scholar]
  2. Sinche, F.; Cabrera, M.; Vaca, L.; Segura, E.; Carrera, P. Determination of the Ecological Water Quality in the Orienco Stream Using Benthic Macroinvertebrates in the Northern Ecuadorian Amazon. Integr. Environ. Assess. Manag. 2022, 11. [Google Scholar] [CrossRef]
  3. Cabrera, S.; Eurie Forio, M.A.; Lock, K.; Vandenbroucke, M.; Oña, T.; Gualoto, M.; Goethals, P.L.M.; Van der heyden, C. Variations in Benthic Macroinvertebrate Communities and Biological Quality in the Aguarico and Coca River Basins in the Ecuadorian Amazon. Water 2021, 13, 1692. [Google Scholar] [CrossRef]
  4. Oñate-Valdivieso, F.; Massa-Sánchez, P.; León, P.; Oñate-Paladines, A.; Cisneros, M. Application of Ostrom’s Institutional Analysis and Development Framework in River Water Conservation in Southern Ecuador. Case Study—The Zamora River. Water 2021, 13, 3536. [Google Scholar] [CrossRef]
  5. Wingfield, S.; Martínez-Moscoso, A.; Quiroga, D.; Ochoa-Herrera, V. Challenges to Water Management in Ecuador: Legal Authorization, Quality Parameters, and Socio-Political Responses. Water 2021, 13, 1017. [Google Scholar] [CrossRef]
  6. Borja-Serrano, P.; Ochoa-Herrera, V.; Maurice, L.; Morales, G.; Quilumbaqui, C.; Tejera, E.; Machado, A. Determination of the Microbial and Chemical Loads in Rivers from the Quito Capital Province of Ecuador (Pichincha)—A Preliminary Analysis of Microbial and Chemical Quality of the Main Rivers. Int. J. Environ. Res. Public. Health 2020, 17, 5048. [Google Scholar] [CrossRef] [PubMed]
  7. Gobierno Autónomo Descentralizado La Joya de los Sachas Plan de Ordenamiento Territorial La Joya de los Sachas 2019–2023. Available online: https://mega.nz/file/blwDkAIC#eil1MNPjiEVdkW0F6tWh39-v-UeBLEj3yMDP4Q-G7hY (accessed on 24 January 2022).
  8. Dominguez-Granda, L.; Lock, K.; Goethals, P.L.M. Using Multi-Target Clustering Trees as a Tool to Predict Biological Water Quality Indices Based on Benthic Macroinvertebrates and Environmental Parameters in the Chaguana Watershed (Ecuador). Ecol. Inform. 2011, 6, 303–308. [Google Scholar] [CrossRef]
  9. Damanik-Ambarita, M.N.; Lock, K.; Boets, P.; Everaert, G.; Nguyen, T.H.T.; Forio, M.A.E.; Musonge, P.L.S.; Suhareva, N.; Bennetsen, E.; Landuyt, D.; et al. Ecological Water Quality Analysis of the Guayas River Basin (Ecuador) Based on Macroinvertebrates Indices. Limnologica 2016, 57, 27–59. [Google Scholar] [CrossRef]
  10. Gabriels, W.; Lock, K.; De Pauw, N.; Goethals, P.L.M. Multimetric Macroinvertebrate Index Flanders (MMIF) for Biological Assessment of Rivers and Lakes in Flanders (Belgium). Limnol.—Ecol. Manag. Inland Waters 2010, 40, 199–207. [Google Scholar] [CrossRef] [Green Version]
  11. Desrosiers, M.; Pinel-Alloul, B.; Spilmont, C. Selection of Macroinvertebrate Indices and Metrics for Assessing Sediment Quality in the St. Lawrence River (QC, Canada). Water 2020, 12, 3335. [Google Scholar] [CrossRef]
  12. Ramírez, A.; Gutiérrez-Fonseca, P.E. Functional feeding groups of aquatic insect families in Latin America: A critical analysis and review of existing literature. Rev. Biol. Trop. 2014, 62, 155–167. [Google Scholar] [CrossRef]
  13. Larsen, S.; Bruno, M.C.; Vaughan, I.P.; Zolezzi, G. Testing the River Continuum Concept with Geostatistical Stream-Network Models. Ecol. Complex. 2019, 39, 100773. [Google Scholar] [CrossRef] [Green Version]
  14. Beck, H.E.; Zimmermann, N.E.; McVicar, T.R.; Vergopolan, N.; Berg, A.; Wood, E.F. Present and Future Köppen-Geiger Climate Classification Maps at 1-Km Resolution. Sci. Data 2018, 5, 180214. [Google Scholar] [CrossRef] [PubMed] [Green Version]
  15. Poma-Copa, M.P.; Usca-Tiuquinga, M.R. Estimación del balance hídrico climático (BHC) de las microcuencas del cantón Joya de los Sacha, Orellana. FIPCAEC 2020, 5, 3–26. [Google Scholar]
  16. Helson, J.E.; Williams, D.D. Development of a Macroinvertebrate Multimetric Index for the Assessment of Low-Land Streams in the Neotropics. Ecol. Indic. 2013, 29, 167–178. [Google Scholar] [CrossRef]
  17. Pauta-Calle, G.; Velazco, M.; Gutierrez, D.; Vázquez, G.; Rivera, S.; Morales, O.; Abril, A. Evaluación de la calidad del agua de los ríos de la ciudad de Cuenca, Ecuador. Maskana 2019, 10, 76–88. [Google Scholar] [CrossRef]
  18. Ann, M.; Franson, H. Métodos Normalizados Para el Análisis de Aguas Potables y Residuales APHA-AWWA-WPCF 978-84-7978-031-9; Díaz de Santos, S.A.: Madrid, Spain, 1992; 1830p. [Google Scholar]
  19. Rodríguez Badillo, L.; Ríos Guayasamín, P.; Espinosa Chico, M.; Cedeño Loja, P.; Jiménez Ortiz, G.; Rodríguez Badillo, L.; Ríos Guayasamín, P.; Espinosa Chico, M.; Cedeño Loja, P.; Jiménez Ortiz, G. Caracterización de la calidad de agua mediante macroinvertebrados bentónicos en el río Puyo, en la Amazonía Ecuatoriana. Hidrobiológica 2016, 26, 497–507. [Google Scholar] [CrossRef] [Green Version]
  20. Mena-Rivera, L.; Vásquez-Bolaños, O.; Gómez-Castro, C.; Fonseca-Sánchez, A.; Rodríguez-Rodríguez, A.; Sánchez-Gutiérrez, R. Ecosystemic Assessment of Surface Water Quality in the Virilla River: Towards Sanitation Processes in Costa Rica. Water 2018, 10, 845. [Google Scholar] [CrossRef] [Green Version]
  21. Dominguez, E.; Molineri, C.; Nieto, C. Macroinvertebrados Bentónicos Sudamericanos—Sistemática y Biología; Fundación Miguel Lillio: Tucuman, Argentina, 2009; 92p. [Google Scholar]
  22. Thorp, J.H.; Rogers, D.C. Covich’s Freshwater Invertebrates; Academic Press: Boston, MA, USA, 2016; 1016p. [Google Scholar]
  23. Coccia, C.; Vega, C.; Fierro, P. Macroinvertebrate-Based Biomonitoring of Coastal Wetlands in Mediterranean Chile: Testing Potential Metrics Able to Detect Anthropogenic Impacts. Water 2022, 14, 3449. [Google Scholar] [CrossRef]
  24. Wakhid, W.; Rauf, A.; Krisanti, M.; Sumertajaya, I.M.; Maryana, N. Species Richness and Diversity of Aquatic Insects Inhabiting Rice Fields in Bogor, West Java, Indonesia. Biodiversitas J. Biol. Divers. 2020, 21, 34–42. [Google Scholar] [CrossRef]
  25. R Core Team. R Core Team—CNET Download. Available online: https://download.cnet.com/developer/r-core-team/i-6264363/ (accessed on 11 January 2023).
  26. Braga, F.H.R.; Dutra, M.L.S.; Lima, N.S.; Silva, G.M.; Miranda, R.C.M.; Firmo, W.C.A.; Moura, A.R.L.; Monteiro, A.S.; Silva, L.C.N.; Silva, D.F.; et al. Study of the Influence of Physicochemical Parameters on the Water Quality Index (WQI) in the Maranhão Amazon, Brazil. Water 2022, 14, 1546. [Google Scholar] [CrossRef]
  27. Xuan, Y.; Tang, C.; Cao, Y. Mechanisms of Nitrate Accumulation in Highly Urbanized Rivers: Evidence from Multi-Isotopes in the Pearl River Delta, China. J. Hydrol. 2020, 587, 124924. [Google Scholar] [CrossRef]
  28. Huang, J.; Yin, H.; Chapra, S.C.; Zhou, Q. Modelling Dissolved Oxygen Depression in an Urban River in China. Water 2017, 9, 520. [Google Scholar] [CrossRef] [Green Version]
  29. Huey, G.M.; Meyer, M.L. Turbidity as an Indicator of Water Quality in Diverse Watersheds of the Upper Pecos River Basin. Water 2010, 2, 273–284. [Google Scholar] [CrossRef]
  30. Gad, M.; Saleh, A.H.; Hussein, H.; Farouk, M.; Elsayed, S. Appraisal of Surface Water Quality of Nile River Using Water Quality Indices, Spectral Signature and Multivariate Modeling. Water 2022, 14, 1131. [Google Scholar] [CrossRef]
  31. Momeni, M.M.; Kahforoushan, D.; Abbasi, F.; Ghanbarian, S. Using Chitosan/CHPATC as Coagulant to Remove Color and Turbidity of Industrial Wastewater: Optimization through RSM Design. J. Environ. Manag. 2018, 211, 347–355. [Google Scholar] [CrossRef] [PubMed]
  32. Lannergård, E.E.; Ledesma, J.L.J.; Fölster, J.; Futter, M.N. An Evaluation of High Frequency Turbidity as a Proxy for Riverine Total Phosphorus Concentrations. Sci. Total Environ. 2019, 651, 103–113. [Google Scholar] [CrossRef]
  33. FAO Acuerdo No 97/A—Norma de Calidad Ambiental y de Descarga de Efluentes al Recurso Agua (Anexo 1, Libro VI de La Calidad Ambiental, Del Texto Unificado de La Legislación Secundaria Del Ministerio Del Ambiente). Available online: https://www.ecolex.org/details/legislation/acuerdo-no-97a-norma-de-calidad-ambiental-y-de-descarga-de-efluentes-al-recurso-agua-anexo-1-libro-vi-de-la-calidad-ambiental-del-texto-unificado-de-la-legislacion-secundaria-del-ministerio-del-ambiente-lex-faoc155128/ (accessed on 6 January 2023).
  34. Gomolka, Z.; Twarog, B.; Zeslawska, E. State Analysis of the Water Quality in Rivers in Consideration of Diffusion Phenomenon. Appl. Sci. 2022, 12, 1549. [Google Scholar] [CrossRef]
  35. Tian, S.; Wang, Z.; Shang, H. Study on the Self-Purification of Juma River. Procedia Environ. Sci. 2011, 11, 1328–1333. [Google Scholar] [CrossRef] [Green Version]
  36. Md Anawar, H.; Chowdhury, R. Remediation of Polluted River Water by Biological, Chemical, Ecological and Engineering Processes. Sustainability 2020, 12, 7017. [Google Scholar] [CrossRef]
  37. Tomanova, S.; Tedesco, P.A. Tamaño corporal, tolerancia ecológica y potencial de bioindicación de la calidad del agua de Anacroneuria spp. (Plecoptera: Perlidae) en América del Sur. Rev. Biol. Trop. 2007, 55, 67–81. [Google Scholar] [CrossRef] [Green Version]
  38. Sokolova, N.Y.; Paliy, A.V.; Izvekova, B.I. Biology OfChironomus Piger Str. (Diptera: Chironomidae) and Its Role in the Self-Purification of a River. Netherland J. Aquat. Ecol. 1992, 26, 509–512. [Google Scholar] [CrossRef]
  39. Ramírez, A.; Pringle, C.M. Fast Growth and Turnover of Chironomid Assemblages in Response to Stream Phosphorus Levels in a Tropical Lowland Landscape. Limnol. Oceanogr. 2006, 51, 189–196. [Google Scholar] [CrossRef]
  40. Loaiza, M.J.T.; Soto, C.G. Variación estructural de familias de macroinvertebrados acuáticos y su relación con la calidad de agua en quebradas asociadas a cultivos de café y ganadería vacuna en el sector de La Tagua, Sierra Nevada de Santa Marta. Rev. Acad. Colomb. Cienc. Exactas Físicas Nat. 2022, 46, 206–216. [Google Scholar] [CrossRef]
  41. Ab Hamid, S.; Salmah, M.; Nurul Huda, A. Composition and Distribution of Odonata Larvae and Its Relationship with Physicochemical Water Quality in Northern Peninsular Malaysia. Malays. J. Sci. 2016, 35, 198–209. [Google Scholar]
  42. Gutiérrez-Chacon, C.; Zúñiga, M.D.C.; Van Bodegom, P.M.; Chará, J.; Giraldo, L.P. Rove Beetles (Coleoptera: Staphylinidae) in Neotropical Riverine Landscapes: Characterising Their Distribution. Insect Conserv. Divers. 2009, 2, 106–115. [Google Scholar] [CrossRef]
  43. Alcamo, J. Water Quality and Its Interlinkages with the Sustainable Development Goals. Curr. Opin. Environ. Sustain. 2019, 36, 126–140. [Google Scholar] [CrossRef]
Figure 1. Study area where sampling was carried out in the Yanaquincha River. The codes used for the sampling sites were: the BR (beginning of the river), the EPC (beginning of the population center), the PC (population center), the EFPC (exit from the population center), and the FR (end of the river).
Sustainability 15 05790 g001
Figure 2. Map showing the quality of the water in the sampling sites. The main rivers within the Coca River basin are shown. Bad or critical (heavily polluted waters), moderate or doubtful (slightly polluted waters, some effect of pollution is noticeable), and poor or acceptable (moderately polluted) waters are shown.
Sustainability 15 05790 g002
Figure 3. Diagram of main components of the Yanaquincha River. The BMWP-Col index is displayed with colors based on the water quality. Physicochemical and hydromorphological variables are indicated in gray letters. The categories are bad or critical (heavily polluted waters), moderate or doubtful (slightly polluted waters where some effect of pollution is noticeable), and poor or acceptable (moderately polluted waters). The numbers 1, 2, 3, and 4 represent the sampling campaign.
Sustainability 15 05790 g003
Figure 4. Abundance of benthic macroinvertebrates according to functional feeding groups, where CG, Pr, Ft, Sh, Dt, SC, and NI refer to collectors, predators, filter-feeders, shredders, detritivores, scrapers, not identified, respectively.
Sustainability 15 05790 g004
Figure 5. Abundance of benthic macroinvertebrates according to functional feeding groups, where CG, Pr, Ft, Sh, Dt, SC and NI refer to foragers, predators, filter feeders, shredders, de-tritivores, scrapers, and not identified, respectively. Upstream, center, and downstream sections of the river.
Sustainability 15 05790 g005
Table 1. Means, minimum (min), maximum (max), standard deviation (SD), and confidence interval of the variables taken at the 5 sampling points along the Yanaquincha River.
VariableBREPCPCEFPCFR
Temperature (°C)23.924.924.525.025.4
Min23.524.124.224.324.9
Max24.525.527.526.026.0
SD0.450.601.450.730.47
Confidence interval23.4–24.424.3–25.523.1–25.924.3–25.723.1–25.9
PO4−P (mg L−1) 0.420.690.440.600.54
Min0.210.180.210.30.25
Max0.531.590.680.80.74
SD0.150.620.220.240.22
Confidence interval0.26–0.570.08–1.300.22–0.660.36–0.840.32–0.76
Nitrate-(NO3) (mg L−1)0.400.450.580.550.55
Min0.20.30.220.50.4
Max0.70.70.80.60.7
SD0.240.190.250.060.13
Confidence interval0.16–0.630.25–0.640.33–0.830.49–0.610.43–0.66
Turbidity (FTU) 2.593.937.347.778.68
Min1.052.794.53.733.1
Max3.545.2410.714.819.3
SD1.121.03.034.977.33
Confidence interval1.49–3.692.95–4.913.04–6.902.91–12.631.51–15.90
DO (mg L−1)5.725.454.954.084.38
Min4.23.82.62.63.6
Max7.06.777.25.3
SD1.391.211.952.130.77
Confidence interval4.37–7.074.25–6.653.05–6.852.00–6.163.62–5.14
COD (mg L−1)12.111.213.613.910.2
Min10.010.010.010.010.0
Max18.314.319.920.610.8
SD4.132.14.45.00.4
Confidence interval8.04–16.169.14–13.269.31–17.908.96–18.849.83–10.57
BOD5 (mg L−1)0.81.020.91.120.8
Min00000
Max3.22.62.12.42.2
SD1.581.261.041.31.04
Confidence interval−0.74–2.35−0.21–2.25−0.12–1.92−0.15–2.39−0.74–2.34
TDS (mg L−1)53.967.365.073.6760.6
Min47.649.238.350.837.4
Max59.382.280.890.173.5
SD5.115.319.418.116.1
Confidence interval48.92–58.8852.31–82.3045.95–84.0555.93–91.4144.88–76.32
pH7.167.257.047.027.23
Min6.926.816.776.476.75
Max7.487.657.327.57.82
SD0.270.360.30.470.46
Confidence interval6.91–7.416.90–7.606.75–7.336.57–7.476.78–7.69
Fecal coliforms (col 100 mL−1)125578,155108,300363,1502925
Min500420720096001100
Max2100300,000390,0001,400,0007200
SD767.75147,975187,913.4691,265.92864
Confidence interval502.61–2007.39−66,860.5–223,170.5−75,855.07–292,455.07−314,290.48–140,590.48118.28–5731.72
TPH (mg L−1)0.050.060.050.050.05
Min0.050.050.050.050.05
Max0.050.060.050.060.06
SD00.01000
Confidence interval0.05–0.050.06–0.060.05–0.050.05–0.050.05–0.05
Flow velocity (m s−1)26.4224.925.2116.6121.47
Min26.0823.5116.3212.2614.56
Max26.8826.6136.0322.2932.2
SD0.341.298.184.27.68
Confidence interval26.08–26.7523.65–26.1517.19–33.2312.49–20.7313.94–28.99
Depth (m)0.250.380.710.920.75
Min0.20.220.510.660.61
Max0.320.570.881.211.02
SD0.050.150.150.230.19
Confidence interval0.19–0.310.24–0.520.55–0.870.70–1.140.55–0.95
Width (m)4.7410.628.346.2211.81
Min4.38.377.435.6710.2
Max5.2913.179.376.7713.73
SD0.411.970.80.451.46
Confidence interval4.33–5.158.68–12.567.56–9.125.78–6.6510.38–13.24
Table 2. Correlation analysis of environmental, hydromorphological, and biological variables.
BMWP-ColTemperatureVelocityRiver DepthRiver WidthpHTDSODDQOBOD5PO4−PO4NitratesTurbidityTPHColiforms
BMWP-Col1.00
Temperature−0.53 *1.00
Velocity0.31−0.39 *1.00
Depth−0.66 **0.70 **−0.57 **1.00
Width−0.45*0.70 **−0.140.321.00
pH0.17−0.090.14−0.270.041.00
TDS−0.220.26−0.58 **0.290.150.111.00
OD0.24−0.250.14−0.29−0.18−0.43 *−0.411.00
DQO−0.110.46 *0.14−0.20−0.300.080.06−0.061.00
DOD5−0.01−0.49 *−0.01−0.28−0.170.53 *0.16−0.030.581.00
PO4−P−0.06−0.33−0.22−0.11−0.11−0.10−0.220.150.310.401.00
Nitrates −0.360.20−0.090.250.20−0.210.10−0.330.29−0.15−0.081.00
Turbidity−0.64 **0.36−0.240.57 **0.37−0.300.35−0.330.360.07−0.010.49 *1.00
TPH0.09−0.05−0.09−0.260.150.300.17−0.080.44 *0.50*0.27−0.040.221.00
Coliforms−0.42−0.02−0.140.35−0.14−0.01−0.09−0.130.50 *0.270.44 *0.080.300.111.00
* significant at 0.05; ** significant at 0.01.
Table 3. Total abundance of families at sampling sites and tolerance scores according to BMWP-Col.
Sampling SiteOrderFamiliesAbundanceTolerance BMWP-Col
FRColeopteraStaphylinidae726
DipteraChironomidae562
VeneroidaSphaeriidae474
Trichoptera Hydropsychidae407
EphemeropteraLeptophlebii319
ColeopteraElmidae246
OdonataGomphidae1610
EPCColeopteraPtilodactylida5710
Hydraenidae469
HeteropteraNaucoridae447
OdonataGomphidae3910
EphemeropteraLeptophlebi329
Baetidae237
Calopterygidae167
TrichopteraLeptoceridae138
EFPCOdonataCoenagrionidae647
OdonataGomphidae4610
Dytiscidae379
Staphylinidae276
ColeopteraPtilodactylidae2610
BasommatophoraLymnaeidae214
OligochaetaAnnelida181
BRPlecopteraPerlidae9110
DipteraChironomidae602
Ptilodactylidae5510
EphemeropteraLeptophlebi489
ColeopteraHydraenidae319
TrichopteraHydropsychida285
OdonataCoenagrionidae247
Muscidae202
DecapodaPalaeomonidae188
Gomphidae1610
PCOligochaetaAnnelida1261
Muscidae562
DipteraChironomidae502
AmphipodaHyalellidae327
TrichopteraHydrobiosidae.219
EphemeropteraLeptophlebii179
Disclaimer/Publisher’s Note: The statements, opinions and data contained in all publications are solely those of the individual author(s) and contributor(s) and not of MDPI and/or the editor(s). MDPI and/or the editor(s) disclaim responsibility for any injury to people or property resulting from any ideas, methods, instructions or products referred to in the content.

