1. Introduction
The agri-food industry has become a world-leading sector, producing large quantities of highly colored effluents. It is known that the existence of industrial pollutants is an important source of risk in industrial facilities’ discharges, especially agri-food discharges, which pose serious problems to humans and the environment [
1,
2]. Most of these contaminants are undegradable and persistent [
3]. They are difficult to remove by traditional coagulation, filtration, or adsorption methods [
4,
5,
6]. These techniques are non-destructive and are based on a very simple transition of the pollution from one phase to another. Other water purification processes that are also available, such as biological processes, have been implemented. Although biological oxidation and adsorption are less expensive than other approaches, they are inefficient for the degradation of this type of pollutant; therefore, additional removal processes are required.
Therefore, it is important to look for innovative treatment solutions to tackle this problem. New technologies can be included; for instance, various wastewater treatment technologies are already used to completely destroy the remaining persistent pollutants.
For this purpose, heterogeneous photocatalysis has been identified as a valuable method [
7,
8] because of its ability to completely remove (mineralize) a wide variety of organic contaminants with no generation of dangerous intermediate products. Moreover, it has shown the ability to degrade a large variety of organic pollutants. Indeed, it has already been reported by researchers that TiO
2 is a catalyst that gives a high activity due to its large surface area [
9,
10].
Nevertheless, the semiconductor cannot be easily separated from the treated solution, so a recycling operation is required, which is expensive and difficult to implement on a large scale [
11]. Therefore, our goal in this paper was to optimize the efficiency of the catalyst and to not vary its concentration. To examine the stability of TiO
2 for each concentration of the dye, three reusability tests were performed that showed the stability of the catalyst due to the reproducibility of the results [
12]. Consequently, cellulose fibers coated with a mixture of catalyst (TiO
2 Millennium PC 500), zeolite, and silica were considered in this study.
Table 1 summarizes the different processes used for the photocatalytic treatment of wastewater from the food industry. To the best of our knowledge, there are no detailed studies on the degradation of brilliant blue in recirculating batch and ring reactors using the semiconductor TiO
2 Millennium PC 500, which was the focus of this study.
2. Materials and Methods
2.1. Chemicals
All the chemical reagents used were purchased from Sigma Aldrich, namely FCF Brilliant Blue E133 (
Table 2) under the reference code 229730050 and CAS number 3844-45-9, NaCl 99%, Na2HPO4 99%, (HCl 37%), (NaOH, 98%). Stock samples were prepared from high purity water produced by a Millipore Milli-Q system.
2.2. Catalyst and Reactor
2.2.1. Catalyst
The photocatalytic medium supplied by Ahlstrom Company, under the reference Alhström_1048, was a nonwoven textile composed of cellulose fibers coated with a mixture of catalyst (TiO2 Millennium PC 500), zeolite, and silica. Their mass per square meter were 16.5, 3.4, and 13.3 g m−2, respectively. The thickness of the catalyst layer was equal to 250 μm. The median diameter of the pellets deposited on the medium was 1.4 μm.
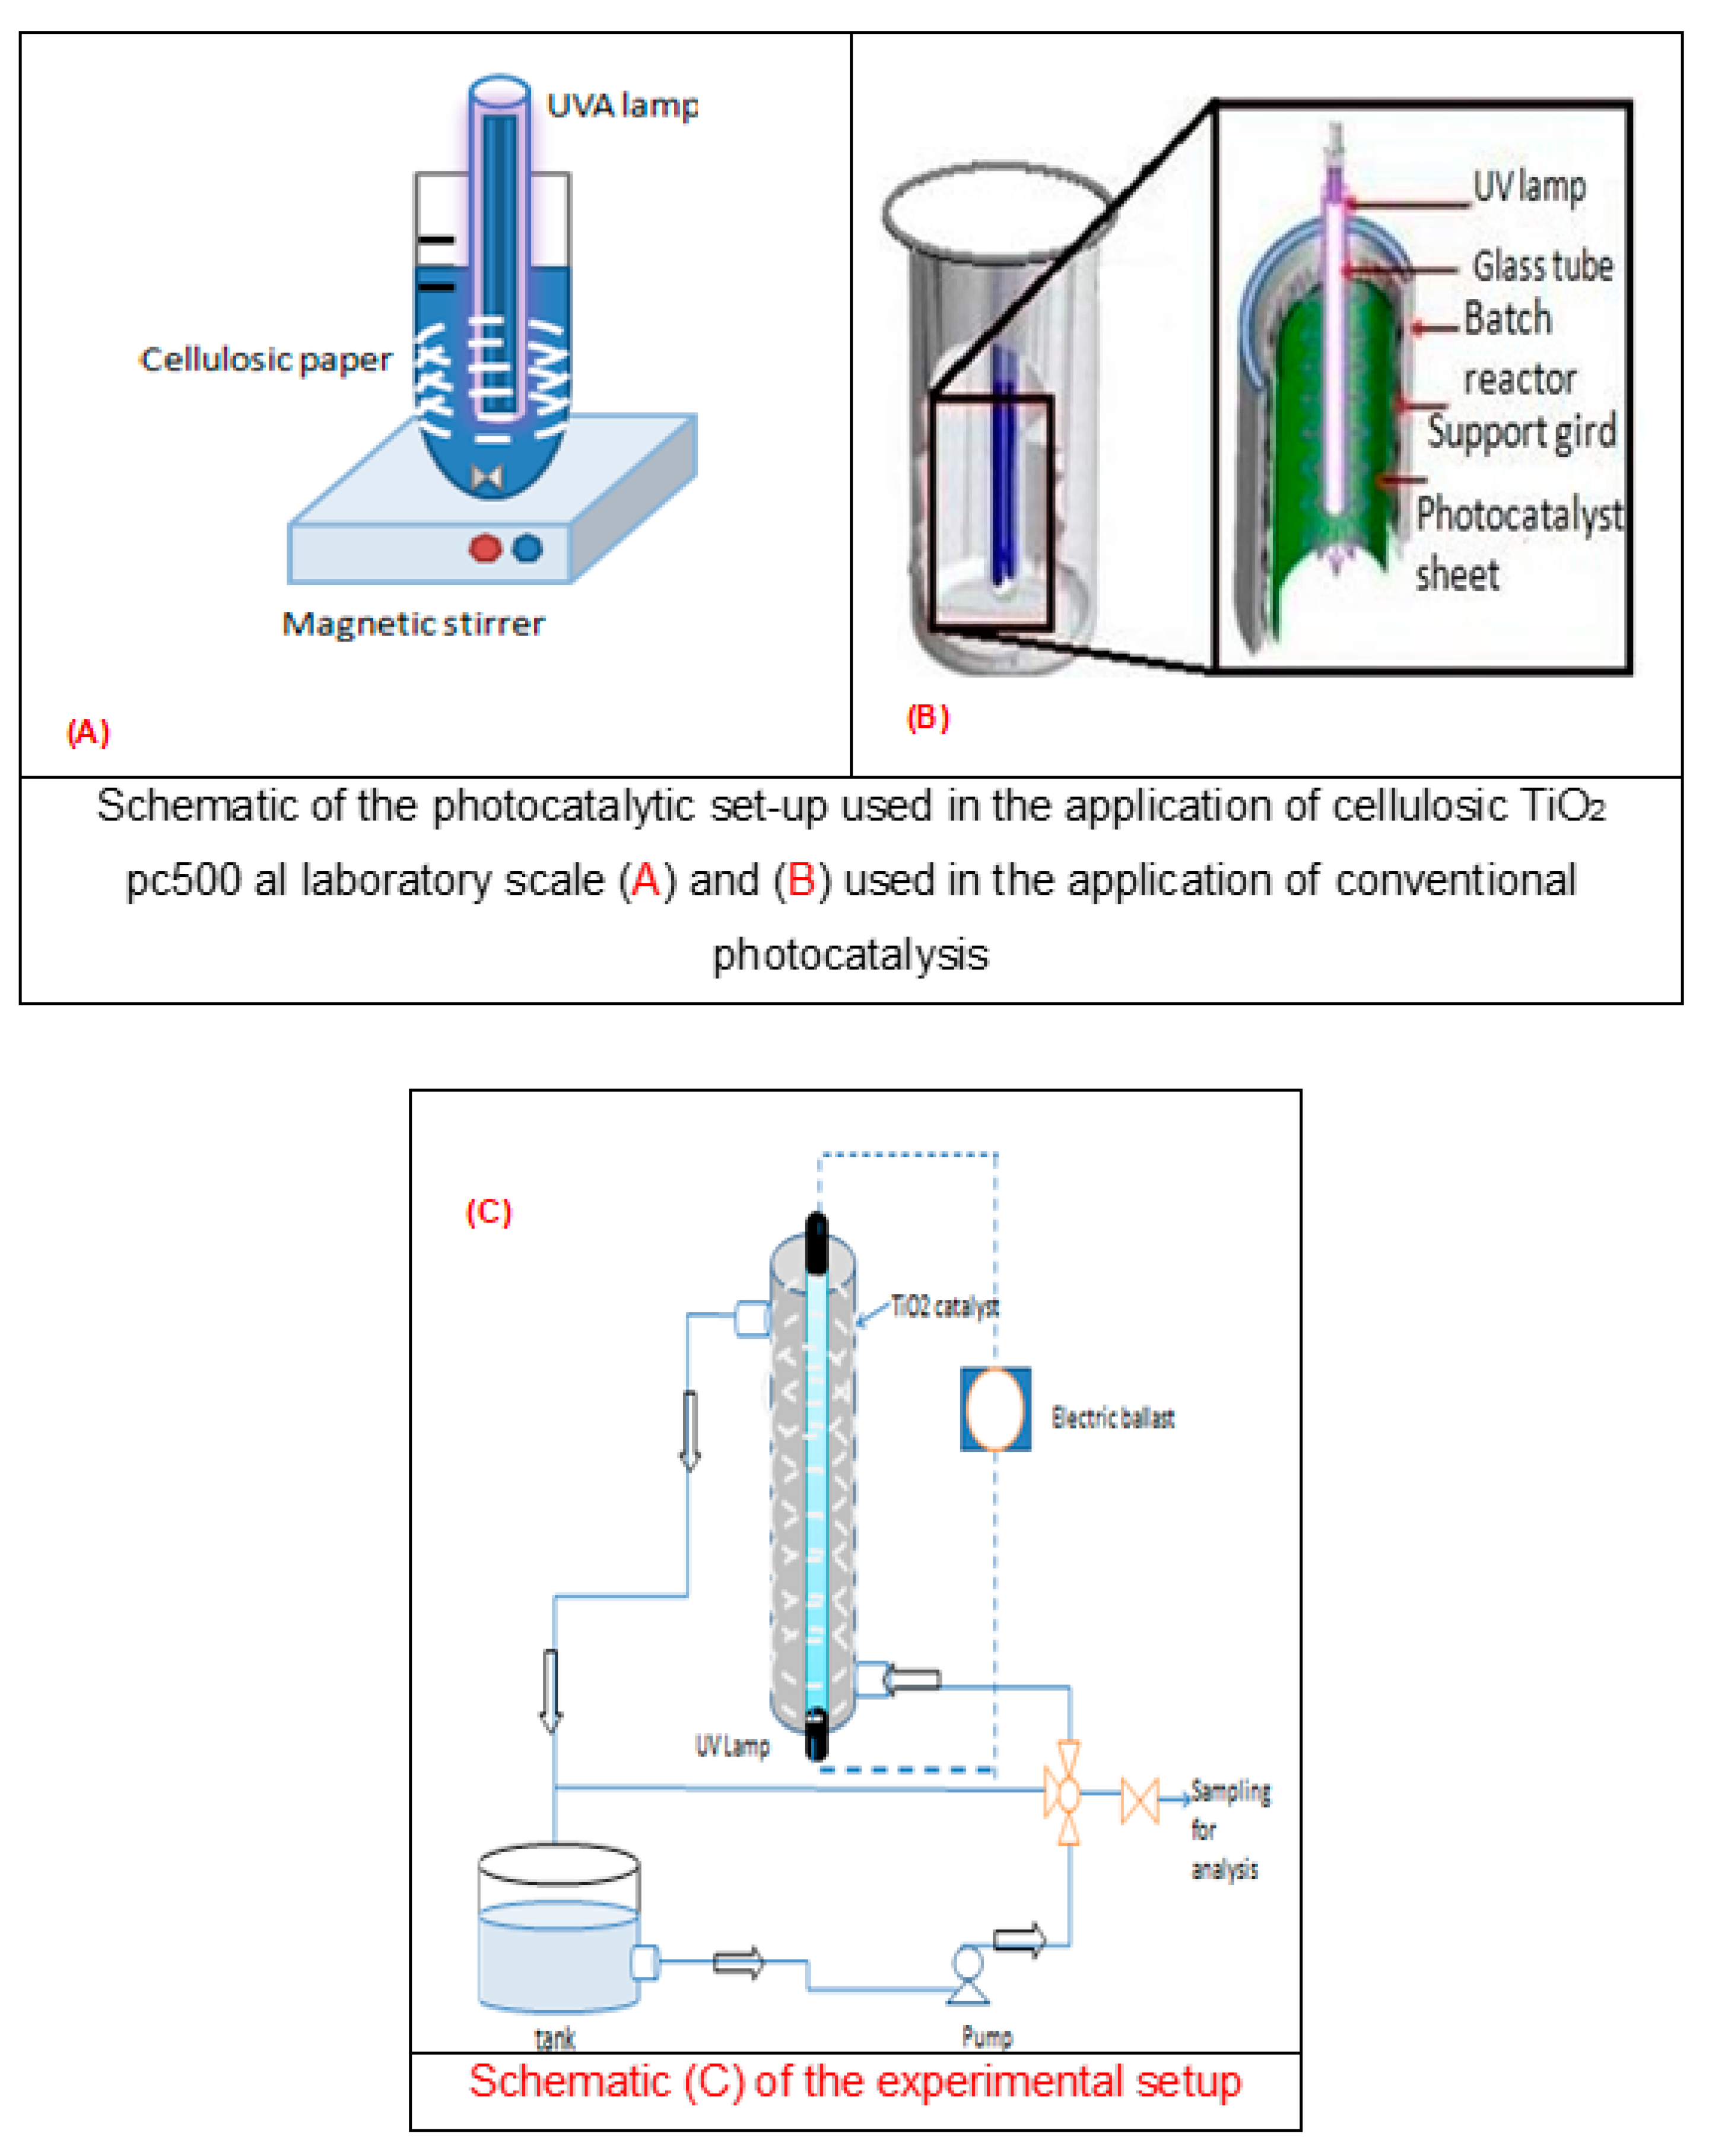
2.2.2. Batch Reactor
1 L solution of brilliant blue was placed in a reactor (
Figure 1A,B) with an UV lamp and a TiO
2 pc 500 photocatalyst supported on a cellulose paper surrounded inside the tank. The solution was covered with aluminum foil to shield it from ultraviolet rays and to improve the light intensity of the tank.
2.3. Pilot Reactor
The annular recirculation photoreactor (
Figure 1C) was composed of two concentric Pyrex tubes, using an 80 W UV light source. The luminous tube was positioned inside the cylinder. The large tube was 80 cm long and was coated with a photocatalytic medium. The surface area of the catalyst was 0.19 m
2. The bright blue pollutant passed across the interannular space corresponding with the area shaded in (
Figure 1C). In this study, the volume of the bright blue solution was fixed at 4 L, but the concentration of the pollutant was varied. The treatment of water was periodically sampled and analyzed. It is also important to state that the solution was kept in the dark for 20 min to attain adsorption equilibrium before photo-illumination.
Characterization
The morphological analysis of the TiO2 tissue of cellulosic paper was carried out by scanning electron microscopy (SEM) JEOL JFC-2300HR JEOL JSM-IT 100 with an acceleration voltage of 20 kV.
The absorbance measurements were carried out using a Shimadzu UV-1800 diode array spectrophotometer. Regarding vibrational analyses, they were carried out by Fourier transform infrared spectroscopy (FT/IR-4600).
2.4. Procedure
Conventional photocatalysis experiments were performed using a semiconductor (TiO
2) supported on cellulose paper in a conventional photoreactor with a central 30 W UVA lamp (Phillips PL-L24W/10/4P) with an emission peak at 365 nm; it was placed in a transparent, quartz, crystal tube and immersed in the photoreactor (
Figure 1A). A borosilicate glass beaker with a discontinuous scale was used as the reactor for the laboratory experiments. The reactor was filled with 1 L of aqueous solution and different initial concentrations of pollutants at room temperature. A magnetic stirrer was used to circulate and homogenize the medium. To examine the stability of the semiconductor, three cycles were carried out. Each time that the semiconductor was to be reused, it was washed with distilled water and left to dry, so that it could be ensured that the pores were free from the dyes and that, as shown in the degradation results, the catalyst had not lost its photocatalytic properties.
The surface area of the semiconductor used in the pilot scale was three times larger than that used in the laboratory scale. The experiments were performed in a recirculating ring reactor consisting of two concentric Pyrex tubes (
Figure 1C), operated in continuous mode, and fed with 4 L of contaminated solution at a flow rate of 200 m
3/h to 800 m
3/h.
TiO
2 regeneration was performed in ultrapure water under UVA and by shaking after each photocatalytic experiment. The photocatalyst was inserted into the reactor and UV irradiation was delivered by a light source. The solution was kept in the dark before light irradiation to reach an adsorption-desorption equilibrium between the pollutant and the photocatalyst. Aqueous pollutant concentrations were measured at the optimum dye absorption at 630 nm wavelength by a Shimadzu UV-1800 UV-vis spectrophotometer using a quartz cell. The degradation efficiency (%) was predicted using Equation (1):
C0: Initial concentration of BB.
CT: Concentration at time t, respectively.
The total organic carbon (TOC) was measured using a TOC analyzer (Shimadzu TOC-VCSH) and the yield rate was calculated according to Equation (2).
TOC0: Initial total organic carbon.
TOCT: Total organic carbon at time t.
3. Results and Discussion
The impact of several different parameters on the elimination of the bright blue pollutant FCF E133 was tested, specifically pH, initial concentration of the pollutant, and the effect of the addition of inorganic salts. The performances of the geometric configuration of the reactors (laboratory and pilot scale) were also tested and compared, as well as the reuse of the cellulosic paper. The process of degradation was followed by identifying both the decolorization of the pollutant (degradation) and the level of mineralization through spectrophotometry and the total organic carbon determination of the samples taken.
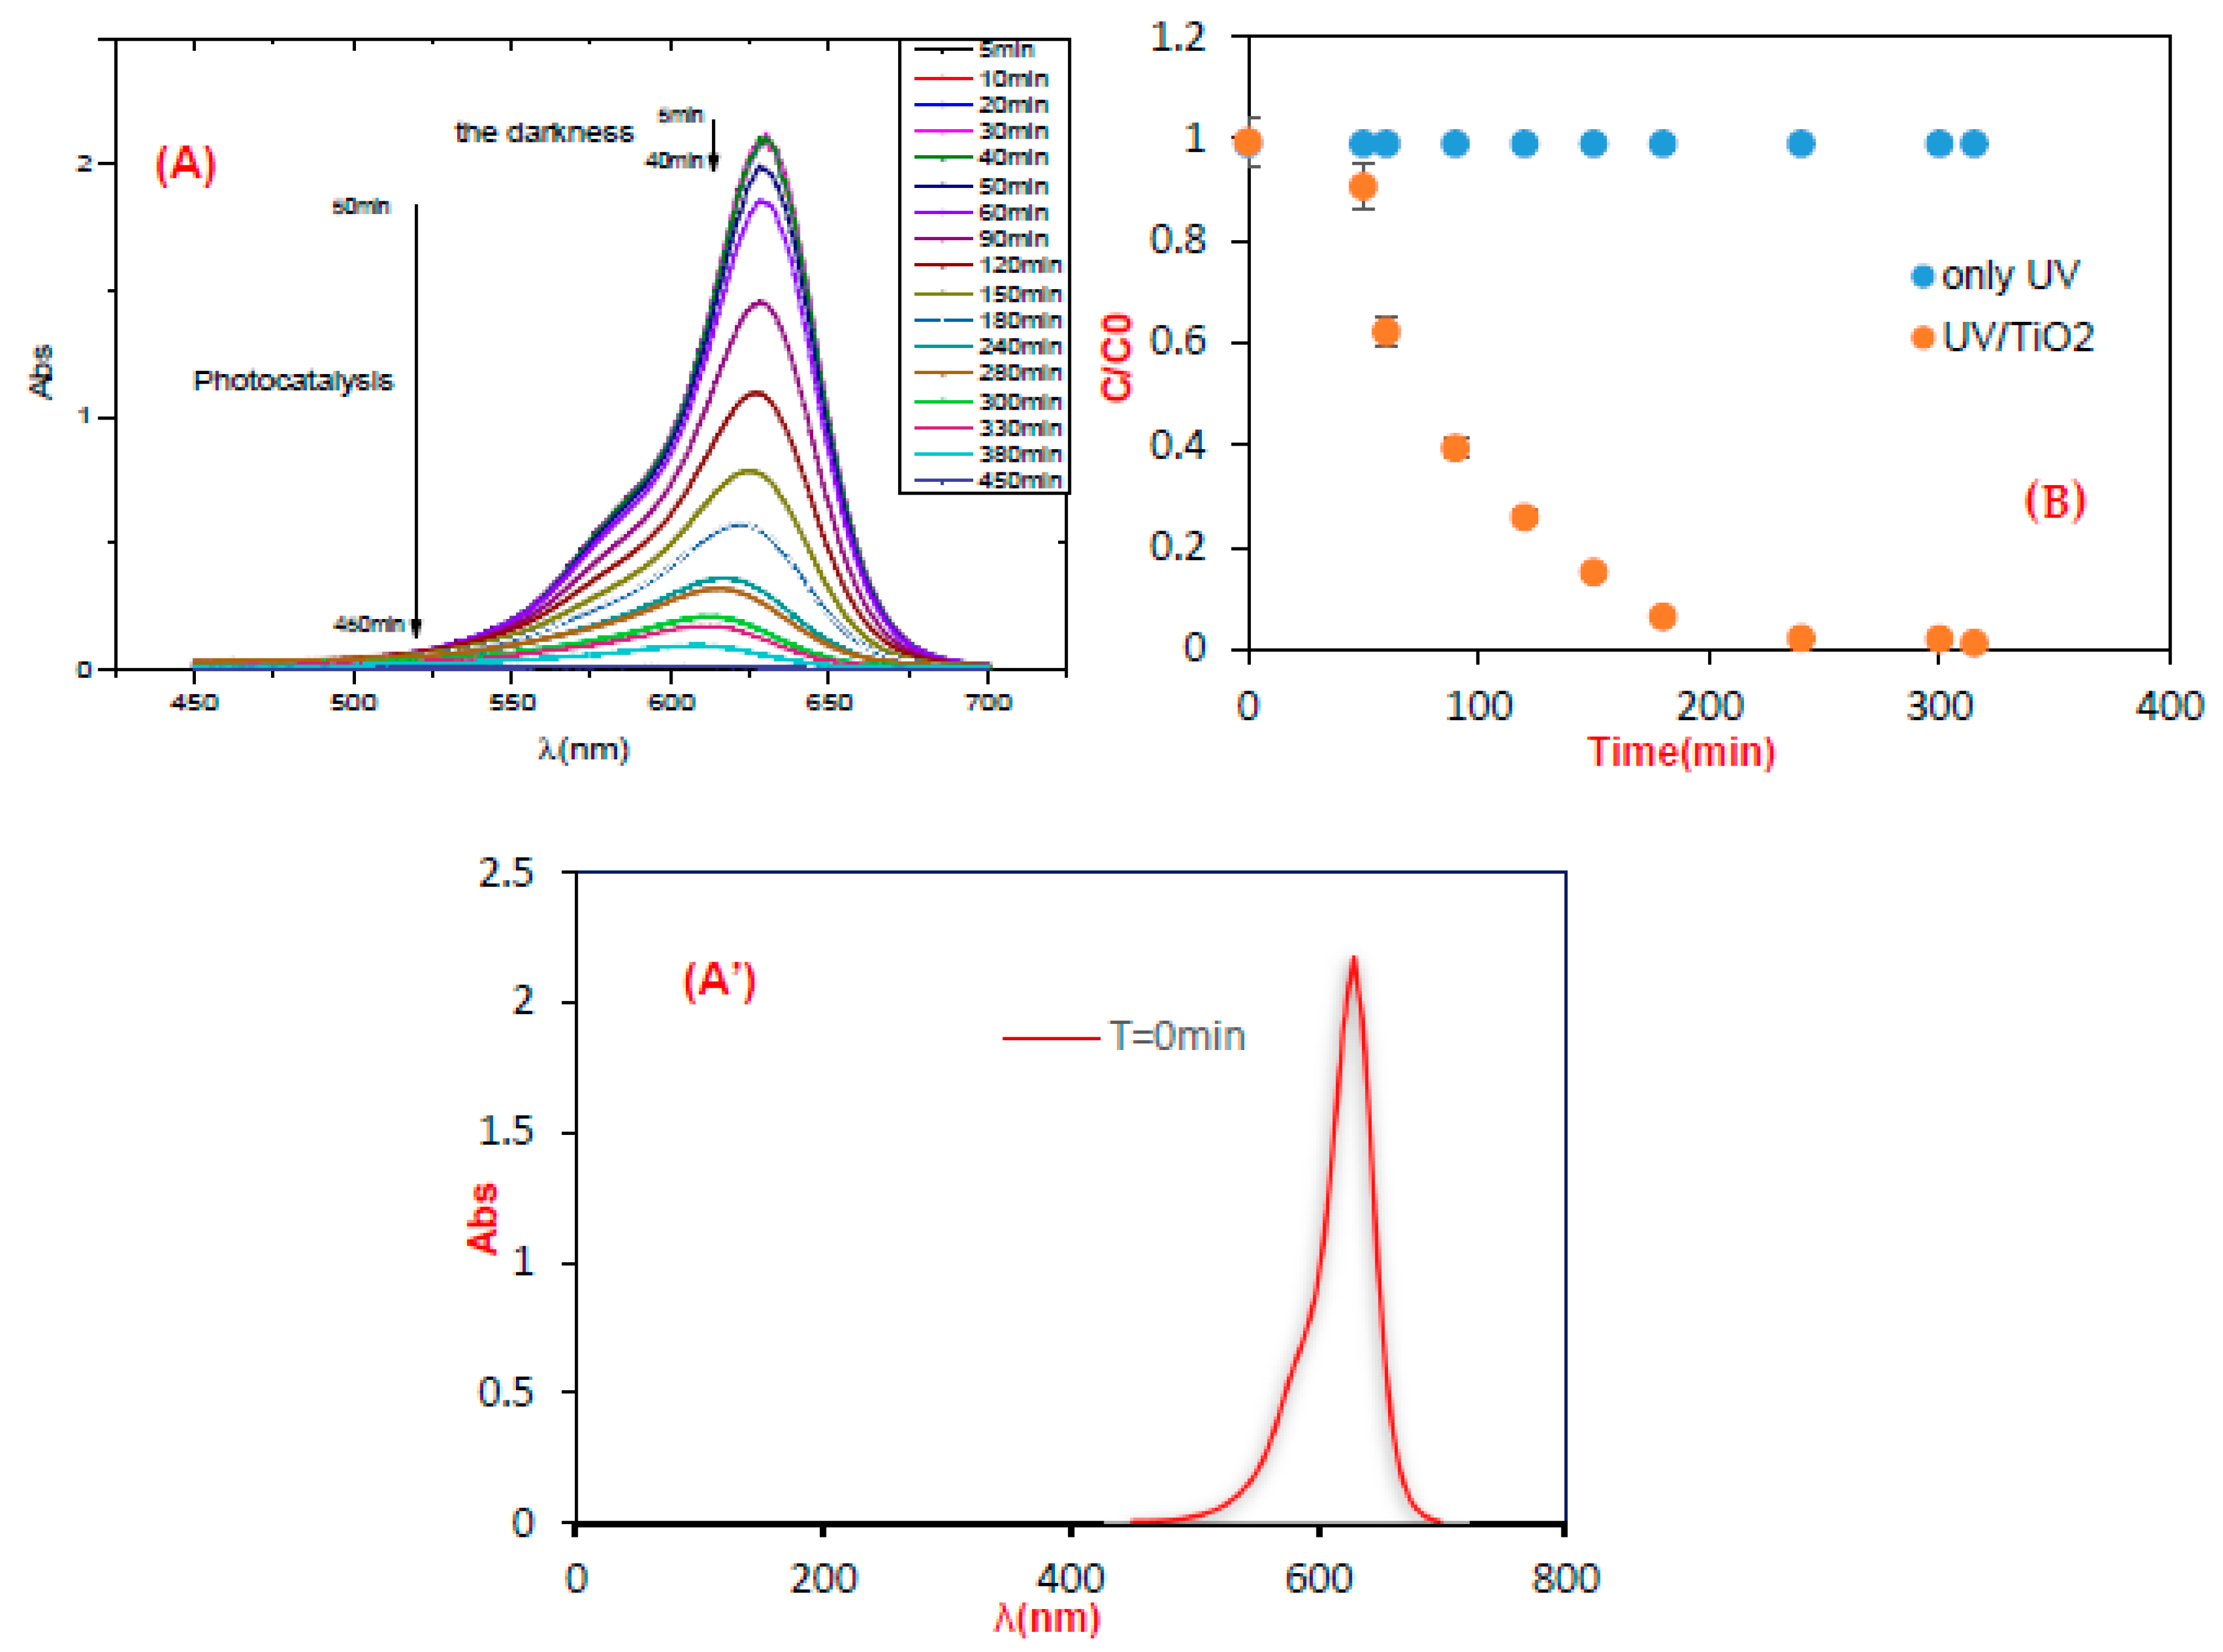
According to the results obtained, there was a degradation rate of 95.7% at a concentration of 10 ppm. Concerning possible photolysis, the observed stability showed that UV alone was not sufficient to degrade the target molecule (
Figure 2B) and hence, TiO
2 was necessary. Indeed, it has been shown that the photocatalytic degradation of organic matter in the solution is triggered by the photoexcitation of the semiconductor, with the subsequent creation of an even electron-hole on the catalyst surface (Equation (3)). The high oxidizing potential of the hole (h+ VB) in the catalyst allows for the immediate oxidation of organic matter (dye) to reactive intermediates (Equation (4)). Similarly, highly reactive hydroxyl radicals are formed either by the decomposition of water (Equation (5)) or by the reaction of the hole with OH- (Equation (6)). The hydroxyl radical is a highly selective and non-selective oxidant (E0 = +3.06 V) that leads to the partial or total mineralization of several organic products.
This radical, in the presence of organic traps, can form organic peroxides (Equation (7)) or hydrogen peroxide (Equation (8))
Conduction electrons are also responsible for producing hydroxyl radicals, which have been designated as the primary cause of mineralization of organic matter (Equation (9)) [
23,
24].
3.1. Laboratory Scale
3.1.1. Effect of the Pollutant Concentration
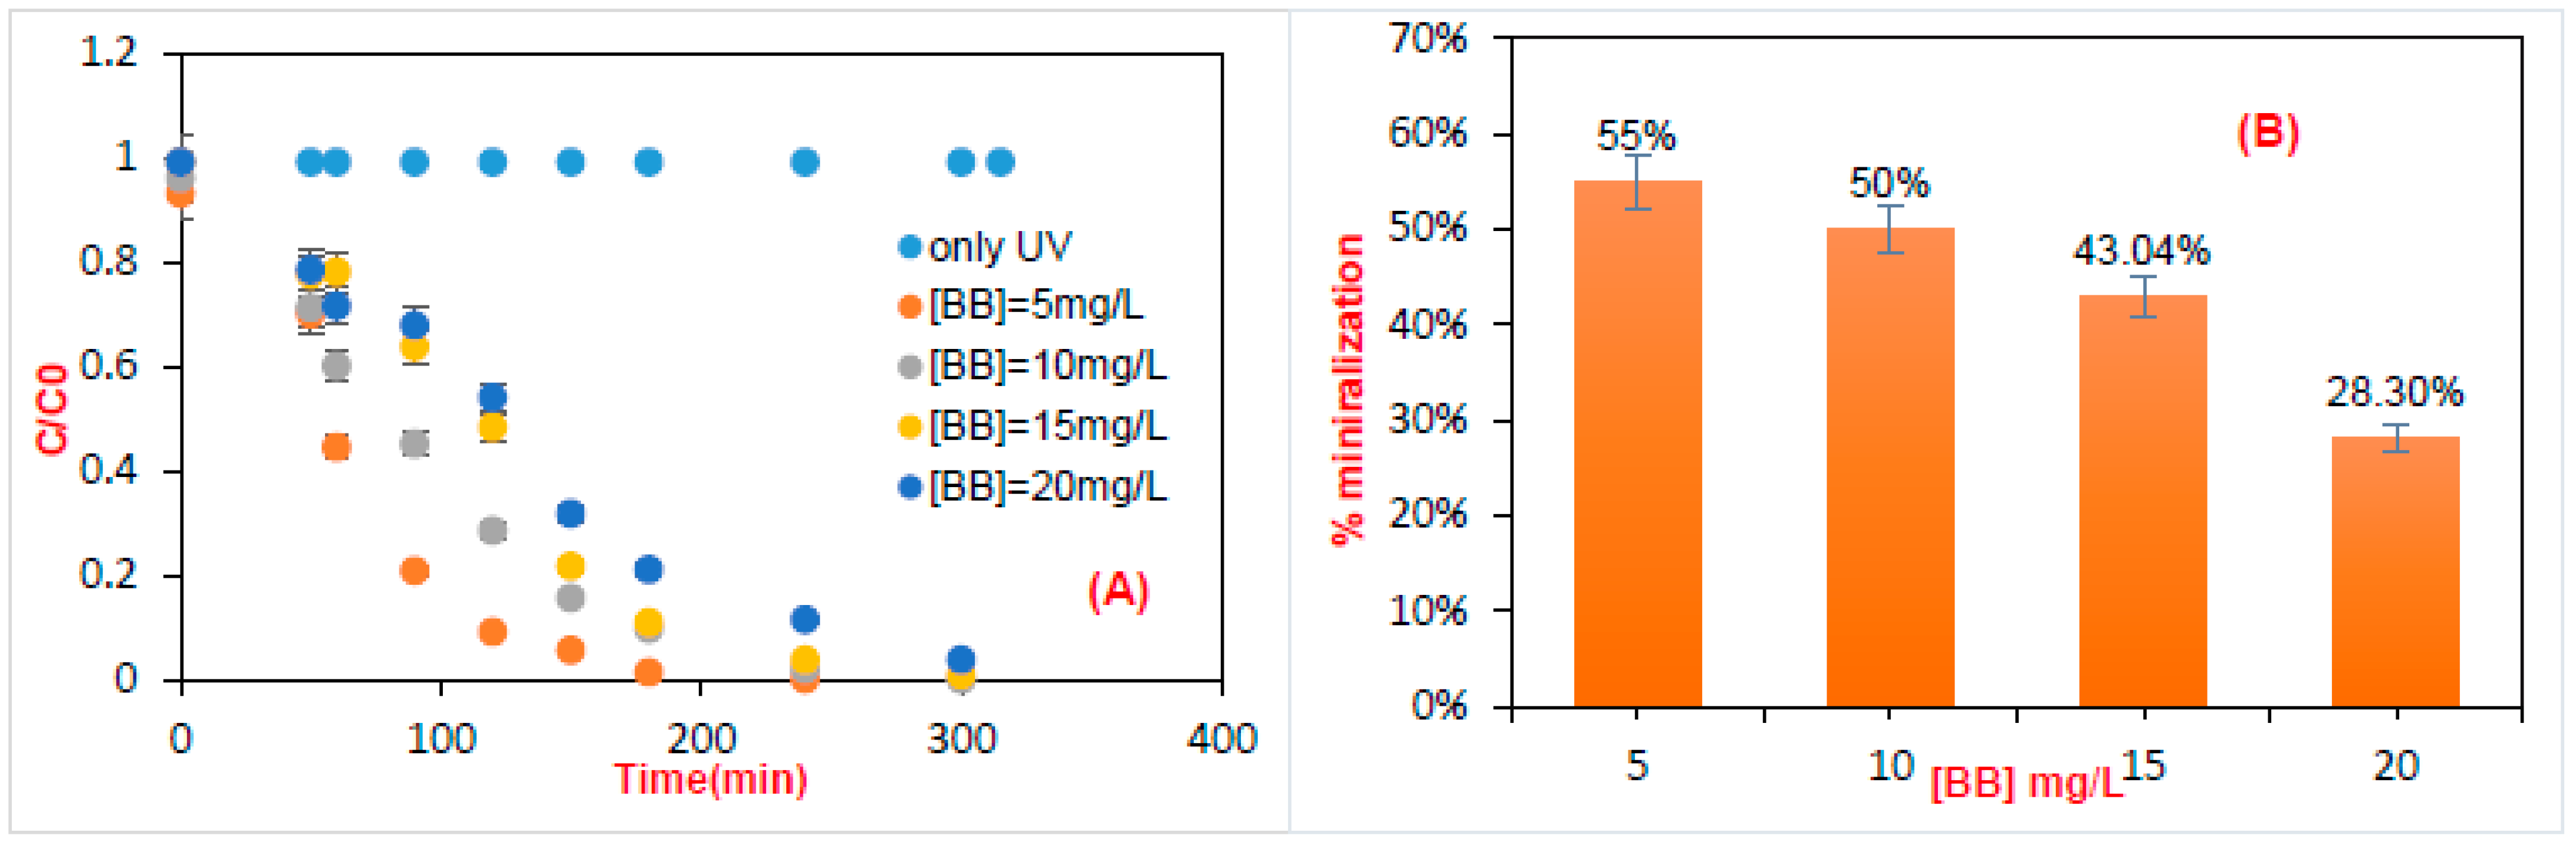
Figure 3A illustrates bright blue degradation efficiency using a batch photocatalytic reactor. The experiments were performed with a variance from 5 to 20 mg.L
−1 of pollutant. It was found that by increasing the concentration, the removal efficiencies of the pollutant decreased. This can be attributed to the influence of the pollutant input concentration on degradation kinetics, which must be related to the provision of the semiconductor-active sites. Many authors have reported similar results [
25,
26].
Figure 3B records the concentration impact on mineralization efficiency. As monitored, the 4-fold increase in concentration led to a 27% reduction in total organic carbon. This can be ascribed to the accessibility of free active sites on the catalyst surface (°OH, h+, etc.). Indeed, at high concentrations, the solution is rendered impermeable to UV irradiation, which leads to a poor production of radical hydroxyls and to a diminution of active sites [
27].
3.1.2. Study of the Catalyst Cycle
The rate of initial degradation of a wide variety of organic materials depends on the concentration of the semiconductor, but our objective in this paper was to optimize the efficiency of the catalyst and to not vary its concentration. To examine the stability of TiO
2 for each dye concentration, three tests were carried out that showed the stability of the catalyst owing to the reproducibility of the results (low error bars) (
Figure 3B). This explains why the treated photocatalyst did not lose its photocatalytic properties during the photocatalytic process.
3.1.3. FT-IR Analysis
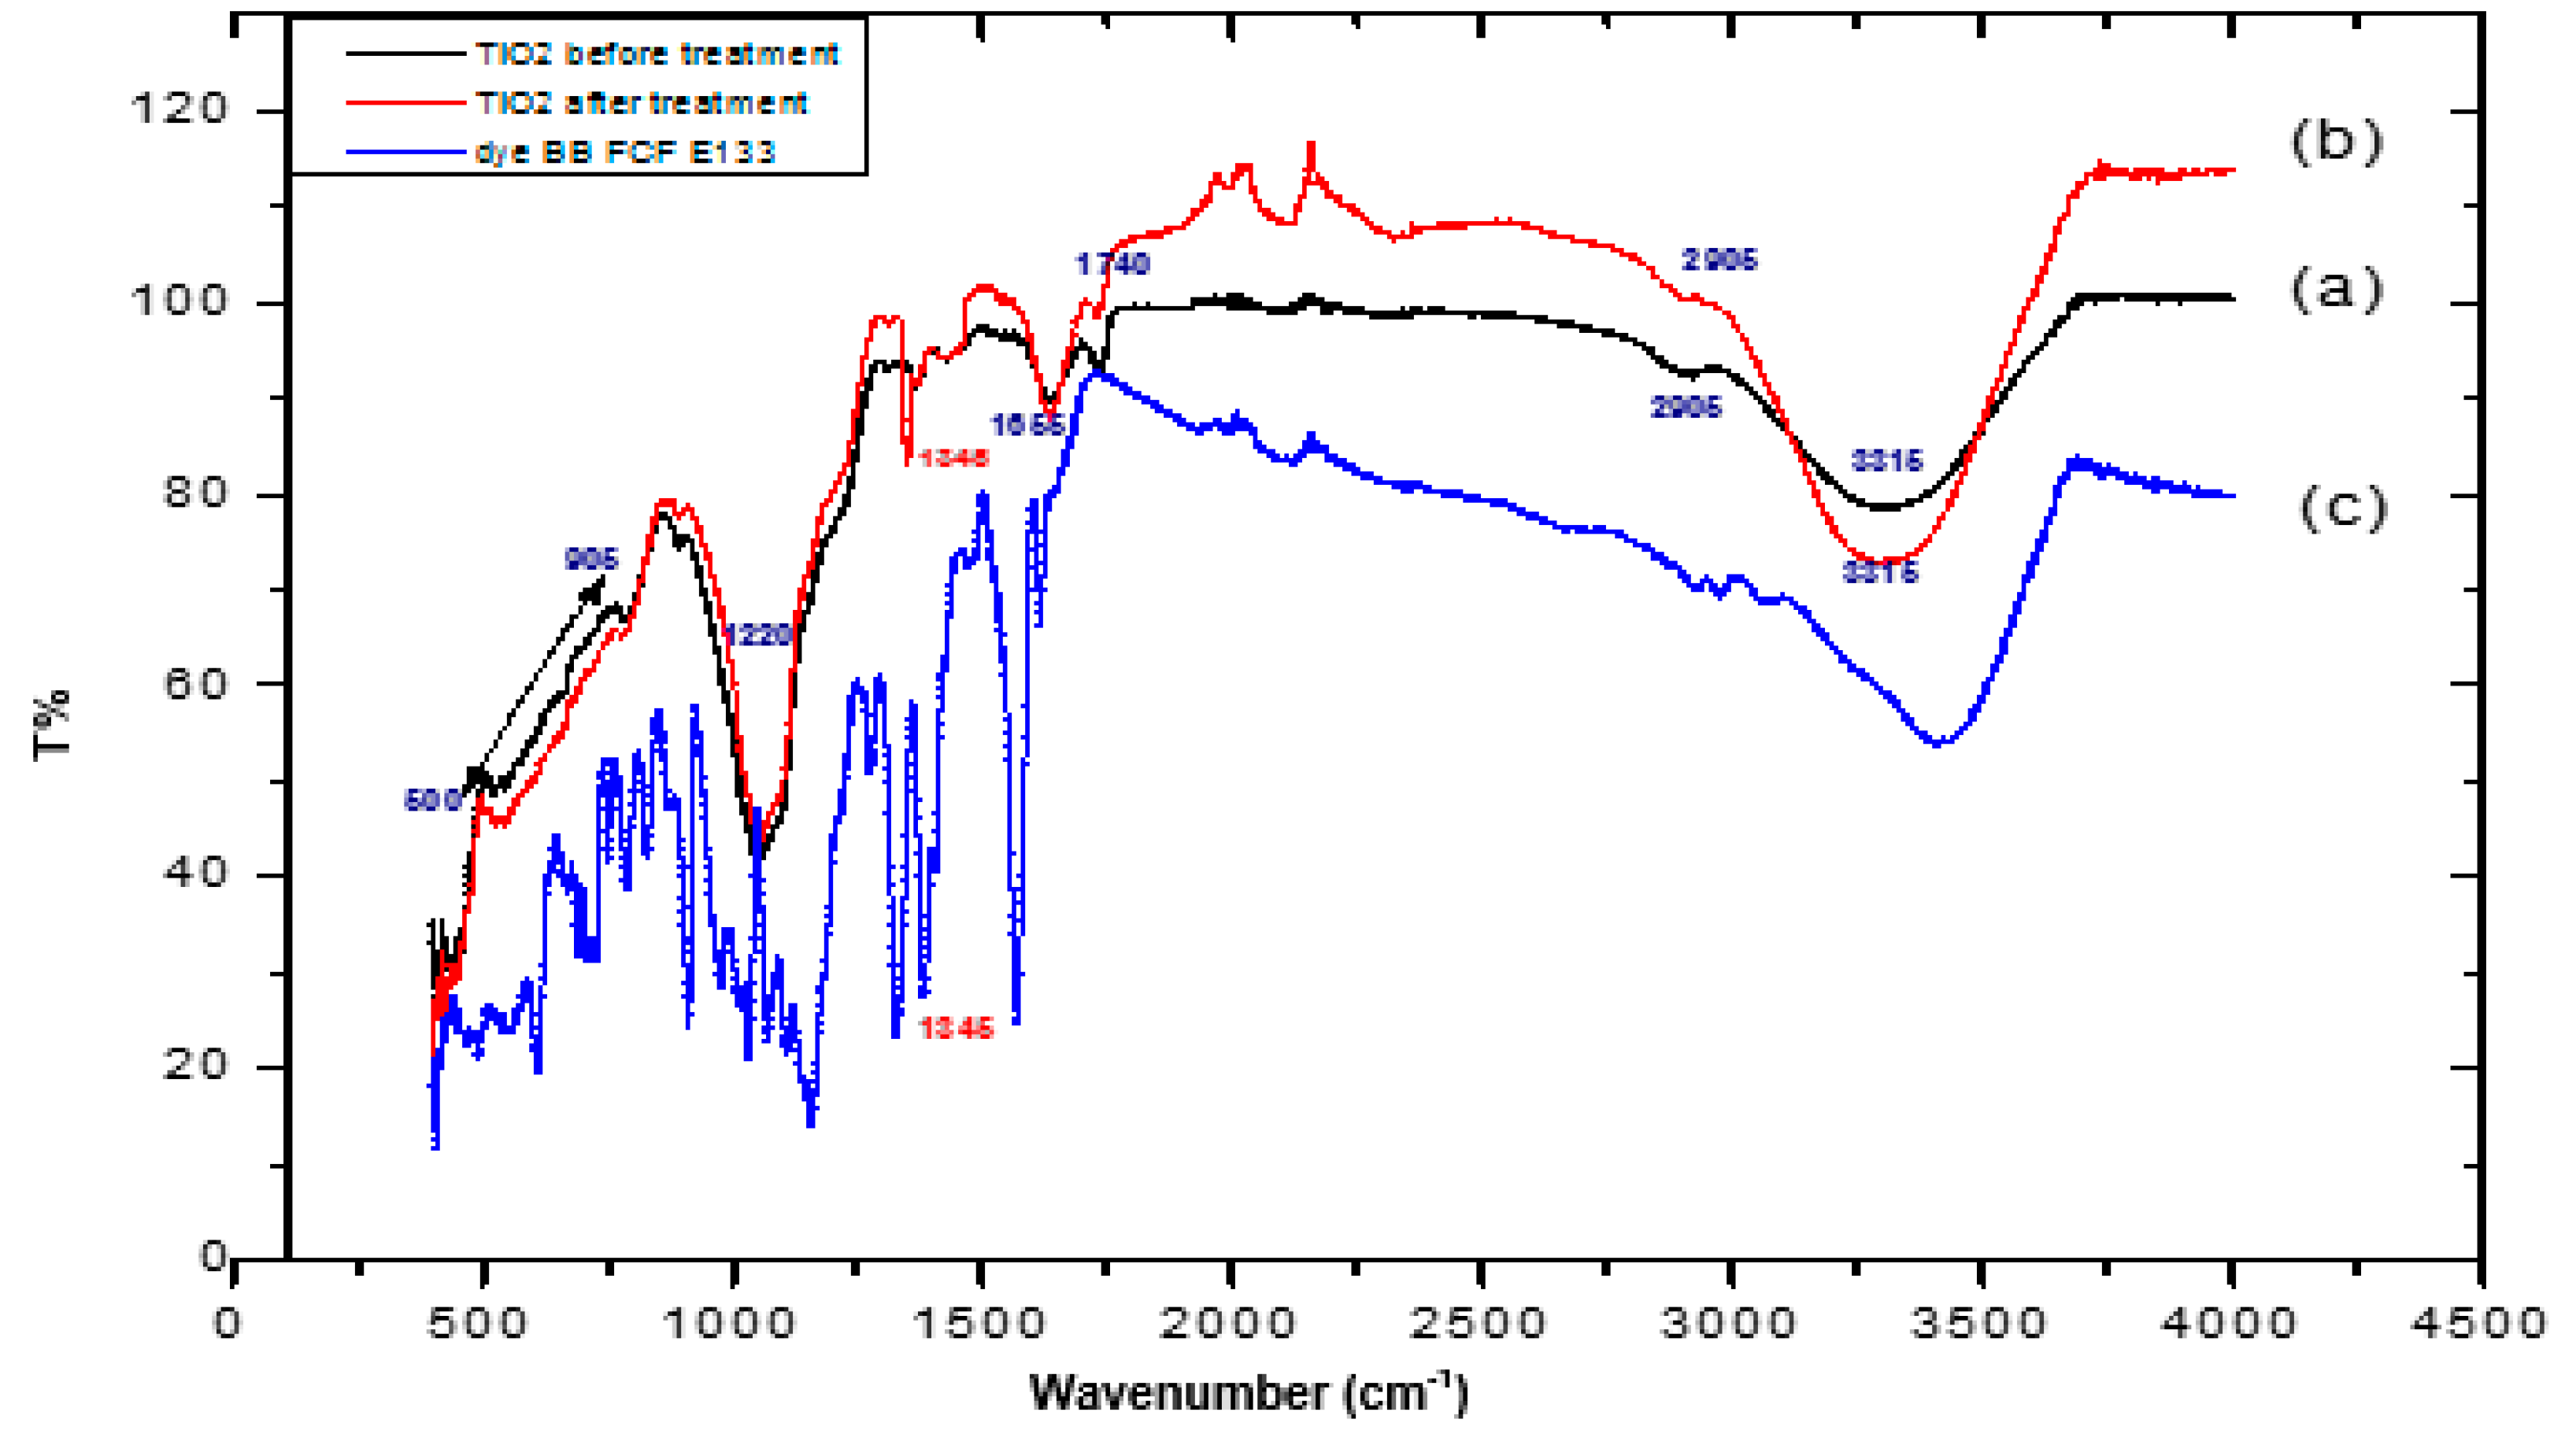
The FTIR spectra of TiO
2 before and after treatment and brilliant blue are shown in (
Figure 4). The wide bands observed at ~3310 cm
−1 represent the v(O-H) group spectrum bands [
28]. The bands observed around 2905 cm
−1 can be attributed to ν(C-H) vibrations indicating the presence of methylene (-CH
2) and methyl (-CH
3) groups.
The carbonyl stretches v (C=O) that have been found at 1740 cm
−1 characterize the ester and aldehyde groups [
29]. Regarding the carboxyl stretches (COO-) related to secondary and primary alcohols, as well as aliphatic and etheric groups, they were found at 1655 cm
−1. The spectral range comprised between 1220 and 1370 cm
−1 corresponding with the stretching vibrations of esters (C-O), and the low-intensity bands located between 550 and 900 cm
−1 corresponded with Ti-O-Ti vibrations. In addition, it can be noted that in the TiO
2 spectrum after treatment, there was a peak that appeared at 1345 cm
−1. According to [
18,
30], the peak in this area corresponded with a sulfonated group in the dye ring; this new peak confirmed the attachment of dye sulfonate groups to TiO
2 and hence, the adsorption of the pollutant on the semiconductor.
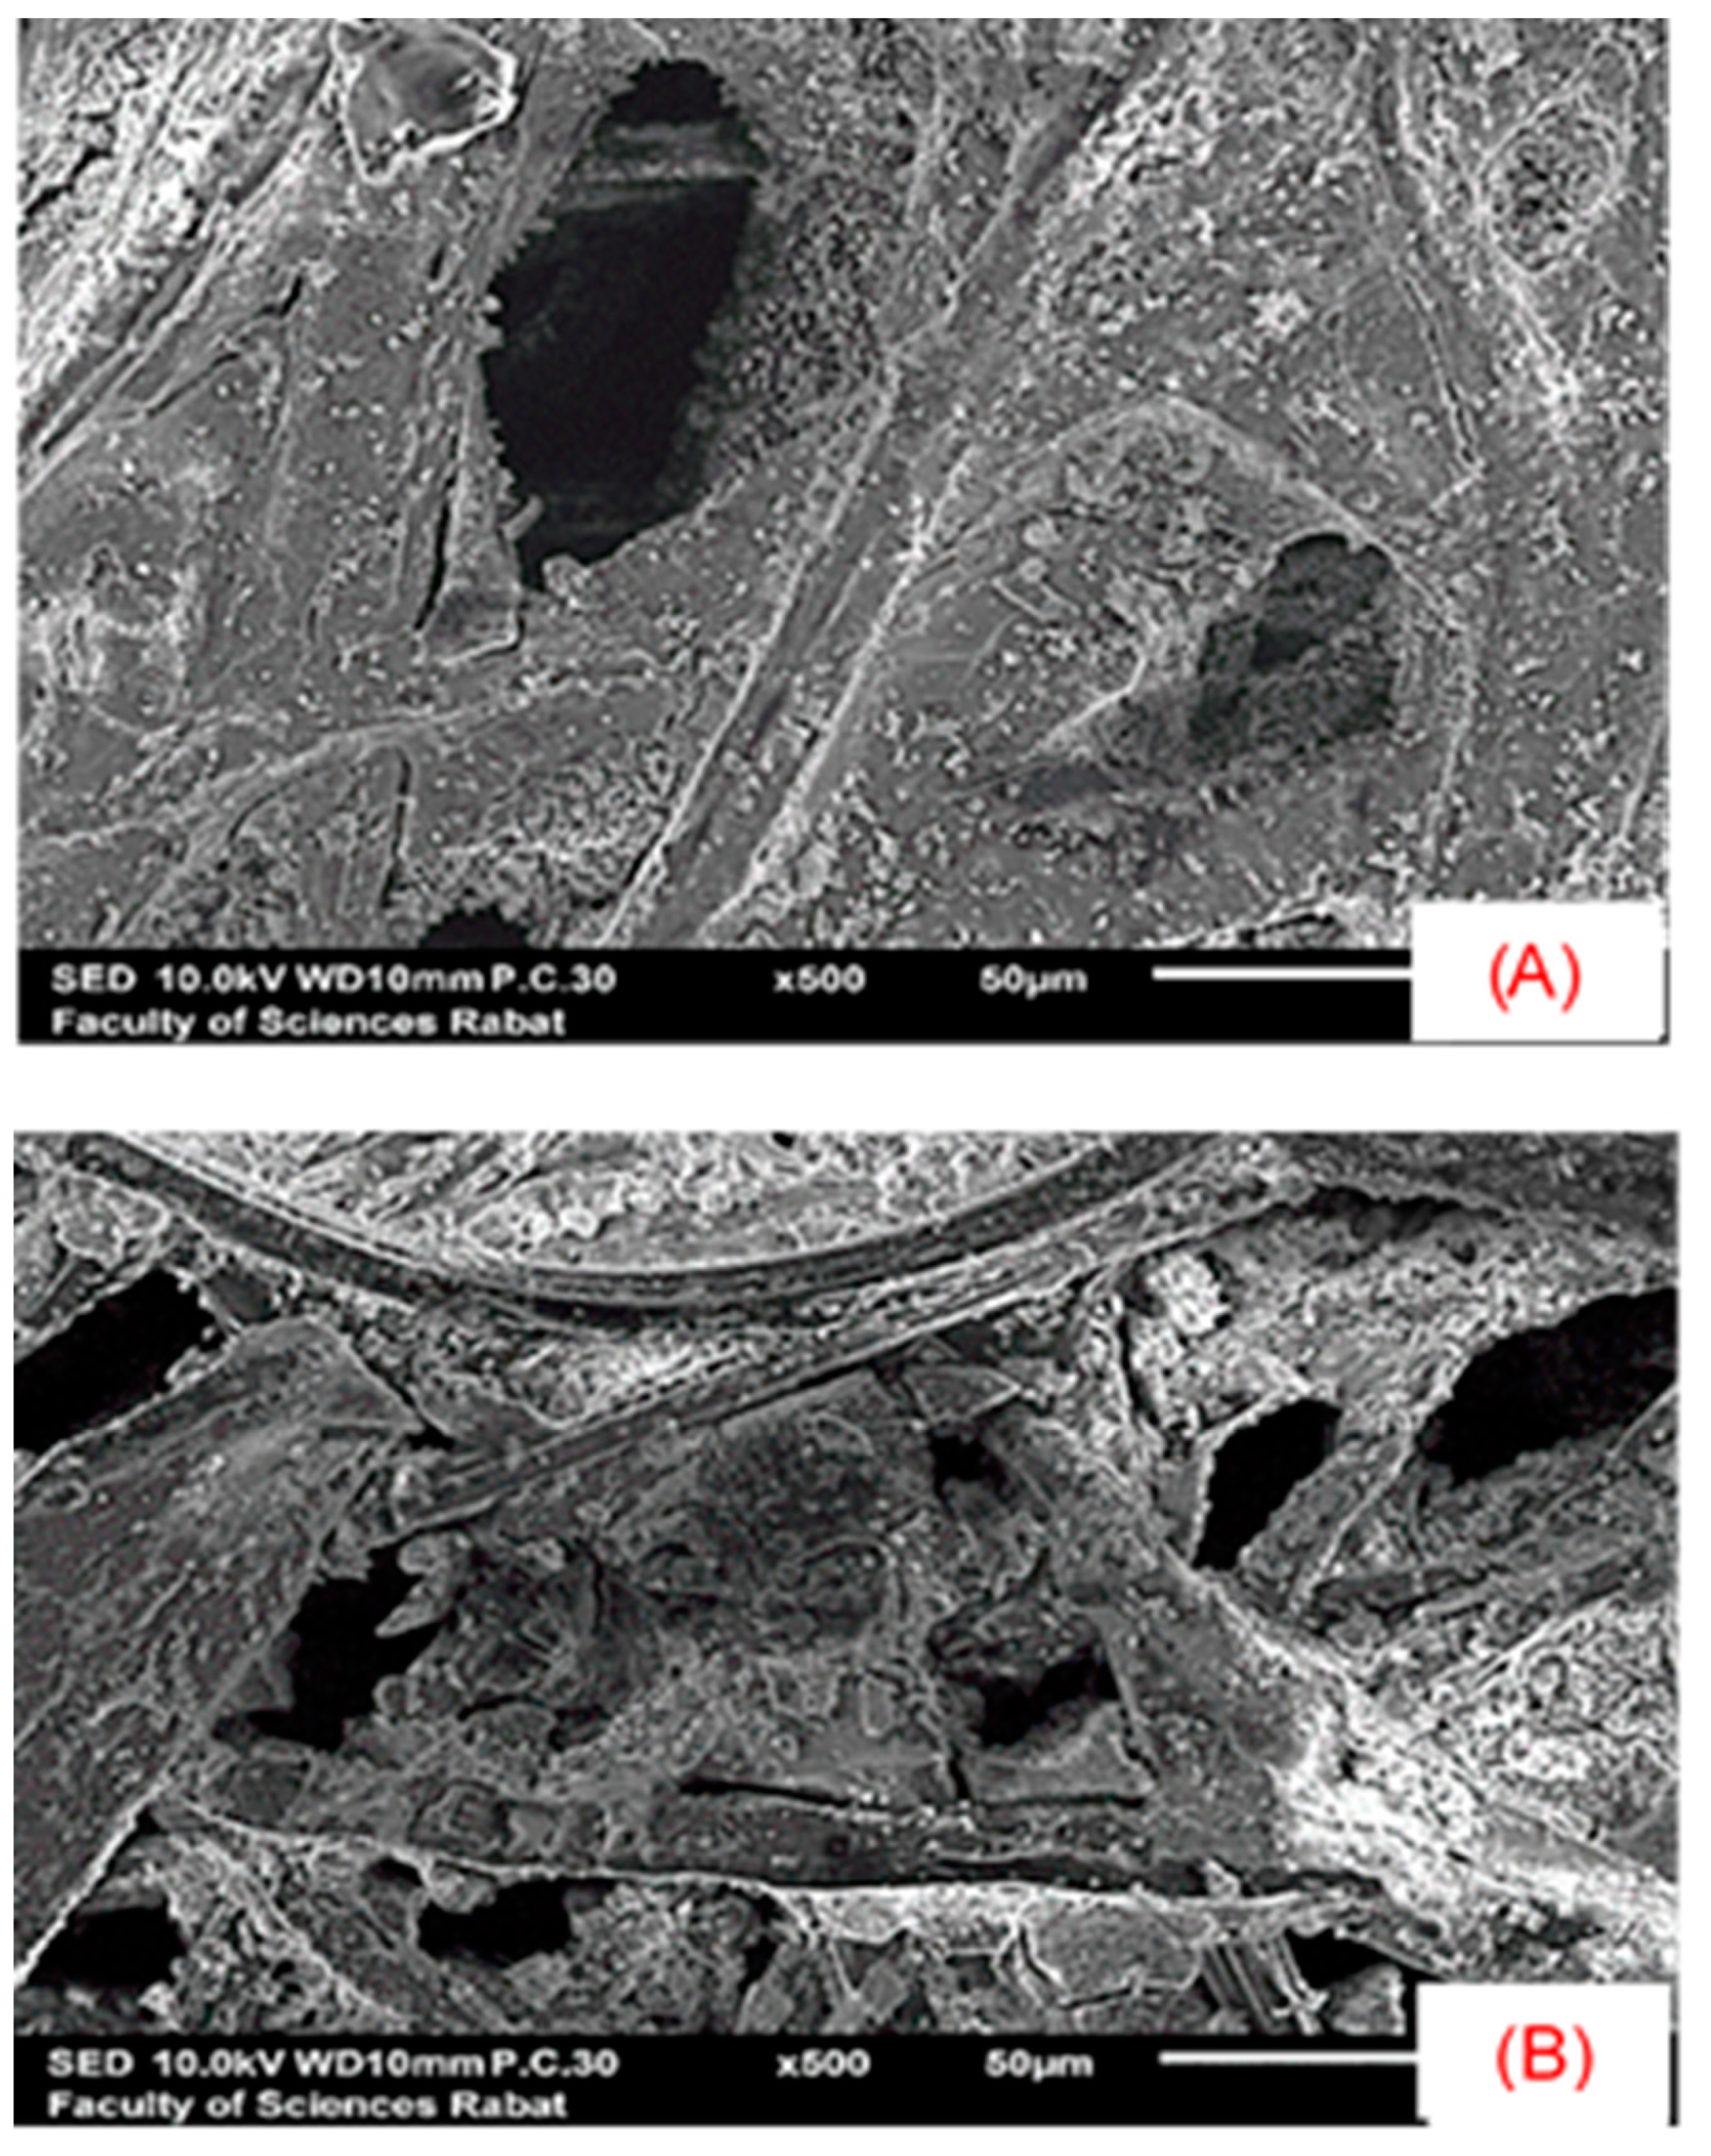
3.1.4. SEM Analysis
Scanning Electron Microscope (SEM) observations were also carried out on the studied semiconductor to evaluate the evolution of the morphology and size of the crystallites. (
Figure 5) gathers the images obtained on the TiO
2 supported on a cellulosic paper before and after photocatalysis. In addition, this study was completed with titanium dioxide supported on a cellulosic paper used in the degradation of food coloring (brilliant blue E133) to see if the presence of this element in the matrix of titanium dioxide on a cellulose paper changed the shape and size of the particles.
SEM characterizations were carried out at different magnifications before and after photodegradation of the pollutant. The semiconductor morphology is shown in (
Figure 5A,B). A highly porous network (porosity ≈ 82%), which can be related to TiO
2 aggregates, was observed in the surface of the cellulose fibers rather than in the pores formed between the fibers.
However, for (
Figure 5B), the pores’ size became tighter; this explains the availability of the active sites of the semiconductor to the brilliant blue pollutant. The results agree with those of the FT-IR.
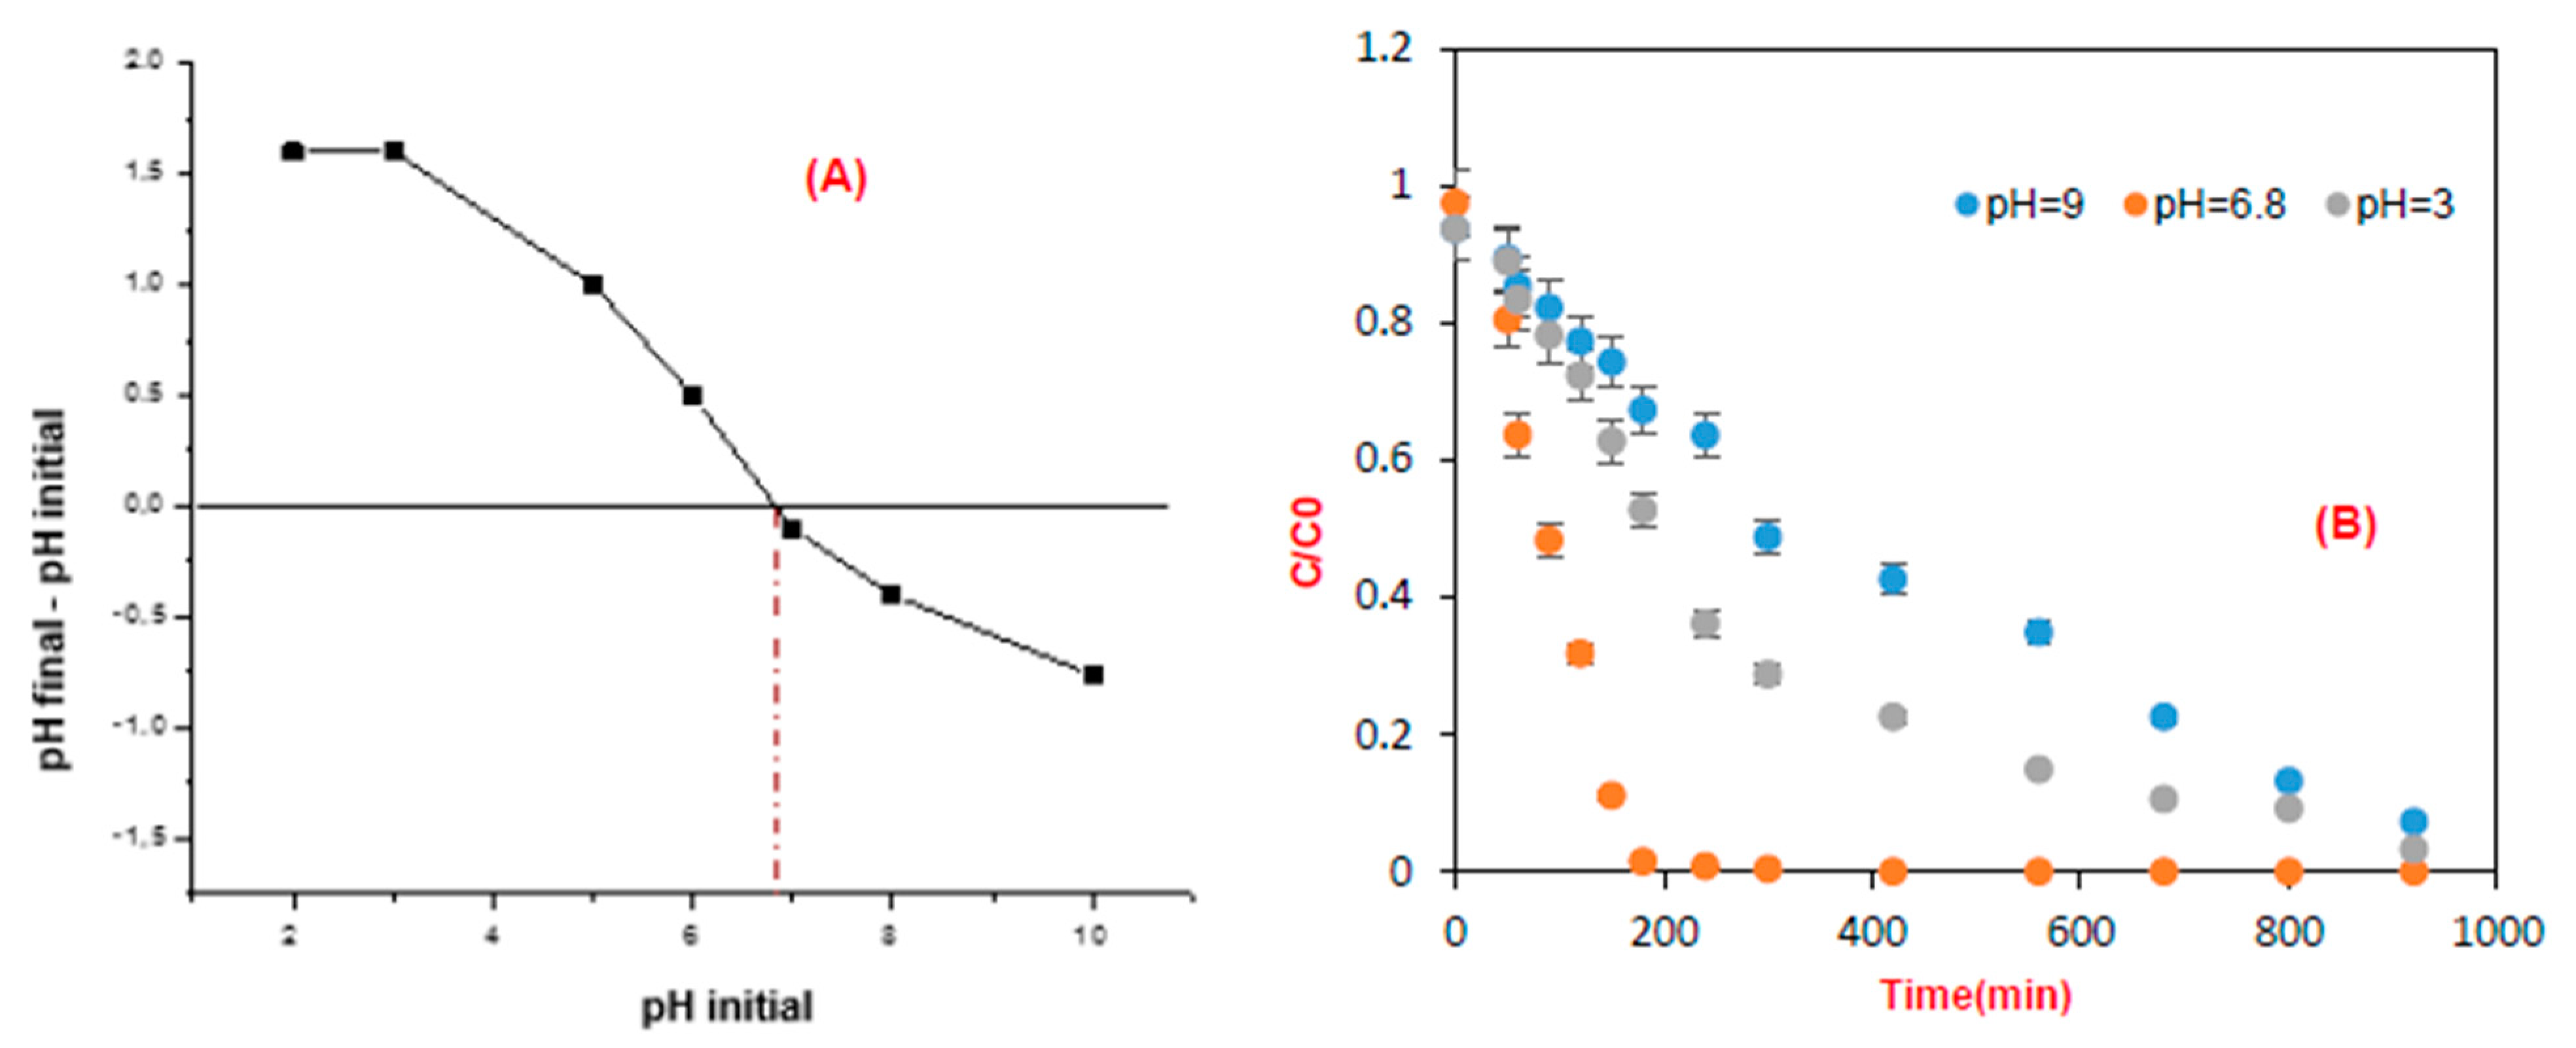
3.1.5. Effect of pH
It is necessary to identify the effect of pH on the mineralization and degradation of the targeted pollutant in this process to improve the efficiency of this method. The nature of the TiO
2 catalyst means that any variation in pH could affect the surface charge or isoelectric point of the photocatalyst [
31,
32]. (
Figure 6A) shows that the pH of the zero-point charge (pHpzc) of TiO
2 supported on cellulose paper was 6.9. The effect of pH on the photocatalytic elimination of brilliant blue E133 by TiO
2 under UV irradiation is shown in (
Figure 6B), showing the impact of pH on removal efficiency. When the pH was above 6.9, the TiO
2 surface was negatively charged and positively charged below pHpzc. The bright blue was reported to be negatively charged due to SO
3− groups, making their electrostatic attachment to the TiO
2 surface appropriate in neutral and acidic solutions and not permitted in alkaline media due to the repulsion between the negatively charged TiO
2 surface and organic molecules [
33]. As a result, the lowest discoloration was found in alkaline media, while neutral media close to pHpzc appeared to be the most suitable for pollutant degradation (
Figure 6B).
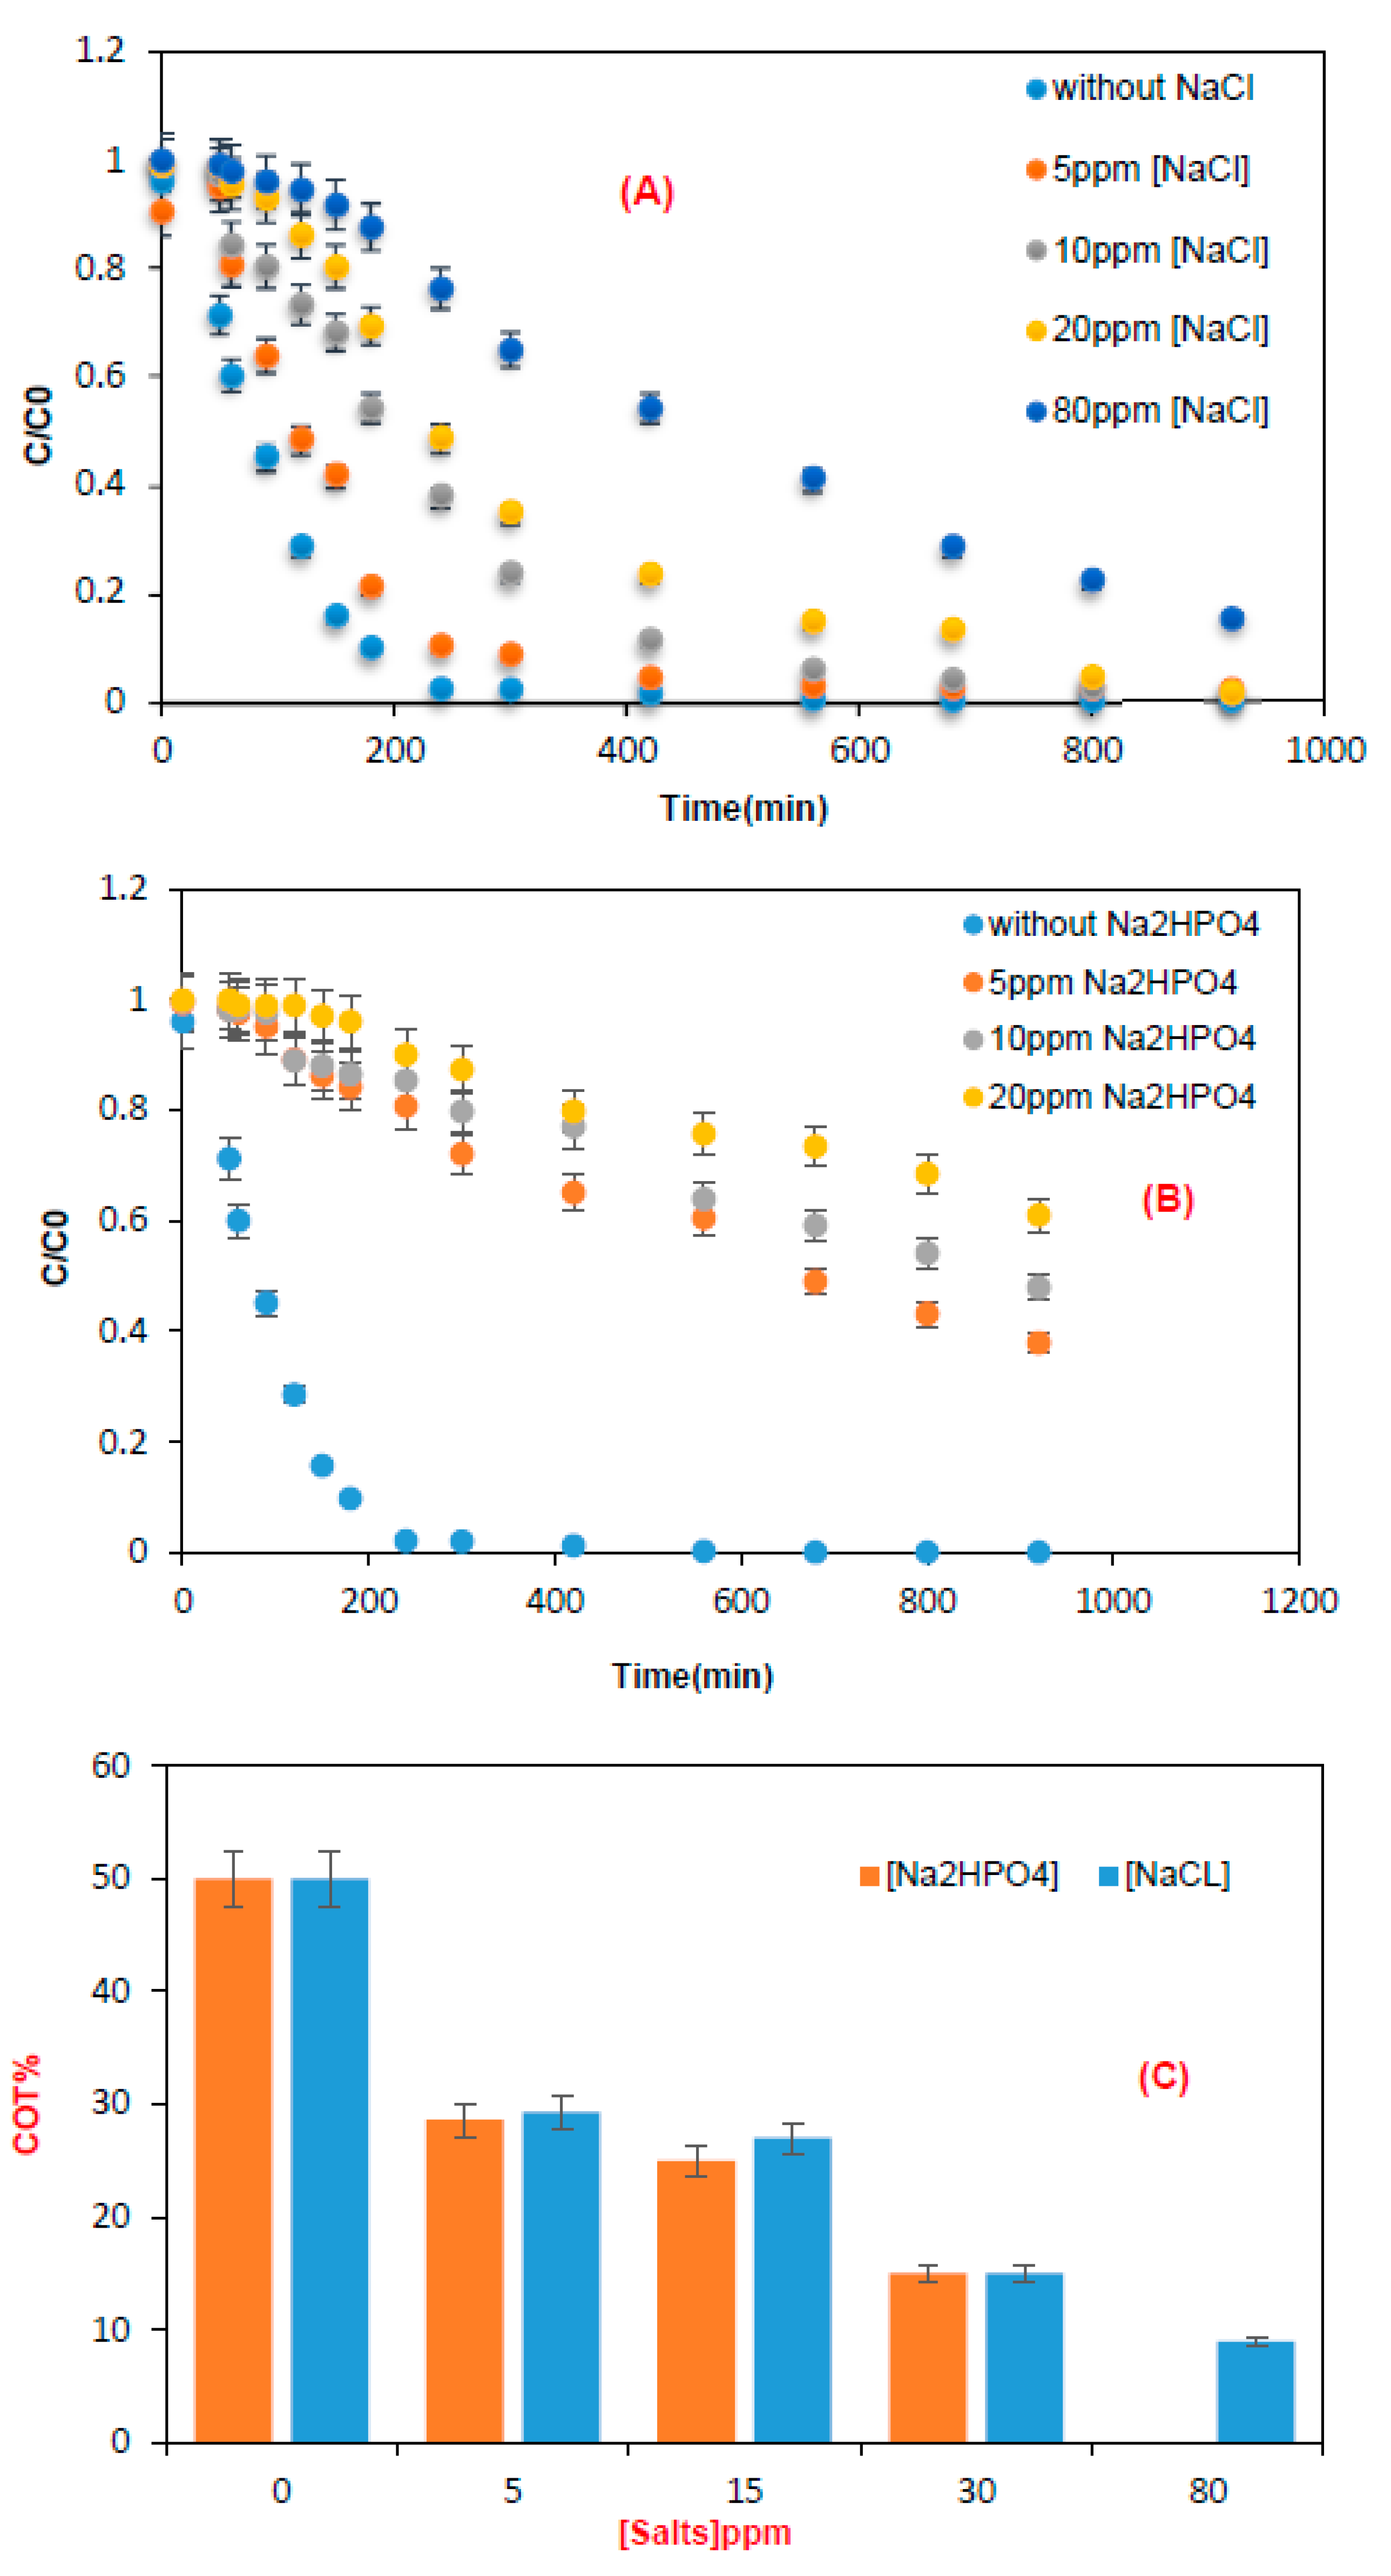
3.1.6. Effect of the Presence of Salts
In an industrial food processing unit, the properties of the generated wastewater generally reflect the activities carried out. Particularly, the production process is associated with variations that are moderate compared with the activities of cleaning and washing. This is confirmed by the different trends in the different samples taken. The rinsing, cleaning, and washing activities are generally characterized by a higher volume of effluent and greater variations in parameters.
It is interesting to study the effects of NaCl and Na2HPO4 present in the discharges, because agri-food wastewater is a mixture of organic and inorganic pollutants; therefore, the bright blue dye could also significantly influence photocatalytic activity.
Degradation was examined at the optimal dye concentration and pH (
Figure 7). In the absence of NaCl, the degradation rate was 98% and 50% mineralization, while 37% degradation and 13% mineralization rate were obtained for 80 ppm NaCl. Chloride ions can have an inhibitory effect on the degradation kinetics of brilliant blue, which can be explained by a competition of chloride ions with the pollutant to react with the generated radicals.
For the effect of Na
2HPO
4 addition on the degradation rate, removal efficiency decreased from 98% in the absence of salt to 38.8% for 20 mg of Na
2HPO
4, respectively. The salt can penetrate the active sites of the TiO
2 surface and thus reduce the rate of degradation of the studied molecule. Moreover, the inhibitory effects of H
2PO
4− can be explained by the reaction of the hydroxyl radical (°OH) and the positive holes (h+) with these anions (
Table 3) [
33,
34].
The increase in salt concentration influences degradation and mineralization, having a negative impact on the kinetics and causing the adsorption to become slow. This could be due to the competitive adsorption that exists between the salt ions and target molecule.
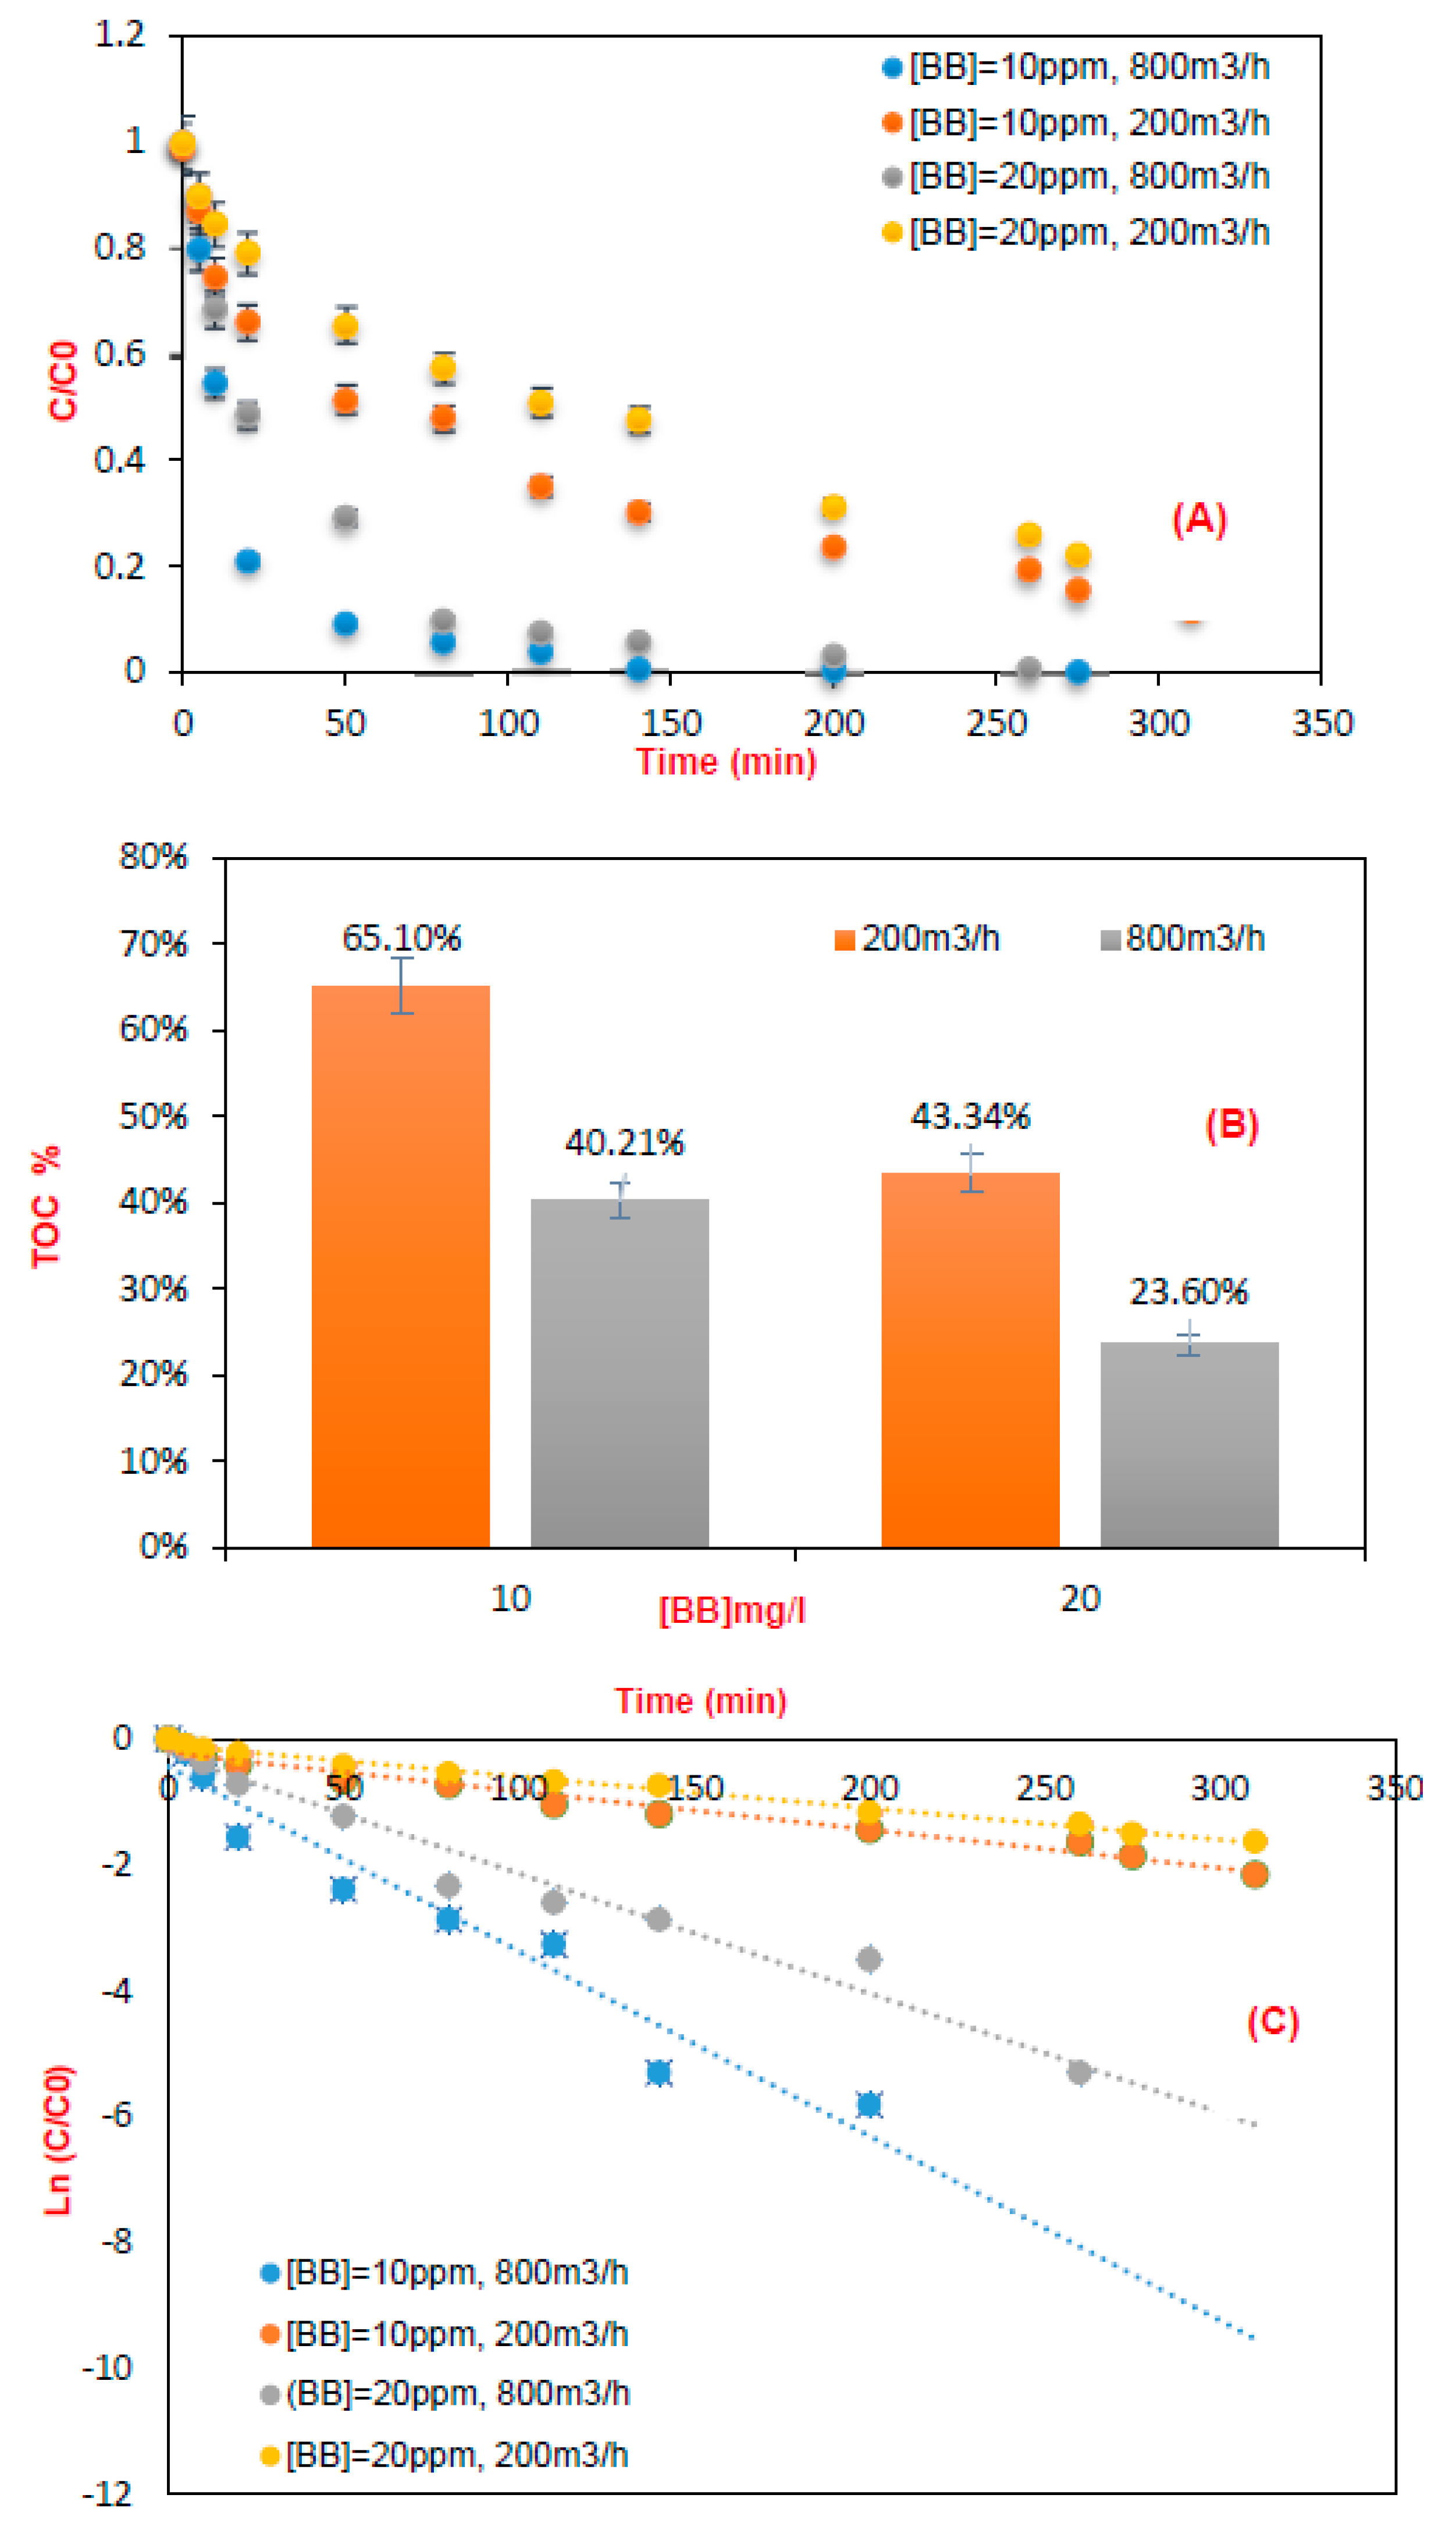
3.2. Pilot-Scale
Effects of Inlet Concentration and Flow Rate
The influence of flow rate and pollutant inlet concentration must be clearly defined to determine the performance of photocatalytic oxidation. (
Figure 8) shows the efficiency of the recirculating reactor in the degradation and mineralization of brilliant blue [
35].
The experiments were carried out, ranging from 200 m
3/h to 800 m
3/h for two different flow rates, and ranging from 10 to 20 mg/L at two concentrations. It can be observed in (
Figure 8A,B) that by increasing the flow rate, the efficiency of removal of brilliant blue decreased. This may be due to the decrease of the contact time between the dye and the active sites of TiO
2. This leads to a small amount of the pollutant being able to react with the active species attached to the catalyst surface. The photocatalytic degradation of the model pollutant decreased remarkably when the input concentration increased [
28,
36,
37,
38,
39]. Indeed, the increase of the amount of dye concentration in the medium limits the efficiency of degradation and mineralization as reported in the literature [
40,
41].
The equation of the first order kinetic model is of the form:
where:
C0: Initial concentration of the pollutant (mg/L).
Ct: Concentration of the pollutant at time t (mg/L).
(
Figure 8C) shows the linear regression plot of time vs. ln (C/Co) using data presented in (
Figure 8A). The curves show that the degradation rate decreased by decreasing the BB concentration [
28,
36,
37,
38,
42,
43]. Through linear regression, using the plot in (
Figure 8C), we found that the pseudo-first order well described the kinetic degradation of BB in the presence of TiO
2 supported on cellulose paper, which is confirmed by the coefficients of correlation presented in
Table 4.
4. Conclusions
Environmental protection is a major problem for humanity. The treatment and reuse of industrial water has become an urgent necessity. Brilliant blue is one of the most used dyes in the food industry, and for this reason, we were interested in the photocatalytic removal of this model pollutant.
In the present work, a parametric study was carried out using a laboratory reactor and a pilot reactor to test the efficiency of photocatalytic degradation of brilliant blue. The influence of pH and initial concentration of the pollutant, as well as the effect of salts, on the efficiency of the removal was studied using the semi-conductor titanium dioxide supported on a cellulose paper which was reused by washing with distilled water, and was characterized by SEM and FTIR before and after proceeding with photodegradation.
Fourier transform infrared spectroscopy (FTIR) showed a new peak that appeared at 1345 cm−1 corresponding with a sulfonated group. This new peak confirms the attachment of sulfonate groups of the dye to TiO2 and thus, the adsorption of the pollutant on the semiconductor.
However, through use of the Scanning Electron Microscope (SEM) after treatment, pore size tightened, which explains the availability of the active sites of the semiconductor by the brilliant blue pollutant.
The following conclusions were drawn:
Degradation of the model pollutant was observed in the presence of UV light and the photocatalyst, not in the presence of UV light alone;
Maximum degradation of the brilliant blue was observed under neutral conditions, which was explained by catalyst-molecule attractions;
For low concentration of brilliant blue, high degradation and mineralization were obtained, which was correlated with the high availability of reactive species;
Brilliant blue inlet concentration and flow rate were studied in a pilot-scale recirculation reactor, and it was shown that degradation and mineralization efficiencies decreased at high concentrations due to the decrease in contact time between the pollutant and the catalyst-active sites.
Author Contributions
Conceptualization, F.D.; Methodology, A.A. and A.A.A.; Software, B.R.; Validation, F.D., M.R., S.E.H. and F.F.; Formal analysis, B.R., F.F. and A.A.A.; Investigation, F.D., A.A. and A.A.A.; Resources, B.R. and J.M.; Data curation, M.R., A.A., F.F. and A.A.A.; Writing–original draft, J.M.; Project administration, S.E.H. All authors have read and agreed to the published version of the manuscript.
Funding
This work was supported by the bilateral program CNRS (France) and CNRST (Morocco).
Institutional Review Board Statement
Not applicable.
Informed Consent Statement
Not applicable.
Data Availability Statement
No new data were created or analyzed in this study. Data sharing is not applicable to this article.
Conflicts of Interest
The authors declare no conflict of interest.
References
- Ghasemzadeh, G.; Momenpour, M.; Omidi, F.; Hosseini, M.R.; Ahani, M.; Barzegari, A. Applications of nanomaterials in water treatment and environmental remediation. Front. Environ. Sci. Eng. 2014, 8, 471–482. [Google Scholar] [CrossRef]
- Liu, L.; Liu, Z.; Bai, H.; Sun, D.D. Concurrent filtration and solar photocatalytic disinfection/degradation using high-performance Ag/TiO2 nanofiber membrane. Water Res. 2012, 46, 1101–1112. [Google Scholar] [CrossRef] [PubMed]
- Bilal, M.; Adeel, M.; Rasheed, T.; Zhao, Y.; Iqbal, H.M.N. Iqbal, Emerging contaminants of high concern and their enzyme-assisted biodegradation—A review. Environ. Int. 2019, 124, 336–353. [Google Scholar] [CrossRef]
- Singh, T.; Srivastava, N.; Mishra, P.; Bhatiya, A.; Singh, N.L. Application of TiO2 Nanoparticle in Photocatalytic Degradation of Organic Pollutants. Mater. Sci. Forum 2016, 855, 20–32. [Google Scholar] [CrossRef]
- Yu, F.; Li, Y.; Han, S.; Ma, J. Adsorptive removal of antibiotics from aqueous solution using carbon materials. Chemosphere 2016, 153, 365–385. [Google Scholar] [CrossRef]
- Zare, K.; Gupta, V.K.; Moradi, O.; Makhlouf, A.S.H.; Sillanpää, M.; Nadagouda, M.N.; Sadegh, H.; Shahryari-Ghoshekandi, R.; Pal, A.; Wang, Z.-J.; et al. A comparative study on the basis of adsorption capacity between CNTs and activated carbon as adsorbents for removal of noxious synthetic dyes: A review. J. Nanostructure Chem. 2015, 5, 227–236. [Google Scholar] [CrossRef] [Green Version]
- Gan, Y.; Wei, Y.; Xiong, J.; Cheng, G. Impact of post-processing modes of precursor on adsorption and photocatalytic capability of mesoporous TiO2 nanocrystallite aggregates towards ciprofloxacin removal. Chem. Eng. J. 2018, 349, 1–16. [Google Scholar] [CrossRef]
- Zhang, M.; Xiong, J.; Yang, H.; Wen, Z.; Chen, R.; Cheng, G. Surface potential/wettability and interface charge transfer engineering of copper-oxides (Cu-MOx, M = W, Ti, and Ce) hybrids for efficient wastewater treatment through adsorption-photocatalysis synergy. Ind. Eng. Chem. Res. 2020, 59, 15454–15463. [Google Scholar] [CrossRef]
- Patchaiyappan, S.; Saran, S.P. Devipriya Recovery and reuse of TiO2 photocatalyst from aqueous suspension using plant based coagulant—A green approach Korean. J. Chem. Eng. 2016, 33, 2107–2113. [Google Scholar]
- Qiu, P.; Lu, M.; Cheng, G.; Li, W.; Liu, L.; Xiong, J. Co-implantation of oxygen vacancy and well-dispersed Cu cocatalyst into TiO2 nanoparticles for promoting solar-to-hydrogen evolution. Int. J. Hydrogen Energy 2023, 48, 933–942. [Google Scholar] [CrossRef]
- Samhaber, W.M.; Nguyen, M.T. Applicability and costs of nanofiltration in combination with photocatalysis for the treatment of dye house effluents. Beilstein J. Nanotechnol. 2014, 5, 476–484. [Google Scholar] [CrossRef] [PubMed] [Green Version]
- Westerhoff, P.; Alvarez, P.; Li, Q.; Gardea-Torresdey, J.; Zimmerman, J. Zimmerman Overcoming implementation barriers for nanotechnology in drinking water treatment. Environ. Sci. Nano 2016, 6, 1241–1253. [Google Scholar] [CrossRef]
- Ghezzar, M.R.; Ognier, S.; Cavadias, S.; Abdelmalek, F.; Addou, A. DBDplate-TiO2 treatment of Yellow Tartrazine azo dye solution in falling film. Sep. Purif. Technol. 2013, 104, 250–255. [Google Scholar] [CrossRef]
- Ren, G.; Zhou, M.; Liu, M.; Ma, L.; Yang, H. A novel vertical-flow electro-Fenton reactor for organic wastewater treatment. Chem. Eng. J. 2016, 298, 55–67. [Google Scholar] [CrossRef]
- Qiu, M.; Huang, C. A comparative study of degradation of the azo dye C.I. Acid Blue 9 by Fenton and photo-Fenton oxidation. Desalination Water Treat. 2010, 24, 273–277. [Google Scholar] [CrossRef]
- Khataee, A.; Vatanpour, V.; Ghadim, A.A. Decolorization of C.I. Acid Blue 9 solution by UV/Nano-TiO2, Fenton, Fenton-like, electro-Fenton and electrocoagulation processes: A comparative study. J. Hazard. Mater. 2009, 161, 1225–1233. [Google Scholar] [CrossRef]
- Zhang, C.; Ren, G.; Wang, W.; Yu, X.; Yu, F.; Zhang, Q.; Zhou, M. A new type of continuous-flow heterogeneous electro-Fenton reactor for Tartrazine degradation. Sep. Purif. Technol. 2018, 208, 76–82. [Google Scholar] [CrossRef]
- Dotto, G.; Pinto, L. Adsorption of food dyes acid blue 9 and food yellow 3 onto chitosan: Stirring rate effect in kinetics and mechanism. J. Hazard. Mater. 2011, 187, 164–170. [Google Scholar] [CrossRef]
- Yang, R.; Liu, G.; Xu, X.; Li, M.; Zhang, J.; Hao, X. Surface texture, chemistry and adsorption properties of acid blue 9 of hemp (Cannabis sativa L.) bast-based activated carbon fibers prepared by phosphoric acid activation. Biomass Bioenergy 2011, 35, 437–445. [Google Scholar] [CrossRef]
- Caudillo-Flores, U.; Muñoz-Batista, M.J.; Kubacka, A.; Zárate-Medina, J.; Cortés, J.A.; Fernández-García, M. Measuring and interpreting quantum efficiency of acid blue 9 photodegradation using TiO2-based catalysts. Appl. Catal. A Gen. 2018, 550, 38–47. [Google Scholar] [CrossRef]
- Ben Torkia, Y.; Atrous, M.; Bouzid, M.; Dotto, G.L.; Ben Lamine, A. Stereographic and energetic studies of acid blue 9 adsorption onto Spirulina platensis (strain LEB-52) based on statistical physics approach. Chem. Eng. Commun. 2019, 207, 445–457. [Google Scholar] [CrossRef]
- Neetha, J.; Ujwal, P.; Sandesh, K.; Santhosh, H.; Girish, K. Aerobic biodegradation of Acid Blue-9 dye by Bacillus fermus Isolated from Annona reticulata. Environ. Technol. Innov. 2018, 11, 253–261. [Google Scholar] [CrossRef]
- Marci, G.; Augugliaro, V.; Munoz, M.J.L.; Martin, C.; Palmisano, L.; Schiavello, M.; Tilley, R.J.D.; Venezia, A.M.J. Preparation Characterization and Photocatalytic Activity of Polycrystalline ZnO/TiO2 Systems. 2. Surface, Bulk Characterization, and 4-Nitrophenol Photodegradation in Liquid−Solid Regime
. Phys. Chem. B 2001, 105, 1033. [Google Scholar]
- Galindo, C.; Jacques, P.; Kalt, A.J. Photodegradation of the aminoazobenzene acid orange 52 by three advanced oxidation processes: UV/H2O2, UV/TiO2 and VIS/TiO2. Photochem. Photobiol. A 2000, 130, 35–47. [Google Scholar] [CrossRef]
- Merabet, S.; Assadi, A.A.; Bouzaza, A.; Wolbert, D. Photocatalyticdegradation of indole–4-methylphenol mixture in an aqueoussolution: Optimization and statistical analysis. Desalin. Water Treat. 2016, 57, 17039–17050. [Google Scholar]
- Carp, O.; Huisman, C.L.; Reller, A. Photoinduced reactivity of titani-um dioxide. Prog. Solid State. Chem. 2004, 32, 33–177. [Google Scholar] [CrossRef]
- Bharati, R.; Suresh, S. Biosynthesis of ZnO/SiO2 nanocatalyst withpalash leaves’powder for treatment of petroleum refinery effluent. Reffit 2017, 3, 528–541. [Google Scholar] [CrossRef]
- Azzaz, A.A.; Assadi, A.A.; Bouzaza, B.; Wolbert, D.; Rtimi, S.; Bousselmi, L.; Jellali, S. Discoloration of simulated textile effluent incontinuous photoreactor using immobilized titanium dioxide: Effect of zinc and sodium chloride. J. Photochem. Photobiol. A Chem. 2018, 358, 111–120. [Google Scholar] [CrossRef]
- Rabahi, A.; Assadi, A.A.; Nasrallah, N.; Bouzaza, A.; Maachi, R.; Wolbert, D. Photocatalytic treatment of petroleum industry wastewater using recirculating annular reactor: Comparison of experimental and modeling. Environ. Sci. Pollut. Res. 2018, 26, 19035–19046. [Google Scholar] [CrossRef]
- Sakkayawong, N.; Thiravetyan, P.; Nakbanpote, W. Adsorption mechanism ofsynthetic reactive dye wastewater by chitosan. J. Hazard. Mater. 2011, 187, 164–170. [Google Scholar]
- N’guettia, R.K.; Gombert, B.; Soro, B.-D.; Traore, S.K.; Vel Leitner Karpel, N. Photocatalytic degradation of 5-fluorouracil by a UV-A/TiO2 system: Effect of catalyst and pollutant concentration, pH and dilution matrices. Int. J. Biol. Chem. Sci. 2017, 11, 1373. [Google Scholar] [CrossRef] [Green Version]
- Aljuboury D al Deen, A.; Al-Abri, M.; Shaik, F.; Al-Sabahi, J.N.; Alkhadori, A.N. Assessment of TiO2/ZnO/H2O2 Photocatalyst to treat wastewater from oil refinery within visible light circumstances. South Afr. J. Chem. Eng. 2020, 35, 69–77. [Google Scholar] [CrossRef]
- Shahrezaei, F.; Mansouri, Y.; Zinatizadeh, A.A.L.; Akhbari, A. Process modeling and kinetic evaluation of petroleum refinery wastewater treatment in a photocatalytic reactor using TiO2 nanoparticles. Powder Technol. 2012, 221, 203–212. [Google Scholar] [CrossRef]
- Hu, C.; Yuchao, T.; Lanyu, L.; Zhengping, H.; Yizhong, W.; Hongxiao, T. Effects of inorganic anions on photoactivity of various photocatalysts under different conditions. J. Chem. Technol. Biotechnol. 2004, 79, 247–252. [Google Scholar] [CrossRef]
- Hu, C.; Yu, J.C.; Hao, Z.; Wong, P. Effects of acidity and inorganic ions on the photocatalytic degradation of different azo dyes. Appl. Catal. B Environ. 2003, 46, 35–47. [Google Scholar] [CrossRef]
- Madriz, L.; Tatá, J.; Carvajal, D.; Núñez, O.; Scharifker, B.; Mostany, J.; Borrás, C.; Cabrerizo, F.M.; Vargas, R. Photocatalysis and photoelectrochemical glucose oxidation on Bi2WO6: Conditions for the concomitant H2 production. Renew. Energy 2020, 152, 974–983. [Google Scholar] [CrossRef]
- Baaloudj, O.; Nasrallah, N.; Kebir, M.; Guedioura, B.; Amrane, A.; Nguyen-Tri, P.; Nanda, S.; Assadi, A.A. Artificial neural network modeling of cefixime photodegradation by synthesized CoBi2O4 nanoparticles. Environ. Sci. Pollut. Res. 2020, 28, 15436–15452. [Google Scholar] [CrossRef]
- Baaloudj, O.; Nasrallah, N.; Bouallouche, R.; Kenfoud, H.; Khezami, L.; Assadi, A.A. High efficient Cefixime removal from water by the sillenite Bi12TiO20: Photocatalytic mechanism and degradation pathway. J. Clean. Prod. 2021, 330, 129934. [Google Scholar] [CrossRef]
- Kenfoud, H.; Baaloudj, O.; Nasrallah, N.; Bagtache, R.; Assadi, A.A.; Trari, M. Structural and electrochemical characterizations of Bi12CoO20 sillenite crystals: Degradation and reduction of organic and inorganic pollutants. J. Mater. Sci. Mater. Electron. 2021, 32, 16411–16420. [Google Scholar] [CrossRef]
- Saoud, W.A.; Assadi, A.A.; Guiza, M.; Bouzaza, A.; Aboussaoud, W.; Ouederni, A.; Soutrel, I.; Wolbert, D.; Rtimi, S. Study of synergetic effect, catalytic poisoning and regeneration using dielectric barrier discharge and photocatalysis in a continuous reactor: Abatement of pollutants in air mixture system. Appl. Catal. B Environ. 2017, 213, 53–61. [Google Scholar] [CrossRef]
- Zhong, L.; Brancho, J.J.; Batterman, S.; Bartlett, B.M.; Godwin, C. Experimental and modeling study of visible light responsive photocatalytic oxidation (PCO) materials for toluene degradation. Appl. Catal. B Environ. 2017, 216, 122–132. [Google Scholar] [CrossRef] [PubMed]
- Vargas, R.; Núñez, O. Photocatalytic degradation of oil industry hydrocarbons models at laboratory and at pilot-plant scale. Sol. Energy 2010, 84, 345–351. [Google Scholar] [CrossRef]
- Liu, B.; Zhao, X.; Terashima, C.; Fujishima, A.; Nakata, K. Thermodynamic and kinetic analysis of heterogeneous photocatalysis for semiconductor systems. Phys. Chem. Chem. Phys. 2014, 16, 8751–8760. [Google Scholar] [CrossRef] [PubMed]
Figure 1.
Photocatalytic montages used during this study.
Figure 1.
Photocatalytic montages used during this study.
Figure 2.
(A) Changes in the UV-Vis spectra of BB FCF E133 (10 ppm) in an aqueous dispersion of TiO2 (mTiO2= 0.3 g) irradiated with a lamp at neutral pH, sometimes: 15 min, 30 min, and 60 min. (A’) The standard curve of brilliant blue at t = 0 min (B) Effect of UV light and TiO2 on the photocatalytic degradation of BB FCF E133. [BB] 0 = 10 ppm, TiO2 =0.3 g, pH neutral.
Figure 3.
(A) Effect of bright blue concentration on time of UV irradiation. The following test conditions were considered: pH = 6.8 and mTiO2 = 0.3 g. (B) Photocatalytic mineralization of bright blue with different input concentrations after 5 h of irradiation.
Figure 3.
(A) Effect of bright blue concentration on time of UV irradiation. The following test conditions were considered: pH = 6.8 and mTiO2 = 0.3 g. (B) Photocatalytic mineralization of bright blue with different input concentrations after 5 h of irradiation.
Figure 4.
IR spectra of the semiconductor (a) virgin TiO2, (b) TiO2 after treatment. (c) Brilliant blue spectrum.
Figure 4.
IR spectra of the semiconductor (a) virgin TiO2, (b) TiO2 after treatment. (c) Brilliant blue spectrum.
Figure 5.
SEM Imaging [(A) before and (B) after photocatalysis].
Figure 5.
SEM Imaging [(A) before and (B) after photocatalysis].
Figure 6.
(A) Point of zero charge of TiO2, (B) Evolution of the concentration of FCF brilliant blue E133 over time at different pH values.
Figure 6.
(A) Point of zero charge of TiO2, (B) Evolution of the concentration of FCF brilliant blue E133 over time at different pH values.
Figure 7.
Time-courses of brilliant blue degradation in the presence of (A) NaCl and (B) Na2HPO4. (C) Photocatalytic mineralization of brilliant blue in the presence of various concentrations of NaCl and Na2HPO4. Experimental conditions: batch reactor, pH = 7, and mTiO2 = 0.3 g.
Figure 7.
Time-courses of brilliant blue degradation in the presence of (A) NaCl and (B) Na2HPO4. (C) Photocatalytic mineralization of brilliant blue in the presence of various concentrations of NaCl and Na2HPO4. Experimental conditions: batch reactor, pH = 7, and mTiO2 = 0.3 g.
Figure 8.
(A) Variation of the bright blue concentration as a function of time (circulation reactor; pH = 6.8 at a flow rate of Q= 800 and 200 m3·h−1, [BB] = 10 and 20 ppm), (B) Photocatalytic mineralization with the same conditions. (C) Linear plot of the first order kinetics model.
Figure 8.
(A) Variation of the bright blue concentration as a function of time (circulation reactor; pH = 6.8 at a flow rate of Q= 800 and 200 m3·h−1, [BB] = 10 and 20 ppm), (B) Photocatalytic mineralization with the same conditions. (C) Linear plot of the first order kinetics model.
Table 1.
Different processes used for the degradation of wastewater from an agri-food activity.
Table 1.
Different processes used for the degradation of wastewater from an agri-food activity.
| Process | The Pollutant | References |
|---|
| DBD Plasma Process | Tartrazine | [13] |
| Electro Fenton | Tartrazine | [14] |
| Fenton and photo-Fenton | Acid blue 9 | [15] |
UV/Nano-TiO2 Fenton-Like
Electro-Fenton and electrocoagulation process | Acid blue 9 | [16] |
| Electro-Fenton | Tartrazine | [17] |
| Adsorption | Acid blue 9 | [18] |
| Adsorption | Acid blue 9 | [19] |
| Photodegradation using TiO2 based Catalysts | Acid blue 9 | [20] |
| Adsorption | Acid blue 9 | [21] |
| Aerobic biodegradation | Acid blue 9 | [22] |
Table 2.
Structure and characteristics for the photocatalytic of brilliant blue.
Table 2.
Structure and characteristics for the photocatalytic of brilliant blue.
| Structure | ![Sustainability 15 05788 i001]() |
| Chemicals class | Triphenylmethane |
| λmax (nm) | 630 |
| M (g/mol) | 792.86 |
Table 3.
Characteristics of wastewater from the food industry.
Table 3.
Characteristics of wastewater from the food industry.
| Parametre | Unités | Valeurs |
|---|
| Minimum | Moyenne | Maximum |
|---|
| pH | mg/L | 5.4 | 11.7 | 12.7 |
| Nitrate | mg/L | 16.4 | 17.0 | 44.0 |
| Sulfure | mg/L | 0.0 | 0.1 | 0.2 |
| Chlorure | mg/L | 22 | 78 | 126 |
| Orthophosphate | mg/L | 17 | 34 | 70 |
Table 4.
Parameters of first-order kinetics.
Table 4.
Parameters of first-order kinetics.
| Experimental Conditions | kapp (mg L−1 min−1) | R2 |
|---|
| [BB] = 10 ppm, 800 m3/h | 0.0293 | 0.9478 |
| [BB] = 10 ppm, 200 m3/h | 0.0061 | 0.9721 |
| [BB] = 20 ppm, 800 m3/h | 0.0189 | 0.9688 |
| [BB] = 20 ppm, 200 m3/h | 0.005 | 0.9912 |
| Disclaimer/Publisher’s Note: The statements, opinions and data contained in all publications are solely those of the individual author(s) and contributor(s) and not of MDPI and/or the editor(s). MDPI and/or the editor(s) disclaim responsibility for any injury to people or property resulting from any ideas, methods, instructions or products referred to in the content. |
© 2023 by the authors. Licensee MDPI, Basel, Switzerland. This article is an open access article distributed under the terms and conditions of the Creative Commons Attribution (CC BY) license (https://creativecommons.org/licenses/by/4.0/).

 ,
, 


