Article

Spatial and Temporal Heterogeneity of Rural Habitat Level Evolution and Its Influencing Factors—A Case Study of Rural Villages in Nature a Reserve of China

College of Tourism, Northwest Normal University, Lanzhou 730071, China
*
Author to whom correspondence should be addressed.
Sustainability 2023, 15(7), 5775; https://doi.org/10.3390/su15075775
Submission received: 27 January 2023 / Revised: 23 March 2023 / Accepted: 23 March 2023 / Published: 26 March 2023
(This article belongs to the Section Environmental Sustainability and Applications)

Abstract

:
Taking China’s Qilian Mountains Nature Reserve as an example, entropy, hierarchical analysis and spatial autocorrelation analysis methods were combined with geographically and temporally weighted regression to construct an evaluation index system of a rural habitat environment. The spatiotemporal characteristics of the evolution of the rural habitat environment in the Qilian Mountains Nature Reserve from 2000 to 2020 were revealed, and the spatiotemporal heterogeneity of factors affecting the evolution of the rural habitat environment in the Qilian Mountains were analyzed. The results show that during the research period, the rural habitat environment of the Qilian Mountains Nature Reserve obviously improved. The advantaged areas, such as Liangzhou and Shandan, are located mainly on flat terrain, with perfect supporting resources and convenient transportation. The disadvantaged areas, such as Qilian and Menyuan, are concentrated in the mountainous areas with poor natural conditions and inconvenient transportation. The rural habitat in the Qilian Mountains Nature Reserve shows an obvious positive spatial correlation, and areas with similar habitat are adjacent to each other. From 2000 to 2015, the high–high agglomeration area was located in Liangzhou, and the low–low agglomeration area was located in Menyuan. The rural habitat environment in the Qilian Mountains Nature Reserve is influenced by the average temperature, investment in fixed assets, the proportion of secondary and tertiary industries, PM2.5 concentration and CO2 emissions. The influence of various factors on the rural habitat showed obvious spatial and temporal heterogeneity. In rural revitalization, it is necessary to allocate resources to local conditions to promote the continuous improvement of the rural habitat environment in nature reserves.

1. Introduction

The rural area is a region with natural, social and economic characteristics. It is mutually reinforced with towns and cities, and these constitute the main space for human activities [1,2]. After a long period of evolution, a rural system of human settlement has come to integrate the natural, economic, social and human environment, including rural infrastructure, social services and ecological environment. The rural living environment was an important indicator of the quality of life of rural residents, and an important basis for the harmonious and stable development of rural areas.
In recent years, the Chinese government has attached great importance to the improvement of the rural habitat, issuing “The Guidance on Improving Rural Habitat Environment” (2014), “The Three-Year Action Plan for Rural Habitat Environment Improvement” (2018) and “The Essentials of Rural Habitat Environment Improvement Work” (2020). The Strategic Plan for Rural Revitalization, issued by the State Council in 2018, made “building ecologically pleasant and beautiful villages” a separate and important chapter, pushing rural habitat management to an unprecedented level.
In 2021, China proposed the “Five-Year Action to Improve Rural Habitat Environment” to construct the rural habitat environment and promote a national strategy for rural revitalization. By clarifying the real condition of China’s rural habitat environment, elucidating the regional differences and evolutionary characteristics of the rural habitat environment in different regions, and deconstructing the influencing factors, it is possible to suggest remedies.
Rural habitat was an organic combination of material and immaterial required for rural farm households to produce and live [3], and it was an important component of habitat science. There is relatively little literature on rural habitat environment measurement and driver exploration, mainly based on the habitat environment theory established by Doxiadis, to study the change patterns of rural settlements in terms of location, landscape pattern and land use [4,5,6]. The study analyzed the spatial differences and evolutionary mechanisms of the rural habitat environment triggered by migration under reverse urbanization [7] and analyzed the role mechanisms of rural habitat environment planning, participation in remediation and sustainable development [8,9]. With the gradual emergence of urban–rural development imbalance and rural environmental pollution, scholars are paying more attention to the issue of the rural habitat. In terms of the construction of the index assessment system, scholars initially constructed an evaluation index system related to the rural habitat environment [10,11]. The Delphi method [12] and principal component analysis [13] were used to assign weights to the indicators. The former is subjective and focuses on highlighting key indicators, while the latter is objective, but may miss important variables. In order to compensate for the shortcomings of the above single methods, an increasing number of scholars tend to combine subjective and objective methods to ensure the scientific nature of the evaluation index system [14]. For a comprehensive evaluation, fuzzy comprehensive evaluation, the weighted summation method and the comprehensive index method are commonly used [15,16].
Most of the research paradigms on rural habitat issues are based on two major frameworks: one is the study of the natural suitability of rural habitat based on the perspective of rural tribes; the other is the study of the natural suitability of rural habitats based on the perspective of rural tribes. The analysis focuses on the dominant factors affecting the natural suitability level of the rural habitat, such as hydrological conditions, climatic conditions, topographic conditions and natural disasters [17,18,19]. The study reveals the natural evolutionary pattern of the rural habitat level. This research paradigm mainly takes the form of questionnaires to obtain relevant information [20]. In recent years, with the continuous maturation of GIS technology, some scholars have also adopted a comprehensive evaluation of the natural evolution of rural habitat levels based on GIS raster data [21]. The second is the comprehensive evaluation study of the rural habitat environment based on the perspective of provincial, urban and county levels. The purpose of this study is to grasp the spatial improvement and evolutionary trends of the rural habitat environment at the regional level, and it mostly uses statistical databases and various tracking survey reports for analysis. The main content is a comparison of the spatial and temporal evolution and divergence patterns of the regional rural habitat environment in a spatial and temporal dimension [22].
However, in terms of the current research results on the rural habitat environment, there is still room to deepen the research. From the perspective of research regions, most of them are based on national [23], provincial [24], watershed [25] and county [26] perspectives, and there are fewer studies on rural habitat environment levels in nature reserves and ecologically fragile areas. Some of the literature fragments the study pattern into local areas [27,28], which tends to ignore the spatial variation pattern of the rural habitat level within areas. Therefore, it is necessary to release the original regional framework and strengthen the analysis of the evolution of the spatial characteristics of the rural habitat level in the region from the original overall perspective. At the level of the choice of empirical methods, global regression models are mostly used to analyze the influencing factors, lacking the consideration of the internal linkages and interactions of regions in the process of rural habitat construction. These include multiple linear regression models [29], Tobit models [30] and binary logit models [31] relying on panel data. However geospatial data are strongly characterized by spatiotemporal heterogeneity; moreover, there are often structural differences in the relationships of variables in different regions or at different times, and further research must delve into the spatiotemporal effects of influencing factors.
A rural habitat system is characterized by openness, nonlinearity, instability and persistent volatility [32]. Any change in one of these elements will set off a chain reaction that will change the entire system.
China has carried out a series of institutional reforms to solve its “three rural areas problem” and break down the dual urban and rural structures. The reforms are intended to advance urban and rural development. Many agricultural policies have been applied to rural areas, resulting in frequent exchanges and interaction among the elements of the rural habitat system and its subsystems. Based on the theory of the rural area system and human settlement environment, the condition of rural settlements in nature reserves can now be measured.
Taking China’s Qilian Mountains Nature Reserve as an example, the period 2000–2020 is chosen as the research period in this paper. Those years saw rapid economic development. The years 2000, 2005, 2010, 2015 and 2020 were selected as the research nodes to construct the index system of the rural habitat environment and evaluate it in the Qilian Mountains area. Spatial autocorrelation is used to identify its differentiation pattern and its spatial clustering pattern. Finally, the main factors affecting the rural habitat environment are deconstructed by using geographically and temporally weighted regression. The purpose of this paper is to scientifically evaluate the quality of the rural habitat environment in the Qilian Mountains Nature Reserve, to clarify the spatial and temporal variation patterns of the rural habitat environment in the region, and to explore the driving mechanisms behind them. This paper is expected to provide suggestions for the optimization of rural habitat level and ecological policy formulation in the same type of nature reserves worldwide, in order to achieve the sustainable development of habitat environment, ecology and economy in a coordinated manner.

2. Research Methodology and Data Sources

2.1. Study Area Overview

The Qilian Mountains Nature Reserve (Figure 1) straddles Qinghai and Gansu Provinces and is located at the intersection of the Qinghai–Tibet Plateau, Loess Plateau and Mengxin Plateau. It is the birthplace of the Shiyang River, the Hei River and the Shule River in the interior of Northwest China. The reserve covers an area of 50,200 km2, with a gradual rise in terrain from east to west and a large altitude drop, with a relative height difference of more than 3000 m. It is an important area for biodiversity conservation in China and an important ecological security barrier in western China. In recent years, the problem of local ecological damage in the Qilian Mountains has been particularly prominent. The contradiction between conservation and development has been highlighted, the disharmony between human and land relations has increased, and sustainable development is threatened [33]. How to coordinate the protection of the ecological environment in the process of economic development with the improvement of the level of the human living environment has become a pressing problem to be solved in Qilian Mountains Nature Reserve. This paper takes the villages in Qilian Mountain Nature Reserve as an example to explore the quality of the rural habitat in the reserve.

2.2. Construction of the Indicator System

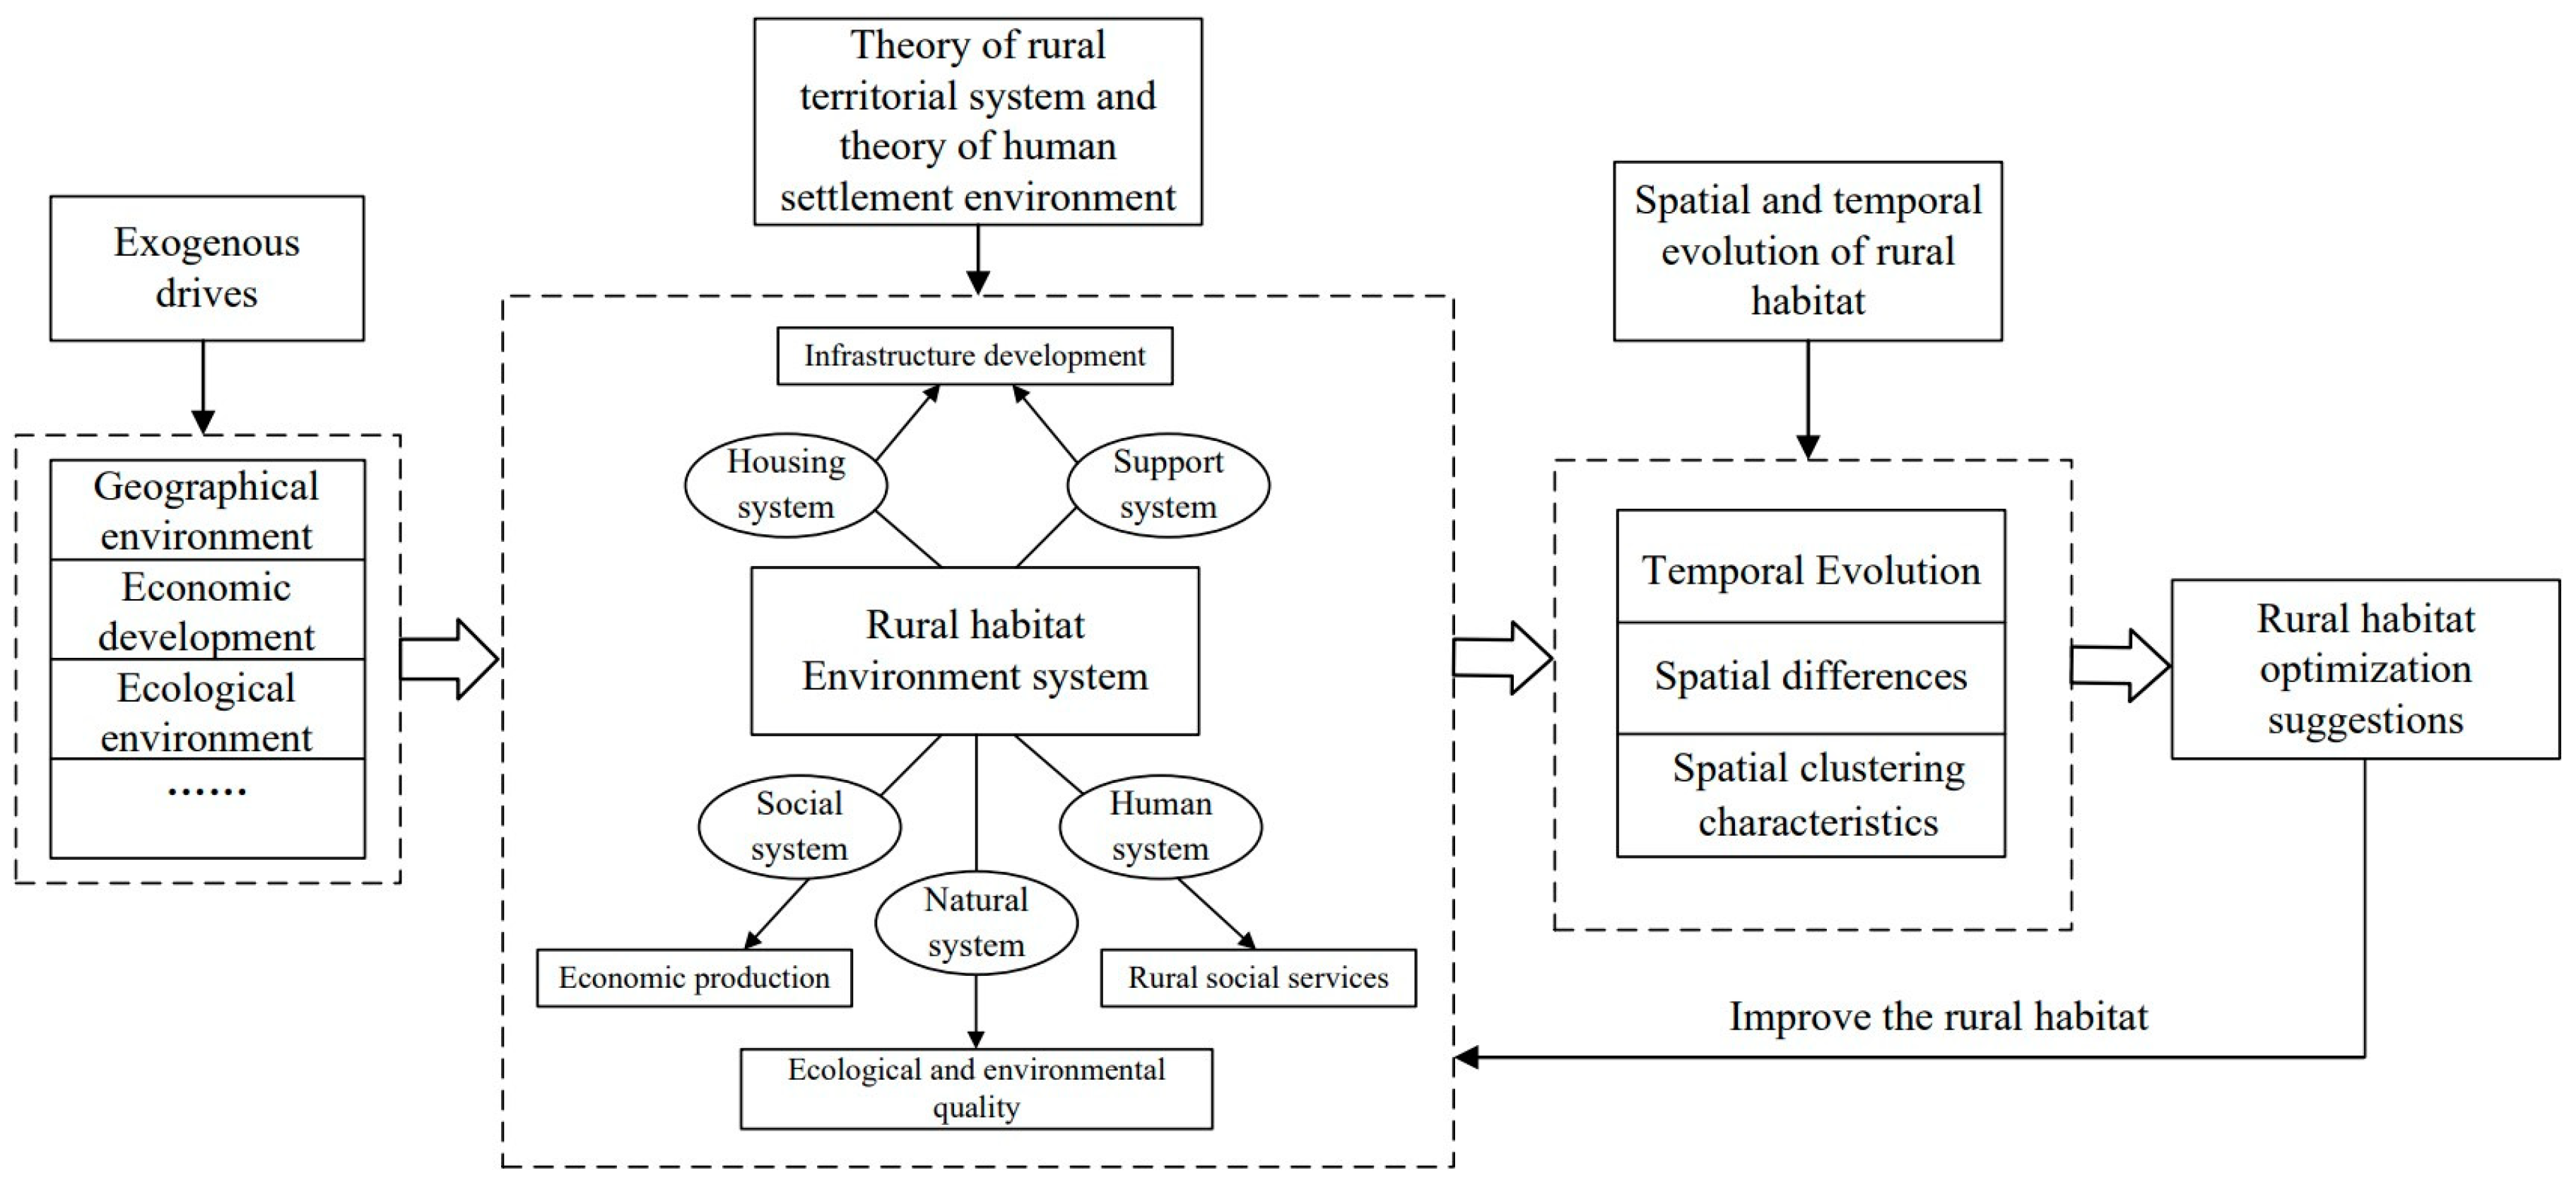
2.2.1. Construction of Rural Habitat Environment Index System

A rural habitat is a socio-economic–natural complex resulting from the settlement of rural inhabitants [34]. The research takes the natural ecological protection area as its research object in the construction of the index of the rural habitat environment. The influence of the ecological environment is fully considered.
Concerning reference to the research results about the evaluation and index system of the rural habitat environment [32,35,36], five subsystems of habitat environment were identified: social, human, natural, housing and support.
The support system and the housing system together constitute the physical environment of the rural habitat and are the unity of spatial and natural elements. At the same time, infrastructure development denotes the physical environment of the rural habitat. Five indicators were selected to measure the support system and living system: housing area per capita in the countryside, per capita electricity consumption of rural residents, number of hospital beds per 10,000 people, road network density and level of rural communication facilities. The level of economic production in the social system is the driving force of rural habitat construction, representing the economic level and living production of the countryside. The per capita net income of rural residents; food production per capita; per capita output value of agriculture, forestry, animal husbandry and fishery; level of agricultural modernization; and Engel’s coefficient of rural residents were selected for measurement. The natural system is the basic condition for the construction of the ecological environment and sustainable development of the countryside, as well as the embodiment of rural ecological civilization. Forest coverage, total water resources per capita, agricultural fertilizer application intensity, agricultural plastic film use intensity and intensity of pesticide use were selected as indicators to measure the quality of the ecological and environment. In the human system, the cultural needs of residents are the cornerstone of rural revitalization and progress, as well as a key of sustainable rural development in the future. Public library collections per 10,000 people, number of health technicians per 10,000 people, number of social welfare institutions per 10,000 people, number of villagers’ committee units per 10,000 people and teacher–student ratio in rural elementary school were selected for measurement.
Following the principles of scientific, relevance and data collectability, a rural habitat environment index system was constructed. The index objectively reflects both the state of the rural habitat environment and the regional characteristics of the ecological reserve (Table 1). Cronbach’s α is used to evaluate the extent to which the accuracy of the data affects the overall test results. When the tested coefficient exceeds 0.7, it indicates that the internal consistency of the data is high. Referring to the study of [37], the data of each indicator layer were imported into Spss 23.0 for hierarchical processing and classified into five levels. Reliability analysis tools were used to determine whether the variables satisfy consistency. After testing, the internal consistency reliability Cronbach’s α coefficient value of the rural habitat environment index system is 0.786, greater than the threshold value of 0.7. It meets the requirements of index consistency and representativeness.

2.2.2. Selection of Influencing Factors and Comparison of Model Results

Moran’s I value of the rural habitat environment in each year of the study node is greater than 0, which can be analyzed by modeling using GTWR. In this paper, considering the actual situation of the rural habitat environment in the Qilian Mountains Nature Reserve and the availability of data, based on related studies [38], nine indicators were selected for analysis from three aspects: geographical environment, economic development and ecological environment (Table 2). The geographical environment index was characterized by selecting the average temperature, average annual precipitation and average elevation [39,40]. The economic development index was characterized by selecting the GDP per capita, fixed asset investment and percentage of secondary and tertiary industries. PM2.5 concentration, carbon dioxide emissions and sulfur dioxide emissions from industrial waste gases, as important indicators for judging ecological quality, affect the health status of residents. Referring to existing studies [41,42,43], the three were used as indicators for judging the impact on the ecological environment. To reduce model bias caused by heteroskedasticity, the variables were standardized, and the treated variables were used as explanatory variables in the model. The rural habitat was used as the explanatory variable in the model. GTWR was used for analysis.
Since GTWR requires no global covariance and local covariance among the explanatory variables, a total of five variables passed the covariance diagnosis and significance test with significance level p < 0.05 and variance inflation factor VIF < 5 by regression model in SPSS23.0. The variables are the average temperature (X1), the amount of fixed asset investment (X2), the proportion of secondary and tertiary industries (X3), PM2.5 concentration (X4) and CO2 emissions (X5). To verify that there is no similarity between the evaluation indicators of the rural habitat environment and the indicators of influencing factors in the previous section, the variables were subjected to regression tests. The results found that the above five variables passed the test with significance level p < 0.05 and variance inflation factor VIF < 5. There is no similarity between the two types of indicators.

2.3. Data Sources

The basic data involved in this study are mainly the administrative boundary vector data and socio-economic development data of 13 regions. The administrative boundary data of the Qilian Mountains Nature Reserve are obtained from the National Geographic Information Database (1:1 million). The socioeconomic development data are from the county and municipal statistical yearbooks, statistical bulletins [44,45,46] and the Gansu Statistical Yearbook [47], Qinghai Statistical Yearbook [48] and China County Statistical Yearbook from 2000 to 2020 [49]. The data on average elevation are from geospatial data cloud DEM data (www.gscloud.cn, accessed on 26 January 2023); the data of average temperature and average precipitation are from the observation data of Gansu Province (www.gs.cma.gov.cn, accessed on 26 January 2023) and Qinghai (www.qh.cma.gov.cn, accessed on 26 January 2023) Meteorological Bureau; the data of PM2.5 concentration are from China General Environmental Inspection Station (www.cnemc.cn); the data of carbon dioxide emissions are from the latest energy statistics of China Bureau of Statistics (www.stats.gov.cn, accessed on 26 January 2023); and the data of Ganzhou are not available around 2000. The corresponding data for 2001 are used to supplement. Some counties and cities with missing data are supplemented with linear interpolation.

2.4. Research Methodology

2.4.1. Hierarchical Analysis Method

Hierarchical analysis is a combination of qualitative and quantitative decision analysis. It is systematic, practical and concise, and is often applied to multi-objective, multi-criteria, multi-level complex decision-making problems. The basic idea is to establish a recursive and ordered hierarchical structure model according to the requirements of the problem, and to derive the weights of each index through comparative judgment and mathematical calculation between factors at each level. YAAHP is used to draw the rural habitat environment evaluation model, construct the judgment matrix, conduct consistency tests and determine the weights of each indicator. Considering the positivity and negativity of the indicators, the mean standardization method is chosen to eliminate the influence of the different indexes on the results. The research framework is shown in Figure 2.

2.4.2. Entropy Method

The entropy method is an objective assignment method, which can avoid the subjective influence in weight acquisition. The steps are as follows [50,51]:
(1)
Construct the eigenvalue matrix. Assuming that the number of rural habitat environment research objects is m and the number of evaluation indicators is n, the original matrix of the rural habitat environment evaluation of order m*n can be constructed.
(2)
Data standardization. The indicators are standardized to eliminate the differences in scale, order of magnitude, positive and negative orientation; G j i is the result of standardization of   X i j data.
(3)
Indicator homogeneity quantification. Based on the standardization of data, the homogeneous quantification of indicators is carried out, and the numerical weight   p i j of the jth indicator of the ith research object is calculated.
p i j = G j i / i = 1 m G j i
(4)
Entropy value and coefficient of variation calculation. Calculate the entropy value e j   of the jth index as
e j = i = 1 n p i j ln p i j ln m
(5)
Determine the indicator weights. There are n indicators in the comprehensive evaluation, and the coefficient of variation of the jth indicator is calculated, g j = 1 e j ;   then, the weight w j   of the jth indicator is
w j = g j / j = 1 n g j
(6)
Measure the comprehensive evaluation score of the rural habitat environment level.
S j = j = 1 n w j y t i j
s j   is the composite score of the rural habitat environment level, and   w j is the weight of the index obtained.

2.4.3. Calculation of Combined Weights

Let the combined weight of evaluation index j be Wj, Wj =   α w j + 1 α φ j , Wj is the weight of the hierarchical analysis method and φ j is the weight of the entropy value method. That is, the integrated weight is a linear combination of the hierarchical analysis method (subjective weight) and the entropy method (objective weight). When α = 0.5, the sum of squares of θ 1 and   θ 2   is minimized. In this paper, we used a combination of the entropy method and the AHP and considered both to be equally important in weighting. We set the α value to 0.5.
W j = 0.5 w j + 0.5 φ j

2.4.4. Global Spatial Autocorrelation

Global spatial autocorrelation characterizes the correlation and significance between the study areas through Moran’s I, which can fully reflect whether the rural habitat level in Qilian Mountains National Park has obvious clustering characteristics, and the calculation formula is as follows [52].
Moran s   I = i = 1 n j i n w i j x i x ¯ x j x ¯ s 2 i = 1 n j i n w i j
S 2 = i = 1 n x i x ¯ 2 n ,   x = i = 1 n x i n
x i   and x j   are the indicator attribute values of region i and j, respectively; n is the number of spatial units; x   ¯ is the average value of the indicator attribute values; w i j   is the spatial weight matrix; region i and j are spatially adjacent to 1, and not adjacent to 0. The value of Moran’s I is in the range of [−1,1]. When the value of I is positive, there is a positive spatial correlation, and the areas with higher (or lower) rural habitat are significantly clustered in space. When the value of I is negative, there is negative spatial correlation, and the rural habitat environment is significantly different and spatially dispersed. When the value of I is 0, the index attribute values are independent of each other and are randomly distributed in space.

2.4.5. Local Spatial Autocorrelation

Local spatial autocorrelation can further measure spatial differences and significance characteristics between the study unit and the surrounding. It is used to describe the distribution characteristics of areas with similar levels of local rural habitat and to pinpoint the specific locations of the spatial clustering of geographic elements or local clustering phenomena [53]. The calculation formula is as follows.
I i = z i j w i j z j
I i   is the local Moran index of region I, w i j   is the spatial weight, j w i j = 1, z i and z j represent the normalized evaluation values of region i and neighboring region j. If I i > 0, z i > 0, region i is in the H-H quadrant. If I i > 0, z i < 0, region i is in the L-L quadrant. If I i < 0, z i > 0, region i is in the H-L quadrant. If I i < 0, z i < 0, region i is in the L-H quadrant.

2.4.6. Geographically and Temporally Weighted Regression

This paper measures the spatial and temporal heterogeneity of factors affecting the level of rural habitat in the Qilian Mountains Nature Reserve using geographically and temporally weighted regression (GTWR). The geographically and temporally weighted regression model combines a time-weighted regression model with a geographically weighted regression model (GWR), which can measure the spatiotemporal heterogeneity of rural habitat level factors more accurately than the geographically weighted regression model, making the estimation results more effective and providing conditions for dealing with “spatiotemporal effects” [54].
Y i = β 0 u i , v i , t i + β k u i , v i , t i X i k + ε i
Y i is the explanatory variable, which is the rural habitat level in this paper; u i , v i   a n d   t i are the longitude, dimension and time of the ith geographical unit. u i , v i , t i   is the spatiotemporal coordinate of the ith county. β 0 u i , v i , t i is the intercept term; β k u i , v i , t i is the regression coefficient of the kth driver of the ith county. X i k is the value of the kth driver at point i. ε i is the residual.
Considering the inconsistent spatial distribution density between counties and villages, the automatic optimization method was used to determine the spatiotemporal weight matrix. To generate a smoother kernel surface, the bandwidth is selected using the fixed distance method and the optimal bandwidth is established using the AIC criterion method [48].
Due to the different spatial and temporal units, the socio-economic and ecological environment will have certain differences in changes, and the degree of action of each factor will produce spatial and temporal heterogeneity characteristics. The spatial heterogeneity of factors influencing the rural habitat in Qilian Mountains Nature Reserve from 2000 to 2020 was explored by GTWR, and the spatial heterogeneity pattern of the action magnitude of each factor was analyzed and compared with OLS, TWR and GWR models to verify the superiority of GTWR model (Table 3).
From the comparison results, the OLS and TWR results are similar, and the GWR and GTWR results are closer. In terms of R2, RSS and AICc criterion, OLS and TWR have a significant disadvantage over GWR and GWTR because neither one considers the spatial heterogeneity characteristics of the elements leading to deviations in the model values. The R2 of GTWR has the highest goodness of fit (0.927), RSS has the smallest (0.141), and the AICc criterion has the smallest value (−1637.875). Compared with the GWR model, the GTWR model integrates spatial and temporal heterogeneity, and can correct for the local effects of each variable, which is superior. Finally, the GTWR model is selected to analyze the influencing factors described in this paper.

3. Results and Analysis

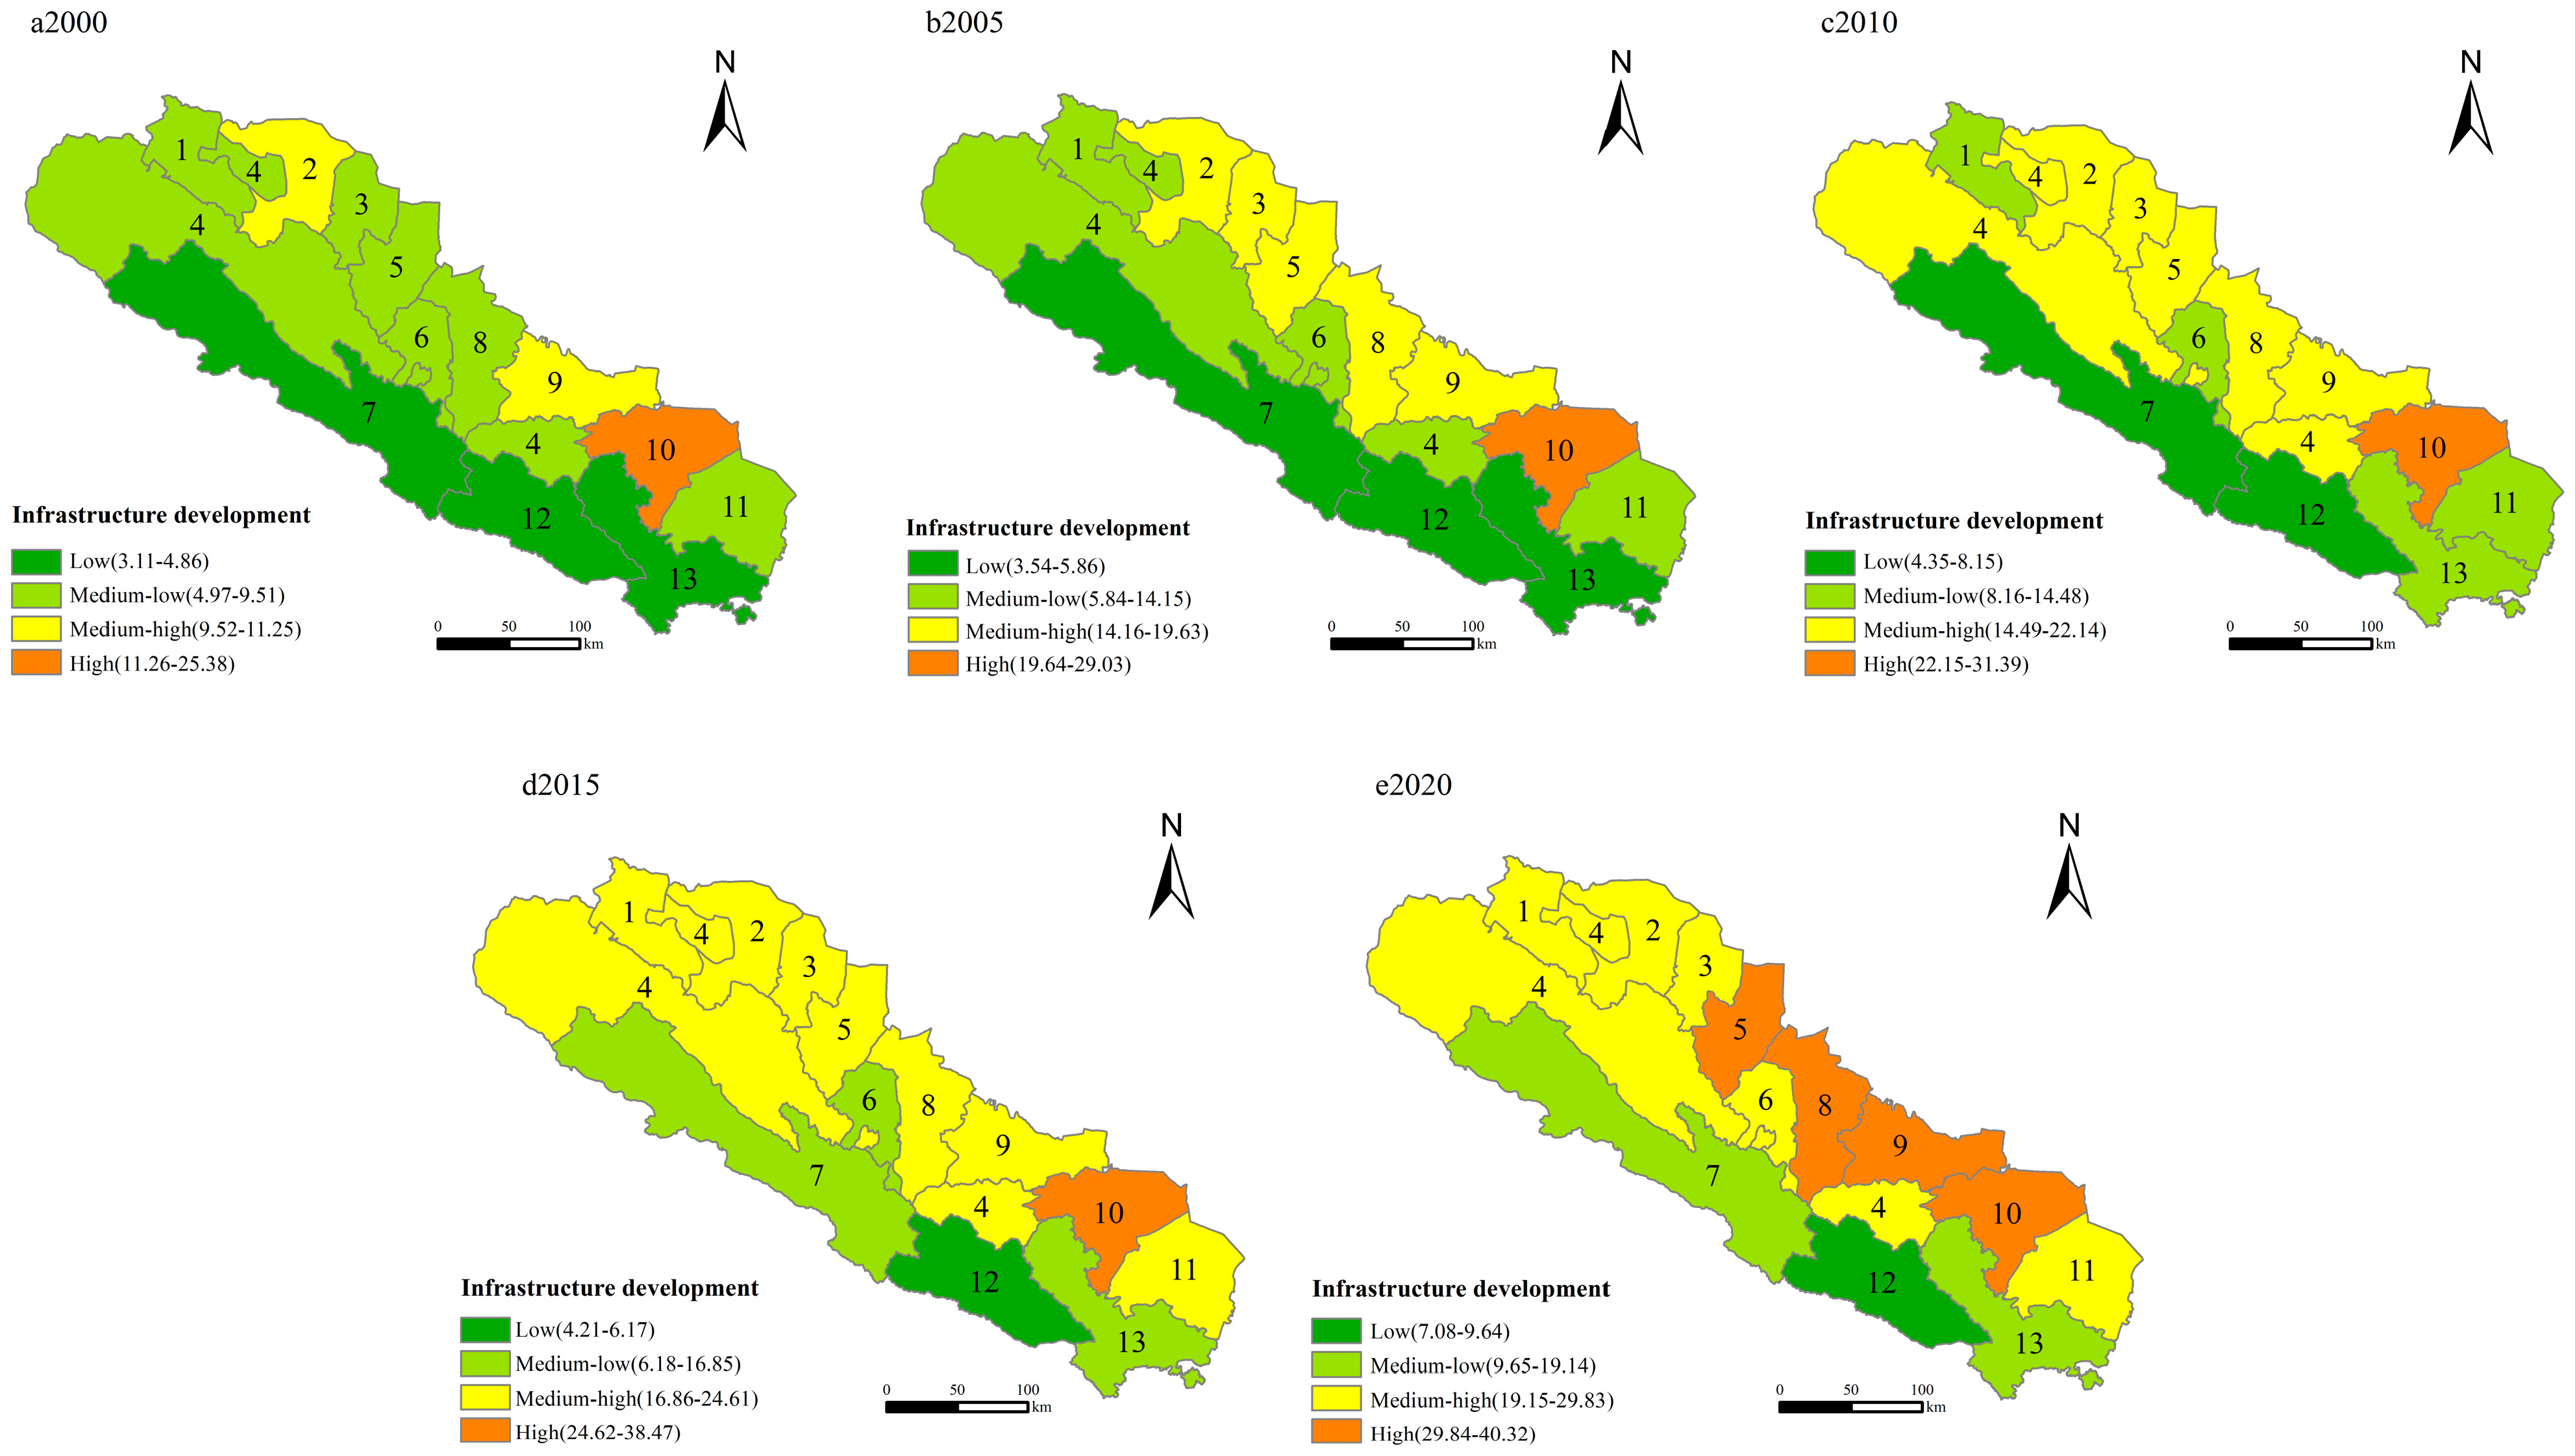
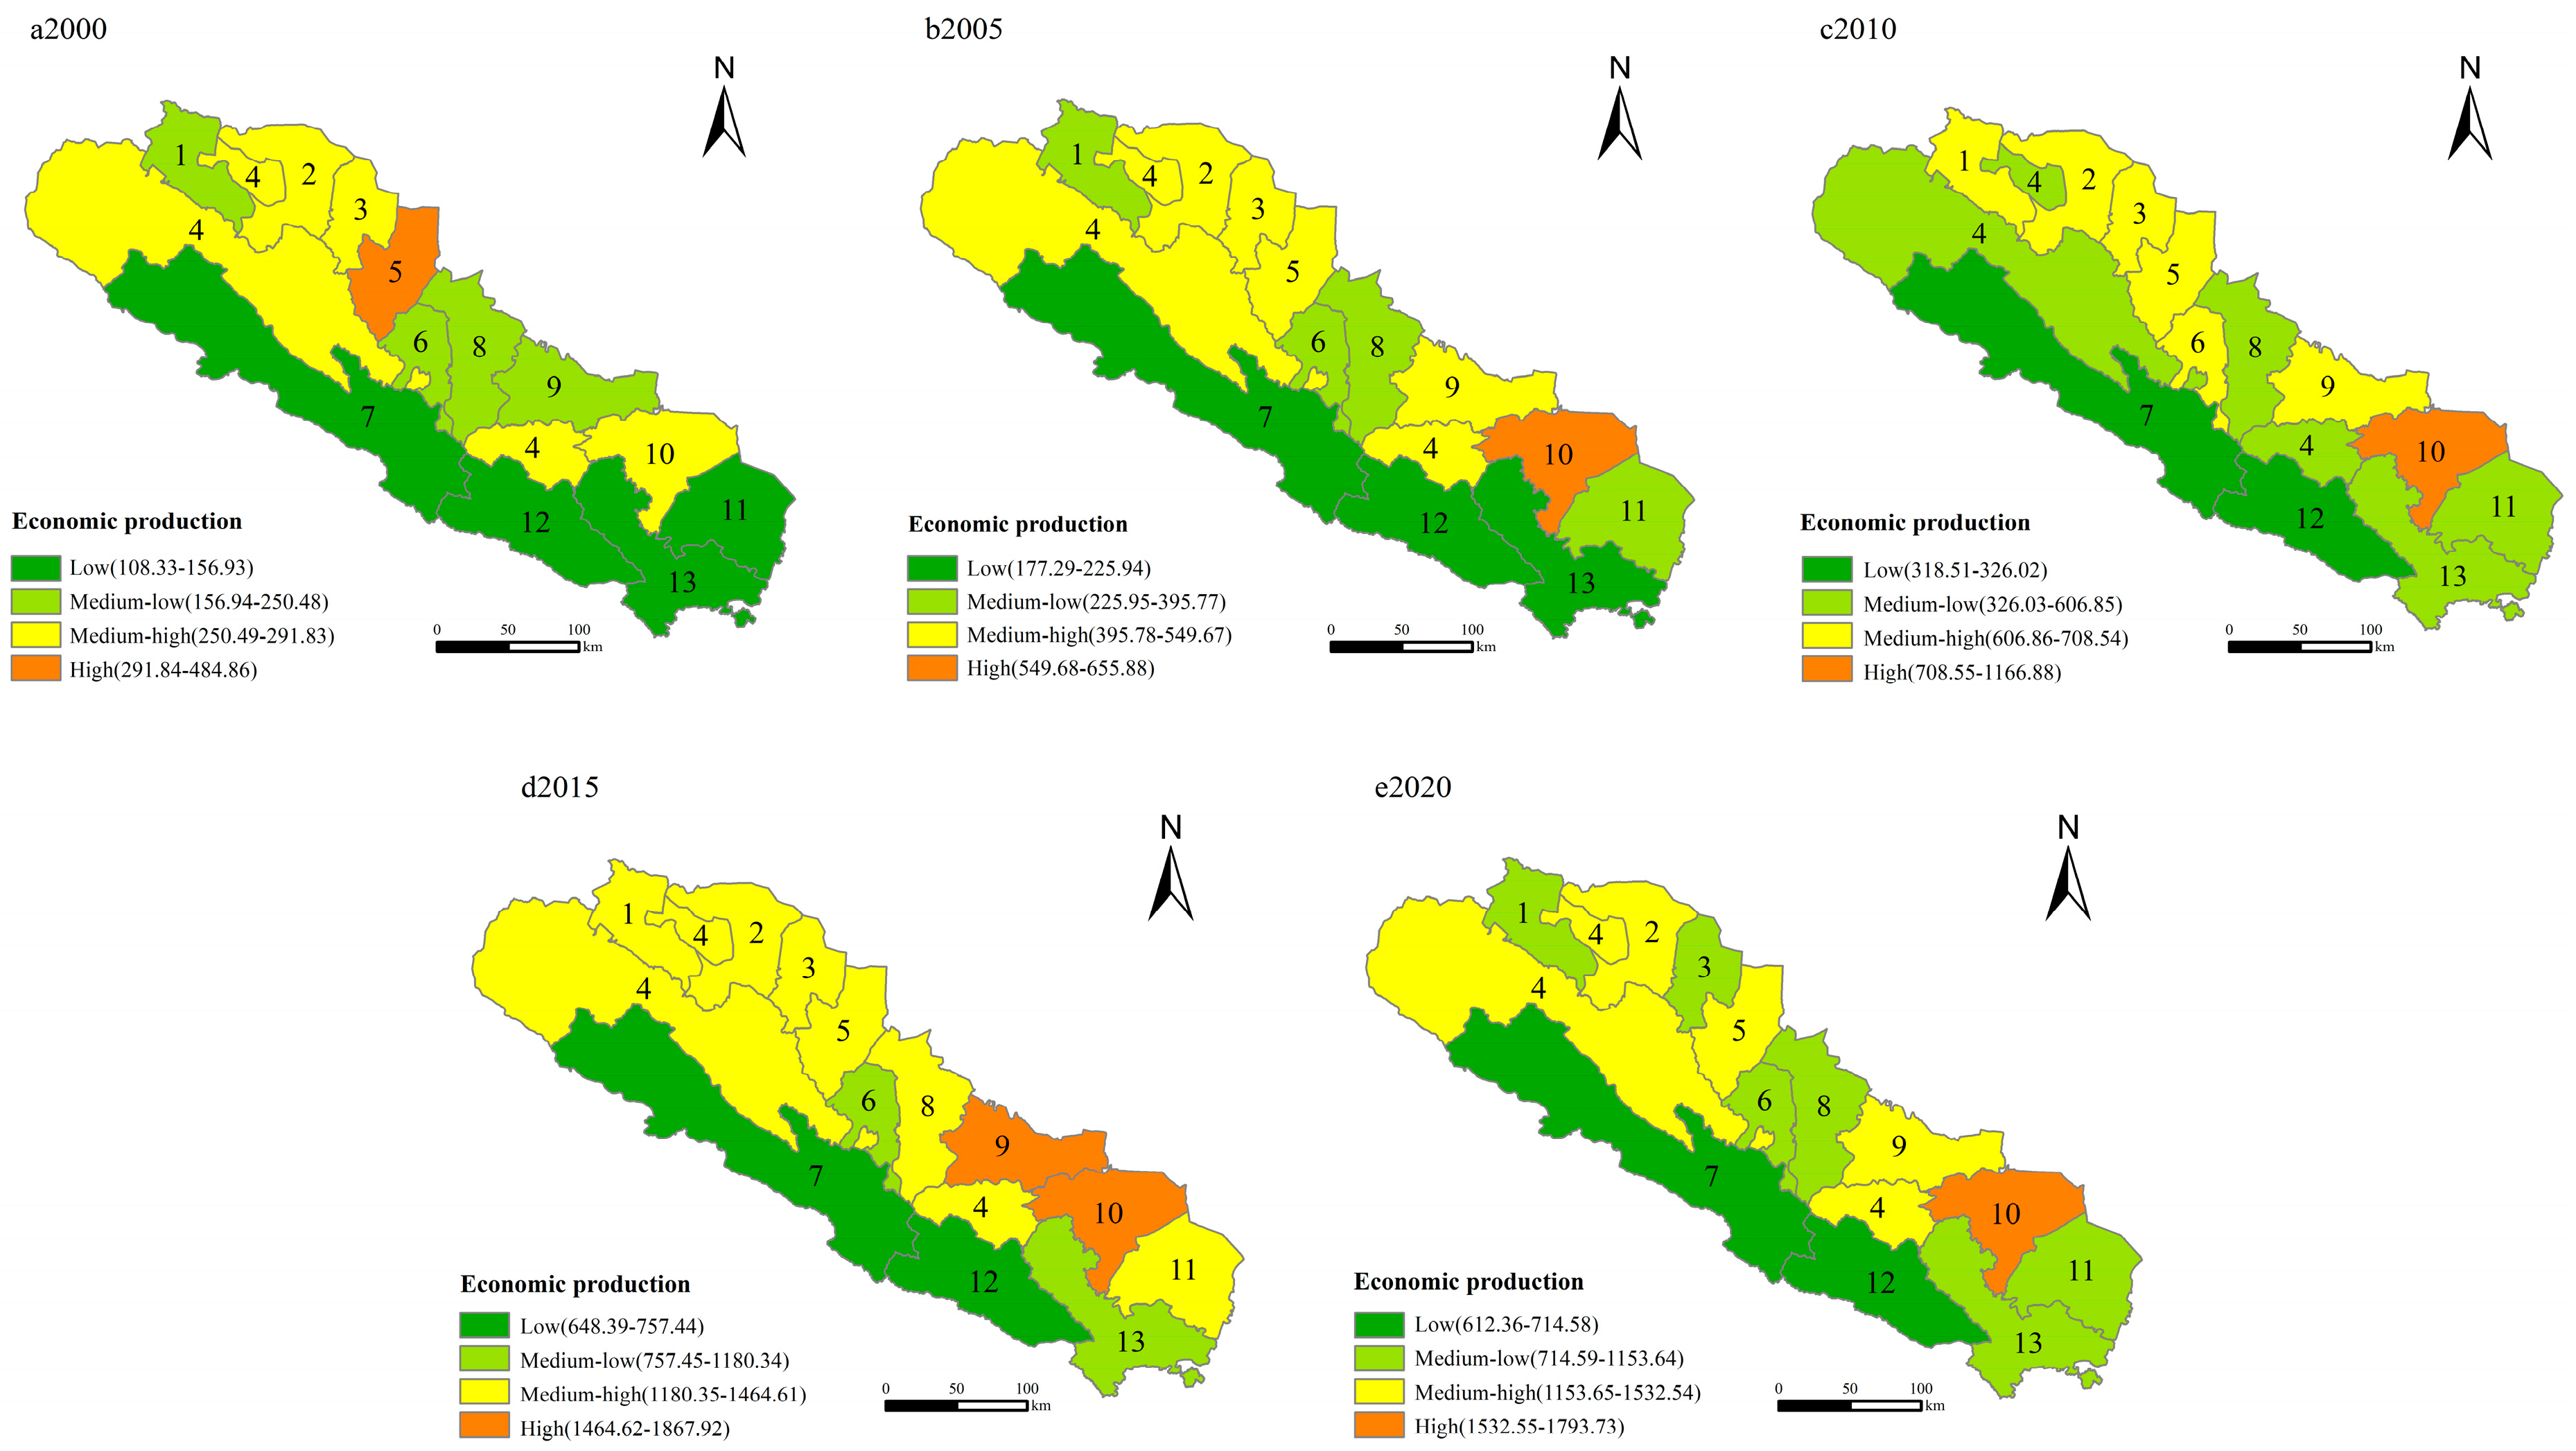
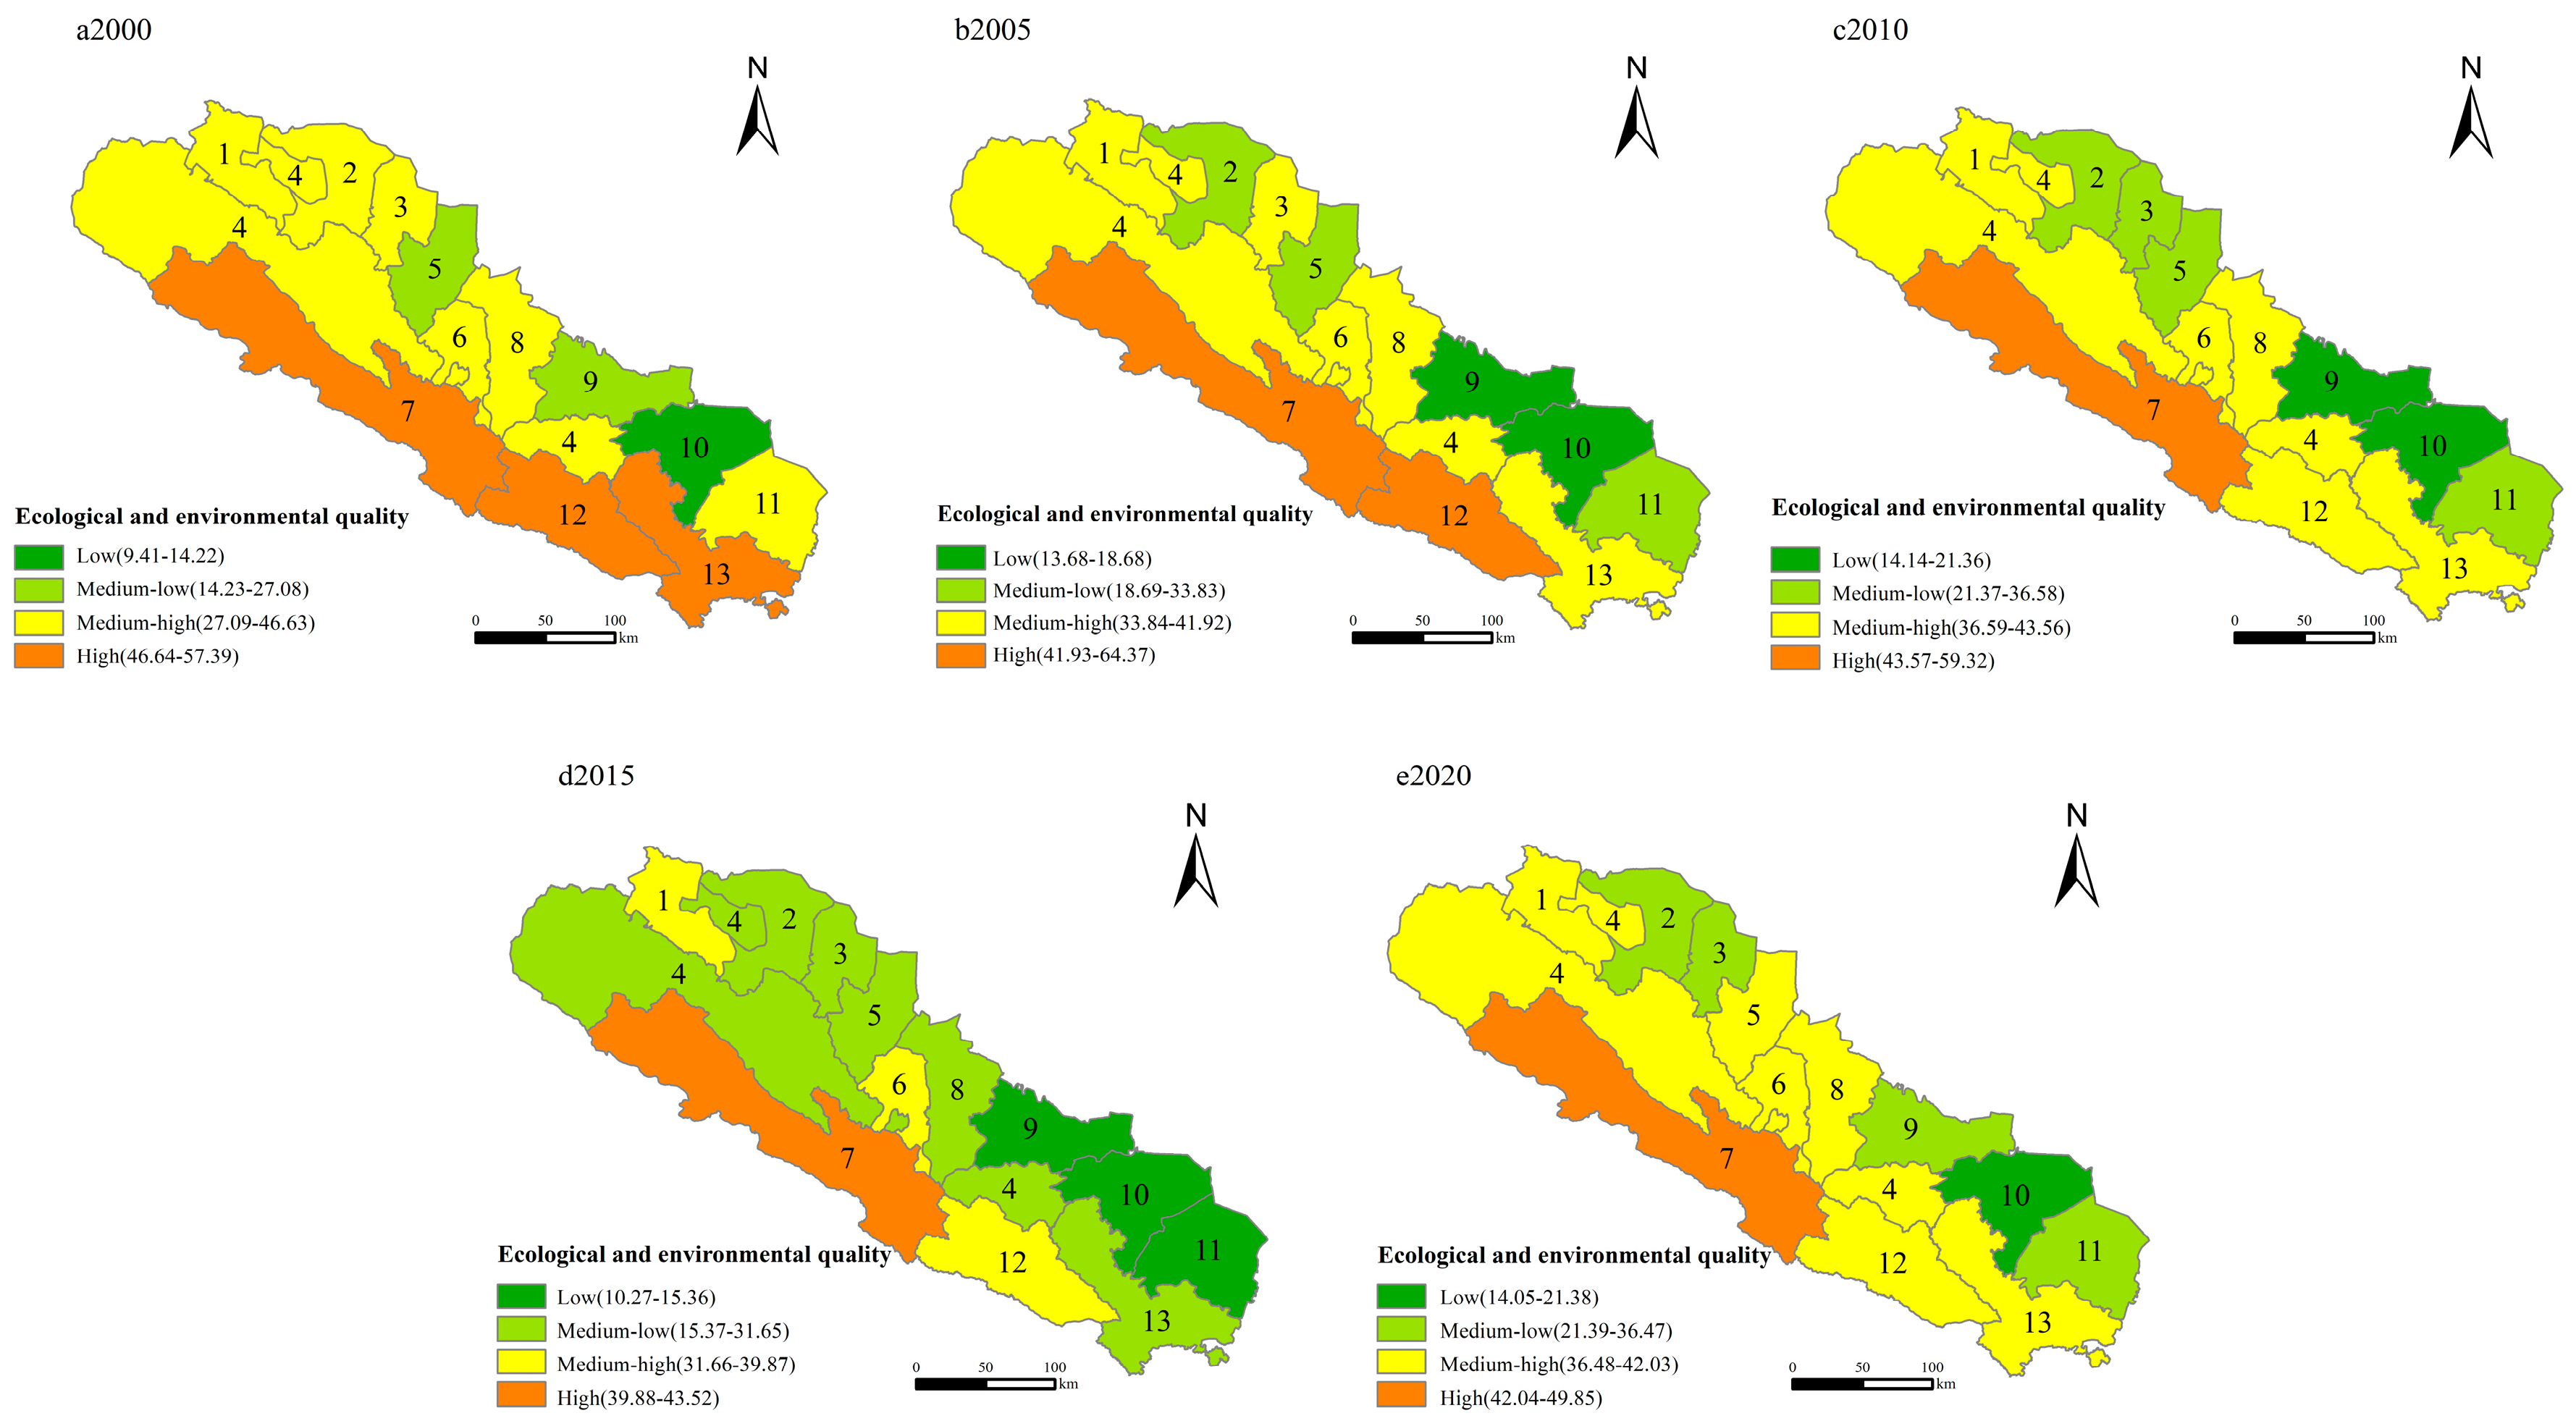
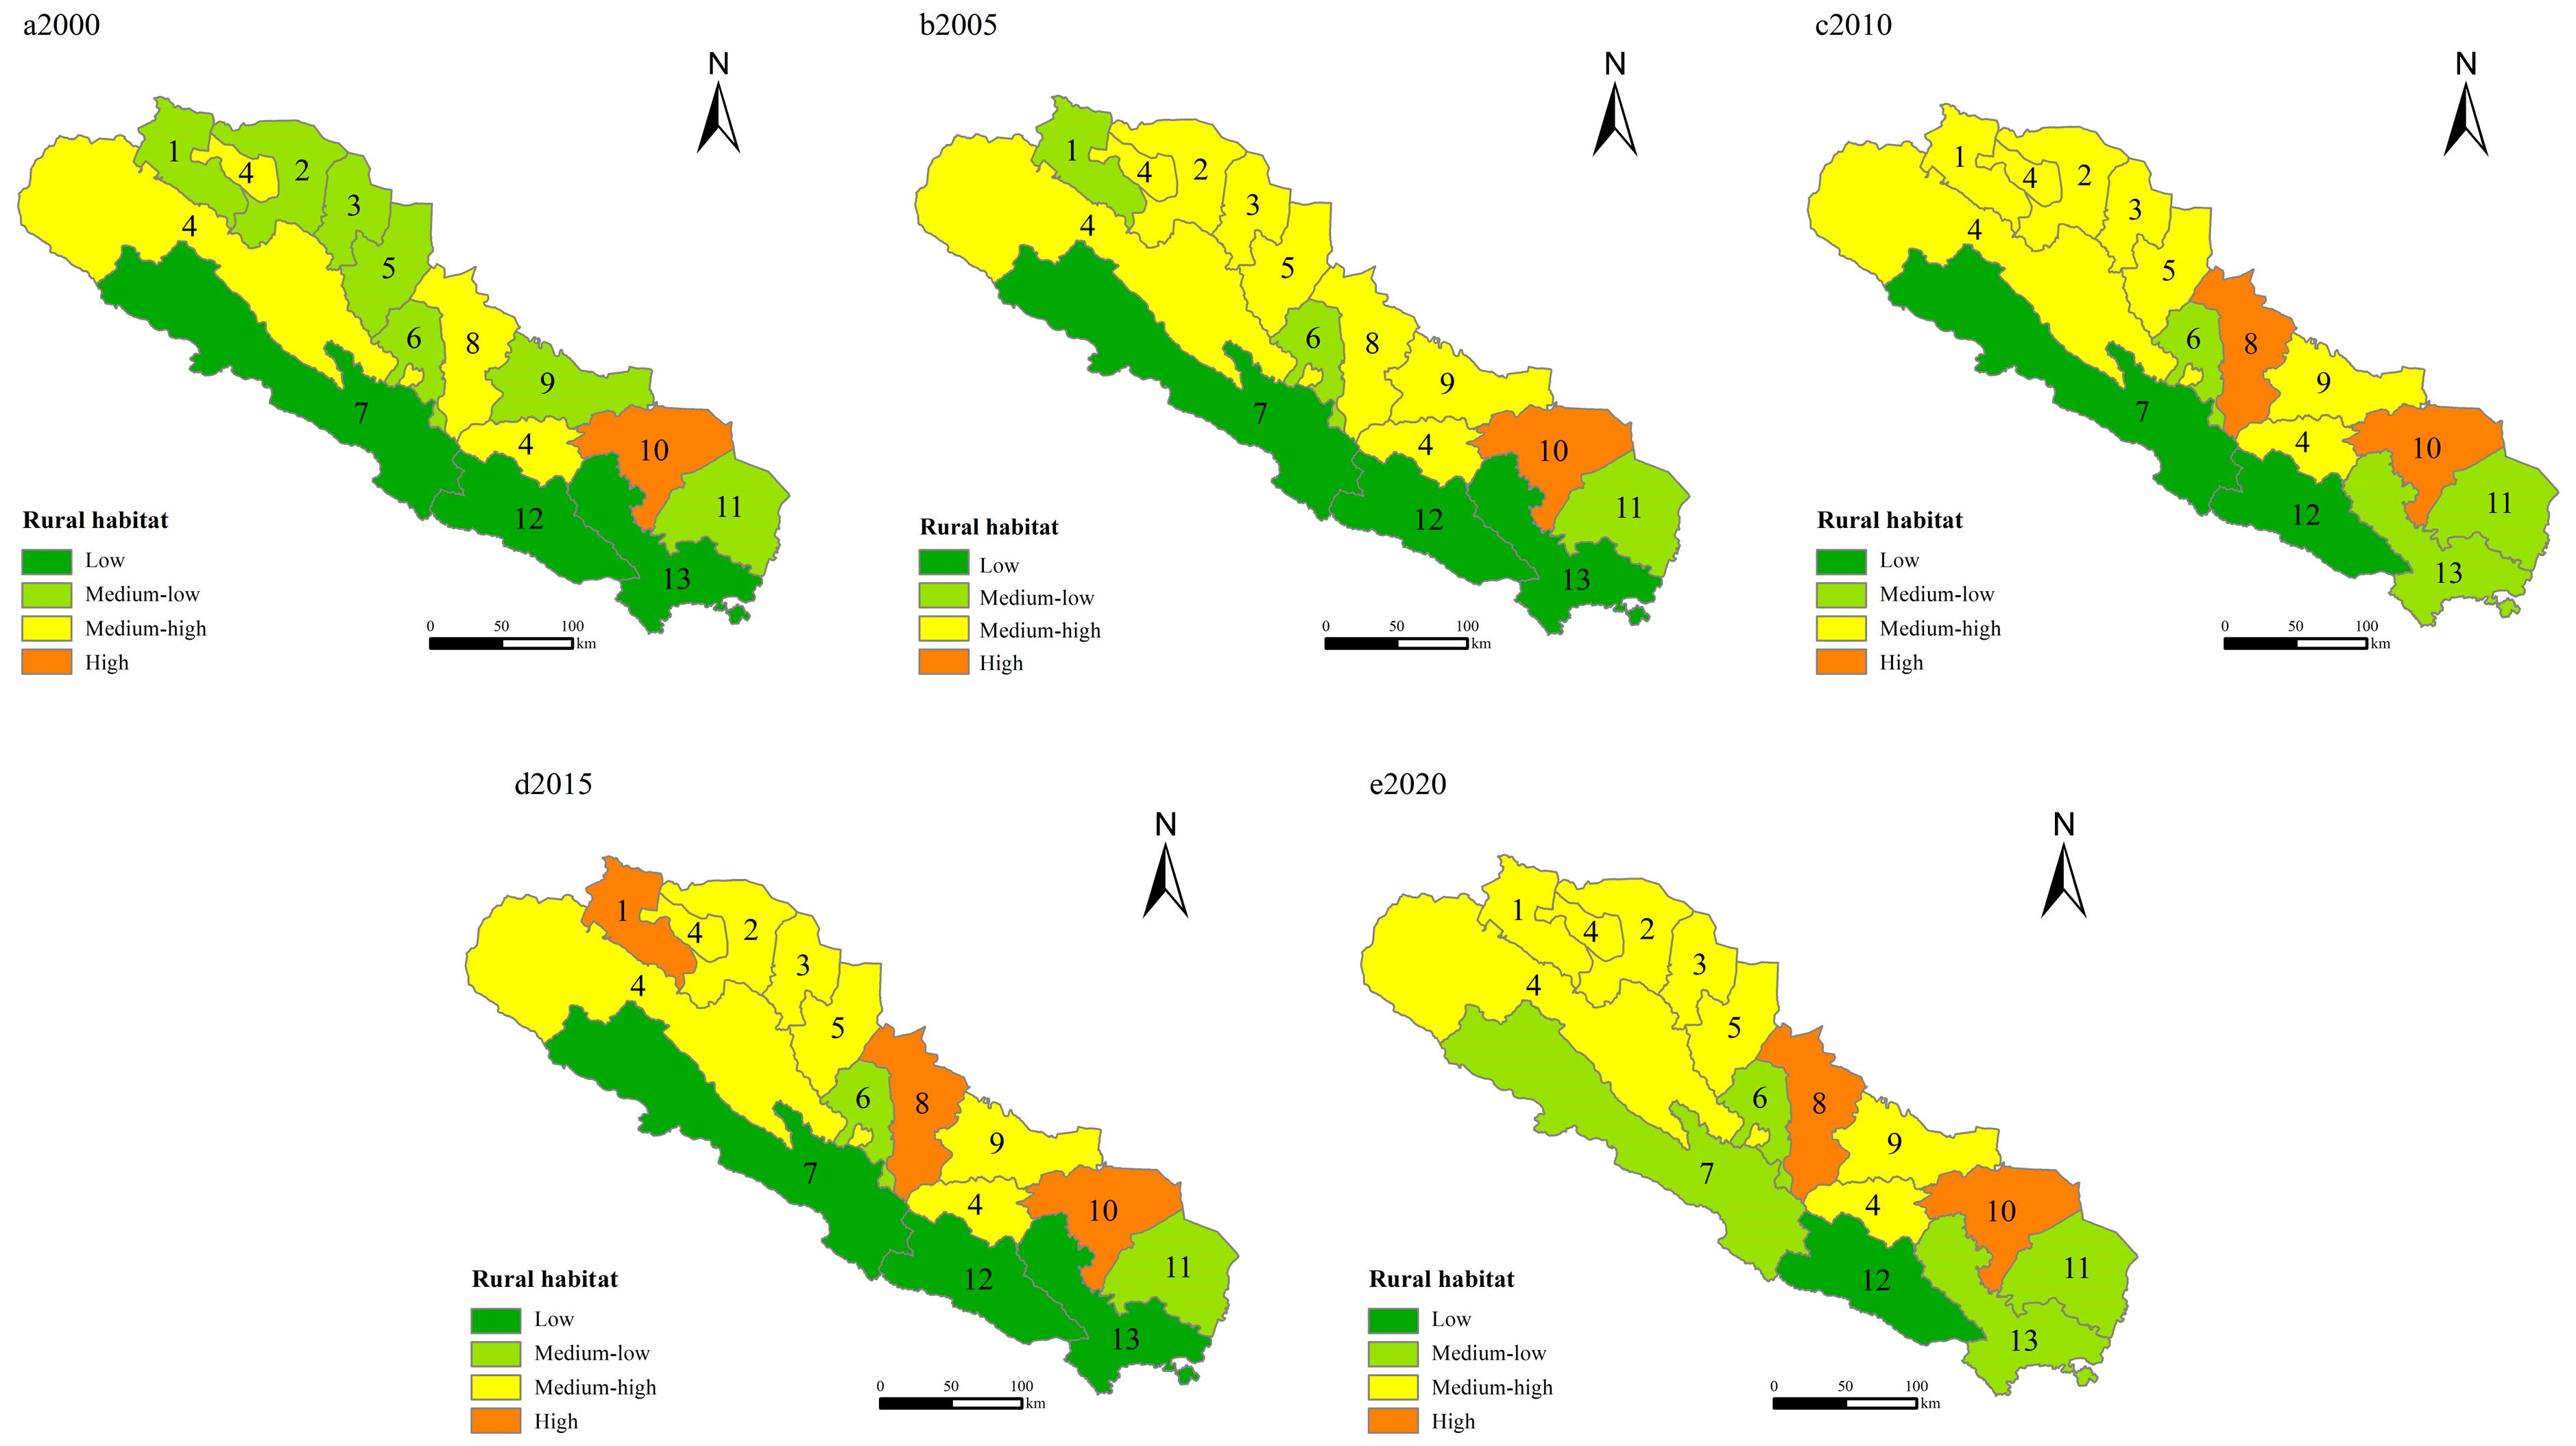
3.1. Spatial and Temporal Evolution Characteristics of Rural Habitat in Qilian Mountains National Park

According to the evaluation system of the rural habitat environment in the Qilian Mountains, the comprehensive score is calculated by the ArcGIS10.8 natural breakpoint method. The evaluation results were divided into four categories: low region, medium–low region, medium–high region and high region. The distribution and evolution characteristics of each functional area are analyzed.
Infrastructure development: The numerical level of infrastructure construction in the Qilian mountains Nature Reserve showed an increasing trend (Figure 3), with the mean value rising from 5.068 to 8.312, an increase of 64.01%. The growth rate was faster in 2010–2015, with an increase of 26.71%, and steady growth was achieved in 2000–2010. Referring to existing studies [55], due to the impact of COVID-19, the level of infrastructure in 2020 showed a downward trend, decreasing by 2.98% compared to 2010–2015. The construction in the northern part of the study area is higher than that in the eastern and southern, and in Gansu Province it is higher than in Qinghai.
The advantaged areas are located in areas of flat terrain such as Liangzhou, Shandan and Yongchang. The unique geographical conditions make it possible to coordinate development within the region, and with the implementation of the supporting systems and policies in the national urban–rural area supporting reform pilot, the rural infrastructure supporting functions have been perfected, raising the level of infrastructure construction within the region.
Low- and medium–low-value areas are located in the eastern and southern mountainous areas, with the mountains covering more than 80% of the area. Restricted by reserve development, the support system is imperfect. The construction of rural roads is not systematic, the traffic is blocked, the residents find travel difficult and inconvenient, the rural dwellings remain rough in construction and the living conditions for humans are poor. Humans and animals have to live in the same space. This leads to the conclusion that the infrastructure in the region is weak.
The local government should promote the implementation of ecological relocation, plan the gradual transfer of residents of nature reserves to towns and shallow mountainous areas, promote projects such as clean-up projects, and gradually improve the infrastructure construction in low-value areas.
Economic production: The overall economic production of the Qilian Mountains Nature Reserve showed an upward trend (Figure 4), with an average value of 304.88 in 2015, which is the highest in the study period. The highest rate of increase was 44.66% and the fastest growth rate from 2005–2010, up 77.26%. Referring to existing studies [56], the COVID-19 pandemic reduced economic production in some areas by 3.13% in 2020 compared to 2015.
Economic production in the northwest region of the study area is higher than in the south and southeast, and that of Gansu is higher than that of Qinghai. The advantaged areas are located in Liangzhou and in other areas with better infrastructure and convenient transportation. The favorable geographical conditions attract capital, technology and talent, which gather here and drive the optimization of the industrial structure.
The special funds of the state and local governments will promote the development of economic organizations and enterprises, and enable the residents to participate in the ecological economy. The low- and medium–low-value areas are located in the south and southeast of the study area, which are high mountainous areas with harsh natural conditions, sparsely populated and large areas of barren hills and slopes.
Restricted by the development of the nature reserve, residents only have a single source of livelihood, resulting in a widening economic income gap with high-value areas. The economic production of the nature reserve depends on national policies and projects, and the spatial differences are obvious. The management of the nature reserve should perfect its ecological compensation and ecological migration mechanisms, as well as promote projects such as “beautiful villages” and “ecological towns,” so that residents can participate in the construction of ecological projects and increase their income.
Ecological and environmental quality: The ecological and environmental quality of the Qilian Mountains Nature Reserve is declining (Figure 5), with the average value decreasing by 25.35%, from 11.99 to 8.95. The average value of ecological environmental quality was the lowest in 2015 at 8.31, and the environmental quality decreased at the fastest rate from 2010 to 2015, with a range of 26.41%.
The areas with the better ecological environment quality are located in Mengyuan, Qilian and other areas where the natural ecological environment is superior and the components of the complex ecosystem are complete. Low and medium–low areas are distributed in the north of Liangzhou, Gaotai and other densely populated areas, where there is an industrial cluster on a large scale. Production activities deteriorate the ecological and environmental quality. Over the past 20 years and especially in 2015–2020, ecological damage in the Qilian Mountains Nature Reserve has been a serious problem.
Large-scale mining activities have created a series of problems such as localized vegetation destruction, soil erosion and surface collapse. Some hydropower facilities are illegally constructed, and due to insufficient consideration of the ecological flow in the protected area during construction and operation, there has been water reduction and even cut-off in the downstream section of the river, as well as serious damage to the ecosystem. Ineffective government supervision and rectification efforts have resulted in the slow progress of ecological restoration and remediation work, a combination leading to ecological and environmental damage to the Qilian Mountains.
In 2017, China introduced their strictest protection policies and carried out special rectification activities to improve ecological and environmental conditions in the Qilian Mountains Nature Reserve. The ecological and environmental quality in Mengyuan, Sunan and other areas improved slightly. As an ecologically fragile area, the Qilian Mountains need natural forest protection—the return of farmland to forest, and soil and water conservation. The government should enforce strict forest conservation measures such as a ban on logging in natural forests, as well as the sealing of forests to establish an ecological barrier and promote a harmonious relationship between people and nature.
Rural social services: The level of rural social services in the Qilian Mountains Nature Reserve showed an upward trend (Figure 6), with the average value rising from 7.62 to 9.49, an increase of 19.71%. The period of 2000-2005 saw a faster growth rate of 42.24%, and 2005–2015 achieved a steady increase. Rural social services decreased slightly in 2020 due to the COVID-19 pandemic [57], by 18.77% compared to 2015, with a slight improvement in services in the central part of the study area. The distribution characteristics are more like the distribution of infrastructure construction. Central and northern rural social services are better than those in the south and east. The most favorable areas are in Gansu Liangzhou and Shandan.
Low and medium–low areas are located in the eastern and southern mountainous areas. The rural social security system is flawed, and the government’s policy support for education and medical care in the mountainous areas is weak and easy to drain, making it difficult to introduce excellent medical and teaching staff.
The local government should plan the village system to realize the sharing of resources such as education and medical care between urban and rural areas. The government also should further strengthen the construction of public service facilities and cultural activities, stabilize and optimize the team of rural teachers and doctors, and better ensure that residents enjoy equal access to education and basic medical services.
Rural Habitat: From the overall spatial distribution of the rural habitat in the Qilian Mountains Nature Reserve, the rural habitat has improved significantly in 20 years (Figure 7). The high and medium–high areas are located in the central and northern regions, and the low and medium–low areas are located in the southern regions.
In response to the problems of rural poverty, backward production conditions, limited public services and poor living environment, the government has implemented policies for the benefit of the people. Projects for whole-village improvement, poverty alleviation and development have greatly improved residents’ living conditions. Rural areas are strengthening the construction of transportation, water conservancy projects, and electric power facilities in towns and shallow mountainous areas, improving rural public services, implementing rural welfare projects, improving rural governance, changing conditions in rural schools and upgrading public medical services.
During the implementation of projects such as ecological home construction, poverty alleviation and relocation, beautiful countryside and “long-term governance” projects, the living habits and lifestyle of residents in deep mountainous areas have begun to change. Residents’ income has increased and there have been significant improvements in the ecological environment and public service facilities. Due to the deprivation of traditional resource use rights in nature reserves and limited local infrastructure construction, some residents’ livelihoods and production remain in a difficult situation.
In areas where no ecological projects have been implemented, residents have been stealing forest resources. Illegal mining and other illegal acts engaged in by residents to survive pose a serious threat to local ecological construction. How the local government implements policies to benefit and strengthen agriculture and ensure the coordinated development of ecological environment and habitat is key to improving the rural habitat in the Qilian Mountains Nature Reserve.

3.2. Spatial Clustering Characteristics of Rural Habitat in Qilian Mountains

3.2.1. Global Spatial Autocorrelation

Moran’s I index of the rural habitat in Qilian Mountains Nature Reserve over five years was calculated by Geoda. Z-value and p-value tests were performed. The results are shown in Table 4.
At the significance level of p ≤ 0.05, the Z-values of all four years were greater than 1.96, which passed the significance test, and Moran’s I indexes were all positive, showing an obvious positive spatial correlation, indicating that regions with similar rural habitat environments have a certain spatial clustering and regions with a more developed rural habitat environment are spatially adjacent.
Regions with poorer rural habitat environments are spatially adjacent. Among them, Moran’s I index of the rural habitat environment in 2015 was 0.192, which was the highest in five years, indicating that the spatial clustering of the rural habitat environment in Qilian Mountains Nature Reserve was the most pronounced in 2015. The 2010 Moran I index of the rural habitat environment was 0.085, with a value of 1.68 and a p-value of 0.07, which only passed the 7% significance test, indicating that the spatial clustering of rural habitat among regions in the Qilian Mountains in 2010 is not significant.

3.2.2. Local Spatial Autocorrelation

The local spatial autocorrelation LISA index allows a more intuitive analysis of the specific geographical distribution of the agglomerations, and it is obvious from Moran’s scatter plot (Figure 8) that the scatter points are distributed in quadrants 1 and 2, with high–high and high–low distributions. It shows that there are cities with a high or low level of rural habitat within the Qilian Mountains Nature Reserve, and the number of cities with a high level of rural habitat is greater than the number of cities with a low one, showing an imbalance of regional heterogeneity. Cities with higher levels of rural habitat have a stronger radiating effect on neighboring cities, and cities in the third quadrant of low–low are likely to be caught in a cycle of constant weakness.
The LISA aggregation results (Table 5) show that the high–high (H-H) aggregation area is distributed in Liangzhou, the low–low (L-L) aggregation area is distributed in Menyuan in 2000–2015, and the low–low area excludes Menyuan in 2020. Liangzhou is a key point along the ancient Silk Road, with a long history of humanities, rich agricultural resources, superior socio-economic and natural conditions, a high urbanization rate, and nearly complete medical security and educational systems. Local farmers can increase their income by entering non-agricultural industries. As a competitive county in Gansu Province, it has a leading role in the development of the surrounding counties, improving the living environment of their residents.
The mountainous area in Menyuan accounts for 83.1% of its total area, with an average altitude of 2866 m, complex topography and disparities in height. The region is dominated by traditional agricultural production methods, with relatively poor natural conditions, limited urbanization and industrialization, and a single industrial structure. As an important nature reserve and water connotation area within the reserve, its regional industry has limited development potential and difficult industrial transformation. In 2019, in the wake of new government policies, Mengyuan’s gross regional product grew 3.8% year-on-year and was removed from the list of poverty-stricken counties. The promotion of government policies, accelerating the process of urban–rural complementation, forming a new urban–rural relationship of common prosperity, carrying out ecological tourism projects, increasing residents’ income and the prosperity of agricultural industries are the keys to improving the rural habitat of the region.

3.3. Spatial and Temporal Heterogeneity Analysis of Influencing Factors

To investigate the spatial and temporal heterogeneity of the factors influencing the rural habitat in Qilian Mountains Nature Reserve and to clarify the spatial distribution pattern of the degree of action of each factor, the results of the regression parameters for each year were imported into the GIS and visualized for analysis. The regression coefficients of each influencing factor were then graded using the natural breakpoint method.
(1)
Average temperature: The average temperature was positively correlated with the condition rural habitat (Figure 9). The higher the average temperature of the area, the better the condition of the rural habitat. This is consistent with studies concluding that habitat and temperature are positively correlated [58]. The regression coefficients of each year fluctuated with significant spatial and temporal heterogeneity, indicating that the average temperature is a more important influencing factor on the condition of the rural habitat.
Spatially, the regression coefficient shows a high trend in the south and a low trend in the north, with larger values in the low-level counties. This is because the low-level counties are in the hilly and mountainous areas with complex topography, variable weather and cold climate, all of which have a great degree of influence on the living and production environment. The natural environment is an important prerequisite for human development, and climatic conditions have an important impact on the rural habitat.
(2)
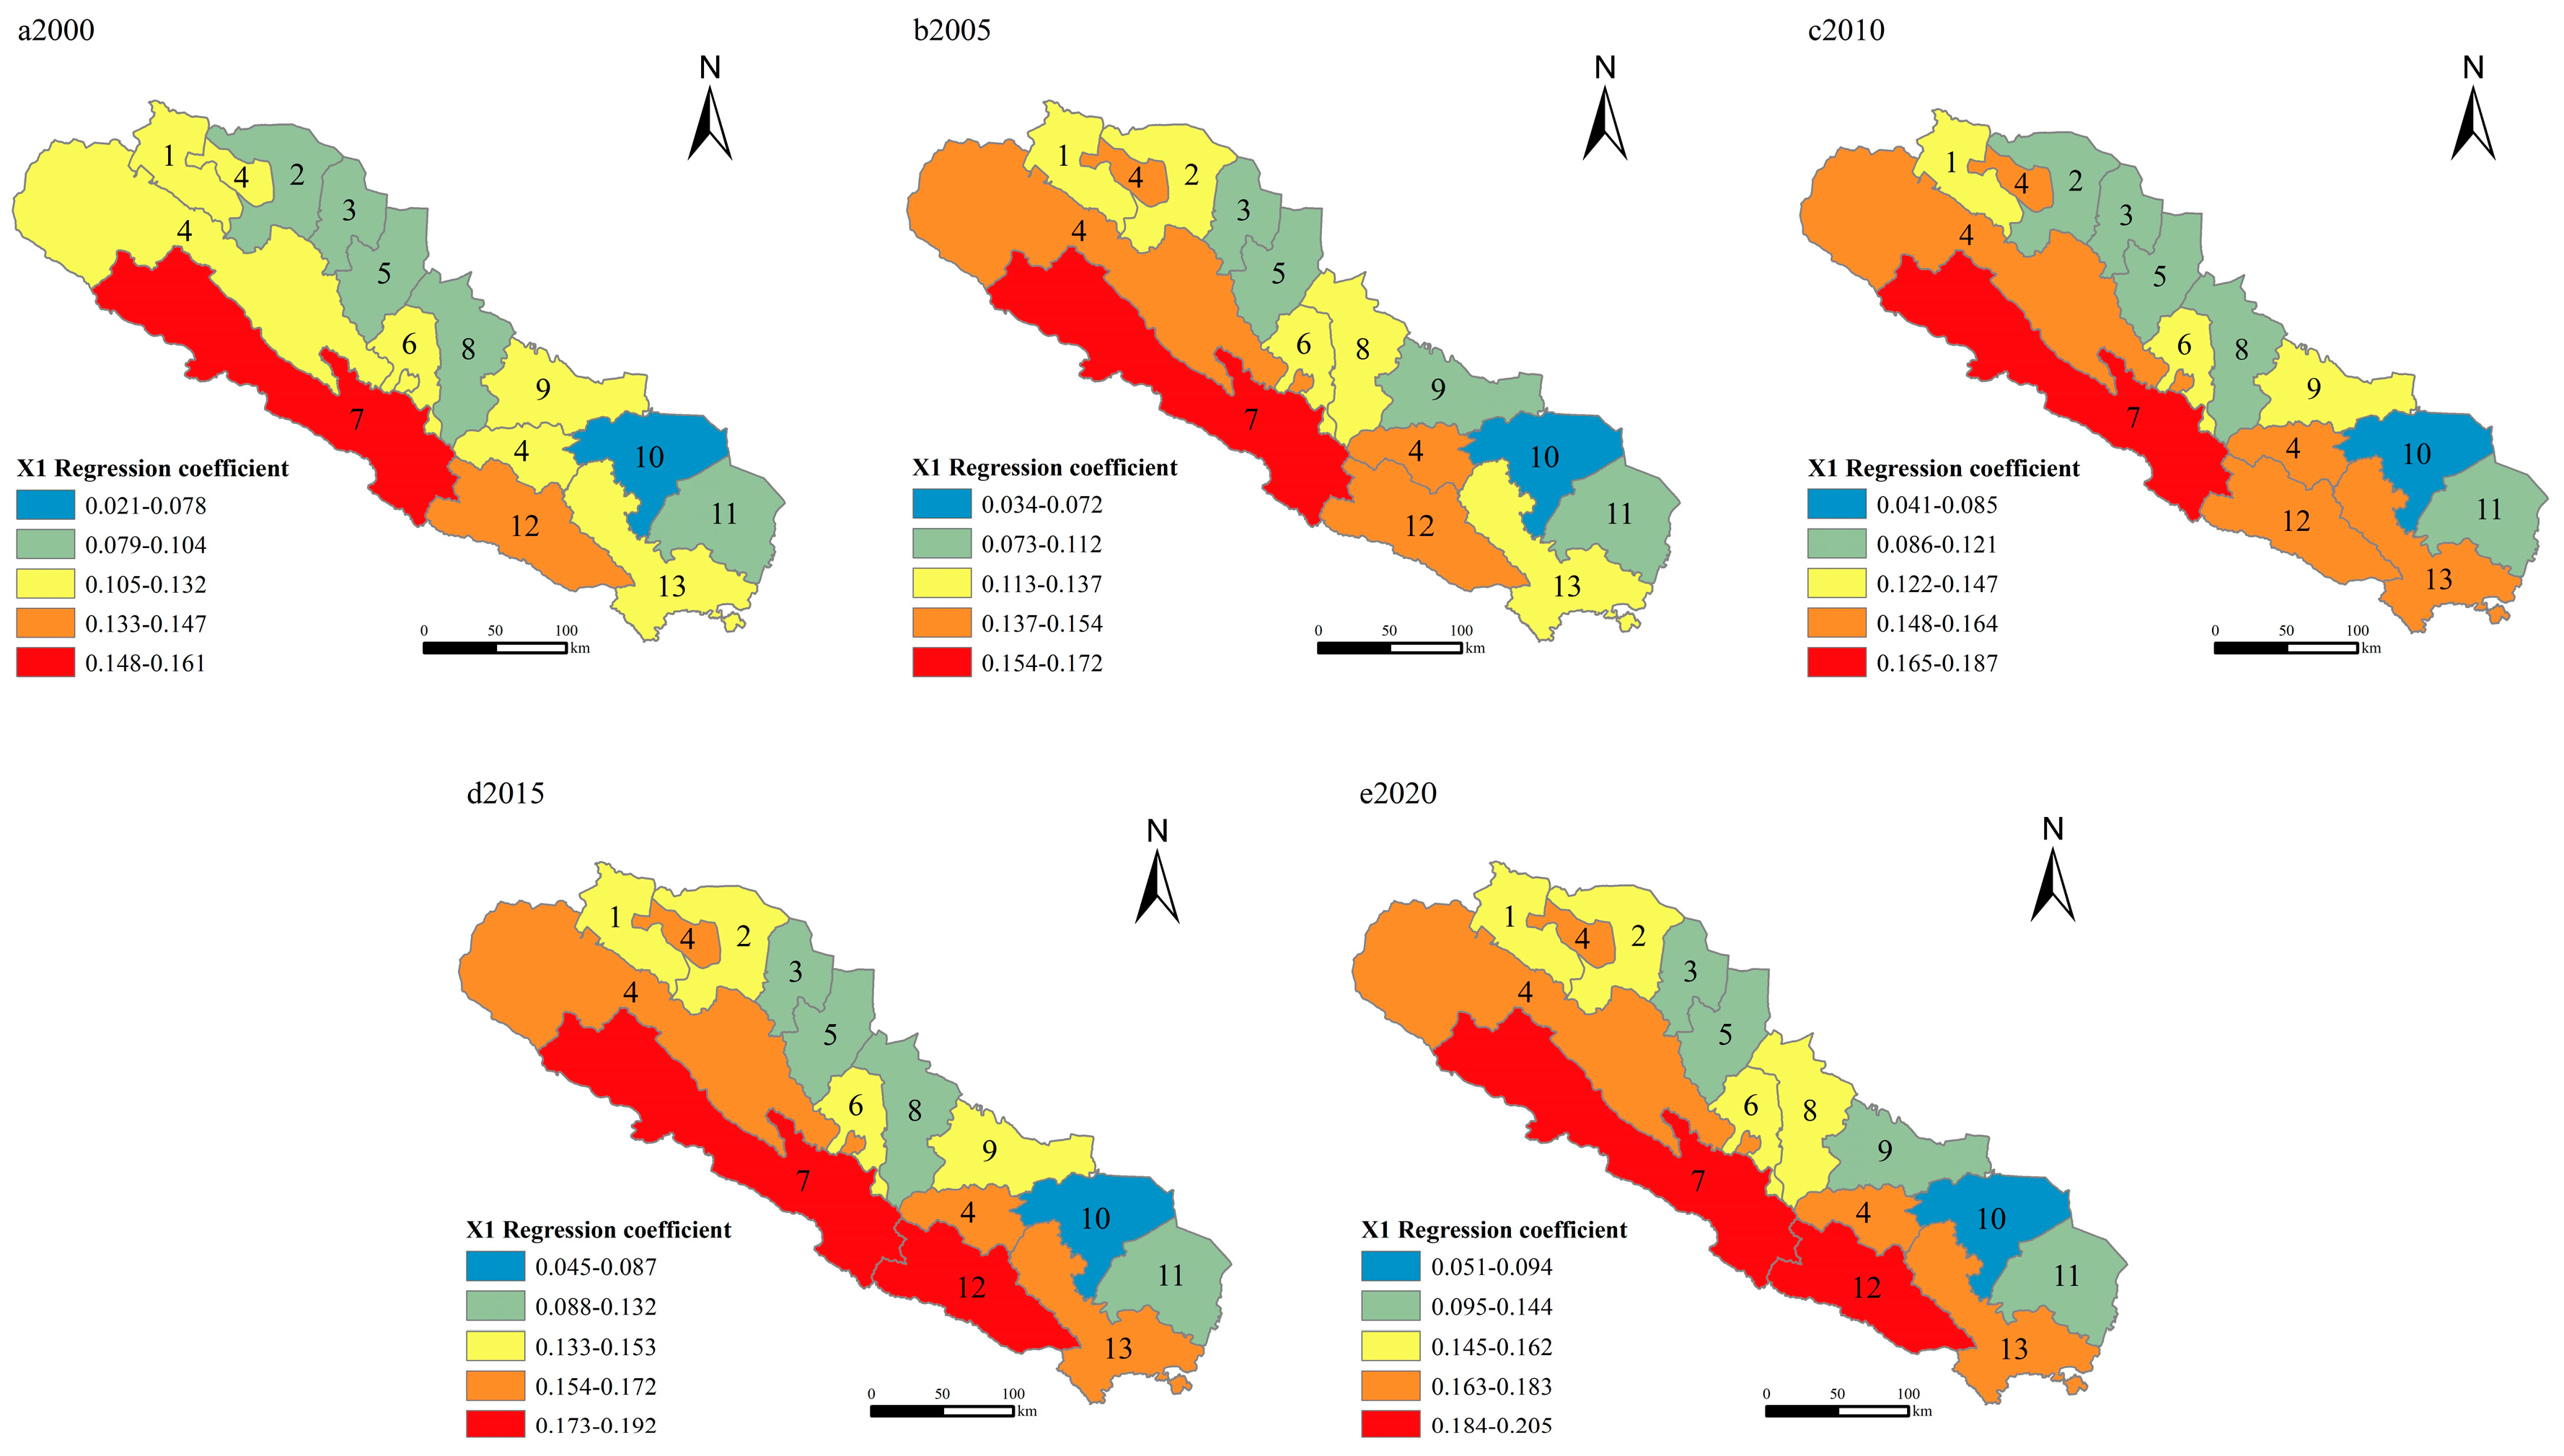
Fixed asset investment amount: The regression coefficient of fixed asset investment amount from 2000 to 2020 decreases from north to south, and the high-value area is distributed in Liangzhou and Shandan in the north (Figure 10). The regression coefficient of the fixed asset investment amount fluctuates significantly, indicating that the fixed asset investment amount has a strong spatial and temporal heterogeneity on the rural habitat of the Qilian Mountains Nature Reserve, which is the main factor in improving the habitat.
Its regression distribution resembles the distribution of economic production, which verifies the correctness of the research cited above. Fixed asset investment will affect the total supply and demand, create more employment opportunities, indirectly increase residents’ income, drive economic development and promote the improvement of the rural habitat. The increase in the amount of fixed asset investment has a positive impact on creating a beautiful and livable countryside and increasing the income of the regional population.
(3)
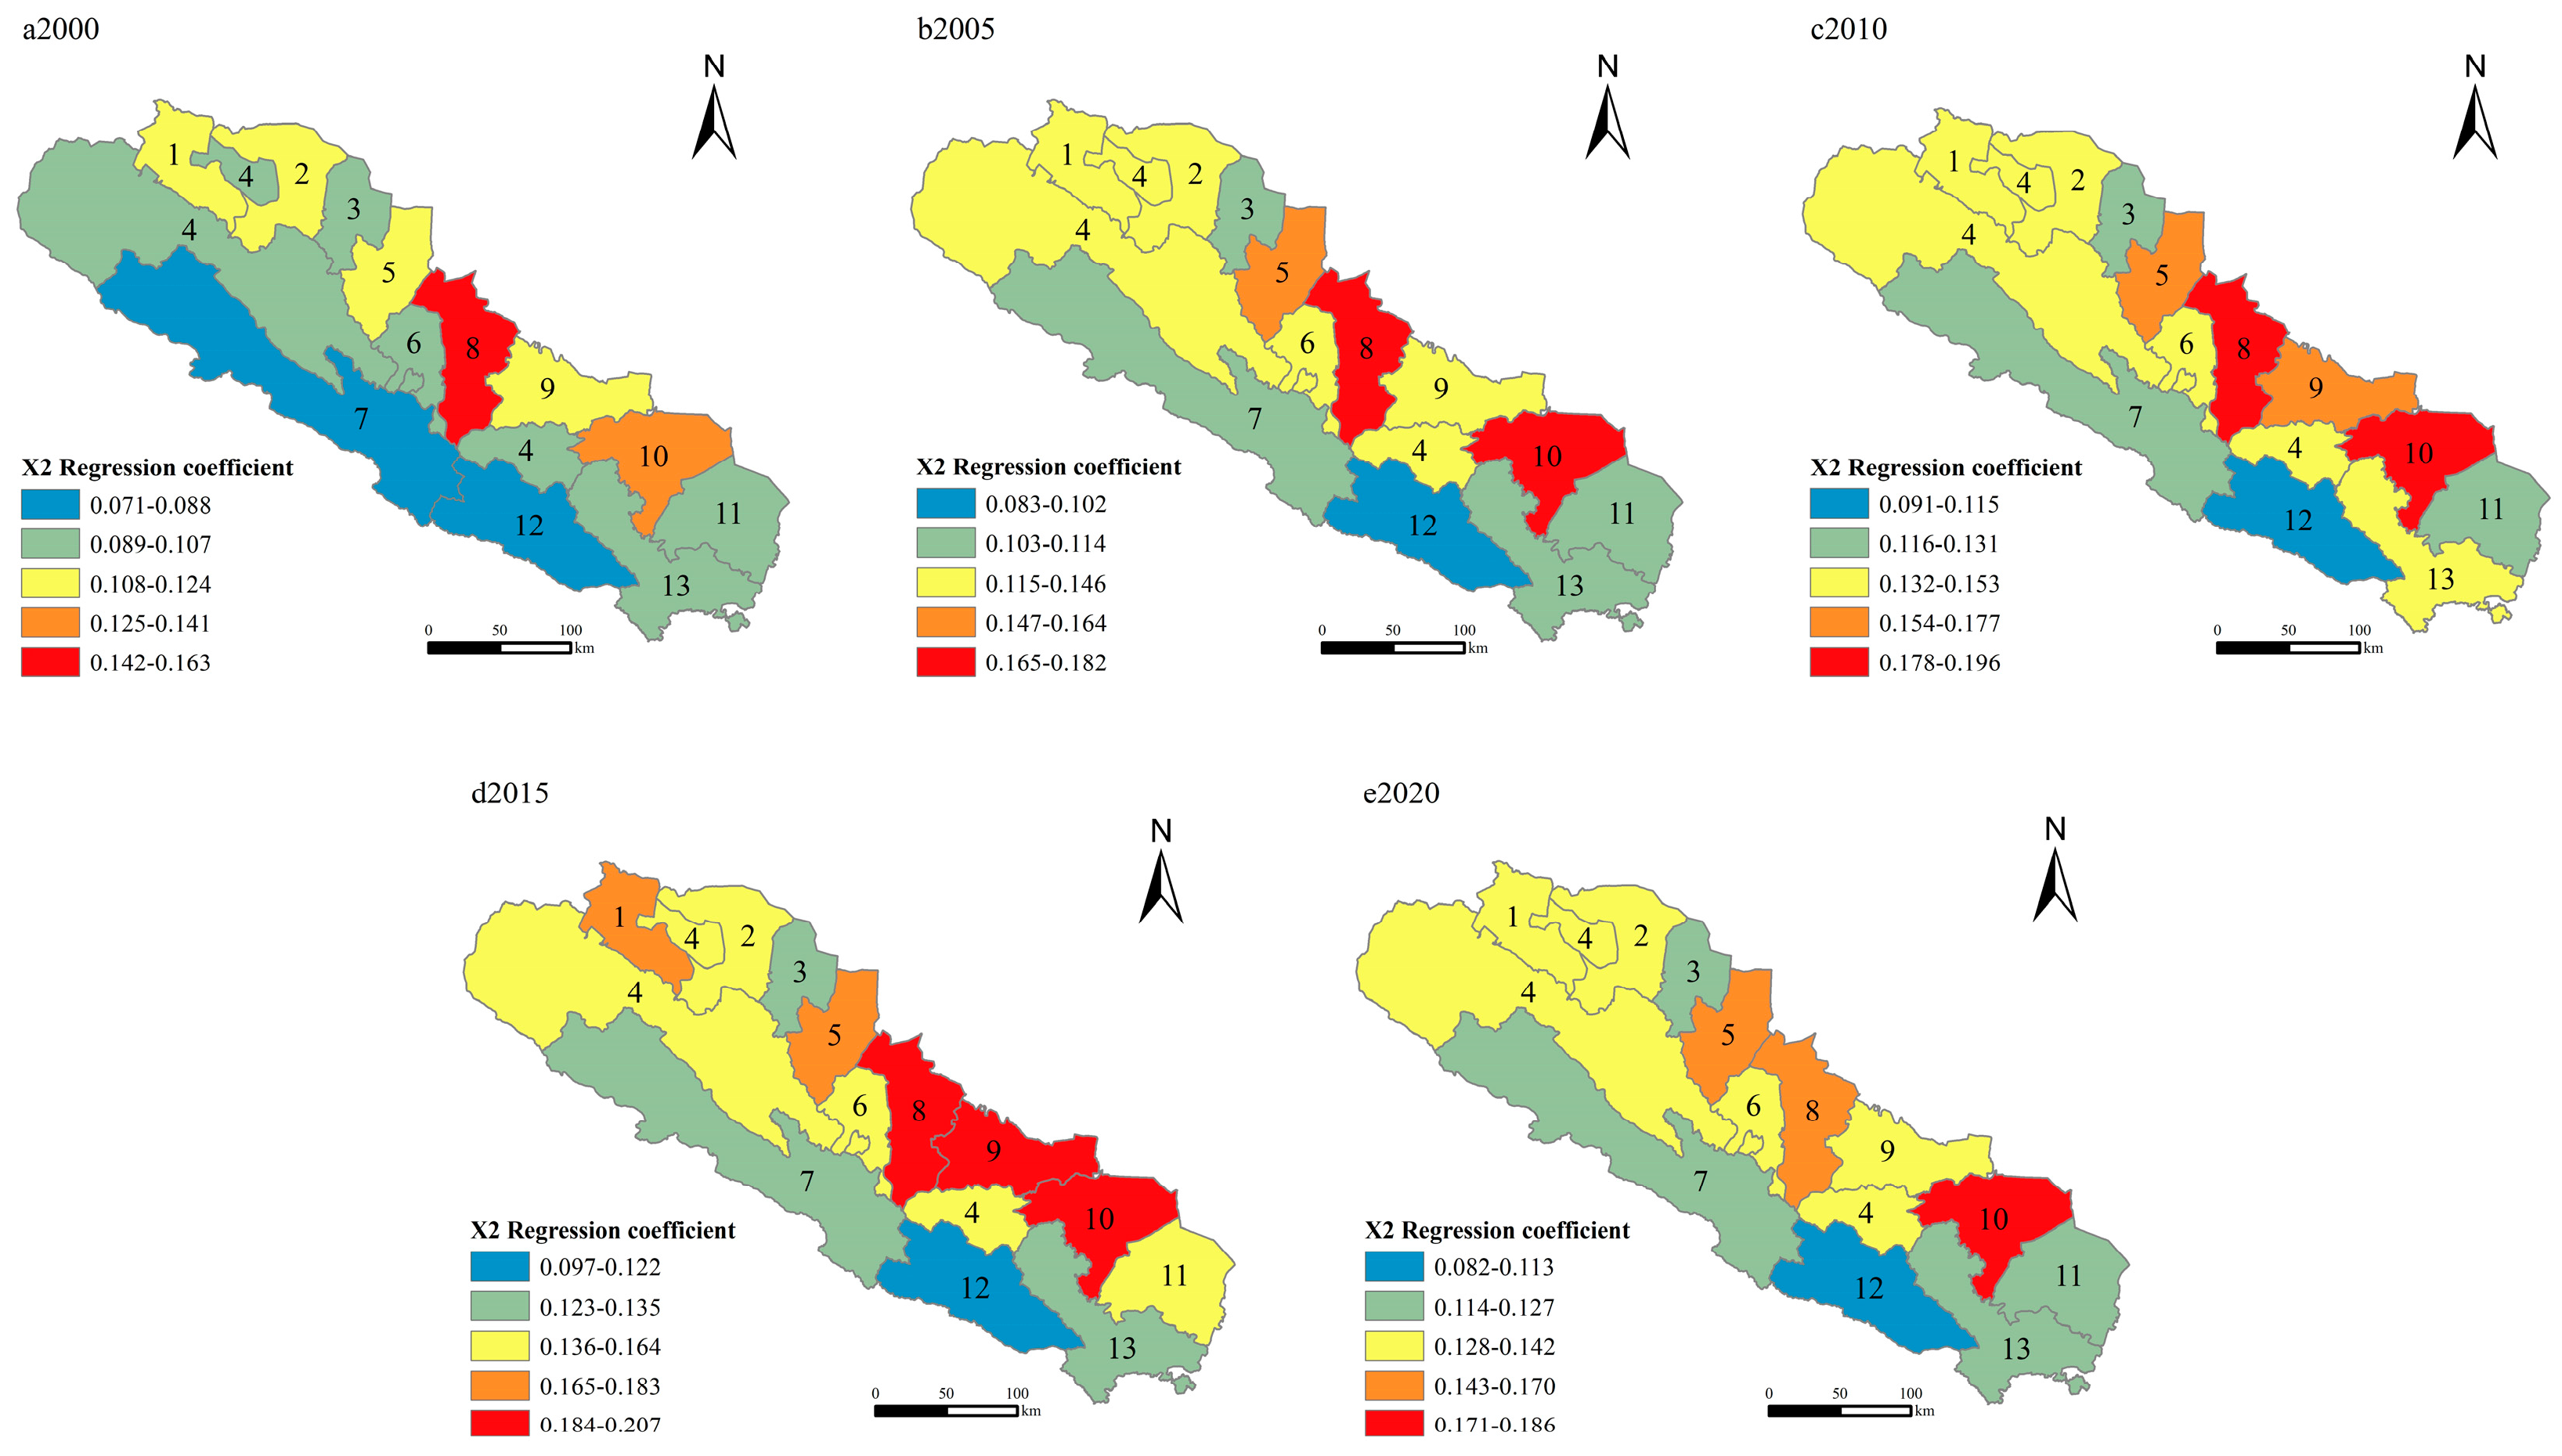
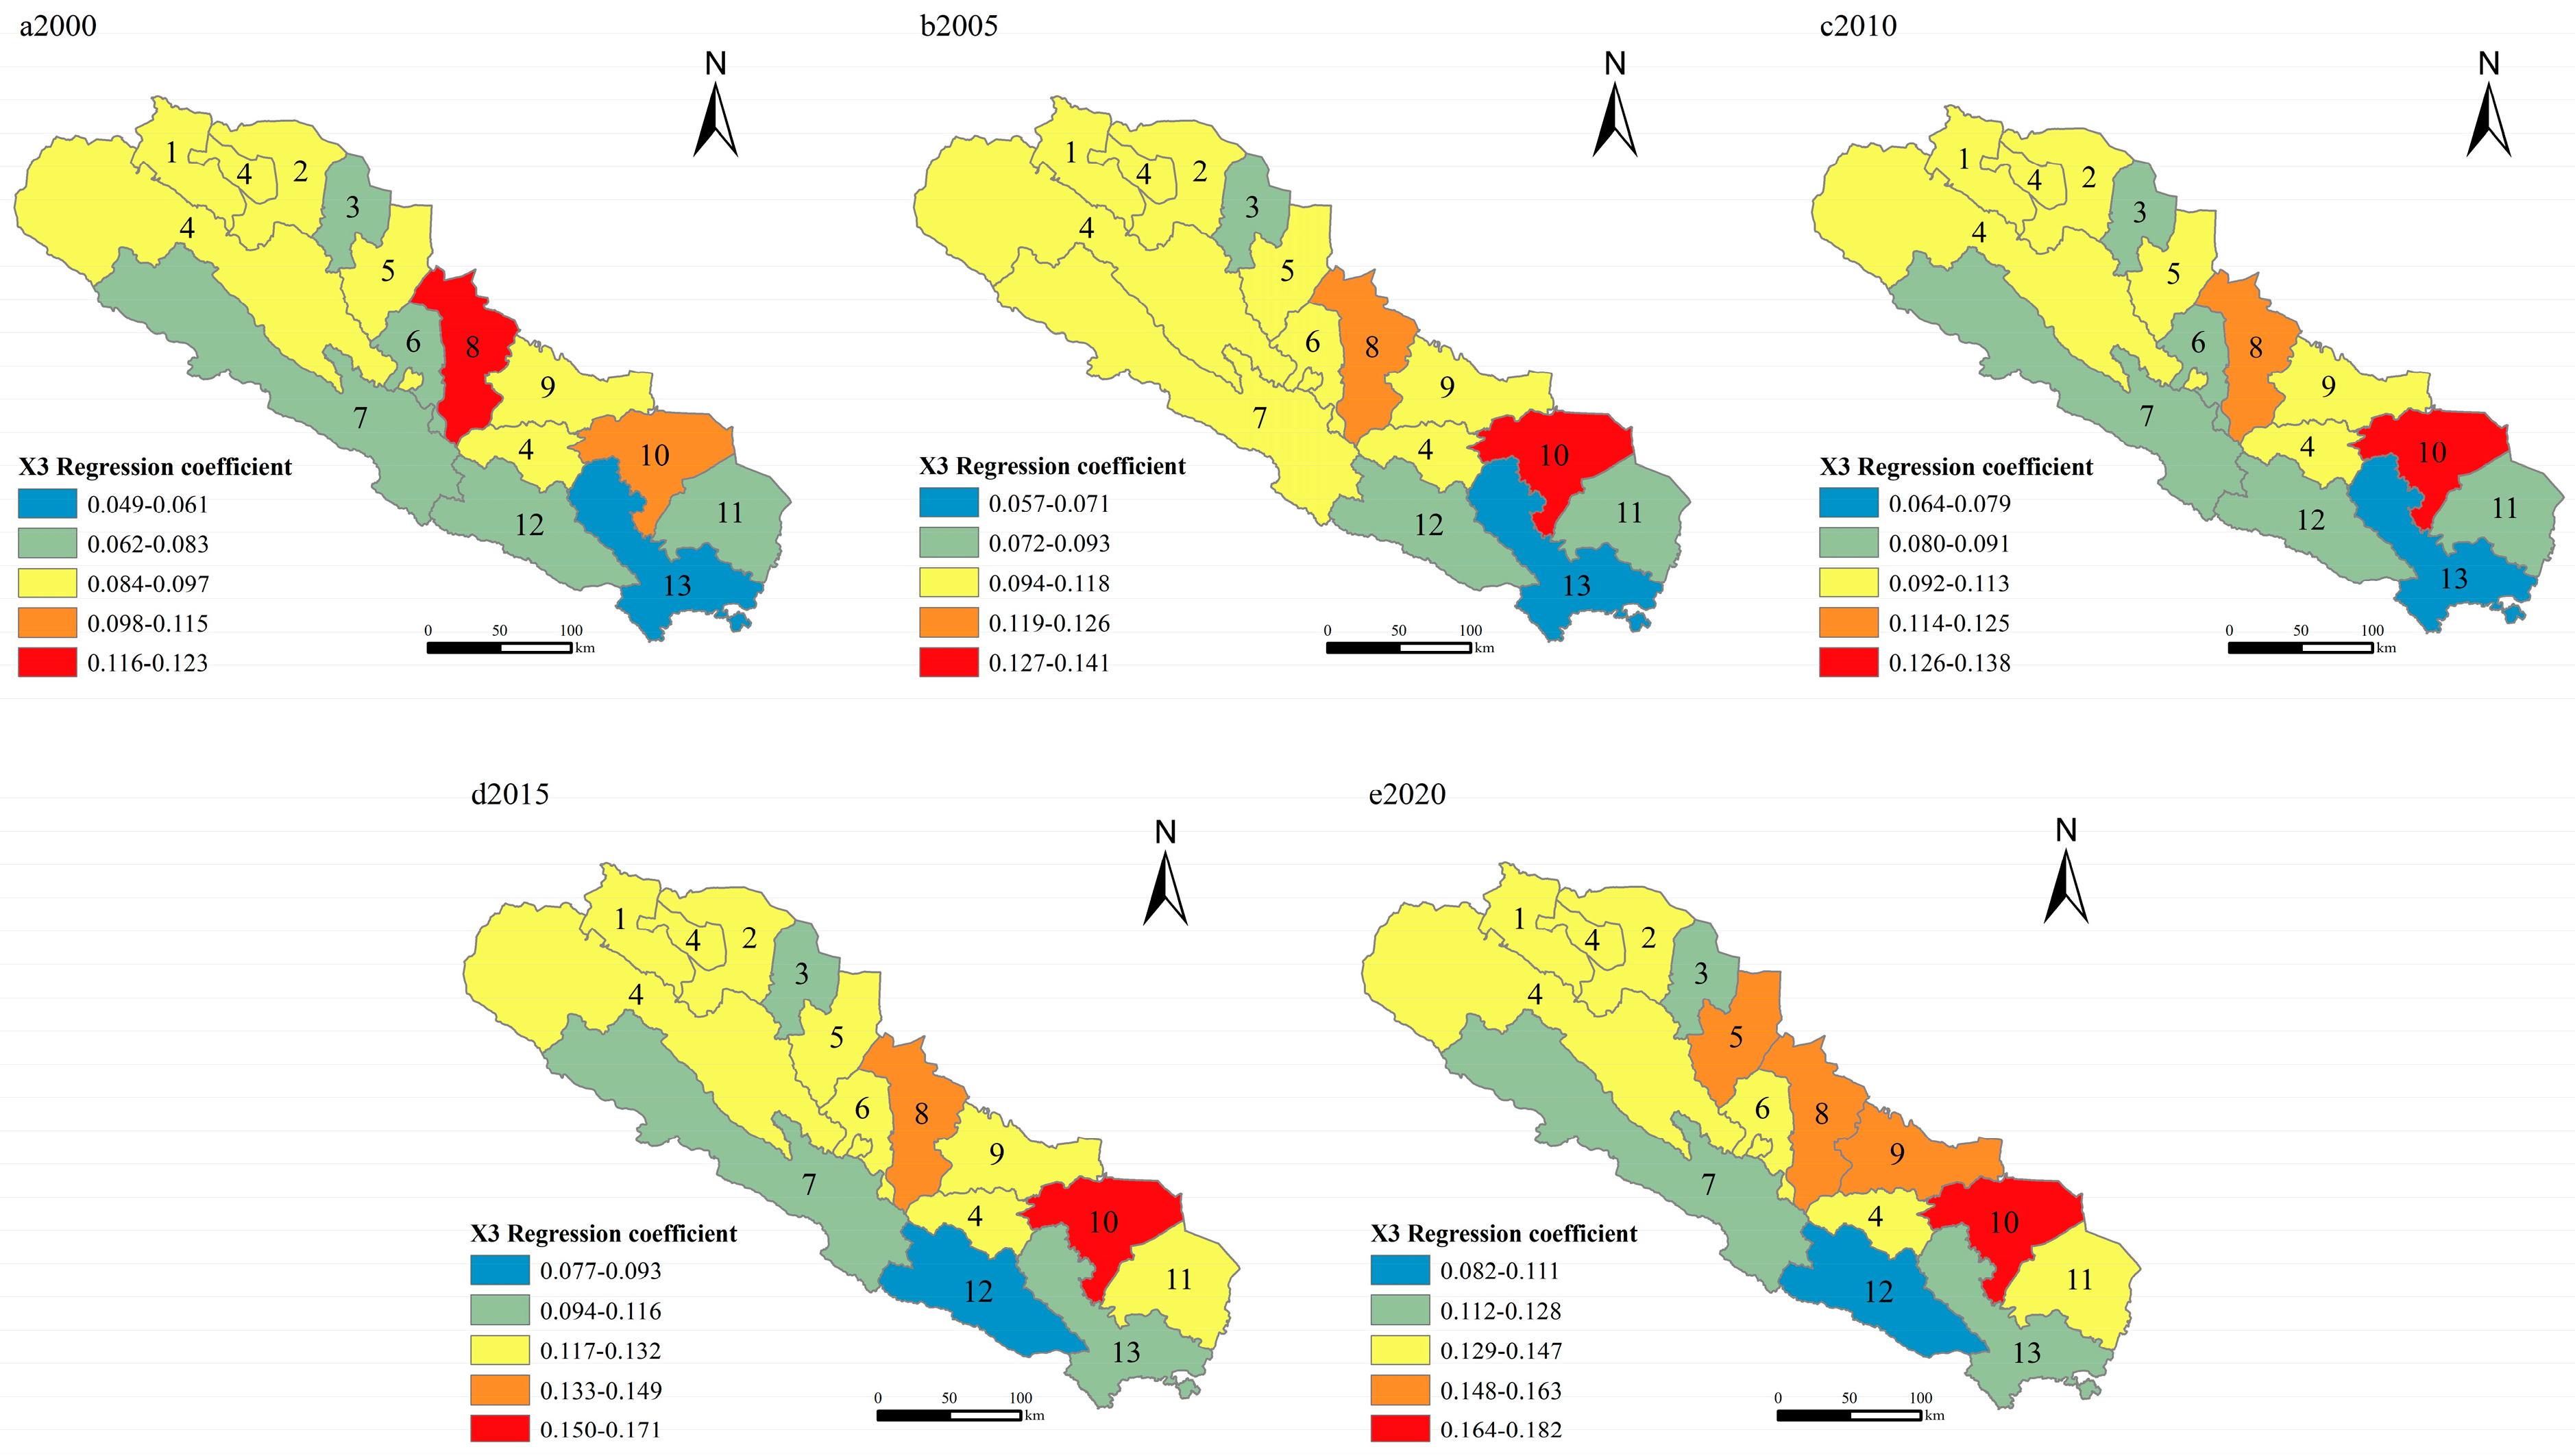
The ratio of secondary and tertiary industries: The ratio of secondary and tertiary industries is positively correlated with the condition of the rural habitat environment (Figure 11). Most of the high-value areas are distributed in central and northern Liangzhou and Shandan, indicating that the improvement of the ratio of secondary and tertiary industries promotes the rural habitat environment in the central and northern regions significantly more than others. The value of the regression coefficient increases year by year, and the distribution trend is stable, with no significant changes except for a few areas where the grade has slightly increased, indicating that the proportion of secondary and tertiary industries is a more important influencing factor on the rural habitat.
The central and northern regions such as Liangzhou and Shandan are more economically developed, and the transportation infrastructure between urban and rural areas is rather advanced. Therefore, rural labor can flow to nearby urban areas, and the non-agricultural part-time industry shows cyclical characteristics. Improving the proportion of secondary and tertiary industries can significantly improve the rural economic production environment and rural habitats. In the south and southeast of the country, the production structure of less economically developed areas has a high proportion of agricultural production and is based on monoculture.
The transportation infrastructure between urban and rural areas is somewhat backward, which makes it difficult to realize the rapid flow of labor factors to cities and towns. There is a more serious problem with brain drain and hollowing out of the countryside, limiting the accumulation of human capital. Instead of improving the economic development of the region, increasing its proportion of secondary and tertiary industries pollutes the local ecological environment and intensifies the pressure on it.
(4)
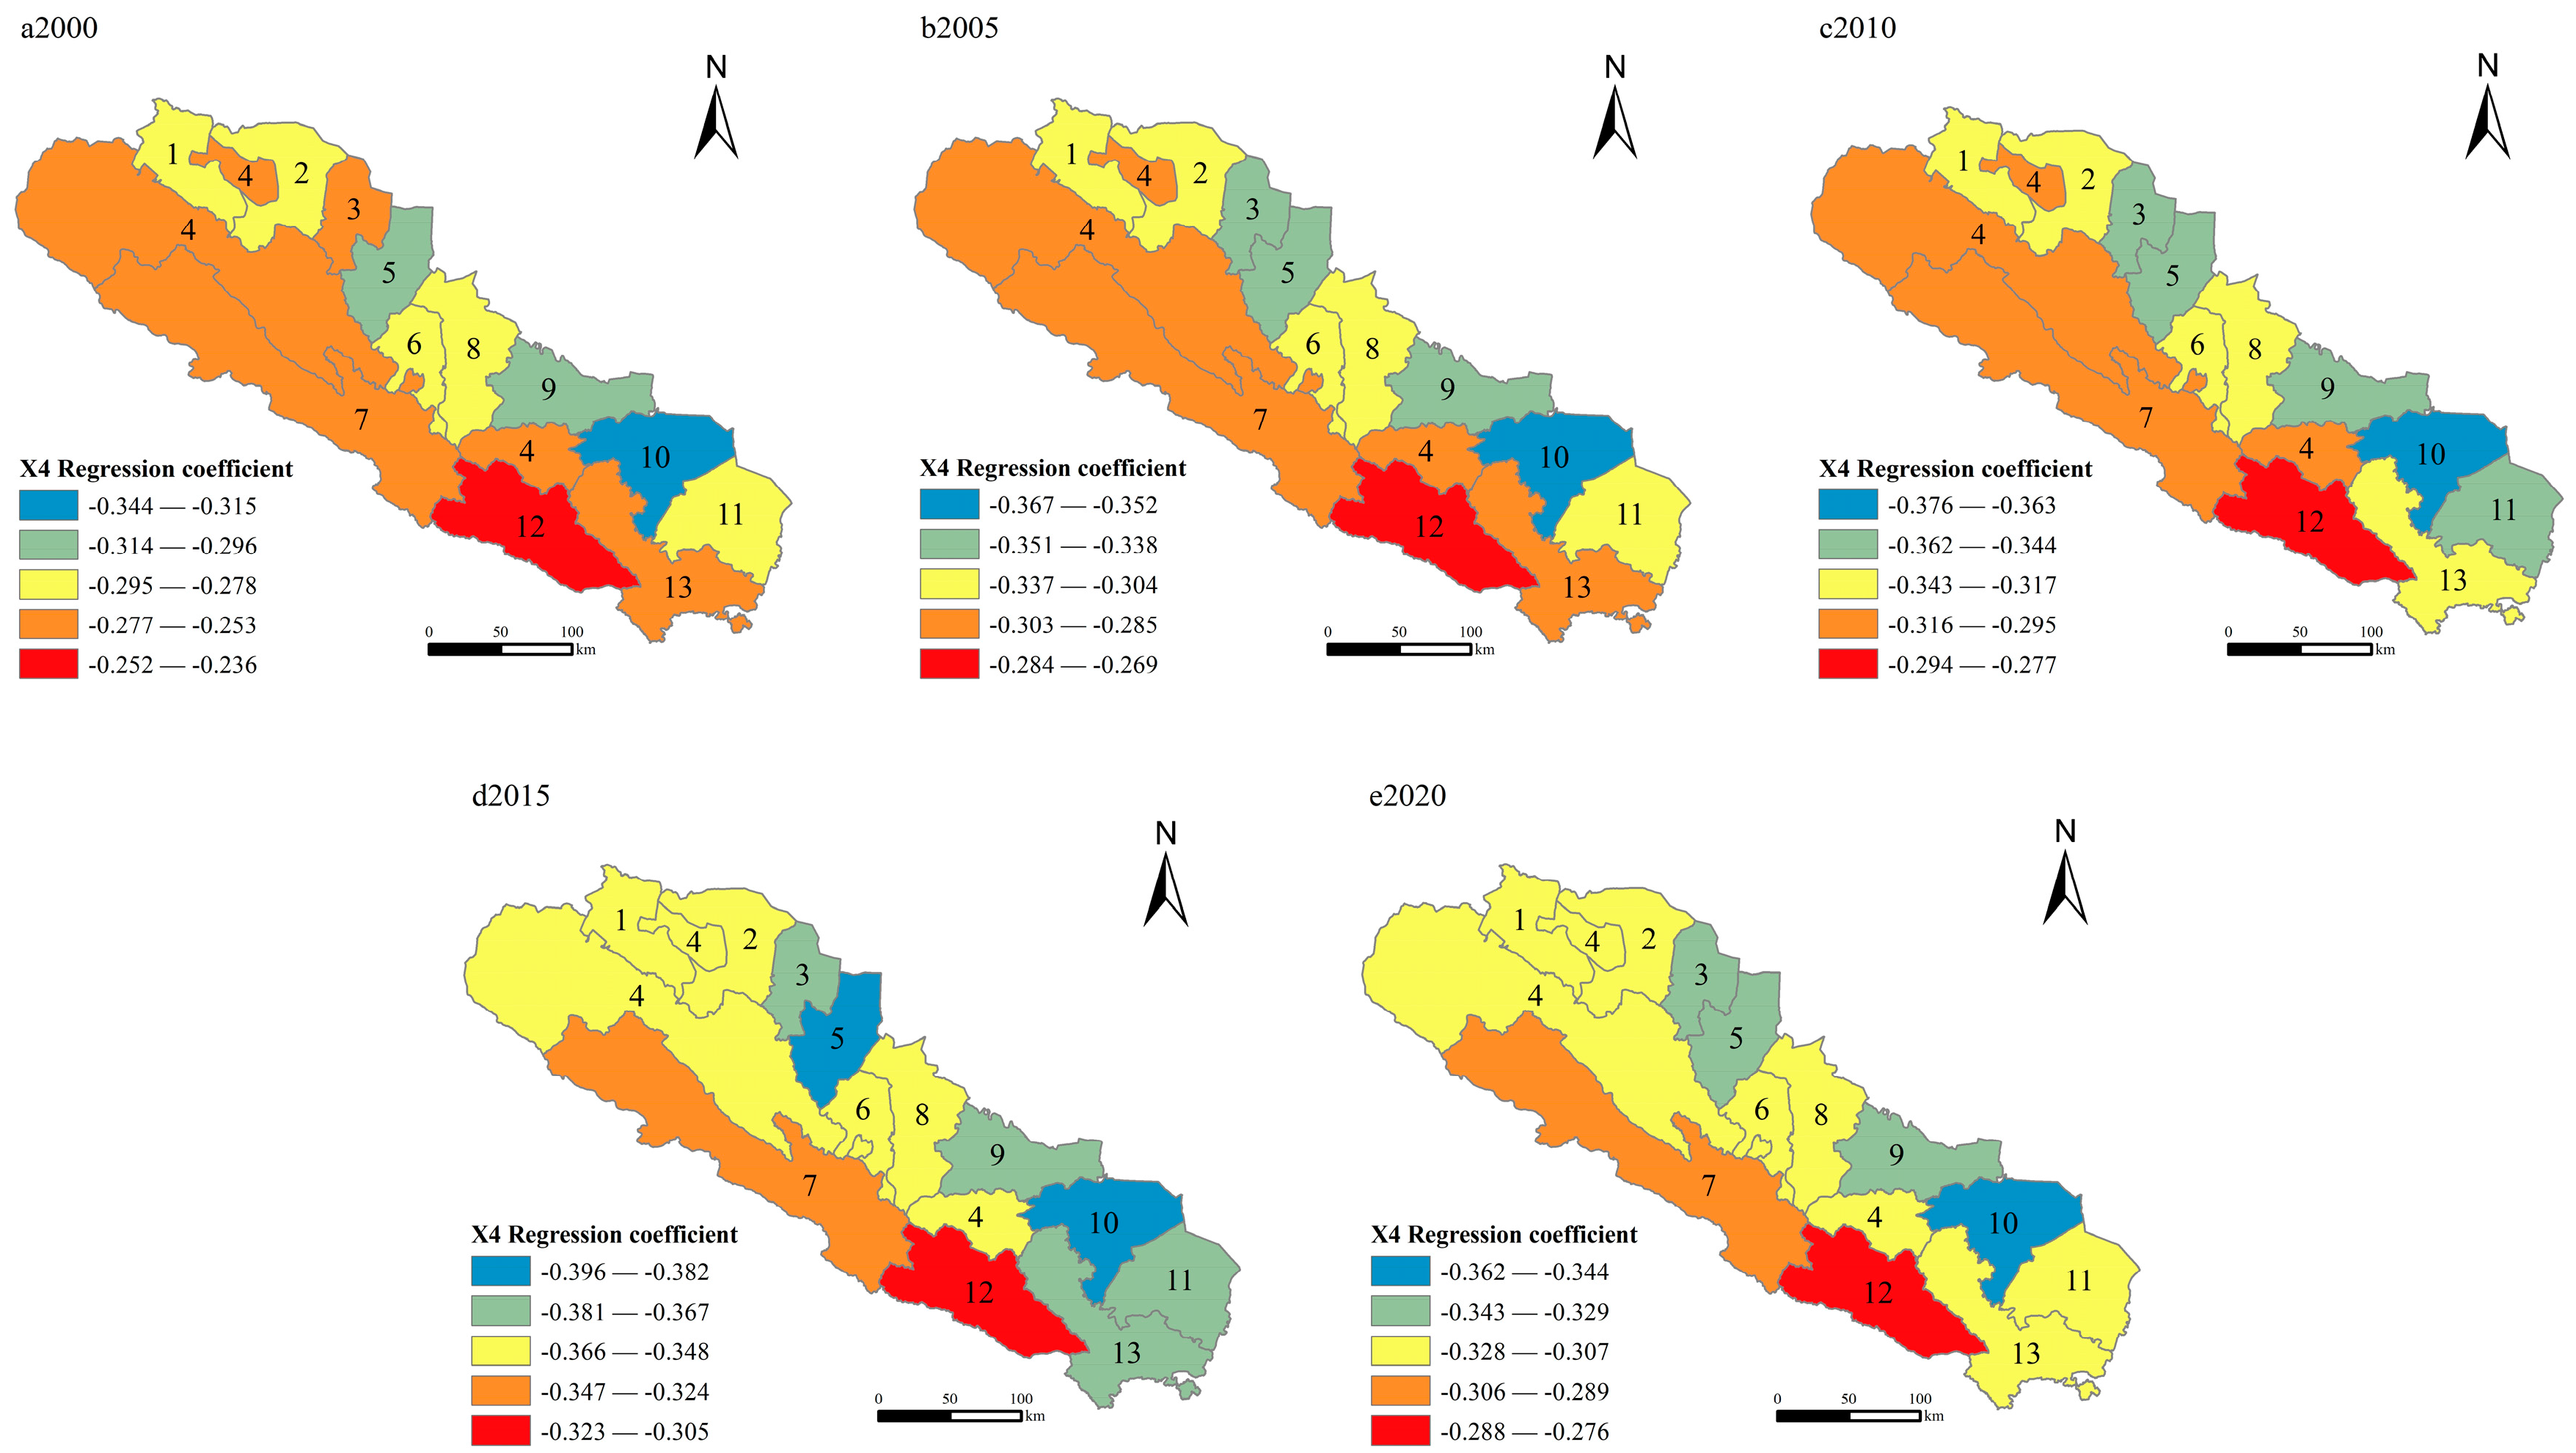
PM2.5 concentration: PM2.5 concentration has a negative effect on the rural habitat (Figure 12). The lower the regression coefficient of PM2.5, the worse the condition of the rural habitat. From 2000–2015, the regression coefficient decreased year by year, indicating that the increase in PM2.5 concentration is detrimental to the rural habitat. There is a significant upward trend in its regression coefficient from 2015 to 2020, indicating that the special treatment work carried out by the government has improved the ecological and environmental problems in Qilian Mountains Nature Reserve.
The PM2.5 concentration values have decreased, and the local rural habitat has improved markedly. High-value areas are located in the high mountainous areas of Qilian and Menyuan, which have low population density and a better natural environment. The regression coefficients fluctuated greatly over 20 years, which shows that PM2.5 has a strong spatial and temporal heterogeneity to the quality of the rural habitat in Qilian Mountains Nature Reserve and is the main factor affecting it. PM2.5 is a toxic substance. Small particles linger in the atmosphere for a long time, harming human health, degrading the quality of the ecological environment and restricting the improvement of the rural habitat.
(5)
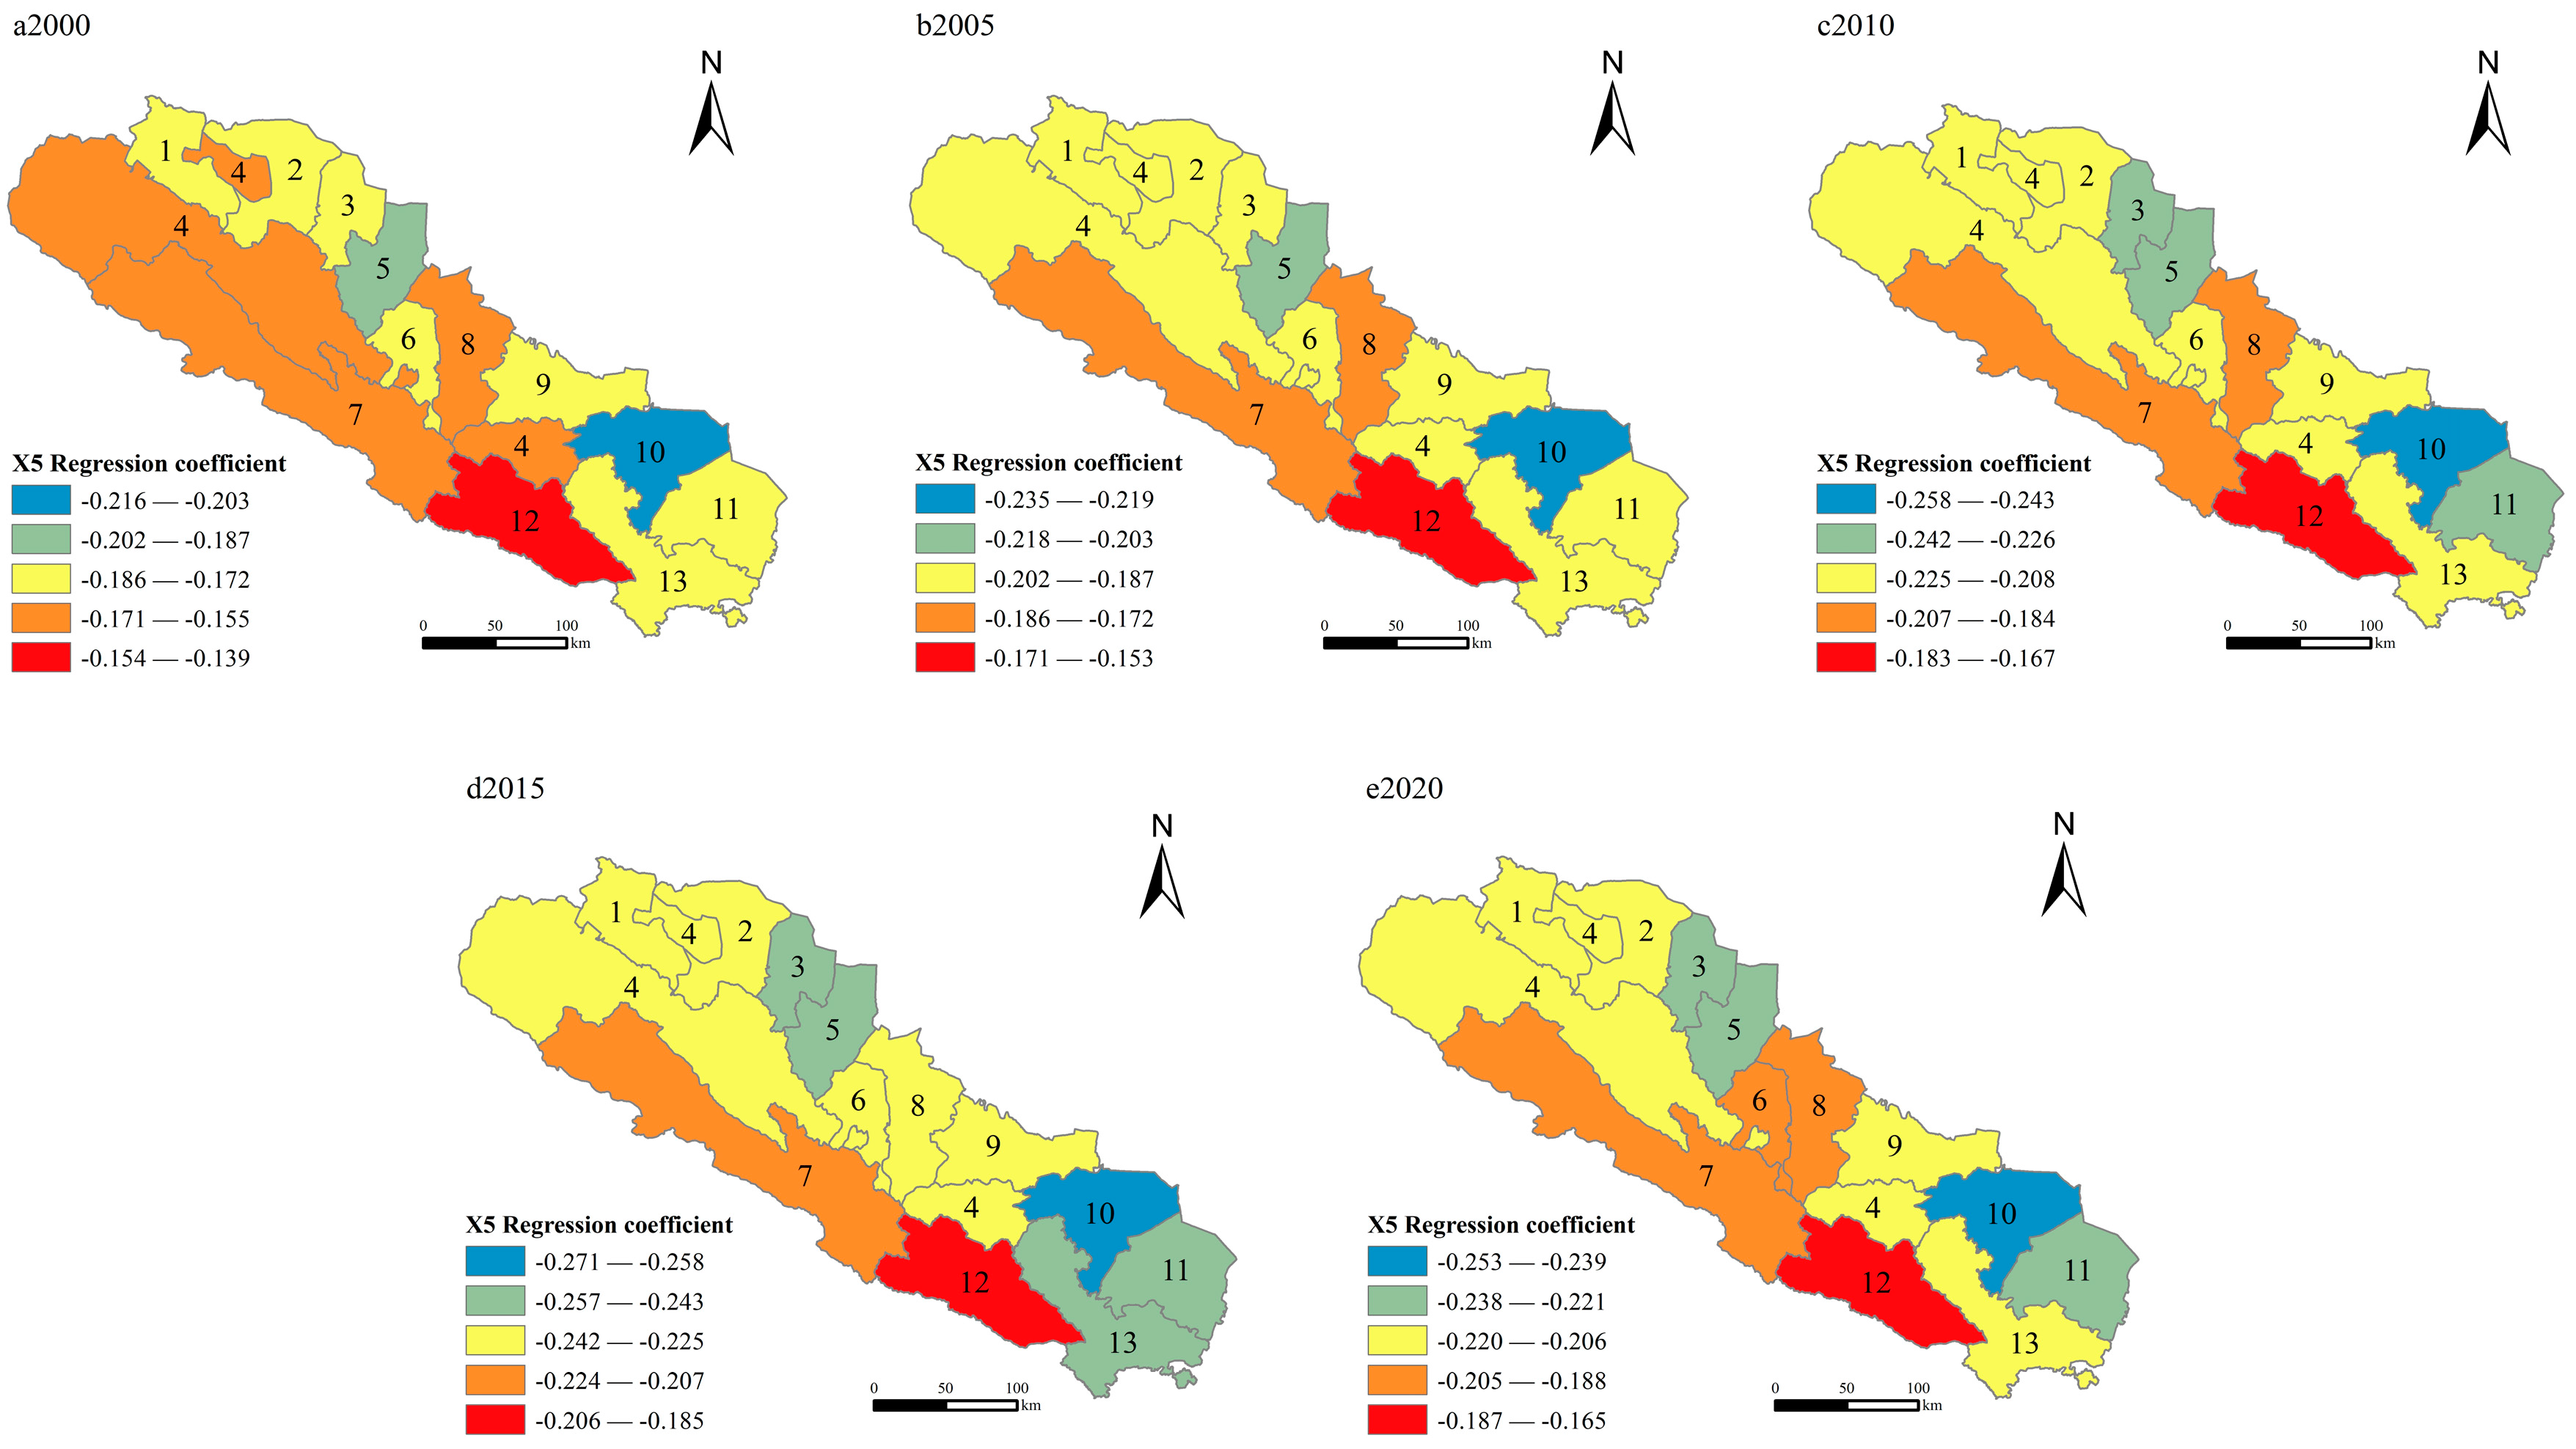
CO2 emissions: CO2 emissions harm the rural habitat. There was a decrease in regression coefficients from 2000 to 2015 and a slight increase from 2015 to 2020, with a slight improvement in the rural habitat (Figure 13). The regression coefficients of each year fluctuate significantly and have strong spatial and temporal heterogeneity characteristics, indicating that CO2 emissions are the main influencing factor in the rural habitat.
High emissions of carbon dioxide, a greenhouse gas, can lead to an increase in regional temperatures. The total area of glaciers in the Qilian Mountains Nature Reserve is 1300 km2, with a storage capacity of 40 km3. This makes the reserve a “solid reservoir” and a “natural water tower.” The increase in carbon dioxide emissions and temperature in protected areas has led to the melting of glaciers, degradation of permafrost and the rise of the snow line in the Qilian Mountains Nature Reserve. The results show a decline in water containment functions and damage to the rural habitat.

4. Discussion and Conclusion

4.1. Discussion

The ecological and environmental quality levels showed a decreasing trend during the study period, indicating that the Qilian Mountains Nature Reserve has not coordinated its relationship with the ecological environment while rapidly developing the economy and improving the level of human habitat. Previous studies [59,60] have shown that improving the quality of human habitat at the expense of resources and environment is not the best development path. It is suggested that the local government should promptly adjust its development strategy, establish an ecological barrier and promote the harmonious development of humans and nature. During the study period, it was found that the disadvantaged areas in terms of rural habitat were mainly located in areas with a poor infrastructure level and rural social services. This result is consistent with Geldmann [61] and Lim [62], who studied the habitat quality of nature reserves, which fully indicates that the index system established in this study reflects the real situation of the rural habitat level more comprehensively and can be universally suitable for the evaluation of rural habitat in nature reserves.
During the study period, it was found that the rural habitat in Qilian Mountains Nature Reserve showed a significant positive spatial correlation, and the cities with close rural habitats were spatially adjacent. This is consistent with the findings of Yoshinaga [63] and Květoň [64]. The reason for this may be that the advantageous area has good economic conditions and the local government pays attention to the investment in the construction of rural habitat, which has a radiating effect on the construction of habitat in the surrounding areas.
PM2.5 concentration and CO2 emissions were found to be the main influencing factors on the level of rural habitat in the Qilian Mountains Nature Reserve during the study. This is inconsistent with the findings of KEMPERMAN [65]. This may be because the government departments in the Qilian Mountains region have not coordinated the relationship between environmental protection and habitat development, making ecological and environmental factors the main factors influencing the level of habitat.

4.2. Conclusions

(1)
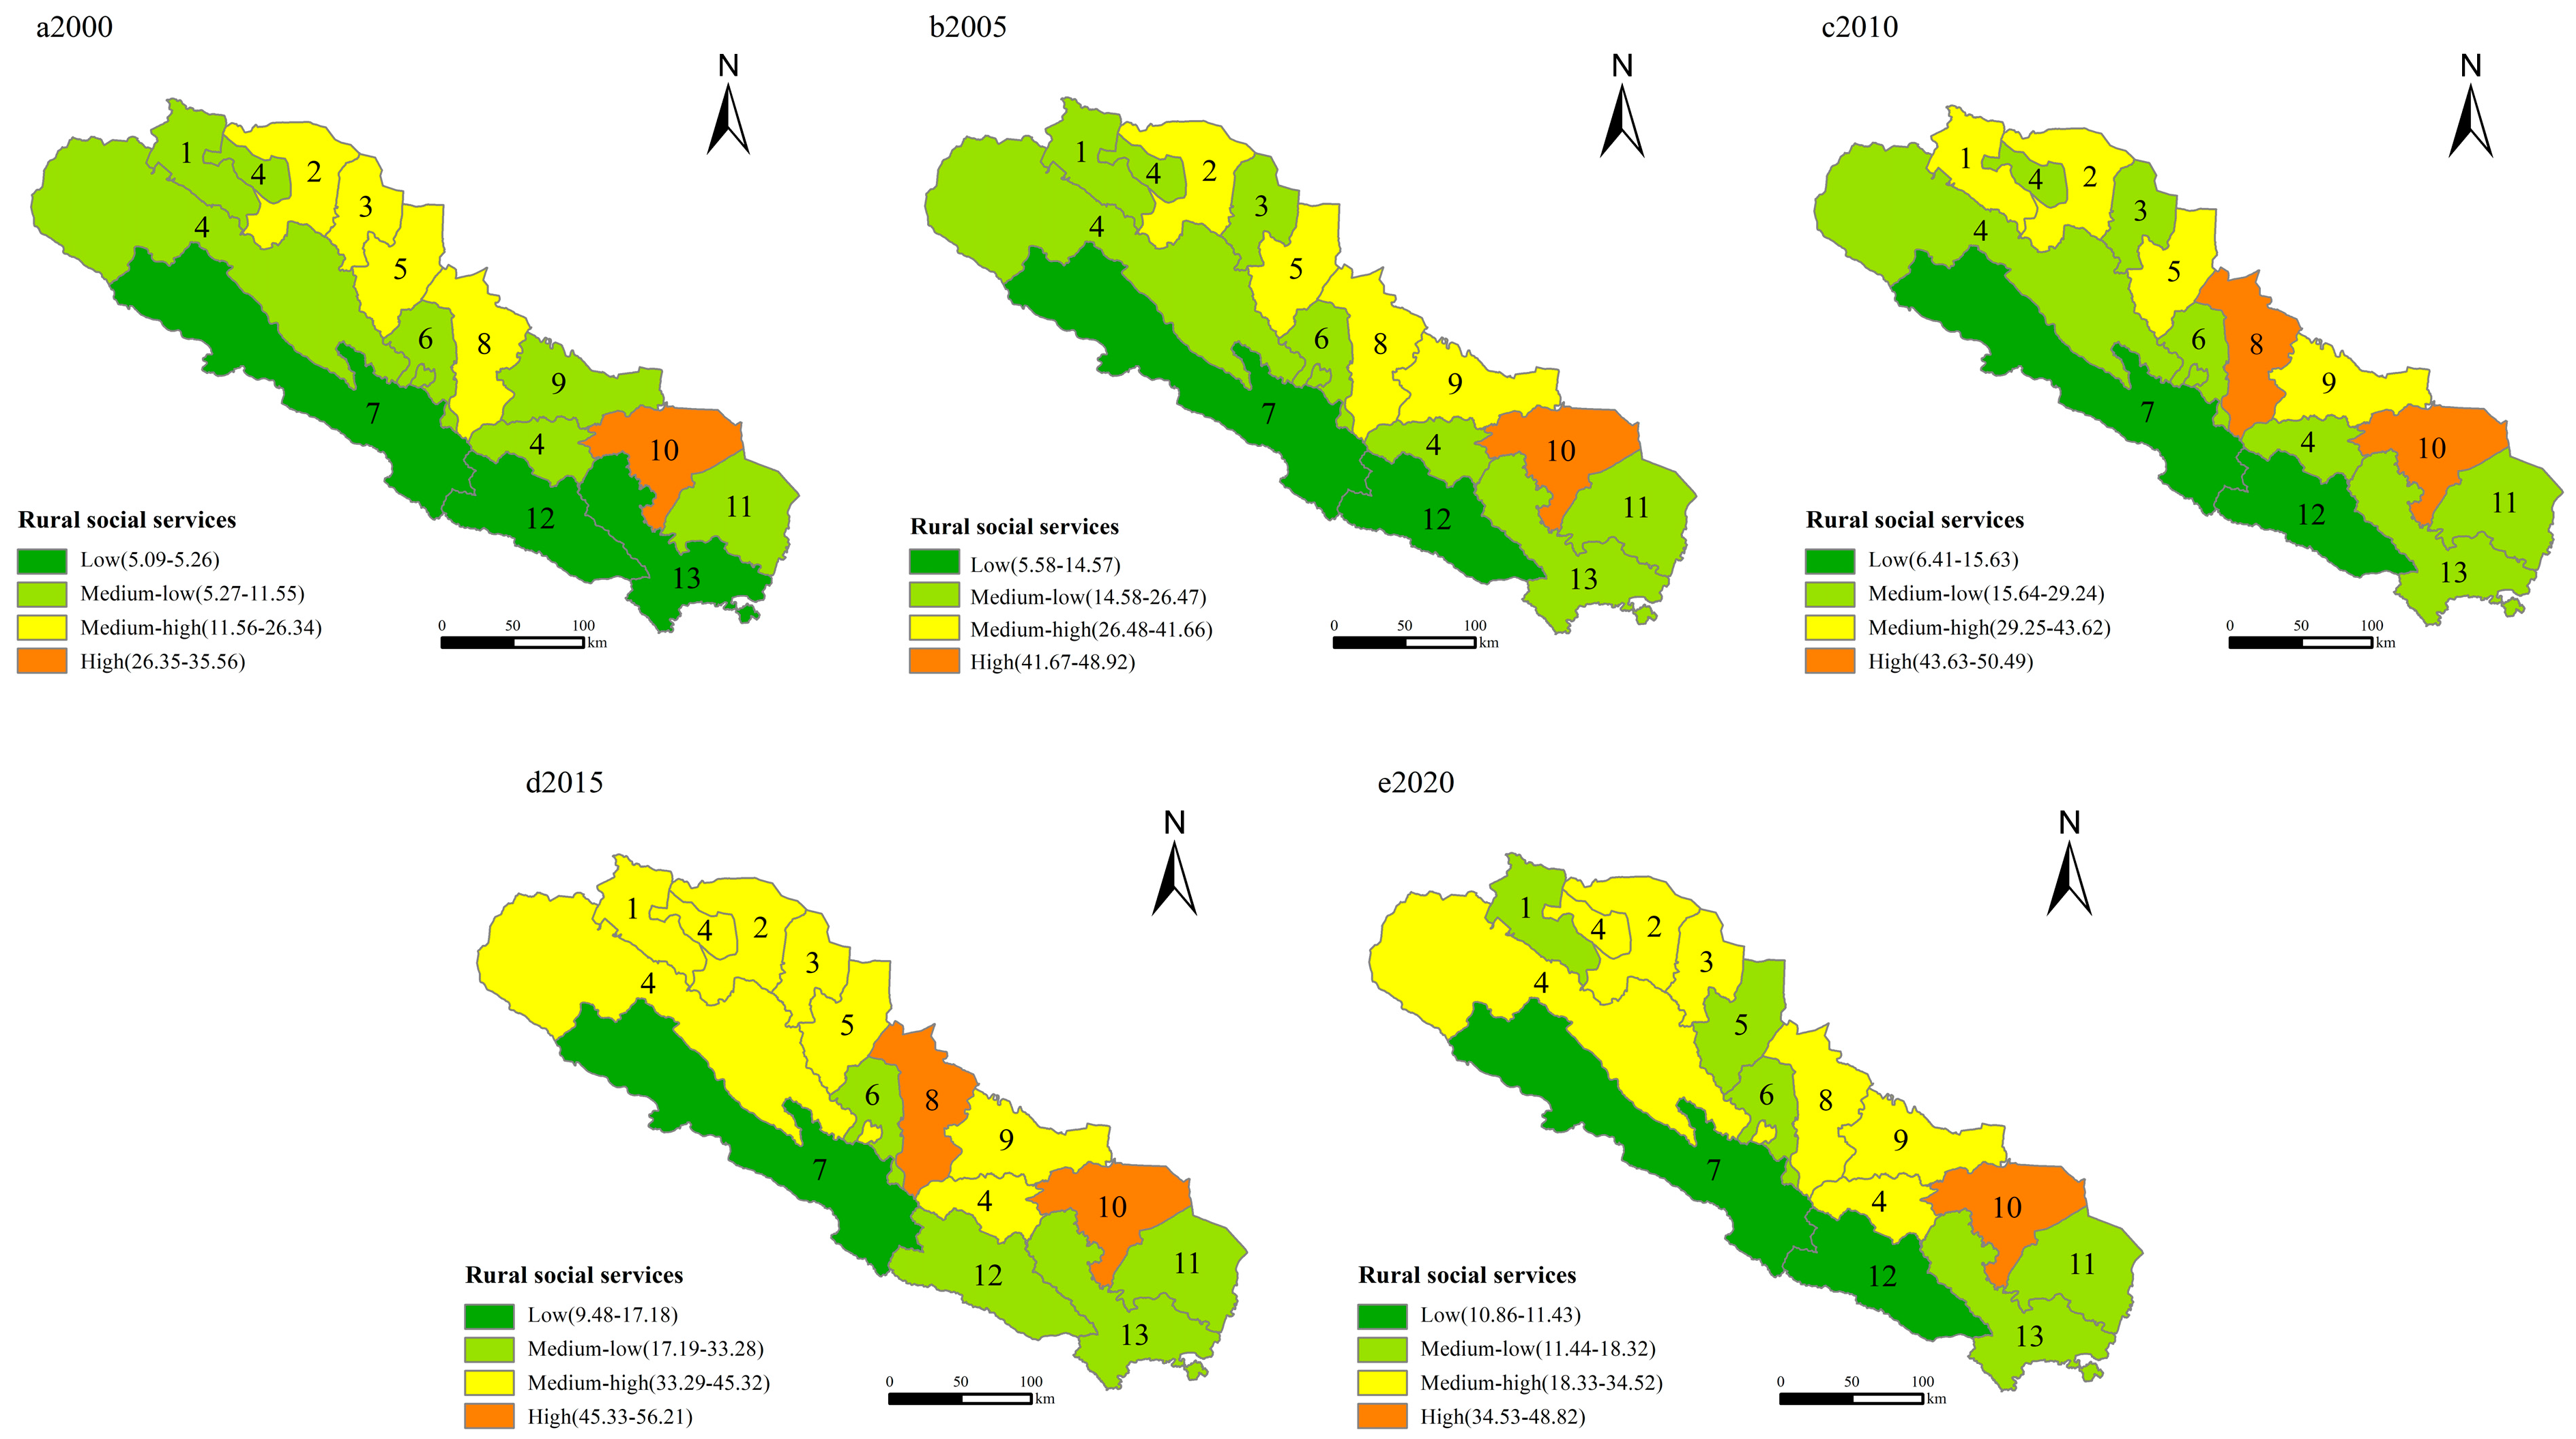
The levels of infrastructure, economic production and rural social services in the Qilian Mountains Nature Reserve from 2000 to 2020 showed an overall upward trend, and all of them decreased in some areas in 2020 due to the impact of COVID-19. Ecological and environmental quality showed a downward trend, and from 2015–2020, the state introduced protection policies to resolve the ecological and environmental problems in Qilian Mountains and slightly improve their ecological and environmental quality. The task of environmental protection in the region is still difficult.
The advantaged areas of rural habitat level are located in Liangzhou and Shandan, which are flat, complete with supporting resources and convenient transportation. The disadvantaged areas of rural habitat are distributed mostly in Qilian, Menyuan and other mountainous and hilly areas with poor natural conditions and blocked roads. Restricted by the development of protected area resources, there are imperfections in the supporting systems in disadvantaged areas, inconvenient transportation, and a single source of livelihood for residents, which collectively lead to a poorer quality of rural habitat.
(2)
The 2000–2020 Qilian Mountains Nature Reserve rural habitat shows an obvious positive spatial correlation, and rural habitat is close to the city in spatial proximity. The high–high (H-H) agglomeration is distributed in Liangzhou, the low–low (L-L) agglomeration is distributed in Menyuan from 2000 to 2015, and the low–low area is removed from Menyuan in 2020.
(3)
This paper analyzes five influencing factors selected from three dimensions—geographic environment, economic development and ecological environment—and finds that the influence of each factor on the habitat shows obvious characteristics of spatial and temporal heterogeneity. Among them, the amount of investment in fixed assets, PM2.5 concentration and CO2 emission are the main factors in the quality of the rural habitat in Qilian Mountains Nature Reserve. The average temperature and the proportion of secondary and tertiary industries are more important influencing factors.

5. Suggestion

Combining the basic characteristics of the ecological environment of the nature reserve and the demands of rural habitat construction in the process of new urban–rural integration, this paper presents four suggestions for optimizing rural habitat.
(1)
The first suggestion is that the government should classify and promote the improvement of the rural habitat environment and establish a long-term mechanism to improve it. The development of the rural habitat environment in the Qilian Mountains Nature Reserve varies greatly, and the government should take the basic principle of adapting to local conditions and enact policies to improve the area.
For areas with a high value of rural habitat, management should build a remediation model with the participation of multiple subjects such as villagers, enterprises and the government; establish a long-term working mechanism; and improve the economic income level of residents. For the medium–high-value areas of rural habitat, the government should take planning as the first step, formulate scientific and reasonable rural habitat planning, highlight the characteristics of rural development, and promote the orderly circulation of elements between urban and rural areas. The medium–low-value areas should develop special rural economies according to local conditions and strengthen education and skills training for villagers. They should also villagers to start their own businesses and stimulate the inherent vitality of rural development. For areas with a low value of rural habitat, policies for the benefit of the people should be formulated, and whole village improvement and poverty alleviation development projects should be implemented.
(2)
The second suggestion is that the government accelerate the development of rural specialty industries and help residents transform their livelihood strategies. Industrial prosperity is central to rural revitalization. The residents in the nature reserve are deprived of the right to use ecological resources, and some of them struggle to survive.
The local government should vigorously guide farmers to rely on natural conditions to develop industries such as the cultivation of the Chinese medicinal herbs, forestry and fruit industry, and the secondary processing of agricultural products to increase their blood-making capacity; reduce the degree of dependence on natural resources; and help residents transform their livelihood development.
(3)
The third suggestion is that ecological migration be accelerated to continuously improve public services in the countryside. For residents in high mountainous, alpine and extremely poor areas, the government should carry out ecological relocation work in an orderly manner, relocate people from the mountains, and transfer villagers from protected areas to towns and shallow mountainous areas.
In addition, the government should improve rural public services such as education, medical care and social security; recruit more rural teachers and doctors; and protect children’s education and basic medical services for families in need.
(4)
The fourth suggestion is to promote clean engineering projects and increase investment in environmental pollution control. The local government should promote clean-up projects and separate humans from animals. Local government should improve the living environment of residents in a gradual manner, pay attention to green low-carbon development, give financial and technical support to the production and consumption of clean energy, raise residents’ awareness of low-carbon environmental protection and resource conservation, and strengthen ecological and environmental management, in order to promote the improvement of the rural habitat of Qilian Mountains Nature Reserve.

6. Research Limitations and Prospects

The study of rural habitat environments involves numerous influencing factors. However, ecotourism, rural household waste, natural disasters, sewage treatment and policy factors are not included in the index system of influencing factors due to the limitation of data acquisition. At present, this is the limitation of this paper and the focus of future research. Subsequent research should include relevant indicators in the system as far as the conditions allow, and explore the comprehensive driving mechanism of multiple elements and subjects to promote the improvement of rural habitat levels and enhance the effectiveness of rural governance. In addition, the research on smaller spatial units and microscopic scales needs to be further expanded and deepened. Future research on the rural habitat environment should focus on the specificity of rural areas and the regularity of rural habitat environment evolution, explore in depth the inner evolution mechanism of different rural types of habitat environment quality, and promote the optimization and control of different types of rural habitat environment quality according to local conditions.

Author Contributions

Writing—original draft, R.Z.; Writing—review & editing, Y.L., R.Y., R.W. and W.L.; Supervision, Y.W. All authors have read and agreed to the published version of the manuscript.

Funding

This research was funded by National Natural Science Foundation of China, grant number 41661107; Philosophy and Social Sciences Project of Gansu Province grant number YB038. Yaobin Wang received two funding grants of 50,000 yuan and was prepared to use the funds when deciding to publish.

Institutional Review Board Statement

Not applicable.

Informed Consent Statement

Not applicable.

Data Availability Statement

Not applicable.

Conflicts of Interest

The authors declare no conflict of interest.

References

  1. Mohammad, Q.; Ruralopolises, A. The Spatial Organization and Residential Land Economy of High-density Rural Regions in South Asia. Urban Stud. 2000, 37, 1583–1603. [Google Scholar]
  2. Fidler, D.; Olson, R.; Bezold, C. Evaluating a Long-Term Livable Communities Strategy in the U.S. Futures 2011, 43, 690–696. [Google Scholar] [CrossRef]
  3. Li, B.; Zeng, J. Study on rural habitat based on the change of spatial behavior of farm households. Geogr. Geogr. Inf. Sci. 2009, 25, 84–88. (In Chinese) [Google Scholar]
  4. Wolfe, R.; Doxiadis, C. Ekistics: An Introduction to the Science of Human Settlements. Geogr. Rev. 1968, 60, 147. [Google Scholar] [CrossRef]
  5. Ploeckl, F. The next town over: On the clustering of towns and settlements before modern economic growth. Reg. Sci. Urban Econ. 2020, 89, 103619. [Google Scholar] [CrossRef]
  6. Dadashpoor, H.; Azizi, P.; Moghadasi, M. Land use change, urbanization, and change in landscape pattern in a metropolitan area. Sci. Total Environ. 2019, 655, 707–719. [Google Scholar] [CrossRef]
  7. Deller, S.; Kures, M.; Conroy, T. Rural entrepreneurship and migration. J. Rural. Stud. 2019, 66, 30–42. [Google Scholar] [CrossRef]
  8. Dušan, R.; Danijela, V.; Miroljub, M. Tourism and sustainable development of rural settlements in protected areas—Example NP Kopaonik (Serbia). Land Use Policy 2019, 89, 104231. [Google Scholar]
  9. Padda, I.; Hameed, A. Estimating Multidimensional Poverty Levels in Rural Pakistan: A Contribution to Sustainable Development Policies. J. Clean. Prod. 2018, 197 Pt 1, 435–442. [Google Scholar] [CrossRef]
  10. Yu, X.; Ma, S.; Cheng, K.; Kyriakopoulos, G.L. An Evaluation System for Sustainable Urban Space Development Based in Green Urbanism Principles—A Case Study Based on the Qin-Ba Mountain Area in China. Sustainability 2020, 12, 5703. [Google Scholar] [CrossRef]
  11. Feng, Y.; Zhao, S. Study on The Evaluation and Promotion Strategy of Sustainable Development Level of Rural Human Settlements in Shandong Province. Chin. J. Agric. Resour. Reg. Plan. 2021, 42, 155–162. (In Chinese) [Google Scholar]
  12. Chen, X.; Jiang, X.; Lu, Y. Study on the rural ecotourism resource evaluation system. Environ. Technol. Innov. 2020, 20, 101131. [Google Scholar]
  13. Wu, B. Study on the optimization of rural living environment in Guanzhong, Shaanxi based on new urbanization. China Agric. Resour. Zoning 2019, 40, 70–77. (In Chinese) [Google Scholar]
  14. Li, S.; Zhu, C.; Li, Y.; Dong, B.; Tan, K. Agricultural space function transitions in rapidly urbanizing areas and their impacts on habitat quality: An urban–Rural gradient study. Environ. Impact Assess. Rev. 2023, 99, 107019. [Google Scholar] [CrossRef]
  15. Cheng, W.; Xi, H.; Sindikubwabo, C. Ecosystem health assessment of desert nature reserve with entropy weight and fuzzy mathematics methods: A case study of Badain Jaran Desert. Ecol. Indictors 2020, 119, 114–126. [Google Scholar] [CrossRef]
  16. Pan, Z.; Gao, G.; Fu, B. Spatiotemporal changes and driving forces of ecosystem vulnerability in the Yangtze River Basin, China: Quantification using habitat-structure-function framework. Sci. Total Environ. 2022, 835, 155494. [Google Scholar] [CrossRef]
  17. Yang, Y.; Nan, Y.; Liu, Z.; Zhang, D.; Sun, Y. Direct and indirect losses of natural habitat caused by future urban expansion in the transnational area of Changbai Mountain. Sustain. Cities Soc. 2020, 63, 102487. [Google Scholar] [CrossRef]
  18. Chen, Z.; Li, Y.; Liu, Y.; Liu, X. Does rural residential land expansion pattern lead to different impacts on eco-environment? A case study of loess hilly and gully region, China. Habitat Int. 2021, 117, 102436. [Google Scholar] [CrossRef]
  19. Ren, Q.; He, C.; Huang, Q.; Zhang, D. Impacts of global urban expansion on natural habitats undermine the 2050 vision for biodiversity, Resources. Conserv. Recycl. 2023, 190, 106834. [Google Scholar] [CrossRef]
  20. Misbawu, A.; Michael, A.; Franklin, N. Assessing the value of forest resources to rural households: A case of forest-fringe communities in the Northern Region of Ghana. Environ. Dev. 2021, 37, 100577. [Google Scholar]
  21. Ahmed, H.; Haider, M. A new approach towards the sustainability of urban-rural integration: The development strategy for central villages in the Abbasiya District of Iraq using GIS techniques. Reg. Sustain. 2023, 4, 28–43. [Google Scholar]
  22. Tang, F.; Wang, L.; Guo, Y.; Fu, M. Spatio-temporal variation and coupling coordination relationship between urbanization and habitat quality in the Grand Canal, China. Land Use Policy 2022, 117, 106119. [Google Scholar] [CrossRef]
  23. Bin, J.; Tang, S.; Chen, S. Evaluation of rural habitat quality in Guangdong Province and its influencing factors. Ecol. Econ. 2021, 37, 203–229. (In Chinese) [Google Scholar]
  24. Zheng, W.; Li, S.; Ke, X.; Li, X.; Zhang, B. The impacts of cropland balance policy on habitat quality in China: A multiscale administrative perspective. J. Environ. Manag. 2022, 323, 116182. [Google Scholar] [CrossRef] [PubMed]
  25. Ottomano, P.; Govindan, K.; Boggia, A.; Loisi, R. Local Action Groups and Rural Sustainable Development. A spatial multiple criteria approach for efficient territorial planning. Land Use Policy 2016, 59, 12–26. [Google Scholar]
  26. Deng, Q.; Li, E.; Zhang, P. Livelihood sustainability and dynamic mechanisms of rural households out of poverty: An empirical analysis of Hua County, Henan Province, China. Habitat Int. 2020, 99, 102160. [Google Scholar] [CrossRef]
  27. Li, C.; Zhao, R.; Tang, Q. Spatial and Temporal Variation of Rural Human Settlements in China Based on Provincial Data. Chin. J. Ecol. 2019, 38, 1472–1481. (In Chinese) [Google Scholar]
  28. Wu, J.; Huang, X. Current Diagnosis and Spatial Pattern of China’s Rural Revitalization—An Empirical Study on the Scale of Prefecture-Level Cities. Econ. Manag. 2020, 34, 48–54. (In Chinese) [Google Scholar]
  29. Du, Y.; Li, S.; Qin, W. Evaluation and optimization of rural habitat quality based on rural revitalization strategy. China Agric. Resour. Zoning 2021, 42, 248–255. (In Chinese) [Google Scholar]
  30. Xiao, Y.; Chai, J.; Wang, R. Assessment and key factors of urban live ability in underdeveloped regions: A case study of the Loess Plateau, China. Sustain. Cities Soc. 2022, 79, 268–281. [Google Scholar] [CrossRef]
  31. Geraldine, M.; Stephen, H.; Eithne, M. An investigation into the type of farmer who chose to participate in Rural Environment Protection Scheme (REPS) and the role of institutional change in influencing scheme effectiveness. Land Use Policy 2014, 39, 199–210. [Google Scholar]
  32. Wu, L. Introduction to Habitat Science; China Construction Industry Press: Beijing, China, 2001. (In Chinese) [Google Scholar]
  33. Yang, Q.; Gao, Y.; Yang, X. Vulnerability-resilience integration study of rural habitat system based on rooting theory-evolutionary characteristics, paths and theoretical models. Geogr. Res. 2023, 42, 209–227. (In Chinese) [Google Scholar]
  34. Kidder, T.; Adelsberger, K.; Arco, L. Basin-scalere construction of the geological context of human settlement: An example from the lower Mississippi Valley, USA. Quat. Sci. Rev. 2018, 27, 1255–1270. [Google Scholar] [CrossRef]
  35. Rey, S.; Janikas, M. STARS: Space-time analysis of regional systems. Geogr. Anal. 2006, 38, 67–86. [Google Scholar] [CrossRef]
  36. Ye, X.; Rey, S. A framework for exploratory space-time analysis of economic data. Ann. Reg. Sci. 2013, 50, 315–339. [Google Scholar] [CrossRef]
  37. Savchenko, A.; Borodina, T. Rural Architectural and Planning Forms as a Source of Diversity for Environment (Case Study of Moscow). Eur. Countrys. 2017, 9, 560–576. [Google Scholar] [CrossRef] [Green Version]
  38. Huang, B.; Wu, B.; Barry, T. Geographically and Temporally Weighted Regression for Spatio-Temporal Modeling of House Prices. Int. J. Geogr. Inf. Sci. 2010, 24, 383–401. [Google Scholar] [CrossRef]
  39. Hu, J.; Zhang, J.; Li, Y. Exploring the spatial and temporal driving mechanisms of landscape patterns on habitat quality in a city undergoing rapid urbanization based on GTWR and MGWR: The case of Nanjing, China. Ecol. Indic. 2022, 143, 109333. [Google Scholar] [CrossRef]
  40. Liu, C.; Sun, W.; Li, M. Evolution of ecosystem service value in rural regions based on geographical scope of entities: A case study of Nanjing, China. Ecol. Inform. 2021, 64, 101368. [Google Scholar] [CrossRef]
  41. Ritu, C.; Harleen, K.; Bhavya, A. Air Quality Forecast using Convolutional Neural Network for Sustainable Development in Urban Environments. Sustain. Cities Soc. 2021, 75, 103239. [Google Scholar]
  42. Madaleno, M.; Nogueira, M. How Renewable Energy and CO2 Emissions Contribute to Economic Growth, and Sustainability—An Extensive Analysis. Sustainability 2023, 15, 4089. [Google Scholar] [CrossRef]
  43. Wang, X.; He, J.; Liao, T.; Gu, G. Does Air Pollution Influence the Settlement Intention of the Floating Population in China? Individual Heterogeneity and City Characteristics. Sustainability 2023, 15, 2995. [Google Scholar] [CrossRef]
  44. Zhangye Municipal People’s Government. Zhangye Comprehensive Yearbook; Gansu Culture Press: Gansu, China, 2000. [Google Scholar]
  45. Jiuquan Local History Office. Jiuquan Yearbook; Gansu Nationalities Publishing House: Gansu, China, 2000. [Google Scholar]
  46. Wuwei Local History Research Center. Wuwei Yearbook; Fangzhi Publishing House: Beijing, China, 2003. [Google Scholar]
  47. Gansu Provincial Local History Office. Gansu Yearbook; Gansu Nationalities Publishing House: Gansu, China, 2001. [Google Scholar]
  48. Qinghai Provincial Bureau of Statistics. Qinghai Statistical Yearbook; China Statistics Press: Beijing, China, 2000. [Google Scholar]
  49. Statistical Bureau of the People’s Republic of China. China County Statistical Yearbook; China Statistics Publishing House: Beijing, China, 2000. [Google Scholar]
  50. Gong, J.; Jin, T.; Cao, E. Is ecological vulnerability assessment based on the VSD model and AHP-Entropy method useful for loessial forest landscape protection and adaptative management? A case study of Ziwuling Mountain Region, China. Ecol. Indic. 2022, 143, 206–215. [Google Scholar] [CrossRef]
  51. Li, Y.; Zhang, Q.; Wang, L. Regional environmental efficiency in China: An empirical analysis based on entropy weight method and non-parametric models. J. Clean. Prod. 2020, 276, 287–298. [Google Scholar] [CrossRef]
  52. Tsinda, A.; Abbott, P.; Chenoweth, J. Sanitation markets in urban informal settlements of East Africa. Habitat Int. 2015, 49, 21–29. [Google Scholar] [CrossRef]
  53. Wei, W.; Bao, Y.; Wang, Z. Response of habitat quality to urban spatial morphological structure in multi-mountainous city. Ecol. Indic. 2023, 146, 109877. [Google Scholar] [CrossRef]
  54. Li, E.; Lu, Y.; Chen, E. Analysis of the geographic pattern evolution and influencing factors of China’s foreign trade goods exports--based on goods export distance and GTWR model. Geogr. Res. 2019, 38, 2624–2638. (In Chinese) [Google Scholar]
  55. Mao, S.; Zhang, L.; He, L. Analysis of China’s agricultural and rural investment status and future investment focus areas. Agric. Econ. Issues 2021, 499, 47–56. (In Chinese) [Google Scholar]
  56. Wang, F.; Yao, M.; Huang, X.; Guo, H.; Zheng, P.; Yu, H. The Effects of Investment in Major Construction Projects on Regional Economic Growth Quality: A Difference-in-Differences Analysis Based on PPP Policy. Sustainability 2022, 14, 6796. [Google Scholar] [CrossRef]
  57. Aberg, H.; Tondelli, S. Escape to the Country: A Reaction-Driven Rural Renaissance on a Swedish Island Post COVID-19. Sustainability 2021, 13, 12895. [Google Scholar] [CrossRef]
  58. Yang, X.; Wang, Q. Evaluation of rural habitat environment quality and impact analysis in the tourist area of South Anhui. J. Geogr. 2013, 68, 851–867. (In Chinese) [Google Scholar]
  59. Mpofu, G.; Darkoh, M.; Gwebu, T. Peri-urbanization land use dynamics: An analysis of evolving patterns and impacts on Gabane Village, Botswana. GeoJournal 2018, 83, 725–741. [Google Scholar] [CrossRef]
  60. Blackstock, K.; White, V.; McCrum, G. Measuring responsibility: An appraisal of a Scottish Nature Reserve’s sustainable indicators. J. Sustain. Tour. 2008, 16, 276–297. [Google Scholar] [CrossRef]
  61. Geldmann, J.; Barnes, M.; Coad, L.; Craigie, I.; Hockings, M.; Burgess, N. Effectiveness of terrestrial protected areas in reducing habitat loss and population declines. Biol. Conserv. 2013, 161, 230–238. [Google Scholar] [CrossRef]
  62. Lim, J.; Choi, B.; Kim, S. Korean traditional village forest (Ma-Eul-Soop) and potential natural vegetation: A case study on the Sachon-Ri Garo-Soop in Gyeongsangbuk-do, South Korea. J. Plant Biol. 2016, 59, 515–524. [Google Scholar] [CrossRef]
  63. Yoshinagaj, J. Lead in the Japanese Living Environment. Environ. Health Prev. Med. 2012, 17, 433–443. [Google Scholar] [CrossRef] [Green Version]
  64. Květoň, V.; Chmelík, J.; Vondráčková, P. Developments in the public transport serviceability of rural settlements with examples from various types of micro-regions. Acta Univ. Carol. Geogr. 2017, 47, 51–63. [Google Scholar] [CrossRef] [Green Version]
  65. Kemperman, A.; Timmermans, H. Green Spaces in the Living Environment and Social Contacts of the Aging Population. Landsc. Urban Plan. 2014, 129, 44–54. [Google Scholar] [CrossRef]
Figure 1. Qilian Mountains Nature Reserve.
Sustainability 15 05775 g001
Figure 2. The research framework.
Sustainability 15 05775 g002
Figure 3. Characteristics of infrastructure development evolution. Remarks: 1. Suzhou; 2. Gaotai; 3. Linze; 4. Sunan; 5. Ganzhou; 6. Minle; 7. Qilian; 8. Shandan; 9. Yongchang; 10. Liangzhou; 11. Gulang; 12. Menyuan; 13. Tianzhu.
Sustainability 15 05775 g003
Figure 4. Characteristics of the evolution of economic production. Remarks: 1. Suzhou; 2. Gaotai; 3. Linze; 4. Sunan; 5. Ganzhou; 6. Minle; 7. Qilian; 8. Shandan; 9. Yongchang; 10. Liangzhou; 11. Gulang; 12. Menyuan; 13. Tianzhu.
Sustainability 15 05775 g004
Figure 5. Evolutionary characteristics of ecological environment quality. Remarks: 1. Suzhou; 2. Gaotai; 3. Linze; 4. Sunan; 5. Ganzhou; 6. Minle; 7. Qilian; 8. Shandan; 9. Yongchang; 10. Liangzhou; 11. Gulang; 12. Menyuan; 13. Tianzhu.
Sustainability 15 05775 g005
Figure 6. Characteristics of the evolution of rural social services. Remarks: 1. Suzhou; 2. Gaotai; 3. Linze; 4. Sunan; 5. Ganzhou; 6. Minle; 7. Qilian; 8. Shandan; 9. Yongchang; 10. Liangzhou; 11. Gulang; 12. Menyuan; 13. Tianzhu.
Sustainability 15 05775 g006
Figure 7. Characteristics of the evolution of rural habitat. Remarks: 1. Suzhou; 2. Gaotai; 3. Linze; 4. Sunan; 5. Ganzhou; 6. Minle; 7. Qilian; 8. Shandan; 9. Yongchang; 10. Liangzhou; 11. Gulang; 12. Menyuan; 13. Tianzhu.
Sustainability 15 05775 g007
Figure 8. Moran scatter plot of rural habitat in Qilian Mountains.
Sustainability 15 05775 g008
Figure 9. Spatial distribution of average temperature regression coefficients. Remarks: 1. Suzhou; 2. Gaotai; 3. Linze; 4. Sunan; 5. Ganzhou; 6. Minle; 7. Qilian; 8. Shandan; 9. Yongchang; 10. Liangzhou; 11. Gulang; 12. Menyuan; 13. Tianzhu.
Sustainability 15 05775 g009
Figure 10. Spatial distribution of fixed asset investment amount regression coefficients. Remarks: 1. Suzhou; 2. Gaotai; 3. Linze; 4. Sunan; 5. Ganzhou; 6. Minle; 7. Qilian; 8. Shandan; 9. Yongchang; 10. Liangzhou; 11. Gulang; 12. Menyuan; 13. Tianzhu.
Sustainability 15 05775 g010
Figure 11. Spatial distribution of the ratio of secondary and tertiary industries’ regression coefficients. Remarks: 1. Suzhou; 2. Gaotai; 3. Linze; 4. Sunan; 5. Ganzhou; 6. Minle; 7. Qilian; 8. Shandan; 9. Yongchang; 10. Liangzhou; 11. Gulang; 12. Menyuan; 13. Tianzhu.
Sustainability 15 05775 g011
Figure 12. Spatial distribution of PM2.5 concentration regression coefficients. Remarks: 1. Suzhou; 2. Gaotai; 3. Linze; 4. Sunan; 5. Ganzhou; 6. Minle; 7. Qilian; 8. Shandan; 9. Yongchang; 10. Liangzhou; 11. Gulang; 12. Menyuan; 13. Tianzhu.
Sustainability 15 05775 g012
Figure 13. Spatial distribution of CO2 emissions’ regression coefficients. Remarks: 1. Suzhou; 2. Gaotai; 3. Linze; 4. Sunan; 5. Ganzhou; 6. Minle; 7. Qilian; 8. Shandan; 9. Yongchang; 10. Liangzhou; 11. Gulang; 12. Menyuan; 13. Tianzhu.
Sustainability 15 05775 g013
Table 1. Index system of rural habitat level.
Objective LayerCriterion LayerIndicator LayerIndicator Interpretation or Calculation MethodEntropy Method WeightHierarchical Analysis Method WeightComprehensive Weight
Rural Habitat LevelInfrastructure DevelopmentHousing area per capita in the countryside (+)Reflects the housing level of rural residents (m2/person)0.0580.0470.053
Per capita electricity consumption of rural residents (+)Rural electricity consumption/number of rural residents (kw·h/person)0.0380.0270.033
Number of hospital beds per 10,000 people (+)Total number of beds in hospital health centers/number of rural residents (beds/10,000 people)0.0530.0410.047
Road network density (+)Road miles/area (km/km2)0.0520.0460.049
Level of rural communication facilities (+)Number of rural telephone subscribers at year-end/number of rural residents (%)0.0590.0460.052
Economic productionPer capita net income of rural residents (+)Reflects the average income level of rural residents (CNY)0.0620.0540.058
Food production per capita (+)Total food production/number of rural residents (kg/person)0.0440.0280.036
Per capita output value of agriculture, forestry, animal husbandry and fishery (+)Total output value of agriculture, forestry, animal husbandry and fishery/number of rural population (CNY/person)0.0390.0270.033
Level of agricultural modernization (+)Total power of agricultural machinery/arable land area (kw/hm2)0.0450.0360.041
Engel’s coefficient of rural residents (−)Rural residents’ expenditure on food consumption/total household expenditure (%)0.0320.0210.026
Ecological andenvironmental qualityForest coverage (+)Total forest land area/total land area (%)0.0730.0960.084
Total water resources per capita (+)Total water resources/total rural residents (m3/person)0.0790.0930.086
Agricultural fertilizer application intensity (−)Agricultural fertilizer application/total arable land area (kg/hm2)0.0240.0310.028
Agricultural plastic film use intensity (−)Agricultural plastic film use/total arable land area (kg/hm2)0.0240.0290.026
Intensity of pesticide use (−)Pesticide use/total arable land area (kg/hm2)0.0260.0350.031
Rural social servicesPublic library collections per 10,000 people (+)Public library book collections/number of rural population (volumes per 10,000 people)0.0540.0790.066
Number of health technicians per 10,000 people (+)Number of health technicians in hospitals/number of rural population (numbers per 10,000 people)0.0580.0770.068
Number of social welfare institutions per 10,000 people (+)Number of social welfare adoptive units/number of rural population (numbers per 10,000 people)0.0630.0510.057
Number of villagers’ committee units per 10,000 people (+)Number of villagers’ committees/number of village population (numbers per 10,000 people)0.0560.0490.052
Teacher–student ratio in rural elementary school (+)Number of elementary school teachers/number of primary school students (%)0.0610.0870.074
Table 2. Description of variables and indicators.
DimensionIndicatorUnit
Geographical EnvironmentAverage temperature°C
Average annual precipitationmm
Average elevationm
Economic DevelopmentGDP per capitaYuan
Fixed asset investmentmillion yuan
Percentage of secondary and tertiary industries%
Ecological EnvironmentPM2.5 concentrationum
Carbon dioxide emissionsmillion tons
Sulfur dioxide emissions from industrial waste gasmillion tons
Table 3. Model parameter estimation results and comparison.
Judgment IndicatorsOLSTWRGWRGTWR
R20.7450.7930.9190.927
R2 Adjusted0.7420.7920.9180.925
RSS0.6140.5330.1850.141
AICc−1239.262−1276.349−1629.374−1637.875
Sigma 0.0230.019
Bandwidth 0.1310.124
Table 4. Moran’s I index of rural habitat in Qilian Mountains.
YearMoran’s IZp
20000.1558.160.01
20050.1094.210.01
20100.0851.680.07
20150.1925.130.01
20200.1732.320.01
Table 5. Clustering results of rural habitat in Qilian Mountains region.
YearClustering Model
(H-H)(L-H)(H-L)(L-L)
2000Linze Menyuan
2005Liangzhou Menyuan
2010Liangzhou Menyuan
2015Liangzhou Menyuan
2020Liangzhou
Disclaimer/Publisher’s Note: The statements, opinions and data contained in all publications are solely those of the individual author(s) and contributor(s) and not of MDPI and/or the editor(s). MDPI and/or the editor(s) disclaim responsibility for any injury to people or property resulting from any ideas, methods, instructions or products referred to in the content.

