Article

Sustainable Development Optimization of a Plant Factory for Reducing Tip Burn Disease

1
College of Biological and Agricultural Engineering, Jilin University, Changchun 130012, China
2
College of Agricultural Engineering, Jiangsu University, Zhenjiang 212013, China
*
Author to whom correspondence should be addressed.
Sustainability 2023, 15(6), 5607; https://doi.org/10.3390/su15065607
Submission received: 23 February 2023 / Revised: 21 March 2023 / Accepted: 22 March 2023 / Published: 22 March 2023

Abstract

:
It is generally believed that stable airflow can effectively reduce tip burn, a common lettuce plant disease in closed plant factories that severely restricts the sustainable development of these factories. This study aims to achieve stable airflow in the cultivator by zoning the seedling and growth stage crops and installing differential fans, while ensuring comprehensive quality. In this study, a three-dimensional simulation plant factory model was created to simulate the airflow inside the cultivator, taking crop shading and heat dissipation from LED light sources into account. Experiments on photosynthetic physiology and airflow were used to determine environmental thresholds for crop growth, which were then used as CFD boundary conditions. After adopting the optimized cultivation model, the comprehensive quality of lettuce increased by 22.28% during the seedling stage, and the tip burn rate decreased to 26.9%; during the growth stage, the comprehensive quality increased by 25.72%, and the tip burn rate decreased to 23.2%. The zoning optimization cultivation method and differential fan arrangement used in this study to improve the airflow field of plant factories provide new ideas and reliable theoretical support for plant factories to combat lettuce tip burn disease.

1. Introduction

With the outbreak and spread of COVID-19 in recent years, sustainable development of agriculture, especially plant factories, has attracted increasing attention [1,2,3,4]. Plant factories can improve agricultural production efficiency by regulating environmental factors, enabling agricultural production to break free of the shackles of natural conditions and the effects of the outside world [5,6]. Lettuce is the most common crop in plant factories because the cultivation period is short, with less energy being required to produce the final product. Lettuce tip burn, which is also the most prevalent disease in plant factories, will result in the yellowing of the upper tip edges and the curling of leaves, significantly impacting crop quality and yield [7]. Scholars have conducted a significant amount of research on the pathogenesis of lettuce tip burn in the growth stage. Studies have shown that the pathogenesis of lettuce tip burn in the growth stage is due to the inhibition of transpiration in the high humidity environment of plant factories, which leads to the inability of Ca2+ to be transported smoothly from the culture solution to the leaves through the roots [8,9,10,11].
Air conditioning systems are used to ventilate plant factories, which are highly enclosed structures. However, the airflow inlet and outlet locations are fixed for established plant factories. Shading of the airflow by the cultivation frame and plant cultivation location, along with heat dissipation from the light source, can affect the airflow field distribution [12,13,14]. After long-term planting, uneven airflow can result in issues such as tip burn, uneven production, and increased energy consumption [15,16]. When lettuce varieties and cultivation methods were identified, Kitaya and Ryohei et al. confirmed that stable and uniform airflow is an effective tool for resolving the problem of lettuce tip burn [17,18]. Computational fluid dynamics (CFD) is an efficient tool for reasonably simulating complex physical phenomena and analyzing environmental uniformity in controlled environments [19]. Ying et al. designed a three-row outlet duct with fans for downward ventilation, and the CFD simulations indicated that the device could effectively improve the airflow distribution in the crop canopy [20]. Benyamin et al. developed a computational fluid dynamics model to simulate the fluid flow in an indoor vertical farming system using photosynthesis. The case with the inlet at the bottom of the short side and the exit at the top of the long side, operating at 0.3 kg/s, demonstrated the desired lower average temperature compared to other vent locations operating at 0.4 or 0.5 kg/s [21]. However, these designs must be completed prior to the construction of the plant factories. For existing plant factories, it is evident that the location of the vents and the lack of monitoring and verification of the actual airflow field cannot be changed [22,23]. Kozai et al. concluded that LED heat dissipation affects the uniformity of the airflow field, particularly in the case of different light source arrangements in the plant factories [24]. Hui F et al. considered crop resistance and LED heat dissipation, designed ventilation ducts with different apertures, and simulated plant canopy airflow. The simulation results revealed that ventilation ducts with 12 mm apertures could increase the plant airflow comfort zone to 70.3% [25]. For plant factories with fixed air inlet and outlet locations, appropriate cultivation methods based on the inherent airflow distribution are more likely to reduce production costs [26,27]. Baek and Ahmed et al. proposed a CFD-based internal differential fan control simulation to improve the cultivation environment inside a plant factory. The uniformity of the airflow field and the comprehensive quality of the crop were significantly enhanced based on simulation results [28,29]. Li Kun used interlayer cool airflow (ILCA) to introduce room air into the internal plant canopies, resulting in a 41.7% reduction in root growth, without negatively impacting lettuce crop yield [30]. However, there is a lack of research regarding optimizing the crop canopy airflow field from the perspective of cultivation location distribution; most studies on optimizing such methods are focused on crop cultivation methods [31].
This study aimed to reduce lettuce tip burn by controlling airflow while maintaining comprehensive plant quality. This study utilized the analytic hierarchy process (Ahp) to analyze the results of lettuce photosynthetic physiology experiments to determine plant light source arrangement. Airflow treatment tests were performed to determine the airflow speed threshold for reducing the incidence of tip burns, and the results were used as simulation boundary conditions. Based on the above findings, we proposed zoning cultivation into high- and low-speed areas, based on the airflow distribution of the plant factory, and implemented CFD simulation. Considering the crop’s shading, we conducted aerodynamic experiments to determine the parameters of the lettuce’s porous medium during the seedling and growing stages. This study arranged differential fans at the side ends of the cultivators and adjusted the differential speed according to the airflow field of each cultivator to reduce the uneven airflow field caused by LED heat dissipation. The study’s results indicated that the zoning cultivation and the arrangement of differential fans effectively mitigated tip burn disease in the plant factory and ensured the lettuce’s comprehensive quality. For the study of sustainable development of plant factories, our study offers a novel concept for low-cost management of tip burn disease in plant factories, avoiding the modification of the plant factories’ inherent building patterns.

2. Materials and Methods

2.1. Photosynthetic Physiology Experiment

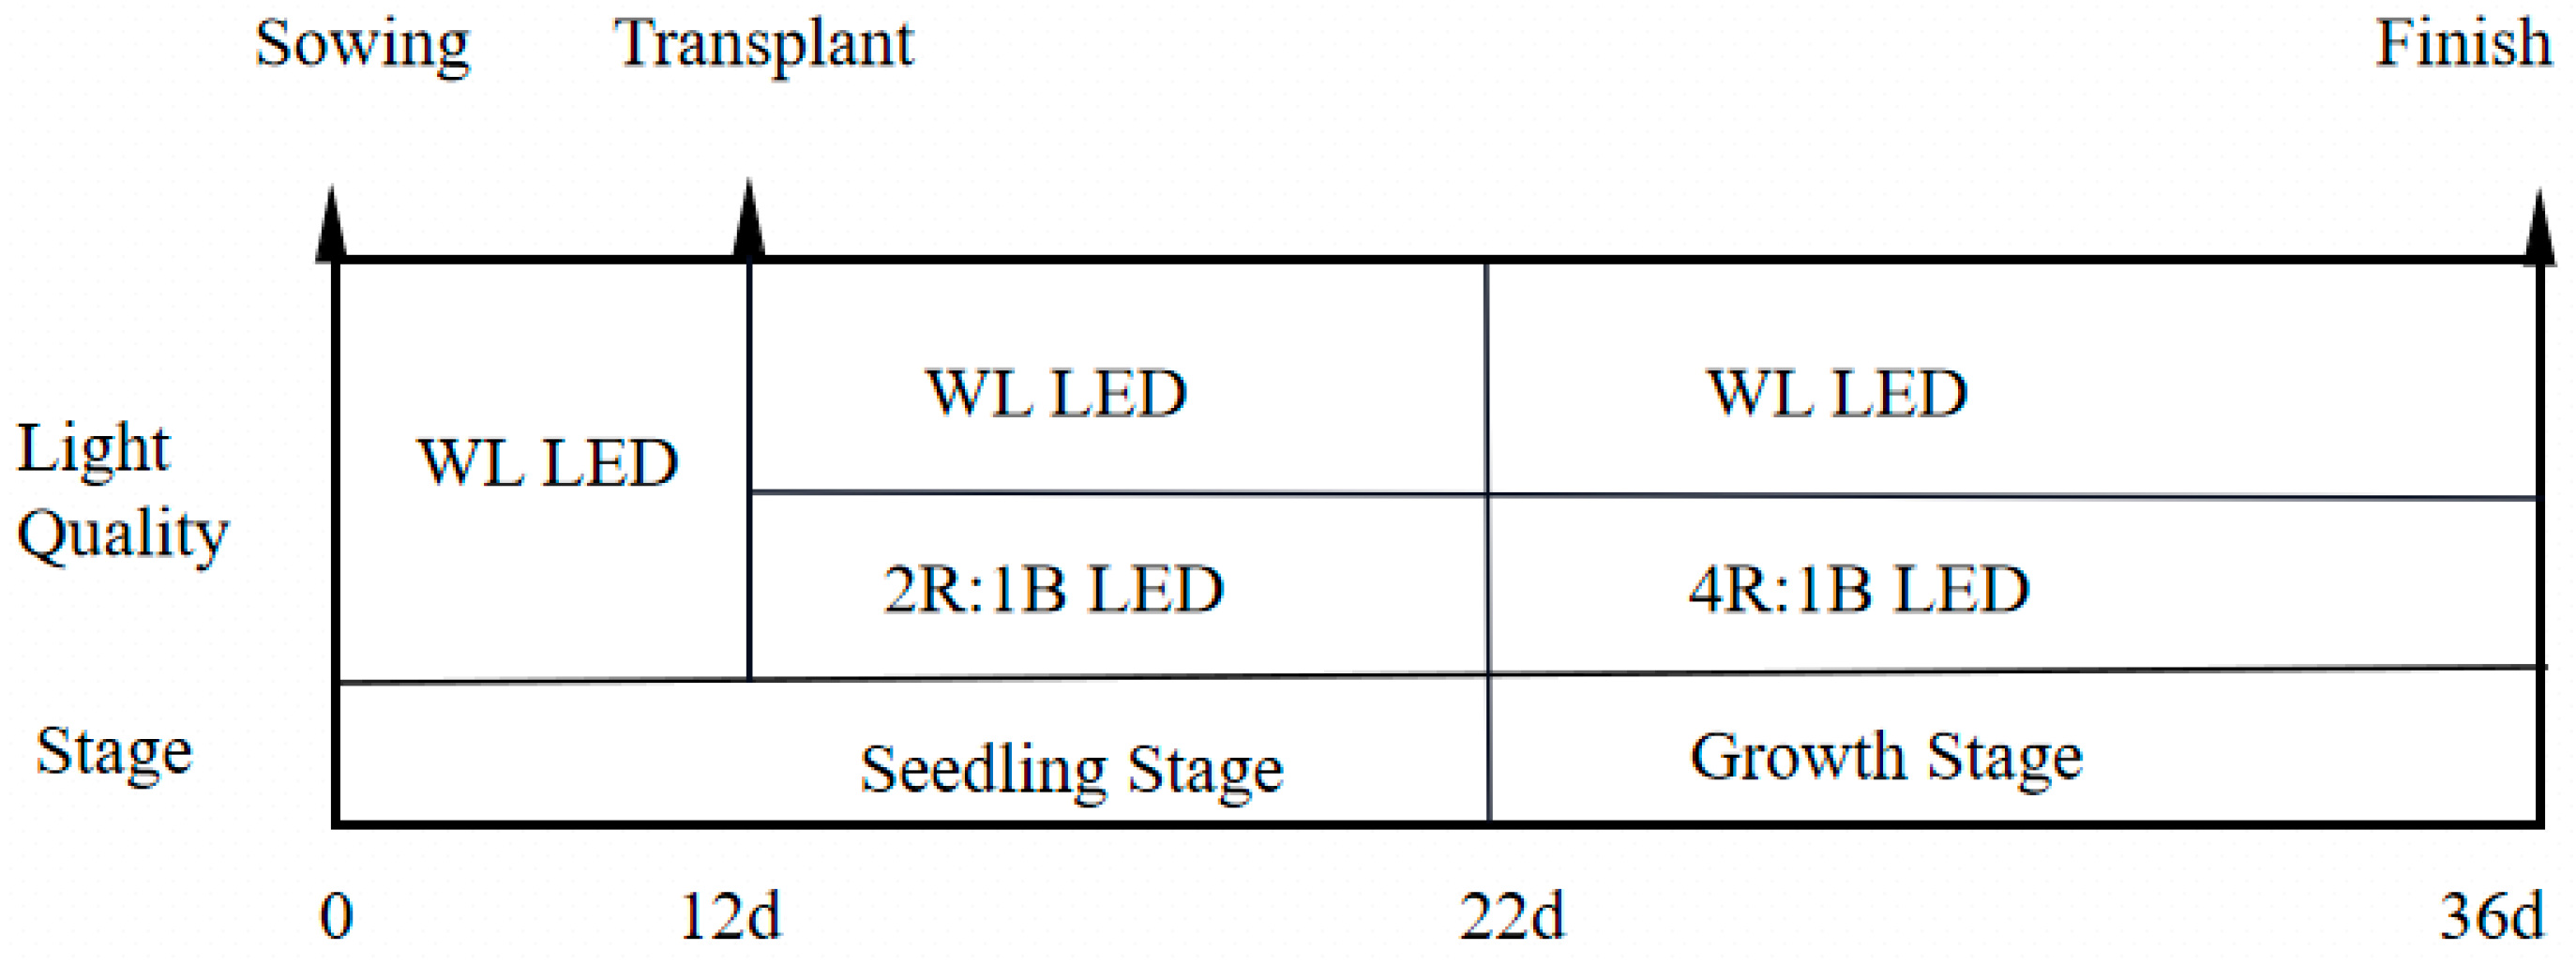
2.1.1. Materials and Conditions

The photosynthetic physiology experiment was conducted in an artificial climate incubator (MRC-550C). The climate incubator was a three-layer spacer-type construction, with adjustable spacing between the spacers. The environmental conditions were controlled, including airflow, temperature, humidity, and light cycle. The light source radiation form was vertical irradiation, the ventilation mode was horizontal or vertical, the temperature range was 0–50 °C, the maximum light intensity was 500 μmol/m2 s, and the humidity adjustment range was 30–95% [32,33]. The LED light used a Guixiang full-spectrum white LED light source and a ZPDT812 adjustable red and blue LED light source, with a light period of 16 h/d. The lettuce cultivar chosen was Italian bolting lettuce. After soaking for 7 h, the seeds were wrapped in wet gauze for 3–4 days. The seedlings were cultured in water with a seedling sponge after budding. The seedlings with the same growth rate were selected and transplanted to each treatment group (n = 24) once they exhibited three true leaves. The nutrient solution follows the Japanese garden test nutrient solution (pH 6.0–6.5, EC 1.0 ms cm−1), the ambient temperature was maintained at 21 °C, and the relative humidity was set at 80%.

2.1.2. Test Methods

The photosynthetic physiology experiment was conducted on seedling and growth stage lettuce with the test schedule illustrated in Figure 1. There were six treatment groups for the seedling and growth stage lettuce photosynthetic physiology experiments, respectively. The number of samples analyzed per treatment group and time point was n = 24. The photosynthetic physiology experiments were treated with each light mode, as shown in Table 1, where WL is the full-spectrum white LED light source, and RB is the red and blue light source, and the different coefficients of the RB prefix represent the ratio of red and blue light sources [34]. The lettuce’s growth and physiological indexes in the seedling stage were measured 22 days after sowing. After the seedling stage, lettuce with consistent growth without tip burn disease was selected for the growing stage treatment. Meanwhile, lettuce’s growth and physiological indexes in the growth stage were measured 36 days after sowing.

2.1.3. Plant Growth and Physiological Index Measurements

In this section, eight physiological growth indexes (leaf area, tip burn rate, plant height, fresh weight, Spad, soluble sugar, ascorbic acid (AsA), and nitrate) were selected to constitute the evaluation index system of lettuce. Plant fresh weight for quantitative analysis was measured by a ten-thousandth electronic analytical balance. Plant height was measured by an electronic vernier caliper. Lettuce leaves with more than three brown spots are considered to have tip burn disease, and the tip burn rate is the percentage of tip burn plants in the treatment group. The leaf area of the plants was measured by a Ya-Xin leaf area instrument, the AsA content was determined by molybdenum blue colorimetry, the soluble sugars content was measured using the anthrone method, and the nitrate content was determined by salicylic sulfuric acid colorimetry [35].

2.1.4. Data Processing and Analysis

Data management and analysis were performed using SPSS 26.0. Significant difference analysis was performed using Duncan’s multiple range test, and differences were considered statistically significant at the 5% probability level.

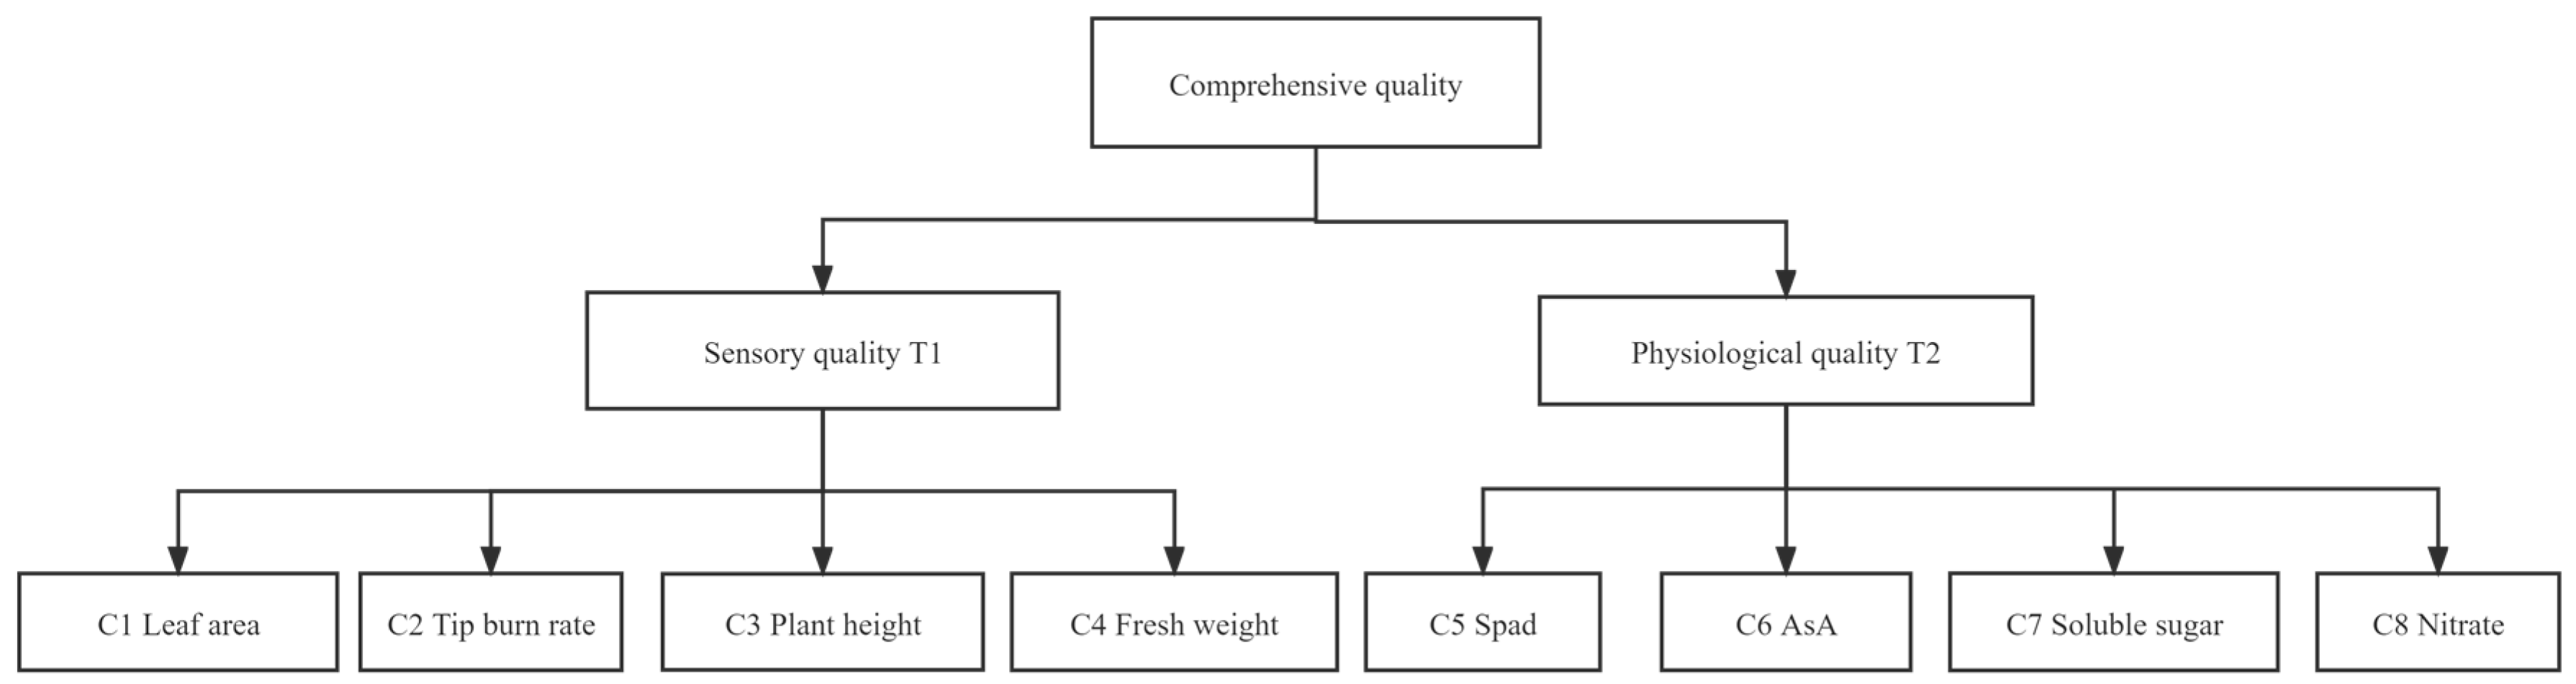
2.1.5. Analytic Hierarchy Process (Ahp)

The comprehensive evaluation system of the comprehensive quality of the lettuce is composed of the experimental indexes in Figure 2 (leaf area, tip burn rate, plant height, fresh weight, Spad, soluble sugar, ascorbic acid (AsA) and nitrate) [36,37,38]. The comprehensive quality of lettuce is evaluated by Ahp fuzzy comprehensive evaluation, and the Wi of each index is shown in Table 2. All the above CR values were less than 0.1, which passed the consistency test. The weight coefficient set Wi = (0.0789, 0.1049, 0.0534, 0.2628, 0.2410, 0.0839, 0.0665, 0.1087) as a reasonable weight vector.

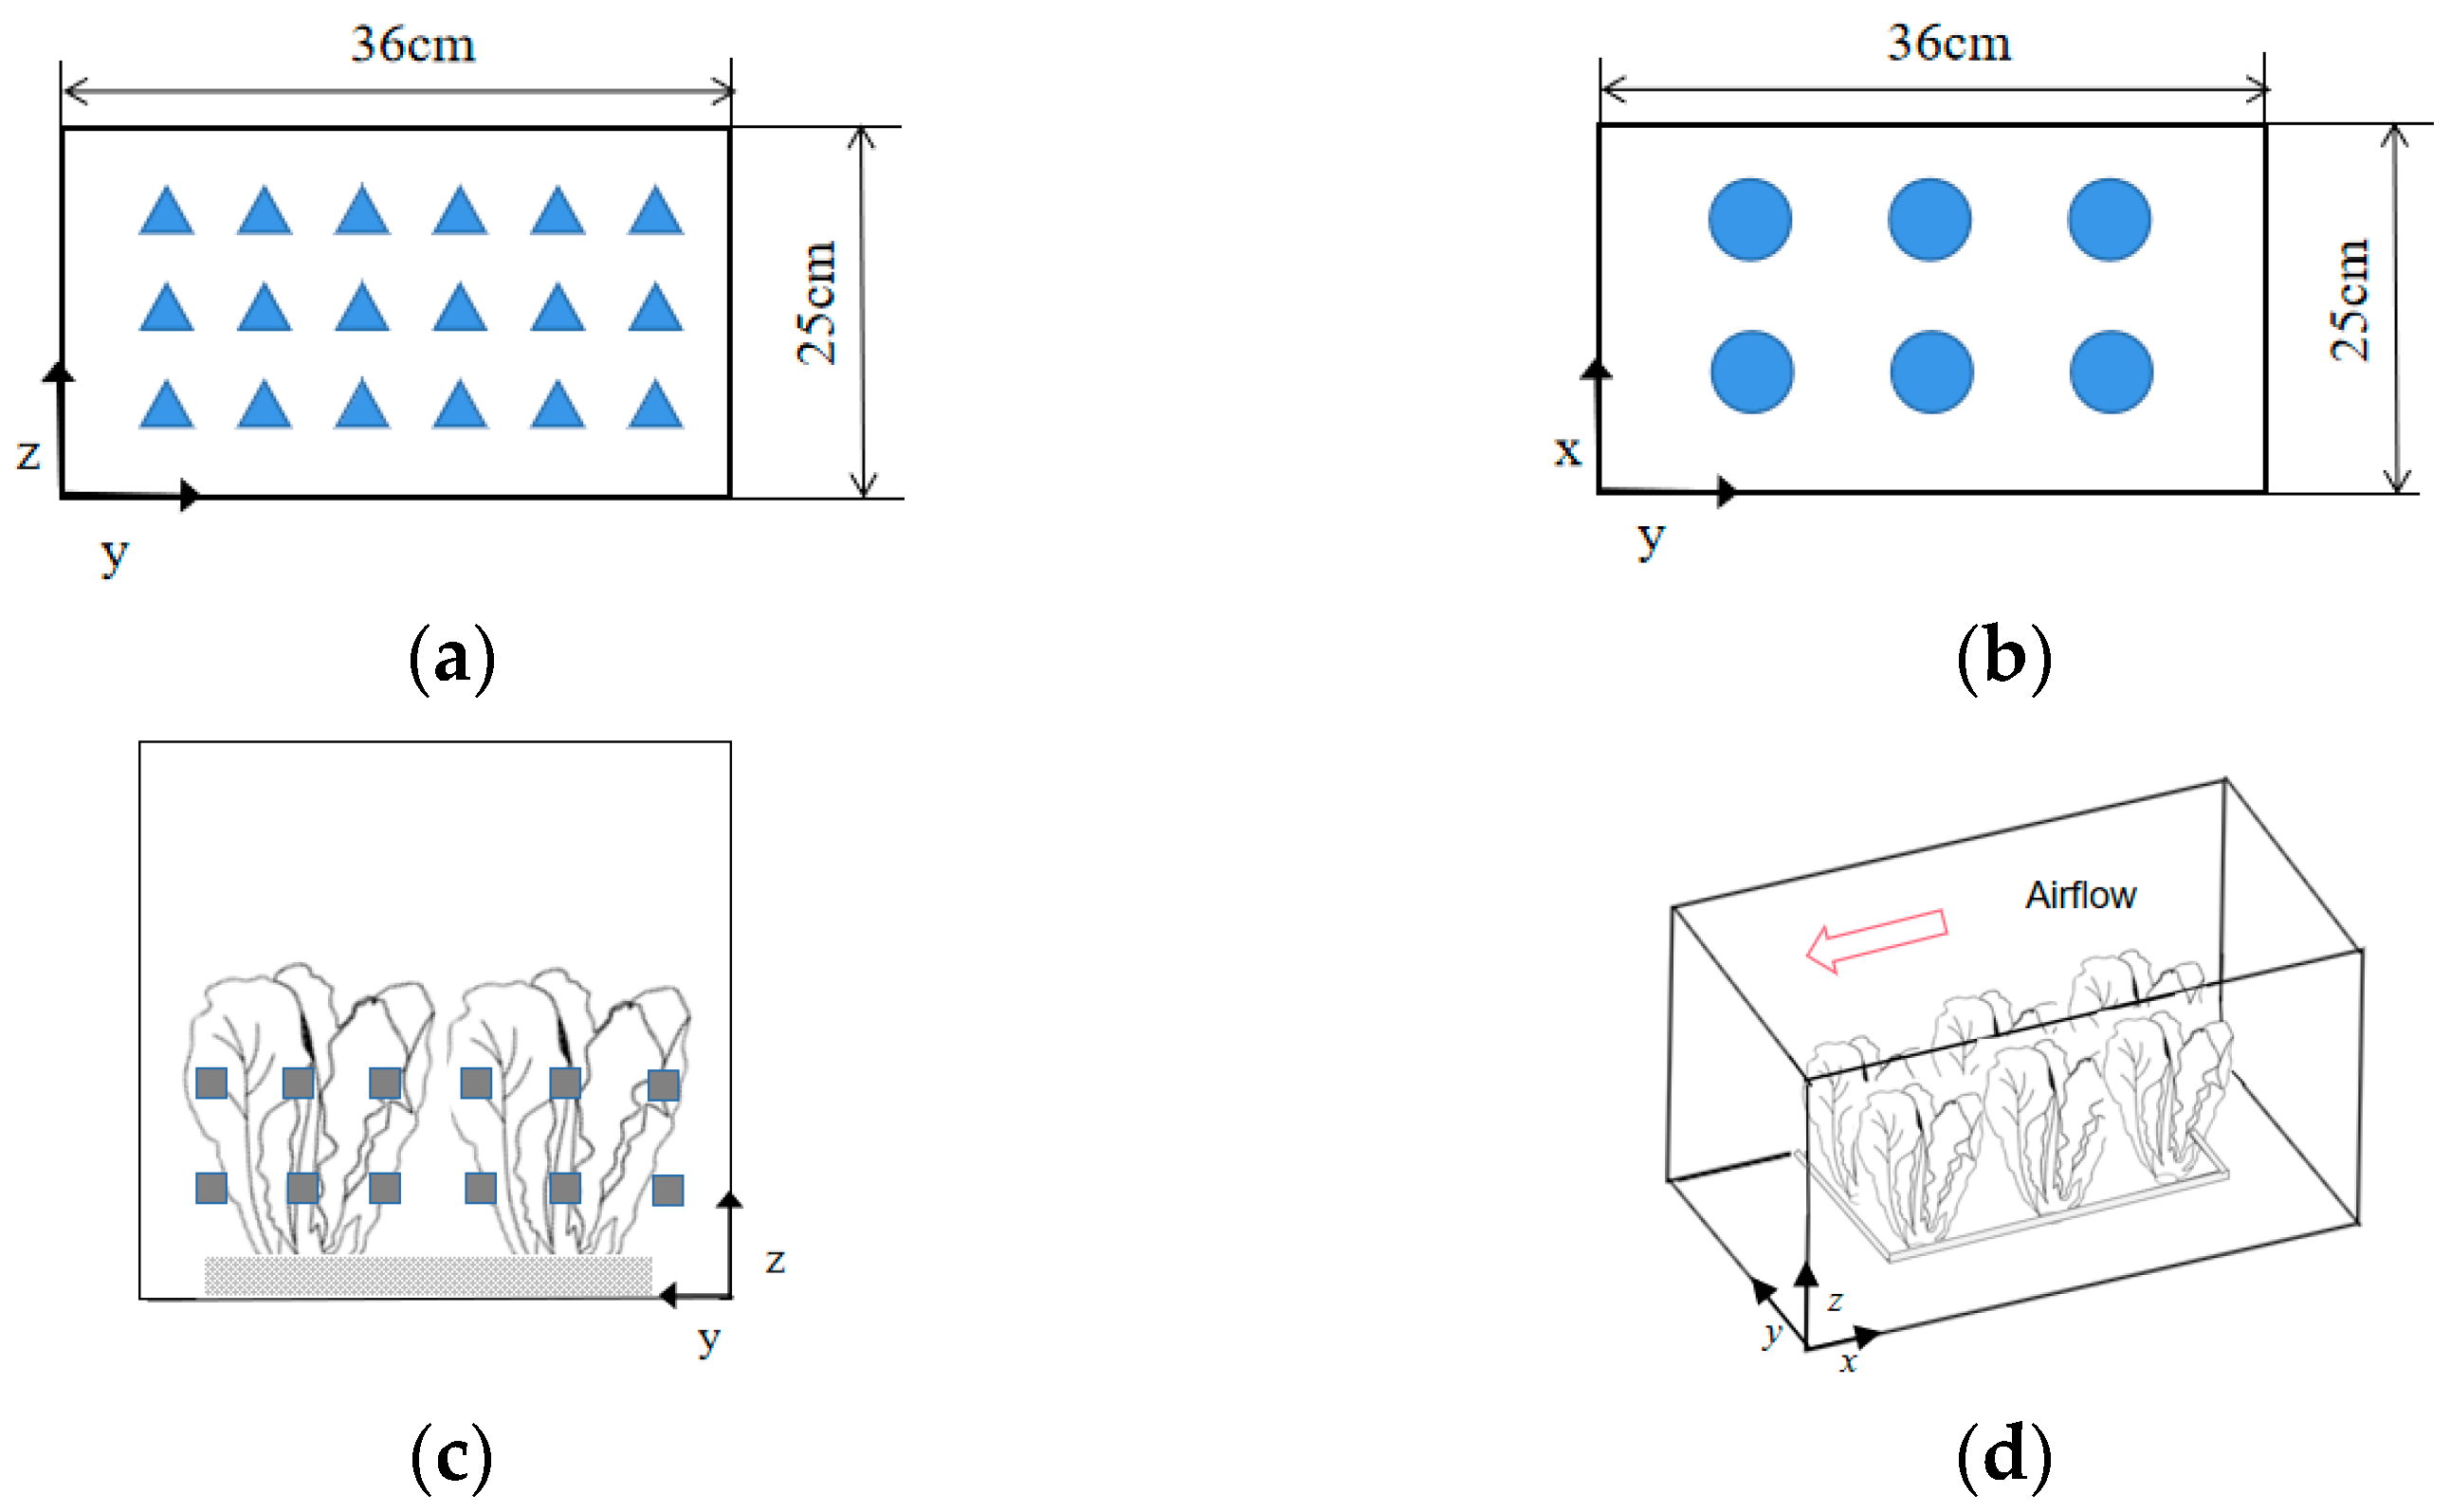
2.2. Airflow Experiment

The seedling lettuce and growth stage lettuce were transferred to an artificial climate incubator (MRC-550C) for a different airflow. The environmental factors were set in the same way as in the photosynthetic physiology experiment in Section 2.1. The lighting pattern setting for the airflow test needed to be based on the results of the plant light and physiology experiments in Section 2.1. The airflow test time period was the same as the photoperiod. The airflow direction in the climate incubator is horizontal or vertical, from top to bottom, respectively. Our previous research experience showed airflow speeds ranging from 0.1 to 0.9 m/s in the seedling stage and from 0.5 to 1.4 m/s in the growth stage [39]. The tip burn rate of seedling stage lettuce was measured at 22 days after sowing; the tip rate of growth stage lettuce was measured at 36 days after sowing.

2.3. Porous Medium Model of Lettuce

The simulation of plant factory fluid must account for plant occlusion of airflow. Therefore, aerodynamic tests on the crop are needed to obtain the parameters of the crop porous medium. After establishing plants as porous media, the resistance coefficients in all directions can be artificially defined to replace the resistance of solids to fluids in porous media, i.e., a momentum sink related to velocity is added, and its expression equation is:
S i = ( j = 1 3 D i j μ v j + j = 1 3 C i j 1 2 ρ | v | v j )
where v is the velocity value, D is the viscous drag coefficient, which in turn can be rewritten as 1 k , k is the permeability, C2 is the inertial drag coefficient, momentum sink Si acts on the fluid to produce a pressure gradient ∇P, ∇P = S i l , and l is the thickness of the porous media domain [40].
From the above relationship between the pressure drop ∇P and the flow velocity v, we obtain a quadratic equation Y = A x 2 + B x , and Equation (1) can be rewritten as:
P = ( D μ v + 1 2 C 2 ρ v 2 ) l
The aerodynamic test was conducted in Jilin University’s Bionic Key Laboratory’s low-speed airflow tunnel. The seedling lettuce porous medium consisted of 3 × 4 crops; the growth period lettuce porous medium consisted of 2 × 3 crops. The monitoring points of pressure drop and the direction of tunnel airflow are shown in Figure 3 [41]. The dimension of the xyz vector direction of lettuce is 360 mm × 250 mm × 200 mm, and the dimension of the xyz vector direction of lettuce in seedling period is 360 mm × 250 mm × 100 mm. l is the length of the lettuce porous medium along the airflow direction in the airflow test, i.e., the xyz direction vector value. The pressure drop of the lettuce canopy was measured in three xyz directions at different airflow speeds. For aerodynamic tests on porous media, velocity ranges of 0.1–1.3 m/s were set for the seedling stage and 0.5–1.5 m/s for the growth stage. According to Equation (2), the polynomial coefficients D and C2 could be solved. The leaf area density of the seedling stage lettuce was 8.25 m2/m3, and the leaf area density of growth stage lettuce was 32.3 m2/m3. The air density ρ is 1.205 kg/m3, and the air viscosity μ is 17.9 × 10⁻⁶ Pa·s.

2.4. CFD Simulation of Flow Field in the Plant Factory

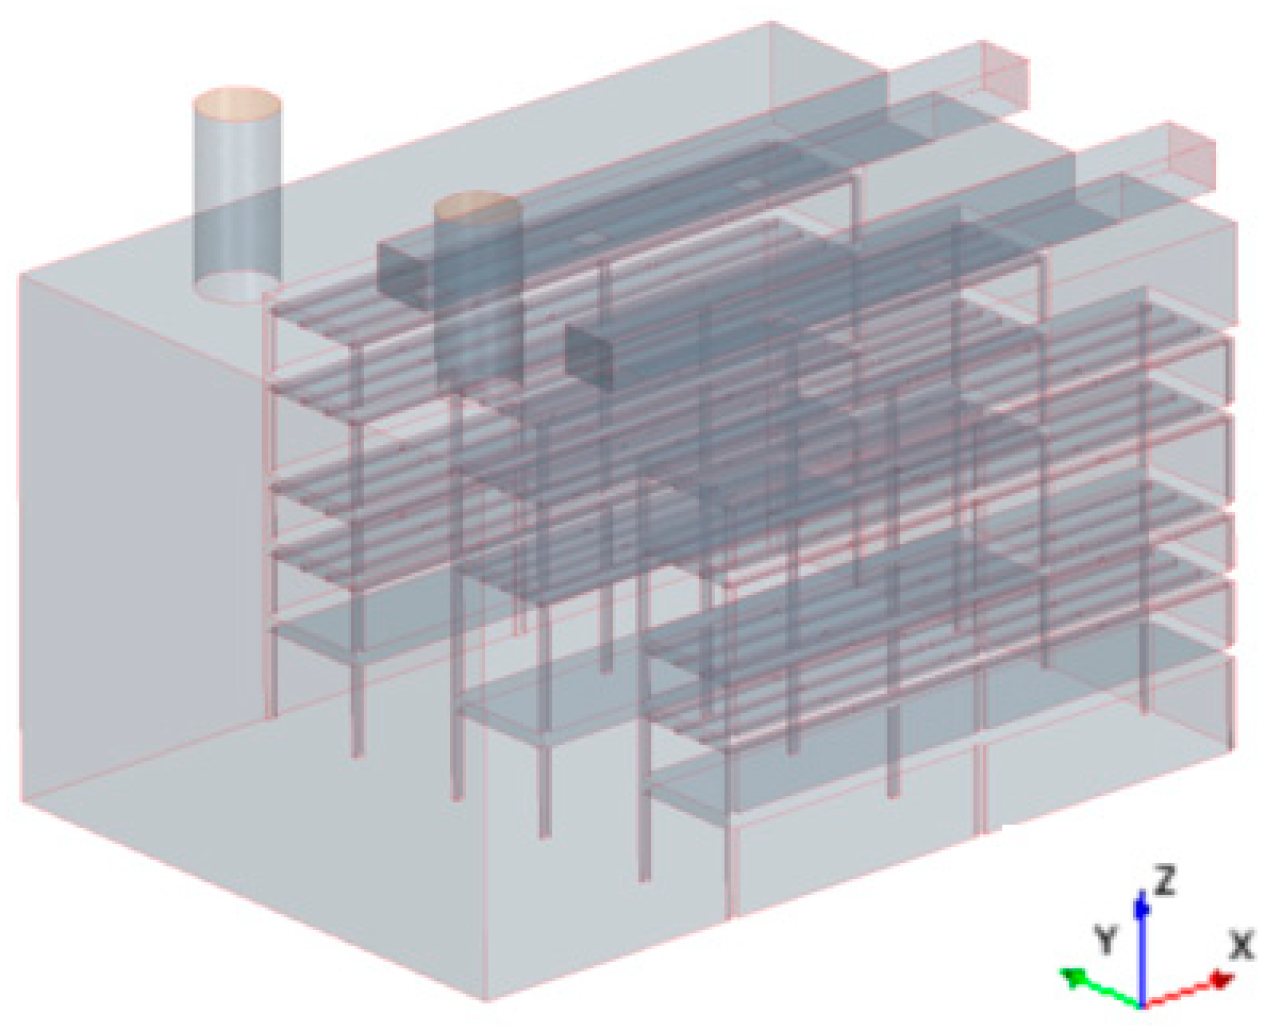
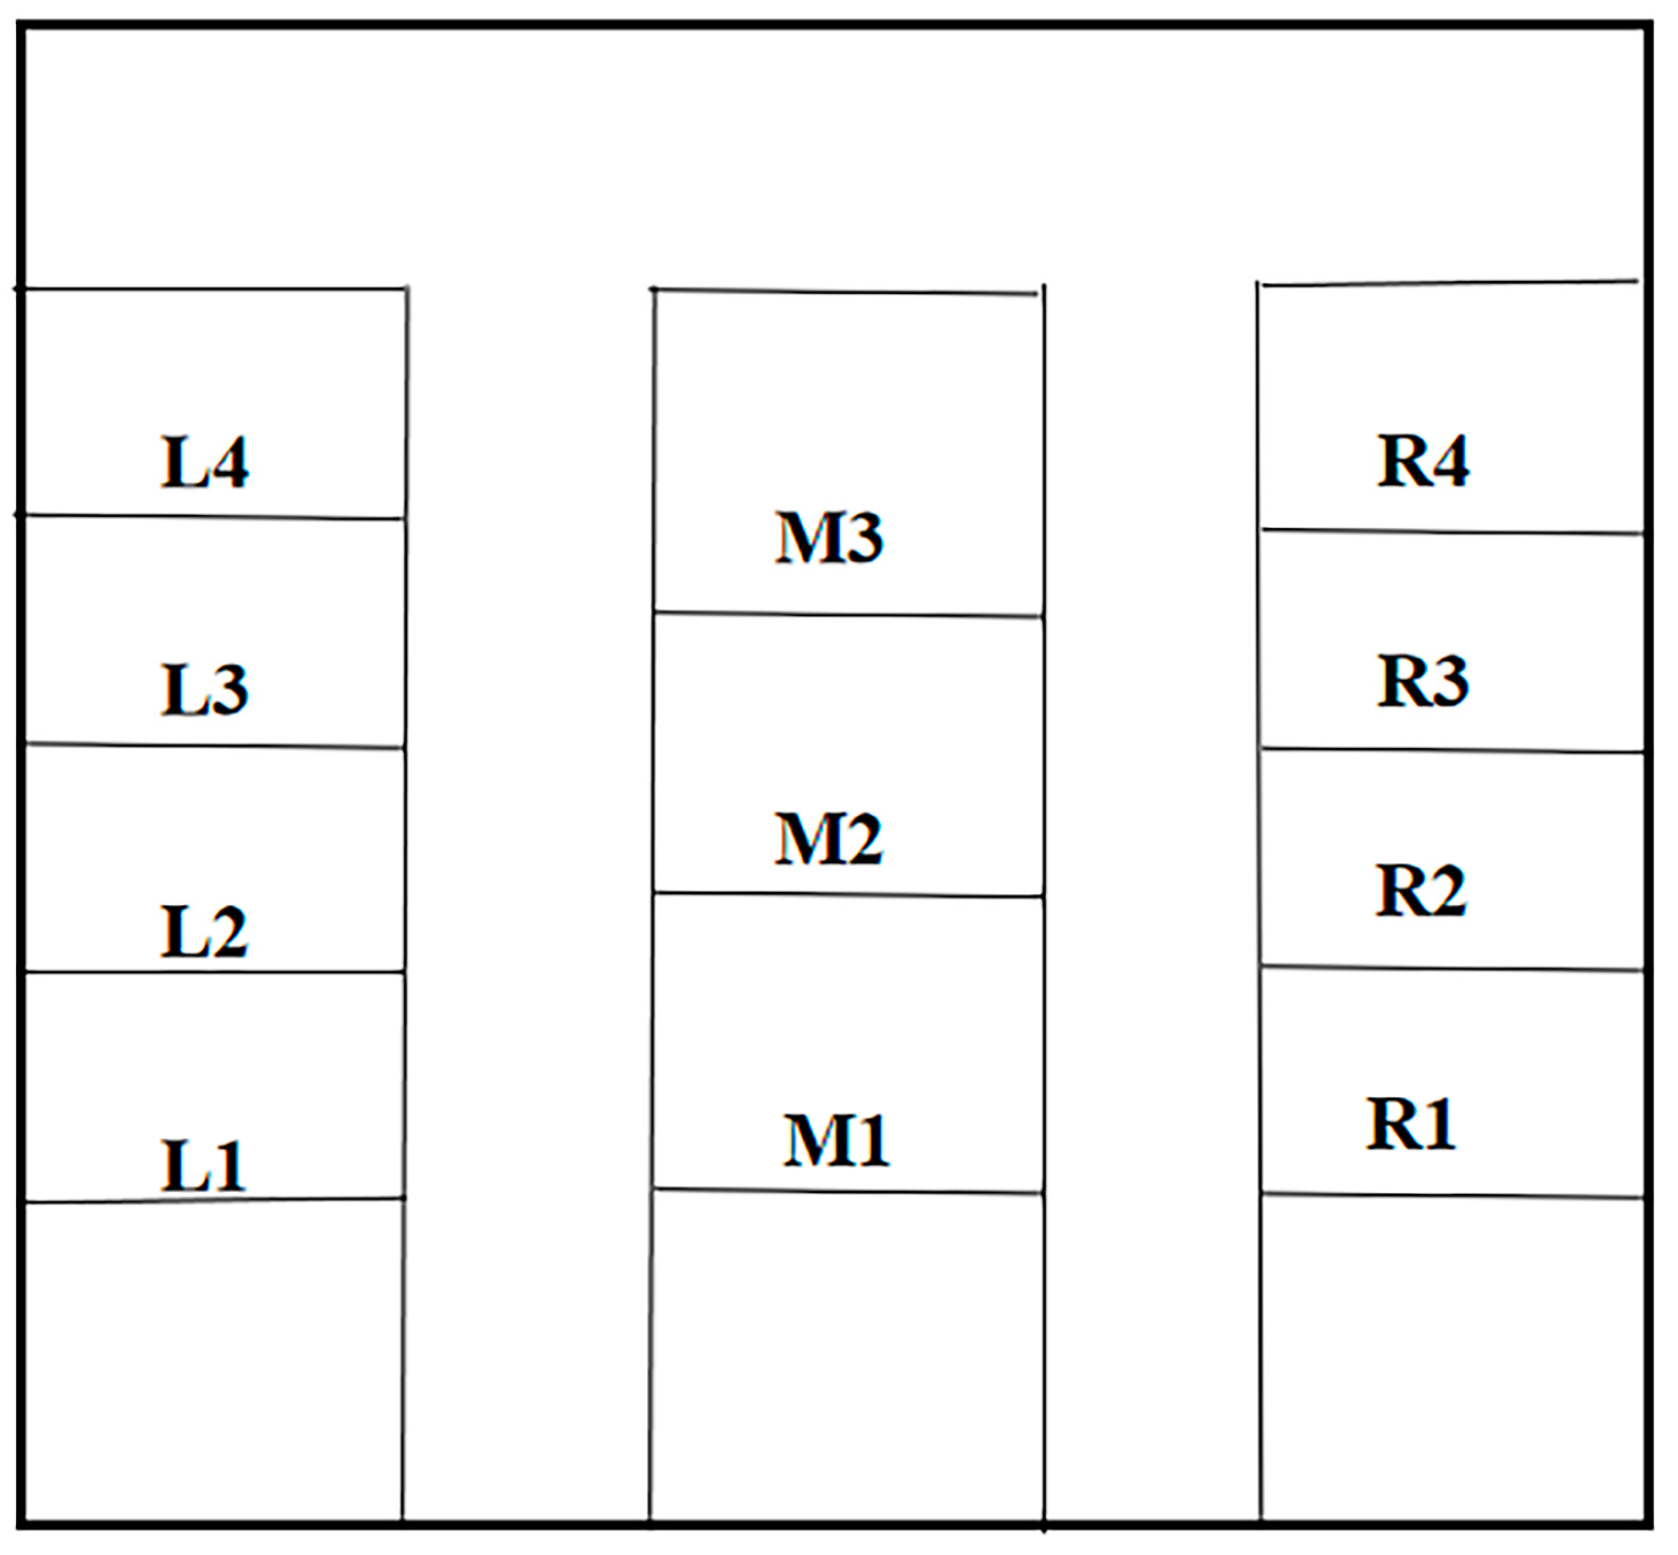
2.4.1. Geometric Model of the Plant Factory

This experiment was carried out at Jilin University’s artificial light plant factory. The plant factory’s specification is 5575 mm × 3950 mm × 3175 mm, as shown in the Figure 4. The three-dimensional model was imported into the star ccm+ module, and the spatial discretization of the flow field in the greenhouse was carried out using a cut-body grid (trim). At a spatial grid volume of 1850 w, the volume change quality of the grid cells was 0.938, thus meeting the solution requirements.

2.4.2. Control Equation

The factory LED light source is the only heat source, and the k-ε turbulence model was used for momentum equation. The governing equations include the continuity equation, the momentum equation, the energy equation, the K turbulent kinetic energy equation, and the ε dissipation rate equation, which can be expressed by general Equation (3)
( ρ φ ) t + div ( ρ φ v ) =   div ( Γ φ grad φ ) + S φ
ρ is the density, kg/m3, v is the velocity vector, m/s, Γφ is the generalized diffusion coefficient, and Sφ is the source term. When φ = 1, the equation is the continuity equation (mass conservation equation); when φ = v (u, v, ω), the equation is the momentum conservation equation, and when φ = T, the equation is the energy conservation equation, where u, v, and ω are velocity scalars in three directions respectively, and T is temperature, unit K.

2.4.3. Simulation Boundary Conditions of the Plant Factory

According to the photosynthetic physiology experiment, TS and TG are the LED light temperatures under the optimal light treatment mode during the seedling and growth stages, respectively. The gradient term used the least square method; the pressure term used the standard algorithm; and the momentum, energy, and viscosity terms all used the first-order up airflow scheme to achieve faster convergence. Boundary conditions of CFD simulations are shown in Table 3, the relaxation factor for the energy term was set to 10−6, and the rest of the terms are set to 10−3. We set the inlet as the velocity inlet, with 8 m/s as the airflow speed. Meanwhile, we set the outlet as the pressure outlet, with 0 Pa as the pressure.

3. Results

3.1. Plant Physiological Indexes

The analytic hierarchy process (Ahp) method was used to obtain the comprehensive evaluation set of the photosynthetic physiology experiment. The original indices for seedling and growth stages in Table 4 were normalized and multiplied by the Wi weight coefficient. Because the tip burn rate and nitrate levels were both negative indicators of lettuce quality, the reciprocal calculation was used after normalization. The comprehensive evaluation subset of each treatment was obtained based on the growth and physiological indexes in Table 4 and the weight coefficients of each index. In the seedling stage, the comprehensive evaluation subset B1 = (0.5847, 0.917, 0.929, 0.621, 0.983, 0.979), while in the growth stage, the comprehensive evaluation subset B2 = (0.618, 0.7976, 0.8875, 0.6648, 0.9254, 1.077). According to the B1 and B2 evaluation sets, the light pattern of the seedling stage was ranked T4 > T5 > T2 > T1 > T3 > CK1, while the light pattern of the growing stage was ranked W5 > W4 > W2 > W1 > W3 > CK2. The best light mode, TS, T4 (2R:1B, 100 μmol/m2·s), was selected during the seedling period; the best light mode, TG, W5 (4R:1B, 200 μmol/m2·s), was selected during the growth stage. Consistent with the findings of Haaak et al., low light intensity, according to the experimental results, can significantly reduce the incidence of tip burn disease while inhibiting growth. Red and blue LEDs, with a ratio between 5 and 20% for the blue light, are optimal to improve lettuce plant growth and light use efficiency. However, red and blue light sources do not significantly alleviate tip burn disease when compared to full-spectrum LED lamps [42,43].

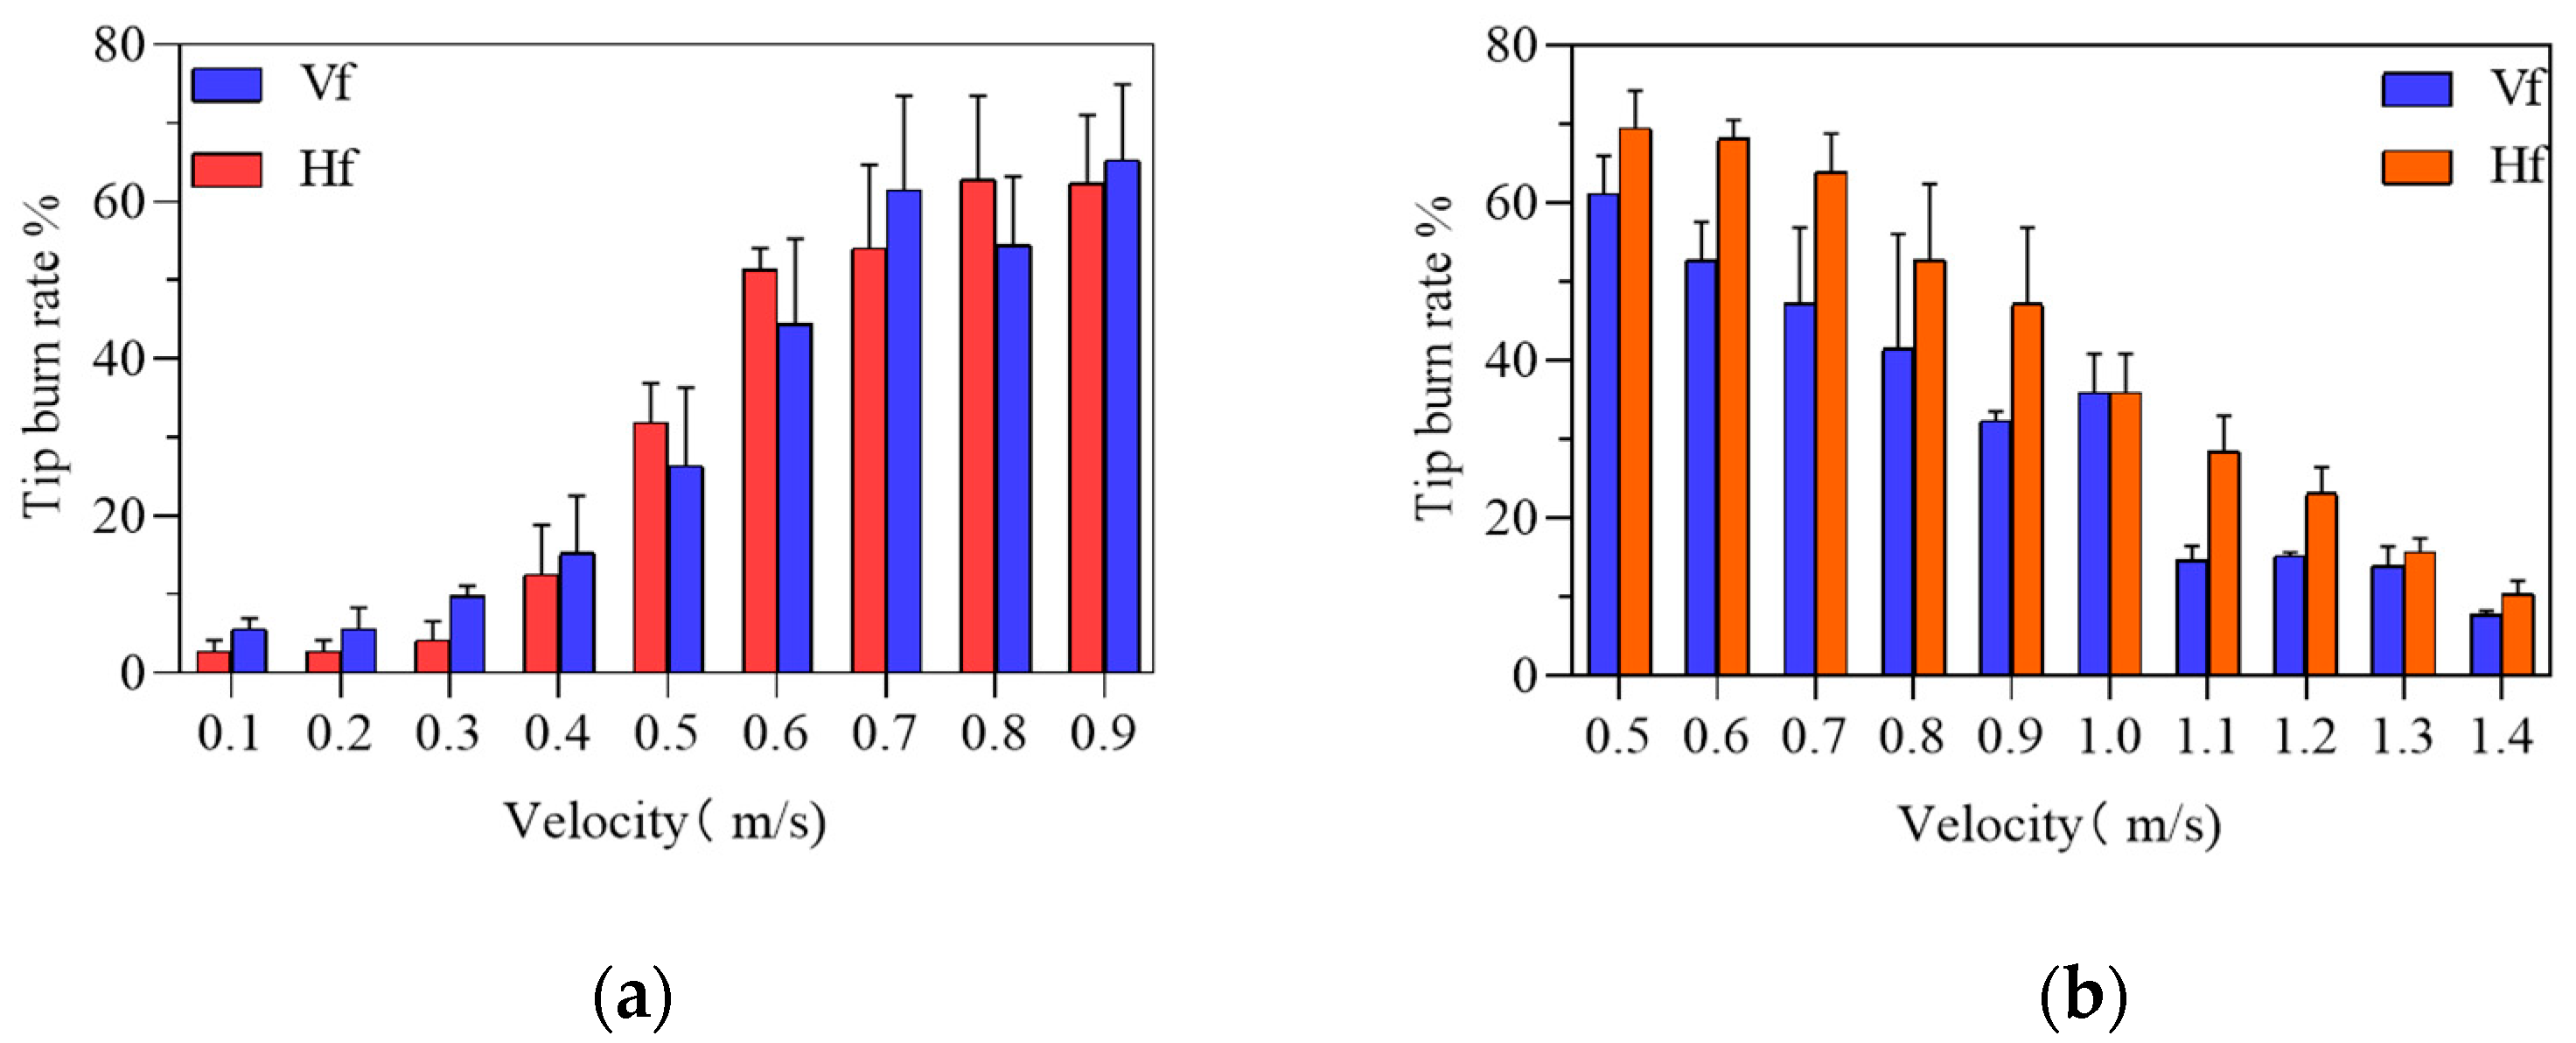
3.2. Airflow Experiment Results and Analysis

As shown in Figure 5, for the seedling stage lettuce, when the airflow speed is lower than 0.5 m/s, the tip burn rate decreases to 31.9% in the top-to-bottom vertical airflow direction and decreases to 26.4% in the horizontal airflow direction. Compared with the seedling tip burn rate under T4 (2R:1B, 100 μmol/m2 s) light treatment, the seedling tip burn rate was reduced by 64.8% under 0.5 m/s horizontal airflow and 59.3%under 0.5 m/s vertical airflow, from top to bottom. For growth stage lettuce, when the airflow speed exceeds 1.1 m/s, the tip burn rate decreases to 14.5% in the vertical airflow direction and decreases to 28.4% in the horizontal airflow direction. Compared with the growth stage tip burn rate under W5 (4R:1B, 200 μmol/m2 s) light treatment, the growth stage tip burn rate was reduced by 84.64% under 1.1 m/s horizontal airflow and 81.94% under 1.1 m/s vertical airflow, from top to bottom. Airflow speed and tip burn rate have a negative relationship during the growth stage. However, the airflow speed should be, at most, the critical value of 1.4 m/s; otherwise, the lettuce leaves will be broken, reducing plant yield and quality. In determining airflow thresholds unfavorable to the development of tip burn in lettuce, based on airflow treatment experiments, the seedling stage airflow thresholds were 0.1–0.5 m/s, and the growth stage airflow threshold was 1.1–1.4 m/s. This airflow experiment showed that appropriate airflow speed could reduce lettuce tip burn disease.

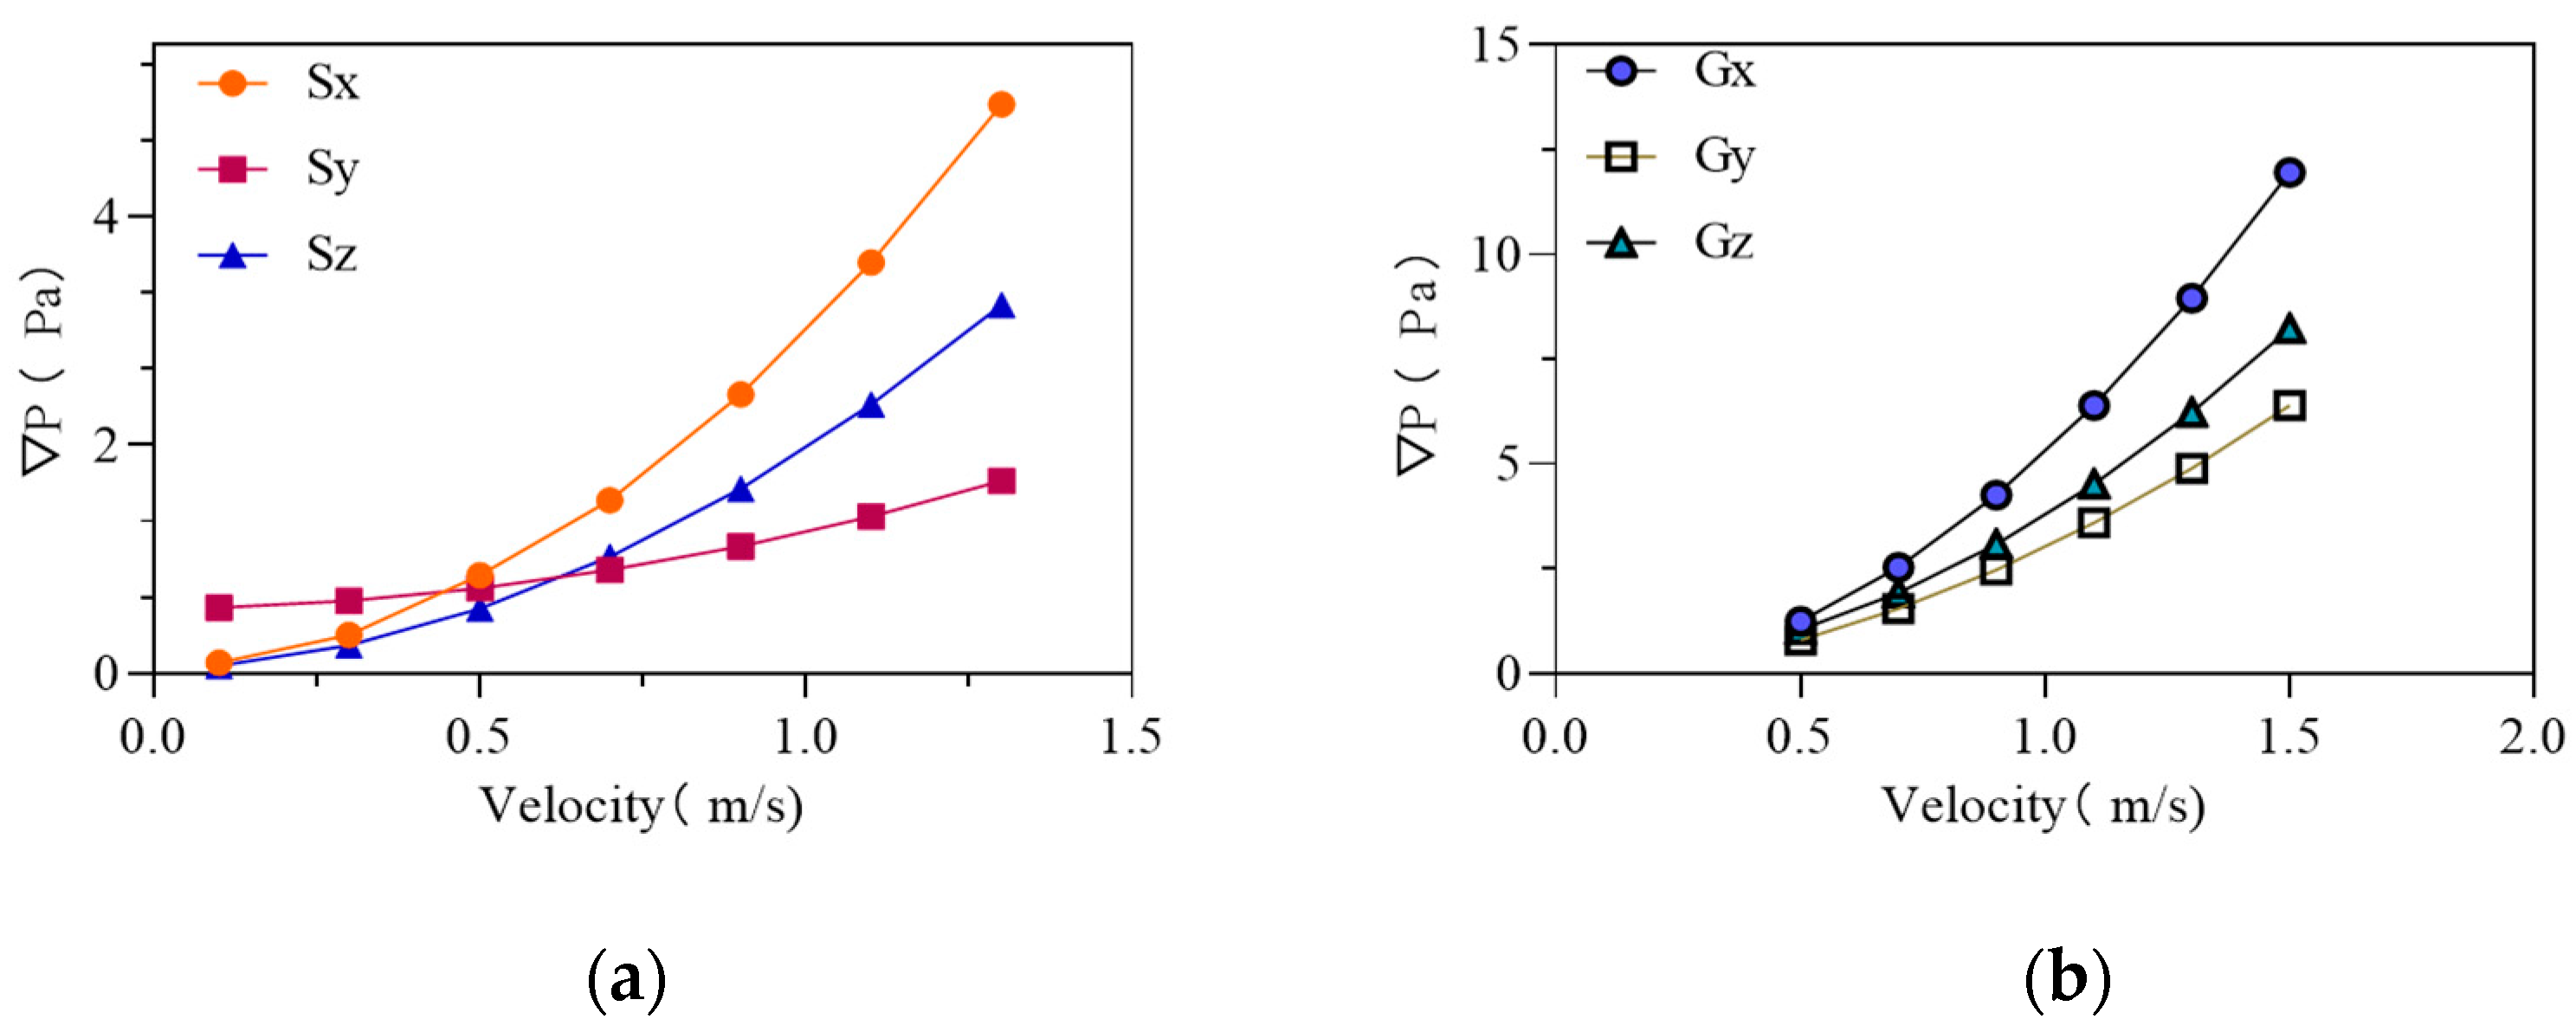
3.3. Porous Medium Parameters

The average pressure drop values at six monitoring points were obtained based on aerodynamic tests conducted in a low-speed airflow tunnel for seedlings and growing lettuce. The pressure drop curves (∇P−v) were plotted, as shown in Figure 6. Based on the pressure drop curves, we deduced the inertial and viscous drag values in three vector directions (x, y, and z) for the lettuce seedling and growth stage, as shown in Table 5.

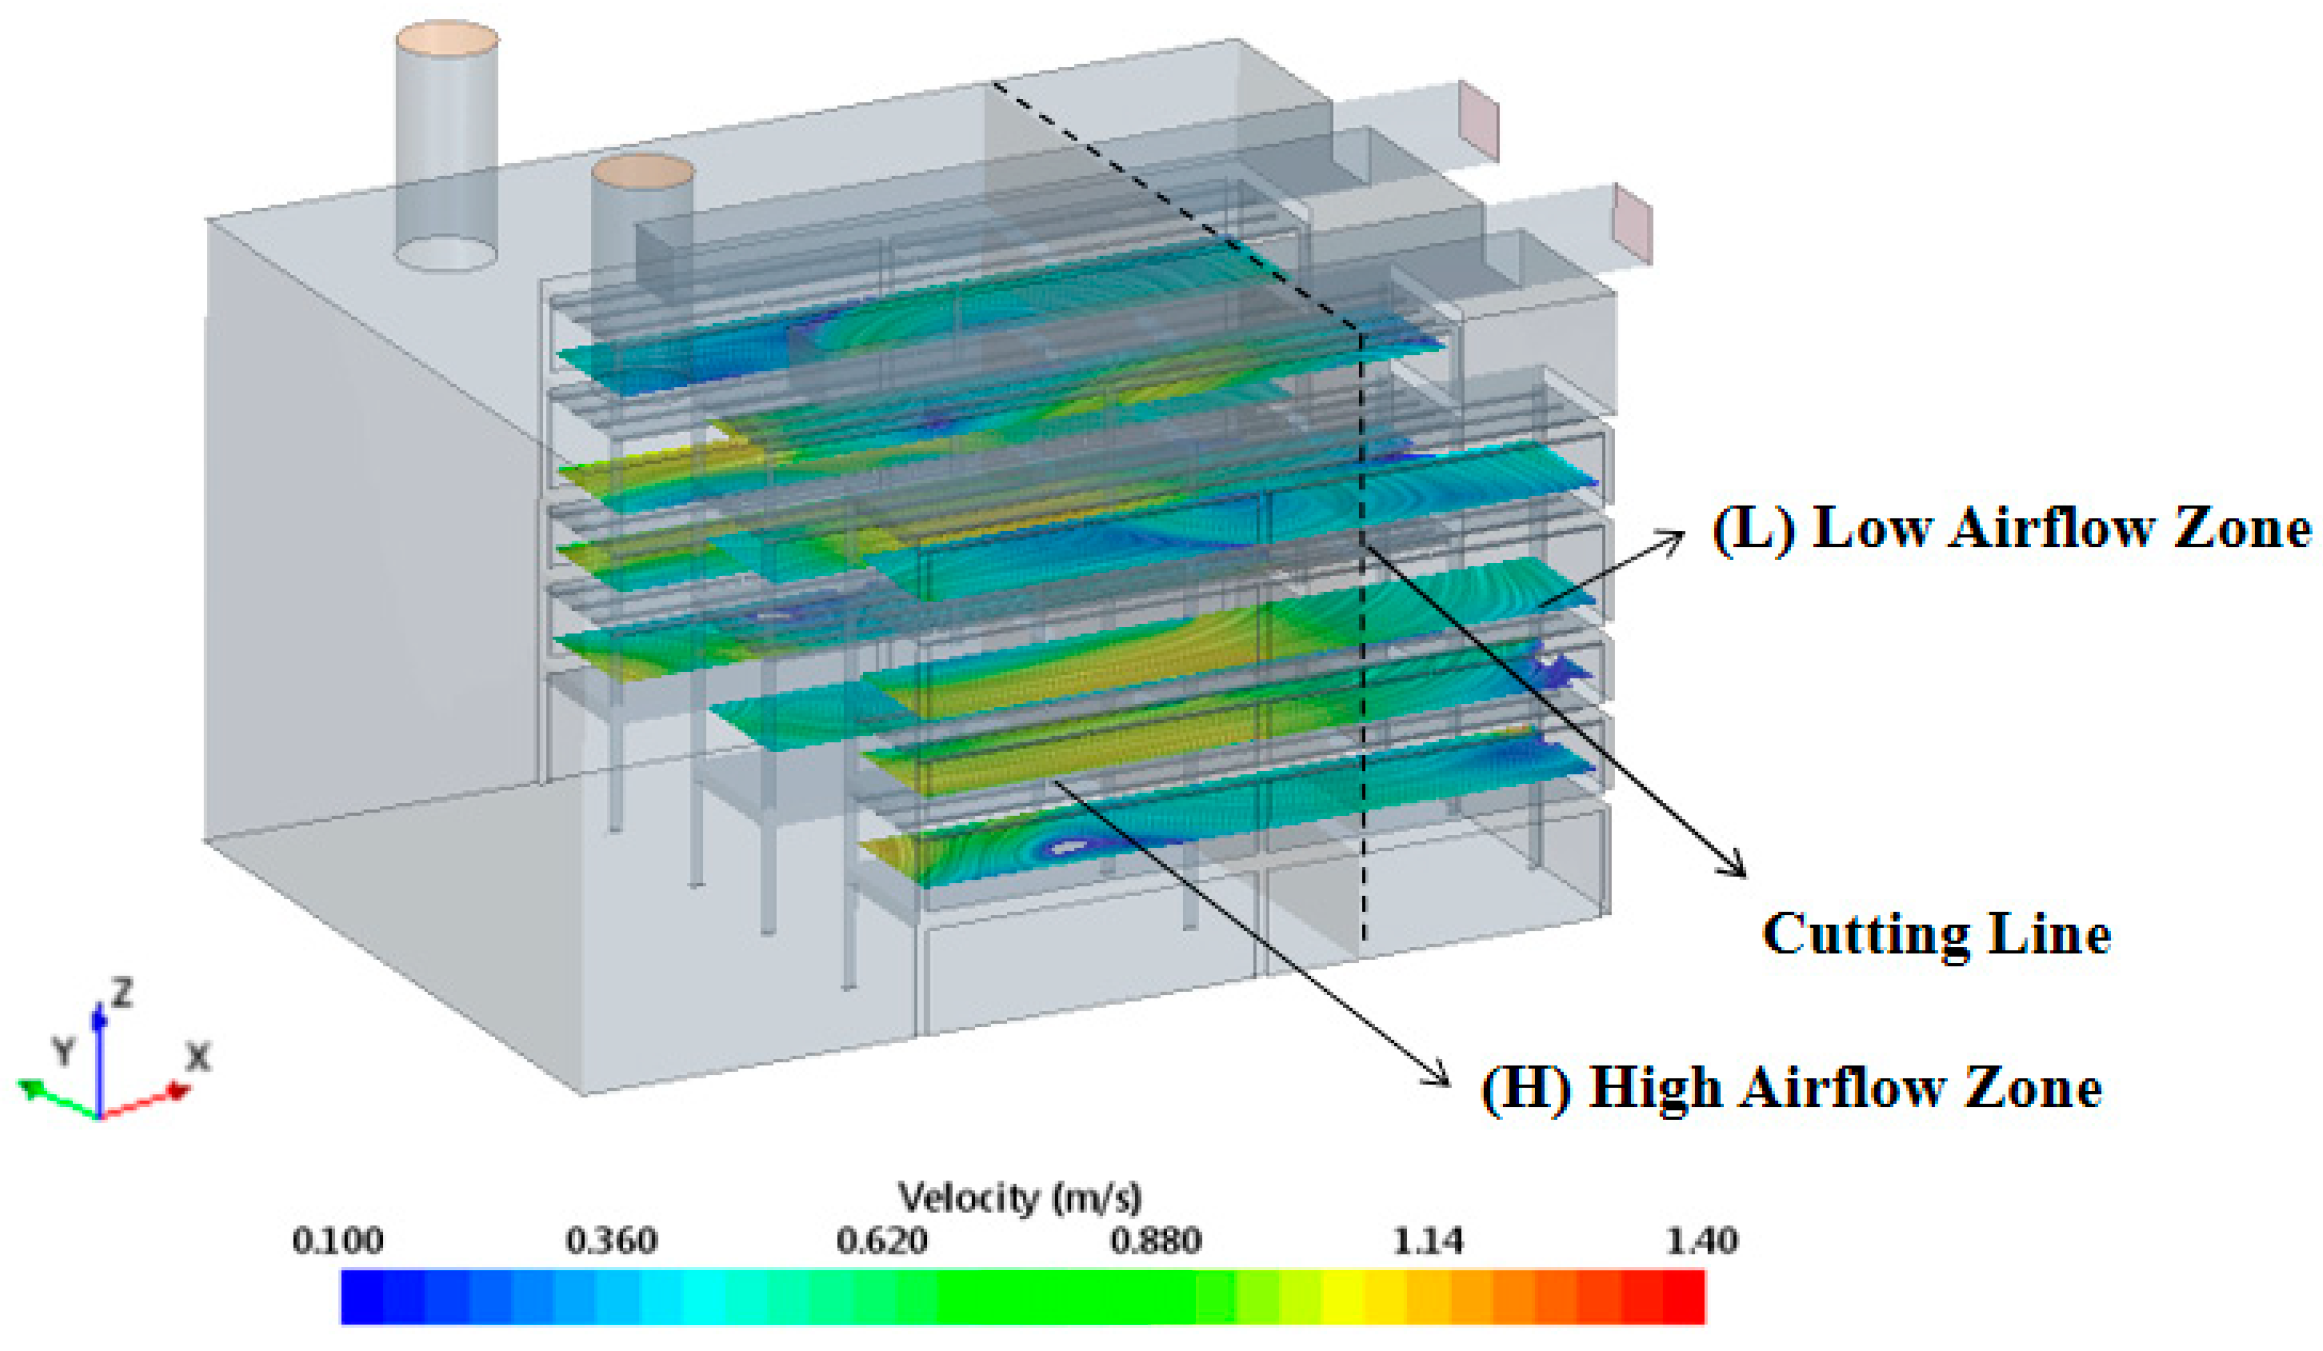
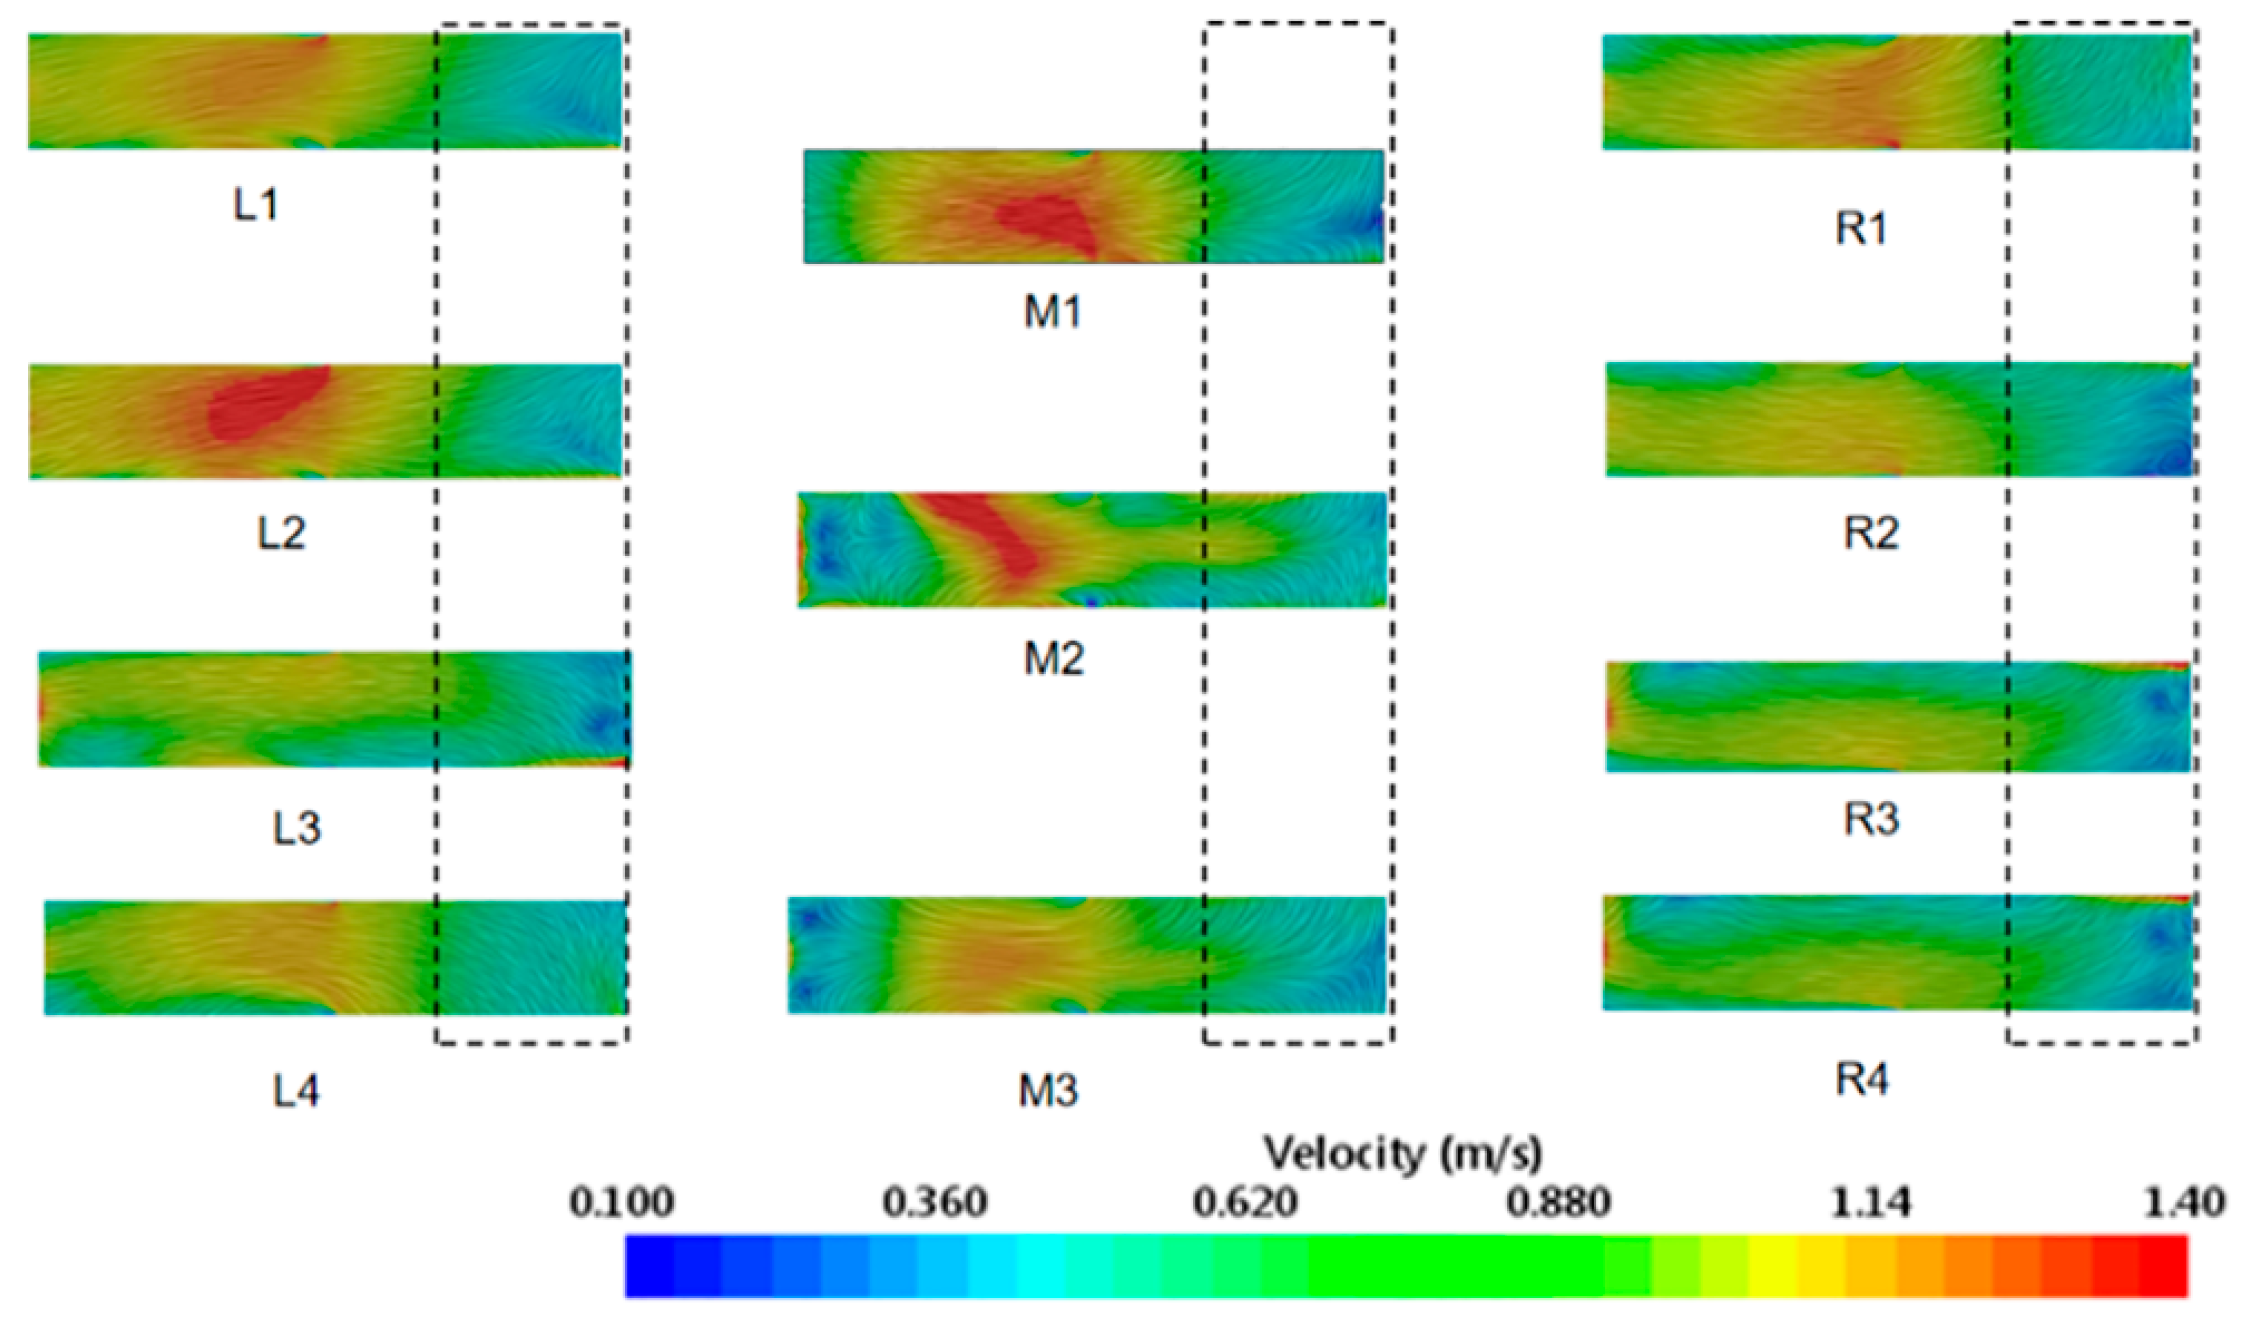
3.4. CFD Simulation and Analysis of Airflow Field

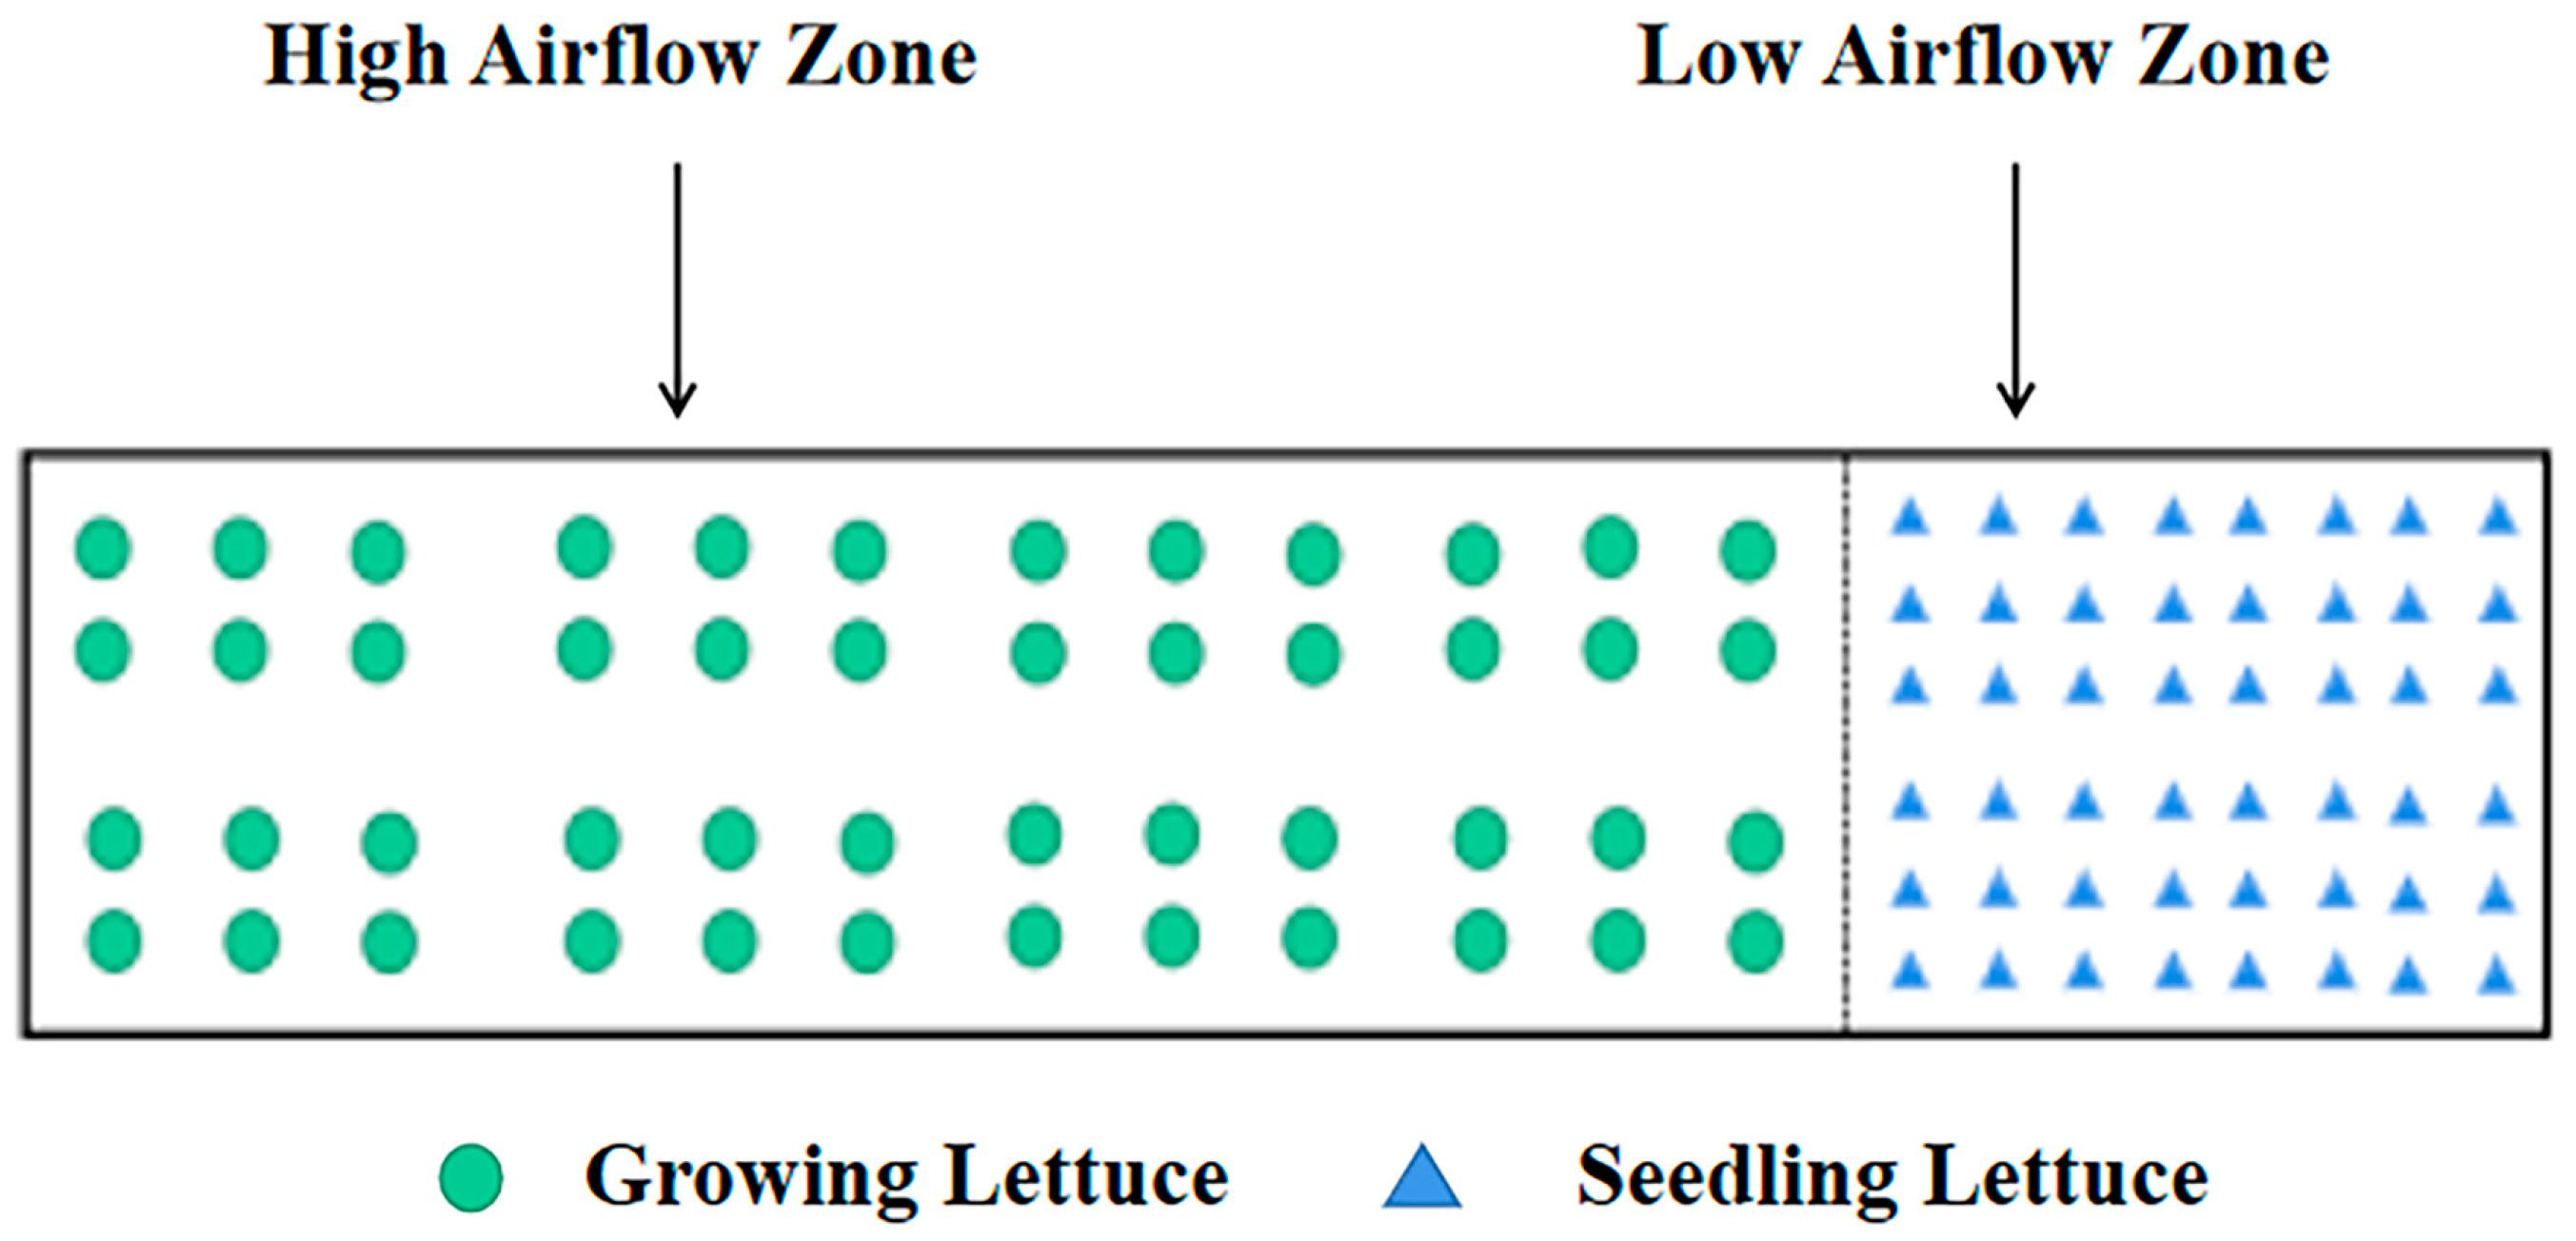
3.4.1. Optimization of Three-Dimensional Cultivation

In the airflow field of the plant factory with no load, as shown in Figure 7, the high airflow speed area is concentrated in the H (high airflow speed) area of the cultivation rack, while the low speed area is concentrated in the L (low airflow speed) area. According to the simulation results of the airflow field in the no-load plant factory, lettuce was planted in the L (low airflow speed) area during the seedling stage and the H (high airflow speed) area during the growth stage. Figure 8 depicts a planting density distribution that ensured that the number of seedlings and growth stage plants correspond to 1:1, thus facilitating the rapid cycling cultivation of lettuce under controlled environments.

3.4.2. Optimization of Airflow Field

In the H (high airflow speed) area, a porous media model for the growth stage was input and the LED lights were arranged in W5 mode (4R:1B, 200 μmol/m2 s), with a heat source temperature of 307.15 K. In the L (low airflow speed) area, a porous media model for the lettuce seedling stage was input, the LEDs were arranged in the T4 mode (2R:1B, 100 μmol/m2 s), and the heat source input temperature was 304.15 K. The rest of the boundary conditions were the same as for the no-load CFD simulation. Therefore, creating vortex areas in the back area where the air supply was opposite the heat source was simple. The dominant indoor airflow after being blocked and attenuated by the supply heat source is the updraft caused by the heat source. The axial speed of the z direction changes very little in the vertical direction of the upper part of the heat source. The updraft changed direction and was discharged from the return air outlet only after it reached the top and was subjected to the combined action of the ceiling and the return air outlet. To address the problem of the uneven distribution of airflow field zoning in the unloaded plant, a fan was installed on the left side of each cultivation frame, with the fan position shown in Figure 9 and the cultivation frames numbered as shown in Figure 10. The differential speed of the fans was adjusted according to the flow field simulation, with the specific fan speed settings shown in Table 6.
Following the differential speed adjustment of the fan at the side end of each cultivation frame, the flow field of each cultivation frame plant canopy is shown in Figure 11. The airflow comfort zone values for each cultivation frame are shown in Table 7. The average growth comfort zone as a percentage of the total low airflow speed cultivation frame at the seedling stage (low airflow speed zone) was 84.5%. At the growth stage (high airflow speed zone), the average growth comfort zone as a percentage of the total high airflow speed cultivation frame was 94.1%.

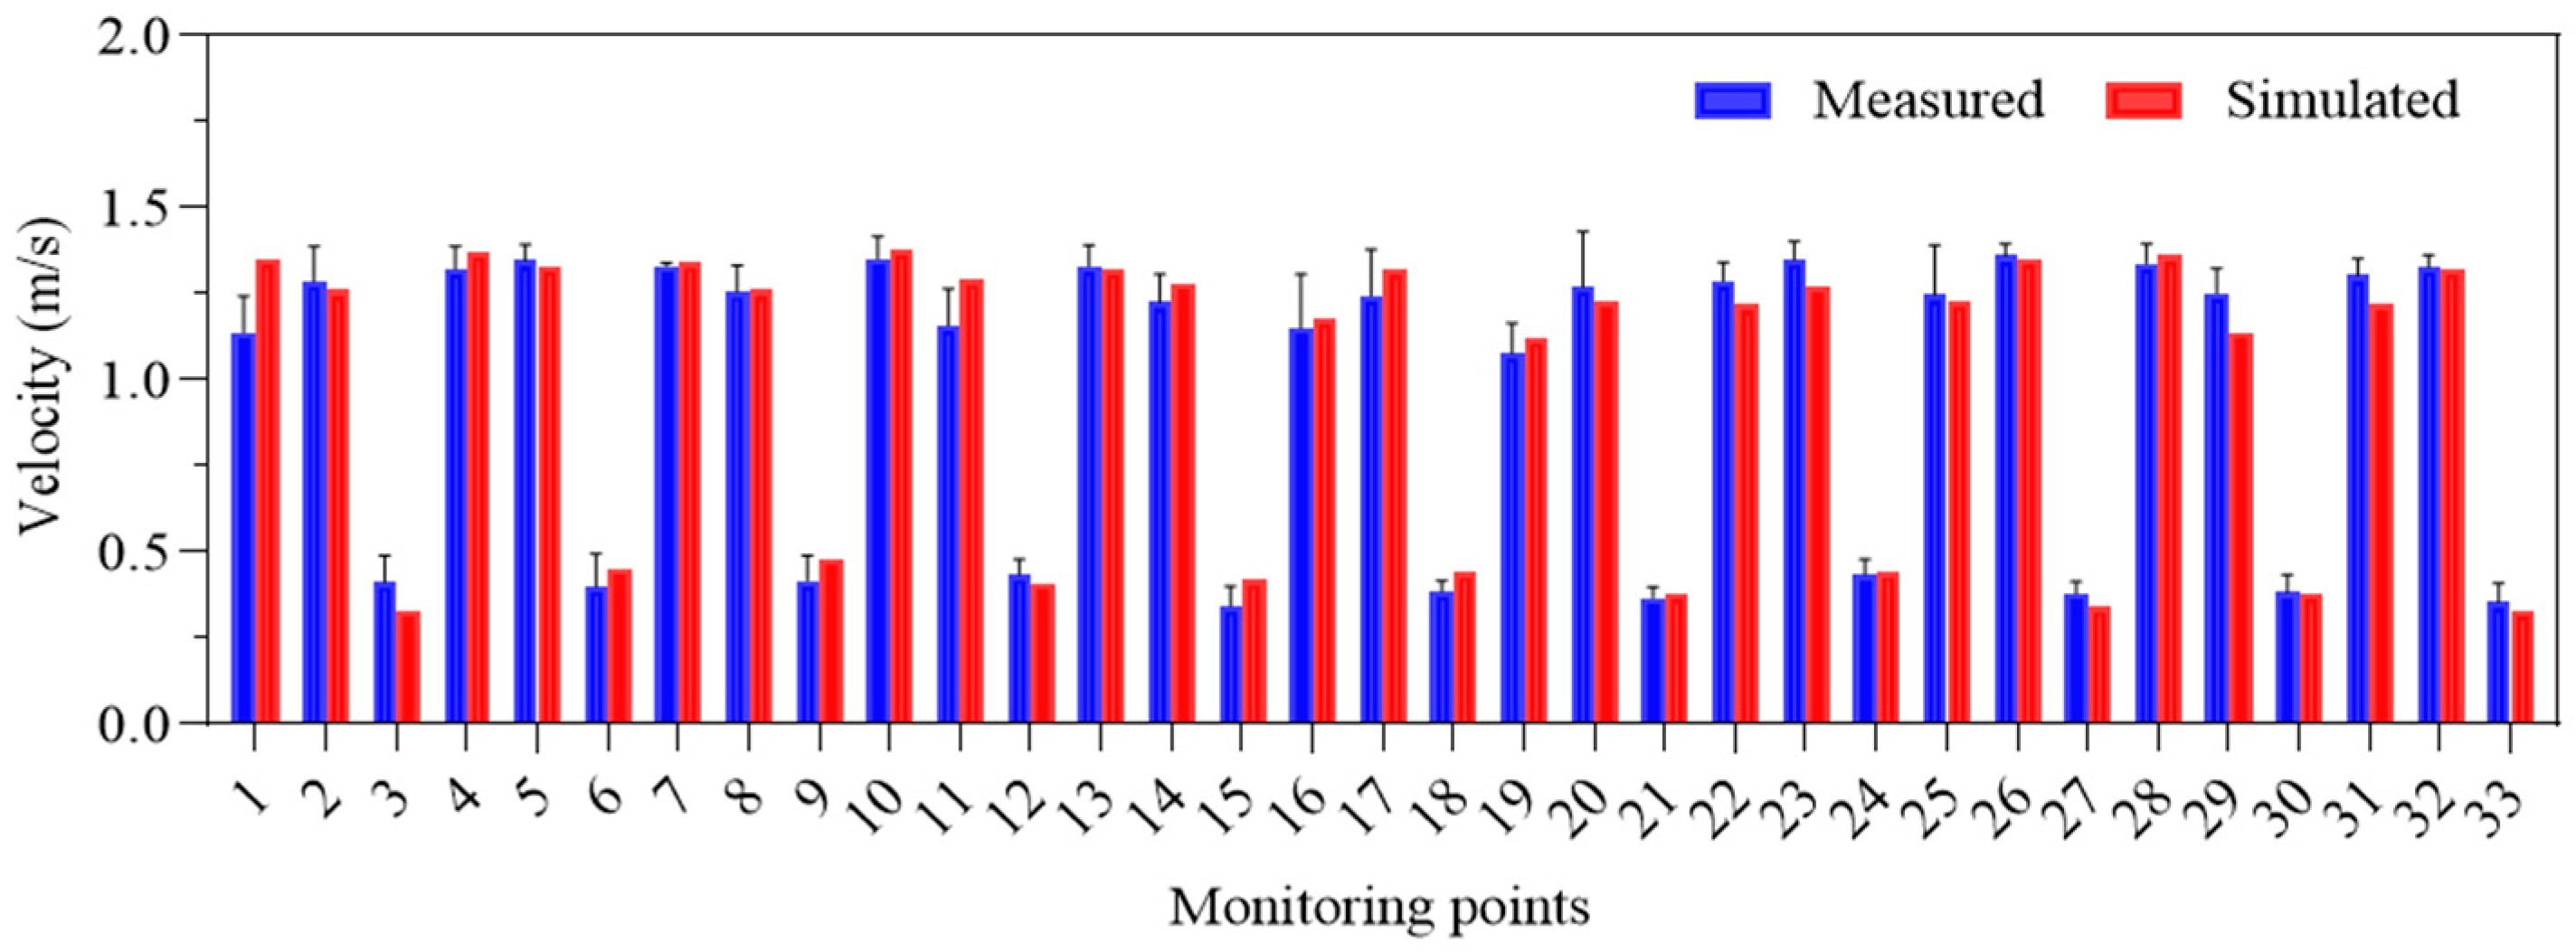
3.4.3. Verification of Simulation Results

According to Figure 12, 33 monitoring points were evenly spaced at 20 cm above the cultivation frame and measured using an RA620 anemometer. The average absolute error was 6.342%, and the simulation model was accurate and reliable.

3.5. Comparison of Tip Burn Rate of Plants before and after Optimization

Lettuce was cultivated according to the planting pattern after the HL (high airflow area and low airflow area) division. As shown in Table 8, the tip burn rate in the seedling period decreased to 26.9%, and that in the growth period, it decreased to 23.3%. Compared with the tip burn rate before optimizing the airflow field, the tip burn rate decreased by 64.3% in the seedling stage and by 69.1% in the growth stage, and the growth quality was significantly improved.
The analytic hierarchy process (Ahp) weight coefficient was used to evaluate the comprehensive quality of lettuce after optimization, and the comprehensive evaluation set of seedling stage lettuce b1 was (0.983, 1.202), and the comprehensive evaluation set of growth stage lettuce b2 was (1.077, 1.354). According to the comprehensive evaluation value, the quality of lettuce in the seedling stage and growth stage improved after optimization. Comparing the lettuce growth quality and tip burn before and after zoning, the overall growth quality at the seedling stage increased by 22.28%, and the integrated quality at the growth stage increased by 25.72%. Therefore, the optimization and improvement described in this paper could improve the problem of tip burn in plant factories.

4. Discussion

The photosynthesis experiments showed that the best comprehensive quality of seedling lettuce was achieved under T4 lighting treatment (2R:1B, 100 μmol/m2 s), and the best comprehensive quality of growing lettuce was achieved under W5 (4R:1B, 200 μmol/m2 s) lighting treatment. Although photosynthesis is integral to tip burn disease, this issue has yet to be well addressed. Meanwhile, low light intensity reduces tip burn disease and significantly impacts plant growth quality; this result is consistent with the findings of Carotti et al. [44]. Furthermore, the increase in lamp temperature, as the heat source of LED, will cause the canopy airflow to move upward. However, we expect the airflow to move into the plant canopy [45]. Therefore, appropriate LED lighting can reduce heat dissipation disturbances to the plant canopy’s airflow field, save energy, and improve plant quality and yield.
The airflow experiment showed that the lettuce tip burn rate decreased when the seedling stage’s airflow speed was 0.1–0.5 m/s and the airflow speed in the growth stage was 1.1–1.4 m/s. In contrast to other studies, such as that of Luuk et al., which merely increased the airflow speed to reduce the resistance of the plant boundary layer, we found that the plant canopy at the seedling stage required a lower airflow speed to maintain the water potential of the leaves [46]. In addition, experiments showed that, in the growth stage, vertical airflow from top to bottom was more effective than horizontal blowing in treating tip burn disease. This could be because vertical airflow could increase airflow in the plant’s canopy and relieve tip burn disease in the first leaf position. In contrast to the demand trend of airflow speed in the seedling stage and growth stage, this may be because too high an airflow speed will accelerate the leaf water potential decrease in the seedling stage, resulting in tip burn; increasing airflow speed in the growth stage can promote high humidity airflow around plants, promote plant transpiration power, and subsequently, promote plant Ca2+ transport.
The aerodynamic tests in the three xyz vector directions for lettuce in the seedling and growth stage, respectively, as well as the porous media model of lettuce in different periods, were conducted. This study showed that the viscous drag coefficient D and inertial drag coefficient C2 of porous media in lettuce at the seedling and growth stage were highly variable; thus, it was necessary to test them separately. The significant differences in porous media parameters compared to those of tomatoes and other vegetables referenced in previous studies occur because lettuce has different physical characteristics from other plants and because of the high density of lettuce cultivation in plant factories [45].
This study cultivated lettuce in the seedling stage and the growth stage in different regions. We optimized the three-dimensional cultivation structure of the plant factory based on the flow field distribution of an empty plant factory; one side’s airflow speed was high, and the other side’s airflow speed was low. In the upper high and low airflow speed areas, we set the LED illumination to 2R:1B (100 μmol/m2 s) and 4R:1B (200 μmol/m2 s), respectively. Compared with the traditional plant factory cultivation mode, our light source arrangement pattern reduces light source heat dissipation and plant factories operating costs. To further optimize the uniformity of the airflow between the various cultivation racks, the side fans of the cultivation frame are adjusted for differential speed, according to the simulation results. The airflow field can be adjusted according to the required environment of the cultivated crop, due to the versatility of the fan unit.

5. Conclusions

Intending to solve the problem of tip burn caused by non-uniform airflow distribution in existing plant factories, this study proposed a method for zoning plants based on photosynthetic physiology experiments and airflow field distribution in unladen plant factories, and further optimizing the airflow field by arranging differential fans in cultivation frames. The best comprehensive quality of seedling lettuce was achieved when the airflow speed was 0.1–0.5 m/s in T4 light mode (2R:1B, 100 μmol/m2 s), and the best comprehensive quality of growing lettuce was achieved when the airflow speed was 1.1–1.4 m/s in W5 light mode (4R:1B, 200 μmol/m2 s). The zoning optimization cultivation method and differential fan arrangement were used in this study to improve the airflow field of plant factories. After setting the differential fan to regulate the airflow field, the percentage of the suitable growth area reached 84.5% in the seedling stage and 94.1% in the growth stage. Compared with the lettuce growth quality and tip burn rate before and after zoning, the integrated quality at the seedling stage increased by 22.28% and the tip burn decreased to 26.9%; the integrated quality at the growth stage increased by 25.72%, and the tip burn decreased to 23.2%. Based on the analytic hierarchy process (Ahp) comprehensive evaluation values, it can be seen that the comprehensive quality of both the seedling and growth stages were improved after optimized cultivation. In this study, the optimization of plant cultivation methods and airflow distribution can effectively reduce the tip burn rate in the plant factory, which has a good guiding significance for the sustainable development of plant factories. Future research can quantify the energy costs and crop benefit output after zone-optimized cultivation to provide more favorable support for plant factory sustainability studies.

Author Contributions

Conceptualization, Y.H. (Yu Haibo) and L.C.; methodology, Y.H. (Yu Haibo); software, Y.H. (Yu Haibo); validation, Z.L., Y.H. (Yu Haibo) and Y.H. (Yu Haibo); formal analysis, S.Y.; investigation, L.Y.; resources, Y.H. (Yu Haibo); data curation, Y.H. (Yu Haibo); writing—original draft preparation, Y.H. (Yu Haiye); writing—review and editing, Y.H. (Yu Haiye); visualization, Y.H. (Yu Haiye); supervision, Y.H. (Yu Haiye); project administration, Y.H. (Yu Haiye) and S.Y.; funding acquisition, Y.H. (Yu Haiye), S.Y. and L.Y. All authors have read and agreed to the published version of the manuscript.

Funding

This research was funded by the National Natural Science Foundation of China (NSFC), grant numbers 32001418 and 32171913, and the Jiangsu Province and Education Ministry Co-Sponsored Synergistic Innovation Center of Modern Agriculture Equipment, grant number XTCX1006.

Conflicts of Interest

The authors declare no conflict of interest.

Abbreviations

Nomenclature
WLwhite full-spectrum LED lamp
RBred and blue light source
Sseedling stage of lettuce
Ggrowth stage of lettuce
CRconsistency ratio
λmaxlargest eigenvalue
Wiweight coefficient of each index
Dviscous drag coefficient, dimensionless
C2inertial drag coefficient, dimensionless
lthickness of the porous media domain, mm
ρ air density, kg/m3
μ air viscosity, Pa.s
Simomentum sink
vairflow velocity, m/s
v velocity vector, m/s
Γφgeneralized diffusion coefficient
SφT source term
Ttemperature, K
TSbest light LED lamp temperature in seedling stage, K
TGbest light LED lamp temperature in growth stage, K
Vftop-to-bottom vertical airflow
Hfhorizontal airflow
∇Ppressure drop, Pa
Hhigh airflow area
Llow airflow area
SOPTmodel of seedling optimization treatment
GOPTmodel of growth period optimization treatment

References

  1. Adnan, M.; Fahad, S.; Khan, I.A.; Saeed, M.; Ihsan, M.Z.; Saud, S.; Riaz, M.; Wang, D.; Wu, C. Integration of poultry manure and phosphate solubilizing bacteria improved availability of Ca bound P in calcareous soils. 3 Biotech 2019, 9, 368. [Google Scholar] [CrossRef]
  2. Adnan, M.; Fahad, S.; Zamin, M.; Shah, S.; Mian, I.A.; Danish, S.; Zafar-ul-Hye, M.; Battaglia, M.L.; Naz, R.M.M.; Saeed, B.; et al. Coupling Phosphate-Solubilizing Bacteria with Phosphorus Supplements Improve Maize Phosphorus Acquisition and Growth under Lime Induced Salinity Stress. Plants 2020, 9, 900. [Google Scholar] [CrossRef] [PubMed]
  3. Huang, L.-C. Consumer Attitude, Concerns, and Brand Acceptance for the Vegetables Cultivated with Sustainable Plant Factory Production Systems. Sustainability 2019, 11, 4862. [Google Scholar] [CrossRef] [Green Version]
  4. Lezoche, M.; Hernandez, J.E.; Diaz, M.; Panetto, H.; Kacprzyk, J. Agri-food 4.0: A survey of the Supply Chains and Technologies for the Future Agriculture. Comput. Ind. 2020, 117, 103187. [Google Scholar] [CrossRef]
  5. Inthichack, P.; Nishimura, Y.; Fukumoto, Y. Effect of potassium sources and rates on plant growth, mineral absorption, and the incidence of tip burn in cabbage, celery, and lettuce. Hortic. Environ. Biotechnol. 2012, 53, 135–142. [Google Scholar] [CrossRef]
  6. Huang, L.-C.; Chen, Y.-H.; Chen, Y.-H.; Wang, C.-F.; Hu, M.-C. Food-Energy Interactive Tradeoff Analysis of Sustainable Urban Plant Factory Production Systems. Sustainability 2018, 10, 446. [Google Scholar] [CrossRef] [Green Version]
  7. Macias-González, M.; Truco, M.J.; Han, R.; Jenni, S.; Michelmore, R.W. High-resolution genetic dissection of the major QTL for tipburn resistance in lettuce, Lactuca sativa. G3 GenesGenomesGenetics 2021, 11, jkab097. [Google Scholar] [CrossRef]
  8. Holmes, S.C.; Wells, D.E.; Pickens, J.M.; Kemble, J.M. Selection of Heat Tolerant Lettuce (Lactuca sativa L.) Cultivars Grown in Deep Water Culture and Their Marketability. Horticulturae 2019, 5, 50. [Google Scholar] [CrossRef] [Green Version]
  9. Cox, E.F.; Mckee, J.M.T.; Dearman, A.S. The Effect of Growth Rate on Tipburn Occurrence in Lettuce. J. Hortic. Sci. 1976, 51, 297–309. [Google Scholar] [CrossRef]
  10. Borkowski, J.; Dyki, B.; Oskiera, M.; Machlańska, A.; Felczyńska, A. The Prevention of Tipburn on Chinese Cabbage (Brassica rapa L. var. pekinensis (Lour.) Olson) with Foliar Fertilizers and Biostimulators. J. Hortic. Res. 2016, 24, 47–56. [Google Scholar]
  11. Uno, Y.; Okubo, H.; Itoh, H.; Koyama, R. Reduction of leaf lettuce tipburn using an indicator cultivar. Sci. Hortic. 2016, 210, 14–18. [Google Scholar] [CrossRef]
  12. Al Murad, M.; Razi, K.; Jeong, B.R.; Samy, P.M.A.; Muneer, S. Light Emitting Diodes (LEDs) as Agricultural Lighting: Impact and Its Potential on Improving Physiology, Flowering, and Secondary Metabolites of Crops. Sustainability 2021, 13, 1985. [Google Scholar] [CrossRef]
  13. Bian, Z.H.; Yang, Q.C.; Liu, W.K. Effects of light quality on the accumulation of phytochemicals in vegetables produced in controlled environments: A review: Effects of light on vegetable phytochemicals. J. Sci. Food Agric. 2015, 95, 869–877. [Google Scholar] [CrossRef] [PubMed]
  14. Cui, W.; Zhao, S.; Qian, Z.; Sun, Y.; Al-Salihi, M.; Deng, X. Influence of non-uniform electric field distribution on the atmospheric pressure air dielectric barrier discharge. Plasma Sci. Technol. 2021, 23, 75402. [Google Scholar] [CrossRef]
  15. Seungmi, M.; Kiyoun, C.; Sookyoun, K.; Kong, H.T.; Jaehyun, L. An Experimental Study on Environmental Elements and Airflow Distribution Characteristics in a Fully Artificial Plant Factory. In Proceedings of the International Conference on Convergence Technology, Seoul, Republic of Korea, 28–30 September 2011. [Google Scholar]
  16. Moon, S.-M.; Kwon, S.-Y.; Lim, J.-H. Improvement of Energy Efficiency of Plants Factory by Arranging Air Circulation Fan and Air Flow Control Based on CFD. J. Internet Comput. Serv. 2015, 16, 57–65. [Google Scholar] [CrossRef] [Green Version]
  17. Koyama, R.; Sanada, M.; Itoh, H.; Kanechi, M.; Inagaki, N.; Uno, Y. In vitro evaluation of tipburn resistance in lettuce (Lactuca sativa. L). Plant Cell Tissue Organ Cult. 2012, 108, 221–227. [Google Scholar] [CrossRef]
  18. Kitaya, Y.; Tsuruyama, J.; Kawai, M.; Shibuya, T.; Kiyota, M. Effects of Air Current on Transpiration and Net Photosynthetic Rates of Plants in a Closed Plant Production System. In Transplant Production in the 21st Century; Springer: Berlin/Heidelberg, Germany, 2000. [Google Scholar]
  19. Zhuang, R.; Li, X.; Tu, J. CFD study of the effects of furniture layout on indoor air quality under typical office ventilation schemes. Build. Simul. 2014, 7, 263–275. [Google Scholar] [CrossRef]
  20. Zhang, Y.; Kacira, M.; An, L. A CFD study on improving air flow uniformity in indoor plant factory system. Biosyst. Eng. 2016, 147, 193–205. [Google Scholar] [CrossRef]
  21. Naranjani, B.; Najafianashrafi, Z.; Pascual, C.; Agulto, I.; Chuang, P.-Y.A. Computational analysis of the environment in an indoor vertical farming system. Int. J. Heat Mass Transf. 2022, 186, 122460. [Google Scholar] [CrossRef]
  22. Chen, J.; Jin, L.; Yang, B.; Chen, Z.; Zhang, G. Influence of the Internal Structure Type of a Large-Area Lower Exhaust Workbench on Its Surface Air Distribution. Int. J. Environ. Res. Public Health 2022, 19, 11395. [Google Scholar] [CrossRef]
  23. Cheng, Q.; Wu, W.; Li, H.; Zhang, G.; Li, B. CFD study of the influence of laying hen geometry, distribution and weight on airflow resistance. Comput. Electron. Agric. 2018, 144, 181–189. [Google Scholar] [CrossRef]
  24. Kozai, T. Resource use efficiency of closed plant production system with artificial light: Concept, estimation and application to plant factory. Proc. Jpn. Acad. Ser. B 2013, 89, 447–461. [Google Scholar] [CrossRef] [PubMed] [Green Version]
  25. Fang, H.; Li, K.; Wu, G.; Cheng, R.; Zhang, Y.; Yang, Q. A CFD analysis on improving lettuce canopy airflow distribution in a plant factory considering the crop resistance and LEDs heat dissipation. Biosyst. Eng. 2020, 200, 1–12. [Google Scholar] [CrossRef]
  26. Kim, K.; Yoon, J.-Y.; Kwon, H.-J.; Han, J.-H.; Eek Son, J.; Nam, S.-W.; Giacomelli, G.A.; Lee, I.-B. 3-D CFD analysis of relative humidity distribution in greenhouse with a fog cooling system and refrigerative dehumidifiers. Biosyst. Eng. 2008, 100, 245–255. [Google Scholar] [CrossRef]
  27. Lim, T.-G.; Kim, Y.H. Analysis of Airflow Pattern in Plant Factory with Different Inlet and Outlet Locations using Computational Fluid Dynamics. J. Biosyst. Eng. 2014, 39, 310–317. [Google Scholar] [CrossRef] [Green Version]
  28. Baek, M.-S.; Kwon, S.-Y.; Lim, J.-H. Improvement of the Crop Growth Rate in Plant Factory by Promoting Air Flow inside the Cultivation Improvement of the Crop Growth Rate in Plant Factory by Promoting Air Flow inside the Cultivation. Int. J. Smart Home 2016, 10, 63–74. [Google Scholar] [CrossRef]
  29. Ahmed, Q.C. Lettuce plant growth and tipburn occurrence as affected by airflow using a multi-fan system in a plant factory with artificial light. J. Therm. Biol. 2020, 88, 102496. [Google Scholar] [CrossRef]
  30. Li, K.; Fang, H.; Zou, Z.; Cheng, R. Optimization of rhizosphere cooling airflow for microclimate regulation and its effects on lettuce growth in plant factory. J. Integr. Agric. 2021, 20, 2680–2695. [Google Scholar] [CrossRef]
  31. Ohara, H.; Hirai, T.; Kouno, K.; Nishiura, Y. Automatic Plant Cultivation System (Automated Plant Factory). Environ. Control Biol. 2015, 53, 93–99. [Google Scholar] [CrossRef] [Green Version]
  32. Kuno, Y.; Shimizu, H.; Nakashima, H.; Miyasaka, J.; Ohdoi, K. Effects of Irradiation Patterns and Light Quality of Red and Blue Light-Emitting Diodes on Growth of Leaf Lettuce (Lactuca sativa L.“Greenwave”). Environ. Control Biol. 2017, 55, 129–135. [Google Scholar] [CrossRef] [Green Version]
  33. Lee, M.; Xu, J.; Wang, W.; Rajashekar, C.B. The Effect of Supplemental Blue, Red and Far-Red Light on the Growth and the Nutritional Quality of Red and Green Leaf Lettuce. Am. J. Plant Sci. 2019, 10, 2219–2235. [Google Scholar] [CrossRef] [Green Version]
  34. Hytönen, T.; Pinho, P.; Rantanen, M.; Kariluoto, S.; Lampi, A.; Edelmann, M.; Joensuu, K.; Kauste, K.; Mouhu, K.; Piironen, V.; et al. Effects of LED light spectra on lettuce growth and nutritional composition. Light. Res. Technol. 2018, 50, 880–893. [Google Scholar] [CrossRef]
  35. Shalaka, S.; Cumming, J.R.; Collart, F.R.; Noirot, P.H.; Larsen, P.E. Pseudomonas fluorescens Transportome Is Linked to Strain-Specific Plant Growth Promotion in Aspen Seedlings under Nutrient Stress. Front. Plant Sci. 2017, 8, 348. [Google Scholar]
  36. Cagri Tolga, A.; Basar, M. The assessment of a smart system in hydroponic vertical farming via fuzzy MCDM methods. J. Intell. Fuzzy Syst. 2021, 42, 1–12. [Google Scholar] [CrossRef]
  37. Xiao, C.; Zou, H.; Fan, J.; Zhang, F.; Li, Y.; Sun, S.; Pulatov, A. Optimizing irrigation amount and fertilization rate of drip-fertigated spring maize in northwest China based on multi-level fuzzy comprehensive evaluation model. Agric. Water Manag. 2021, 257, 107157. [Google Scholar] [CrossRef]
  38. Han, L. Foliar application of zinc alleviates the heat stress of pakchoi (Brassica chinensis L.). J. Plant Nutr. 2020, 43, 194–213. [Google Scholar] [CrossRef]
  39. Bekraoui, A.; Chakir, S.; Fatnassi, H.; Mouqallid, M.; Majdoubi, H. Climate Behaviour and Plant Heat Activity of a Citrus Tunnel Greenhouse: A Computational Fluid Dynamic Study. AgriEngineering 2022, 4, 1095–1115. [Google Scholar] [CrossRef]
  40. Molina-Aiz, F.D.; Valera, D.L.; Álvarez, A.J.; Madueño, A. A Wind Tunnel Study of Airflow through Horticultural Crops: Determination of the Drag Coefficient. Biosyst. Eng. 2006, 93, 447–457. [Google Scholar] [CrossRef]
  41. Jazouli, M.E.; Lekouch, K.; Wifaya, A.; Gourdo, L.; Bouirden, L. CFD Study of Airflow and Microclimate Patterns Inside a Multispan Greenhouse. WSEAS Trans. Fluid Mech. 2021, 16, 102–108. [Google Scholar] [CrossRef]
  42. Haaab, C.; Tong, Y.; Yang, Q. Optimal control of environmental conditions affecting lettuce plant growth in a controlled environment with artificial lighting: A review. S. Afr. J. Bot. 2020, 130, 75–89. [Google Scholar]
  43. Xu, W.; Nguyen DT, P.; Sakaguchi, S.; Akiyama, T.; Tsukagoshi, S.; Feldman, A.; Lu, N. Relation between relative growth rate and tipburn occurrence of romaine lettuce under different light regulations in a plant factory with LED lighting. Eur. J. Hortic. Sci. 2020, 85, 351–361. [Google Scholar] [CrossRef]
  44. Carotti, L.; Graamans, L.; Puksic, F.; Butturini, M.; Stanghellini, C. Plant Factories Are Heating Up: Hunting for the Best Combination of Light Intensity, Air Temperature and Root-Zone Temperature in Lettuce Production. Front. Plant Sci. 2021, 11, 592171. [Google Scholar] [CrossRef] [PubMed]
  45. Morgan Pattison, P.; Hansen, M.; Tsao, J.Y. LED lighting efficacy: Status and directions. Comptes Rendus Phys. 2018, 19, 134–145. [Google Scholar] [CrossRef]
  46. Graamans, L.; van den Dobbelsteen, A.; Meinen, E.; Stanghellini, C. Plant factories; crop transpiration and energy balance. Agric. Syst. 2017, 153, 138–147. [Google Scholar] [CrossRef]
Figure 1. Photosynthetic physiology experiment schedule.
Sustainability 15 05607 g001
Figure 2. The hierarchical chart of the comprehensive quality of lettuce.
Sustainability 15 05607 g002
Figure 3. (a) Porous medium model of seedling stage, (▲) is seedling lettuce; (b) porous medium model of growth stage lettuce, (●) is growth stage lettuce; (c) layout of monitoring points, (■) is the measurement point; (d) airflow direction of aerodynamic experiments.
Sustainability 15 05607 g003
Figure 4. Geometric model of the plant factory.
Sustainability 15 05607 g004
Figure 5. Airflow test: (a) seedling stage airflow experiment, (b) growth stage airflow experiment. Vf is the top-to-bottom vertical airflow; Hf is the horizontal airflow.
Sustainability 15 05607 g005
Figure 6. Plant (∇P−v) curves: (a) seedling stage lettuce (∇P−v) curve, (b) growth stage lettuce (∇P−v) curve. Sx, Sy, and Sz are the pressure drop curves of the seedling porous media model in the xyz vector direction, respectively; Gx, Gy, and Gz are the pressure drop curves of the growth period porous media model in the xyz vector direction, respectively.
Sustainability 15 05607 g006
Figure 7. Schematic diagram of high and low airflow zones.
Sustainability 15 05607 g007
Figure 8. Cultivation pattern diagram. The seedling zone (low airflow speed zone) planting density is twice as high as the growing period (high airflow speed zone) planting density, and the seedling zone (low airflow speed zone) planting area is 0.5 times the growing period (high airflow speed zone) planting area.
Sustainability 15 05607 g008
Figure 9. Vector diagram of optimized airflow field.
Sustainability 15 05607 g009
Figure 10. Cultivation frame side view.
Sustainability 15 05607 g010
Figure 11. Vector diagram of cultivation frame canopy airflow field. The dotted line represents the low airflow speed zone; the rest of the area is the high airflow speed zone.
Sustainability 15 05607 g011
Figure 12. Comparison of monitoring points between measured value and simulated value.
Sustainability 15 05607 g012
Table 1. Factors and levels of photosynthetic physiology experiment.
TreatmentLight QualityLight
Intensity
(μmol/m2·s)
TreatmentLight QualityLight
Intensity
(μmol/m2·s)
CK1WL50 CK2WL100
T1WL100 W1WL150
SeedlingT2WL150GrowthW2WL200
StageT32R:1B50StageW34R:1B100
T42R:1B100 W44R:1B150
T52R:1B150 W54R:1B200
CK1 is the seedling control group; CK2 is the growth stage control group; WL is the white full-spectrum LED lamp; RB is the red and blue light source, and the different coefficients of RB prefix represent the ratio of red and blue light sources.
Table 2. Judgment matrix and consistency test.
T1T2 Wi
T111 0.5000
T211 0.5000
λmax = 4.1155CR = 0.0432
T1C1C2C3C4
C117510.0789
C21/7151/30.1049
C31/5211/30.0534
C413310.2628
λmax = 4.2654CR = 0.0994
T2C5C6C7C8
C51331/20.2410
C61/3111/30.0839
C71/3111/30.0665
C823310.1087
C1: Leaf area; C2: Tip burn rate; C3: plant height; C4: fresh weight; C5: Spad; C6:AsA; C7: soluble sugar; C8: nitrate; λmax is largest eigenvalue; Wi is weight coefficient of each index.
Table 3. Boundary conditions of CFD simulations.
Fluid: AirTurbulent Flow
Inlet airflow temperature: 293.5 K
LED lampTSTG
Viscous modelk-ε
BoundaryTypeSettings
InletVelocity Inlet8 m/s
OutletPressure OutletGauge pressure: 0 Pa
PlafondWallInsulation
WallWallInsulation
FloorWallInsulation
Lamp wallWallInsulation
TS is lamp temperature for optimal light treatment at the seedling stage; TG is lamp temperature for optimal light treatment at growth stage.
Table 4. Ecophysiological indexes of lettuce.
TreatmentLeaf Area
(cm2)
Tip Burn Rate(%)Plant
Height
(cm)
Fresh
Weight
(g)
SpadAsA
(mg/g)
Soluble
Sugar
(mg/g)
Nitrate
(mg/kg)
SCK115.39 ± 2.95 d76.0 ± 9.0 b5.86 ± 0.30 c1.78 ± 0.87 c16.32 ± 3.17 c0.13 ± 0.03 d0.53 ± 0.12 b384.3 ± 11.1 a
T128.49 ± 4.70 b91.1 ± 4.5 a8.25 ± 0.32 a4.48 ± 1.35 a22.92 ± 2.54 b0.24 ± 0.08 b1.45 ± 0.16 a277.8 ± 8.3 d
T221.34 ± 4.78 c92.2 ± 5.5 a7.51 ± 0.19 b4.36 ± 0.64a b23.93 ± 2.08 ab0.23 ± 0.02 b1.48 ± 0.18 a287.9 ± 5.8 c
T316.73 ± 2.57 d75.1 ± 11.4 b5.59 ± 0.28 d2.28 ± 0.63 c15.47 ± 2.66 c0.16 ± 0.03 c0.55 ± 0.10 b373.1 ± 16.8 b
T432.55 ± 7.48 a91.2 ± 6.4 a8.42 ± 0.26 a4.46 ± 0.92 a23.40 ± 2.56 b0.28 ± 0.02 a1.51 ± 0.15 a280.2 ± 13.1 cd
T529.37 ± 4.34 ab92.5 ± 8.4 a7.48 ± 0.29 b3.67 ± 1.02 b25.40 ± 2.66 a0.29 ± 0.03 a1.51 ± 0.15 a280.3 ± 6.2 cd
GCK283.89 ± 2.73 e77.5 ± 3.5 b12.37 ± 0.54 d21.54 ± 1.75 f21.20 ± 3.41 c0.17 ± 0.03 d0.83 ± 0.15 f4634.7 ± 10.4 a
W1116.72 ± 3.73 c91.2 ± 6.4 a14.60 ± 0.49 c26.60 ± 1.23 d30.26 ± 3.36 b0.29 ± 0.05 c1.38 ± 0.11 d3683.4 ± 11.9 c
W2126.13 ± 3.12 b93.3 ± 6.1 a14.87 ± 0.30 c33.38 ± 1.54 c31.58 ± 2.74 b0.34 ± 0.11 b1.63 ± 0.14 c388.7 ± 7.9 d
W393.34 ± 2.01 d77.5 ± 7.1 b12.11 ± 0.49 d24.71 ± 1.15 e20.42 ± 3.51 c0.21 ± 0.04 d1.16 ± 0.16 e4445.4 ± 11.8 b
W4125.71 ± 4.26 b91.3 ± 8.9 a17.99 ± 0.36 a34.78 ± 1.39 b31.83 ± 3.28 b0.30 ± 0.04 c1.79 ± 0.17 b2965.3 ± 6.2 e
W5140.20 ± 4.81 a92.3 ± 8.3 a16.67 ± 0.41 b38.94 ± 1.62 a46.24 ± 3.49 a0.39 ± 0.04 a1.94 ± 0.17 a2649.7 ± 8.4 f
Different letters indicate significant difference among treatments (p < 0.05). S is seedling stage lettuce, G is growth stage lettuce, the same as below.
Table 5. Parameters for porous medium model.
Seedling StageGrowth Stage
xyzxyz
D1.454 × 1040.97 × 1045.66 × 1040.6238 × 10420.85 × 1049.199 × 104
C213.1054.17214.424.615.49658.26
D is the viscous drag coefficient; C2 is the inertial drag coefficient momentum.
Table 6. Differential regulated fan.
L1L2L3L4M1M2M3R1R2R3R4
Fan Speed m/s3.273.423.784.233.984.124.893.273.423.784.23
Table 7. Percentage of the cultivation frame comfort zone.
L1L2L3L4M1M2M3R1R2R3R4Weighted Mean
S89.7%92.1%78.6%84.3%92.4%75.6%72.1%88.6%91.9%81.2%82.5%84.5%
G98.7%97.7%92.4%93.1%94.2%85.4%89.7%96.5%97.4%96.9%92.6%94.1%
S is seedling stage lettuce; G is growth stage lettuce.
Table 8. Comprehensive quality of plants before and after optimization.
Leaf Area
(cm2)
Tip Burn Rate (%)Plant Height
(mm)
Fresh
Weight (g)
SpadAsA
(mg/g)
Soluble
Sugar
(mg/g)
Nitrate
(mg/kg)
Ahp
T432.55 ± 7.4891.2 ± 6.48.42 ± 0.264.46 ± 0.9223.40 ± 2.560.28 ± 0.021.51 ± 0.15280.2 ± 13.10.983
SOPT33.33 ± 0.7726.9 ± 7.28.75 ± 0.254.86 ± 0.2423.05 ± 0.970.26 ± 0.011.54 ± 0.06254.3 ± 7.421.202
W5140.20 ± 4.8192.3 ± 8.316.67 ± 0.4138.94 ± 1.6246.24 ± 3.490.39 ± 0.041.94 ± 0.172649.7 ± 8.41.077
GOPT156.32 ± 1.3823.3 ± 6.818.89 ± 0.4840.26 ± 1.3646.25 ± 0.930.39 ± 0.011.98 ± 0.052598 ± 10.251.354
T4 (2R:1B, 100 μmol/m2·s); W5 (4R:1B,200 μmol/m2·s); SOPT is the model of seedling optimization treatment; GOPT is the model of growth period optimization treatment; and each treatment group n = 24.
Disclaimer/Publisher’s Note: The statements, opinions and data contained in all publications are solely those of the individual author(s) and contributor(s) and not of MDPI and/or the editor(s). MDPI and/or the editor(s) disclaim responsibility for any injury to people or property resulting from any ideas, methods, instructions or products referred to in the content.

