Article

Prediction of Potential Distribution Area of Two Parapatric Species in Triosteum under Climate Change

1
College of Eco-Environmental Engineering, Qinghai University, Xining 810016, China
2
Key Laboratory of Adaptation and Evolution of Plateau Biota, Northwest Institute of Plateau Biology, Chinese Academy of Sciences, Xining 810001, China
3
Qinghai National Park Research Monitoring and Evaluation Center, Xining 810000, China
4
State Key Laboratory of Plateau Ecology and Agriculture, Qinghai University, Xining 810016, China
5
Department of Botany, Hazara University Mansehra, Mansehra 21300, Pakistan
6
Department of Geological Engineering, Qinghai University, Xining 810016, China
*
Authors to whom correspondence should be addressed.
Sustainability 2023, 15(6), 5604; https://doi.org/10.3390/su15065604
Submission received: 9 February 2023 / Revised: 12 March 2023 / Accepted: 13 March 2023 / Published: 22 March 2023
(This article belongs to the Section Sustainability, Biodiversity and Conservation)

Abstract

:
Climate change has a profound impact on global biodiversity and species geographical distribution, especially in alpine regions. The prediction of species’ habitat could help the understanding of species’ responses to potential climate threats. Triosteum L. (1753) is a typical mountain plant with medicinal and ecological value. There are three species of this genus in East Asia. Triosteum Pinnatifidum Maxim. 1888 and Triosteum himalayanum Wall. 1829 are mainly distributed in the Qinghai–Tibet Plateau and its surroundings, and they are sensitive to climate changes. In this study, a MaxEnt model was used to predict the potential distribution of T. Pinnatifidum and T. himalayanum in the present time and at four different time periods in the future under two different Shared Socioeconomic Pathways (SSPs). Topographic factors were taken into account in the prediction. In the present study, the accuracy of the model’s prediction was verified (the AUC values are 0.975 and 0.974), and the results indicate that temperature is the key factor that affects the distribution of these two species. Compared with current distribution, the potential suitable area of T. Pinnatifidum will increase in the future under two types of SSPs (an average increase is 31%), but the potential suitable area of T. himalayanum will decrease significantly (the average area is 93% of what it was before). In addition, the overlap of potential suitable areas of these two species will also expand, potentially affecting their hybridization and interspecific competition. The centroids of T. Pinnatifidum will migrate to the east, but the trajectory of centroids of T. himalayanum is complex. This study could provide basic data for the resource utilization and biogeography research of Triosteum. It will also be helpful for conservation and sustainable use of mountain herbaceous plants under climate change.

1. Introduction

Climate is considered to be one of the key factors in influencing the geographical distribution of species [1,2]. Climate change can affect many ecosystems, including the loss of genetic resources and biodiversity and even leading to the fluctuation of species distribution [3,4,5,6]. During the past 200 years (1800–2012), the global average surface temperature has increased by 0.85 °C due to the combined influence of human activities and natural factors, and it is predicted to rise by 0.3–4.8 °C by the end of the century (IPCC., 2013). Such climate change trends can force plants to adapt to new conditions or change their geographical distribution [7,8]. Predicting the potential geographical distribution of species using bioclimatic factors is one of the hot topics in ecology and biogeography research [6,7,9]. The prediction can not only lay a foundation for the theoretical study of species origin but also provide a reference for the genetic improvement and domestication of species [3].
Species distribution models (SDMs) are an important research tool in ecology and biogeography which can be helpful to study the effects of environmental factors on species distribution and predict the geographical range of species [10,11]. There are many kinds of SDM models applied in research, such as Resource Selection Function (RSF) [12], Generalized Linear Models (GLM) [13], Artificial Neural Networks [14], Classification And Regression Trees (CART) [15] and Maximum Entropy (MaxEnt) [16]. Previous studies have shown that the Maximum Entropy Model (MaxEnt) has the best accuracy among various SDMs, especially for those species with incomplete distribution information [17,18,19]. Therefore, it became the most widely used SDM [20], such as Qi et al. predicted the potentially suitable distribution area of Cinnamomum mairei H. Lév using the MaxEnt model [21]; Liu et al. used the MaxEnt model to model the habitat suitability of Houttuynia cordata [6] and Li et al. applied the MaxEnt model to the delineation of ERLs [22]. Using the MaxEnt model to predict the distribution of potential impacts of climate change on species provides scientists with a basis for decision-making that can help reduce the negative impacts of climate change on global biodiversity.
Triosteum L. is a perennial herb of the family Caprifoliaceae, with seven to eight species distributed from North America to East Asia. There are three species of Triosteum in East Asia, which are T. Pinnatifidum, T. himalayanum and T. sinuatum. T. Pinnatifidum can be found at an altitude of 1800–2900 m on slopes under coniferous forests and sunny sides of gullies in Hebei, Shanxi, Shaanxi, Ningxia, Gansu, Qinghai, Henan, Hubei, Sichuan and Japan. T. himalayanum grows on hillsides, coniferous forest edges, furrows and grasslands at an altitude of 1800–4100 m in Shaanxi, Hubei, Sichuan, Yunnan, Tibet and Nepal [23]. In addition, Triosteum also has medicinal value. Its roots, leaves and fruits can be used as medicine, mainly used to cure diseases such as strain injury, rheumatic back and leg pain, fall injury, indigestion, irregular menstruation, etc. [24]. Moreover, in previous studies on this genus, the distribution of these two species is consistent with that described in Flora Reipublicae Popularis Sinicae. This previous research focused on the phylogenetic relationship of Triosteum and the phylogeography of T. Pinnatifidum and T. himalayanum [25,26]. Some habitats of these two species have been designated as nature reserves and national parks, which are protected as part of the region’s ecosystem.
In this study, the potential distribution regions of T. Pinnatifidum and T. himalayanum today and in the 2050s, 2070s, and 2090s were predicted. The main objectives of this study were:
(1) To reveal the potential suitable habitat for T. Pinnatifidum and T. himalayanum in China and its surroundings under current climatic conditions and explore the key factors that influence its distribution; (2) to predict the suitable habitat of T. Pinnatifidum and T. himalayanum in different climatic scenarios in the future and discuss the changing trend of its distribution pattern during five periods (present day, the 2030s, 2050s, 2070s and 2090s); (3) to expatiate the changes in the overlapping potential habitat of these two species; and (4) to predict the centroid trajectory of T. Pinnatifidum and T. himalayanum under current and future climate change scenarios. This research can contribute to the understanding of the response pattern of Triosteum to the environment. It is also important to infer the potential effects of climate change on the adaptability and genetic differentiation of herbaceous plants.

2. Materials and Methods

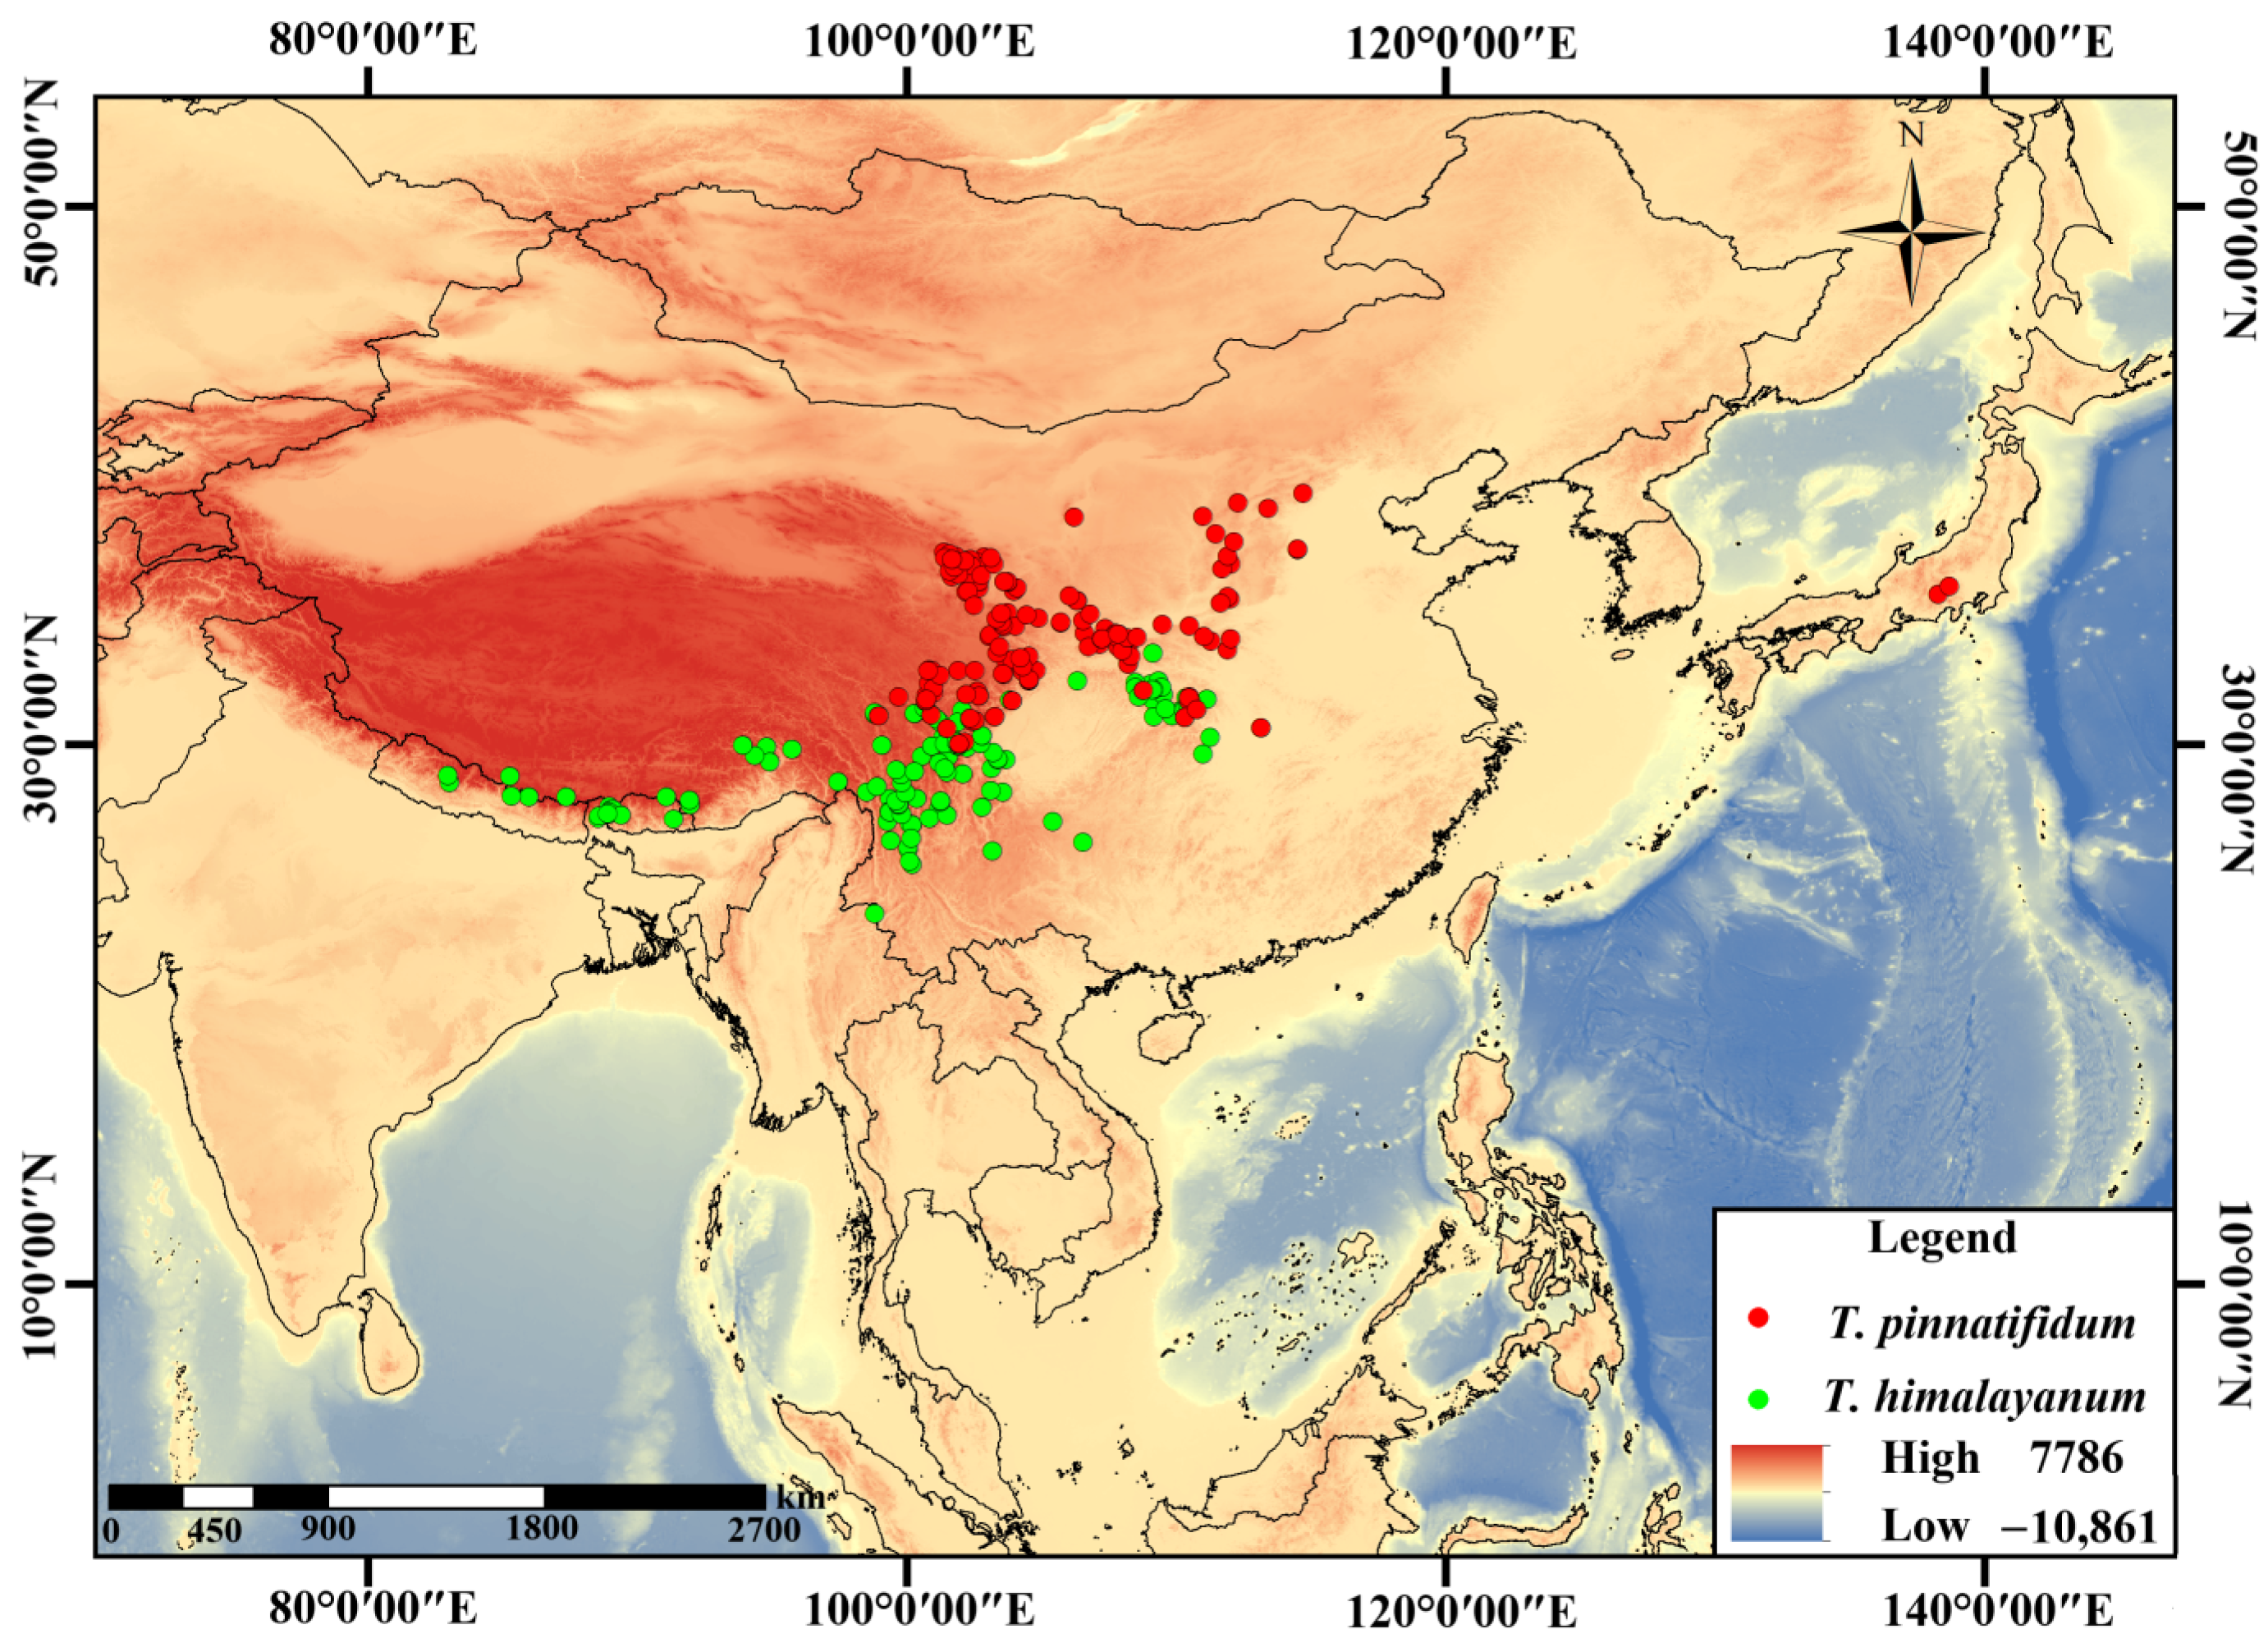
2.1. Species Occurrence Data Acquisition and Screening

The quality and reliability of species location points in SDMs are directly related to the credibility of the predicted results [27,28]. The distribution data of 167 T. Pinnatifidum and 177 T. himalayanum were obtained from our field investigation (Table S1) and the Global Biodiversity Information Facility (GBIF, https://www.gbif.org/, https://doi.org/10.15468/dl.847xg2, https://doi.org/10.15468/dl.2e73vx, accessed on 5 March 2022). After removing the obvious error distribution data and duplicate points, the spatial filtering of the SDMTools plug-in in ArcGIS was used to delete the distribution data that was too close to each other (only one distribution point exists within the range of 5 km × 5 km) [29]. Finally, a total of 150 T. Pinnatifidum and 154 T. himalayanum distribution data were obtained (Figure 1).

2.2. Environmental Data Acquisition and Screening

Bioclimatic variables are considered to be major determinants of SDMs [30]. In this study, a total of 19 current (1950–2000) and future (2021–2040, 2041–2060, 2061–2080, 2081–2100) bioclimatic variables were downloaded from the WorldClim database (https://www.worldclim.org/ (accessed on 5 March 2022)) [31], as well as the DEM data of the relevant area obtained from the General Bathymetric Chart of the Oceans database (GEBCO, https://download.gebco.net/ (accessed on 5 March 2022)). The slope and aspect data were extracted from DEM data. All WorldClim data and DEM data were unified at a spatial resolution of 2.5 arc-minute. Among those bioclimatic variables, the two SSP climate scenarios’ (SSP2-4.5 and SSP5-8.5) data are based on the BCC-CSM2-MR climate system model, which is best suited to China and its vicinity [32]. SSP2-4.5 represents the scenario with medium radiative forcing and moderate greenhouse gas emissions, and SSP5-8.5 represents the scenario with high radiative forcing and large greenhouse gas emissions [33].
To reduce the over-fitting problem of the MaxEnt model caused by the multicollinearity of environmental variables, 22 environmental variables and the final distribution data were imported into ArcGIS 10.7 for point interpolation extraction. The results were imported into SPSS v22 [34] for Spearman correlation analysis. When the correlation between two environmental factors is greater than or equal to |0.8|, only one of the factors can be selected [35]. Finally, 11 environmental factors are used in the model (Table 1).

2.3. Model Establishment, Optimization and Evaluation

Feature combination (FC) and regularization multiplier (RM) are two vital parameters in the MaxEnt model. The optimization of these two parameters can significantly improve the prediction accuracy of the model [36,37]. An R package “KUENM” was used to optimize the FC and RM of the MaxEnt model in this study [38]. The optimization process is as follows: First, the RM was set from 0.1 to 4 at an interval of 0.1, and a total of 40 RM values were set. There are five options for FC, including linear (L), quadratic (Q), product (P), threshold (T) and hinge (H), which can produce 31 different combinations. Subsequently, the KUENM package was used to calculate the prediction of 1240 different models obtained from the combination of 31 FC settings and 40 RM values. The model (OR_AICc) with a statistically significant omission rate that was lower than the threshold value (0.05) and a delta AICc value of less than 2 was selected to determine the optimal model [39].
The optimization model, the distribution data of these two species of Triosteum and the selected environmental factors were imported into MaxEnt3.4.4 to simulate and predict the potentially suitable distribution areas in different periods and different scenarios. 75% of the distribution data were used for model training, and the remaining 25% of distribution data were used as a test set, and this process was repeated ten times [40].
The accuracy of model prediction results was evaluated by the area under the curve (AUC) of the receiver operating characteristic (ROC) [37]. The larger the AUC value is, the better the prediction accuracy of the model will be [41]. If the AUC < 0.7, the prediction result will be poor and the reliability will be low, and the predicted result generally cannot be used. The prediction results of 0.7–0.8 are moderate, 0.8~0.9 indicates good prediction results while 0.9 to 1.0 indicates excellent prediction results [7,42].

2.4. Suitable Area Classification

The suitability of species distribution area is typically evaluated by the value range from 0 to 1, and a higher value means an area is more suitable for the species to grow. The predicted results generated by MaxEnt were imported into ArcGIS 10.7, and the reclassification function was used to divide the suitability grade of two species of Triosteum, and four levels of potential suitability habitat were divided: high suitable area (0.6 < p ≤ 1.0), medium suitable area (0.4 < p ≤ 0.6), low suitable area (0.2 < p ≤ 0.4) and non-suitable area (p < 0.2), and the area of each potential suitability habitat was calculated [43].

2.5. Spatial Pattern Change of Suitable Areas

To study the change of the potentially suitable area of these two species, the predicted results generated by MaxEnt were imported into ArcGIS 10.7 and divided into non-suitable and suitable areas according to p < 0.2 and p ≥ 0.2 by referring to the method in the previous step. The spatial unit of the suitable areas was assigned to 1 and the spatial unit of the non-suitable areas was assigned to 0, and the (0, 1) matrix of the existence/non-existence of the suitable areas of T. Pinnatifidum and T. himalayanum was established. Finally, we used the SDMtoolbox to analyze and map the distribution changes in the suitable habitat area of these two species of Triosteum.

2.6. Geographic Distribution Centroid Calculation

To further study the variation trend of the potential distribution areas in the future, SDMTools was used to calculate the central points of suitable areas of these two species of Triosteum. The suitable regions of T. Pinnatifidum and T. himalayanum were simplified to a vector particle, respectively. The change of the centroid position was used to reflect the size and direction of the suitable region of these two species of Triosteum. The geographical distribution centroid was calculated in accordance with the following formulas [44]:
N = j = 1 m N i × P i , j i = 1 n j = 1 m P i , j
E = i = 1 n P i , j × E j i = 1 n j = 1 m P i , j

2.7. Niche Overlap, Niche Breadth and Range Overlap Calculation

Niche overlap refers to the similarity and competition between different species in the utilization of environmental resources, and niche breadth refers to the sum of environmental resources used by species [45]. Based on the prediction results of MaxEnt model, the niche overlap, range overlap and niche breadth of T. Pinnatifidum and T. himalayanum were analyzed using ENMTools software. The Schoener’s (D) and Hellinger’s -Based (I) of niche overlap were calculated as the following formulas:
D ( P x , P y ) = 1 1 2 i | P x , i P y , i |
I ( P x , P y ) = 1 1 2 i ( P x , i P y , i ) 2
The Niche breadth was calculated in accordance with the following formula:
L x = i = 1 A P x , i l o g P x , i

3. Results

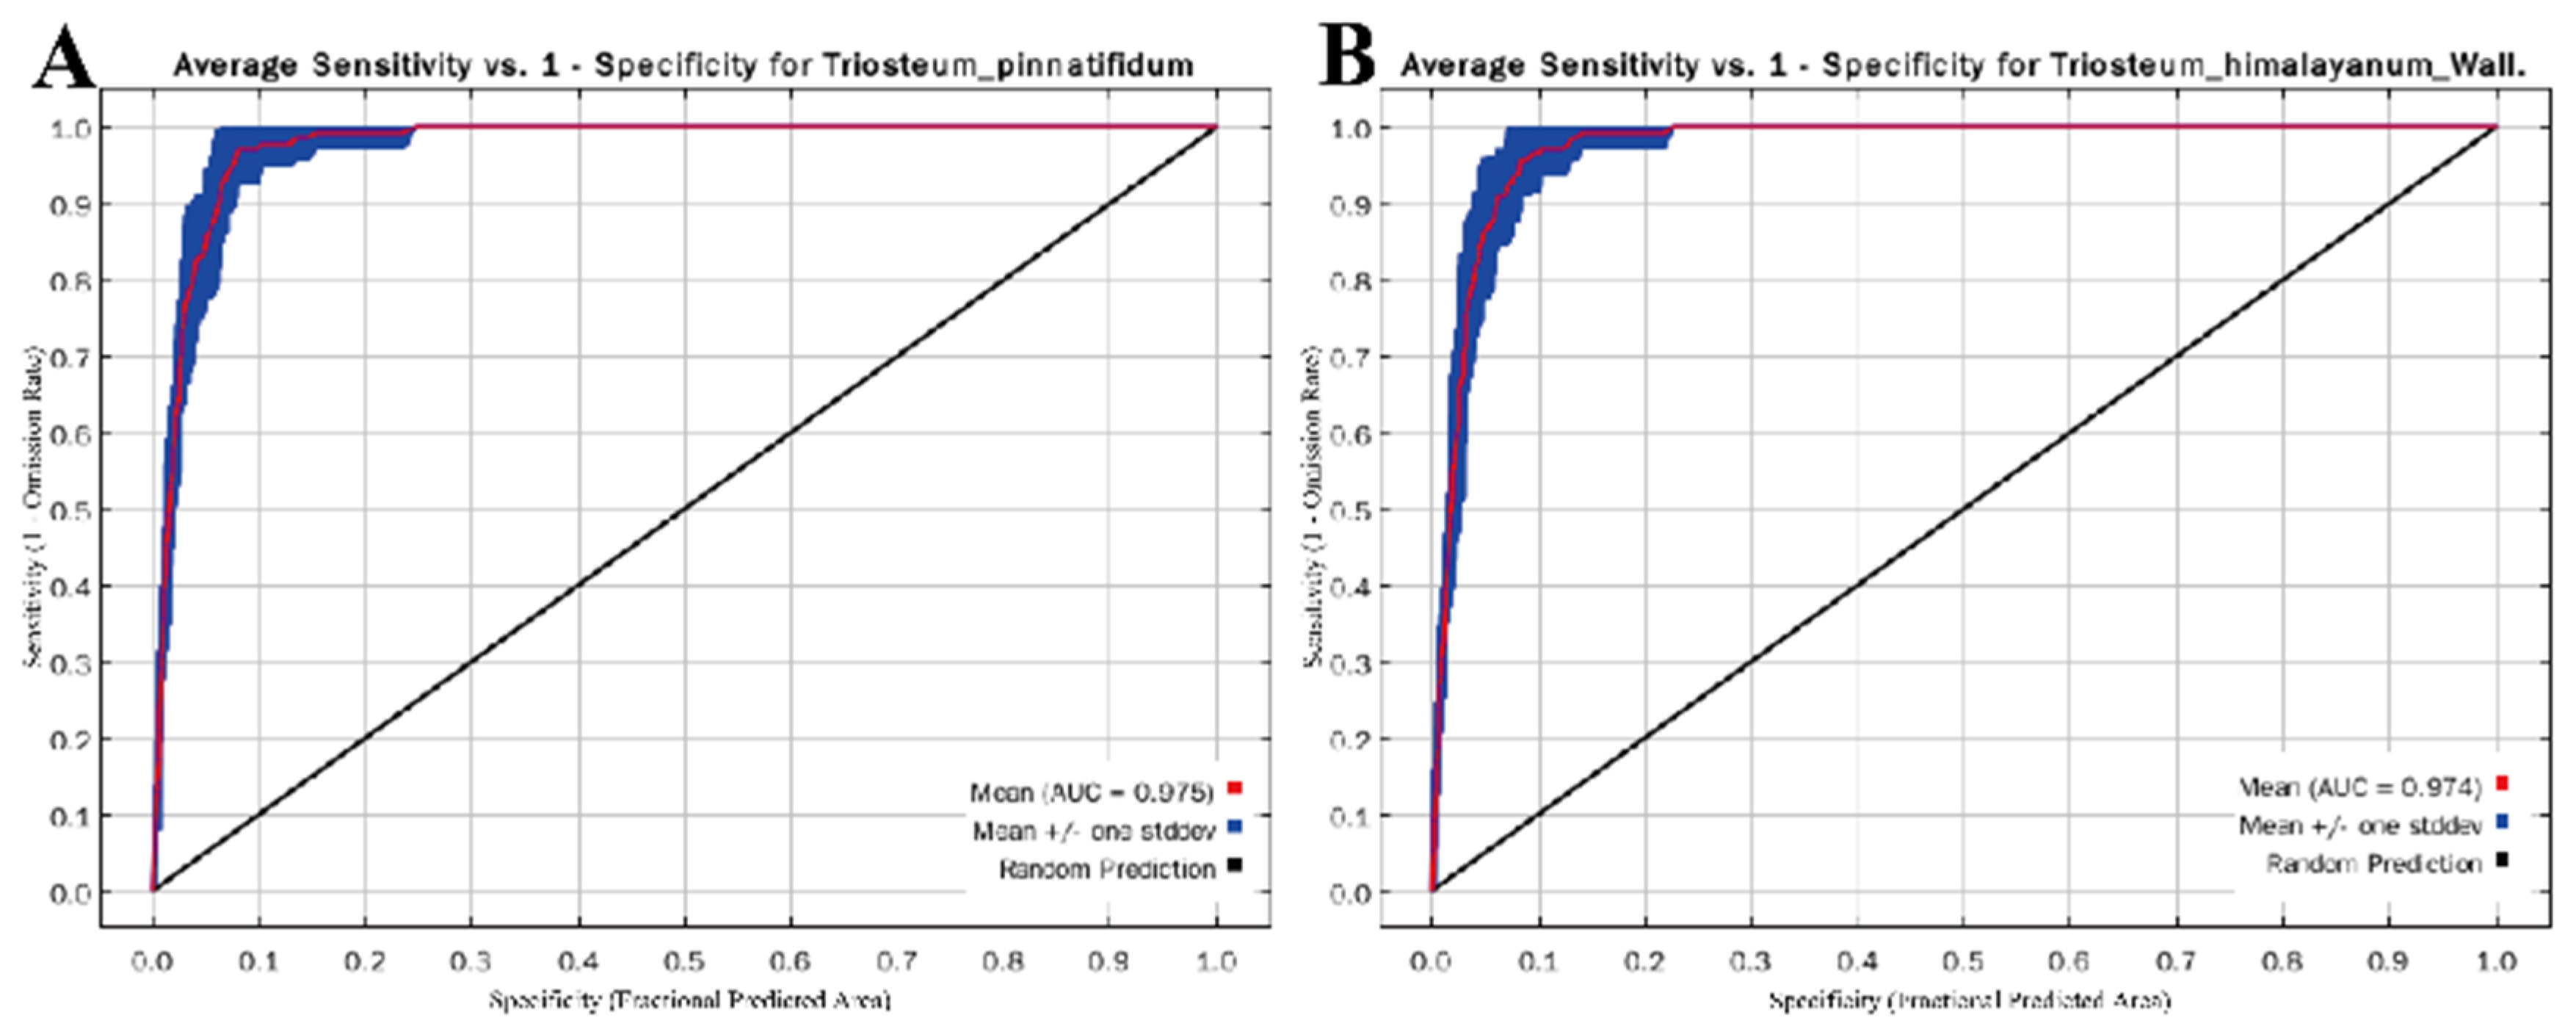
3.1. Model Optimization and Accuracy Evaluation

Based on 150 locality records of T. Pinnatifidum, 154 locality records of T. himalayanum and 11 environment variables, the suitable areas of two species were predicted. According to the optimization results, 348 and 32 of all models are statistically significant, meeting the omission rate criteria for T. Pinnatifidum and T. himalayanum, respectively. One of each models is statistically significant, meeting AICc criteria for T. Pinnatifidum and T. himalayanum; one and two of each models are statistically significant, meeting the omission rate and AICc criteria for T. Pinnatifidum and T. himalayanum, respectively. Finally, the parameters of the model were adjusted as RM = 0.7, FC = LQ for T. Pinnatifidum and RM = 3.1, FC = QTH for T. himalayanum.
Under these parameter settings, the average AUC value of 10 repetitions was 0.975 (T. Pinnatifidum) and 0.974 (T. himalayanum) (Figure 2). Both the AUC values are above 0.9, which are similar to those of other studies, indicating that the prediction accuracy of the model is excellent [46,47].

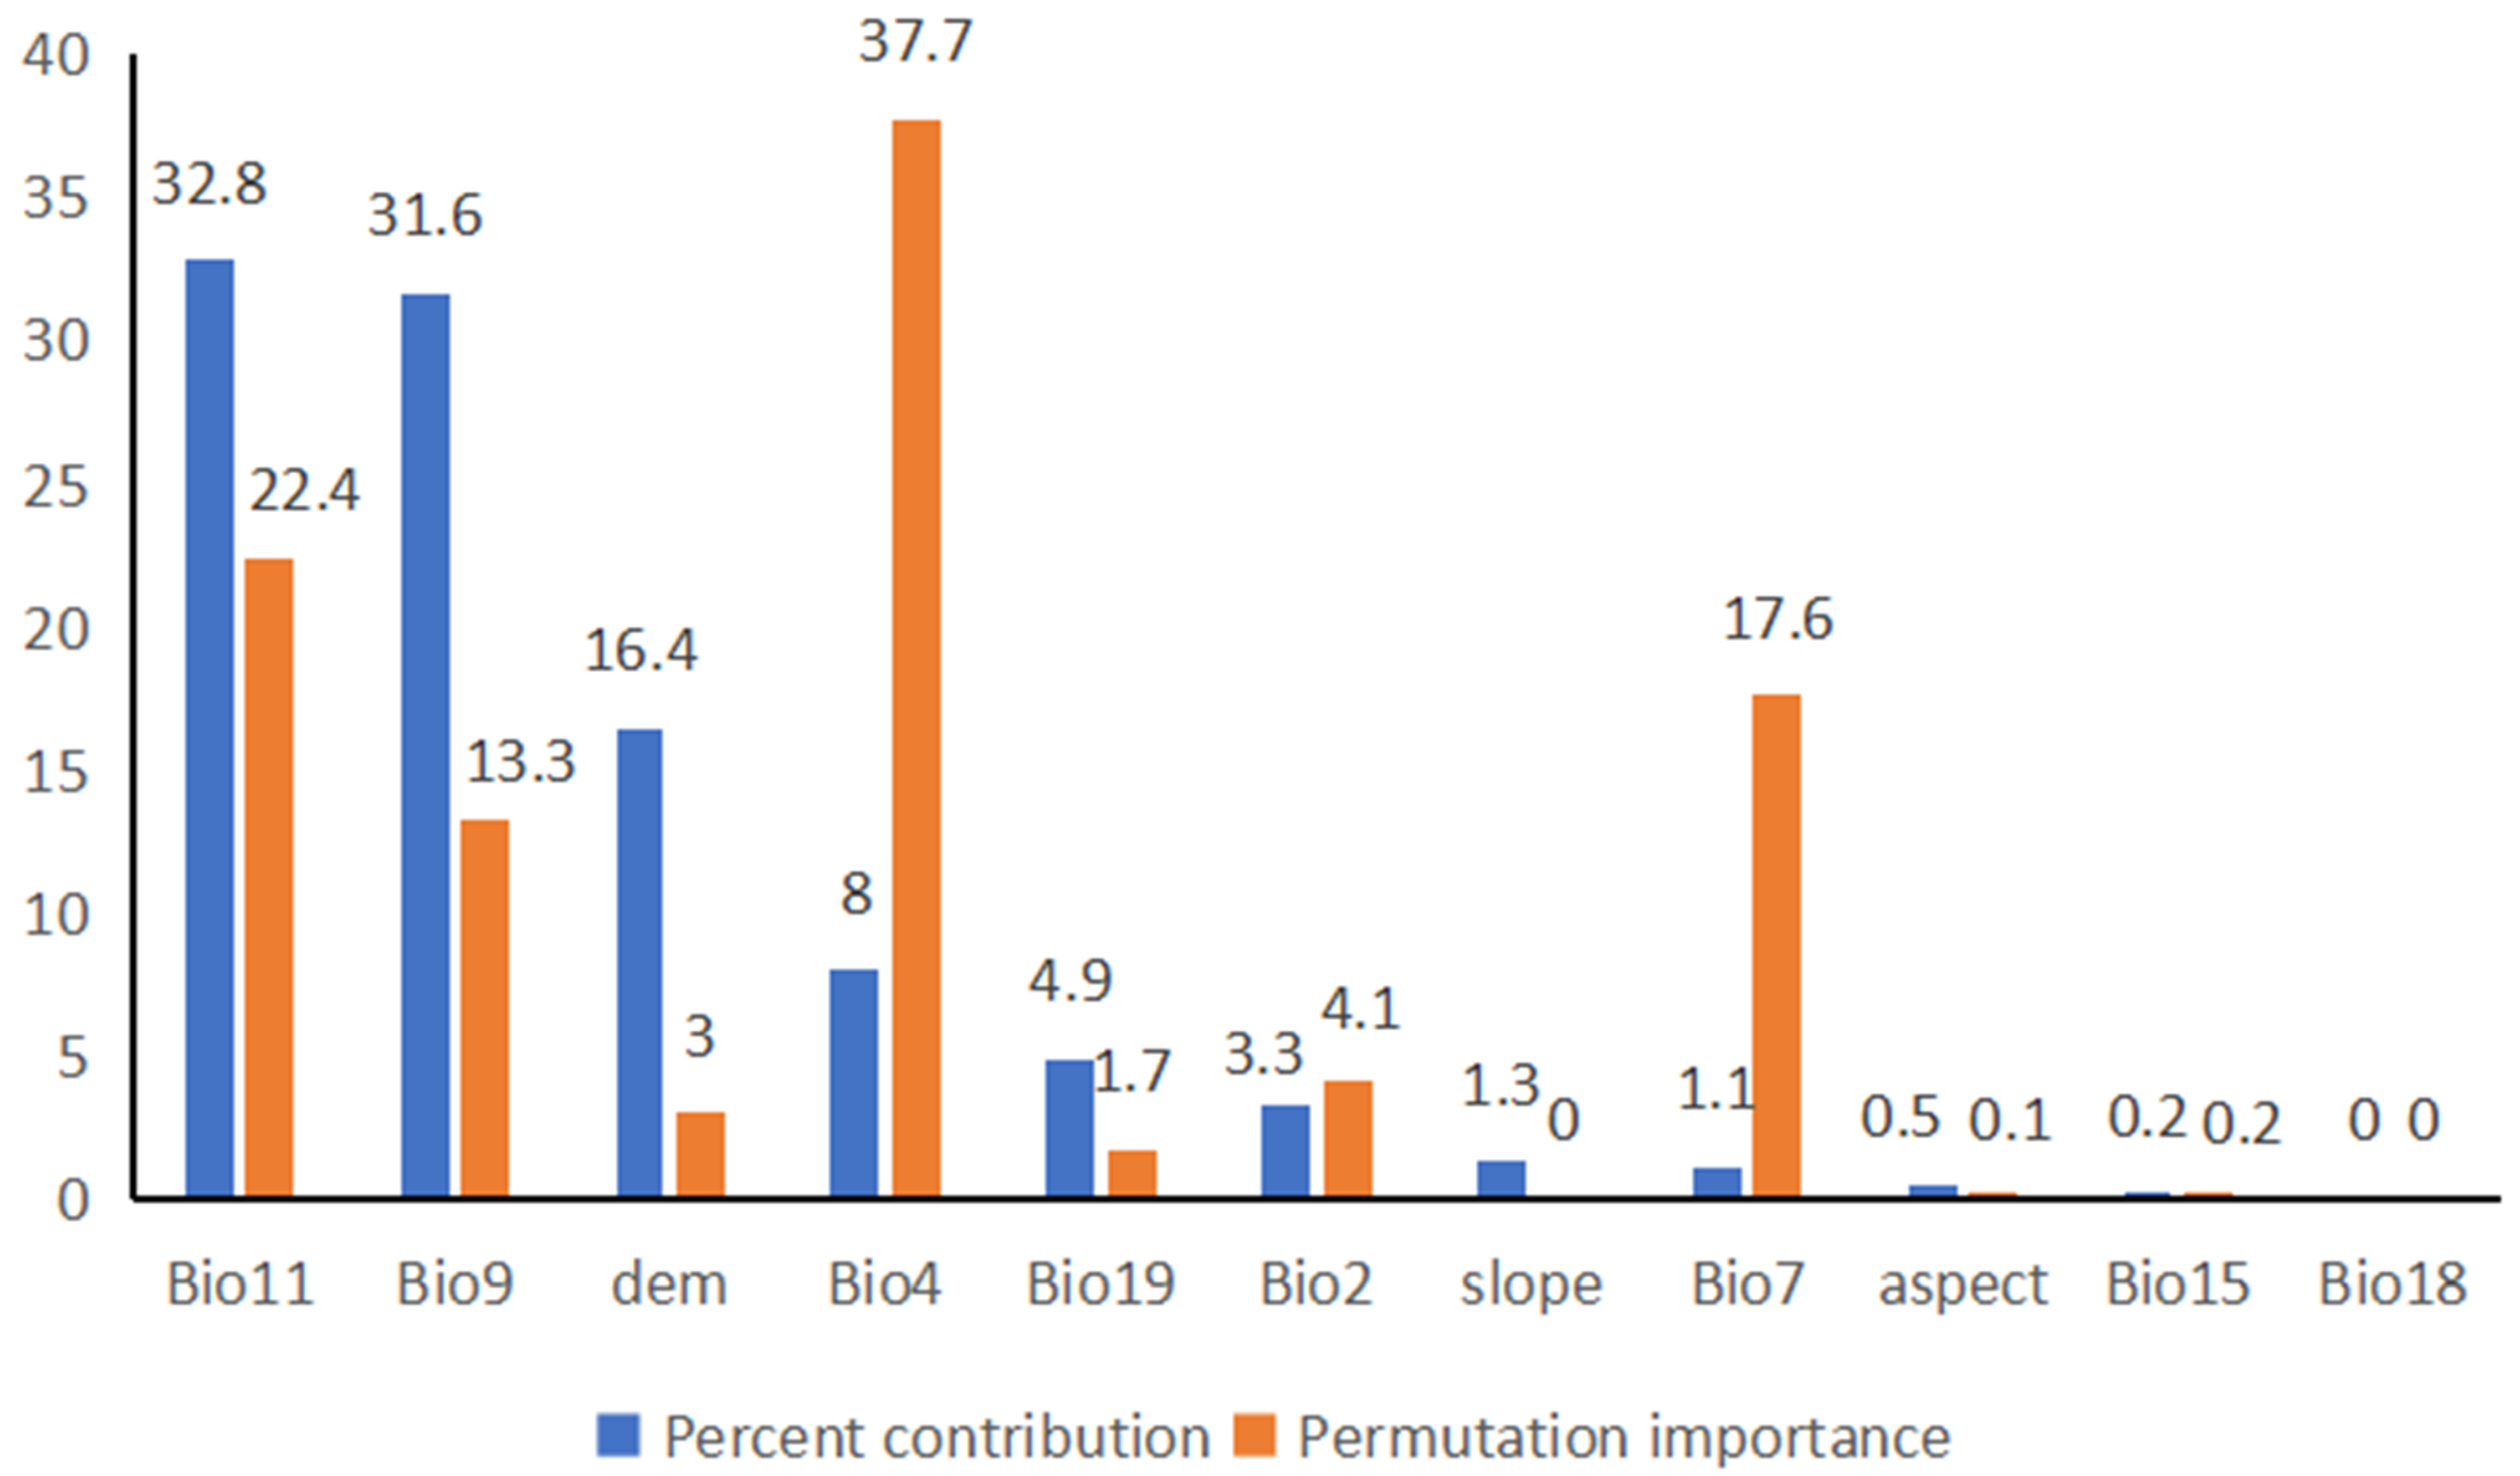
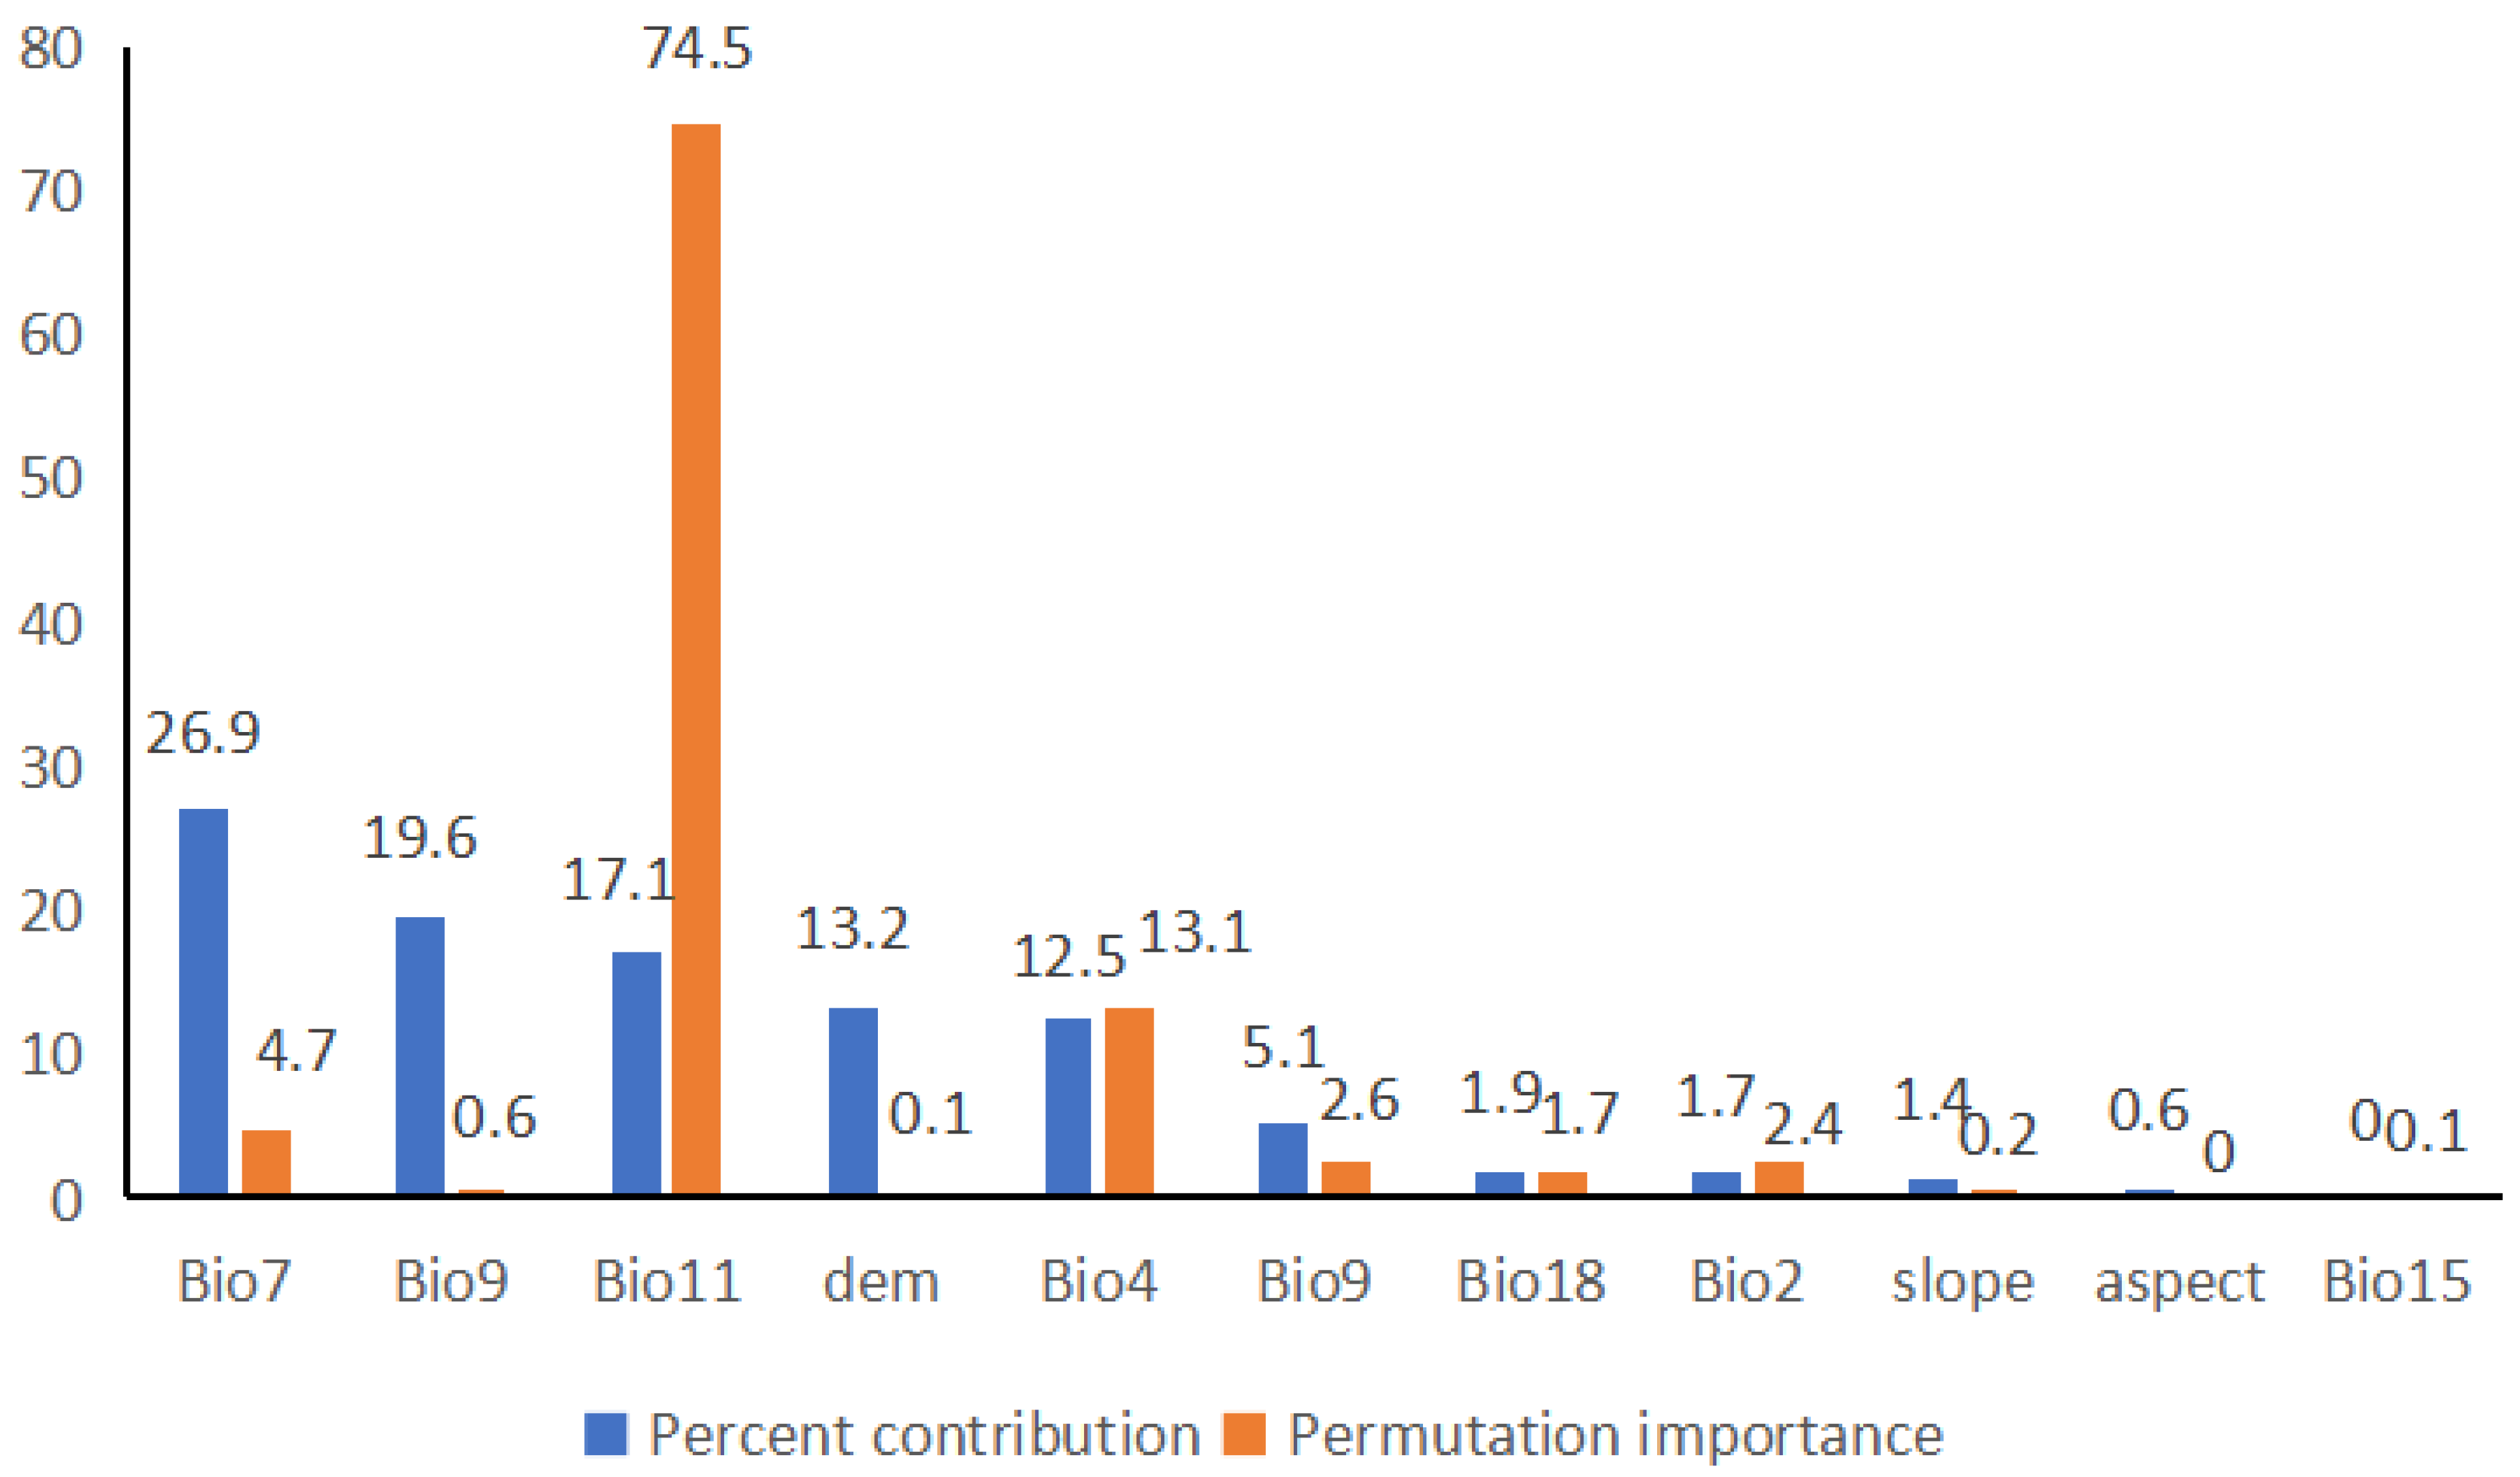
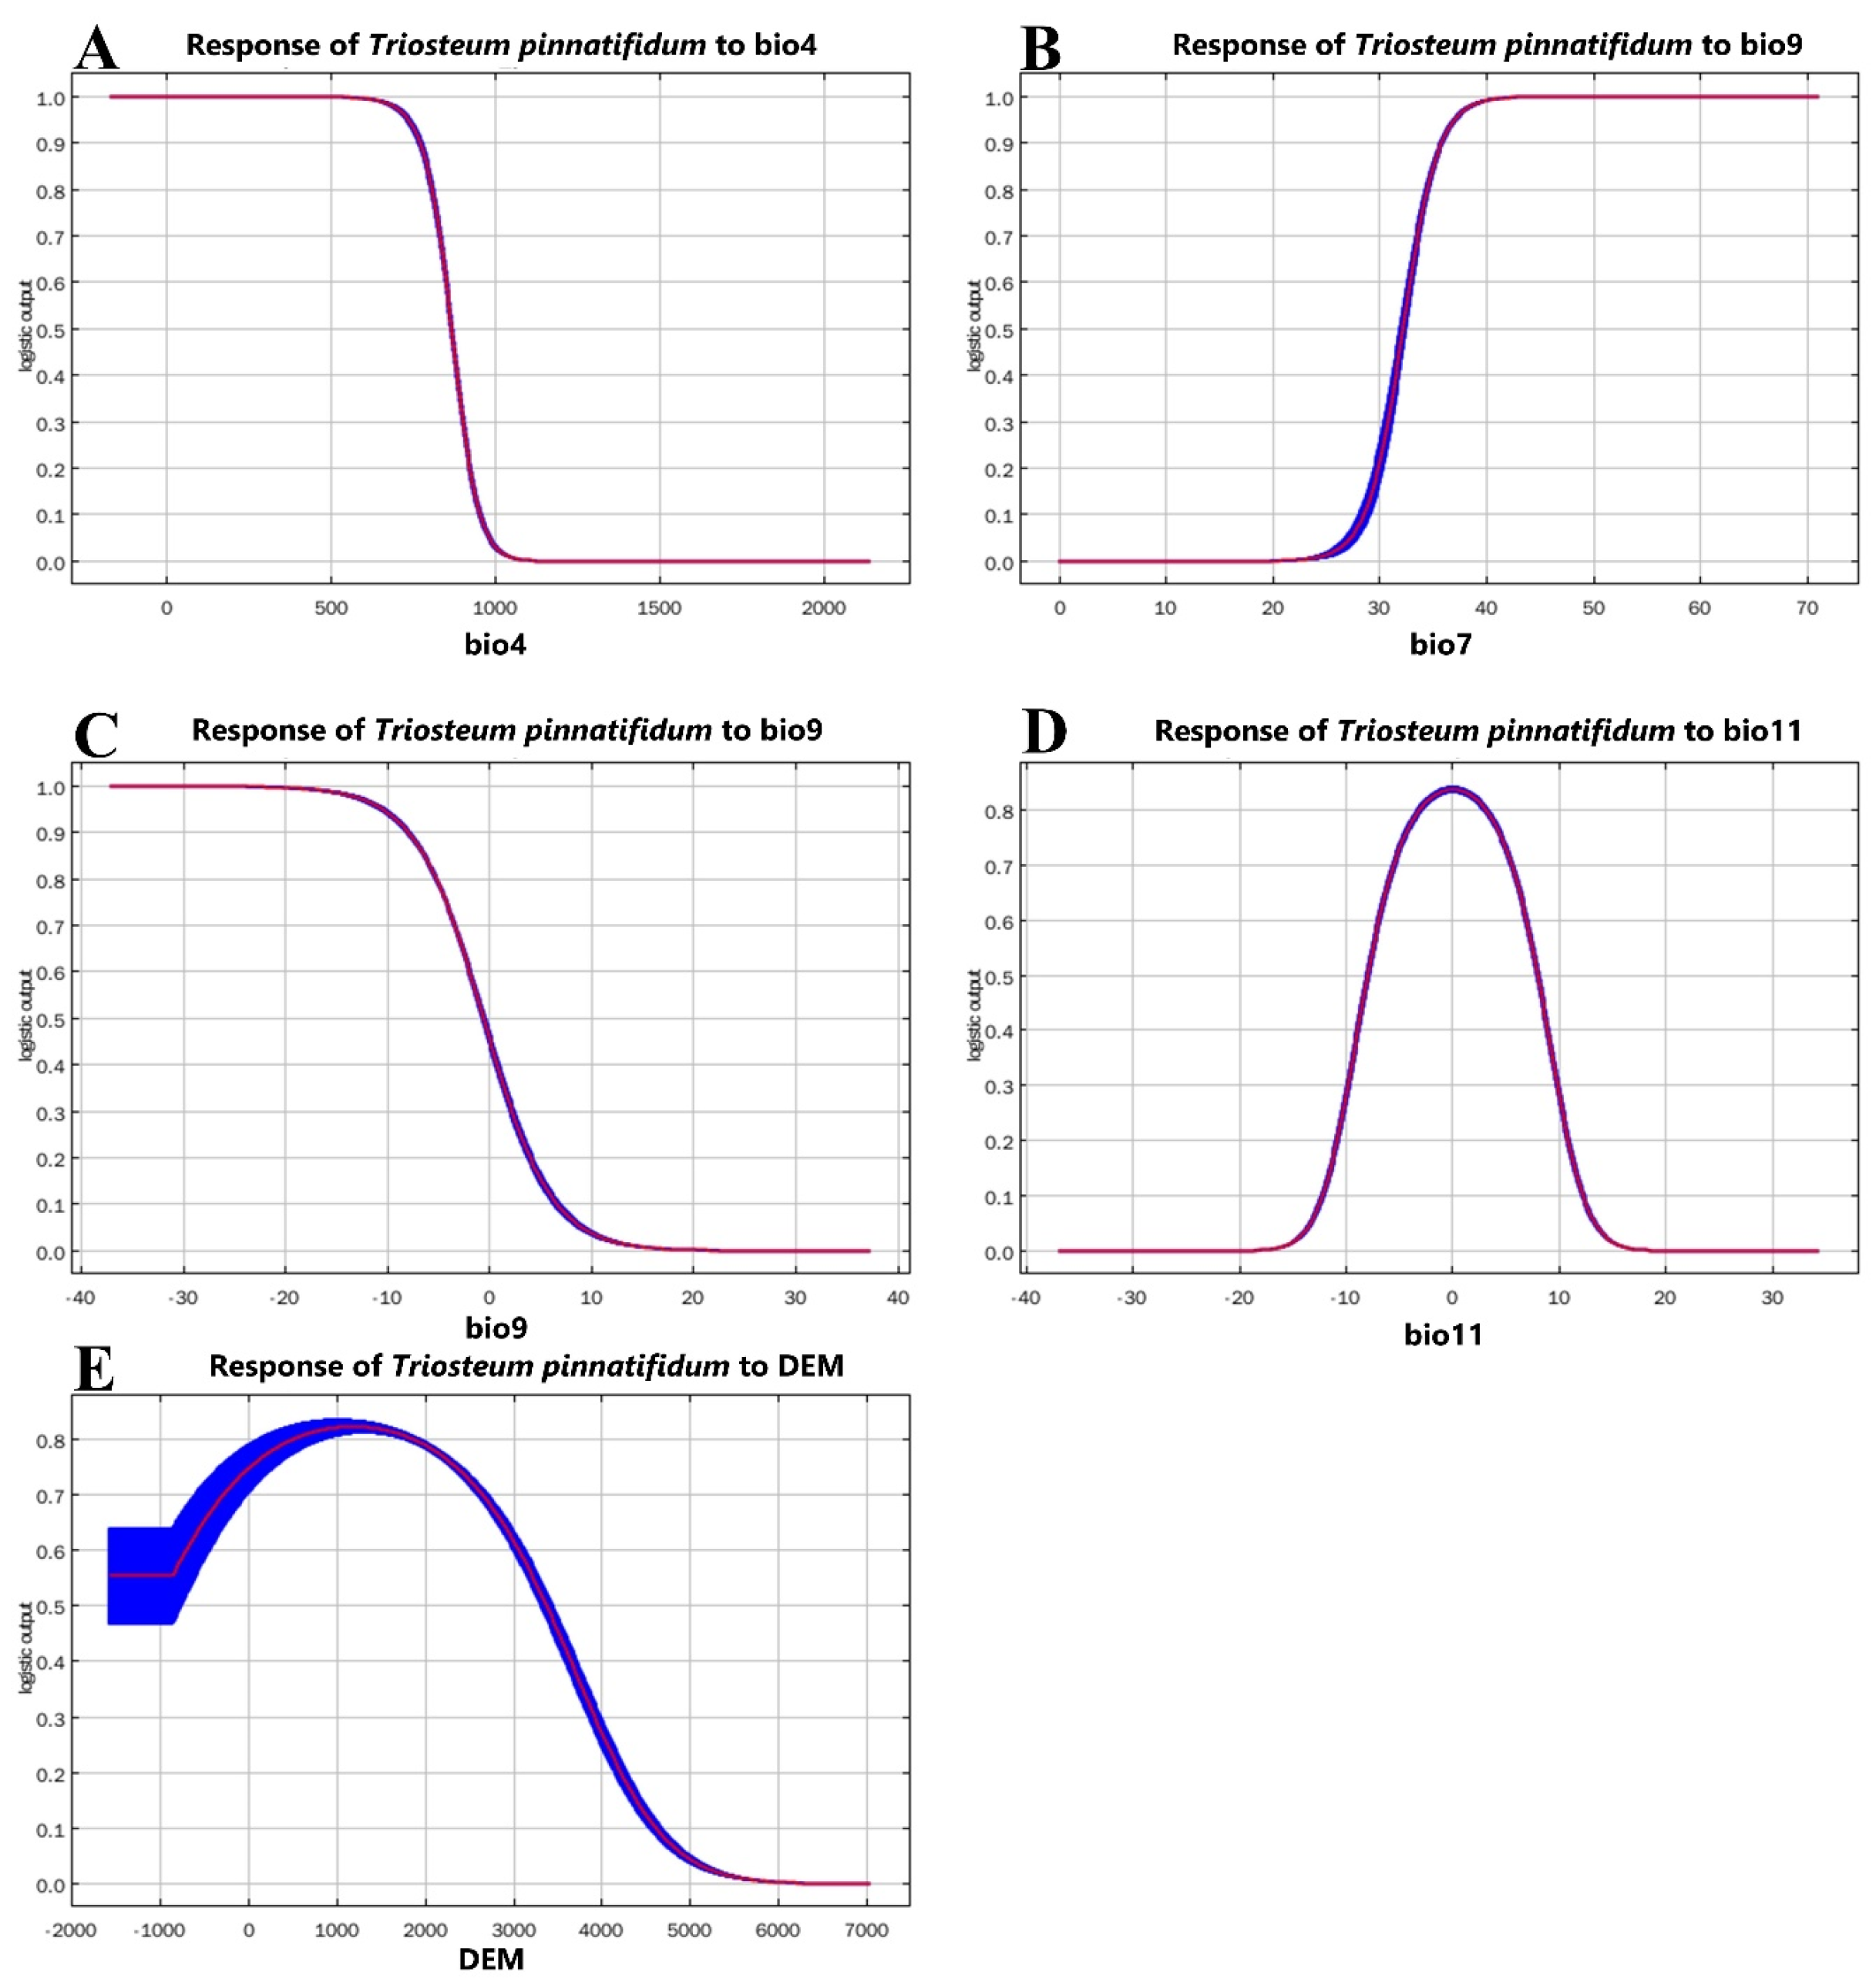
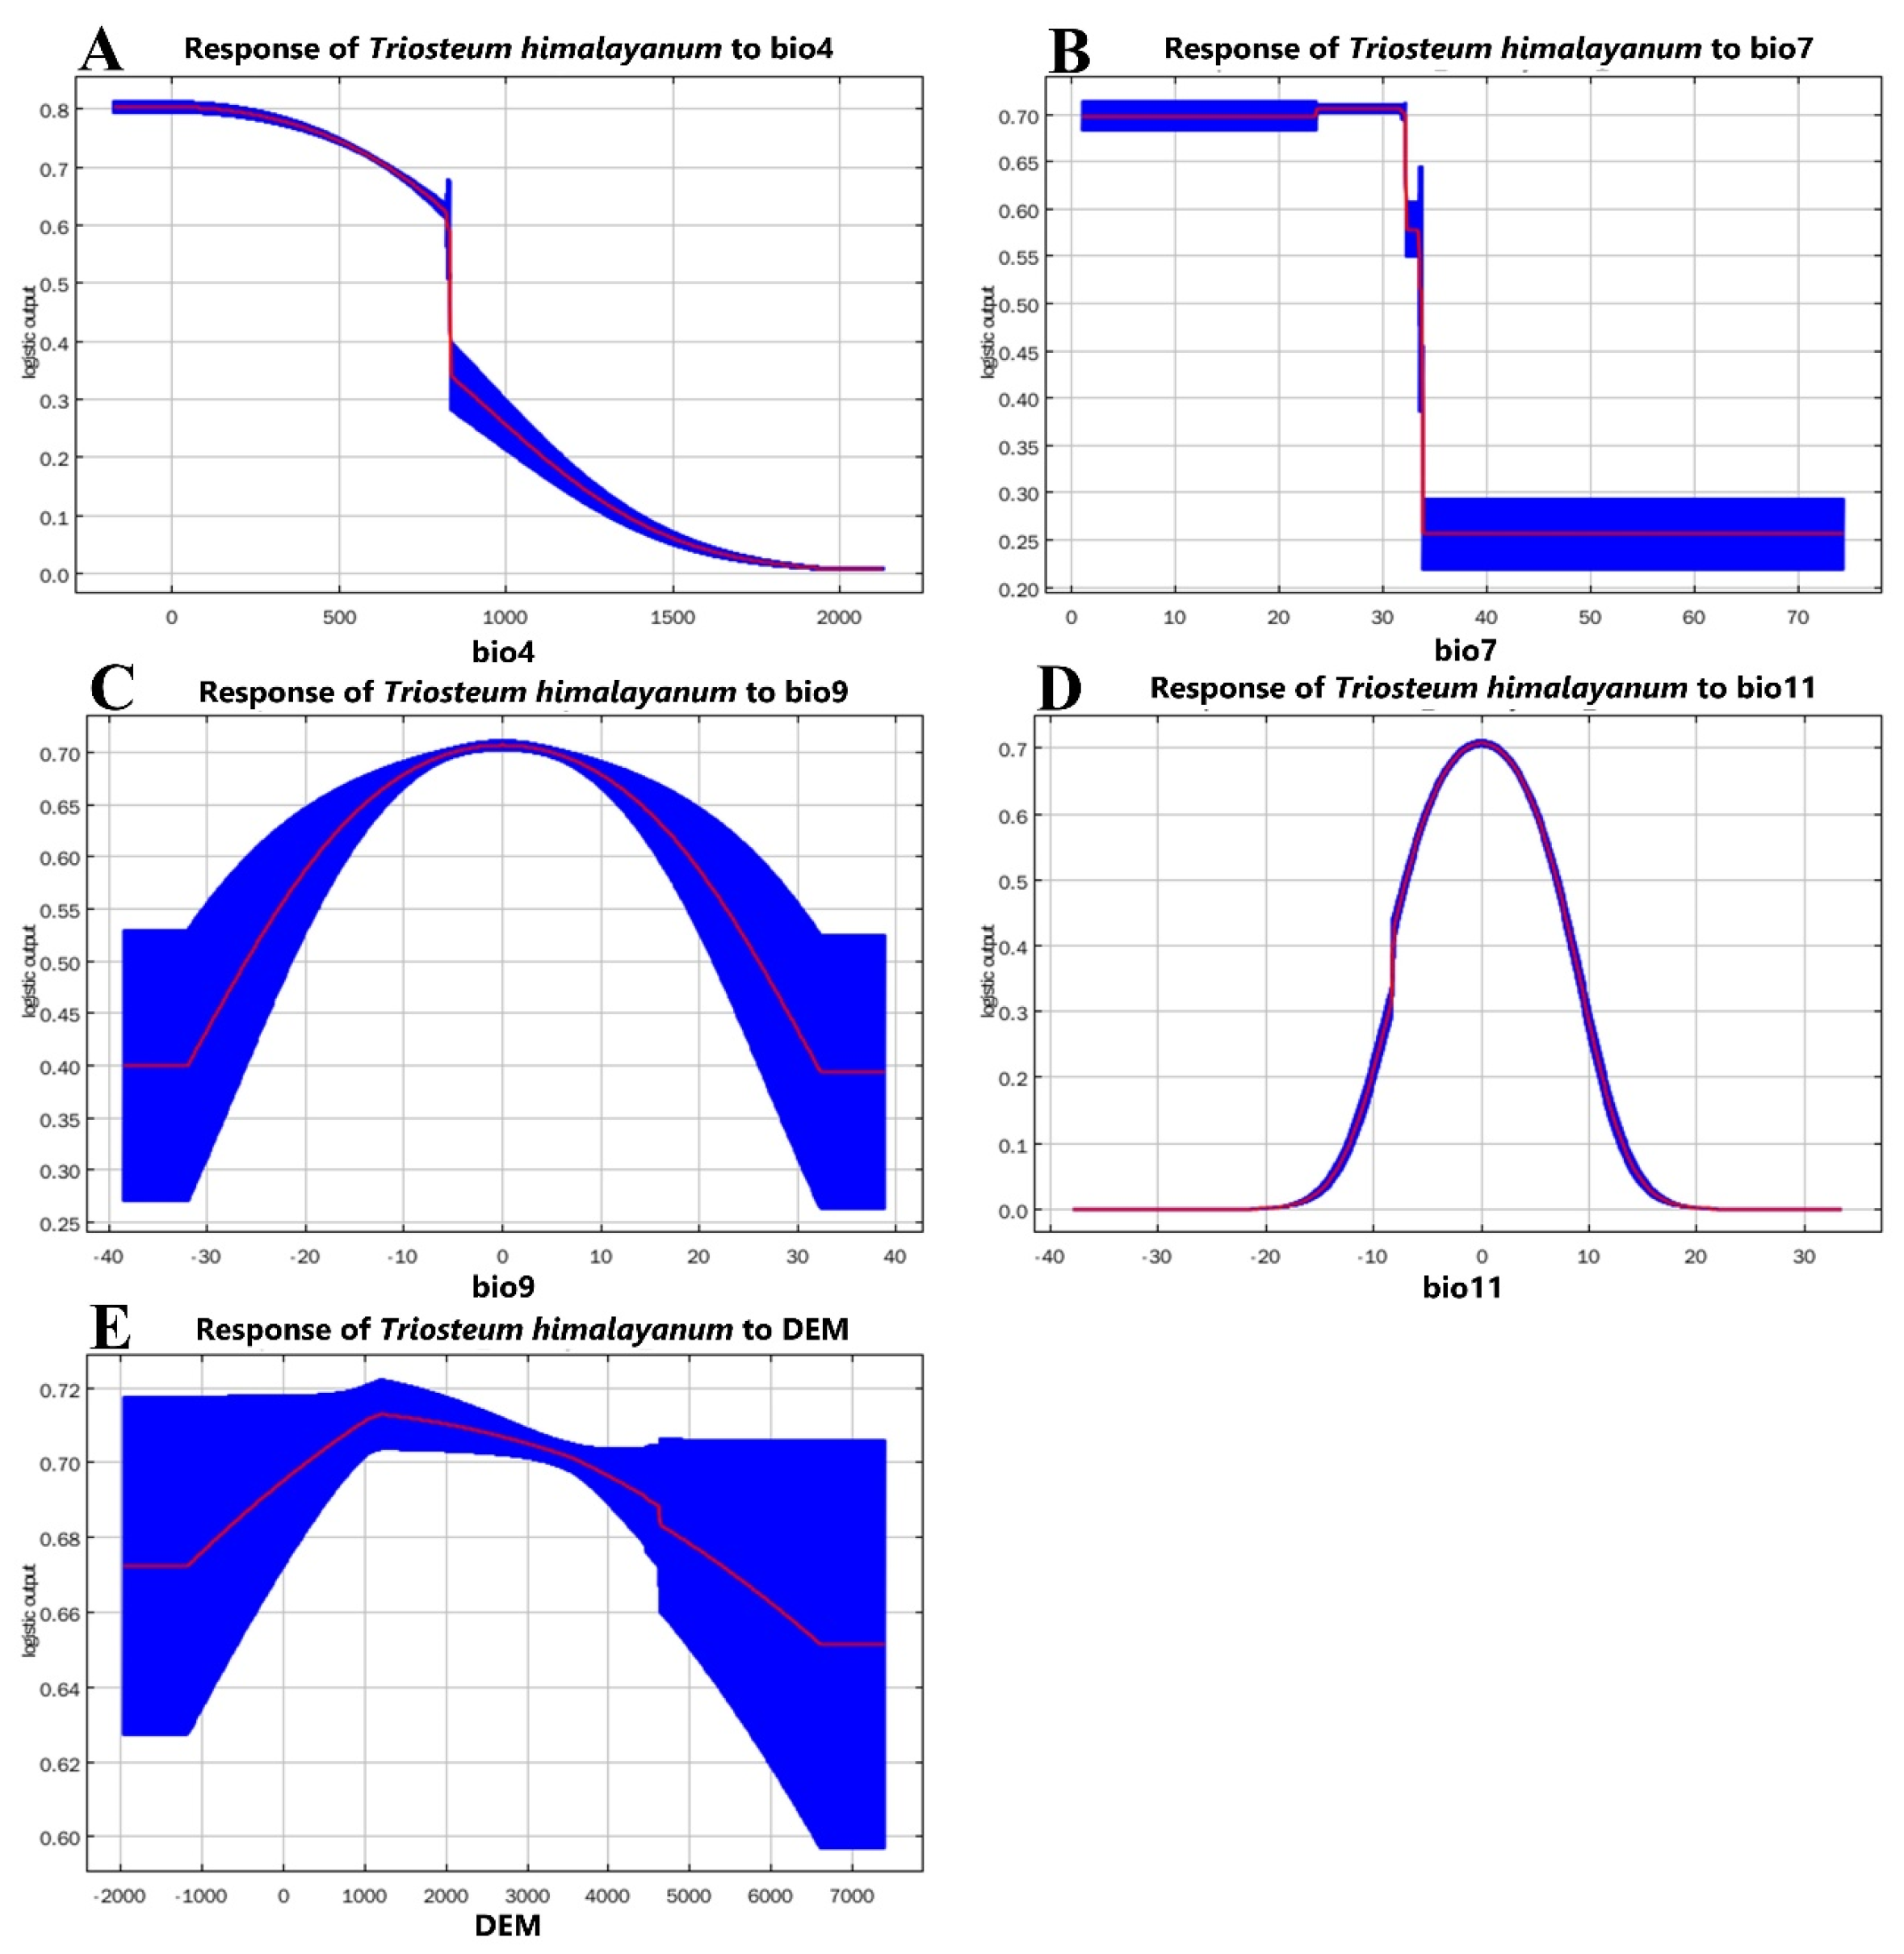
3.2. Importance of Environmental Variables

In the prediction of the current potential suitable area for two species of Triosteum, the importance of 11 climatic variables is shown in Figure 3 and Figure 4.
For T. Pinnatifidum, the top three variables having the highest contribution rate are the mean temperature of the coldest quarter (bio11, 32.8%), mean temperature of the driest quarter (bio9, 31.6%) and dem (16.4%), and the cumulative contribution rate reached 80.8%. The variables with a higher permutation importance value are temperature seasonality (bio4, 37.7%), mean temperature of the coldest quarter (bio11, 22.4%), temperature annual range (bio7, 17.6%) and mean temperature of the driest quarter (bio9, 13.3%), with a cumulative value of 91% (Figure 3). The variables with a higher contribution rate value of T. himalayanum are temperature annual range (bio7, 26.9%), mean temperature of the driest quarter (bio9, 19.6%), mean temperature of the coldest quarter (bio11, 17.1%), dem (13.2%) and temperature seasonality (bio4, 12.5%), and the cumulative contribution rate is 89.3%. Moreover, the variables with a higher permutation importance value are the mean temperature of the coldest quarter (bio11, 74.5%) and temperature seasonality (bio4, 13.1%), with a cumulative value of 87.6% (Figure 4).
In order to examine the climatic preference of these two species of Triosteum, the response curves for five of the most vital variables in MaxEnt were analyzed (Figure 5). The results indicated that when the value of temperature seasonality was under 800 (Figure 5A), the temperature annual range was above about 34 °C (Figure 5B), the mean temperature of the driest quarter was less than −0.5 °C (Figure 5C), the mean temperature of the coldest quarter was between −8 °C and 8 °C (Figure 5D) and the altitude was under about 3200 m (Figure 5E), the probability of the existence of T. Pinnatifidum could exceed 50%. Meanwhile, T. himalayanum prefers habitats with a value of temperature seasonality under about 750, a temperature annual range under 32 °C, a mean temperature of the driest quarter and mean temperature of the coldest quarter at 0 °C and an altitude at 1200 m (Figure 6).

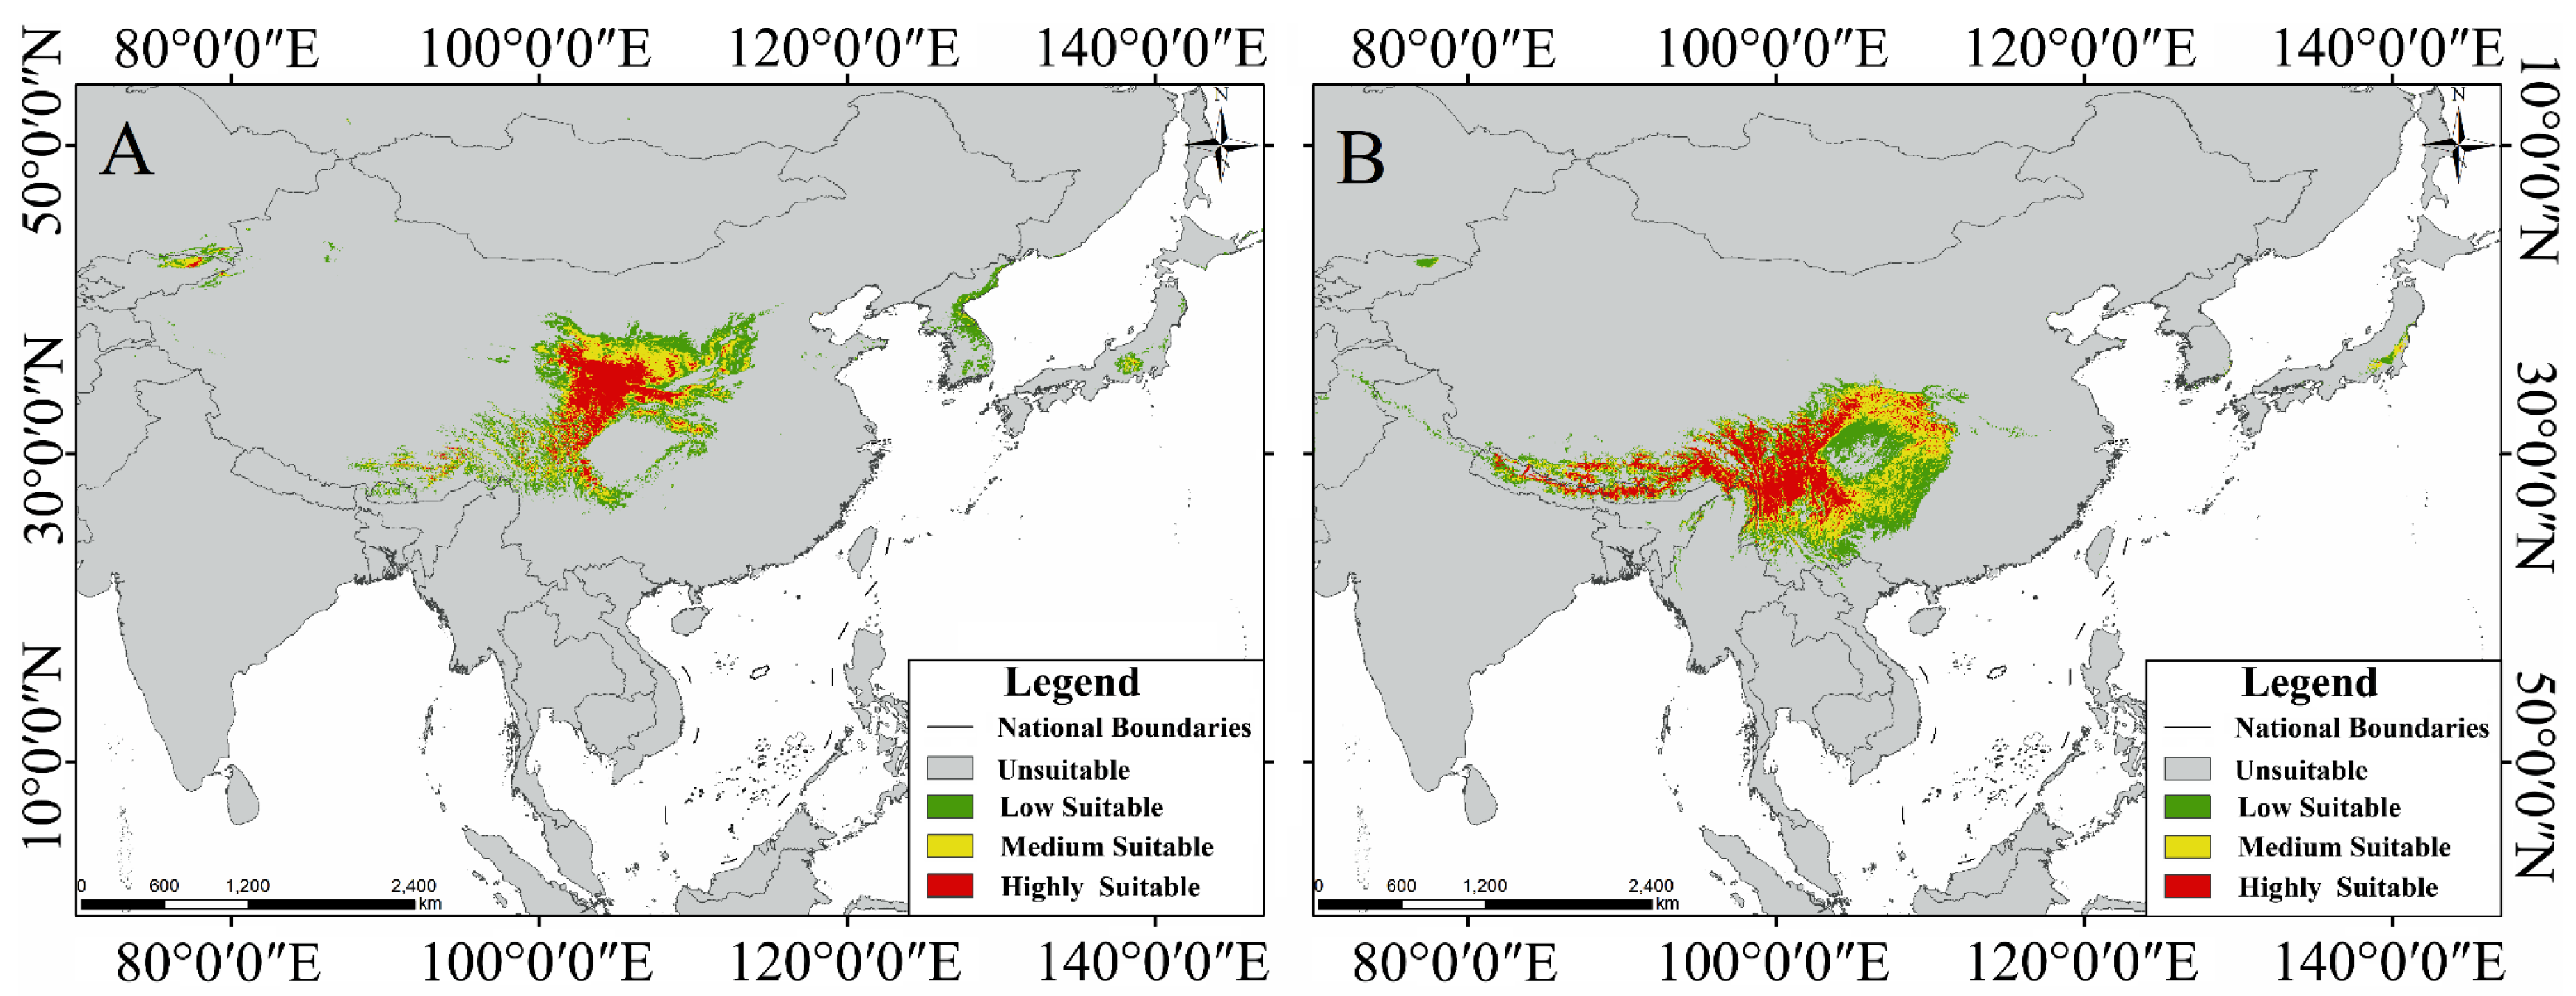
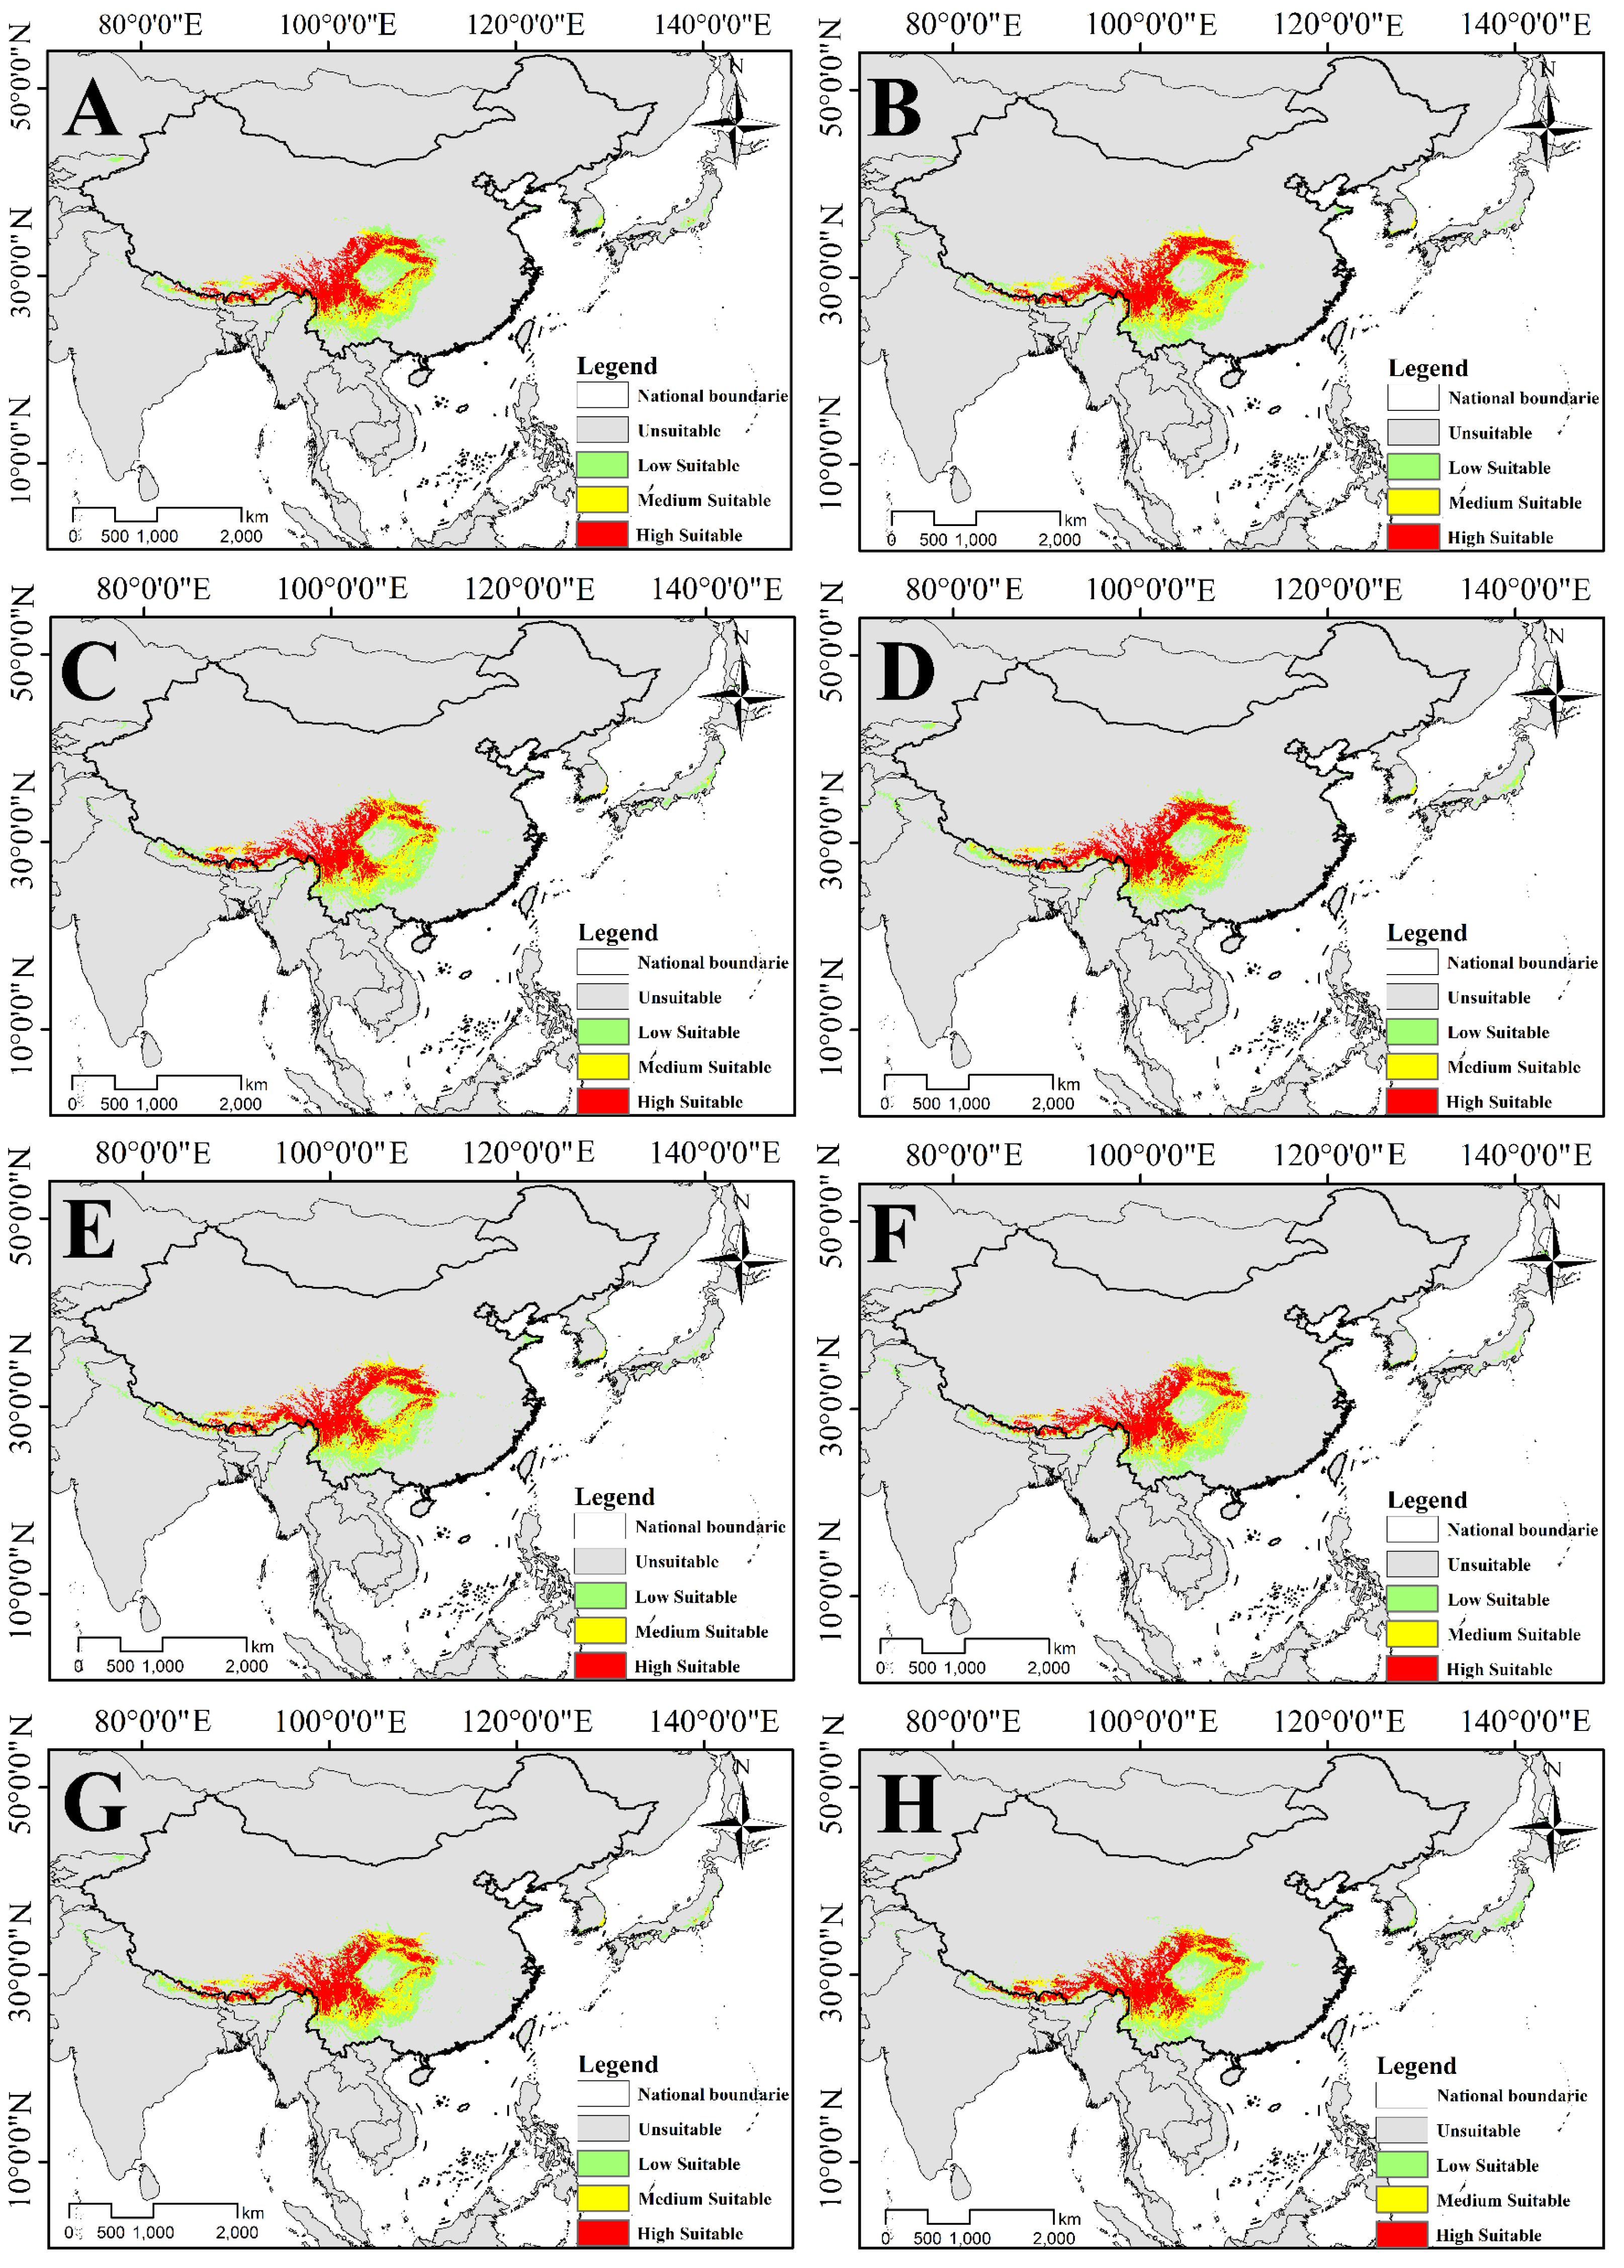
3.3. Potential Suitable Habitat for Two Species of Triosteum under Current Climate

The habitat suitability distributions of T. Pinnatifidum and T. himalayanum in China and its surroundings were predicted by MaxEnt software (Figure 7). Almost all the distribution points of T. Pinnatifidum and T. himalayanum were included in the predicted suitable areas. This result indicates that the model could excellently simulate the potential distribution of those two species. The total suitable habitat of T. Pinnatifidum is 111.03 × 10⁴ km2. The highly suitable area is 24.44 × 10⁴ km2 (22.01%), mainly distributed in the northwest of the Sichuan basin, the eastern edge of the Qinghai-Tibet Plateau (QTP), valleys of the southeast of the QTP and Qinling mountains. The medium suitable area is 30.48 × 10⁴ km2 (27.45%) and the low suitable area is 56.11 × 10⁴ km2 (50.54%). Moreover, there are a few highly suitable areas and other grades of suitable areas in the mountains of the central Honshu Island of Japan. Those suitable areas are exactly consistent with the actual distribution at present. In addition, there are some suitable areas in the Aksu region of Xin-jiang, the border of Kyrgyzstan and Uzbekistan and the mountains of the east Korean Peninsula, but there is no sampling record of T. Pinnatifidum in these places. The highly suitable habitats of T. himalayanum are predominantly concentrated south and southeast of QTP, which was consistent with the existing distribution of T. himalayanum. Similar to T. Pinnatifidum, there are also a few suitable areas on the eastern part of Honshu Island, south of the Korean Peninsula and in Kyrgyzstan, where no distribution records are available. In general, the suitable area of T. himalayanum is 145.68 × 10⁴ km2, of which the highly suitable area was about 41.53 × 10⁴ km² (28.51%), the medium suitable area was about 45.74 × 10⁴ km² (31.40%) and the low suitable area was about 58.41 × 10⁴ km² (40.09%).

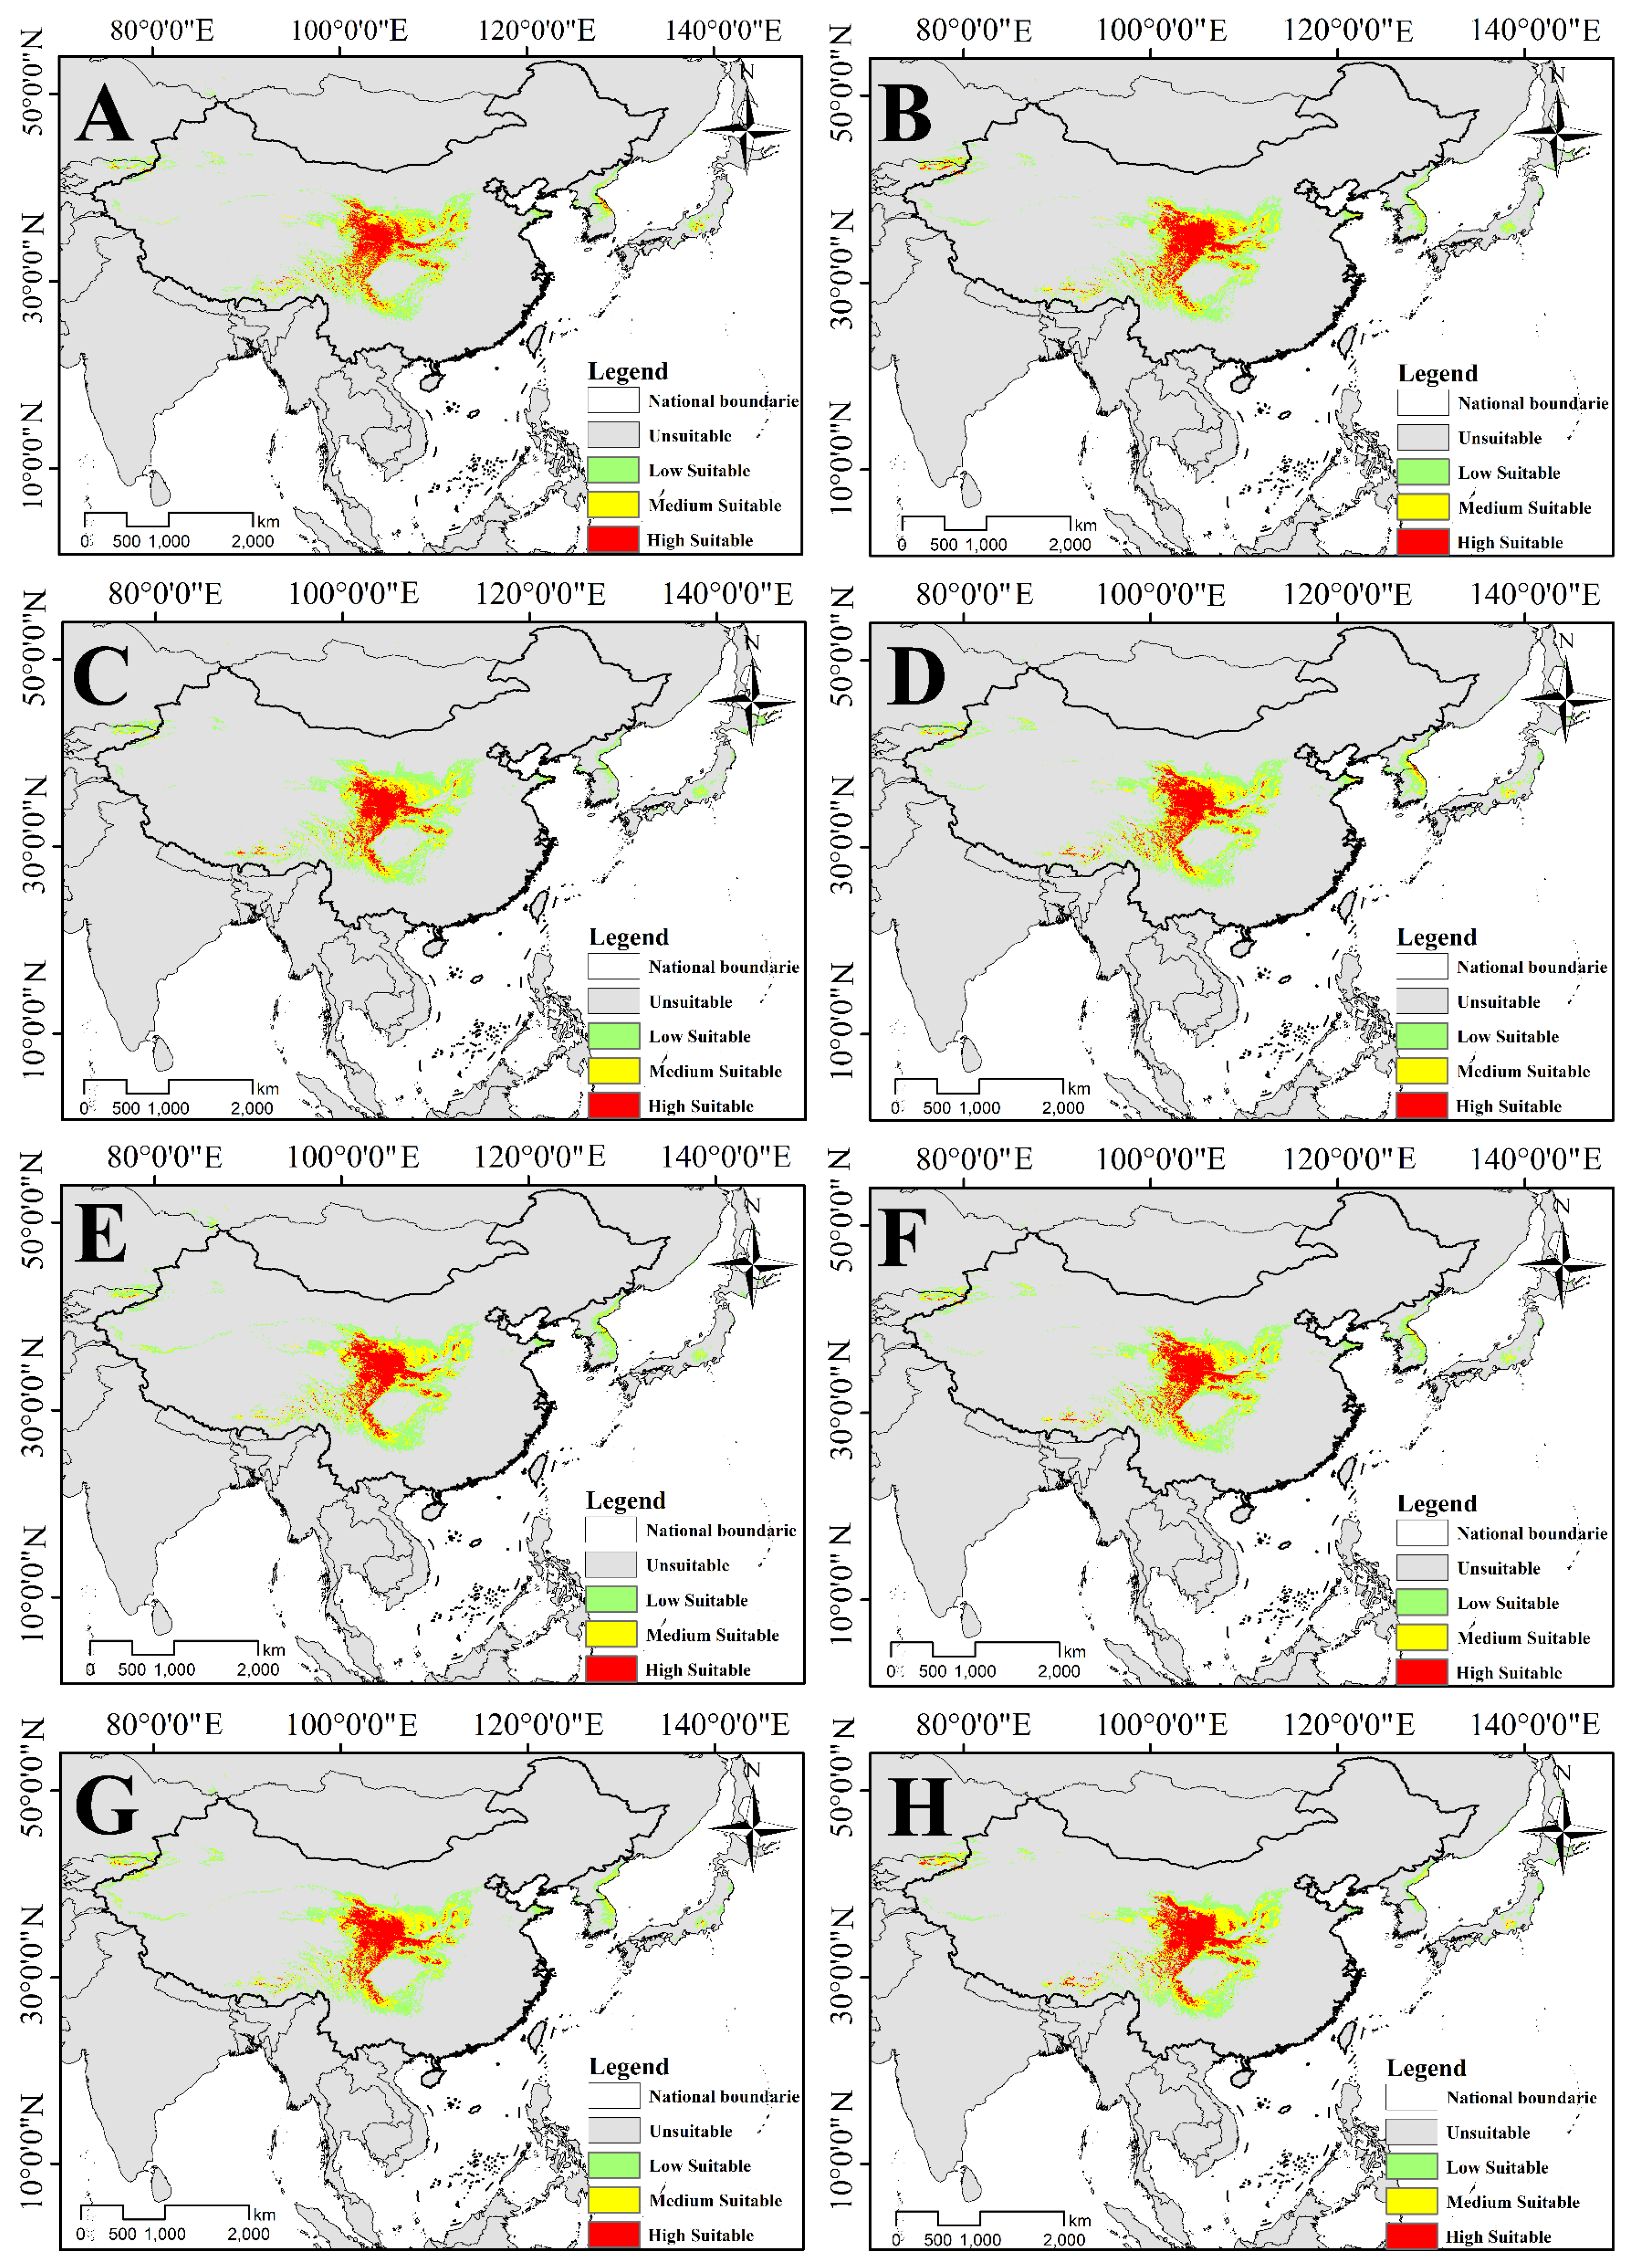
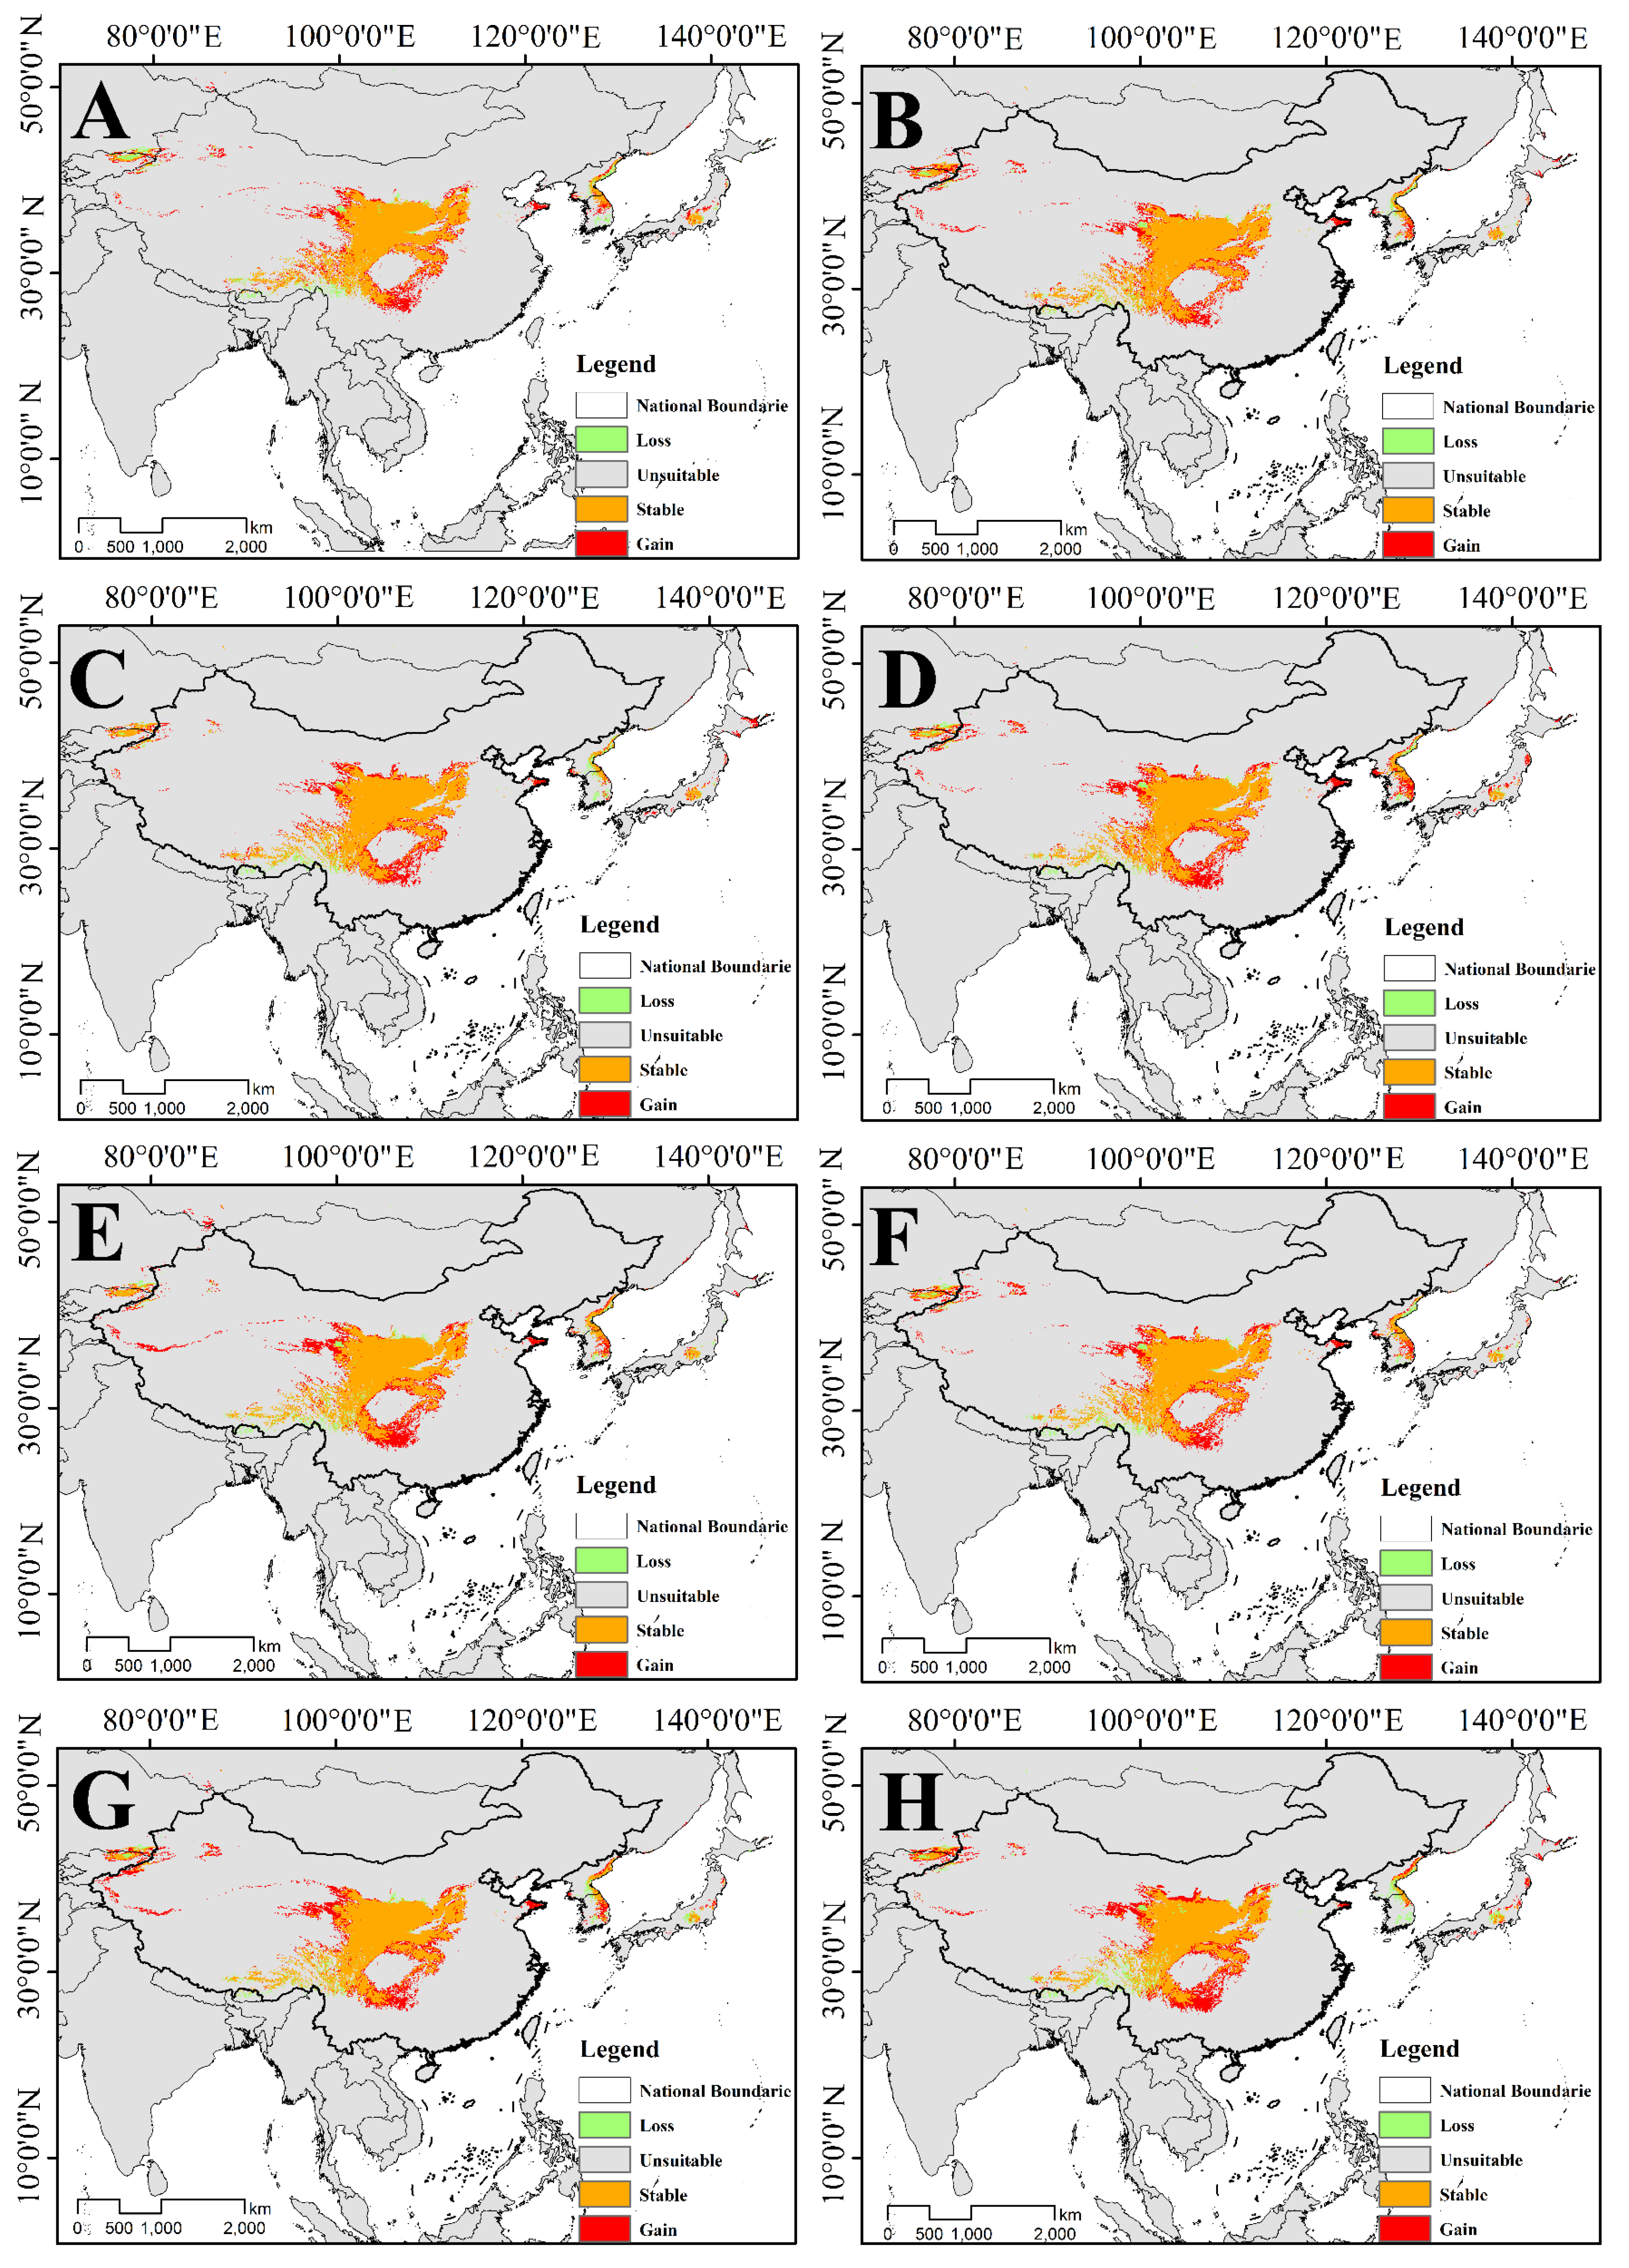
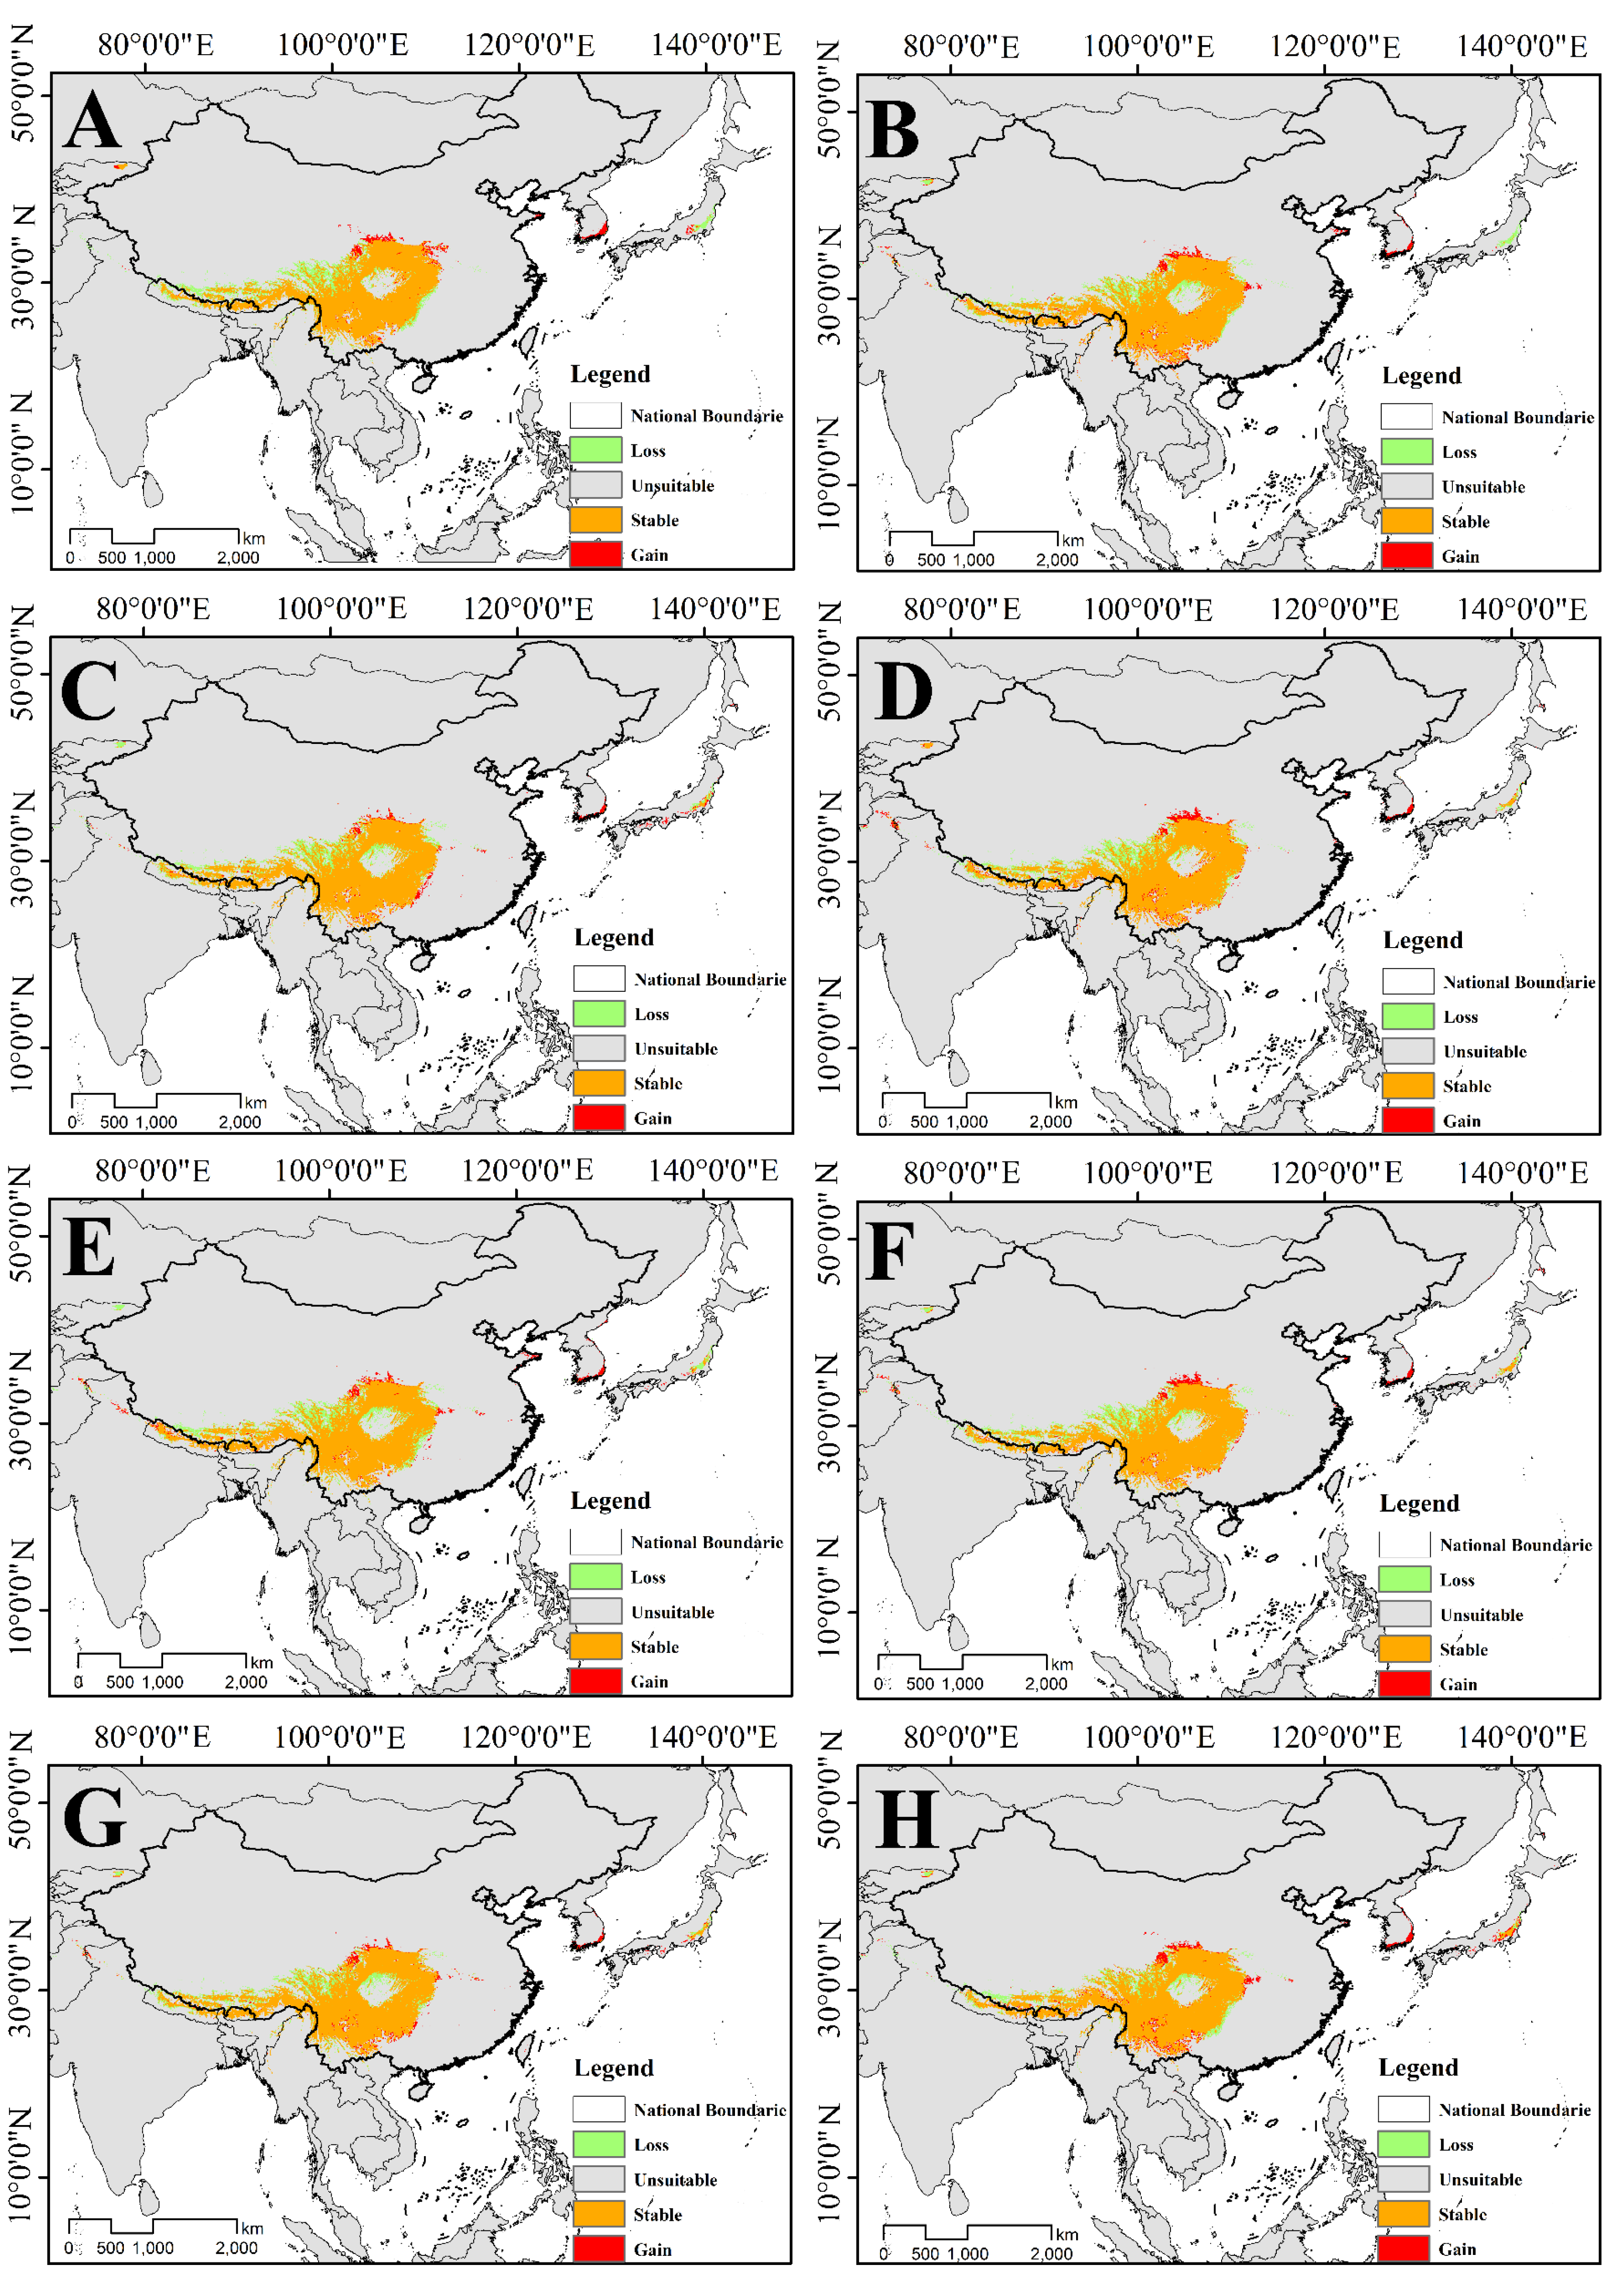
3.4. Distribution and Change of Future Potential Suitable Habitat

3.4.1. Changes in the Suitable Habitat of T. Pinnatifidum

The potential suitable habitat of T. Pinnatifidum under SSP2-4.5 and SSP5-8.5 climate change scenarios in the future is shown in Figure 8 and Table 2. The current potential distribution of T. Pinnatifidum is superposed with the potential distribution of future climate scenarios to obtain the spatial conversion characteristics of a potential suitable habitat (Figure 9). Compared with the current potential suitable areas, the future suitable habitat increases mainly in the south of the Sichuan basin, north and northeast of QTP, the Tianshan mountains, the Shandong peninsula, the northeast of the Korean peninsula and Hokkaido, etc. After the 2070s, a suitable habitat of T. Pinnatifidum will gradually appear near Sakhalin Island and Vladivostok. The decreased area mainly distributed in the southeast of QTP and the south and central Korean Peninsula. In 2030, 2050, 2070 and 2090, under the climate scenario of SSP2-4.5, the suitable habitats of T. Pinnatifidum will be increased by 25.68 × 10⁴ km2, 30.05 × 10⁴ km2, 34.63 × 10⁴ km2 and 38.07 × 10⁴ km2, respectively, compared with that of the present time. While in 2030, 2050, 2070 and 2090, under the SSP5-8.5 climate scenario, the suitable habitats will increase by 34.92 × 10⁴ km2, 40.42 × 10⁴ km2, 31.96 × 10⁴ km2 and 35.13 × 10⁴ km2, respectively. Overall, the suitable area of T. Pinnatifidum shows a significant increase trend. However, under different scenarios and in different periods, the changes of suitable habitat of T. Pinnatifidum were looking slightly different: the suitable area showed a steady upward trend under the SSP2-4.5 scenario, while at the late stage, the net increase area under the SSP5-8.5 scenario was less than that under the SSP2-4.5 scenario.

3.4.2. Changes in the Suitable Habitat of T. himalayanum

Compared to those in the current climate conditions, all potential distributions of T. himalayanum under the two different climate scenarios will decrease (Figure 10; Table 2). The changes in suitable habitat for T. himalayanum are shown in Figure 11. The suitable habitats of T. himalayanum are considerably decreased under all climate scenarios, mainly in the low altitude areas such as the north of the Himalayas, the north of the Hengduan mountains and the inner edge of the Sichuan basin. New suitable habitats will appear on the northeast edge of QTP, the Shandong peninsula and the southern part of the Korean peninsula. Under SSP2-4.5, the loss of potential suitable habitat areas in four different periods is 14.5 × 10⁴ km2, 10.37 × 10⁴ km2, 12.43 × 10⁴ km2 and 8.02 × 10⁴ km2, respectively. Moreover, under the climate scenario of SSP5-8.5, the loss of suitable habitat area is smaller than that of SSP2-4.5; the loss of areas is 6.47 × 10⁴ km2, 8.53 × 10⁴ km2 and 11.4 × 10⁴ km2 in 2030, 2050 and 2070, while in 2090, the potential suitable area of T. himalayanum will slightly increase. Moreover, the highly suitable areas will increase, and the increased area under SSP5-8.5 is greater than the increased area under SS2-4.5.

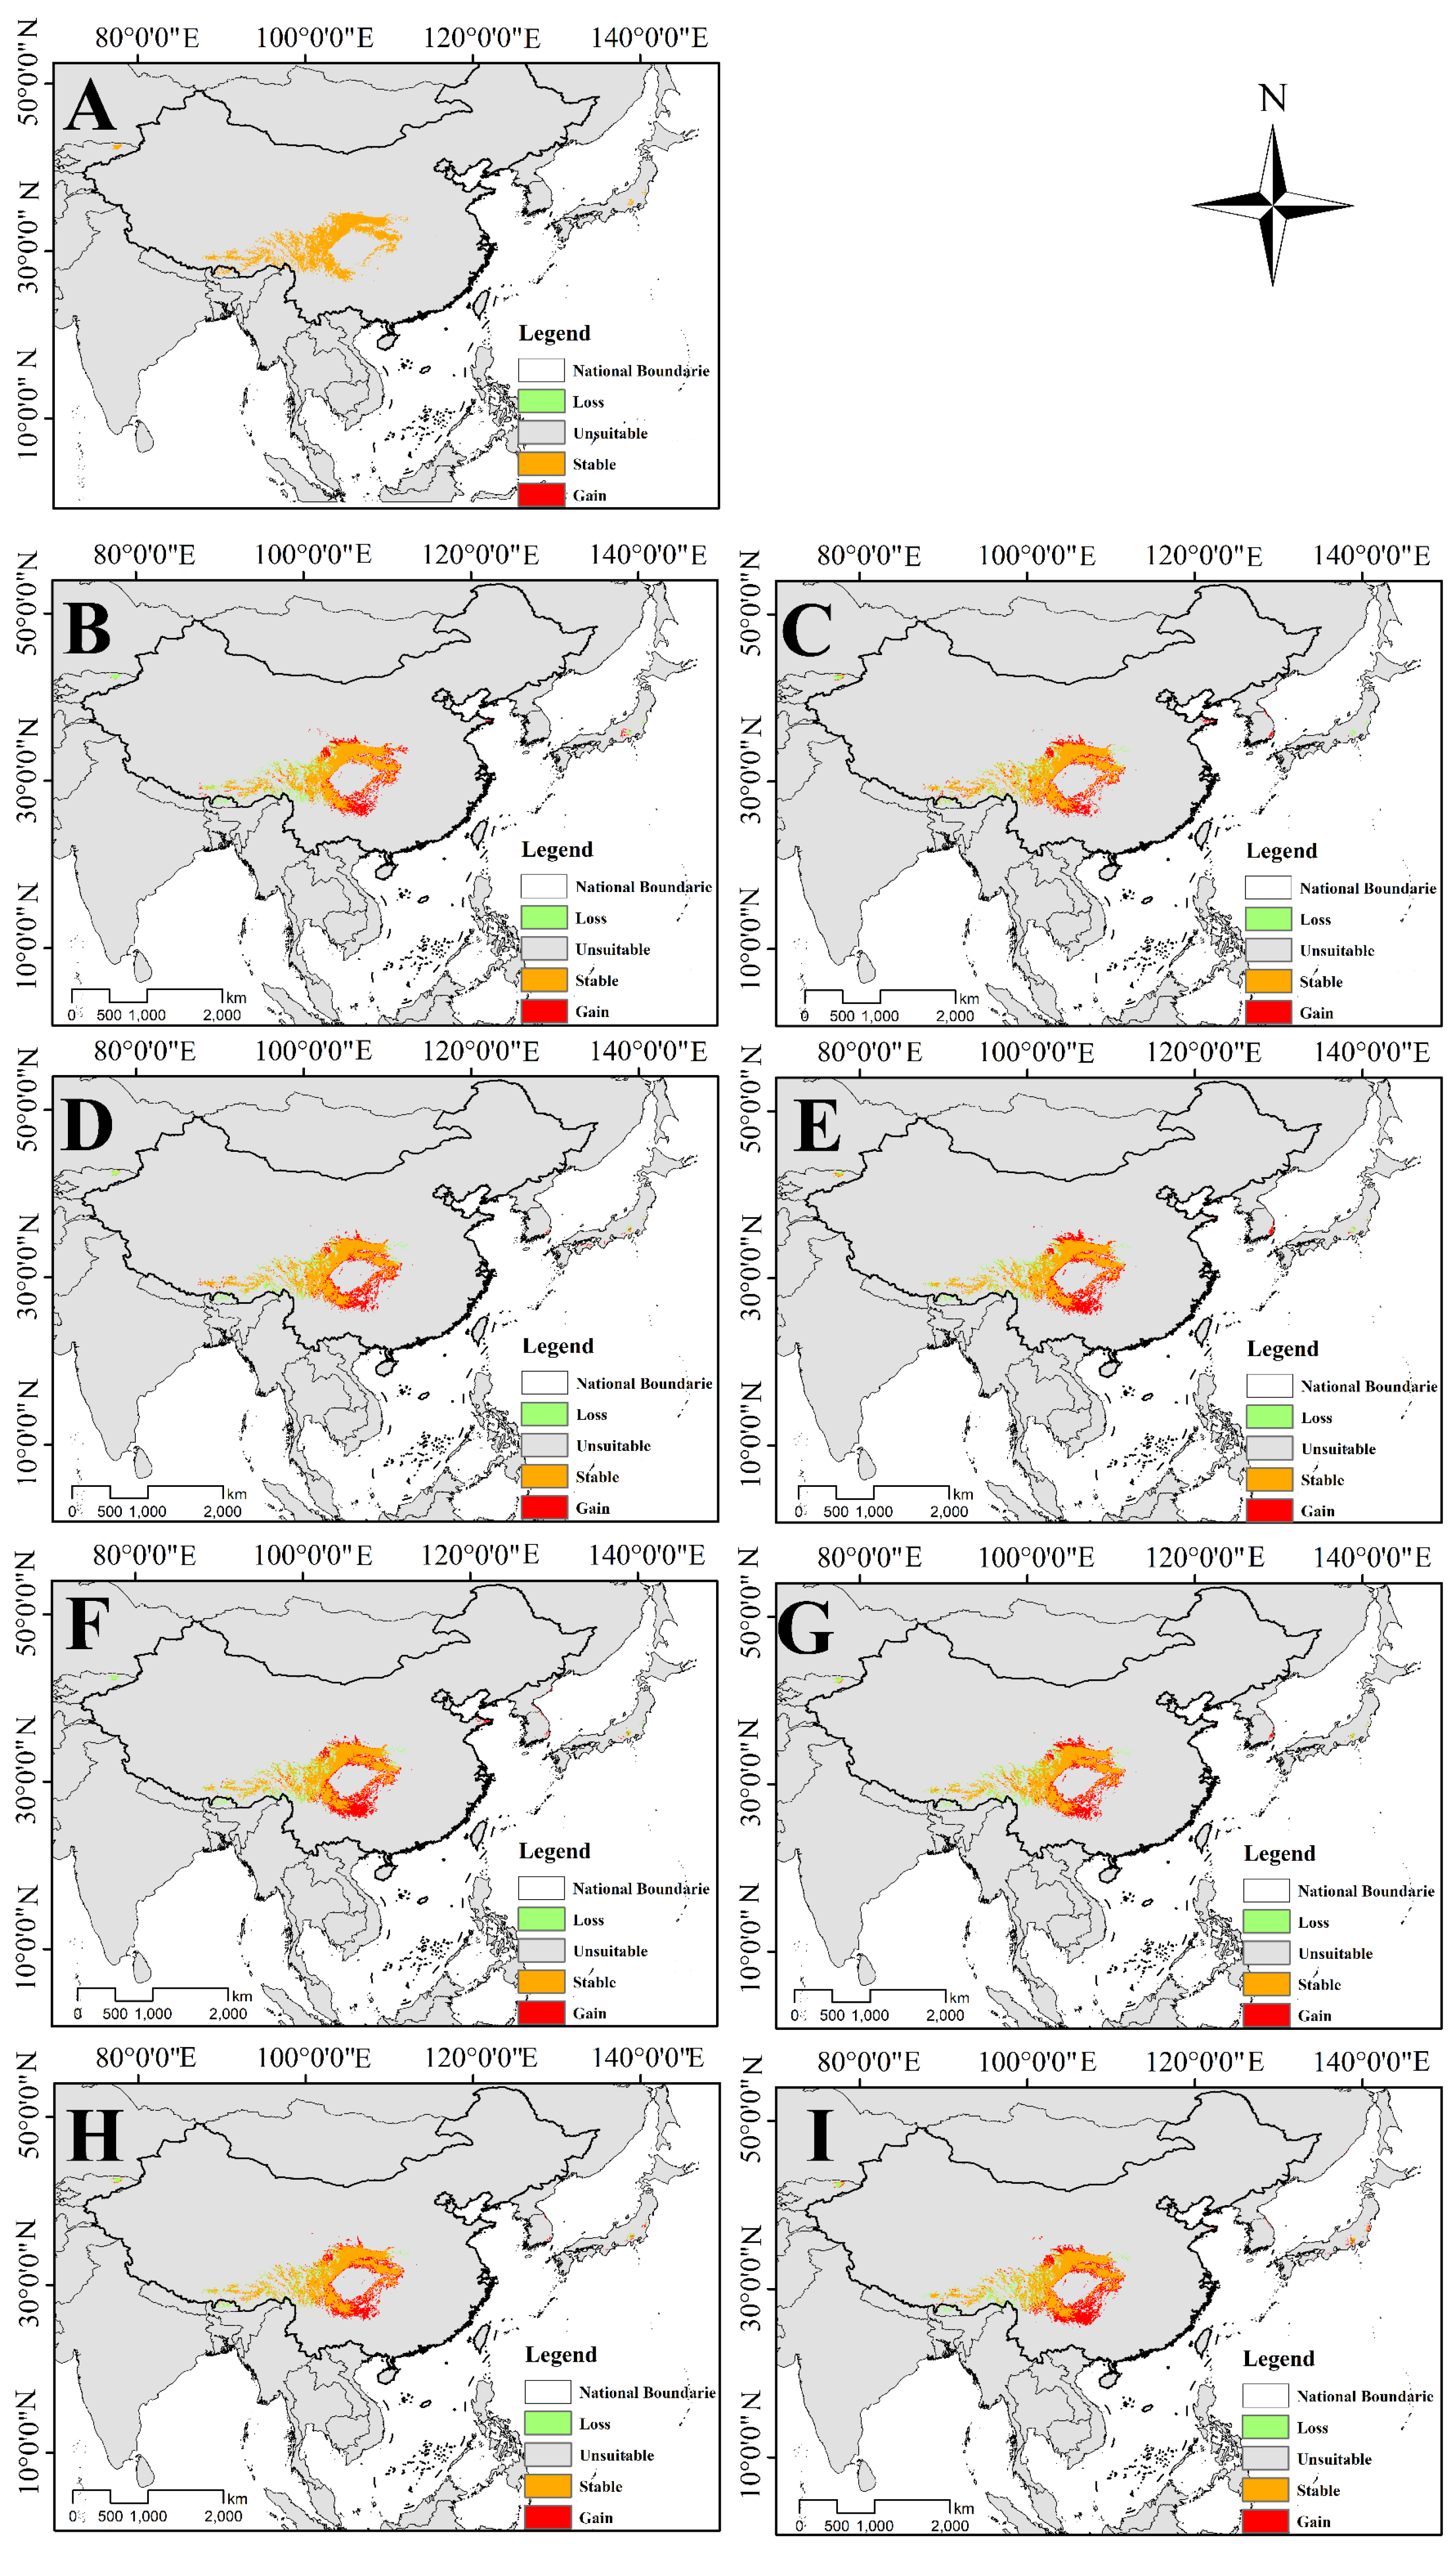
3.4.3. Changes in Overlapping Suitable Habitat of Two Species of Triosteum

The distribution of overlapping suitable areas of T. Pinnatifidum and T. himalayanum was obtained by superposing their distribution maps of potential suitable areas (Figure 12). The result indicates that under the current scenario, the overlapping suitable habitat areas of two species of Triosteum are mainly distributed in the southeast and east of the QTP and Qinba mountains, which is consistent with the previous field investigation results. Under future climate scenarios, the common suitable habitat will gradually shrink from the southeast of the QTP and spread eastward.

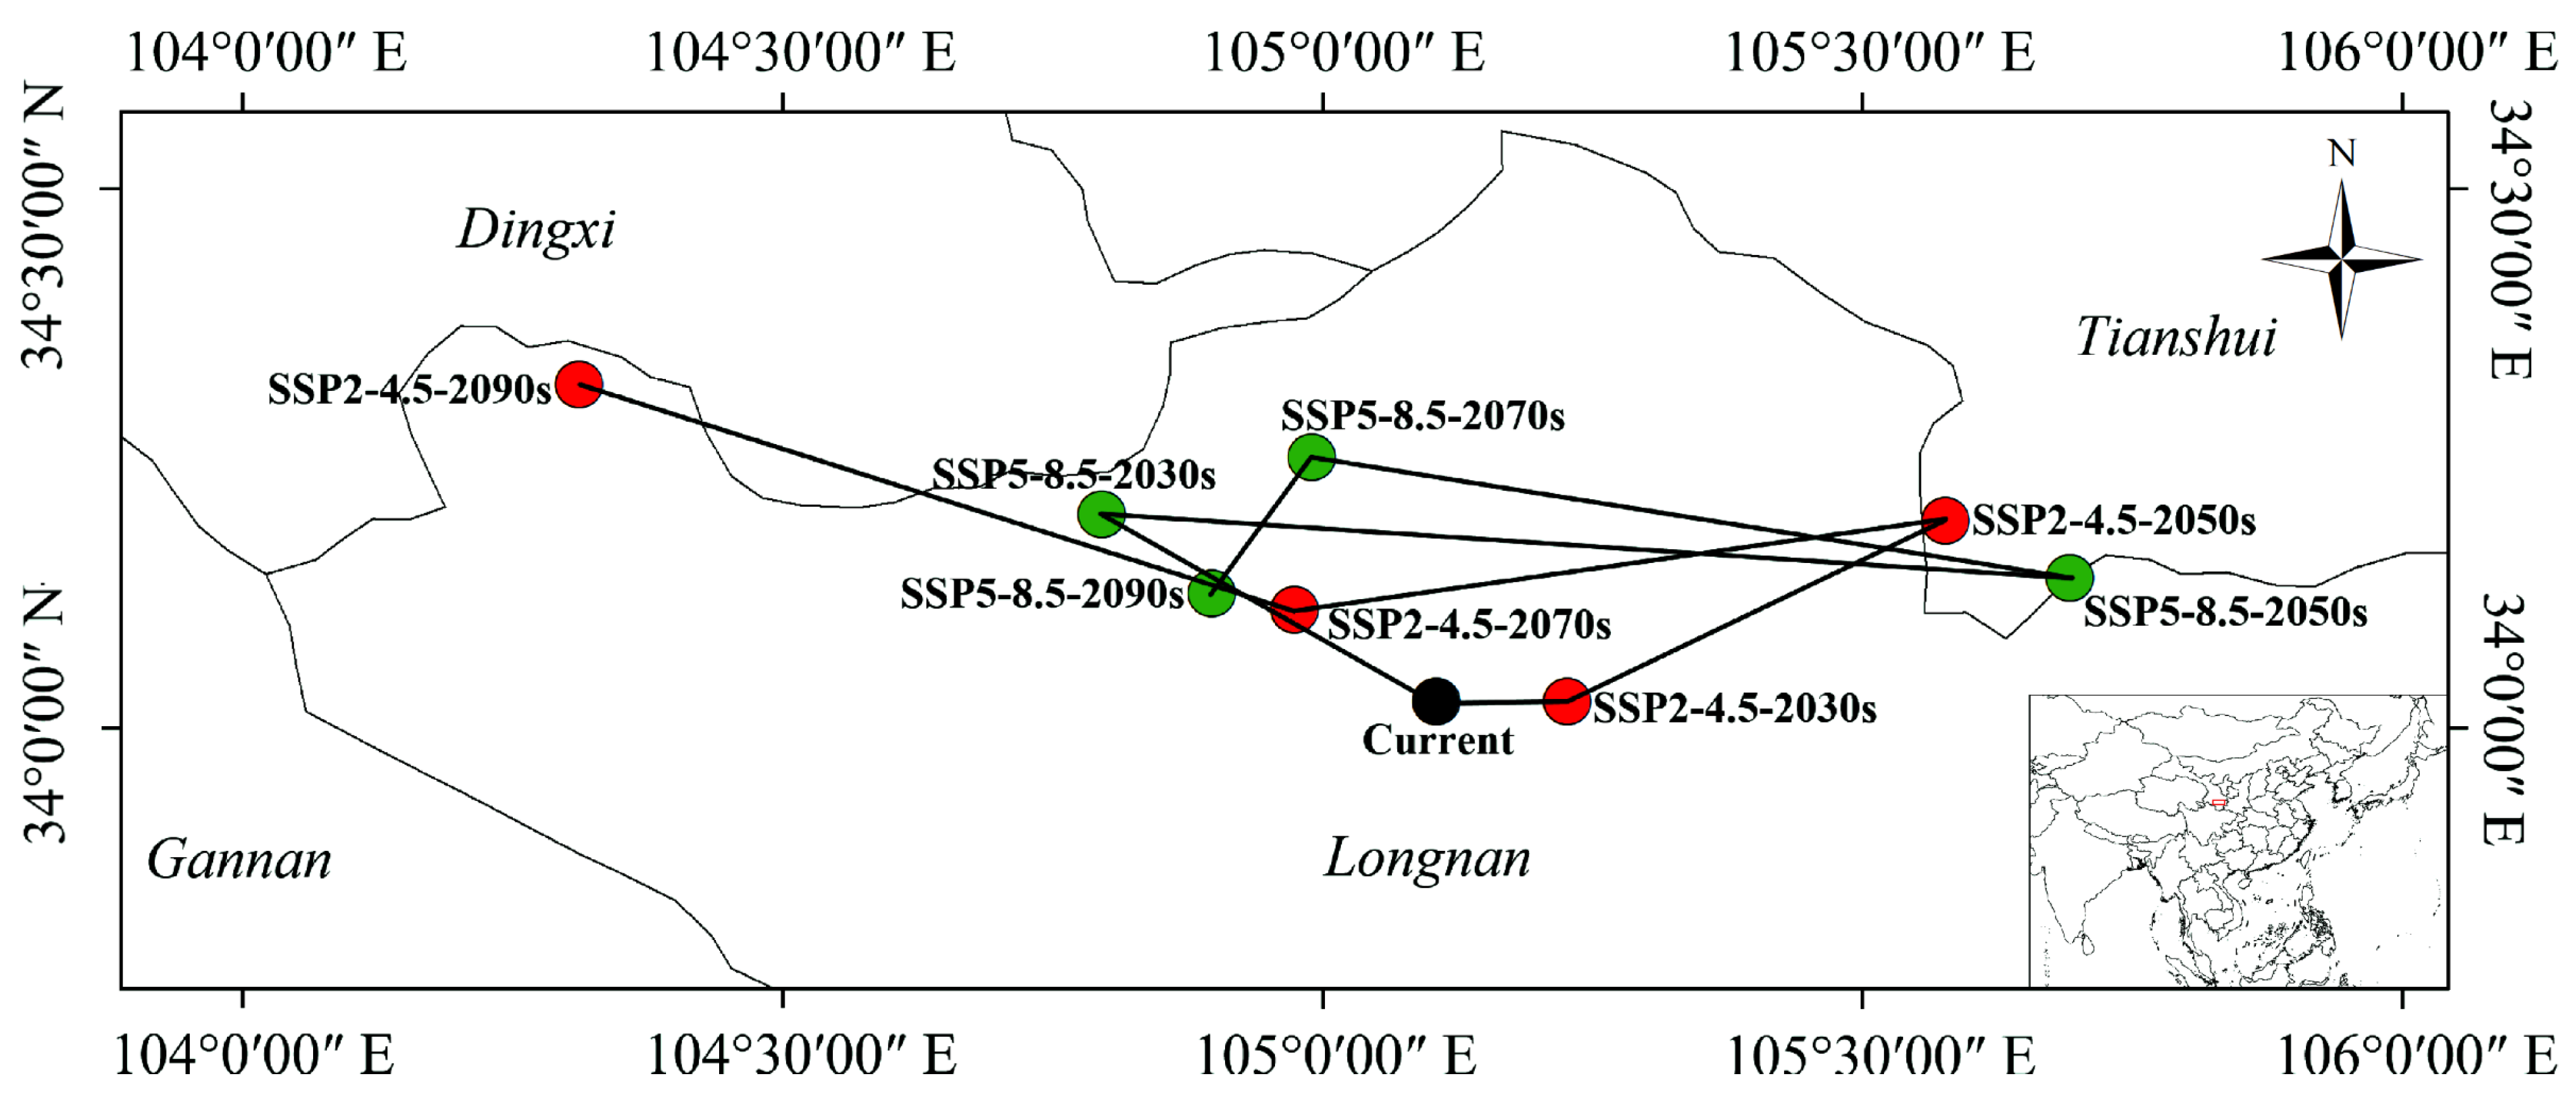
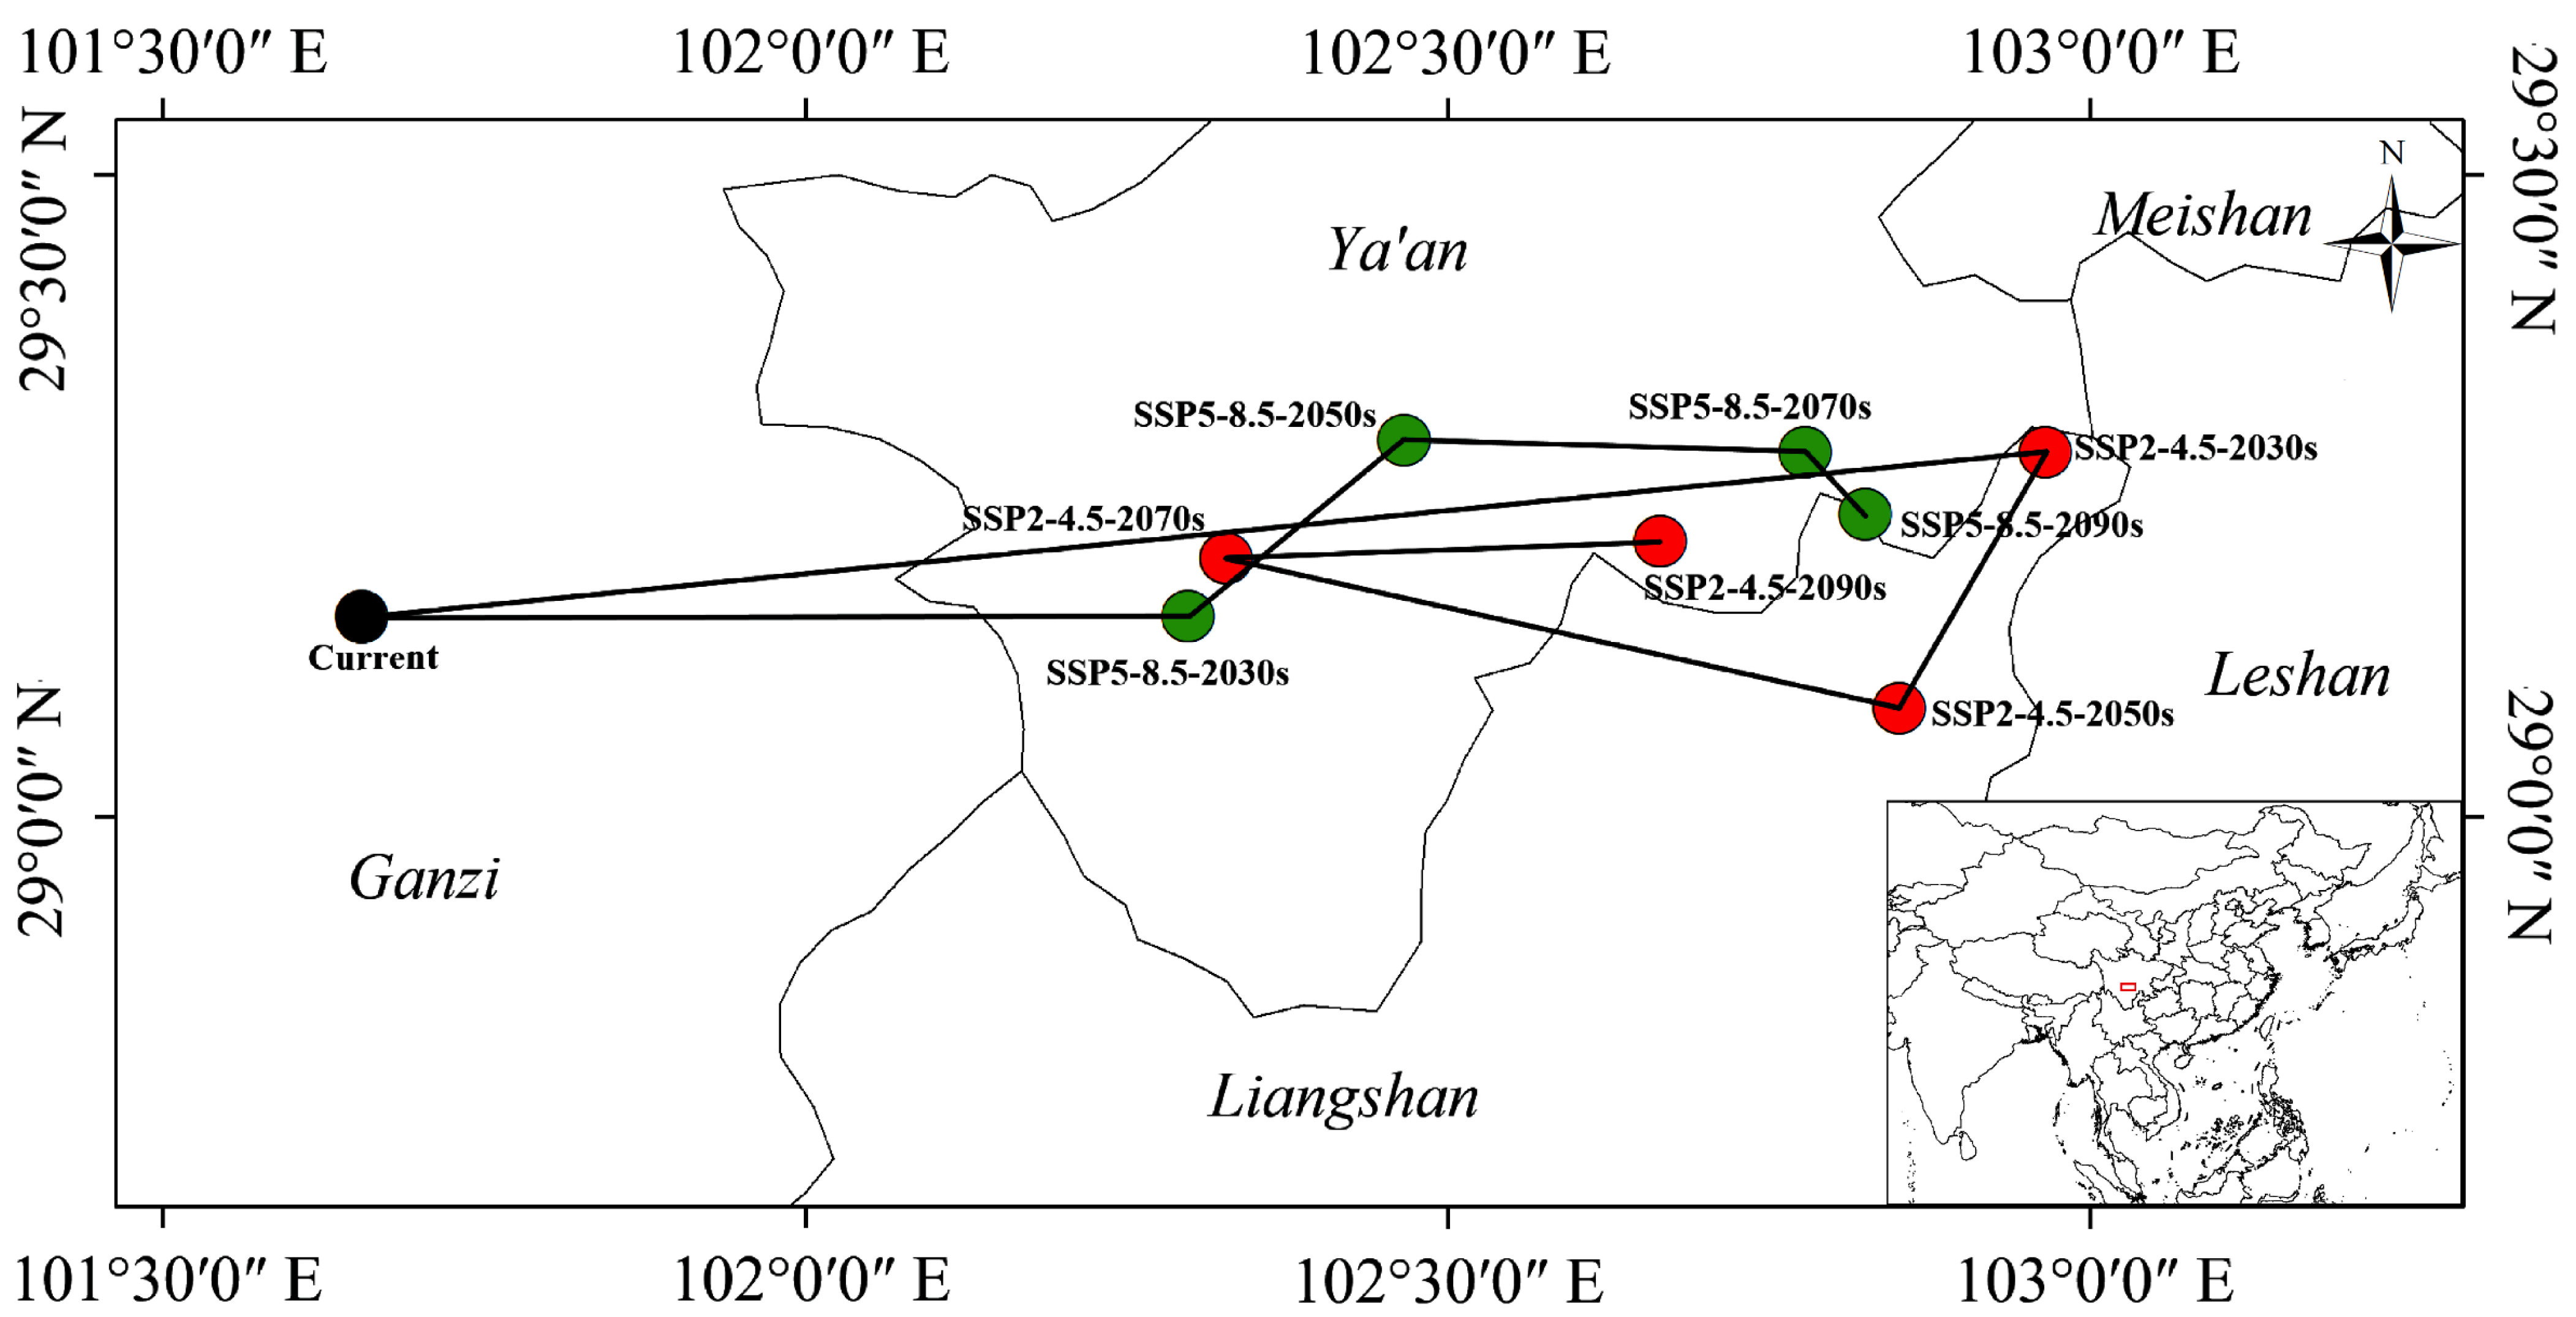
3.5. Changes in Suitable Habitat Centroid under Different Climatic Scenarios

In order to explain the future distribution center and its changes, the SDMToolbox package of ArcGIS was used to track the centroid trajectory of the distribution area of T. Pinnatifidum and T. himalayanum under different SSPs.
The centroid of the potential suitable area of T. Pinnatifidum under current climatic scenario is located at 34°1′29.03″ N, 105°6′16.84″ E (Longnan, Gansu). Under the climate scenario of SSP2-4.5, the centers of the potential suitable areas in the 2030s, 2050s, 2070s and 2090s will be 34°1′30.99″ N, 105°13′35.09″ E (Longnan, Gansu); 34°11′34.85″ N, 105°34′36.461″ E (Tianshui, Gansu); 34°6′37.02″ N, 104°58′25.12″ E (Longnan, Gansu) and 34°19′7.65″ N, 104°18′37.87″ E (Longnan, Gansu), respectively. Compared to the current centroid, the future centroid will shift to the east by 11.24 km, to the northeast by 47.39 km, to the northwest by 15.37 km and by 80.16 km, respectively. Under the climate scenario of SSP5-8.5, the distribution center of the suitable area in the above four time periods will be located at 34°11′55.19″ N, 104°47′42.88″ E (Longnan, Gansu); 34°8′23.92″ N, 105°41′31.82″ E (Tianshui, Gansu); 34°15′7.02″ N, 104°59′22.81″ E (Longnan, Gansu) and 34°7′29.78″ N, 104°53′48.06″ E (Longnan, Gansu). Compared to the current direction, the centroid will shift by 34.46 km to the northwest, 55.71 km to the northeast and shift to the northwest again by 27.35 km and 22.18 km (Figure 13).
In the current climate scenario, the centroid of the potential suitable area of T. himalayanum is located at 29°9′22.23″ N, 101°39′12.37″ E (Ganzi, Sichuan). Under the climate scenario of SSP2-4.5, the centers of potential suitable areas in the 2030s, 2050s, 2070s and 2090s are located at 29°17′2.61″ N, 102°57′53.03″ E (Liangshan, Sichuan); 29°5′6.45″ N, 102°51′5.27″ E (Liangshan, Sichuan); 29°12′7.06″ N, 102°19′38.03″ E (Ya’an, Sichuan) and 29°12′52.94″ N, 102°39′53.31″ E (Ya’an, Sichuan), respectively. Compared to the current distribution center, it moves by 128.28 km, 116.86 km, 65.74 km and 98.58 km to the east. Under the climate conditions of SSP585, the centroid of the suitability areas in the 2030s, 2050s, 2070s and 2090s is 29°9′22.23″ N, 102°17′49.27″ E (Ya’an, Sichuan); 29°17′36.19″ N, 102°27′54.90″ E (Ya’an, Sichuan); 29°17′2.61″ N, 102°46′40.25″ E (Ya’an, Sichuan) and 29°14′8.31″ N, 102°49′29.59″ E (Liangshan, Sichuan), respectively. The centroid will shift eastward 62.62 km, 80.38 km, 110.24 km and 114.27 km from the current (Figure 14).

3.6. Niche Analysis of T. Pinnatifidum and T. himalayanum

Based on the results of MaxEnt, ENMTools was used to estimate the niche overlap, range overlap and niche breadth of these two species of Triosteum. The range overlap threshold was set at 0.2. The niche overlap degree of T. Pinnatifidum and T. himalayanum was recorded high, with D and I values of 0.439597 and 0.714068, respectively. The niche breadth of T. himalayanum is slightly higher than that of T. Pinnatifidum but both are very close to the value of 0.85. The range overlap between the two species is about 0.46 (Table 3).

4. Discussion

T. Pinnatifidum and T. himalayanum are typical alpine species that are distributed in the QTP and its surroundings. In this study, the suitable areas of T. Pinnatifidum and T. himalayanum in current and future climate scenarios were simulated. The research on its distribution pattern can help to explain the speciation of this genus, so as to infer the response mechanism of herbaceous plants to climate changes. Moreover, this research would provide a foundation for the ecological restoration of the QTP and its adjacent mountains.

4.1. Accuracy of Model Prediction

SDMs simulate and predict the potential suitable areas of species based on species geospatial information, while the actual distribution of species is part of the potential distribution area of predicted results [48]. Among the SDMs, the MaxEnt model is widely used in the research field of ecology, biogeography, evolution and conservation biology [49]. Using optimized default settings before running MaxEnt can improve the accuracy of model prediction, which is of great benefit to our research [9,50,51,52]. Here, an R package “KUENM” was used to adjust the default parameters of MaxEnt to maximize model prediction accuracy. The AUC values of the final results of these two species are 0.974 and 0.975, respectively. As in other studies, the AUC values were greater than 0.9, indicating that the prediction accuracy is excellent and could be used for further analysis [53,54].

4.2. Effects of Environmental Variables on Species Distribution

Climate is considered to be the most important driving factor controlling the geographical distribution of plants [55]. Moreover, precipitation and temperature conditions are considered to play key roles in their distribution patterns [56]. The present study revealed that the main bioclimatic variables affecting the potential suitable distribution of two species of Triosteum are the major four temperature variables, viz., mean temperature of the coldest quarter, mean temperature of the driest quarter, temperature seasonality and temperature annual range, respectively (Figure 5 and Figure 6). It is indicated that the temperature factors have a great impact on the distribution of these two species of Triosteum. It is considered to be suitable for areas where with a high annual range of temperature. The results of the present study are consistent with the habitats of the two species recorded in the Flora Reipublicae Popularis Sinicae. In previous research by others, it has been suggested that cold temperatures are needed for seed germination [57,58]. In addition, in our previous germination experiments, the seed germination of Triosteum was difficult under room temperature due to dormancy. However, when the seeds were kept at 0 °C for about 20 days, the seeds germinated easily. This indicates that the seed germination of Triosteum is similar to other temperate plants; hence, it is confirmed that seeds of Triosteum require a chilling temperature for the breaking of dormancy [59]. The low temperature in the driest quarter and coldest quarter could provide cold temperature conditions for germination. Therefore, the low temperature environment could limit its distribution by affecting its germination. Moreover, as mentioned in introduction, Triosteum grows in a humid environment (mainly in understory), so precipitation has little direct effect on it.

4.3. Potential Suitability Analysis, Distribution Pattern and Centroid Changes of T. Pinnatifidum and T. himalayanum

Global warming has forced herbaceous plants to higher elevations [60,61], but the warming trend may also reduce the distribution of species that originally live in high mountain areas [62,63].
In this study, the prediction results of the MaxEnt model showed that the potential suitable habitat of T. Pinnatifidum under the four climate scenarios in the future will increase compared with the current suitable habitat. The results also reveals that the suitable area of T. Pinnatifidum will expand to different degrees in SSP2-4.5 and SSP5-8.5 scenarios. In the SSP2-4.5 scenario, the overall suitable area of T. Pinnatifidum will increase, while in the SSP5-8.5 scenario, the suitable area initially will increase (before 2070s) and then will fluctuate (after 2070s). In addition, the suitable areas of T. Pinnatifidum have an expansion trend to high altitude areas, which is consistent with the above scene. However, for T. himalayanum, there is a decreasing trend in its potential suitable habitat. The suitable habitat will be lost in high-altitude areas near the north Hengduan Mountains and south of the QTP. Additionally, an upward trend is also revealed in the areas west of Kunming city. In addition, the suitable habitat also tend to expand to the north. This trend may be due to the warming of the climate. It leads to the changes of some original low-latitude suitable areas into low-suitable areas or non-suitable areas. The results indicate that global warming has a strong impact on the potential distribution area of Triosteum. Global warming will benefit the survival of T. Pinnatifidum; however, it would be detrimental to the survival of T. himalayanum.
The center of the potential suitable area of T. Pinnatifidum at the current climate scenario is in Longnan city, south of Gansu Province. In the future, the center of the distribution area of T. Pinnatifidum will migrate to higher latitudes under the two SSPs. This is consistent with previous studies which have shown that climate warming will lead to the migration of plants to high-altitude and high-latitude areas [64,65]. The center of the potential suitable area of T. himalayanum is in the west of Sichuan Province, China. It will move to the east in the future. It is related to the decrease of suitable distribution areas in QTP. It also showed that the centroid would not always move in the same direction. The results are consistent with previous studies that the small time span would result in a complex trajectory [66,67].

4.4. Change of Potential Overlapping Distribution Area and Ecological Niche Analysis of Two Species of Triosteum

According to the prediction results of MaxEnt, there is a large potential overlapping suitable area between T. Pinnatifidum and T. himalayanum. It is also found that the two species are distributed several meters apart in the wild. Usually, this distribution pattern will result in hybridization between species. Furthermore, in the field investigation, an intermediate type of two species was found (also illustrated by Gould and Donoghue [68]), which could be speculated that there is hybridization between these two species. The large overlapping suitable area between T. Pinnatifidum and T. himalayanum will promote the possibility of interbreeding. However, in the future, the overlapping distribution area will decrease in the southeast of QTP but will increase in the northeast edge of the QTP, in the Qinba mountains and south of the Sichuan Basin, and the increasing area is greater than the decreasing area. Therefore, the change of overlapping distribution would be beneficial to the hybridization of T. Pinnatifidum and T. himalayanum. Moreover, in our sampling and specimen records, there is no distribution record of T. Pinnatifidum in the south of the QTP. So, a reduced range of suitable regions in this area would not harm its hybridization.
Niche overlap and niche breadth usually reflect the adaptability of species to the environment. A larger niche breadth means a species is more adaptable to its environment [69]. Similarly, a wider overlap range indicates a higher degree of niche overlap between the two species [45,69,70]. Due to limited habitat resources, niche overlap may exist between sympatric species, leading to intensified competition among species [71]. In this study, it was found that there is a high niche overlap degree and similar niche breadth in the current climate, which proves that there will be strong interspecific competition in the overlapping distribution area of the two species. In the future, with the increase of overlapping distribution area of these two species, this competition will be intensified.

4.5. The Benefits and Limitations of the Modeling

Ecological niche modeling has been recognized as an efficient and extensive approach to provide relevant guidelines for managing species in the presence of global climate change [72]. Previous studies have shown that the Maximum Entropy Model (MaxEnt) has the best accuracy among various SDMs, especially for those species with incomplete distribution information. However, there are still limitations. For example, only climate and topography variables were considered in this study, and other factors such as vegetation, landscape, soil, light and air were not considered in the modeling. In future studies, we should incorporate them for analysis.

5. Conclusions

Assessing the impact of climate change on plant distribution is important for plant conservation. In this study, the KUENM package and MaxEnt model were used to predict the potential suitable habitat of T. Pinnatifidum and T. himalayanum in China and its surroundings in the context of climate change. Because of the advantages of the model and the large number of distributed data, this result is considered to be accurate. The main variables affecting their distribution were determined. The temperature factors have a greater effect on the distribution of these two species. Under climate change, the suitable area of T. Pinnatifidum will expand, while that of T. himalayanum will decrease. However, the overlapping habitat between these two species will increase, possibly promoting interspecific competition. Predicting the distribution pattern of T. Pinnatifidum and T. himalayanum can provide a reference for resource conservation and sustainable utilization of Triosteum and other alpine species.

Supplementary Materials

The following supporting information can be downloaded at: https://www.mdpi.com/article/10.3390/su15065604/s1, Table S1: Distribution data from field investigation.

Author Contributions

Conceptualization, H.L.; methodology, H.L.; software, Q.Y., Z.Y. and X.L.; validation, H.L. and W.L.; formal analysis, Z.Y. and Y.G.; investigation, X.L.; resources, H.L.; data curation, H.L.; writing—original draft preparation, X.L.; writing—review and editing, H.L., I.A., D.Z. and R.X.; visualization, X.L.; supervision, Q.Y.; project administration, H.L.; funding acquisition, H.L. All authors have read and agreed to the published version of the manuscript.

Funding

This research was funded by National Natural Science Foundation of China, grant number 32260059; CAS Light of West China Program (2022); Joint Grant from Chinese Academy of Science -People’s Government of Qinghai Province on Sanjiangyuan National Park, grant number LHZX-2021-04.

Institutional Review Board Statement

Not applicable.

Informed Consent Statement

Not applicable.

Data Availability Statement

The data supporting the results are available in a public repository at: https://doi.org/10.6084/m9.figshare.21456300 (accessed on 2 November 2022). https://doi.org/10.6084/m9.figshare.21456297 (accessed on 2 November 2022).

Conflicts of Interest

The authors declare no conflict of interest.

References

  1. Zhao, Q.; Mi, Z.; Lu, C.; Zhang, X.; Chen, L.; Wang, S.; Niu, J.; Wang, Z. Predicting potential distribution of Ziziphus spinosa (Bunge) H.H. Hu ex F.H. Chen in China under climate change scenarios. Ecol. Evol. 2022, 12, e8629. [Google Scholar] [CrossRef]
  2. Zhang, K.; Liu, H.; Pan, H.; Shi, W.; Zhao, Y.; Li, S.; Liu, J.; Tao, J. Shifts in potential geographical distribution of Pterocarya stenoptera under climate change scenarios in China. Ecol. Evol. 2020, 10, 4828–4837. [Google Scholar] [CrossRef] [Green Version]
  3. Yan, X.; Wang, S.; Duan, Y.; Han, J.; Huang, D.; Zhou, J. Current and future distribution of the deciduous shrub Hydrangea macrophylla in China estimated by MaxEnt. Ecol. Evol. 2021, 11, 16099–16112. [Google Scholar] [CrossRef] [PubMed]
  4. Arshad, F.; Waheed, M.; Fatima, K.; Harun, N.; Iqbal, M.; Fatima, K.; Umbreen, S. Predicting the Suitable Current and Future Potential Distribution of the Native Endangered Tree Tecomella undulata (Sm.) Seem. in Pakistan. Sustainability 2022, 14, 7215. [Google Scholar] [CrossRef]
  5. Grimm, N.B.; Chapin, F.S., III; Bierwagen, B.; Gonzalez, P.; Groffman, P.M.; Luo, Y.; Melton, F.; Nadelhoffer, K.; Pairis, A.; Raymond, P.A. The impacts of climate change on ecosystem structure and function. Front. Ecol. Environ. 2013, 11, 474–482. [Google Scholar] [CrossRef] [Green Version]
  6. Liu, L.; Guan, L.; Zhao, H.; Huang, Y.; Mou, Q.; Liu, K.; Chen, T.; Wang, X.; Zhang, Y.; Wei, B.; et al. Modeling habitat suitability of Houttuynia cordata Thunb (Ceercao) using MaxEnt under climate change in China. Ecol. Inform. 2021, 63, 101324. [Google Scholar] [CrossRef]
  7. Soilhia, Z.; Sayaria, N.; Benalouacheb, N.; Mekkia, M. Predicting current and future distributions of Mentha pulegium L. in Tunisia under climate change conditions, using the MaxEnt model. Ecol. Inform. 2022, 68, 101533. [Google Scholar] [CrossRef]
  8. Koo, K.A.; Park, S.U.; Kong, W.S.; Hong, S.; Jang, I.; Seo, C. Potential climate change effects on tree distributions in the Korean Peninsula: Understanding model & climate uncertainties. Ecol. Model. 2017, 353, 17–27. [Google Scholar] [CrossRef]
  9. Zhao, Y.; Deng, X.; Xiang, W.; Chen, L.; Ouyang, S. Predicting potential suitable habitats of Chinese fir under current and future climatic scenarios based on Maxent model. Ecol. Inform. 2021, 64, 101393. [Google Scholar] [CrossRef]
  10. Zhao, R.; He, Q.; Chu, X.; Lu, Z.; Zhu, Z. Prediction of potential distribution of Carpinus cordata in China under climate change. Chin. J. Appl. Ecol. 2019, 30, 3833–3843. [Google Scholar] [CrossRef]
  11. Qin, A.; Liu, B.; Guo, Q.; Bussmann, R.; Ma, F.; Jian, Z.; Xu, G.; Pei, S. Maxent modeling for predicting impacts of climate change onthe potential distribution of Thuja sutchuenensis Franch., an extremely endangered conifer from southwestern China. Glob. Ecol. Conserv. 2017, 10, 139–146. [Google Scholar] [CrossRef]
  12. Boyce, M.; McDonald, L. Relating populations to habitats using resource selection functions. Trends Ecol Evol. 1999, 14, 268–272. [Google Scholar] [CrossRef] [PubMed]
  13. McCullagh, P.; Nelder, J.A. Generalized Linear Models; Chapman & Hall: London, UK, 1989. [Google Scholar]
  14. Ripley, B.D. Pattern Recognition and Neural Networks; Cambridge University Press: Cambridge, UK, 1996. [Google Scholar]
  15. Breiman, L.; Friedman, J.; Stone, C.J.; Olshen, R.A. Classification and Regression Trees; Chapman & Hall: London, UK, 1984. [Google Scholar]
  16. Phillips, S.J.; Dudı’k, M.; Schapire, R.E. A maximum entropy approach to species distribution modeling. In Proceedings of the Twenty-First International Conference on Machine Learning, Banff, AB, Canada, 4–8 July 2004; p. 83. [Google Scholar]
  17. Wang, G.; Wang, C.; Guo, Z.; Dai, L.; Wu, Y.; Liu, H.; Li, Y.; Chen, H.; Zhang, Y.; Zhao, Y.; et al. Integrating Maxent model and landscape ecology theory for studying spatiotemporal dynamics of habitat: Suggestions for conservation of endangered Red-crowned crane. Ecol. Indic. 2020, 116, 106427. [Google Scholar] [CrossRef]
  18. Elith, J.; Phillips, S.J.; Hastie, T.; Dudík, M.; Chee, Y.E.; Yates, C.J. A statistical explanation of MaxEnt for ecologists. Divers. Distrib. 2011, 17, 43–57. [Google Scholar] [CrossRef]
  19. Phillips, S.J.; Dudík, M. Modeling of species distributions with Maxent: New extensions and a comprehensive evaluation. Ecography 2008, 31, 161–175. [Google Scholar] [CrossRef]
  20. Ye, X.; Zhang, M.; Lai, W.; Yang, M.; Fan, H.; Chen, S.; Liu, B. Prediction of potential suitable distribution of Phoebe bournei based on MaxEnt optimization model. Acta Ecol. Sin. 2021, 41, 8135–8144. [Google Scholar] [CrossRef]
  21. Qi, S.; Luo, W.; Chen, K.L.; Li, X.; Luo, H.L.; Yang, Z.Q.; Yin, D.M. The Prediction of the Potentially Suitable Distribution Area of Cinnamomum mairei H. Lév in China Based on the MaxEnt Model. Sustainability 2022, 14, 7682. [Google Scholar] [CrossRef]
  22. Li, Z.; Liu, Y.; Zeng, H. Application of the MaxEnt model in improving the accuracy of ecological red line identification: A case study of Zhanjiang, China. Ecol. Indic. 2022, 137, 108767. [Google Scholar] [CrossRef]
  23. Xu, B.S.; Hu, J.Q.; Wang, J.H. (Eds.) Flora Reipublicae Popularis Sinicae; Science Press: Beijing, China, 1988; pp. 72–105. [Google Scholar]
  24. Cao, D.; LI, T.; WU, L.; Ge, L.; Lei, Y. Study on the morphology and histology of Triosteum pinnatifidum. West China J. Pharm. Sci. 2014, 29, 056–058. [Google Scholar] [CrossRef]
  25. Liu, H.R.; Khan, G.; Gao, Q.B.; Zhang, F.Q.; Liu, W.H.; Wang, Y.F.; Fang, J.; Chen, S.L.; Afridi, S.G. Dispersal into the Qinghai–Tibet plateau: Evidence from the genetic structure and demography of the alpine plant Triosteum pinnatifidum. PeerJ 2022, 10, e12754. [Google Scholar] [CrossRef]
  26. Liu, H.R.; Gao, Q.B.; Zhang, F.Q.; Khan, G.; Chen, S.L. Westwards and northwards dispersal of Triosteum himalayanum (Caprifoliaceae) from the Hengduan Mountains region based on chloroplast DNA phylogeography. PeerJ 2018, 6, e4748. [Google Scholar] [CrossRef] [Green Version]
  27. Braunisch, V.; Suchant, R. Predicting species distributions based on incomplete survey data: The trade-off between precision andscale. Ecography 2010, 33, 826–840. [Google Scholar] [CrossRef]
  28. Hefley, T.J.; Baasch, D.M.; Tyre, A.J.; Blankenship, E.E. Correction of location errors for presence-only species distribution models. Methods Ecol. Evol. 2014, 5, 207–214. [Google Scholar] [CrossRef] [Green Version]
  29. Brown, J.L.; Bennett, J.R.; French, C.M. SDMtoolbox 2.0: The next generation Python-based GIS toolkit for landscape genetic, biogeographic and species distribution model analyses. PeerJ 2017, 5, e4095. [Google Scholar] [CrossRef] [PubMed] [Green Version]
  30. Tang, C.Q.; Matsui, T.; Ohashi, H.; Dong, Y.F.; Momohara, A.; Herrando-Moraira, S.; Qian, S.; Yang, Y.; Ohsawa, M.; Luu, H.T.; et al. Identifying long-term stable refugia for relict plant species in East Asia. Nat. Commun. 2018, 9, 4488. [Google Scholar] [CrossRef] [PubMed] [Green Version]
  31. Fick, S.E.; Hijmans, R. WorldClim 2: New 1 km spatial resolution climate surfaces for global land areas. Int. J. Climatol. 2017, 37, 4302–4315. [Google Scholar] [CrossRef]
  32. Wu, T.; Lu, Y.; Fang, Y.; Xin, X.; Li, L.; Jie, W.; Zhang, J.; Liu, Y.; Zhang, L.; Zhang, F.; et al. The Beijing Climate Center Climate System Model (BCC-CSM): The main progress from CMIP5 to CMIP6. Geosci. Model Dev. 2019, 12, 1573–1600. [Google Scholar] [CrossRef] [Green Version]
  33. O’Neill, B.C.; Tebaldi, C.; van Vuuren, D.P.; Eyring, V.; Friedlingstein, P.; Hurtt, G.; Knutti, R.; Kriegler, E.; Lamarque, J.F.; Lowe, J.; et al. The Scenario Model Intercomparison Project (ScenarioMIP) for CMIP6. Geosci. Model Dev. 2016, 9, 3461–3482. [Google Scholar] [CrossRef] [Green Version]
  34. IBM Corp. IBM SPSS Statistics for Windows, Version 22.0; IBM Corp: Armonk, NY, USA, 2013. [Google Scholar]
  35. Cao, Z.; Zhang, L.; Zhang, X.; Guo, Z. Predicting the Potential Distribution of Hylomecon japonica in China under Current and Future Climate Change Based on Maxent Model. Sustainability 2021, 13, 11253. [Google Scholar] [CrossRef]
  36. Radosavljevic, A.; Anderson, R.P. Making better MAXENT models of species distributions: Complexity, overfitting and evaluation. J. Evol. Biol. 2013, 41, 629–943. [Google Scholar] [CrossRef]
  37. Merow, C.; Smith, M.J.; Silander, J.A., Jr. A practical guide to MaxEnt for modeling species’ distributions: What it does, and why inputs and settings matter. Ecography 2013, 36, 1058–1069. [Google Scholar] [CrossRef]
  38. Cobos, M.E.; Peterson, A.T.; Barve, N.; Osorio-Olvera, L. Kuenm: An R package for detailed development of ecological niche models using Maxent. PeerJ 2019, 7, e6281. [Google Scholar] [CrossRef] [PubMed] [Green Version]
  39. Li, D.; Li, Z.; Liu, Z.; Yang, Y.; Khoso, A.G.; Wang, L.; Liu, D. Climate change simulations revealed potentially drastic shifts in insect community structure and crop yields in China’s farmland. J. Pest Sci. 2023, 96, 55–69. [Google Scholar] [CrossRef]
  40. Phillips, S.J. Transferability, sample selection bias and background data in presence-only modeling: A response to Peterson et al. and (2007). Ecography 2008, 31, 272–278. [Google Scholar] [CrossRef]
  41. Fielding, A.H.; Bell, J.F. A review of methods for the measurement of prediction errors in conservation presence/absence models. Environ. Conserv. 1997, 24, 38–49. [Google Scholar] [CrossRef]
  42. Swets, J. Measuring the accuracy of diagnostic systems. Science 1988, 240, 1285–1293. [Google Scholar] [CrossRef] [PubMed] [Green Version]
  43. Liu, H.; Zhang, Z.; Jian, S. Simulation of potential suitable distribution area of Pinus tabuliformis in Yiluo River basin on MaxEnt Model. J. Zhejiang For. Sci. Technol. 2023, 43, 1–8. [Google Scholar]
  44. Jiang, J.M.; Jin, L.; Huang, L.; Wang, W.T. The Future Climate under Different CO2 Emission Scenarios Significantly Influences the Potential Distribution of Achnatherum inebrians in China. Sustainability 2022, 14, 4806. [Google Scholar] [CrossRef]
  45. Silvertown, J.W. The distribution of plants in limestone pavement: Tests of species interaction and niche separation against null hypotheses. J. Ecol. 1983, 71, 819–828. [Google Scholar] [CrossRef]
  46. Dong, H.; Zhang, N.; Shen, S.; Zhu, S.; Fan, S.; Lu, Y. Effects of Climate Change on the Spatial Distribution of the Threatened Species Rhododendron purdomii in Qinling-Daba Mountains of Central China: Implications for Conservation. Sustainability 2023, 15, 3181. [Google Scholar] [CrossRef]
  47. Song, D.; Li, Z.; Wang, T.; Qi, Y.; Han, H.; Chen, Z. Prediction of Changes to the Suitable Distribution Area of Fritillaria przewalskii Maxim. in the Qinghai-Tibet Plateau under Shared Socioeconomic Pathways (SSPs). Sustainability 2023, 15, 2833. [Google Scholar] [CrossRef]
  48. Peterson, A.T. Ecological niche conservatism: A time-structured review of evidence. J. Evol. Biol. 2011, 38, 817–827. [Google Scholar] [CrossRef]
  49. Araújo, M.B.; Guisan, A. Five (or so) challenges for species distribution modelling. J. Biogeogr. 2006, 33, 1677–1688. [Google Scholar] [CrossRef]
  50. Anderson, R.P.; Gonzalez, I. Species-specific tuning increases robustness to sampling bias in models of species distributions: An implementation with Maxent. Ecol. Model. 2011, 222, 2796–2811. [Google Scholar] [CrossRef]
  51. Wei, Y.; Zhang, L.; Wang, J.; Wang, W.; Niyati, N.; Guo, Y.; Wang, X. Chinese caterpillar fungus (Ophiocordyceps sinensis) in China: Current distribution, trading, and futures under climate change and overexploitation. Sci. Total Environ. 2021, 755, 142548. [Google Scholar] [CrossRef] [PubMed]
  52. Yang, Z.; Bai, Y.; Alatalo, J.M.; Huang, Z.; Yang, F.; Pu, X.; Wang, R.; Yang, W.; Guo, X. Spatio- temporal variation in potential habitats for rare and endangered plants and habitat conservation based on the maximum entropy model. Sci. Total Environ. 2021, 784, 147080. [Google Scholar] [CrossRef]
  53. Anand, V.; Oinam, B.; Singh, I.H. Predicting the current and future potential spatial distribution of endangered Rucervus eldii eldii (Sangai) using MaxEnt model. Environ. Monit. Assess. 2021, 193, 147. [Google Scholar] [CrossRef]
  54. Mafuwe, K.; Broadley, S.; Moyo, S. Use of maximum entropy (Maxent) niche modelling to predict the occurrence of threatened freshwater species in a biodiversity hotspot of Zimbabwe. Afr. J. Ecol. 2021, 60, 557–565. [Google Scholar] [CrossRef]
  55. Abeli, T.; Ghitti, M.; Socchi, R. Does ecological marginality reflect physiological marginality in plants? Plant Biosyst. 2020, 154, 149–157. [Google Scholar] [CrossRef]
  56. Sun, S.; Zhang, Y.; Huang, D.; Wang, H.; Cao, Q.; Fan, P.; Yang, N.; Zheng, P.; Wang, R. The effect of climate change on the richness distribution pattern of oaks (Quercus L.) in China. Sci. Total Environ. 2020, 744, 140786. [Google Scholar] [CrossRef] [PubMed]
  57. Xiao, Y.; Chen, M.; Zheng, N.; Xu, Z.; Zhang, J.; Hu, X.; Li, L.; Gu, R.; Du, X.; Wang, J. Transcriptome Analysis Identifies Novel Genes Associated with Low-Temperature Seed Germination in Sweet Corn. Plants 2023, 12, 159. [Google Scholar] [CrossRef]
  58. Zhu, J.; Wang, W.; Jiang, M.; Yang, L.; Zhou, X. QTL mapping for low temperature germination in rapeseed. Sci. Rep. 2021, 11, 23382. [Google Scholar] [CrossRef]
  59. Fang, Z.Z.; Wang, L.K.; Dai, H.; Zhou, R.D.; Jiang, C.C.; Espley, V.R.; Deng, C.; Lin, Y.J.; Pan, S.L.; Ye, X.F. The genome of low-chill Chinese plum “Sanyueli” (Prunus salicina Lindl.) provides insights into the regulation of the chilling requirement of flower buds. Mol. Ecol. Resour. 2021, 22, 1919–1938. [Google Scholar] [CrossRef] [PubMed]
  60. Kazakis, G.; Ghosn, D.; Vogiatzakis, I.N.; Papanastasis, V.P. Vascular plant diversity and climate change in the alpine zone of the Lefka Ori, Crete. Biodivers. Conserv. 2007, 16, 1603–1615. [Google Scholar] [CrossRef]
  61. Pickering, C.; Hill, W.; Green, K. Vascular plant diversity and climate change in the alpine zone of the Snowy Mountains, Australia. Biodivers. Conserv. 2008, 17, 1627–1644. [Google Scholar] [CrossRef] [Green Version]
  62. Klanderud, K.; Totland, Ø. Simulated Climate Change Altered Dominance Hierarchies and Diversity of an Alpine Biodiversity Hotspot. Ecology 2005, 86, 2047–2054. [Google Scholar] [CrossRef] [Green Version]
  63. Guisan, A.; Thuiller, W. Predicting species distribution: Offering more than simple habitat models. Ecol. Lett. 2005, 8, 993–1009. [Google Scholar] [CrossRef] [PubMed]
  64. Ashraf, U.; Ali, H.; Chaudry, M.N.; Ashraf, I.; Batool, A.; Saqib, Z. Predicting the potential distribution of Olea ferruginea in Pakistan incorporating climate change by using Maxent model. Sustainability 2016, 8, 722. [Google Scholar] [CrossRef] [Green Version]
  65. Wu, Y.; Shen, X.; Tong, L.; Lei, F.; Mu, X.; Zhang, Z. Impact of past and future climate change on the potential distribution of an endangered Montane Shrub Lonicera oblata and its conservation implications. Forests 2021, 12, 125. [Google Scholar] [CrossRef]
  66. Wang, R.; Li, Q.; He, S.; Liu, Y. Potential distribution of Actinidia chinensis in China and its predicted response to climate change. Chin. J. Eco- Agric. 2018, 26, 27–37. [Google Scholar] [CrossRef]
  67. Wang, L.; Wu, X.; Li, Y.; Xu, X. Prediction of suitable cultivation area for Halesia carolina L. in China. J. Nanjing For. Univ. (Nat. Sci. Ed.) 2018, 42, 10–16. [Google Scholar] [CrossRef]
  68. Gould, K.R.; Donoghue, M.J. Phylogeny and biogeography of Triosteum. Harv. Pap. Botany. 2000, 5, 157–166. [Google Scholar]
  69. Jing, G.H.; Cheng, J.M.; Su, J.S.; Wei, L.; Shi, X.X.; Jin, J.W. Response of dominant population niche breadths and niche overlaps to various disturbance factors in typical steppe fenced grassland of China’s Loess Plateau region. Acta Pratacult. Sin. 2015, 24, 43–52. [Google Scholar] [CrossRef]
  70. Li, M.; Jiang, D.M.; Toshio, O.; Zhou, Q.L.; Luo, Y.M. Niche characteristic of herbages in artificial sand-fixing communities in Horqin sandy land. Pratacult. Sci. 2009, 26, 10–16. [Google Scholar]
  71. Jiao, S.W.; Qing, Z.; Sun, G.Q.; Lei, G.C. Improving conservation of cranes by modeling potential wintering distributions in China. J. Resour. Ecol. 2016, 7, 44–50. [Google Scholar] [CrossRef]
  72. Deb, J.C.; Phinn, S.; Butt, N.; McAlpin, C.A. Climatic-induced shifts in the distribution of teak (Tectona grandis) in tropical Asia: Implications for forest management and planning. Environ. Manag. 2017, 60, 422–435. [Google Scholar] [CrossRef]
Figure 1. Distribution records of T. Pinnatifidum (red) and T. himalayanum (green) in China. Outlines of national boundaries are shown.
Sustainability 15 05604 g001
Figure 2. ROC curves of MaxEnt models for (A) T. Pinnatifidum and (B) T. himalayanum.
Sustainability 15 05604 g002
Figure 3. Contribution rate of dominant environmental variables (T. Pinnatifidum).
Sustainability 15 05604 g003
Figure 4. Contribution rate of dominant environmental variables (T. himalayanum).
Sustainability 15 05604 g004
Figure 5. Relationship between the potential distribution probability of T. Pinnatifidum and essential environmental factors. (A) Temperature seasonality, bio4; (B) Temperature annual range, bio7; (C) Mean temperature of driest quarter, bio9; (D) Mean temperature of coldest quarter, bio11; and (E) altitude.
Sustainability 15 05604 g005
Figure 6. Relationship between the potential distribution probability of T. himalayanum and essential environmental factors. (A) Temperature seasonality, bio4; (B) Temperature annual range, bio7; (C) Mean temperature of driest quarter, bio9; (D) Mean temperature of coldest quarter, bio11; and (E) altitude.
Sustainability 15 05604 g006
Figure 7. Predicted habitat distribution of (A) T. Pinnatifidum and (B) T. himalayanum based on MaxEnt.
Sustainability 15 05604 g007
Figure 8. Potential suitable habitat of T. Pinnatifidum under future climate scenarios. (A) 2030s SSP2-4.5, (B) 2030s SSP5-8.5, (C) 2050s SSP2-4.5, (D) 2050s SSP5-8.5, (E) 2070s SSP2-4.5, (F) 2070s SSP5-8.5, (G) 2090s SSP2-4.5, (H) 2090s SSP5-8.5.
Sustainability 15 05604 g008
Figure 9. Change in the suitable habitat of T. Pinnatifidum in future climate. (A) 2030s SSP2-4.5, (B) 2030s SSP5-8.5, (C) 2050s SSP2-4.5, (D) 2050s SSP5-8.5, (E) 2070s SSP2-4.5, (F) 2070s SSP5-8.5, (G) 2090s SSP2-4.5, (H) 2090s SSP5-8.5.
Sustainability 15 05604 g009
Figure 10. Potential suitable habitat of T. himalayanum under future climate scenarios. (A) 2030s SSP2-4.5, (B) 2030s SSP5-8.5, (C) 2050s SSP2-4.5, (D) 2050s SSP5-8.5, (E) 2070s SSP2-4.5, (F) 2070s SSP5-8.5, (G) 2090s SSP2-4.5, (H) 2090s SSP5-8.5.
Sustainability 15 05604 g010
Figure 11. Change in the suitable habitat of T. himalayanum in future climate. (A) 2030s SSP2-4.5, (B) 2030s SSP5-8.5, (C) 2050s SSP2-4.5, (D) 2050s SSP5-8.5, (E) 2070s SSP2-4.5, (F) 2070s SSP5-8.5, (G) 2090s SSP2-4.5, (H) 2090s SSP5-8.5.
Sustainability 15 05604 g011
Figure 12. Changes in overlapping suitable habitat of two species of Triosteum. (A) Current, (B) 2030s SSP2-4.5, (C) 2030s SSP5-8.5, (D) 2050s SSP2-4.5, (E) 2050s SSP5-8.5, (F) 2070s SSP2-4.5, (G) 2070s SSP5-8.5, (H) 2090s SSP2-4.5, (I) 2090s SSP5-8.5.
Sustainability 15 05604 g012
Figure 13. The change trends in the gravity points of the suitable areas of T. Pinnatifidum under SSP2-4.5 (red circles) and SSP5-8.5 (green circles) climatic conditions.
Sustainability 15 05604 g013
Figure 14. The change trends in the gravity points of the suitable areas of T. himalayanum under SSP2-4.5 (red circles) and SSP5-8.5 (green circles) climatic conditions.
Sustainability 15 05604 g014
Table 1. Description of bioclimatic variables used for MaxEnt model prediction.
VariablesDescription Units
Bio1Annual mean temperature°C
Bio2Mean diurnal range°C
Bio3Isothermality/
Bio4Temperature seasonality/
Bio5Max Temperature of Warmest Month°C
Bio6Min temperature for coldest month°C
Bio7Temperature annual range°C
Bio8Mean temperature of wettest quarter°C
Bio9Mean temperature of driest quarter°C
Bio10Mean temperature of warmest quarter°C
Bio11Mean temperature of coldest quarter°C
Bio12Annual precipitationmm
Bio13Precipitation of wettest monthmm
Bio14Precipitation of driest monthmm
Bio15Precipitation seasonality/
Bio16Precipitation of wettest quartermm
Bio17Precipitation of driest quartermm
Bio18Precipitation of warmest quartermm
Bio19Precipitation of coldest quartermm
demElevationm
slopeSlope°
aspectAspect°
Bold text indicates the bioclimatic variables used for model construction after screening.
Table 2. Predicted suitable area in km2 for T. Pinnatifidum and T. himalayanum habitats under current and future climate.
SpeciesPeriodPredicted Area (×104 km2) and % of the Corresponding Current Area
Low Suitable HabitatMedium Suitable HabitatHighly Suitable HabitatTotal Suitable Habitat
T. PinnatifidumPresent56.1130.4824.44111.03
2030S(SSP2-4.5)69.03 (123.02%)38.34 (125.79%)29.34 (120.05%)136.71 (123.13%)
2030S(SSP5-8.5)74.36 (132.53%)38.79 (127.26%)32.80 (134.21%)145.95 (131.45%)
2050S(SSP2-4.5)77.79 (138.64%)36.77 (120.64%)26.97 (110.35%)141.53 (127.47%)
2050S(SSP5-8.5)79.59 (141.85%)40.68 (133.46%)31.18 (127.58%)151.45 (136.40%)
2070S(SSP2-4.5)76.66 (136.62%)38.75 (127.13%)30.25 (123.77%)145.66 (131.19%)
2070S(SSP5-8.5)74.39 (132.58%)38.52 (126.38%)30.08 (123.08%)142.99 (128.79%)
2090S(SSP2-4.5)77.11 (137.43%)40.59 (133.17%)31.40 (128.48%)149.10 (134.29%)
2090S(SSP5-8.5)70.19 (125.09%)39.96 (131.10%)36.01 (147.34%)146.16 (131.64%)
T. himalayanumPresent58.4145.7441.53145.68
2030S(SSP2-4.5)48.98 (83.86%)31.96 (69.87%)50.24 (120.97%)131.18 (90.05%)
2030S(SSP5-8.5)48.05 (82.26%)37.39 (81.74%)53.77 (129.47%)139.21 (95.56%)
2050S(SSP2-4.5)51.07 (87.43%)34.24 (74.86%)50.00 (120.39%)135.31 (92.88%)
2050S(SSP5-8.5)50.04 (85.67%)33.31 (72.82%)53.80 (129.54%)137.15 (94.14%)
2070S(SSP2-4.5)48.43 (82.91%)31.78 (69.48%)53.04 (127.71%)133.25 (91.47%)
2070S(SSP5-8.5)50.76 (86.90%)34.96 (76.43%)48.56 (116.93%)134.28 (92.17%)
2090S(SSP2-4.5)51.29 (87.81%)36.39 (79.56%)49.98 (120.35%)137.66 (94.49%)
2090S(SSP5-8.5)56.27 (96.34%)35.69 (78.03%)54.37 (130.92%)146.33 (100.45%)
Table 3. Niche overlap, niche breadth and range overlap between T. Pinnatifidum and T. himalayanum.
Niche OverlapRange OverlapNiche Breadth
DI
0.4395970.7140680.4556490.851083/0.858738
Disclaimer/Publisher’s Note: The statements, opinions and data contained in all publications are solely those of the individual author(s) and contributor(s) and not of MDPI and/or the editor(s). MDPI and/or the editor(s) disclaim responsibility for any injury to people or property resulting from any ideas, methods, instructions or products referred to in the content.

