Article

Innovative Design Method of Jet Grouting Systems for Sustainable Ground Improvements

1
Graduate School of Engineering and Science, Shibaura Institute of Technology, Tokyo 135-8548, Japan
2
College of Engineering, Shibaura Institute of Technology, Tokyo 135-8548, Japan
3
School of Engineering and Technology, Asian Institute of Technology, Khlong Nueng 12120, Thailand
4
Sanshin Corporation, Tokyo 111-0052, Japan
*
Author to whom correspondence should be addressed.
Sustainability 2023, 15(6), 5602; https://doi.org/10.3390/su15065602
Submission received: 28 February 2023 / Revised: 14 March 2023 / Accepted: 20 March 2023 / Published: 22 March 2023
(This article belongs to the Section Sustainable Engineering and Science)

Abstract

:
The major focus of this study was determining the effectiveness of new construction specifications regarding the method of cement grout injection for the jet grouting system (high-pressure injection stirring method), with the objective of developing a sustainable ground improvement method. The recent innovative jet grouting techniques allow for improvement at middle pressure, but the mud discharge amount is drastically increased. This produces a serious environmental and financial burden during the disposal of mud discharge. This study attempts to develop a sustainable jet grouting method. The simulation model was prepared by the 3D AutoCAD software, and the analysis was conducted using the moving particle semi-implicit method (MPS method). The study focused on the changes that occurred in the mixing ratio of cement slurry and soil due to the changes made in cement milk spraying during the construction phase and compared it with the traditional method of cement milk spraying. All other construction parameters were kept the same for both cases, and the comparison result shows that the modified construction specification provides a denser and larger improved soil body than the traditional method. Furthermore, the density of the number of particles was determined at the upper, middle, and lower portions of the improved body for comparison.

1. Introduction

The jet grouting system (high-pressure injection stirring method) is a technology used to create a columnar improved body by spraying a jet of high-pressure cement milk into the ground, which hardens on setting and has been mixed with the grounds cut by jet pressure [1,2,3,4]. Since this improved body construction mechanism is a complicated and invisible phenomenon [5,6], the practical use for construction has been carried out only by making speculations experimentally and empirically [7,8] and finally checking the quality by unconfined compression testing of the boring sample after completion of the construction [5]. The overall evaluation of this method for deficiencies and design quality confirmation are deduced from the unconfined compression test results. Recent studies, such as those of Inazumi et al. [9] and Nakao et al. [10], using the discrete element method (DEM), attempted to evaluate the jet grouting method, in which the cement milk injection situation inside the ground was analyzed and the attenuation situation of the injection distance and injection speed was reproduced. Inazumi et al. [11] successfully reproduced the soil improvement body formation by middle pressure jet grouting by the application of computer-aided engineering (CAE) analysis using the MPS method [12,13] and verified it visually and analytically. Shakya et al. [14] refined the evaluation method of jet grouting using MPS-CAE analysis. However, these construction were carried out by spraying water at the beginning to loosen the soil particles, and, since the volume of injection is increased, the amount of the mud discharge is also increased proportionately. According to the Japan Jet Grouting Association (JJGA), the amount of mud discharge is 1.1 times the injected amount for sandy soil and 1.3 for the clayey soil [15]. The disposal of the mud discharge is another issue regarding the jet grouting construction, and it is desirable to limit the amount of the mud discharge as much as possible due to the environmental and financial concerns. Thus, this innovative construction method might not be the most sustainable method. Meanwhile, construction methodology of other studies utilizing the industrial wastes are based on the guidelines of the traditional construction methods where it initially digs up to the desired depth and starts spraying cement grout at angular velocity, while retracting the drill rod [16,17,18,19]. However, in this research, a new design methods was proposed in which the cement slurry is sprayed in two phases, starting and ending at the desired bottom level.
The objective of this study is to analytically verify the effectiveness of the innovative design method for ground improvement technology by visualizing the inside of the ground and evaluating the improved body. It aims to accurately simulate the construction method and evaluate the improved soil body formation between two different construction conditions to determine the optimum construction specification using CAE-MPS analysis. It is expected to contribute in the development of the sustainable jet grouting method.

2. MPS-CAE Method

In this analysis, two governing equations of the incompressible flow, i.e., the mass conservation law and the Navier–Stokes law, while considering the influence of surface tension, were used. This is given by the Equations (1) and (2) respectively.
D ρ D t = 0
D u D t = 1 ρ P + ϑ 2 u + g + 1 ρ σ k δ n
where D ρ / D t is the differentiation of the density with respect to time, D u / D t is the differentiation of the velocity vector, ρ is the fluid density, u is the fluid velocity vector, P is the pressure of the fluid, ϑ is the coefficient of kinematic viscosity, g is the gravity vector, σ is the coefficient of surface tension, k is the curvature of the surface, δ is the delta function for the surface tension acting on the soil particles surface, and n is the unit vector perpendicular to the surface.
The MPS method discretizes each differential operator of the governing Equation (2), i.e., slope, divergence, and a weighted Laplacian function [20,21,22]. In each particle interaction model, the weighting functions are determined by the relationship of the interparticle distance r and the influence radius R . The influence radius is equal to 2.1–4.1 times the value of the interparticle distance.
Equation (3) shows the relationship of the weighting function ( w ) with respect to the effective radius of the support domain ( R ) and the distance between the particles ( r ).
w r = R r 1 0 r R 0 R r
The particle number density ( n i ) is defined as the sum of the weight function in the support domain and is given by Equation (4).
n i = j i w i j
where w i j = w r i j , R refers to the weight function between the particles i and j . If the particles are located on a regular grid and its grid size is same as that of the particle diameter, then such particle number density is called the criterion of the particle number density ( n * ).
Equations (5)–(7) show the differential operators for the gradient, the Laplacian, and the divergence of a particle i formulated in the derivative models for the traditional MPS method, respectively.
< > i = d n * j i i j r i j 2 x i j w i j
< 2 > i = 2 d n * λ i j i i j w i j
< . Φ > i = d n * j i i j . x i j r i j 2 w i j
where is the gradient differential operator, represents an arbitrary scalar, Φ is an arbitrary vector, and λ is the Laplacian model coefficient, defined as Equation (8).
λ i = j i w i j r i j 2 j i w i j

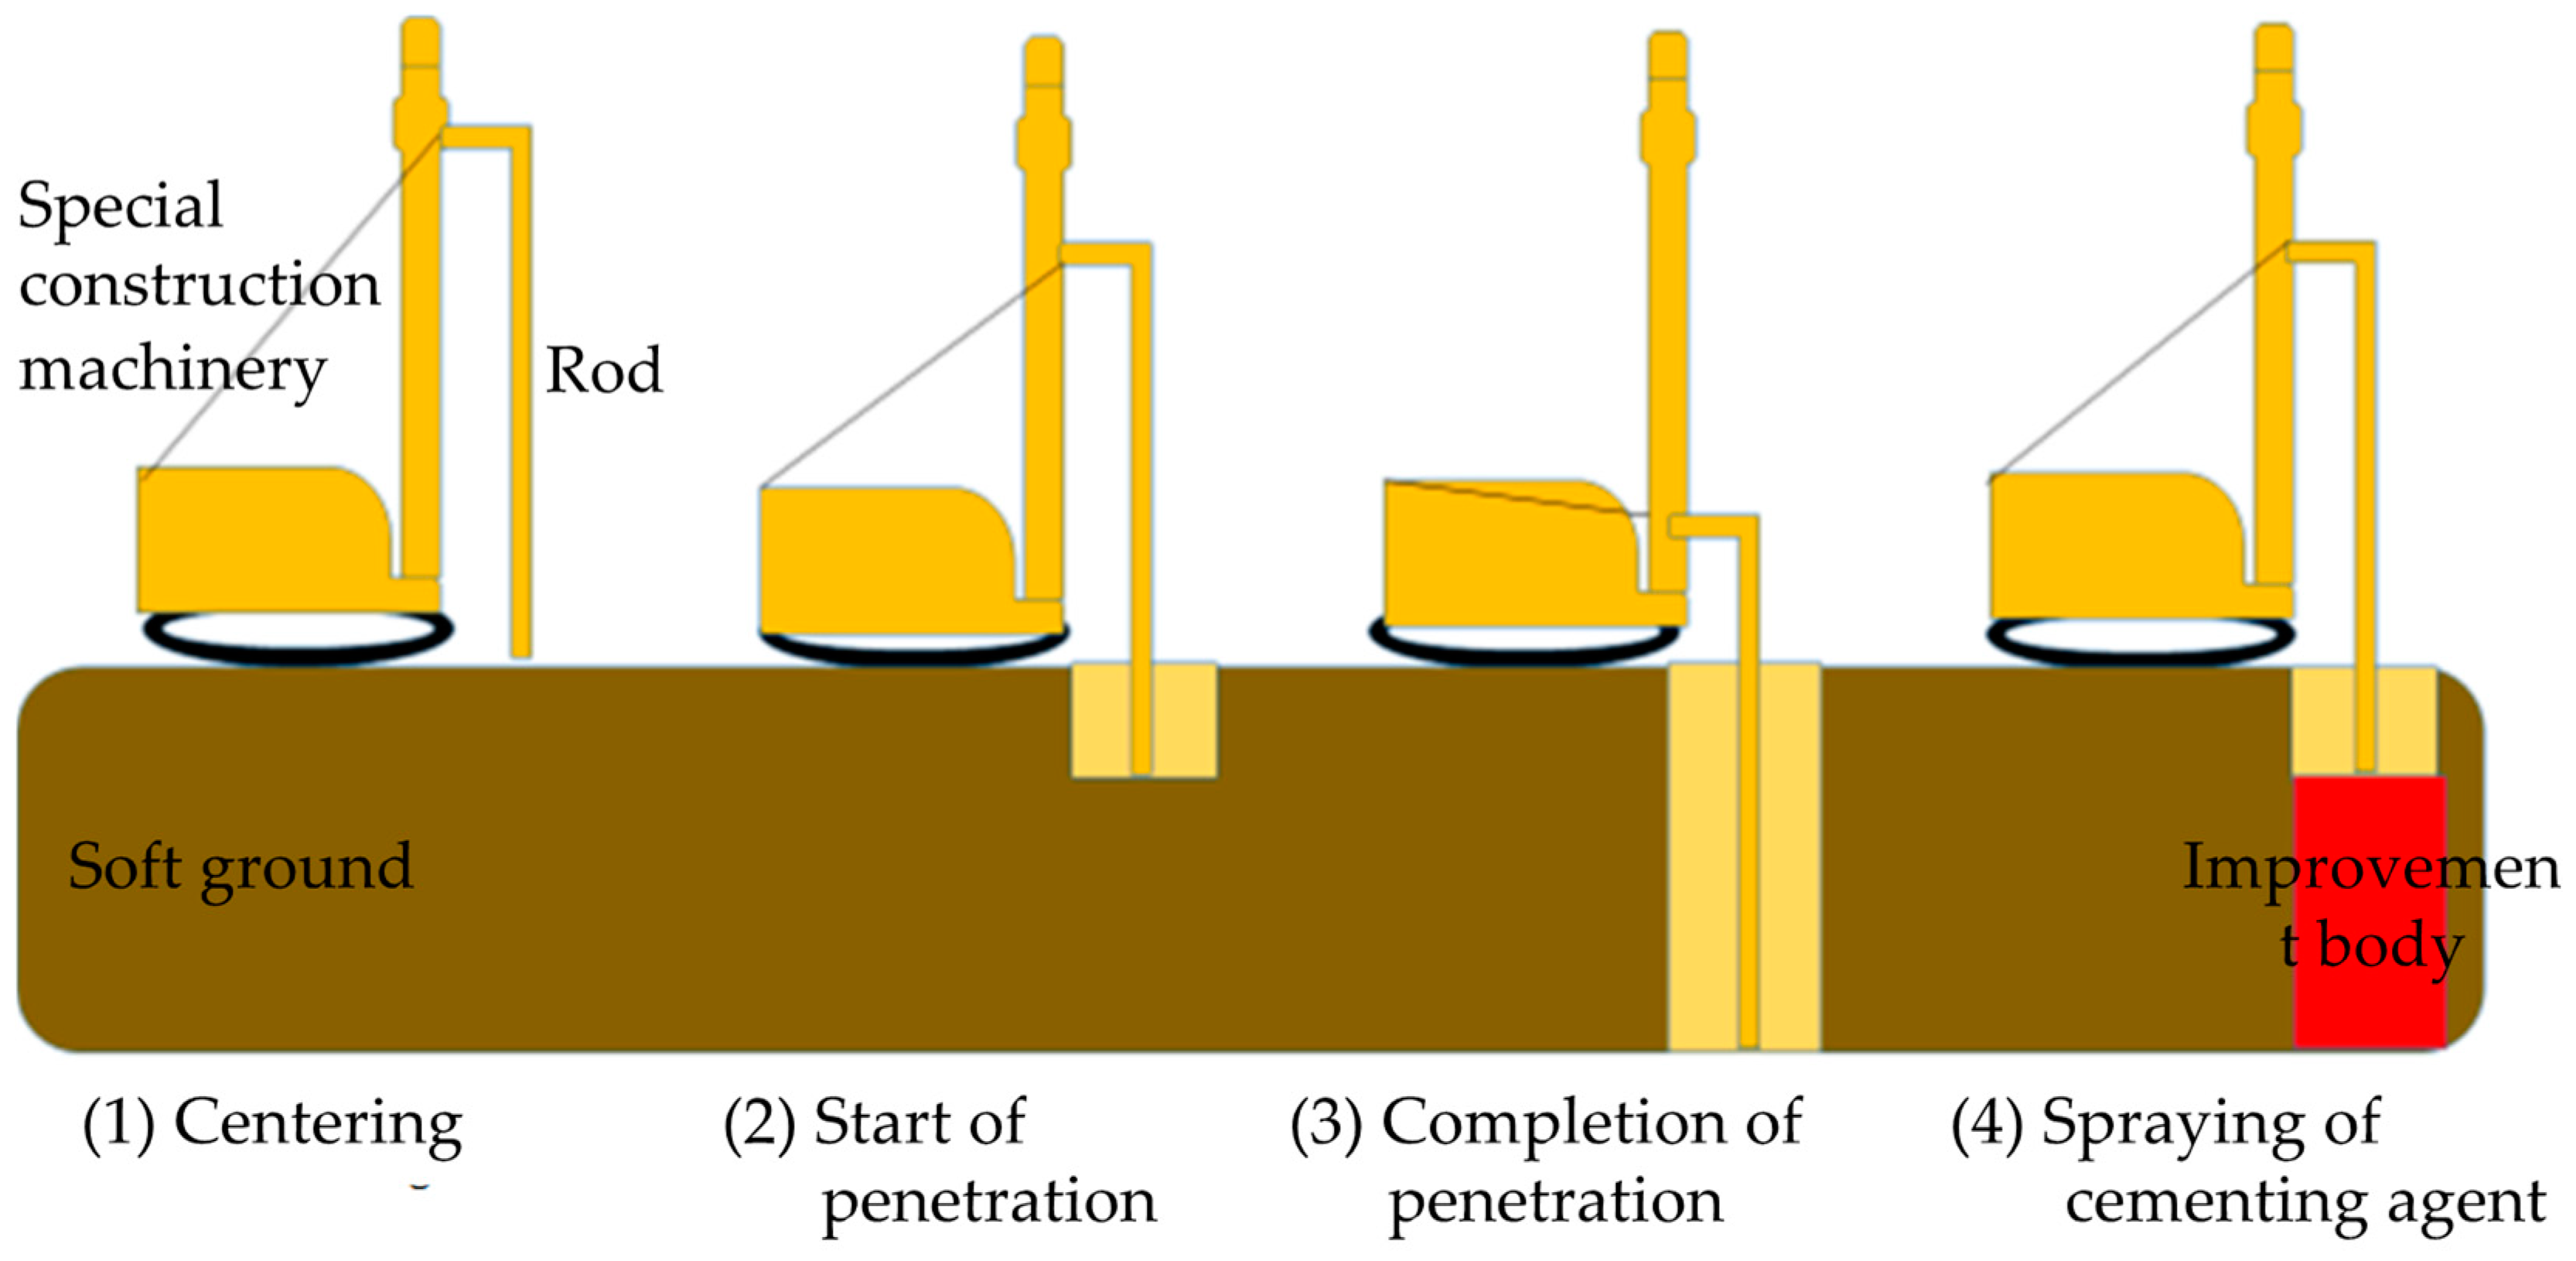
3. Jet Grouting System

The jet grouting system is one of the sustainable ground improvement technologies in which many industrial wastes, such as fly ash and slags, are used as grout materials. The ground is cut with these cement-based hardening agents, injected at high pressure, while the cut soft ground is simultaneously mixed with additives to form an improved body in a series of steps, as shown in Figure 1 [17,23]. Moreover, a mixture of cement slurry and air is injected into the ground at an ultra-high pressure to mix and stir it with the original ground soil to form a cement-improved ground. Among the existing ground improvement methods, these can be roughly classified into drainage, compaction, replacement, solidification and water cut-off techniques [24]. However, the jet grouting method has the greatest advantages of using the most compact machinery, as small as the size of a small boring machine, and can even be installed in close contact with the earth retaining sheet piles so that a large-diameter ground improvement body can be created even directly under the buried object. Moreover, adjusting the injection amount and injection pressure of the cement milk, various jet grouting systems have been widely put into practical use, forming different improved diameters, mainly for the temporary protection of the retaining wall defection, bottom improvement, initiating and attaining the protection of the shield construction, etc. It can also be applied to sandy ground, with a maximum improved diameter of ϕ5.5 m and an N value of over 50, and to deep constructions, with a depth of over 30 m [6,7,8]. On the other hand, this jet grouting system possesses problems, such as the need to inject a large amount of cement milk and the need to dispose of the industrial waste (mud discharge) associated with the injection construction, as shown in Figure 2.
Since the jet grouting method is popular choice of ground improvement methods, it is necessary to improve on the previous shortcoming of this method. This includes the reviewing the procedure of the construction itself. Hence, this study will focus on the determination of the effectiveness of injecting cement slurry in a single pipe method at high pressure by the MPS method, different from the traditional method. A literature review on the recent research trend reveals the investigation of the probable parameter selection and visualization method by the MPS method. However, only few studies have been conducted on the analytical review of the quality of the improved body when the cement injection method itself has been changed and is limited only to the innovative construction method.

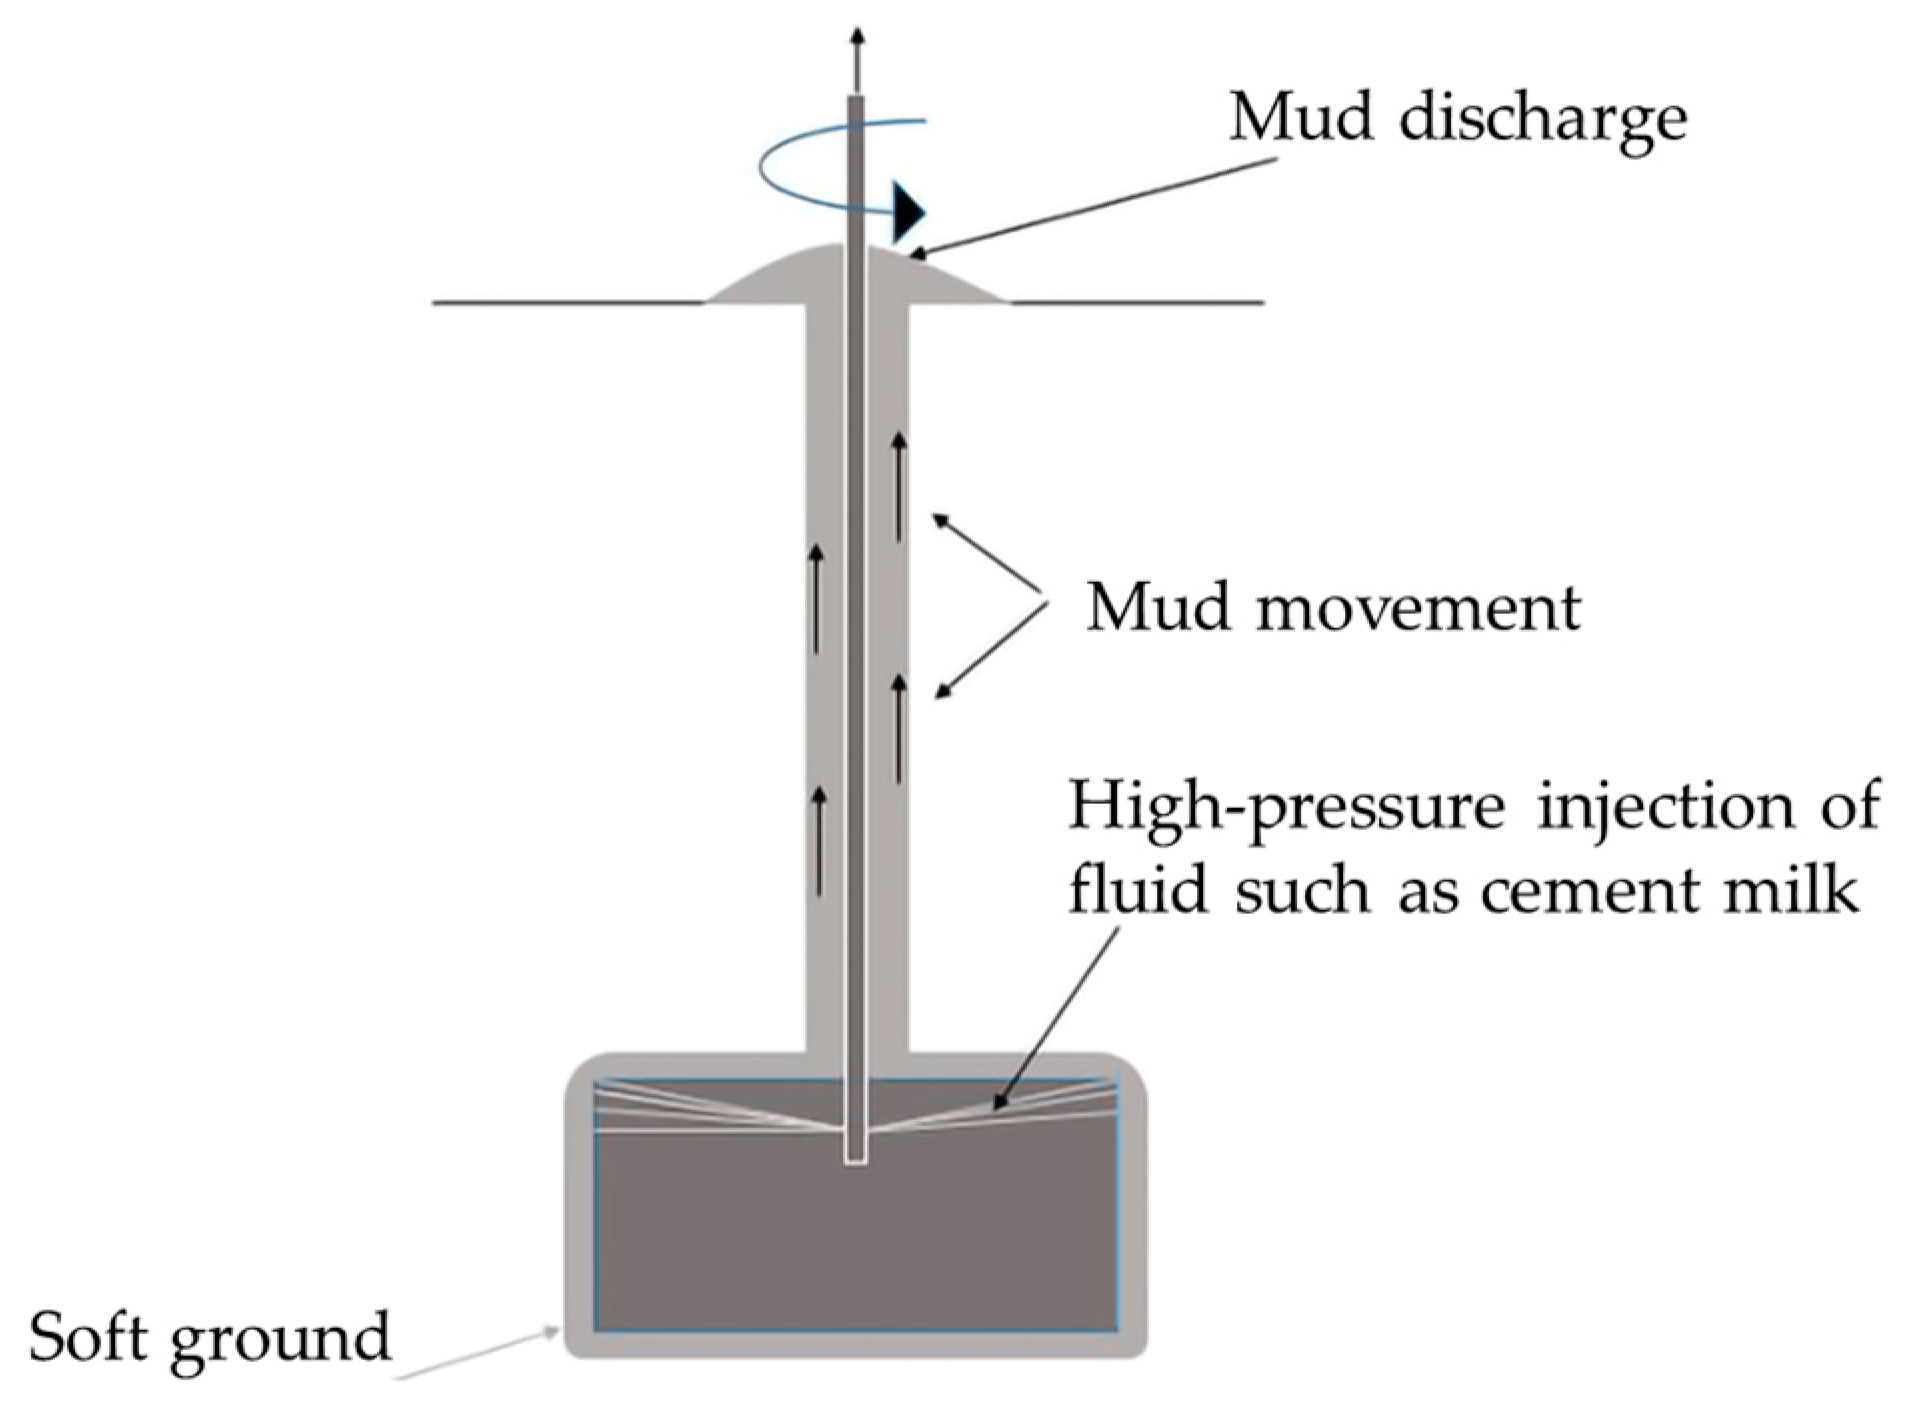
3.1. Mud Drainage by Jet Grouting System

A large amount of cut earth and sand, water, and mud mixed with cement are discharged into the ground as the ground is cut using high-pressure fluid injection (see Figure 2). This mud is sometimes used as a soil material, but it is generally treated as industrial waste. Additionally, since it is self-hardening, it must be discarded immediately after the construction, resulting in the demand for high-cost transportation. Moreover, in recent years, securing a final disposal site and dealing with environmental issues have become social issues. The waste mud discharged by the jet grouting system can sometimes be reused, but since the proportions of soil and cement are not always consistent, the soil must be processed by a number of procedures before reusing it, requiring additional time and money. Therefore, it is not always efficient to reuse industrial waste and recycle it as roadbed material. Thus, if construction specifications could be proposed that would reduce the mud drainage in the jet grouting system, the method would then be considered extremely effective in solving such problems. It is believed that an MPS-CAE analysis will enable the proposal of construction specifications that can reduce the amount of mud drainage by simulating various construction specifications.

3.2. Quality Control Method and Issues of Improved Body by Jet Grouting Method

The complex mechanism of mixing the soil and grout particles, and the subsequent complex infiltration mechanism of injecting the grout through the inter-particle spaces has limited the evaluation process of the jet grouting system to only visual observations [25]. However, core sampling from the construction, if tested in the laboratory, help to identify the inadequacies and confirm the quality in the design phase [5]. Wanik et al. [26] developed the relationship between the amount of injected cement, unconfined compression strength, and soil properties. Toraldo et al. [27] and Modoni and Bzòwka [28], after investigating the strength data collected from various literature, came to conclusion that the strength development of the jet grouting method is random, even for similar soil compositions. The probable cause might be due to the following reasons.
Firstly, in sampling by check boring, there is a tendency for uniaxial compression tests to be performed by selecting only high-quality parts, excluding parts that are disturbed by the sampling and/or unimproved mixed parts, which can cause the overestimation of the actual strength. Secondly, core sampling by boring is generally performed in the vicinity of 1/4 of the diameter of the improved body from the center of the improved body to confirm the finished shape. However, in the case of a pile-shaped improvement, the samples collected near the boundary of the improved body may be from an unimproved section, as there is no reliable method of confirming the actual diameter visually. Therefore, this study evaluates the density of the cement particles numbers to assess the homogeneity of the improved soil body.

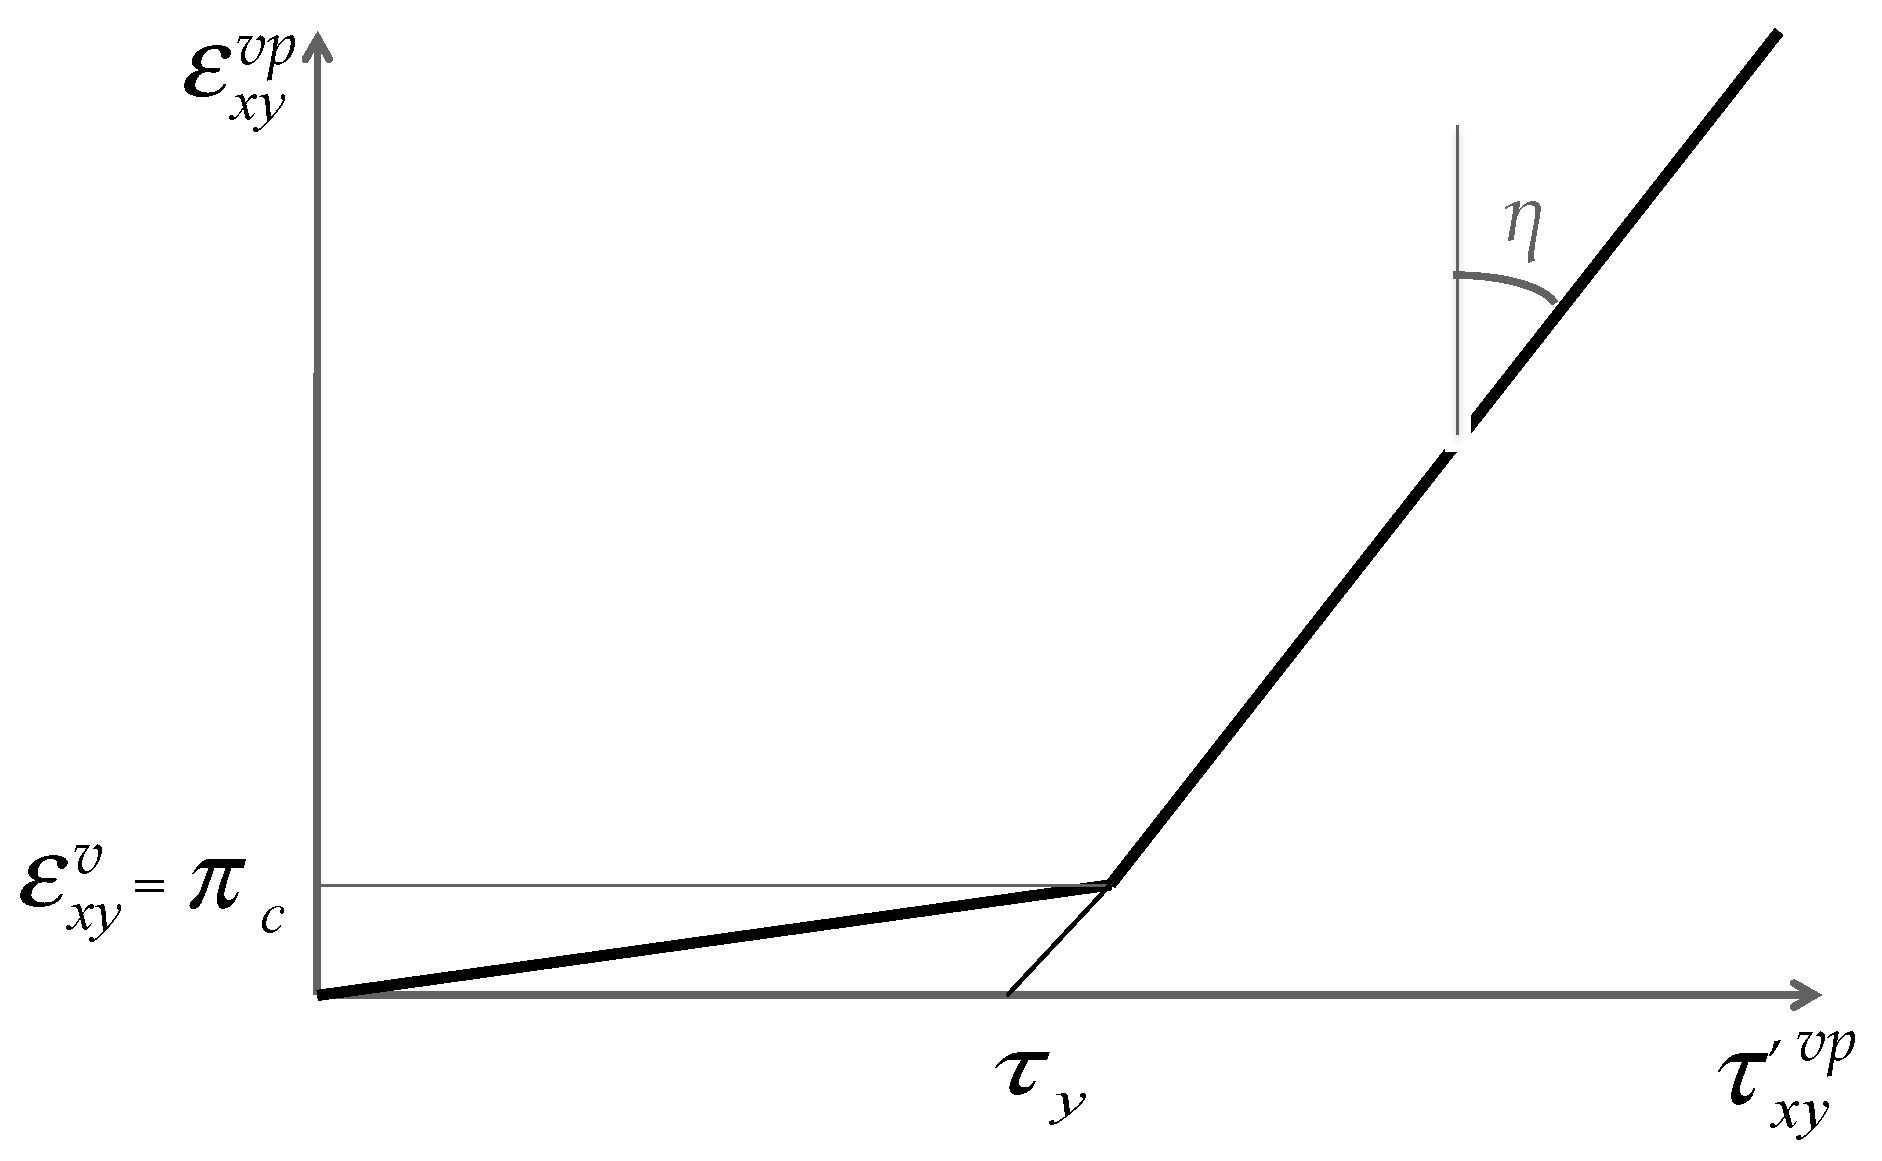
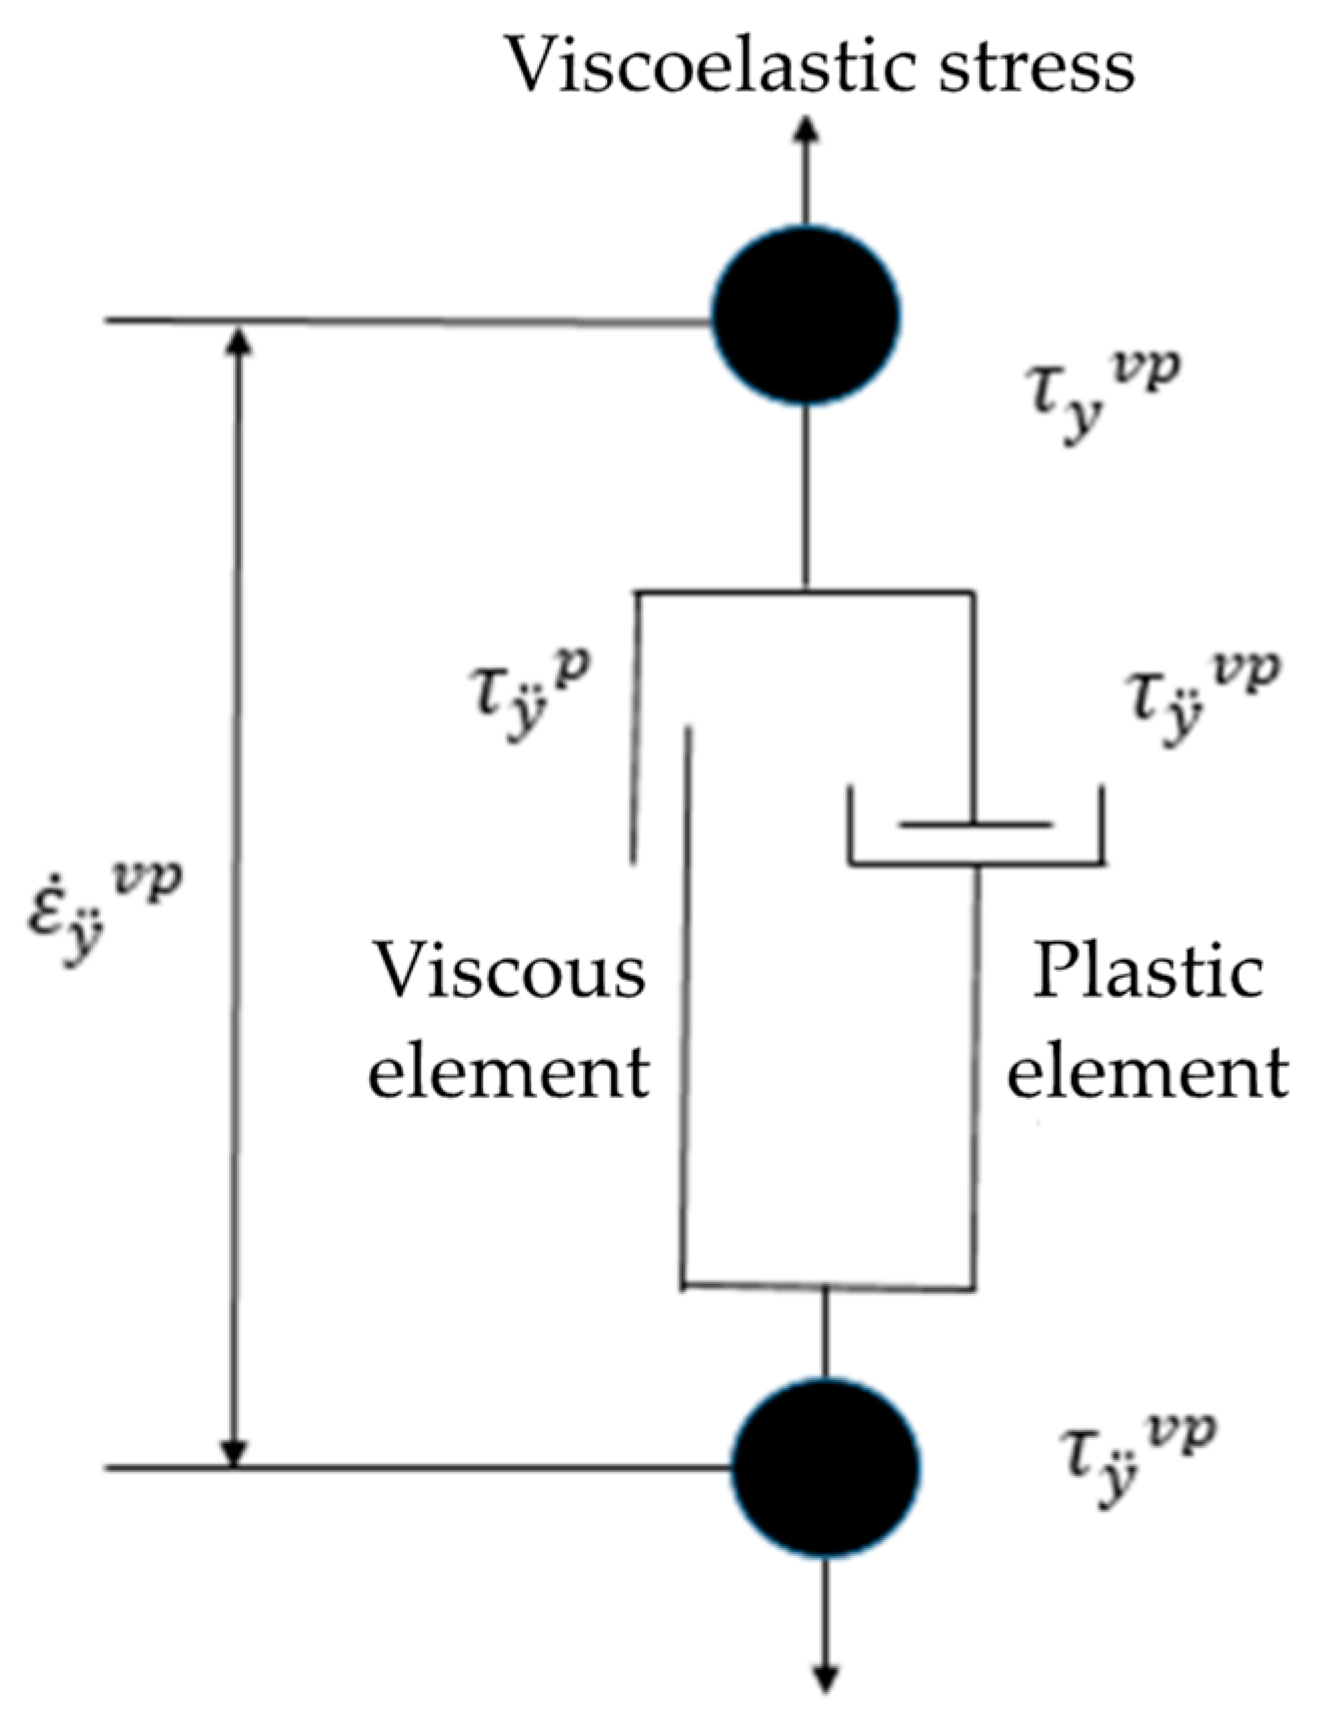
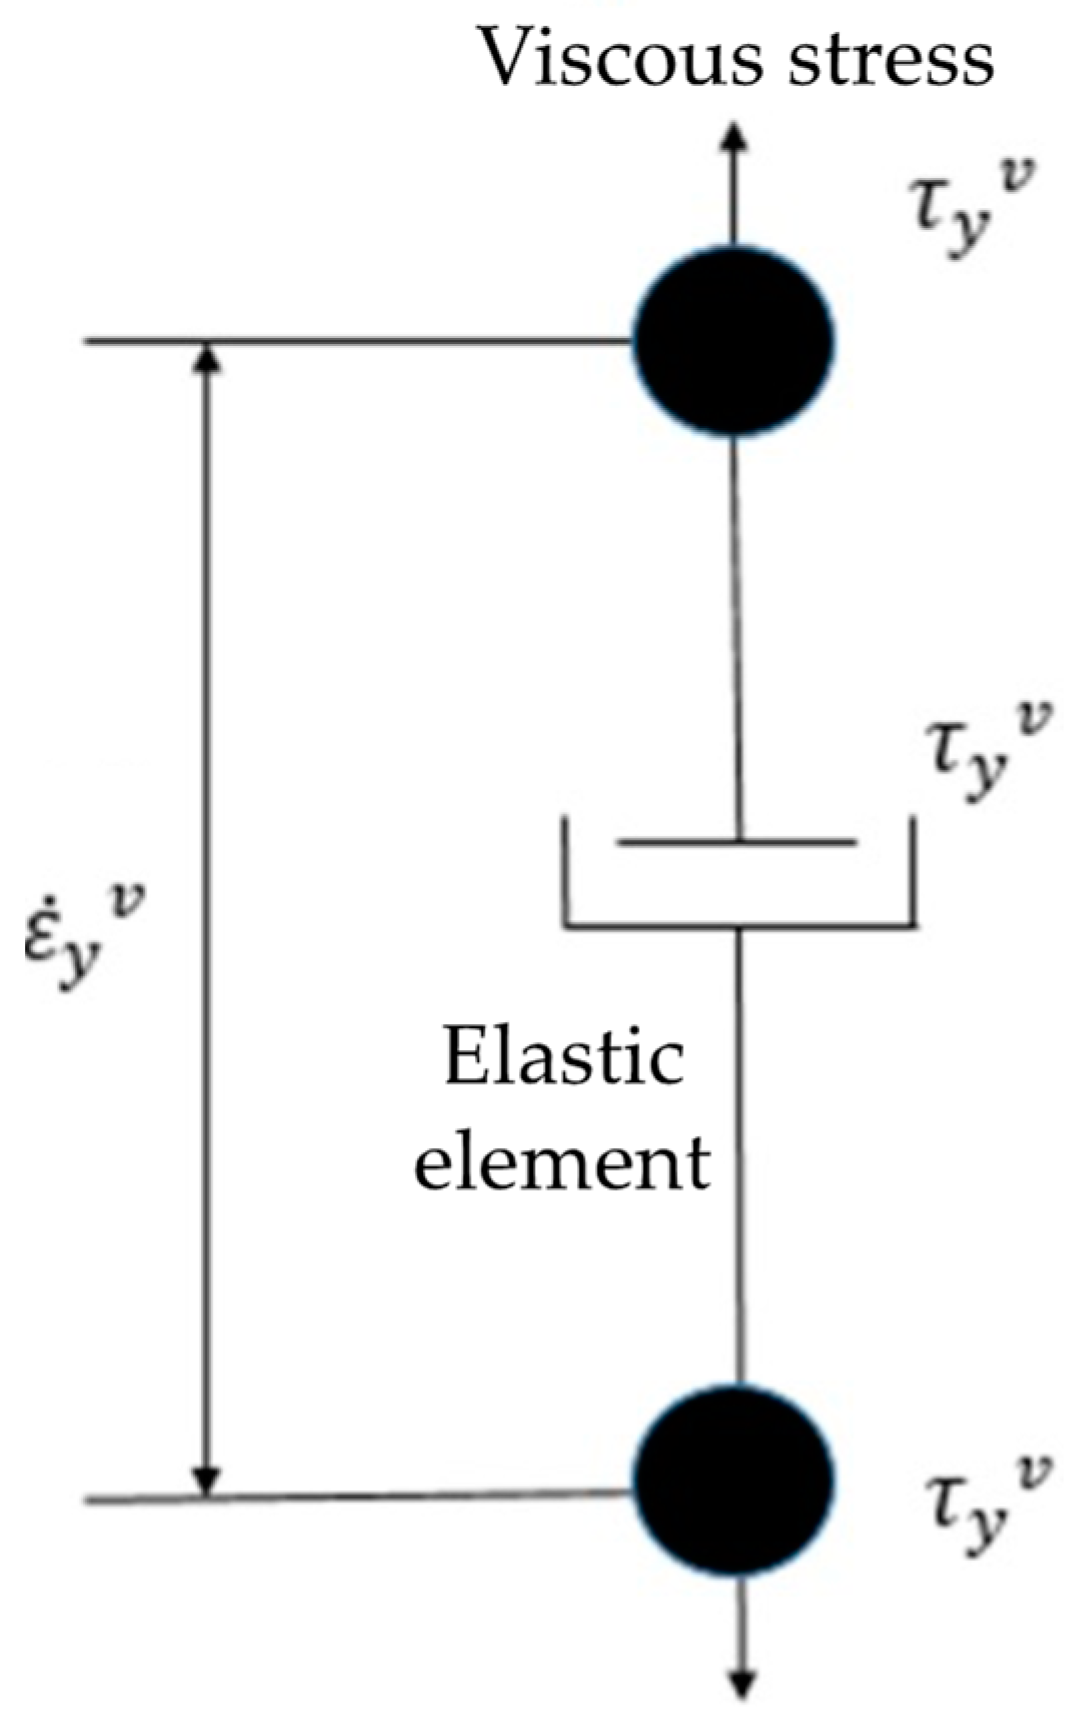
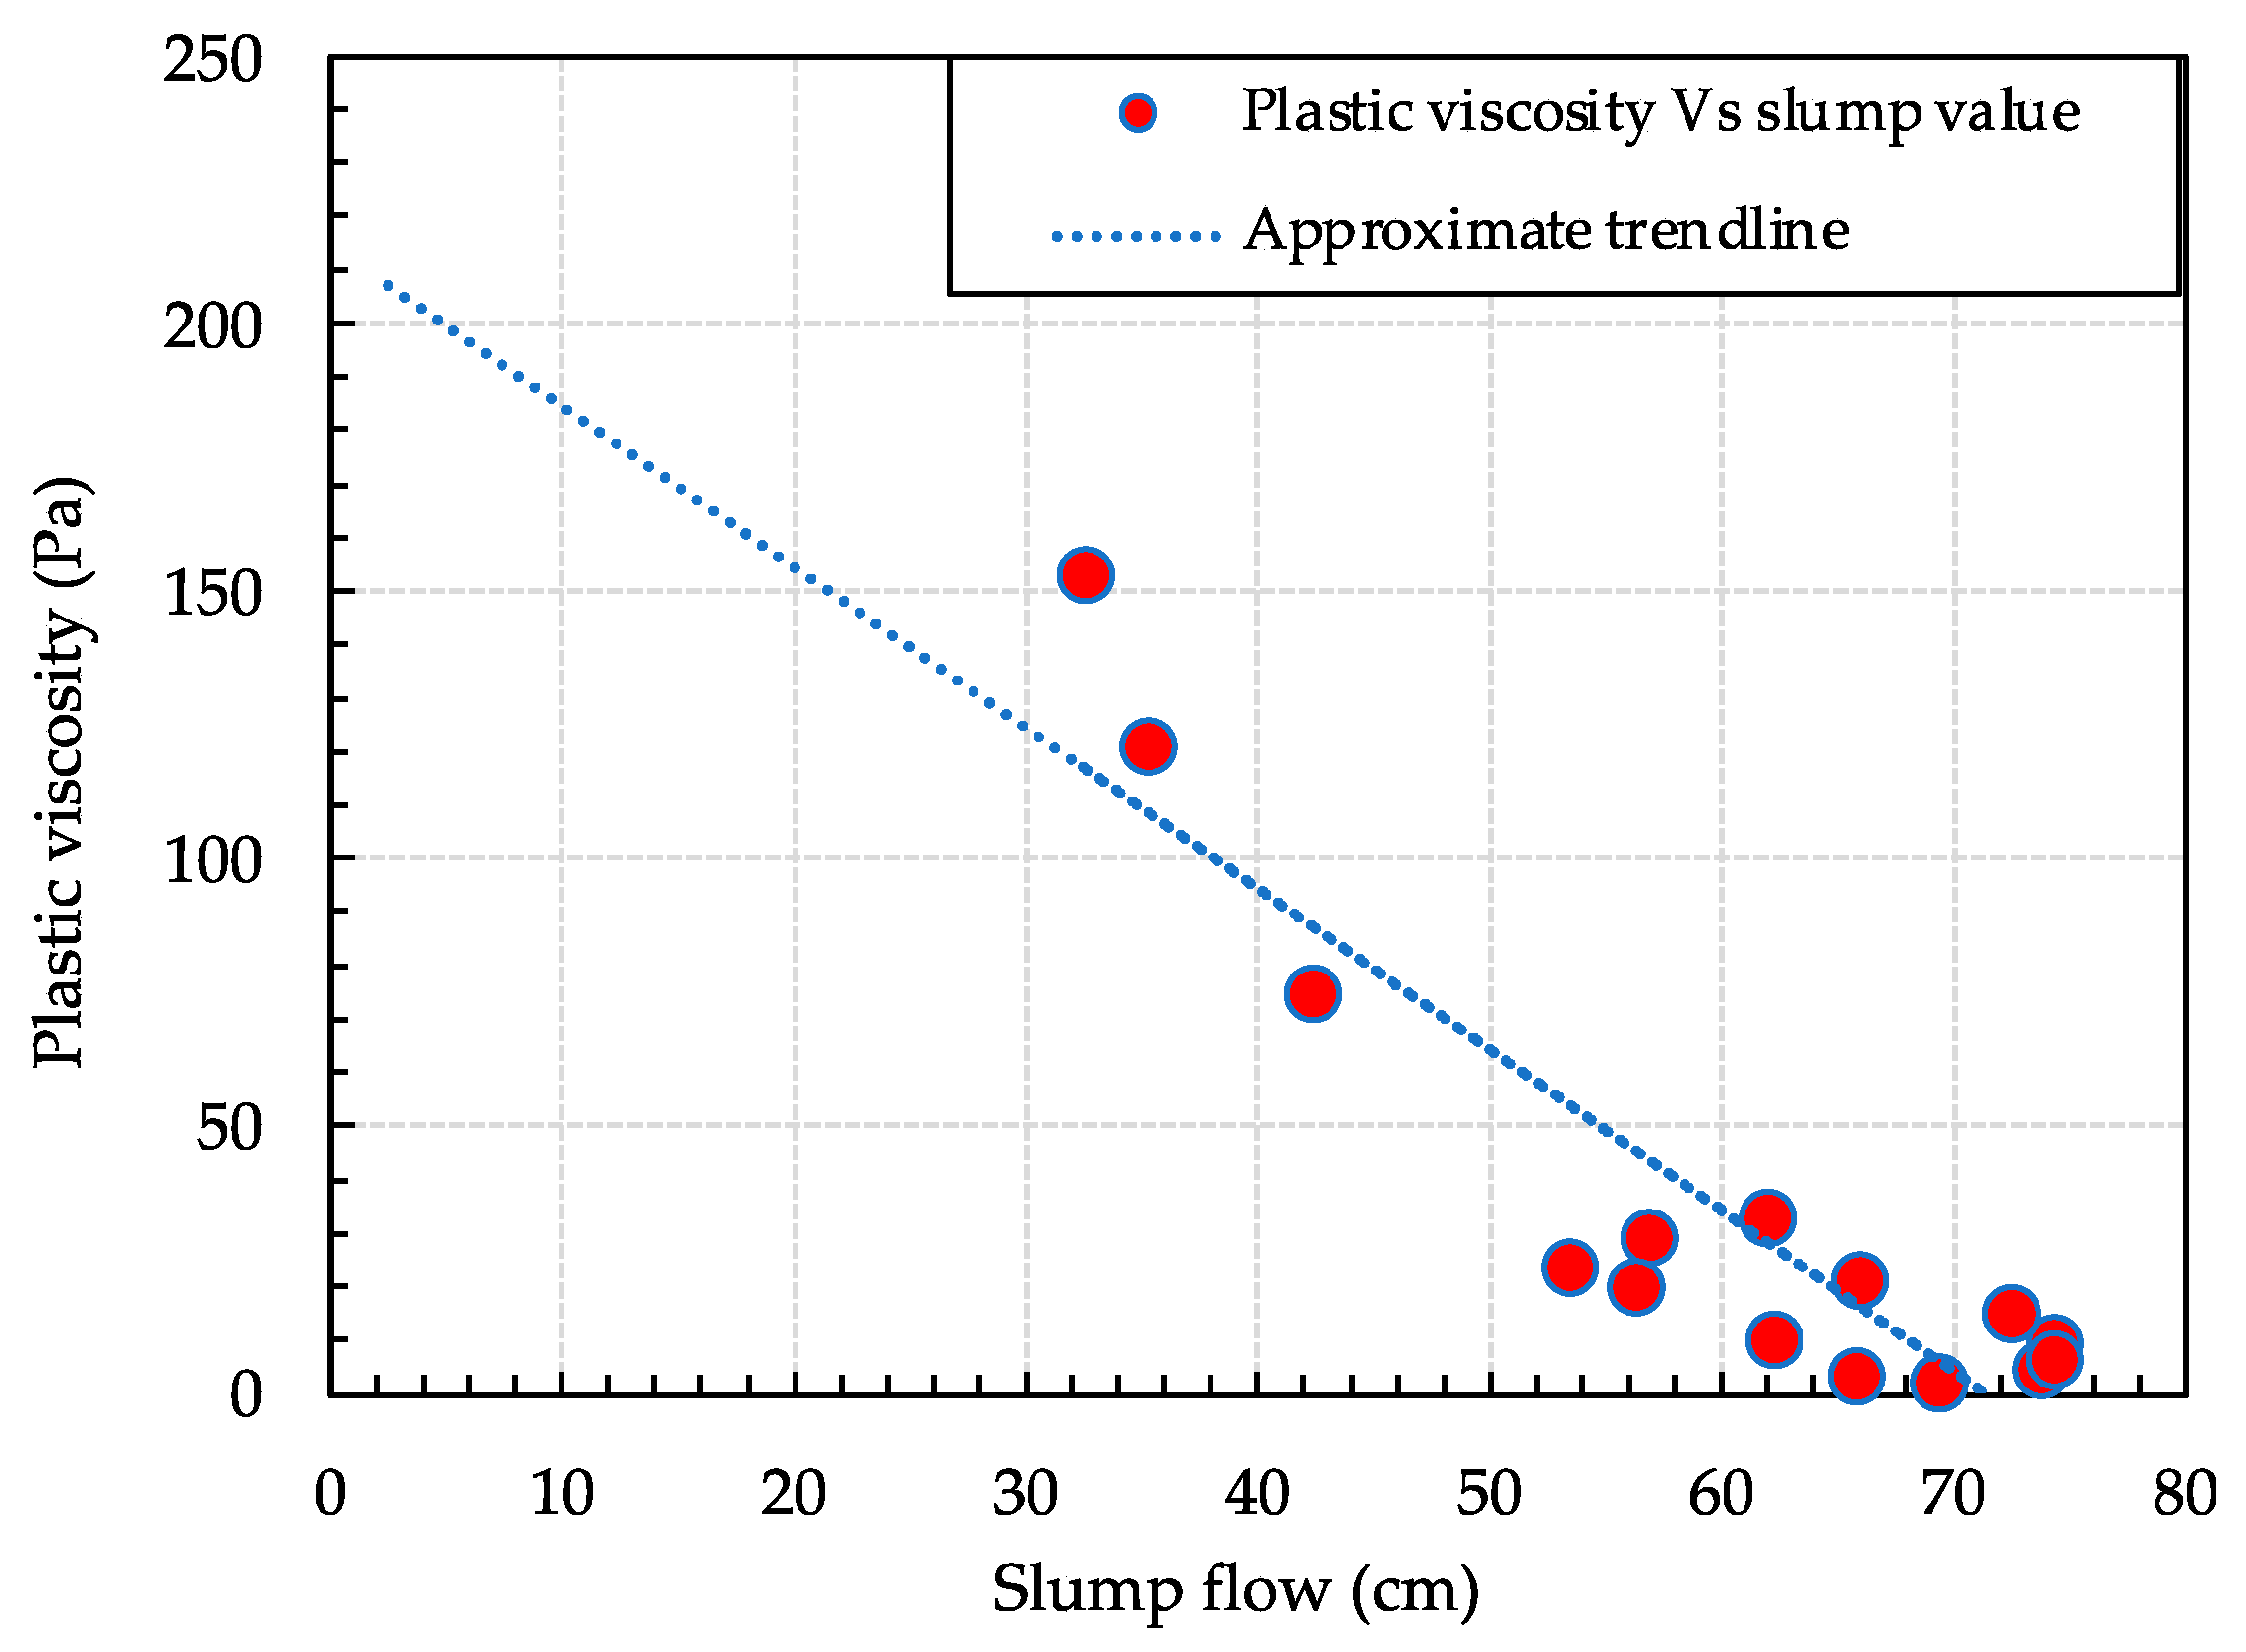
3.3. Application of the Bingham Fluid

Cement milk and the ground are assumed as Bingham fluids in this study. Since a Bingham fluid is a type of non-Newtonian fluid that does not flow when shear stress τ is below critical value τ 0 , shear stress τ must exceeds the critical yield value ( τ 0 ) to flow. Unlike cement milk, the ground does not inhibit flowing properties under normal conditions; thus, in order to apply the numerical analysis, the ground is assumed to be a bi-viscosity model, as shown in Figure 3, treating it as a highly viscous fluid and making the flow velocity extremely low, as if it is in an immobilized state [29,30]. Unless the ground experiences the critical shear stress ( τ y ), its viscosity is assumed to be very high and its flow velocity to be extremely low. The corresponding strain rate value at this critical point is called critical strain rate ( π c ). In addition, it is also required to determine the value of yield point parameters and the plastic viscosity. Equation (9) is a constitutive model of the Bingham fluid used in this study.
η 0 = τ ÿ γ ˙ + η
where η 0 is the viscosity coefficient in Pa·s, τ ÿ represents the yield value in Pa/m2, γ ˙ represents the shear velocity (1/s), and η represents the plastic viscosity in Pa·s.
Figure 4 show the viscoelastic model that represents the composition model for fresh concrete during the flow. It is defined by Equation (10) as follows.
τ ÿ = P δ y ¨ + 2 η + τ y Π ε i j v p ˙ Π Π c
where P is the pressure, δ y ¨ is the Kronecker delta, η is the plastic viscosity, τ y is the yield value, and ε i j v p ˙ is the strain rate during the flow.
Figure 5 show a highly viscous fluid model that represents the fluid in an immobile state. It is defined by Equation (11).
τ ÿ = P δ y ¨ + 2 η + τ y Π c ε i j v ˙ Π < Π c
In Equation (10), ε i j v ˙ ̇is the strain rate at immobility, Π c is the threshold yield value for the flow and the immobility state, and Equation (12) is obtained using critical strain rate π c .
Π c = ( 2 π c ) 2
Substituting Equation (10), the motion equation for the Bingham fluid during the flow state becomes Equations (13) and (14).
u t = F 1 ρ P + η + Λ 2 u + 2 ε ˙ i j Λ x
where P , u , and η are the pressure, velocity vector, and plastic viscosity, respectively, Λ is the parameter that depend on the fluidity, given by Equation (14), and F is the body force vector, a function of volume of fluid (VOF).
Λ = τ y Π F l u i d s t a t e τ y Π c i m m o b i l e s t a t e
In addition, Π , used for the flow judgment in Equations (10) and (11), is a function of the strain rate and is expressed by Equations (15) and (16).
Π = 2 ε ˙ i j v p ε ˙ i j v p
ε ˙ i j v p ε ˙ i j v p = ε ˙ x x v p 2 ε ˙ y y v p 2 ε ˙ z z v p 2 + 2 ( ε ˙ x y v p 2 ε ˙ y z v p 2 ε ˙ z x v p 2 )
where ε ˙ x x v p 2 is the strain rate in the x-direction, ε ˙ y y v p 2 is the strain rate in the y-direction, ε ˙ z z v p 2 is the z-direction strain rate, and ε ˙ x y v p 2 , ε ˙ y z v p 2 , and ε ˙ z x v p 2 are the shear strain rates.

4. Target, Conditions, and Material Parameters for Analysis

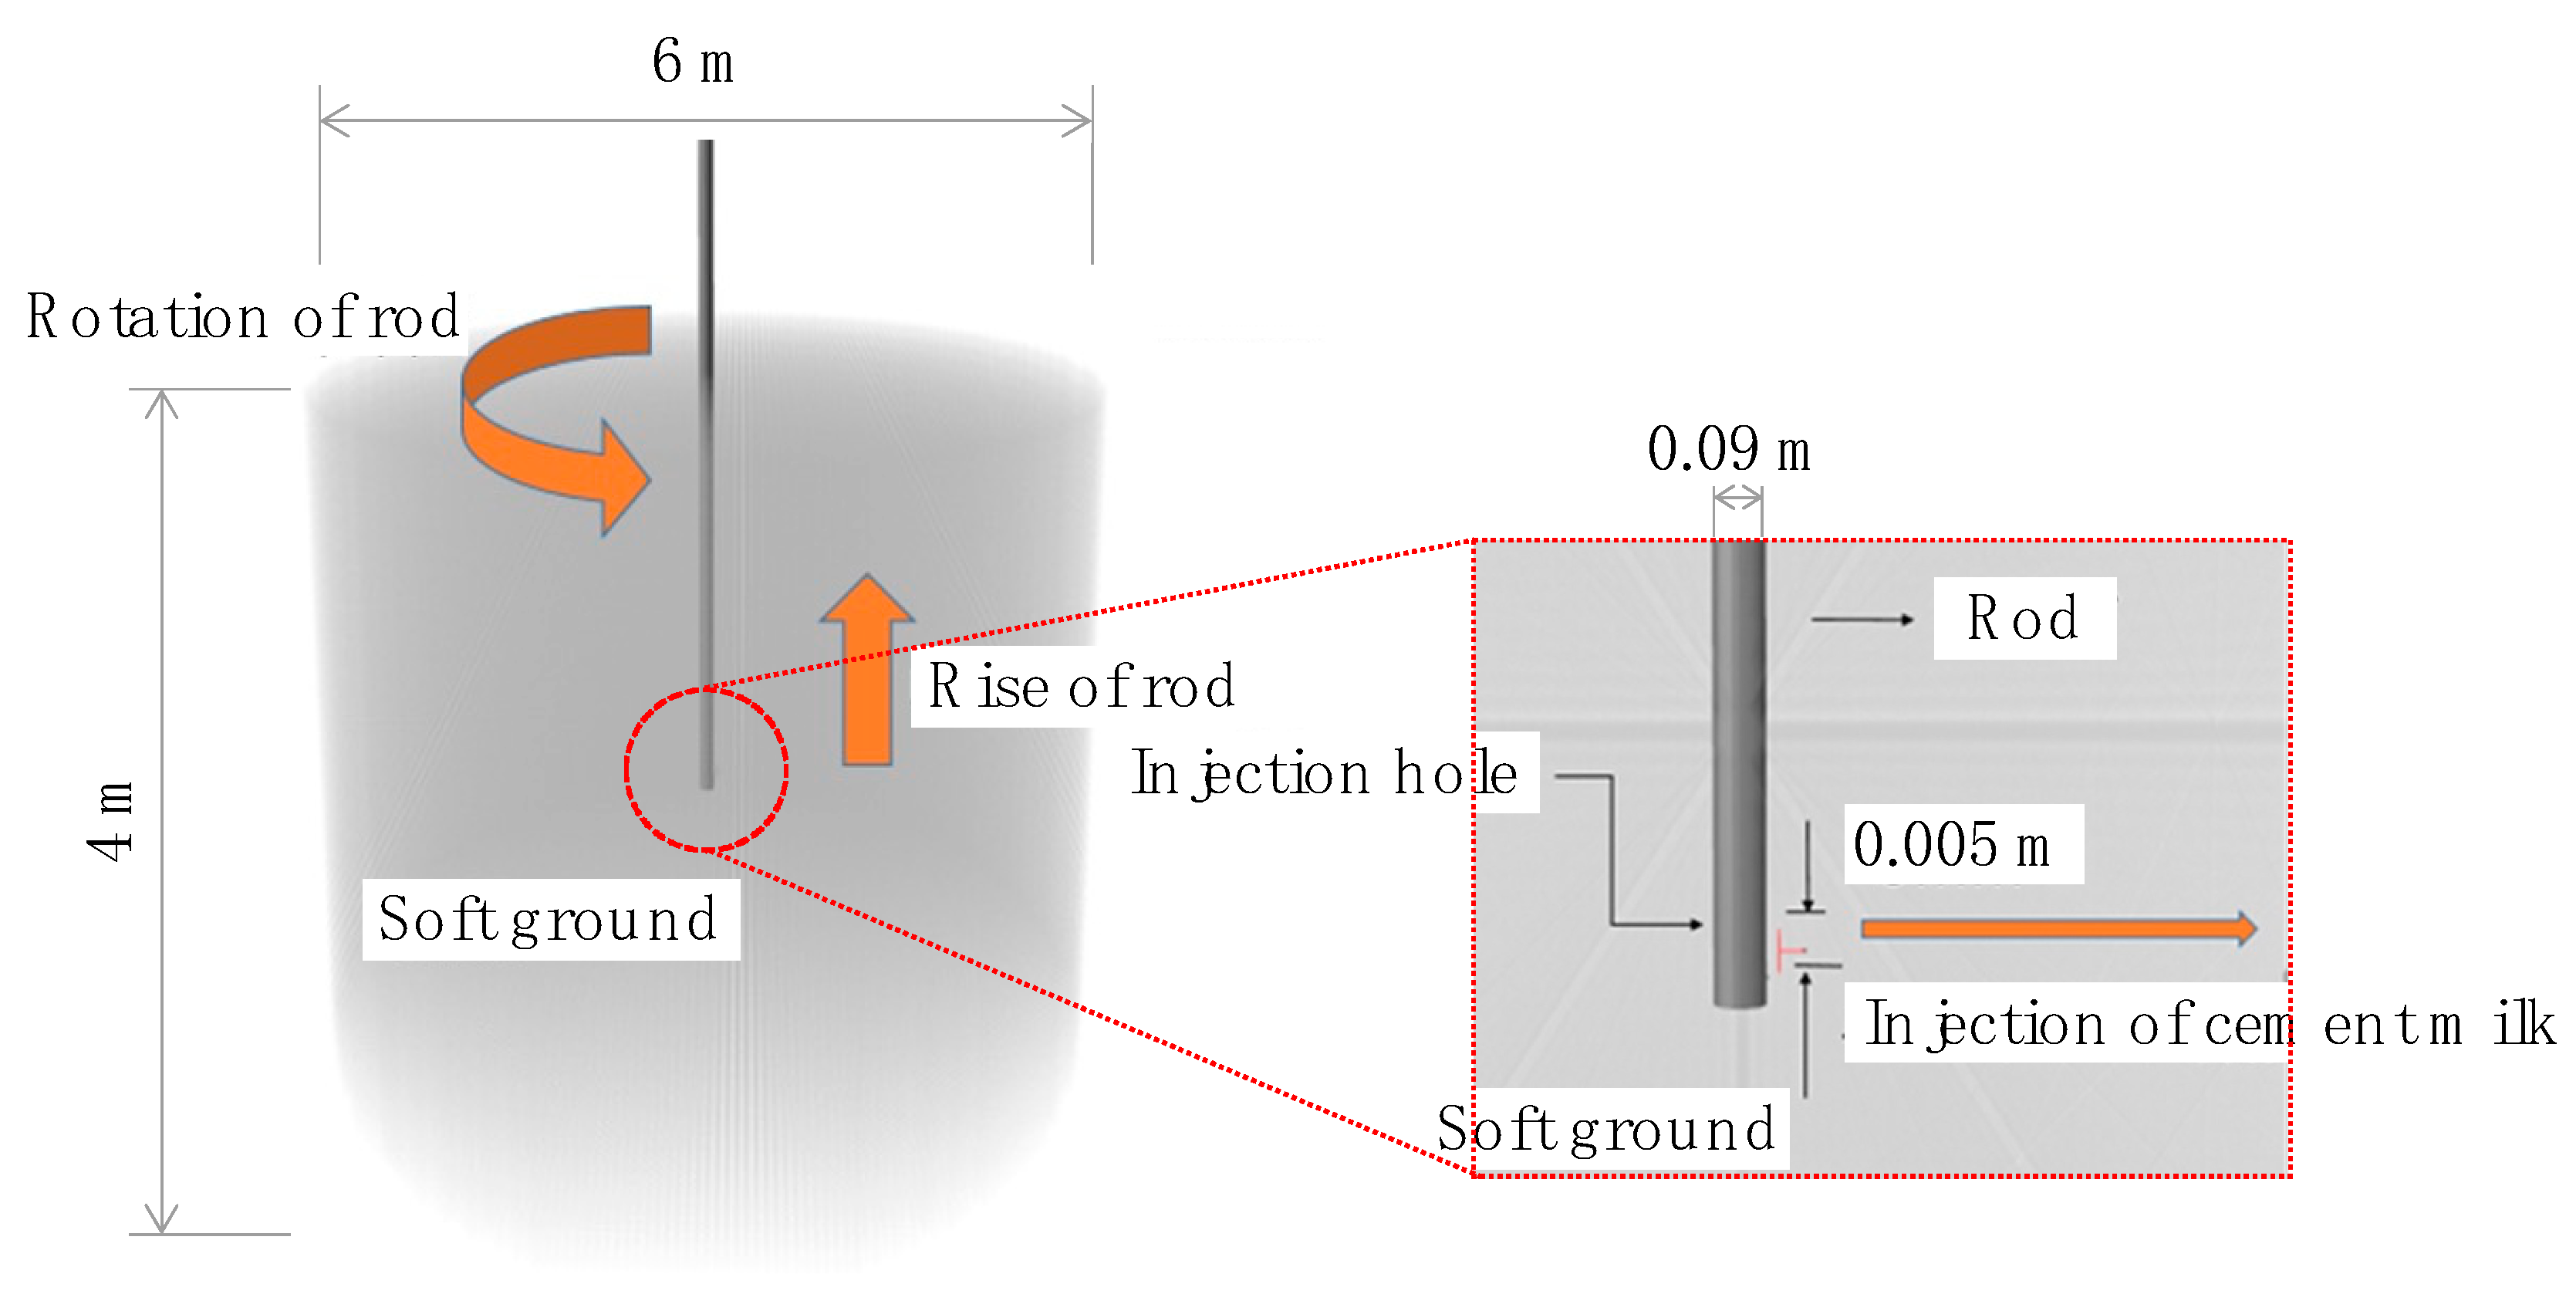
4.1. Analysis Target

The target ground model of 6 m diameter and 4 m depth and the setup of a high-pressure injection stirring cylindrical rod of 0.09 m diameter and 5 m length, with a cement slurry injecting hole of 0.005 m, to be used in the jet grouting system, is created by CAD software (see Figure 6). The inter-particle distance between the soil particles is set to be 0.05 m, and the total of 300,693 soil particles were placed in the ground model.

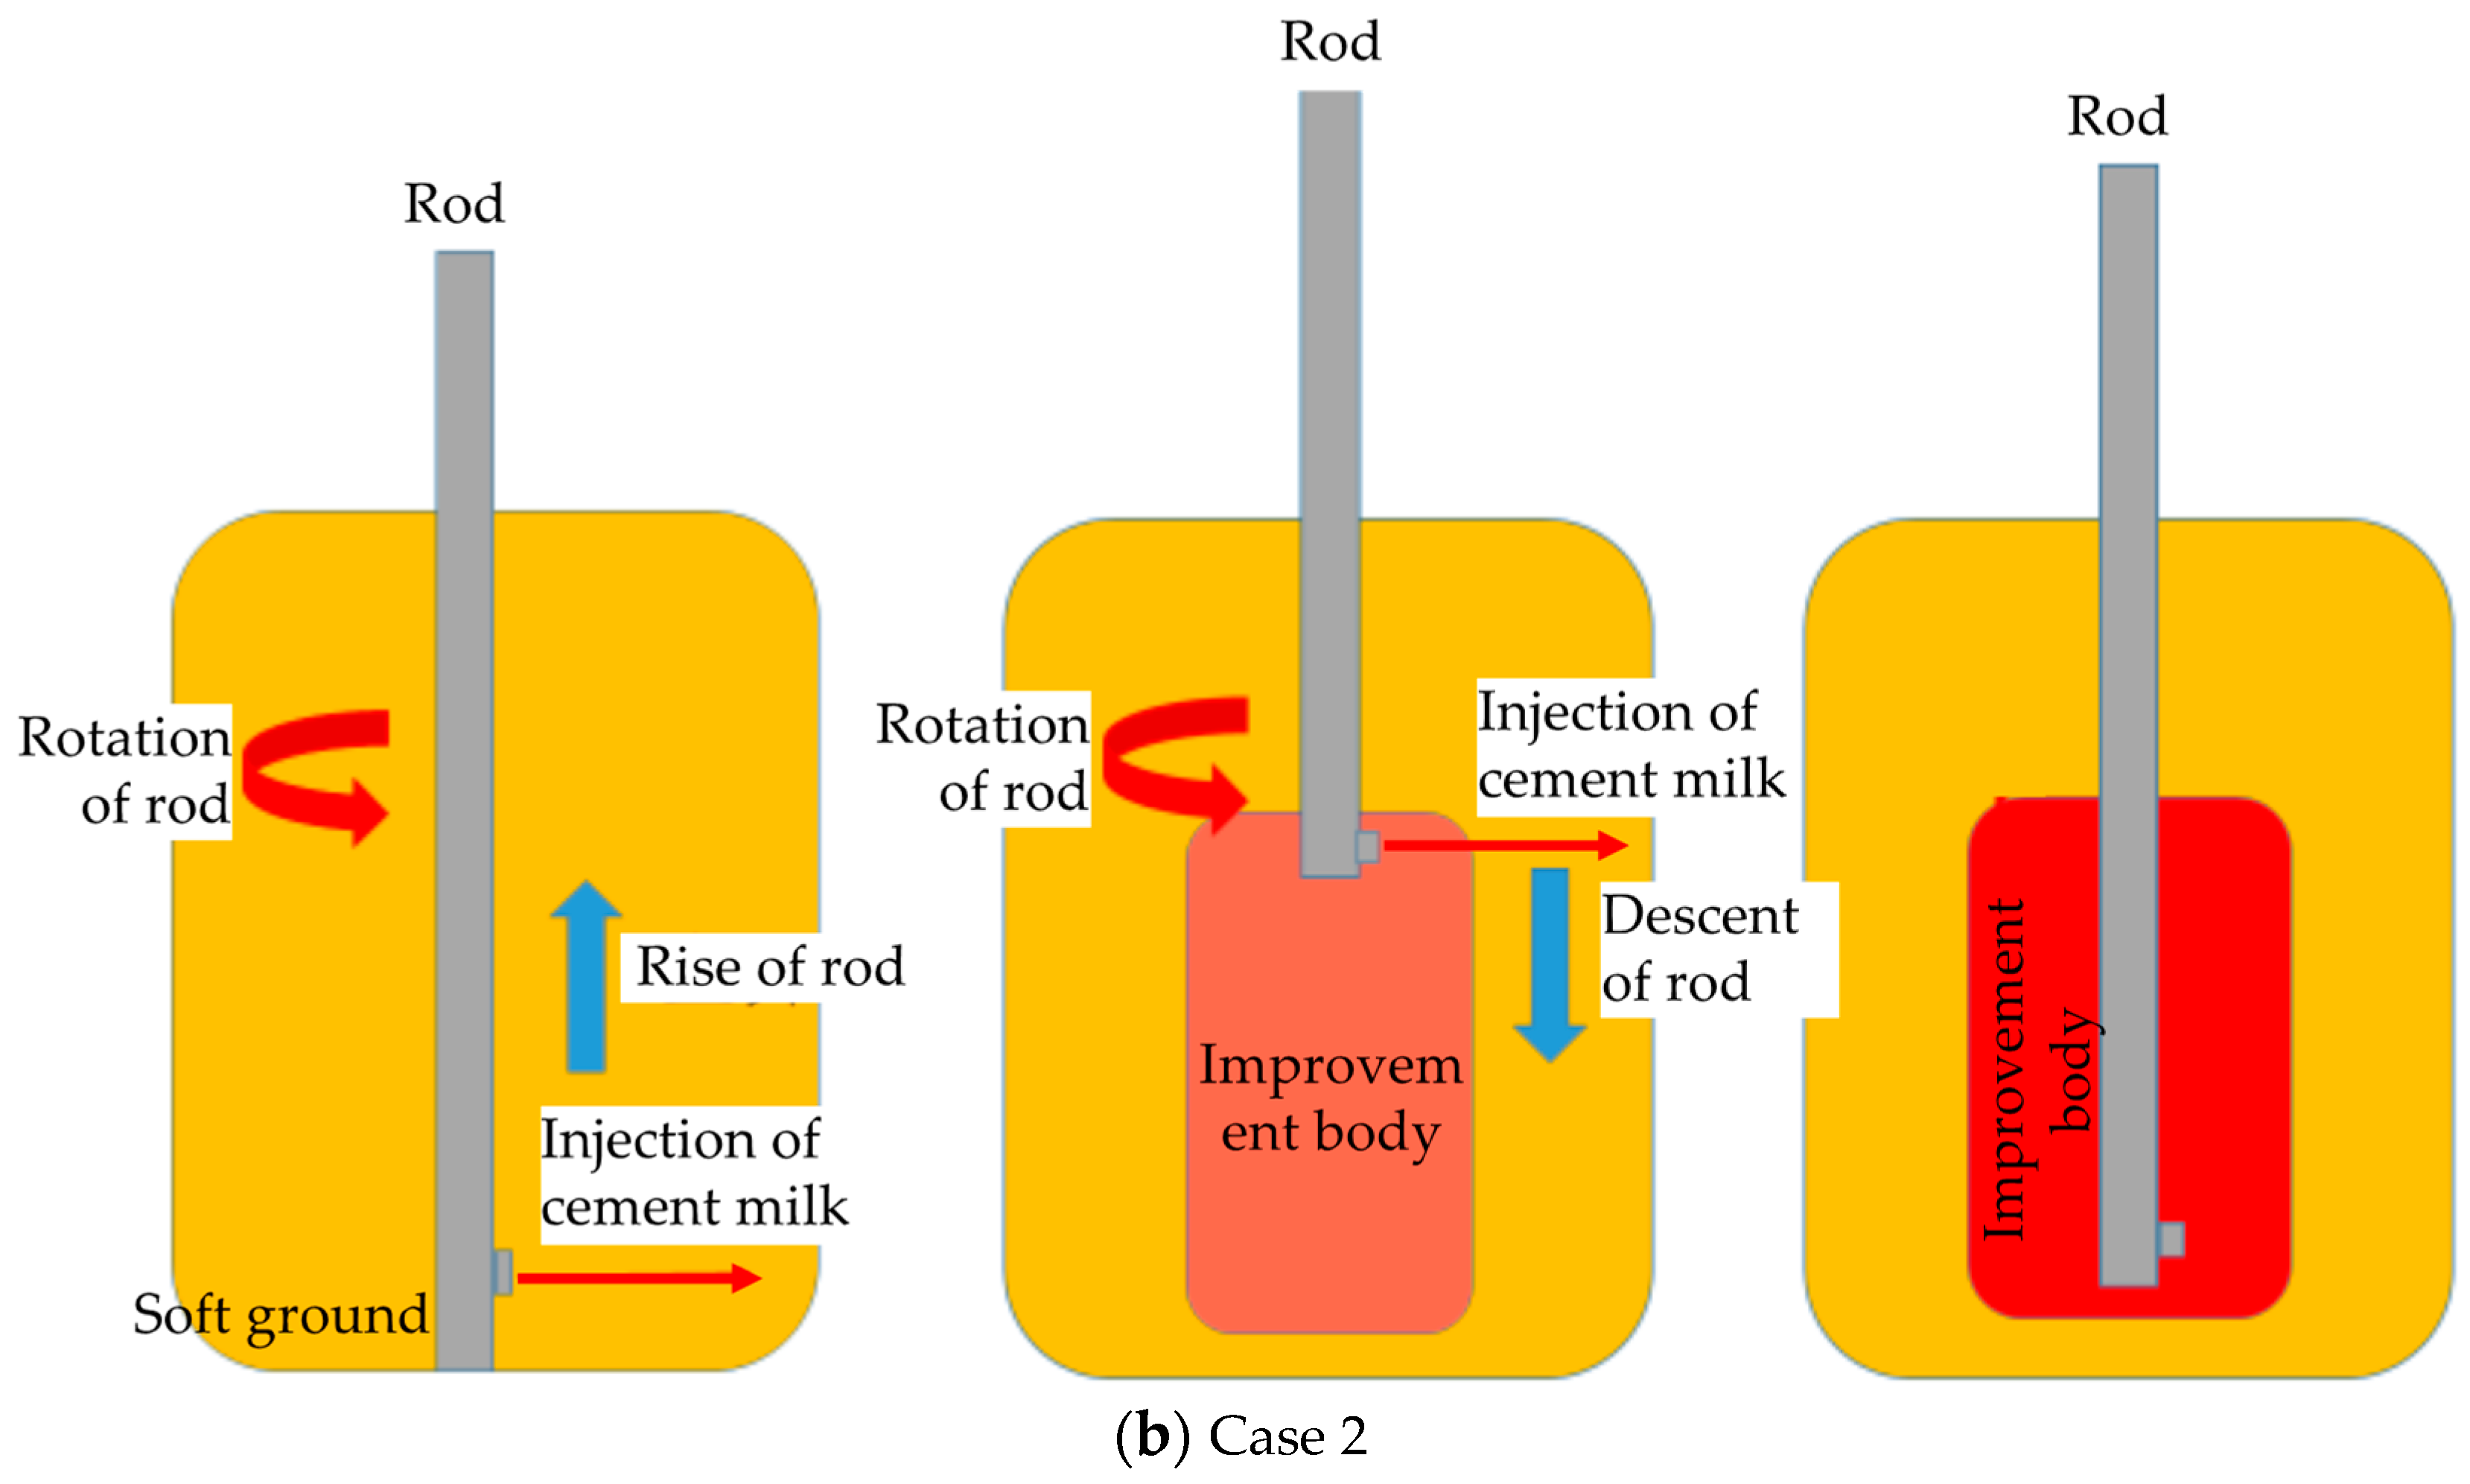
4.2. Analysis Conditions

In this study, two cases of the cement slurry injection method were simulated, and the results were compared. Both of the cases were carried out for the same time period and all other construction and material parameters were kept the same, except for the cement slurry ejection time and the vertical motion of the cylindrical rod. In Case 1, the rod was raised at 1.5 m/min, and the cement slurry ejection was carried out only during the ascent of the rod, starting from the maximum depth to the desired depth of the soil improvement body (see Figure 7a). In Case 2, the rod was moved vertically at 3 m/min, and the cement slurry ejection was started from the top level of the desired soil improvement body, continuing until the rod reached the maximum depth during the descent and continuing until it reached the starting point during the ascent (see Figure 7b). The rotation speed was 20 rpm for both cases, and the discharge rate was 0.09 m3/min. Table 1 summarizes the conditions of analysis for both cases.

4.3. Material Parameters

Since both the cement milk and the ground are assumed to be Bingham fluid, the major influencing parameters are the yield value, the plastic viscosity, and the yield point. The plastic viscosity of the cement slurry was measured using a Brookfield B-type viscometer. Since the actual water–cement ratio to be used in the construction site is 100%, this design, with computer simulation, also adopts a w/c ratio of 1 to create a more realistic result. For this reason, the yield value of the cement slurry could not be measured, as it flows without the application of additional stress. Shakya and Inazumi [31] stated that the yield value is equivalent to 3.5 times the plastic viscosity, as a rule of thumb, in Bingham fluid. Since the plastic viscosity value is low, this yield value has a negligible influence on the flow parameter. Thus, for simplicity in the design, the yield value of the cement slurry was assumed to be 0.
For the ground, the yield value was assumed to be 100 kN/m2, as determined by the uniaxial compressive test performed on the undisturbed soil sample from the construction site. As for the plastic viscosity, the result can be obtained by uniaxial compression test simulation, as suggested by Güllü [32] and Güllü et al. [33], but since the inter-particle distance between the soil particles was assumed to be 0.005 m to reduce the calculation load during the design with computer simulation, it is much larger than the actual value and will not provide the actual plastic viscosity value. In this study, the ground is assumed to be of a bi-viscosity model, which possess both solid and fluid characteristics. The plastic viscosity is then assumed to be of very high value until it exceeds the yield stress value, as if it remains in an immobile state (see Figure 4). However, this study is based on the assumption that the ground will be in fluid state and capable of flowing, so the very high plastic viscosity value is not considered in analysis.
It was assumed that the ground will behave like concrete when it comes in contact with the cement milk and thus, the necessary corresponding Bingham parameters are obtained from the flow test results of this concrete. Figure 8 shows the graph for the values of the plastic viscosity obtained for 15 different samples from the concrete flow test. The trendline was drawn to determine the approximate pattern of the graph. It can be observed that the value of plastic viscosity was higher for the lower slump flow value. It was found that for any pair of rheometers, the correlation between the values of plastic viscosity and yield stress are very high, but there is no standard method to measure concrete plastic viscosity, and it is different for different concrete rheometers [34]. However, previous studies [35,36] show the relationship between the plastic viscosity value and yield value of the fresh concrete. Here, it is important to notice that the flow value is obtained only after the critical yield value of the fresh concrete has been exceeded; thus, if the concrete has not started to flow yet, then it is resisted only by its plastic viscosity. Therefore, the corresponding value obtained by extrapolating the slump flow curve at which the flow value remains 0 becomes the plastic viscosity value, i.e., for this study, the plastic viscosity of the ground is assumed to be equivalent to 200 Pa s. (see Figure 8). Table 2 shows the summary of the cement slurry and ground parameters used in this simulation.

5. Results and Discussion

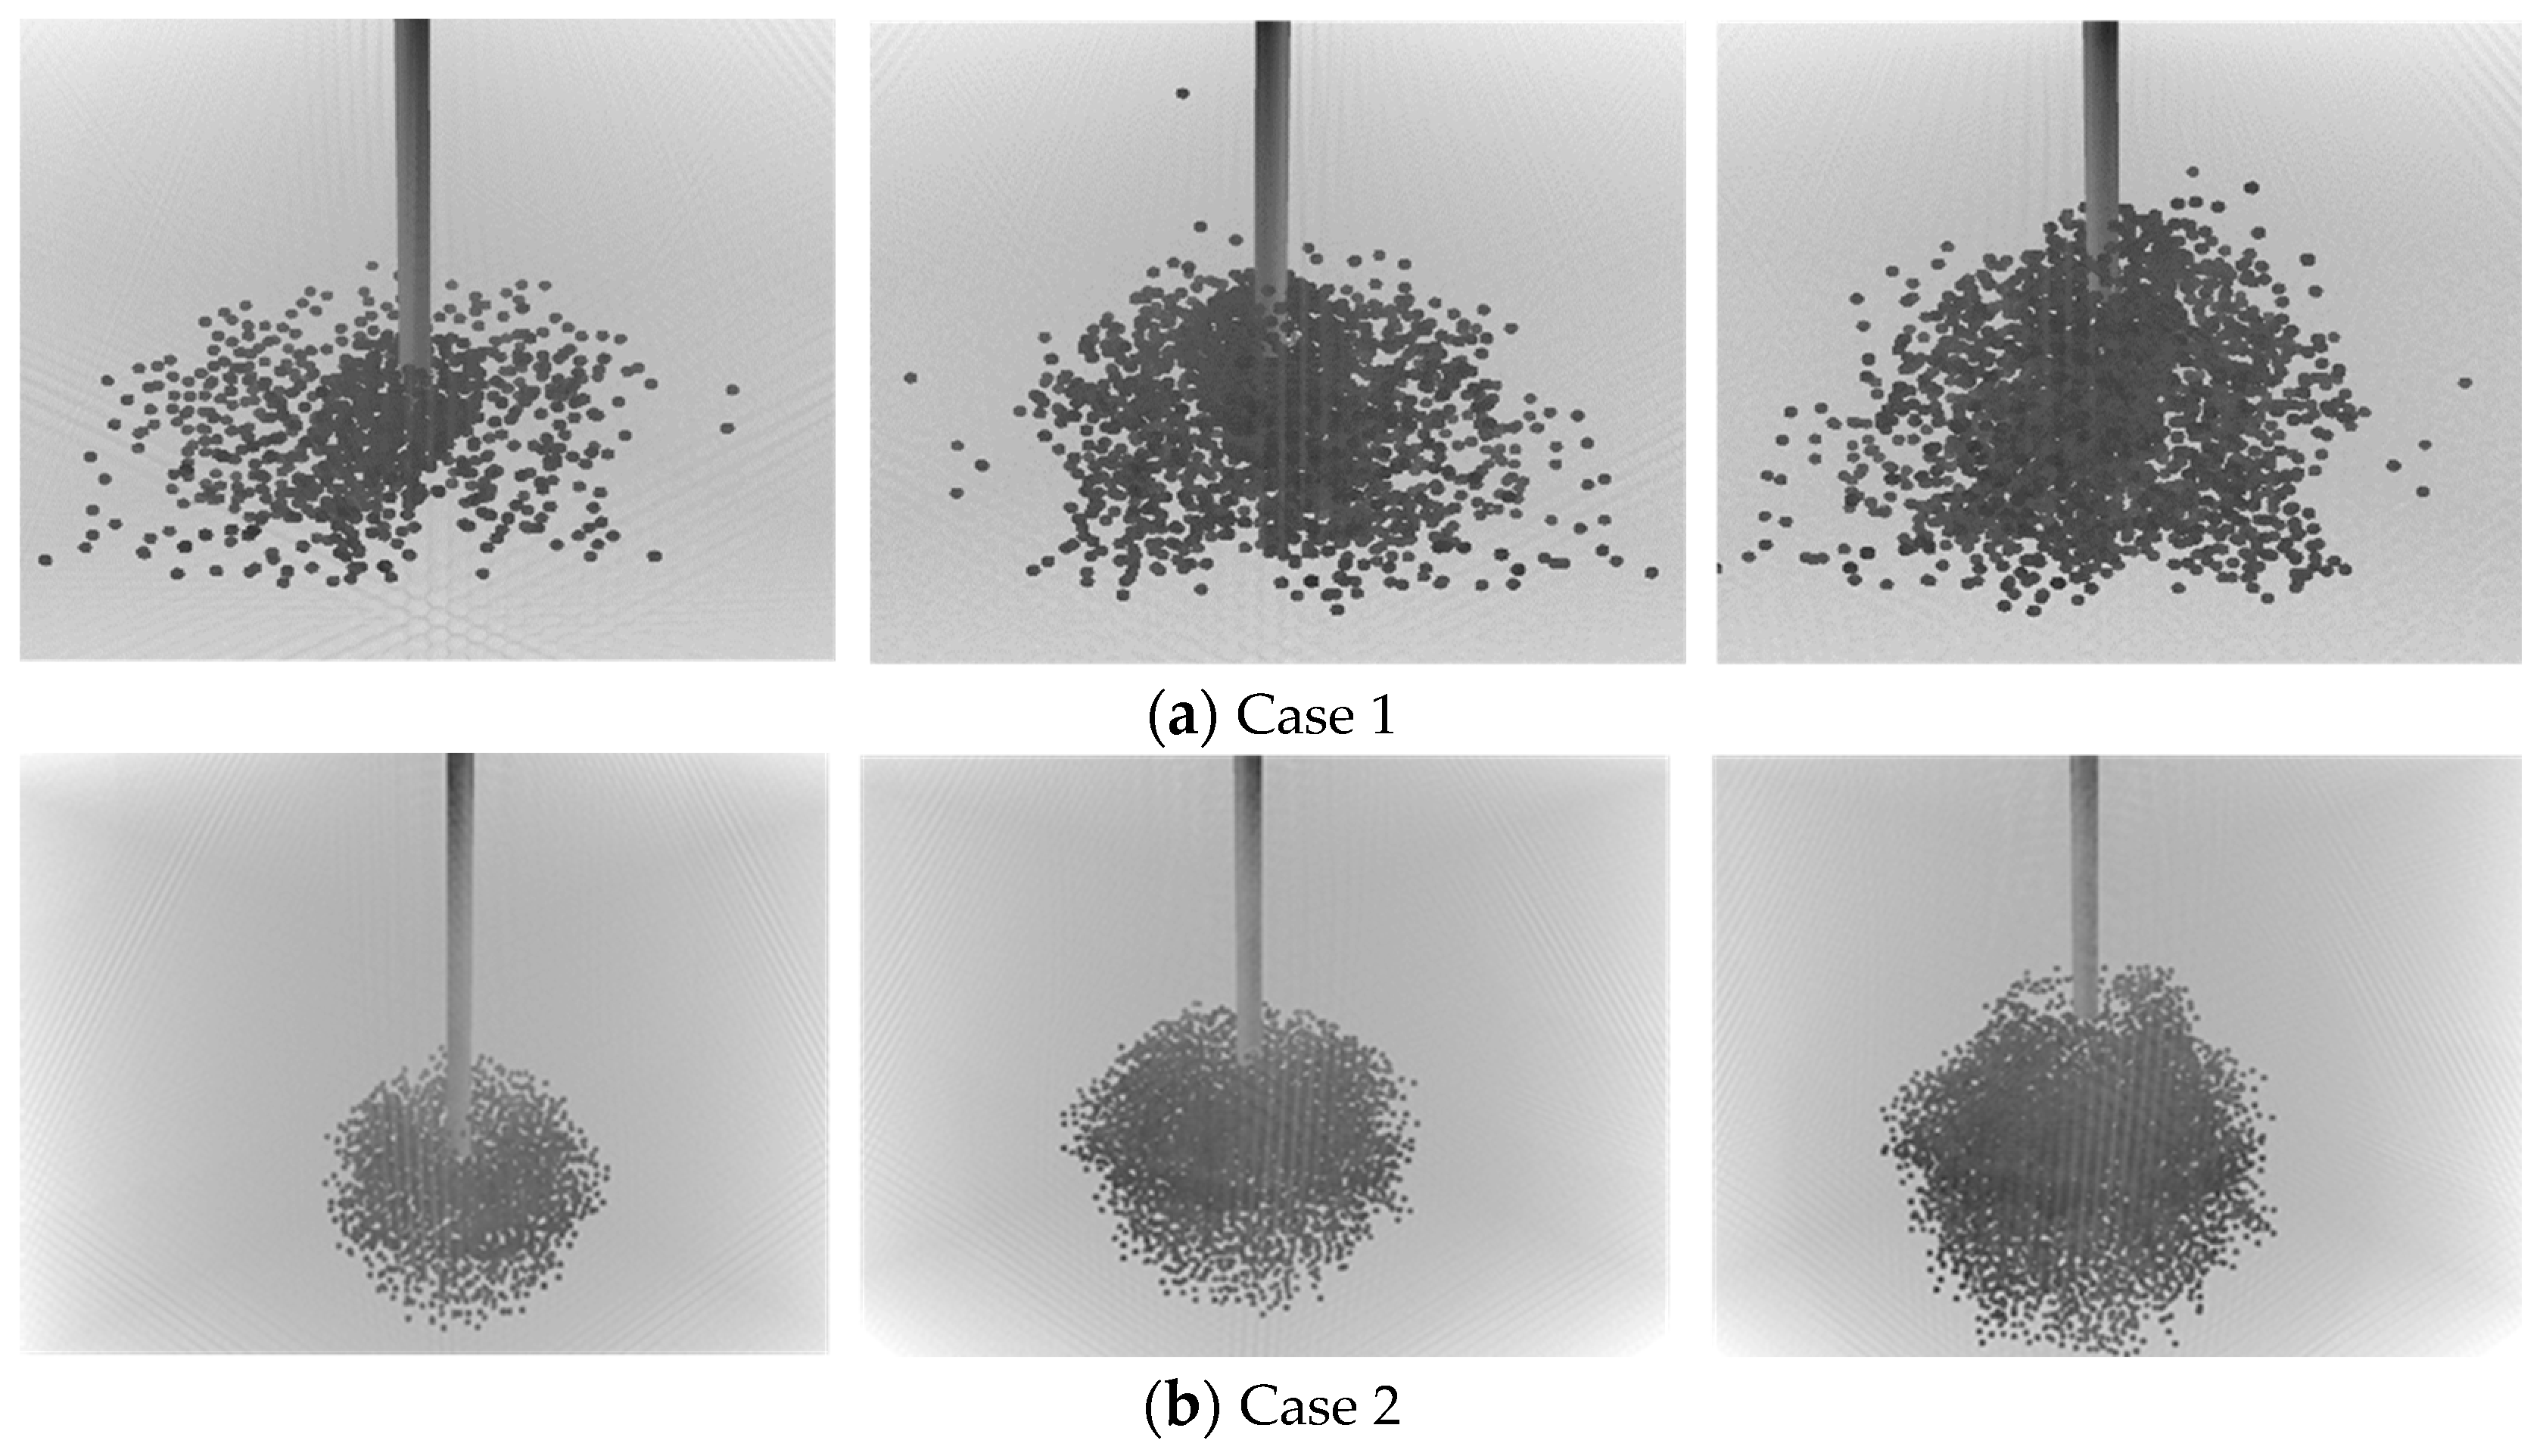
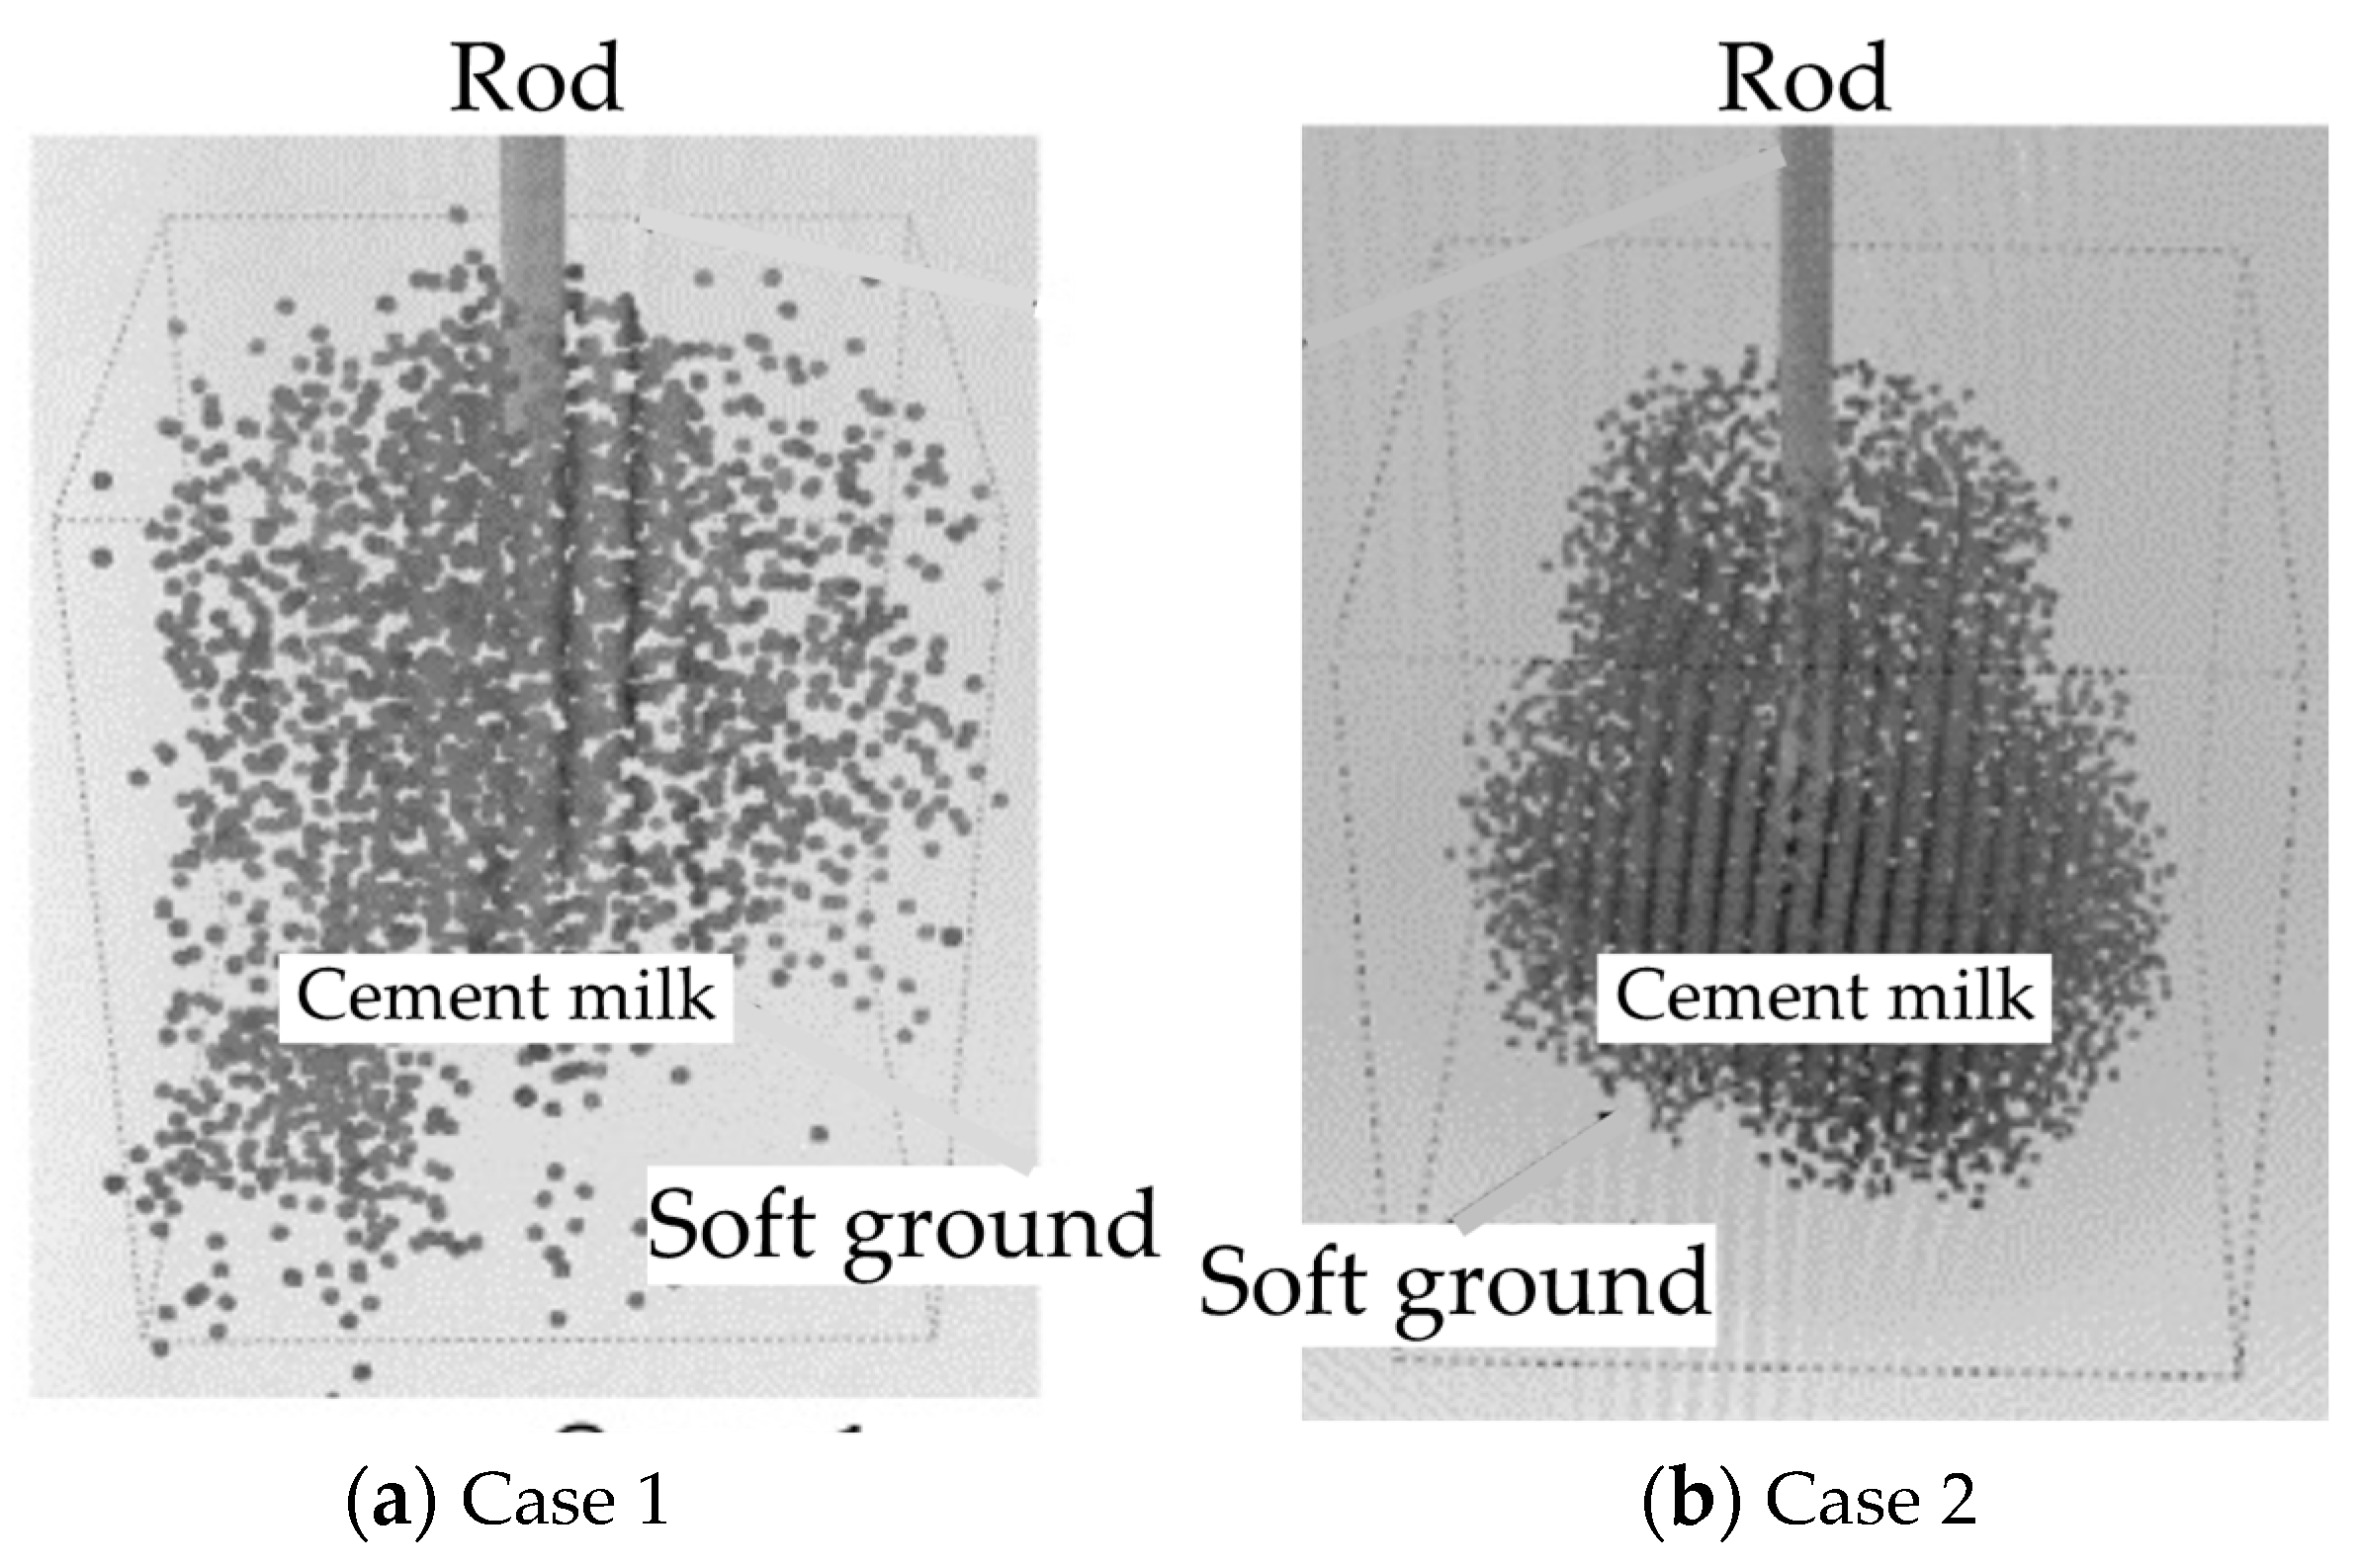
5.1. Reproduction of Improved Body Construction Condition

Figure 9a shows the Case 1 body improvement construction status, while Figure 9b shows that of Case 2. The height of the improved body was 1.5 m in both cases. A comparison of the improved bodies is shown in Figure 10. It seems that the cement milk is somewhat scattered in Case 1, but that the improved body of the cylinder itself has been successfully created. Meanwhile, it can be seen that the improved body created in the process of Case 2 has a higher concentration of cement milk, and that the cement milk is not scattered. In order to quantitatively compare these two improved bodies, the particle number density was determined. The formula for calculating the particle number density is given as Equation (17).
P a r t i c l e   n u m b e r   d e n s i t y   =   N o .   o f   c e m e n t   m i l k   p a r t i c l e s   w i t h i n   t h e   b o u n d a r y V o l u m e   o f   t h e p r o b e   r e g i o n
Table 3 summarizes the total cement milk particles for each region, the number of ground particles, the total number of particles, and the density of the cement milk particles. The particle number density was measured for a probe region of cuboid shape, with a base length 0.1 m each and a 1.5 m height. The base lengths were gradually increased by 0.5 m to widen the area for calculating the particle number density of the cement milk. Figure 11 shows a graph of the cement milk particle number density in each probe region.
It is evident that Case 2 has a higher particle number density compared to Case 1, so it can be said that better soil improvement can be achieved if grout is sprayed while both ascending and descending the rod. It can be observed that the particle number density decreases with the increase in the probe region for both cases, except for the 3.375 m3 probe region in Case 2, which might have resulted due to the intermingling of grout sprayed during the ascent and the settling of grout sprayed during the descent.

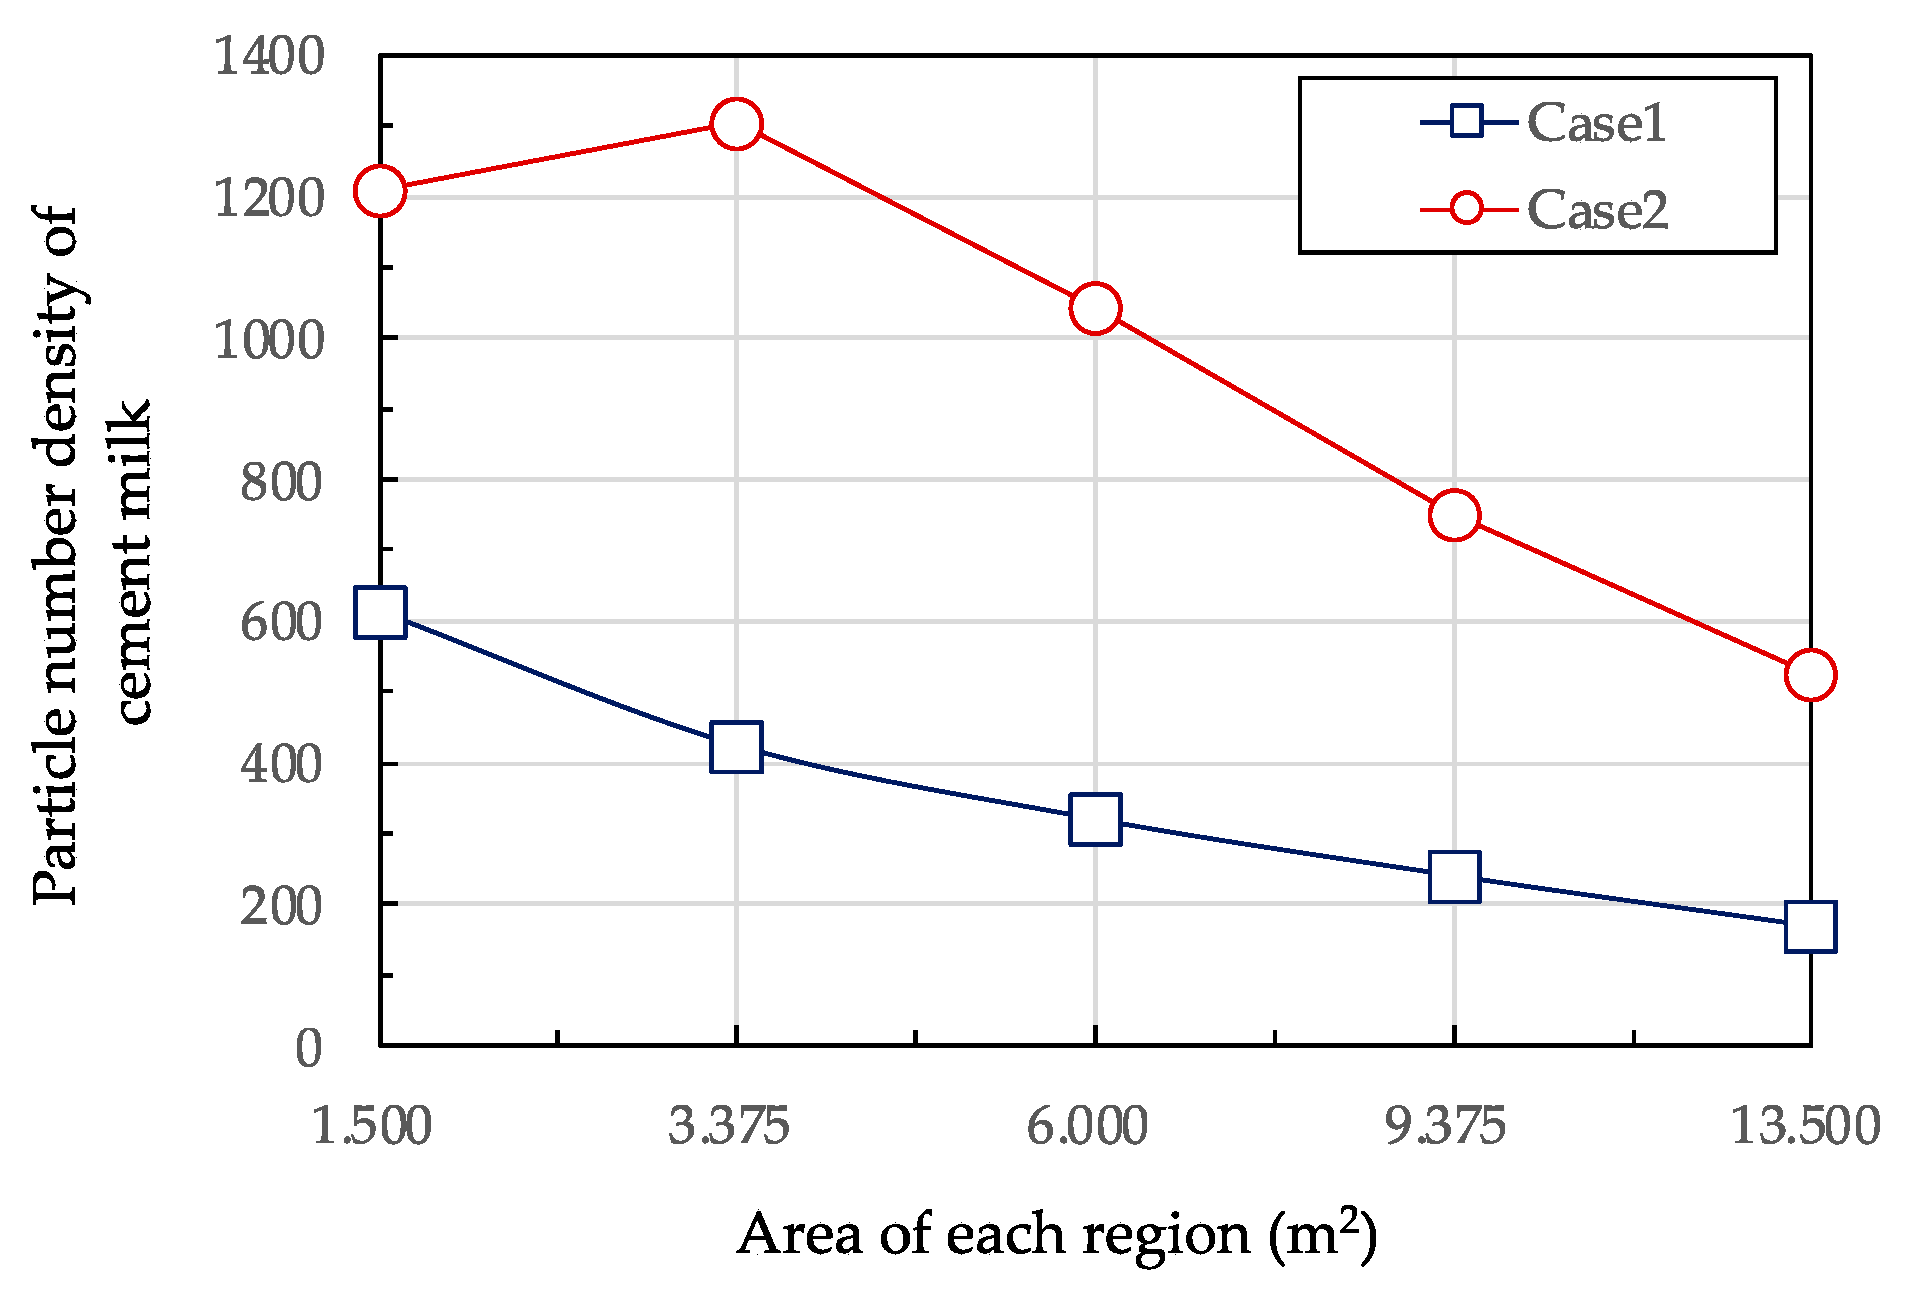
5.2. Comparison of Improved Body Diameters

It was found that the improved diameter of the improved body created in Case 1 was 1.44 m, while that in Case 2 was 1.51 m. In order to accurately measure the improved body diameter, the improved body mixture ratio was calculated using Equation (18):
I m p r o v e d   m i x t u r e   r a t i o   =   n u m b e r   o f   c e m e n t   m i l k   p a r t i c l e s t o t a l   n u m b e r   o f   p a r t i c l e s   i n   t h e   r e g i o n × 100
Table 4 summarizes the cement milk particle number in each region, the number of ground particles, the total particle number, and the mixture ratio of the improved products. The area for calculating the improved mixture ratio is 0.2 m × 0.2 m (base area) and 1.0 m (height). This region is moved from the center of the improved body toward the end of the improved body by 0.2, 0.4, 0.6, and 0.8 m, and the improved body mixture ratio of each region is calculated to accurately measure the improved diameter.
Figure 12 shows a graph with the transition of the improved mixture ratio for each region. It can be seen that the overall mixing ratio is larger for Case 2 in comparison to Case 1. In Case 1, the mixing ratio drops drastically at 0.4 m, while it was 0.6 m in Case 2. Assuming that the dimension of the improved soil body is considered for the approximate 80% mixing ratio, it can be said that the improved body radius is 0.4 m for Case 1 and 0.6 m for Case 2. The reason for having a better result for Case 2 might be explained by the spraying through the same layer twice and the probable influence on the seepage of the grout material through the inter-particle spaces. Instead of overflowing the small spaces when discharged with the high amount of cement slurry in a single phase, as in Case 1, the low discharging amount per layer at a time and the longer time lag for the percolation of an equivalent discharge amount might have enabled a higher efficiency in mixing.

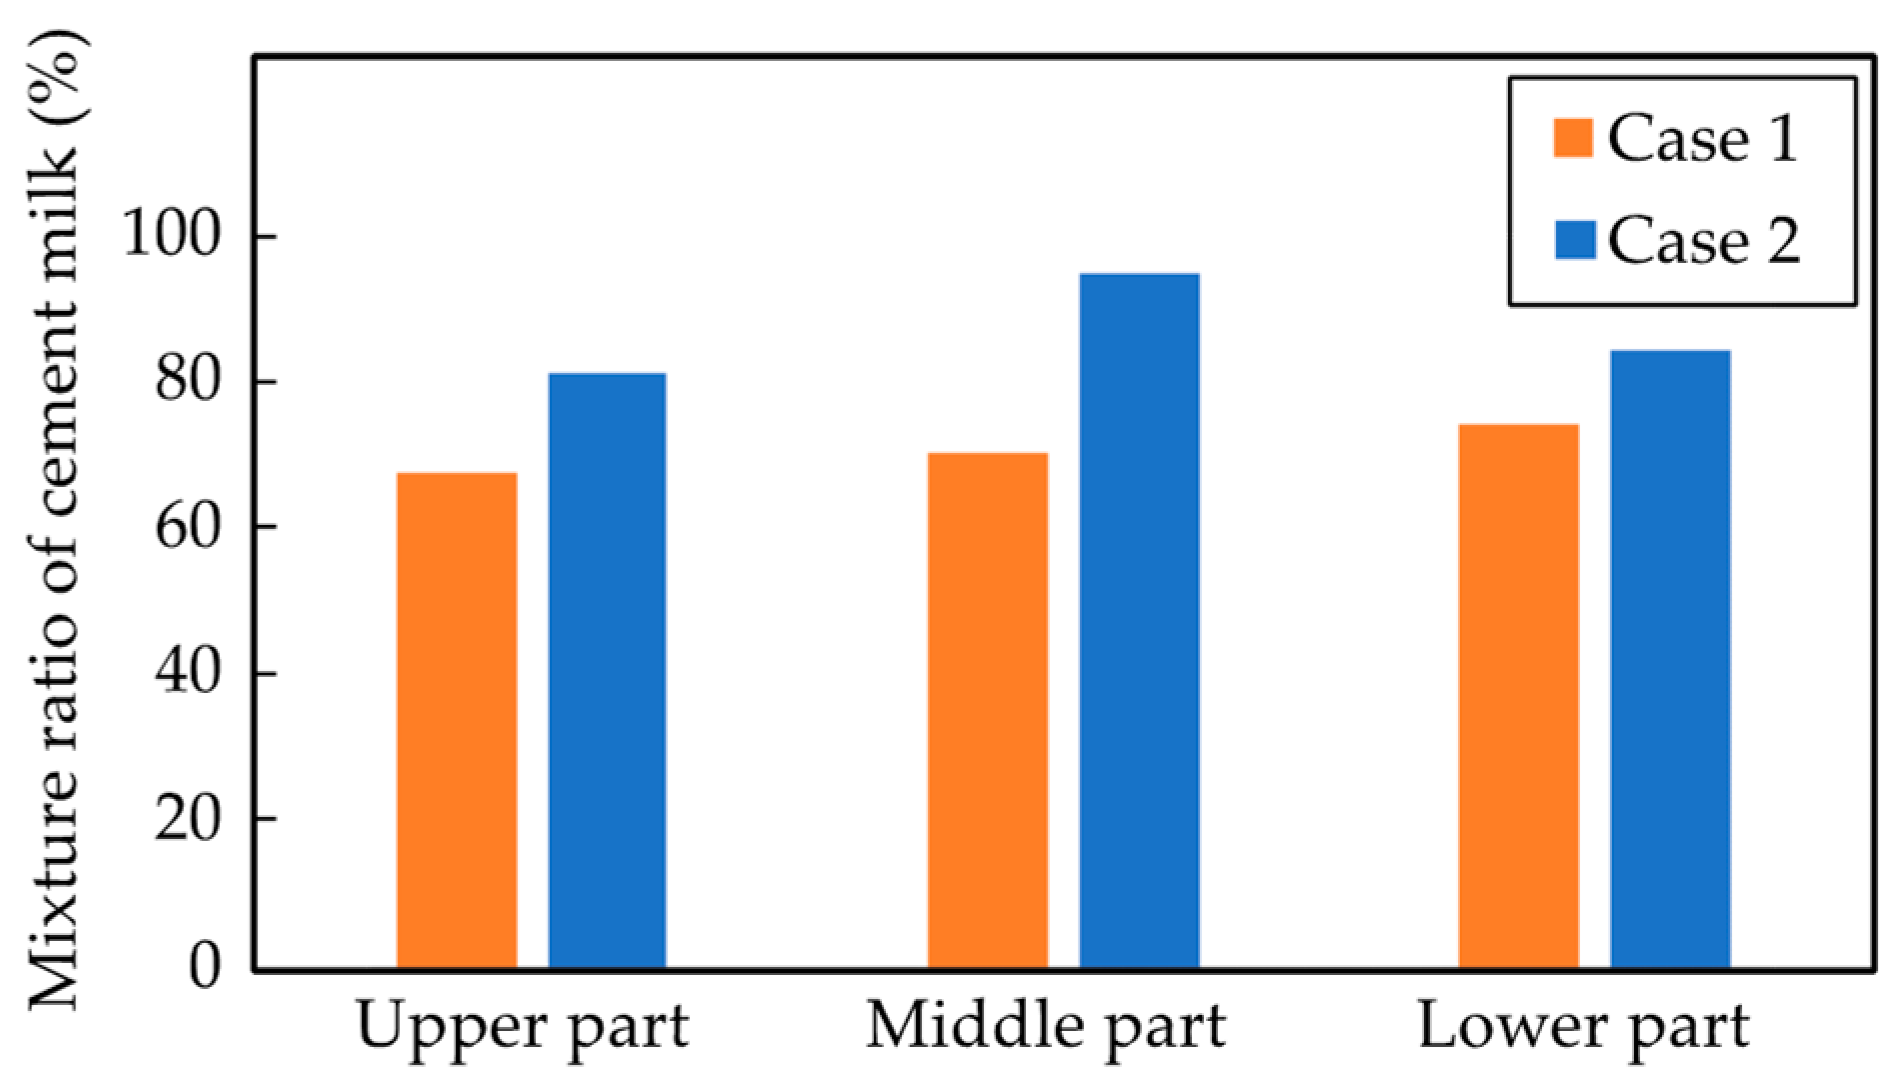
5.3. Comparison of Upper, Middle, and Lower Parts of Improved Body

Table 5 summarizes the cement milk particle number, the ground particle number, the total particle number, and the mixture ratio in each region, showing how the improved body is formed in the upper, middle, and lower parts. The improved mixture ratio is measured quantitatively for a probe region of 0.5 m (vertical) × 0.5 m (horizontal) × 0.2 m (height) in each part.
Figure 13 shows the bar chart comparison of the cement milk mixture ratio in different parts of the soil improved body. The average mixing ratio is around 70% in Case 1, while it is higher than 80% in each part for Case 2. The mixing ratio is uniform for Case 1, with it being the highest at the lower part. The probable reason is that a certain amount of sprayed cement milk had flown downward after losing the horizontal velocity. Meanwhile in Case 2, the overall mixing ratio is higher, but the central part has the densest cement milk particles. The reason for this is the downward flowing of the sprayed cement grout similar to that in Case 1. It is supported by the fact that the lower part has a higher mixing ratio than the upper part, but the reason for the maximum mixing ratio in the middle part might be the lower resistance offered by the already disturbed upper and lower soil particles. For the upper and lower parts, one side is undisturbed soil, so the resistance for grout penetration is comparatively higher and might stimulate the backward flow, without retention in the inter-particles spaces after losing horizontal velocity. However, the retention amount is higher in the middle portion, making it the densest portion.
Apart from the formation of the soil body improvement, the validity of the jet grouting system design depends upon the recreation of the mud discharge phenomenon. Figure 14 shows the mud discharge phenomenon recreated during the design. This simulation allows for a tentative visual judgement, as it can provide the visualization of all the phenomena that occurred. The total mud discharge amount from the start to the end of both simulations did not vary much when judged visually, and since the same amount of cement milk is injected, it can be assumed that the amount of cement milk retained inside for both cases is also the same.

6. Conclusions

The innovative design using computer simulation was conducted for the two different practices of soil body improvement by jet grouting systems with the objective of determining the most efficient method of cement milk spraying. The results proved that the spraying while ascending and descending the rod will provide the optimum result compared to the traditional method. Some of the conclusions that can be drawn from this study are as follows:
(1)
Case 2 of the ascending and descending method showed a higher particle number density, with the maximum density at the middle portion.
(2)
Case 2 produced a higher effective diameter, assuming an 80% mixing ratio as the benchmark.
(3)
Meanwhile, the mixing ratio throughout the height of the soil body improvement is lower, but uniform in Case 1 compared to Case 2.
(4)
The mud discharge was recreated in both cases, but there were no distinct changes in the amount of mud discharge, suggesting the success in the development of a more effective method than the traditional technique.
The success of this innovative design, using computer simulation, creates an opportunity to conduct various experimental simulations to determine the optimum construction specifications to achieve the desired results, as it can be used as a guideline for future references. However, the concern regarding the selection of the appropriate material parameters still remains. The study on the determination of soil parameters has progressed recently, but the exact value of the parameter is yet to be found. This applies to the cement slurry as well, whose yield value is still calculated empirically. Additionally, this study only provided two construction specifications; therefore, there might be other probable optimum construction specifications by which the mud discharge amount can be further reduced. Future research should be focused on addressing these issues.

Author Contributions

Conceptualization, S.I., K.C.C. and R.K.N.W.; methodology, S.I. and S.S.; software, S.S.; validation, S.S. and R.K.N.W.; formal analysis, S.S.; investigation, R.K.N.W.; resources, K.C.C. and R.K.N.W.; data curation, S.S. and S.I.; writing—original draft preparation, S.S.; writing—review and editing, S.I.; visualization, S.I.; supervision, S.I. and K.C.C.; project administration, S.I.; funding acquisition, S.I. All authors have read and agreed to the published version of the manuscript.

Funding

This research received no external funding.

Institutional Review Board Statement

Not applicable.

Informed Consent Statement

Not applicable.

Data Availability Statement

The data are contained within the article.

Conflicts of Interest

The authors declare no conflict of interest.

References

  1. Covil, C.S.; Skinner, A.E. Jet grouting—A review of some of the operating parameters that form the basis of the jet grouting process. Grouting Ground 1994, 605–629. [Google Scholar] [CrossRef]
  2. Modoni, G.; Croce, P.; Mongiovì, L. Theoretical modelling of jet grouting. Géotechnique 2006, 56, 335–347. [Google Scholar] [CrossRef]
  3. Shibazaki, M. State of Practice of Jet Grouting. In Grouting and Ground Treatment; American Society of Civil Engineers: Reston, VA, USA, 2003. [Google Scholar] [CrossRef]
  4. Burke, G.K. Jet Grouting Systems: Advantages and Disadvantages. In Proceedings of the GeoSupport 2004, Orlando, FL, USA, 29–31 January 2003. [Google Scholar] [CrossRef]
  5. Choi, R.F.Y. Review of the jet Grouting Method. Bachelor’s Thesis, University of Southern Queensland, Darling Heights, Australia, 2005. [Google Scholar]
  6. Shimano, A.; Yamazaki, J.; Shinsaka, T. The study about work progress control of jet grouting method. In Proceedings of the 12th National Symposium on Ground Improvement, Kyoto, Japan, 27–28 October 2016; pp. 455–458. [Google Scholar]
  7. Komaki, T.; Fukada, S.; Sumi, K.; Nakanishi, Y.; Tanaka, N. Demonstration experiment of evolution technology by combination mixing slurry of middle pressure injection total system. In Proceedings of the 53th Japan National Conference on Geotechnical Engineering, Takamatsu, Japan, 25–27 July 2018; pp. 835–836. [Google Scholar]
  8. Komaki, T.; Fukada, S.; Shimano, A.; Nakanishi, Y. Efficient of Mechanical mixing method with middle pressure injection by High performance fluidizing agent. In Proceedings of the 13th National Symposium on Ground Improvement, Tokyo, Japan, 18–19 October 2018; pp. 375–378. [Google Scholar]
  9. Inazumi, S.; Komaki, T.; Nakanishi, Y.; Hashida, H.; Suzuki, M. Qualities evaluation on high pressure jet mixing ground improvement methods by distinct element method (DEM). In Proceedings of the 13th National Symposium on Ground Improvement, Tokyo, Japan, 18–19 October 2018; pp. 211–216. [Google Scholar]
  10. Nakao, K.; Inazumi, S.; Takahashi, T.; Nontananandh, S. Numerical simulation of the liquefaction phenomenon by MPSM-DEM coupled CAES. Sustainability 2022, 14, 7517. [Google Scholar] [CrossRef]
  11. Inazumi, S.; Shakya, S.; Komaki, T.; Nakanishi, Y. Numerical analysis on performance of middle-pressure jet grouting method for ground improvement. Geosciences 2021, 11, 313. [Google Scholar] [CrossRef]
  12. Hamri, O.; Léon, J.C.; Giannini, F.; Falcidieno, B. Software environment for CAD/CAE integration. Adv. Eng. Softw. 2010, 41, 1211–1222. [Google Scholar] [CrossRef]
  13. Nakao, K.; Inazumi, S.; Takaue, T.; Tanaka, S.; Shinoi, T. Evaluation of discharging surplus soils for relative stirred deep mixing methods by MPS-CAE analysis. Sustainability 2022, 14, 58. [Google Scholar] [CrossRef]
  14. Shakya, S.; Inazumi, S.; Nontananandh, S. Potential of computer-aided engineering in the design of ground improvement technologies. Appl. Sci. 2022, 12, 9675. [Google Scholar] [CrossRef]
  15. Ni, J.C.; Cheng, W.C. Quality control of double fluid jet grouting below groundwater table: Case history. Soils Found. 2014, 54, 1039–1053. [Google Scholar] [CrossRef] [Green Version]
  16. Burke, G.; Cacoilo, D.; Chadwick, K. SuperJet Grouting: New Technology for In Situ Soil Improvement. Transp. Res. Rec. J. Transp. Res. Board 2000, 1721, 45–53. [Google Scholar] [CrossRef]
  17. Croce, P.; Flora, A. Analysis of single-fluid jet grouting. Géotechnique 2000, 50, 739–748. [Google Scholar] [CrossRef]
  18. Lunardi, P. Ground improvement by means of jet-grouting. Ground Improv. 1997, 1, 65–85. [Google Scholar] [CrossRef]
  19. Wang, Z.F.; Shen, S.L.; Ho, E.C.; Kim, Y.H. Jet grouting practice: An overview. Geotech. Eng. 2013, 44, 88–96. [Google Scholar]
  20. Hattori, M. An attempt to apply mathematical foundation of moving particle simulation to the MPS software “Paticleworks”. Proc. Symp. Educ. Appl. Inf. Technol. 2015, 9, 59–62. [Google Scholar]
  21. Shakibaeini, A.; Jin, Y.C. MPS mesh-free particle method for multiphase flows. Comput. Methods Appl. Mech. Eng. 2012, 229–232, 13–26. [Google Scholar] [CrossRef]
  22. Tanaka, M.; Cardoso, R.; Bahai, H. Multi-resolution MPS method. J. Comput. Phys. 2018, 359, 106–136. [Google Scholar] [CrossRef]
  23. Croce, P.; Flora, A.; Modoni, G. Jet Grouting: Technology, Design and Control; CRC Press: Boca Raton, FL, USA, 2014. [Google Scholar]
  24. Harada, K.; Ohbayashi, J.; Matsumoto, J.; Kubo, Y.; Akima, T. New ground improvement technologies under restricted conditions in Japan. In Proceedings of the 15th Asian Regional Conference on Soil Mechanics and Geotechnical Engineering, Fukuoka, Japan, 9–13 November 2015; Japanese Geotechnical Society Special Publication: Tokyo, Japan, 2016. [Google Scholar] [CrossRef] [Green Version]
  25. Njock, P.G.A.; Chen, J.; Modoni, G.; Arulrajah, A.; Kim, Y.H. A review of jet grouting practice and development. Arab. J. Geosci. 2018, 11, 459. [Google Scholar] [CrossRef]
  26. Wanik, L.; Mascolo, M.C.; Bzówka, J.; Modoni, G.; Shen, J.S.L. Experimental Evidence on the Strength of Soil Treated with Single and Double Fluid Jet Grouting. In Grouting 2017; American Society of Civil Engineers: Reston, VA, USA, 2017. [Google Scholar] [CrossRef]
  27. Toraldo, C.; Modoni, G.; Ochmański, M.; Croce, P. The characteristic strength of jet-grouted material. Géotechnique 2018, 68, 262–279. [Google Scholar] [CrossRef]
  28. Modoni, G.; Bzówka, J.; Pieczyrak, J. Experimental investigation and numerical modelling on the axial loading of jet grouting columns. Archit. Civ. Eng. Environ. 2010, 3, 69–78. [Google Scholar]
  29. Zhu, H.; Martys, N.S.; Ferraris, C.; Kee, D.D. A numerical study of the flow of Bingham-like fluids in two-dimensional vane and cylinder rheometers using a smoothed particle hydrodynamics (SPH) based method. J. Non-Newton. Fluid Mech. 2010, 165, 362–375. [Google Scholar] [CrossRef]
  30. Fukuzawa, Y.; Tomiyama, H.; Shibata, K.; Koshizuka, S. Flow analysis of highly viscous non-Newtonian fluid by MPS method. Trans. Jpn. Soc. Comput. Eng. Sci. 2014, 2014, 20140007. [Google Scholar] [CrossRef]
  31. Shakya, S.; Inazumi, S. Soil behavior modeling by mps-cae simulation. Geomate J. 2023, 24, 18–25. [Google Scholar] [CrossRef]
  32. Güllü, H. A new prediction method to rheological behavior of grout with bottom ash for jet grouting columns. Soils Found. 2017, 57, 384–396. [Google Scholar] [CrossRef]
  33. Güllü, H.; Cevik, A.; Al-Ezzi, K.M.; Gülsan, M.E. On the rheology of using geopolymer for grouting: A comparative study with cement-based grout included fly ash and cold bonded fly ash. Constr. Build. Mater. 2019, 196, 594–610. [Google Scholar] [CrossRef]
  34. Tomiyama, J.; Iribe, T.; Sakihara, K.; Iraha, S.; Yamada, Y. Application of MPS method to flow analysis of fresh concrete. J. Struct. Eng. A 2009, 55, 164–171. [Google Scholar] [CrossRef]
  35. Li, Z.; Ohkubo, T.; Tanigawa, Y. Flow performance of high-fluidity concrete. J. Mater. Civ. Eng. 2004, 16, 588–596. [Google Scholar] [CrossRef]
  36. Ferraris, C.F.; Brower, L.E. Comparison of Concrete Rheometers: International Tests at MBT (Cleveland OH, USA) in May 2003; National Institute of Standards and Technology: Gaithersburg, MD, USA, 2004; pp. 41–70.
Figure 1. Construction procedure of jet grouting system.
Sustainability 15 05602 g001
Figure 2. Assumed mechanism of mud discharge due to jet grouting system.
Sustainability 15 05602 g002
Figure 3. Concept of bi-viscosity model.
Sustainability 15 05602 g003
Figure 4. Viscoelastic model concept.
Sustainability 15 05602 g004
Figure 5. Highly viscous fluid model concept.
Sustainability 15 05602 g005
Figure 6. Images of overall and enlarged sections of the analyzed model.
Sustainability 15 05602 g006
Figure 7. Images of overall and enlarged sections of the analyzed model.
Sustainability 15 05602 g007aSustainability 15 05602 g007b
Figure 8. Trendline for the ground flow test.
Sustainability 15 05602 g008
Figure 9. Condition of improved body construction.
Sustainability 15 05602 g009
Figure 10. Comparison of improved bodies.
Sustainability 15 05602 g010
Figure 11. Transition of particle number density of cement milk in each region.
Sustainability 15 05602 g011
Figure 12. Transition of each region and improved mixture ratio.
Sustainability 15 05602 g012
Figure 13. Comparison of upper, middle, and lower mixture ratios for each case.
Sustainability 15 05602 g013
Figure 14. State of mud drainage obtained as analysis results.
Sustainability 15 05602 g014
Table 1. Analysis conditions.
CaseRotation Speed (rpm)Spray Volume (m3/min)Rod Motion
1200.091.5 m/min upward
2200.093 m/min upward
3 m/min downward
Table 2. Material parameters.
Density (kg/m3)Plastic Viscosity (Pa·s)Yield Value (Pa)
Cement milk16000.280
Ground2300200100,000
Table 3. Number of particles and distribution of density of the number of particles within the boundary.
CaseVolume of Area (m3)13.59.37563.3751.5
1Number of particles of cement milk2265223919241434921
Number of ground particles8049727646842265694
Total particle numbers10,3149515660836991615
Density of number of particles (number/m3)168239320424614
2Number of particles of cement milk71147027627544011832
Number of ground particles11,936944839231011259
Total particle numbers19,04816,47510,19854112091
Particle number density (number/m3)527750104513041211
Table 4. Number of particles in each region and mixture ratio of each improved body.
CaseApart from Central Axis (m)0.00.20.40.60.8
1Number of particlesCement milk1731631223815
Ground41359147165
Total177179181185180
Mixture ratio of improved body (%)97.791.167.420.58.3
2Number of particlesCement milk19316722516968
Ground131342106250
Total205180267275318
Mixture ratio of improved body (%)93.792.884.361.521.4
Table 5. Number of particles in each region and density of number of particles of each improved body.
CasePortionUpperMiddleLower
1Number of particlesCement milk156165167
Ground736756
Total229232223
Density of number of particles
(number/m3)
687175
2Number of particlesCement milk330383342
Ground731861
Total403401403
Density of number of particles
(number/m3)
829685
Disclaimer/Publisher’s Note: The statements, opinions and data contained in all publications are solely those of the individual author(s) and contributor(s) and not of MDPI and/or the editor(s). MDPI and/or the editor(s) disclaim responsibility for any injury to people or property resulting from any ideas, methods, instructions or products referred to in the content.

