Article

Analysis of the Effect of Modified Biochar on Saline–Alkali Soil Remediation and Crop Growth

Botany Laboratory, College of Life Sciences, Zhejiang Normal University, Jinhua 321004, China
*
Author to whom correspondence should be addressed.
Sustainability 2023, 15(6), 5593; https://doi.org/10.3390/su15065593
Submission received: 17 February 2023 / Revised: 16 March 2023 / Accepted: 16 March 2023 / Published: 22 March 2023

Abstract

:
To solve the problem of soil degradation in coastal saline–alkali land, three different types of biochar (rice straw biochar, magnetic biochar, and humic acid–magnetic biochar) were prepared to remedy the saline–alkali soil under different mixing ratios. The effects of biochar on the growth of crops in saline–alkali soil were explored through a pot experiment on Chinese cabbage. The experimental results showed that the soil leaching treatment combined with humic acid–magnetic biochar could effectively repair the coastal saline–alkali soil. After adding 5% humic acid–magnetic biochar, the content of soil organic matter was 33.95 g/kg, the water content was 13.85%, and the contents of available phosphorus and available potassium were 9.43 mg/kg and 29.51 mg/kg. After adding 5% humic acid–magnetic biochar, the plant height of Chinese cabbage was 9.16 ± 0.19 cm, and the plant germination rate reached 83.33 ± 5.54%. The incorporation of biochar could effectively increase the chlorophyll content and soluble protein content of pakchoi and reduce the soluble sugar content of pakchoi. The study analyzed the effect of different modified biochar on saline–alkali land restoration and crop growth and explored the action rule of hydrochloric acid magnetic biochar on saline–alkali land restoration, which has important practical value for improving coastal saline–alkali land.

1. Introduction

Soil salinization is a key issue in soil degradation control in recent years. Excessive salinization will destroy the physical and chemical structure of soil and cause a serious impact on the growth and output of soil crops [1,2]. The increase in the global salinization area of soil has reduced the world’s agricultural productivity. When the global population increases, the international agricultural structural crisis and food security risks are increasingly prominent. It is required to improve the saline–alkali land governance and protect agricultural cultivated land resources [3]. The groundwater level of the coastal wetland is relatively high and contains a large amount of soluble salts, which easily accumulate in the surface soil and form the primary coastal saline–alkali land [4,5,6]. The artificial factors of seawater irrigation will also aggravate the salinization of coastal wetland soil. The strong alkalization of the coastal saline–alkali land will cause serious degradation of the soil structure, thus affecting the growth of plants and crops in the coastal area, leading to a decline in agricultural production capacity in the coastal area [7]. In coastal areas with soil salinization, the soil shows the characteristics of high salt content and strong alkalization. Salinity stress in saline–alkali land will lead to the excessive accumulation of plant active oxygen, which will cause cell tissue damage and hinder the normal growth of plants [8,9]. Moreover, soil salinization will also have an impact on soil fertility, resulting in a decrease in the soil’s water-holding capacity and organic matter content. It is conducive to the nutrient absorption of crops, thus inhibiting the production of plants and crops in saline–alkali land [10,11]. Soil salinization also reduces the permeability of the soil, affecting the water absorption activities of plant and crop roots and causing physiological dehydration and other problems [12,13]. Soil salinization also has a negative impact on soil microbial communities, which worsens soil biological characteristics and hinders the growth and development of plants and crops [14,15,16]. The action of biochar on plants can accelerate their growth, thus increasing the yield of crops. When biochar and nitrogen are used together, the dry matter content of radish can be increased because of the reaction between biochar and nitrogen. Even if the highest biochar content is added to the soil without applying nitrogen fertilizer, it will not increase the crop yield. Therefore, only the combination of biochar and nitrogen fertilizer can improve crop yield.
In previous studies, it was believed that biochar could effectively deal with soil problems. Wang S and others analyzed the adsorption mechanism of ferric chloride-modified wheat straw biochar. The results showed that the modified method improved the adsorption capacity of ammonium, thereby improving the capacity of sewage treatment [17]. Roy H et al. developed a low-cost biochar adsorbent and used it to treat methylene blue dye in an aqueous solution. Through experiments, it was proved that low-cost CMP-derived biochar had the potential to remove dye from industrial wastewater [18]. However, in previous studies, a large amount of biochar had poor treatment capacity in saline–alkali soil. Therefore, a new type of biochar was needed to adsorb pollutants in saline–alkali soil and promote crop growth.
Therefore, the research uses straw to prepare biochar and carries out magnetic modification and humic acid grafting treatment to explore the remediation effect of modified biochar on saline–alkali land. The impact of modified biochar on the growth of crops is further analyzed in saline–alkali land. It is expected that the use of modified biochar improves the nutrient retention capacity of saline–alkali soil and achieves the effect of reducing soil salinity so as to improve the growth performance of crops in coastal saline–alkali land. It provides a reference for solving the problem of soil degradation in coastal saline–alkali land. In order to show the innovation of the research more clearly, the advantages and disadvantages of different types of biochar are compared, as shown in Table 1.

2. Experimental Design of the Effect of Modified Biochar on Saline–Alkali Soil Remediation and Crop Growth

2.1. Preparation Method of Modified Biochar

2.1.1. Experimental Instruments

The instruments used in the material preparation process were as follows: (1) Muffle furnace (Beijing Tongde Pioneer Technology, Beijing, China), equipment model BML-1, which was used for the pyrolysis processing of straw powder. (2) Pulverizer (Shanghai Instrument and Electric Science Instrument, Shanghai, China), with the equipment model FW100, was used to crush the straw into powder. (3) Magnetic stirrer (IKA, Staufen, Germany), with equipment model S025, was used to evenly mix the reactants. (4) Vacuum freeze dryer (Shanghai Yuming Biotechnology, Shanghai, China), equipment model FD-1A-50, which was used to freeze dry the prepared sediment.
The material performance and characterization test instruments were as follows: (1) Infrared spectrum test: Fourier infrared spectrometer (Thermo Fisher Scientific, Shanghai, China), equipment model Nicolet6700, which was used to determine the infrared spectrum. (2) Element analysis: element analyzer (Elemental, Heraeus, Germany); equipment model Vario EL III, which was used to determine the composition and structure of substances. (3) Material parameter analysis: portable multi-parameter analyzer (Shanghai Instrument and Electronics Science Instrument, Shanghai, China); equipment model DZB-718, which was used to measure conductivity and pH parameters.

2.1.2. Experimental Materials and Reagents

The main material of the experiment was rice straw, which was purchased and placed in a drying oven for drying treatment. It was dried at a constant temperature for 12 h, and the temperature was maintained at 70 °C. After the treatment, the rice straw was placed in a dry place for storage. The main experimental reagents include sodium hydroxide, acetic acid, iron sulfate, ferrous sulfate heptahydrate, and anhydrous ethanol. The purity of all experimental reagents is analytical pure.

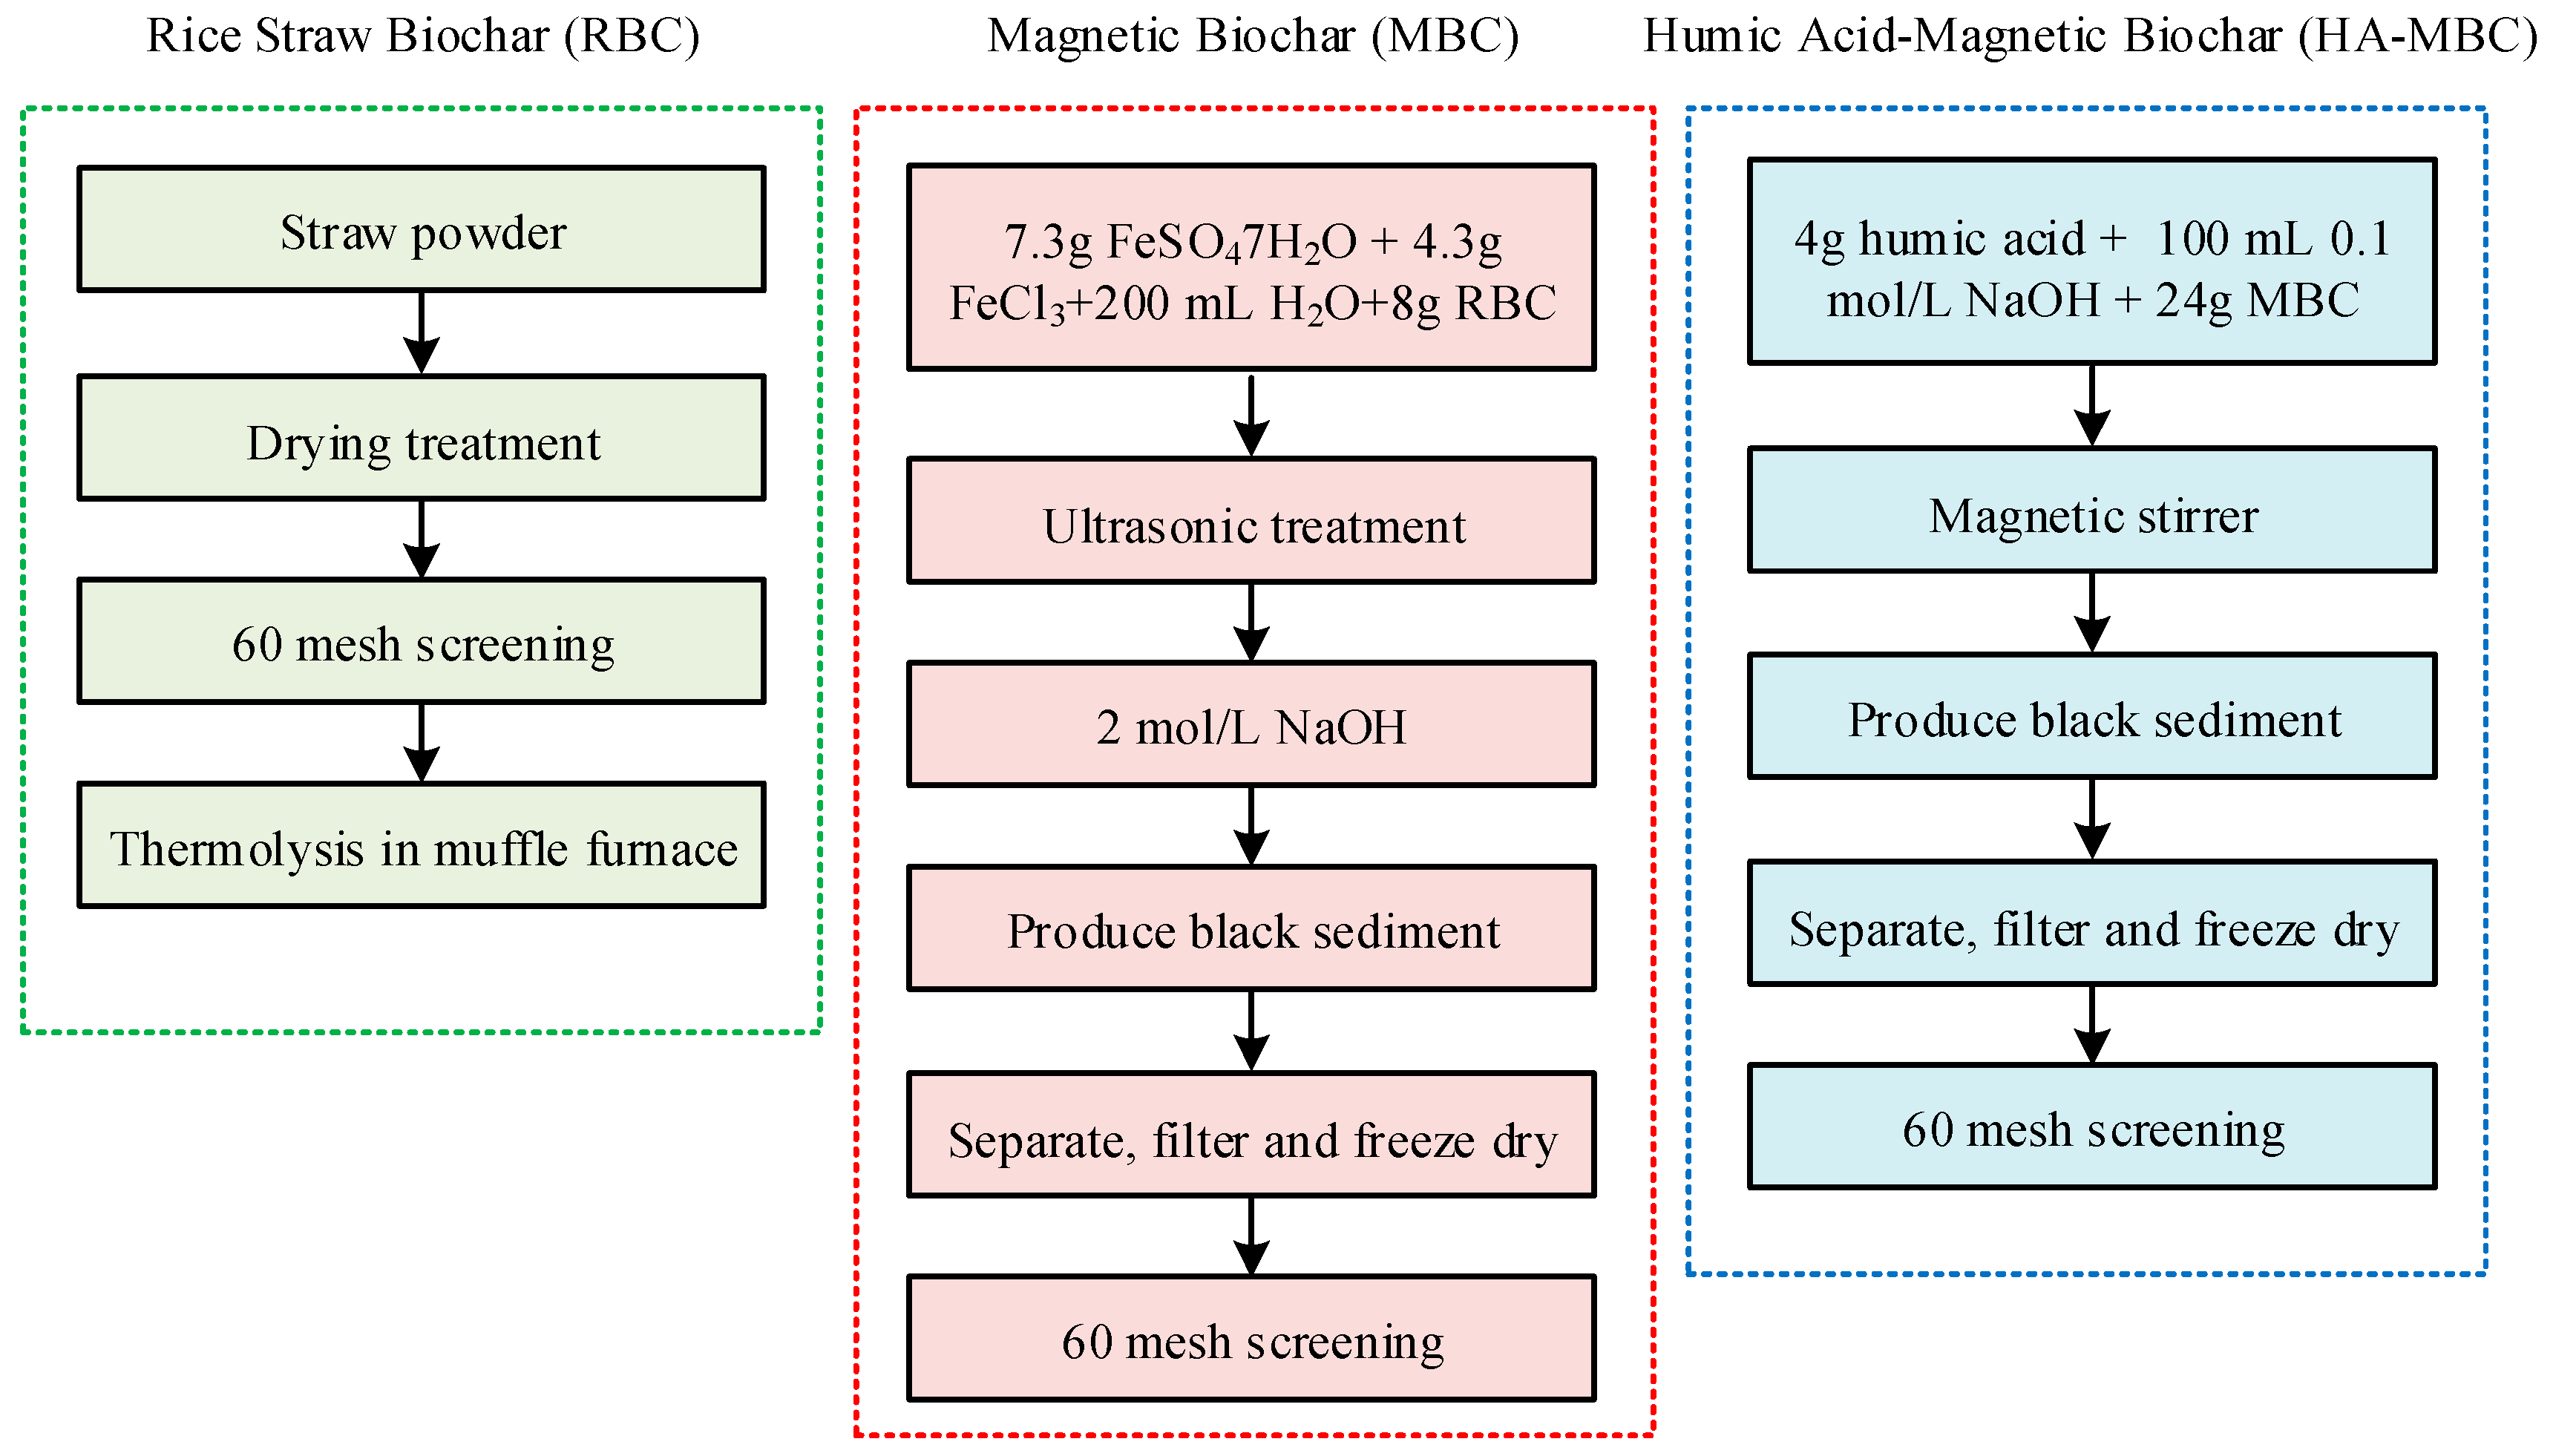
2.1.3. Preparation of Biochar

According to the previous studies of biochar preparation, the preparation of biochar needs to be performed in a dry environment and should be heated in a vacuum environment [19,20]. Rice straw biochar (RBC) was prepared from rice straw. First, the rice straw was crushed into a powder by a pulverizer, and the crushed rice straw powder was placed in an oven for drying treatment. The treatment time was 24 h, and the drying temperature was 105 °C. After drying, a 60-mesh sieve was used to screen the straw powder. A certain amount of straw powder was put into the quartz boat, and then into the muffle furnace. After the vacuum treatment three times, nitrogen was continuously injected into the muffle furnace through the nitrogen generator to empty the air in the pipe. Then, the pyrolysis was carried out at a heating rate of 10 °C/min. The pyrolysis temperature was set at 500 °C, and the maximum temperature was maintained for 2 h. After the preparation, the straw biochar was placed in a drying dish for standby.
Magnetic biochar (MBC) was prepared by the magnetic modification of straw biochar. Amounts of 4.3 g of ferric chloride and 7.3 g of ferrous sulfate heptahydrate were placed in 200 mL of water and fully stirred to completely dissolve the solid in the solution. An amount of 8 g of straw biochar was added to the solution and fully stirred before conducting ultrasonic treatment for 15 min. Sodium hydroxide of 2 mol/L was slowly dropped into the solution at room temperature, and its pH value was adjusted to 10–11. It was stirred vigorously until black precipitates appeared in the beaker. After mixing, the beaker was left to stand for 30 min. The solution was filtered to separate the solution and black sediment. The sediment was washed repeatedly with deionized water until the filtrate turned clear and the pH was neutral. A vacuum freeze dryer was used to dry the filtered sediment, and the freeze drying time was 24 h. The sediment was removed and ground and sifted with a 60-mesh sieve. The prepared magnetic biochar was put into a sealed bag and then put in a drying dish for standby [21,22].
Humic acid was introduced into the magnetic biochar to prepare humic acid–magnetic biochar (HA-MBC). An amount of 100 mL of 0.1 mol/L sodium hydroxide solution was added to 4 g of humic acid and fully stirred until the humic acid was completely dissolved in the solution. Hydrochloric acid of 1 mol/L was added to the solution and the pH of the solution was adjusted to neutral. An amount of 24 g of magnetic biochar was added to the solution and stirred with a magnetic stirrer. The stirring time was 48 h, and the speed of the stirrer was 180 rpm. After mixing, the solution stood for 24 h, and the solution precipitate was washed repeatedly with deionized water until the filtrate turned clear and the pH was neutral. A vacuum freeze dryer was used to freeze dry the filtered sediment, and the drying time was 24 h. The dried sediment was ground and sifted with a 60-mesh sieve to obtain the prepared humic acid–magnetic biochar and put into a sealed bag in a drying dish for standby. The preparation process of three kinds of biochar is shown in Figure 1.

2.1.4. Performance and Characterization Test

For pH determination, the prepared biochar was mixed with deionized water, and the mixed solid–liquid ratio was 1:20 (w/w). The pH value was measured with a pH meter. The yield of biochar obtained from pyrolysis was calculated; that is, the ratio of the quality of biochar obtained to the quality of raw materials. For ash determination, we first took 1 g of biochar and put it into a crucible. Then, we quickly put it into a muffle furnace and heated it to 800 °C; the heating rate was 10 °C/min. The maximum temperature was maintained for 2 h to keep it at room temperature and then taken out for weighing. The biochar ash is the ratio of the difference between the quality of the crucible before and after incineration and the quality of the biochar. The element analysis was carried out by using the element analyzer of Elemental Company in Germany to obtain the C, H, S, and O elements of biochar. The biochar’s pore volume and specific surface area were tested by Quadrascorb Company’s automatic specific surface area and porosity analyzer in the United States. The infrared spectrogram was measured by the infrared spectrometer of Thermo Company in the United States, and the wave number scanning range was 400–4000 cm−1.

2.2. Experimental Design of the Influence of Modified Biochar on Saline–Alkali Soil Leaching and Remediation

2.2.1. Experimental Instruments

The material preparation instruments were as follows: (1) High-speed freezing centrifuge (Hunan Xiangli Scientific Instrument, Hunan, China), equipment model CenLeel6R, which was used to separate liquid and solid mixtures. (2) Vacuum freeze dryer (Shanghai Yuming Biotechnology, Shanghai, China), equipment model FD-1A-50, which was used to freeze dry the prepared sediment.
The performance test instruments were as follows: (1) Cation concentration analysis: inductively coupled plasma spectrometer (LEEMAN LABS, Hudson, NY, USA), equipment model ICP-OES Prodigy-Plus, which was used to determine the cation concentration of leachate. (2) Parameter analysis of material conductivity and other parameters: portable multi-parameter analyzer (Shanghai Instrument and Electronics Science Instrument, Shanghai, China), equipment model DZB-718, which was used to measure the parameters of conductivity and pH value. (3) Determination of total organic carbon: total organic carbon analyzer (German Jena Analytical Instrument, Jena, Germany), equipment model Multi N/C3100, which was used to test the total organic carbon content. (4) Material structure and interaction analysis: ultraviolet spectrophotometer (Beijing General Analysis, Beijing, China), equipment model T6 New Century, and the absorption spectrum of substances were used to analyze the content of substances.
CRM was used for ICP-OES data validation. First of all, in the calibration of ICP-OES instruments, the literature [23] proposes evaluating the accuracy of all reference materials and unknown materials by determining the coefficient of variation. By using the percentage deviation, the relative difference between materials can be measured. Therefore, based on the experimental results of the literature [23], the study calibrated the ICP-OES adopted in the article. The results showed that the relative error of the instrument was only 0.003%; that is, ICP-OES was feasible [23]. In order to ensure the quality of ICP-OES in use, the OSP procedure proposed in the literature [24] was used to determine the cation ratio, then the ICP-OES capability was improved. Potassium chloride (Pharmaceutical Secondary Standard; Certified Reference Material; Product No.: PHR1329) and sodium chloride (Pharmaceutical Secondary Standard; Certified Reference Material; Product No.: PHR1321) were selected for validation. The results showed that ICP-OES had high accuracy [24]. The determination of ICP-OES referred to thorium, lanthanide, and uranium in the literature [25]. To verify the accuracy of SY-2, SY-3, and GSP-2, ICP copper standards were selected in the study [25] (TraceCERT®, 1 g/L Cu in nitric acid (nominal concentration, Merck, Shanghai, China); Item number: 68921) along with ICP multi-element mixed label 5 (TraceCERT®, in 10% nitric acid; Item number: 54704, Merck, Shanghai, China) [25].

2.2.2. Experimental Materials and Reagents

The soil used in the experiment was the coastal saline soil from a certain place where the main crop is rice and the source of irrigation water is the estuary of the Yangtze River. Soil was collected, placed in a sealed bag, and put in a dry place for standby after treatment. The collected soil was screened by 2 mm and used as soil for the soil column leaching experiment and pot experiment. Table 1 shows the physical properties as well as chemical properties of the soil.
The main reagents for the experiment included cobalt hexachloride, ferrous sulfate, silver sulfate, ferrous amine sulfate hexahydrate, aminosulfuric acid, sodium hydroxide, sodium bicarbonate, potassium chloride, potassium antimony tartrate, and mercury sulfate from Ron Reagents. The purity of the experimental reagents was analytical.

2.2.3. Design of Leaching Experiment

The saline–alkali soil column was filled by wet column loading to fully mix the biochar and saline–alkali soil. A 100-mesh screen was placed at the bottom of the plexiglass column which was 8 cm in diameter and 30 cm in height. White Vaseline inside the glass column was applied to prevent preferential flow. A small amount of ultra-pure water was added to the plexiglass column, and the bottom of the glass was filled with 35-mesh quartz sand with a height of 1 cm to avoid soil leaching and loss. A 100-mesh screen was placed on the upper layer of quartz sand. The saline–alkali soil was mixed with more than 10 mesh of quartz sand and slowly put into the glass column, with a sand mixing ratio of 20%. The leaching rate was accelerated through sand mixing treatment to shorten the test time. The saline–alkali soil mixture was filled into the plexiglass column in increments of about 2 cm. After each filling, the soil compactor was used to vibrate slightly and mix and compact the saline–alkali-soil-filled column with a glass rod. The saline–alkali soil was always submerged in water to try to intercept air and reduce soil stratification. After filling the saline–alkali soil mixture, a 100-mesh screen was placed on the top of the plexiglass column and filled with 1 cm of quartz sand larger than 10 mesh. Before the leaching test, 5 cm water was injected head-first.
After filling the saline–alkali soil column, the sample unit was divided by 30 mL of leachate. The water head was supplemented after each sample collection so that the water head of the soil column reached 5 cm. An amount of 810 mL distilled water was used to leach the soil column in each experiment until the leaching solution flowed out from the bottom. The study adopted a comparative test, including a blank control group, straw biochar group (RBC), magnetic biochar group (MBC), and humic acid–magnetic biochar group (HA-MBC). Comparative experiments were carried out with 1% and 5% biochar input. All experiments were repeated three times to reduce the impact of errors on the experimental results.

2.2.4. Performance Test Design

To obtain the pH value and cation concentration of leachate, the physical properties and chemical properties of leachate were determined by a multi-parameter analyzer and inductively coupled plasma spectrometer. To determine the physical property as well as the chemical properties of the experimental soil, we first took 5 g of dry soil and put it in the beaker, added 25 mL of deionized water, fully mixed it then put it in the beaker, and obtained the soil leachate through filtration.

2.3. Experimental Design of Effects of Saline–Alkali Soil Leaching and Modified Biochar on Crop Growth

2.3.1. Experimental Instruments

The material preparation instruments were as follows: (1) High-speed freezing centrifuge (Hunan Xiangli Scientific Instrument, Hunan, China), equipment model CenLeel6R, which was used to separate liquid and solid mixtures. (2) Vacuum freeze dryer (Shanghai Yuming Biotechnology, Shanghai, China), equipment model FD-1A-50, which was used to freeze dry the prepared sediment. (3) Constant temperature incubator (Shanghai Sop Instrument, Shanghai, China), equipment model LRH-250, which was used to maintain a constant cultivation temperature in the potting experiment of Chinese cabbage.
The performance test instruments were as follows: (1) Cation concentration analysis: inductively coupled plasma spectrometer (LEEMAN LABS, Hudson, NY, USA), equipment model ICP-OES Prodigy-Plus, which was used to determine the cation concentration of leachate. (2) Conductivity measurement: portable conductivity meter (German Jena Analytical Instrument, Jena, Germany), equipment model DZB-718, which was used to measure conductivity.

2.3.2. Experimental Materials and Reagents

The experimental crop was “American fast growing” Chinese cabbage. The main reagents for the experiment included onion ketone, sodium dihydrogen phosphate, disodium hydrogen phosphate, concentrated sulfuric acid, acetone, methanol, and Coomassie brilliant blue from Sinopharm Group, as well as anhydrous ethanol from Ron Reagents. The purity of all experimental reagents was analytical pure.

2.3.3. Pot experiment Design

The leached experimental soil was treated by air drying. At the same time, the soil was screened with a 10-mesh sieve. An amount of 500 g of the treated experimental soil was used as the leaching group for the pot experiment. The biochar and the original saline–alkali soil were mixed according to the addition ratio of 1% and 5%, and 500 g of the mixture was used as the original group for the pot experiment. A flowerpot with a diameter of 10 cm and a height of 15 cm was selected for the experiment. A small hole with an equal depth distance of 1 cm was dug in the flowerpot, and 10 Chinese cabbage seeds were selected with similar shapes for equidistant seeding. During the experiment, the potted Chinese cabbage was placed in a constant temperature incubator, and the temperature of the incubator was kept at 25 °C. The full spectrum light supplement lamp was used to simulate sunlight, and 20 mL of tap water was used for irrigation every day. The pot experiment period was one month, and three parallel experiments were conducted in each group.

2.3.4. Index Test Design

The chlorophyll content of the leaves of Chinese cabbage was measured by the acetone extraction–spectrophotometer method. This research used the Coomassie brilliant blue method to measure the Chinese cabbage’s soluble protein content. The soluble sugar content of Chinese cabbage was measured by allione colorimetry [26,27].

3. Results and Analysis of the Effect of Modified Biochar on the Remediation of Saline–Alkali Soil and Crop Growth

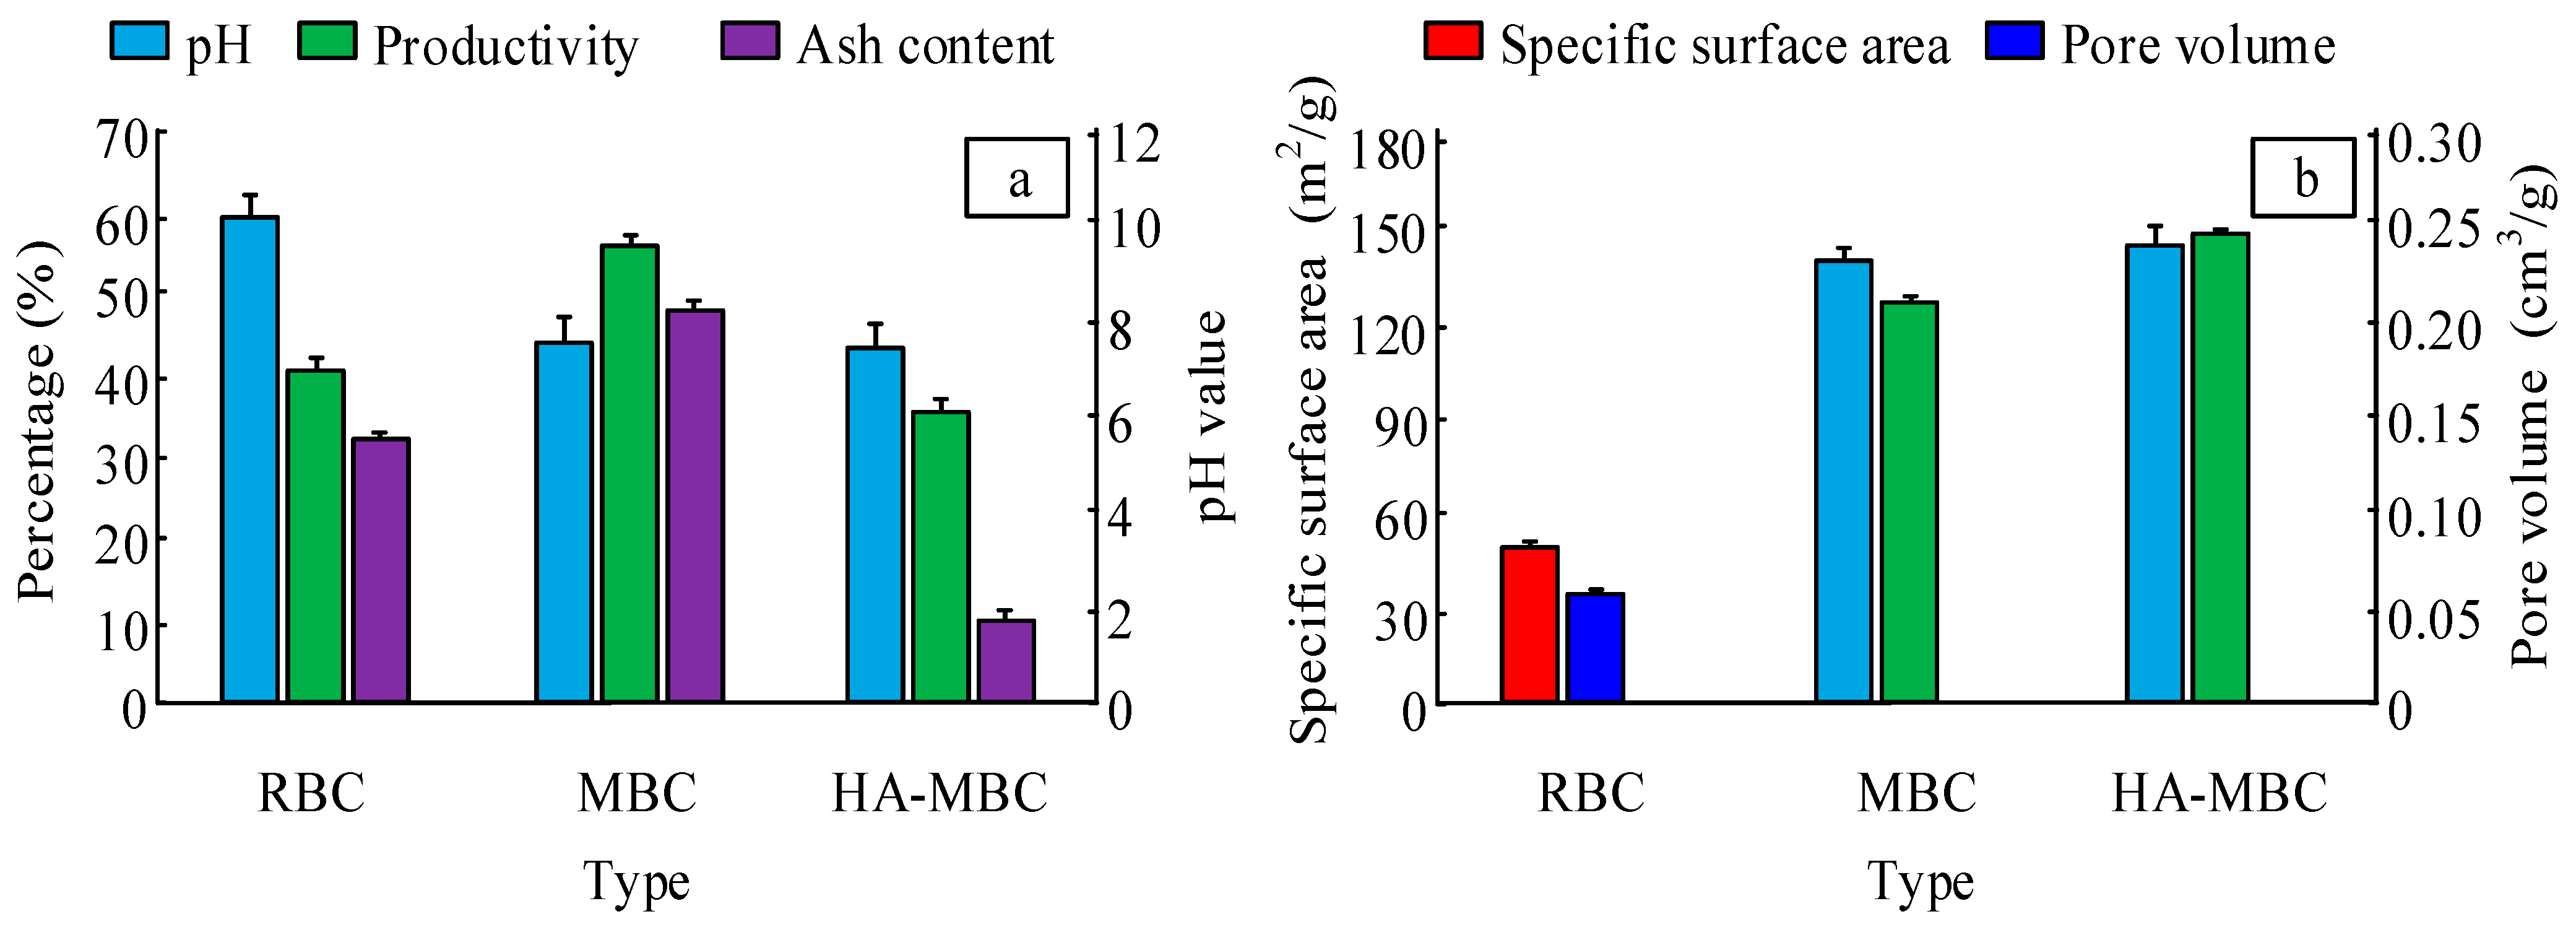
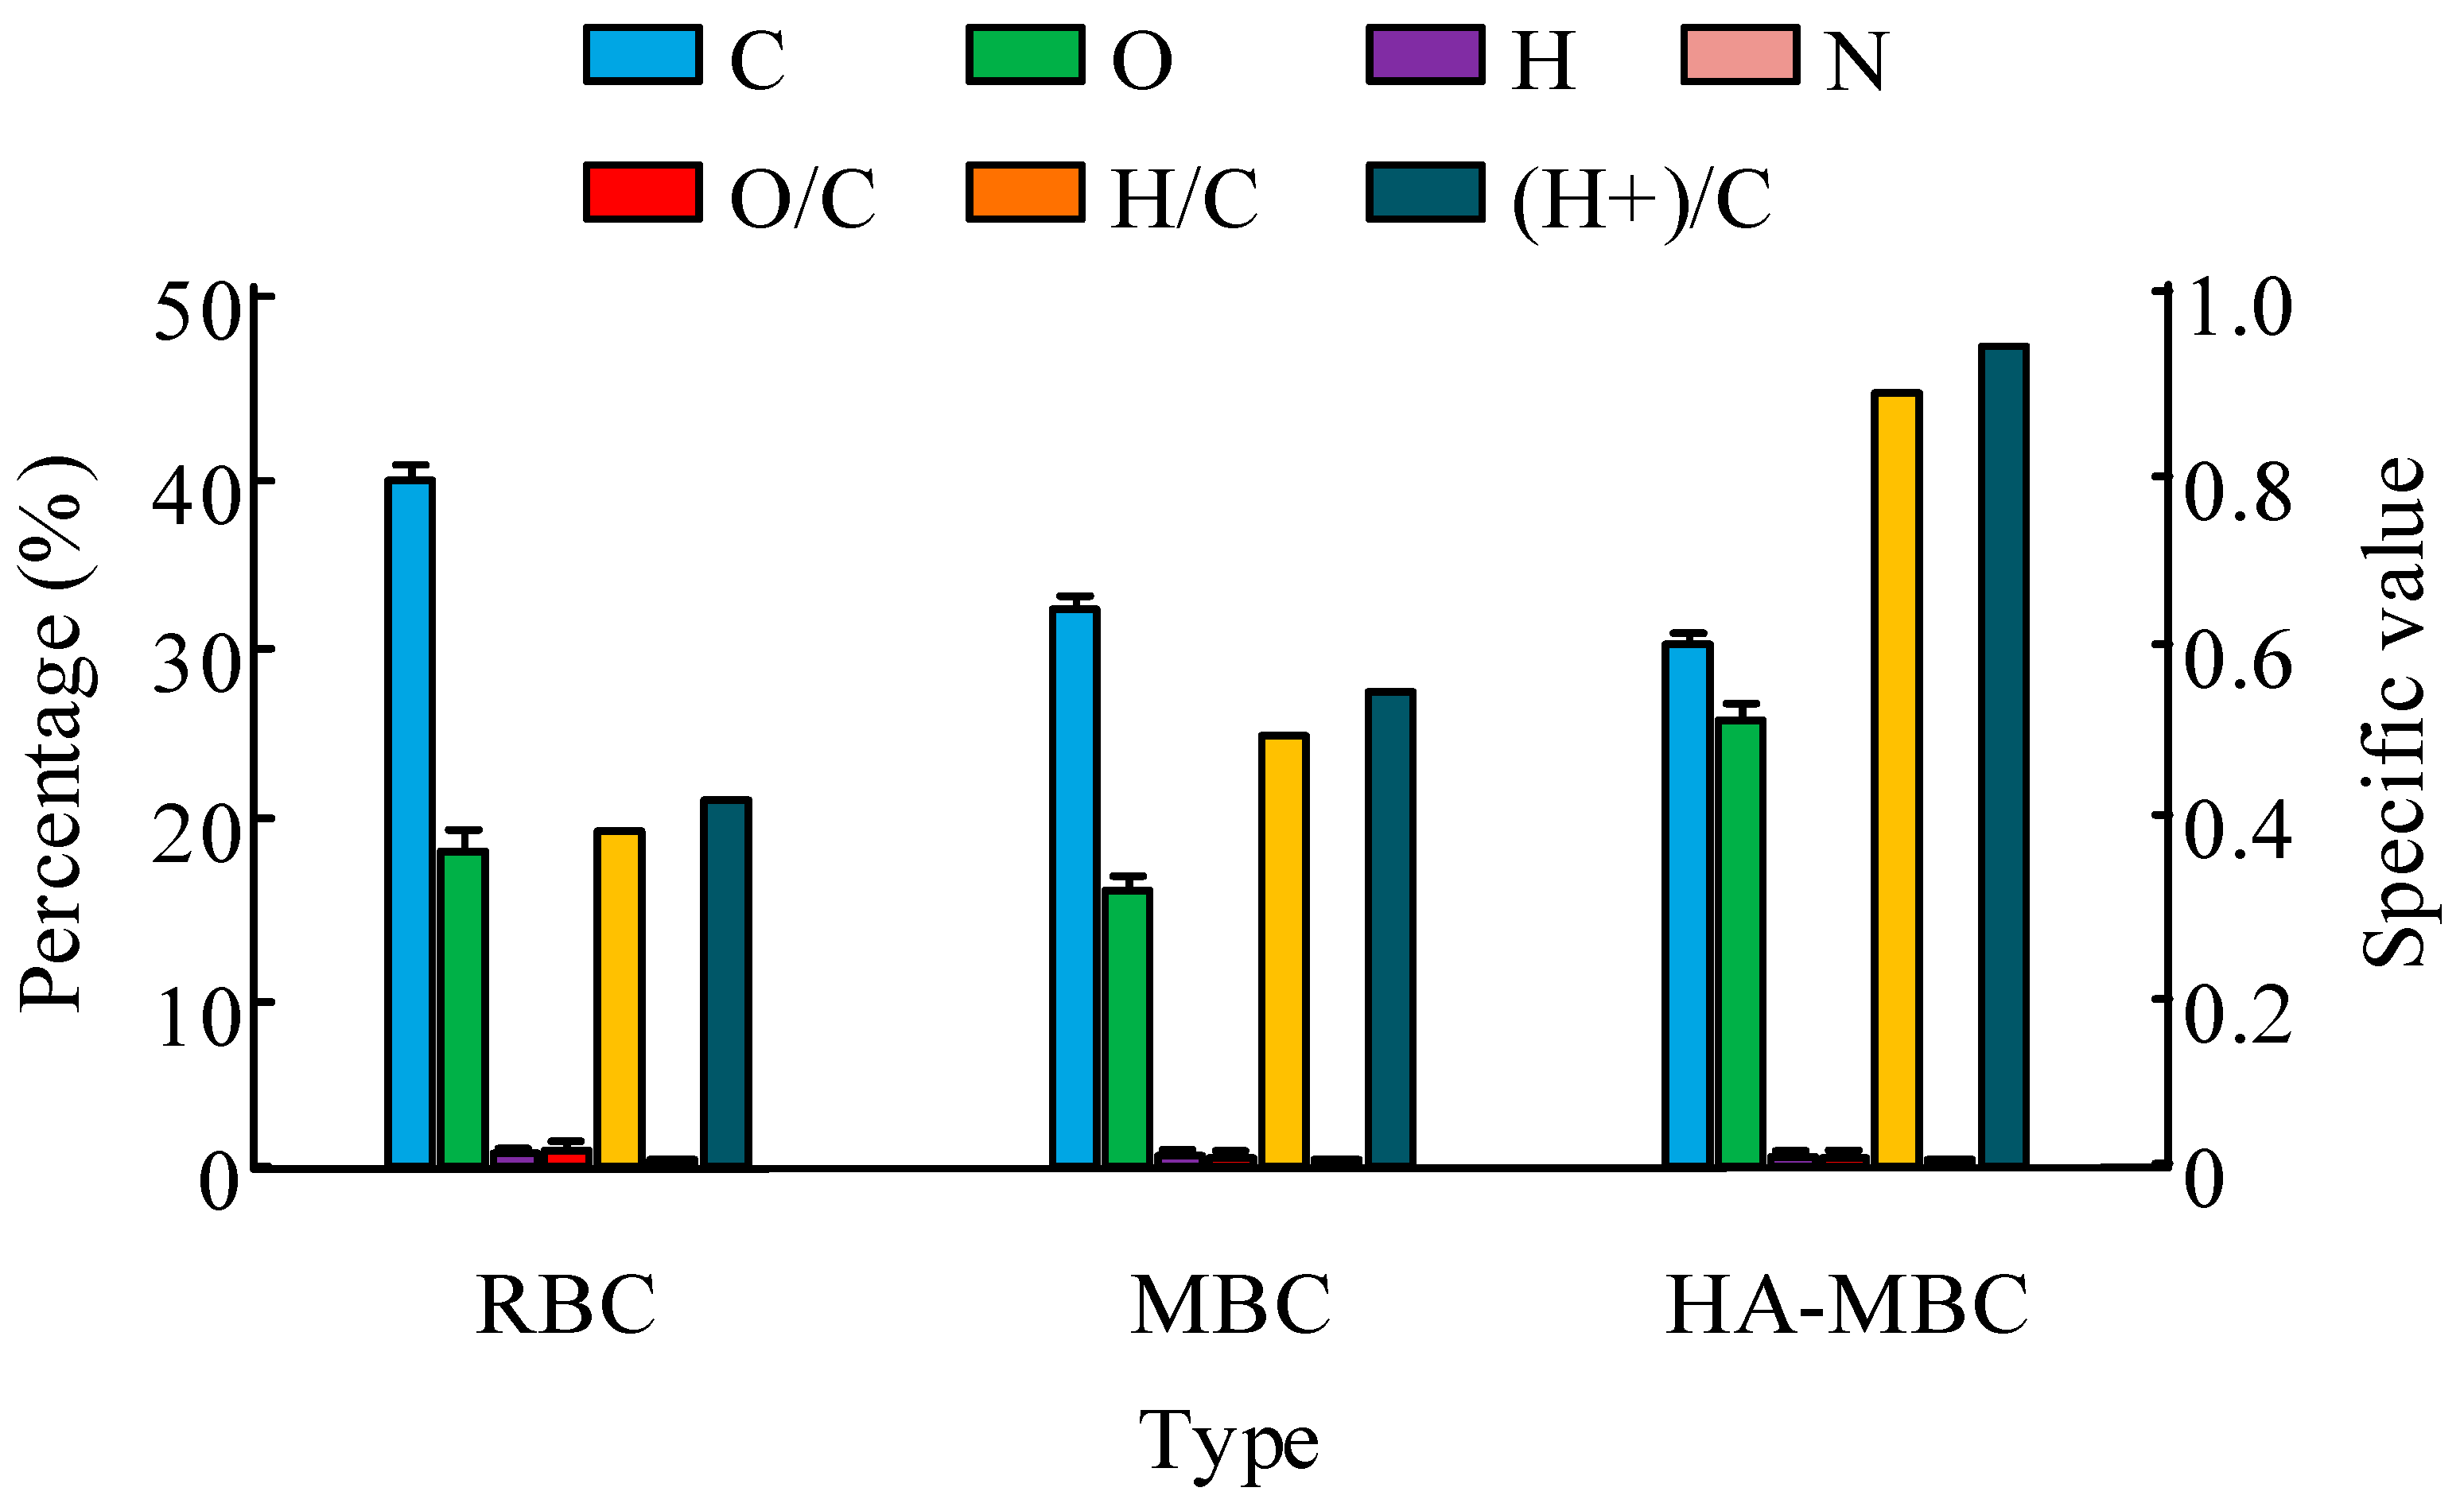
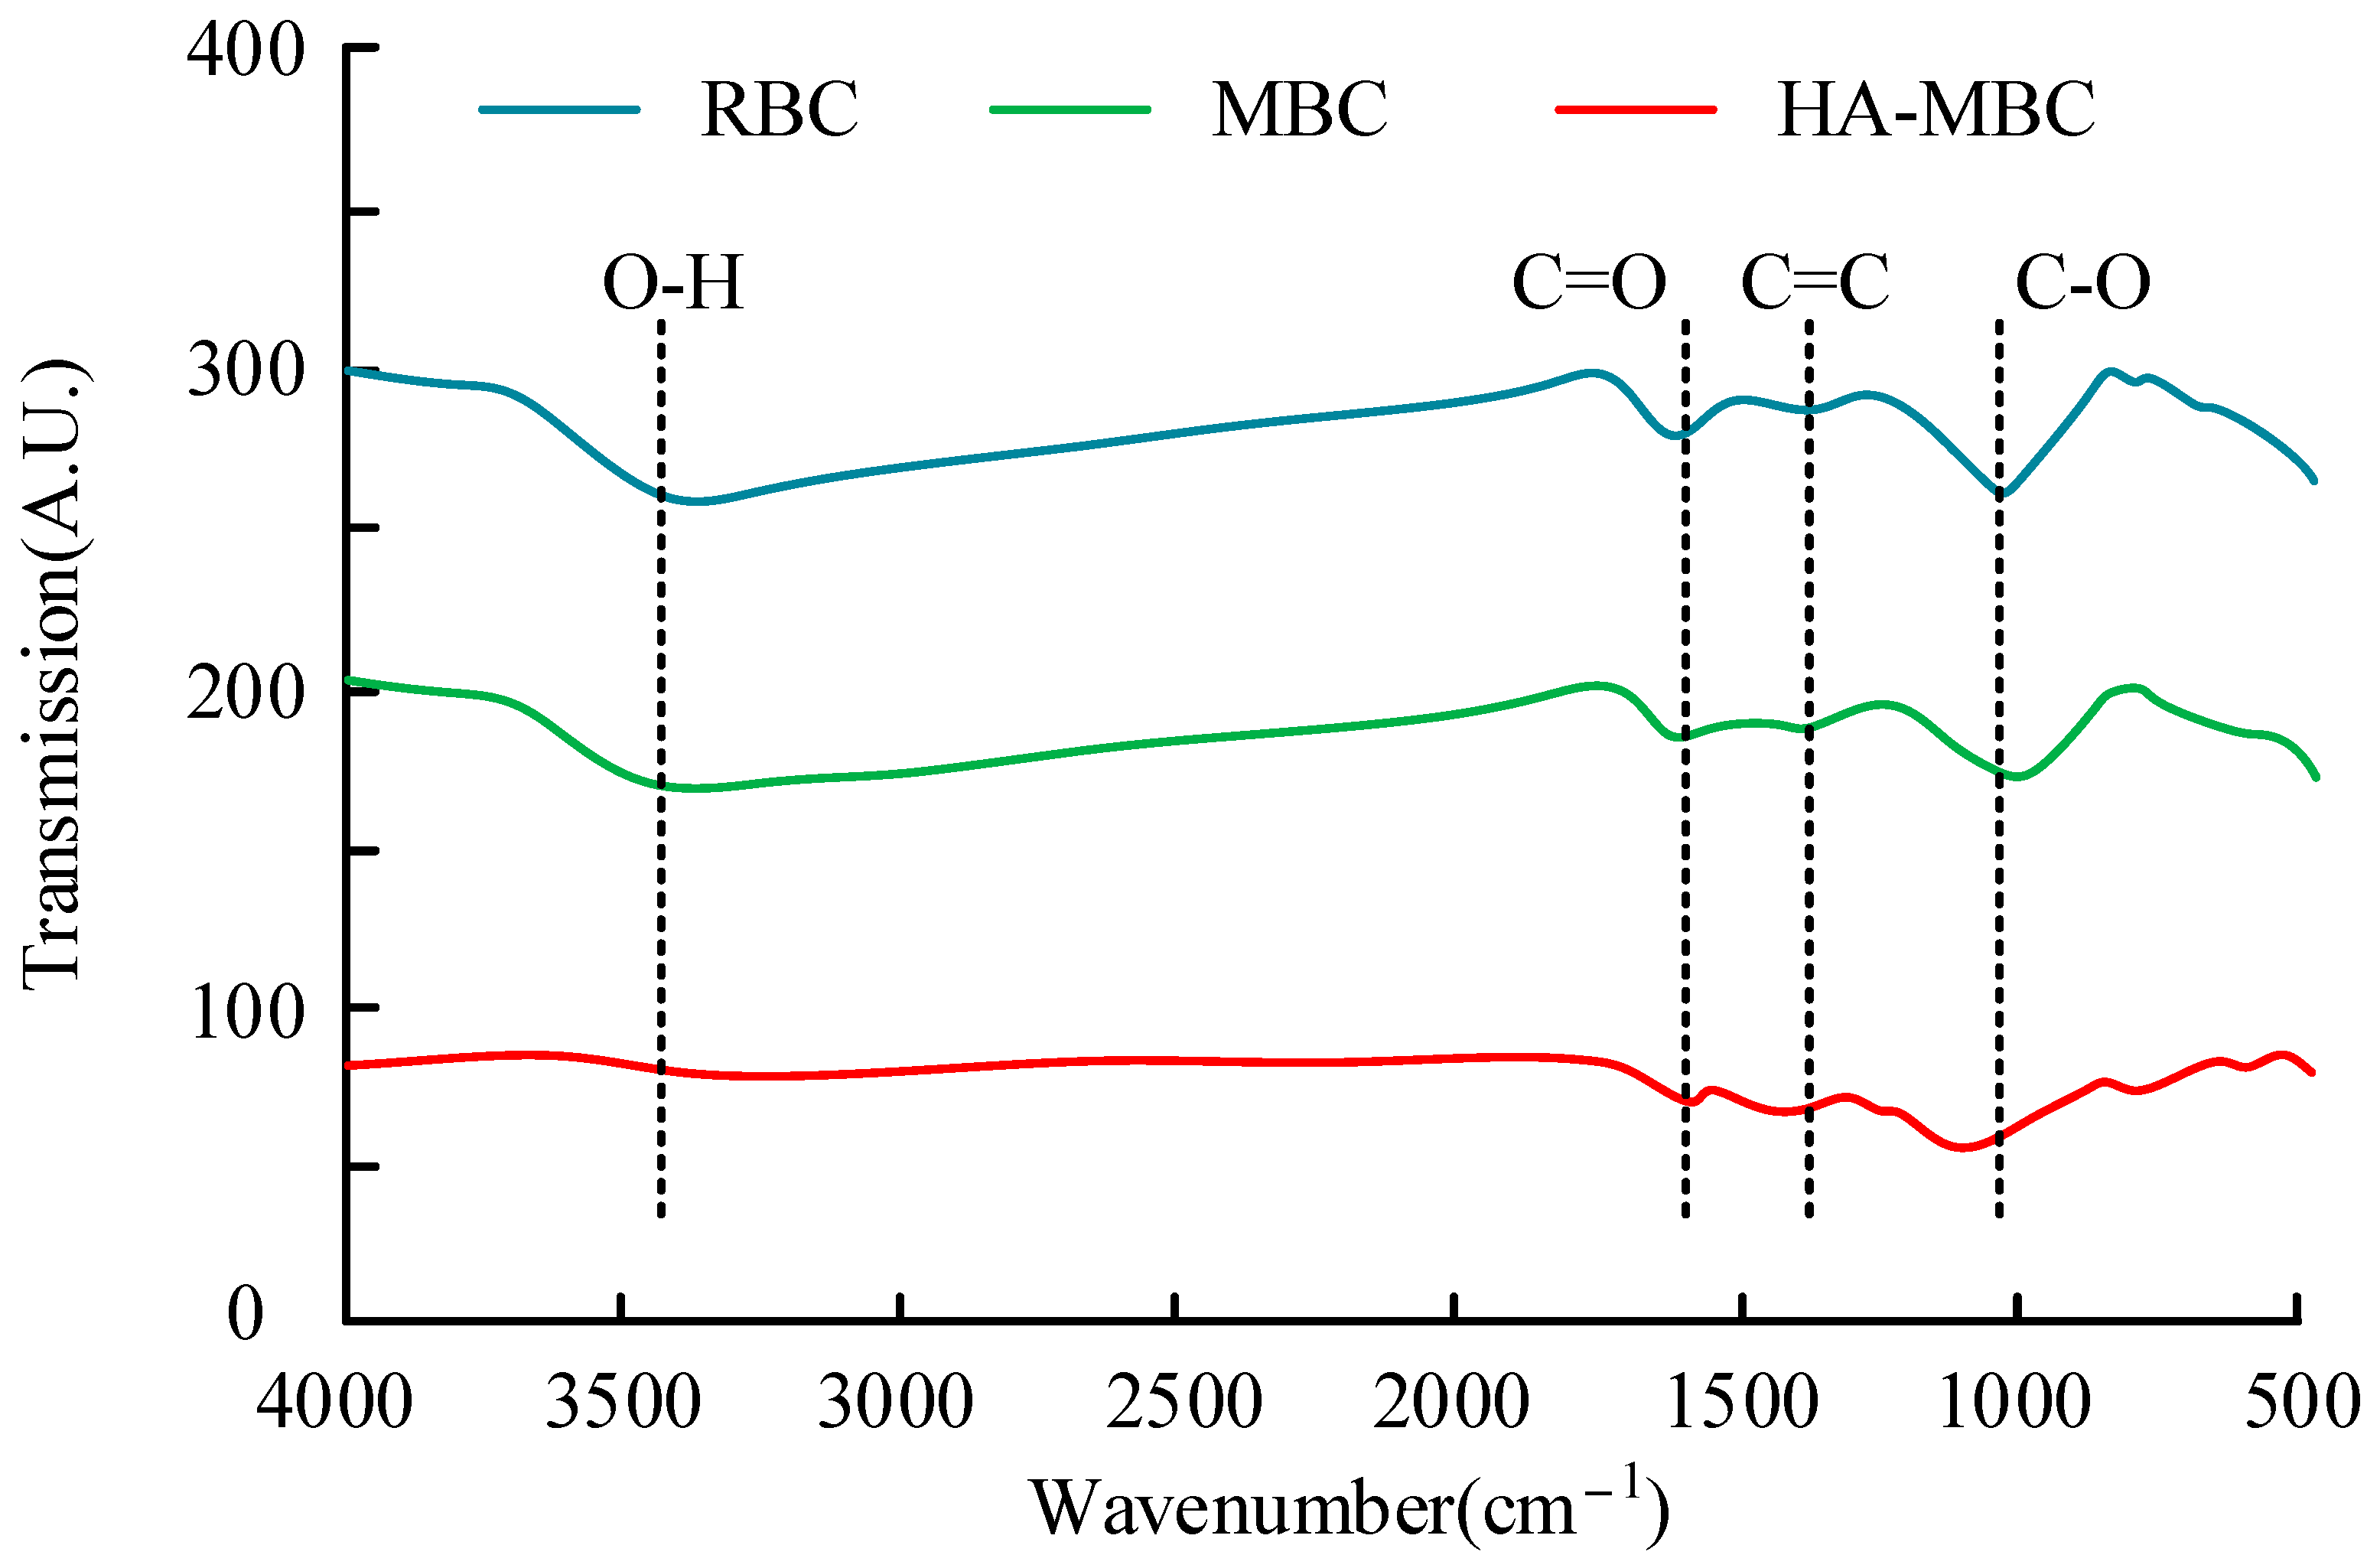
3.1. Characterization Results and Analysis of Modified Biochar

The study used the statistical software SPSS 23.0 to carry out statistical analysis on the data and expressed the counting data in the form of mean ± standard deviation. The comparison results of the basic physical and chemical properties of the three kinds of biochar are shown in Table 2 and Figure 2. From the perspective of acidity and alkalinity, the straw biochar is alkaline. During the preparation and pyrolysis of biochar, the inorganic ions in the straw are fused into alkaline, making the prepared biochar alkaline. The magnetic modification process uses deionized water to wash it to neutral, so the magnetic biochar is neutral. The adhesion of humic acid further reduces the alkalinity of humic acid–magnetic biochar. Compared with straw biochar, the specific surface area of magnetic biochar and humic acid–magnetic biochar increased by 166.51% and 178.02%, respectively, which is consistent with previous research results [11,12]. After modified preparation, magnetic particles and humic acid adhered to the surface of the biochar, which significantly increased the specific surface area and pore volume of the biochar.
The elemental analysis results of the three kinds of biochar are shown in Figure 3. The H/C molar ratio of straw biochar is 0.04, the H/C molar ratio of magnetic biochar is 0.05, and the H/C molar ratio of humic acid–magnetic biochar is 0.06. It shows that the aroma of straw biochar is the strongest, while that of humic acid–magnetic biochar is the weakest. Compared with straw biochar and magnetic biochar, humic acid–magnetic biochar has stronger polarity and hydrophilicity, and more oxygen-containing functional groups, which proves that the humic acid was successfully grafted onto the magnetic biochar.
The infrared spectra of three kinds of biochar are shown in Figure 4. The hydroxy vibration peak of humic acid–magnetic biochar is higher, followed by magnetic biochar, and the hydroxy vibration peak of straw biochar is the lowest. During magnetic modification, magnetic biochar introduces hydroxyl groups due to the use of sodium hydroxide, while humic acid–magnetic biochar introduces a large number of hydroxyl groups due to the grafting of humic acid. The C-O and C=O vibration peaks of humic acid–magnetic biochar are the highest. The successful grafting of humic acid makes the humic acid–magnetic biochar have many oxygen-containing functional groups. Humic acid contains a large number of oxygen-containing functional groups. After the humic acid is grafted onto the magnetic biochar, the humic acid–magnetic biochar also contains a large number of oxygen-containing functional groups.

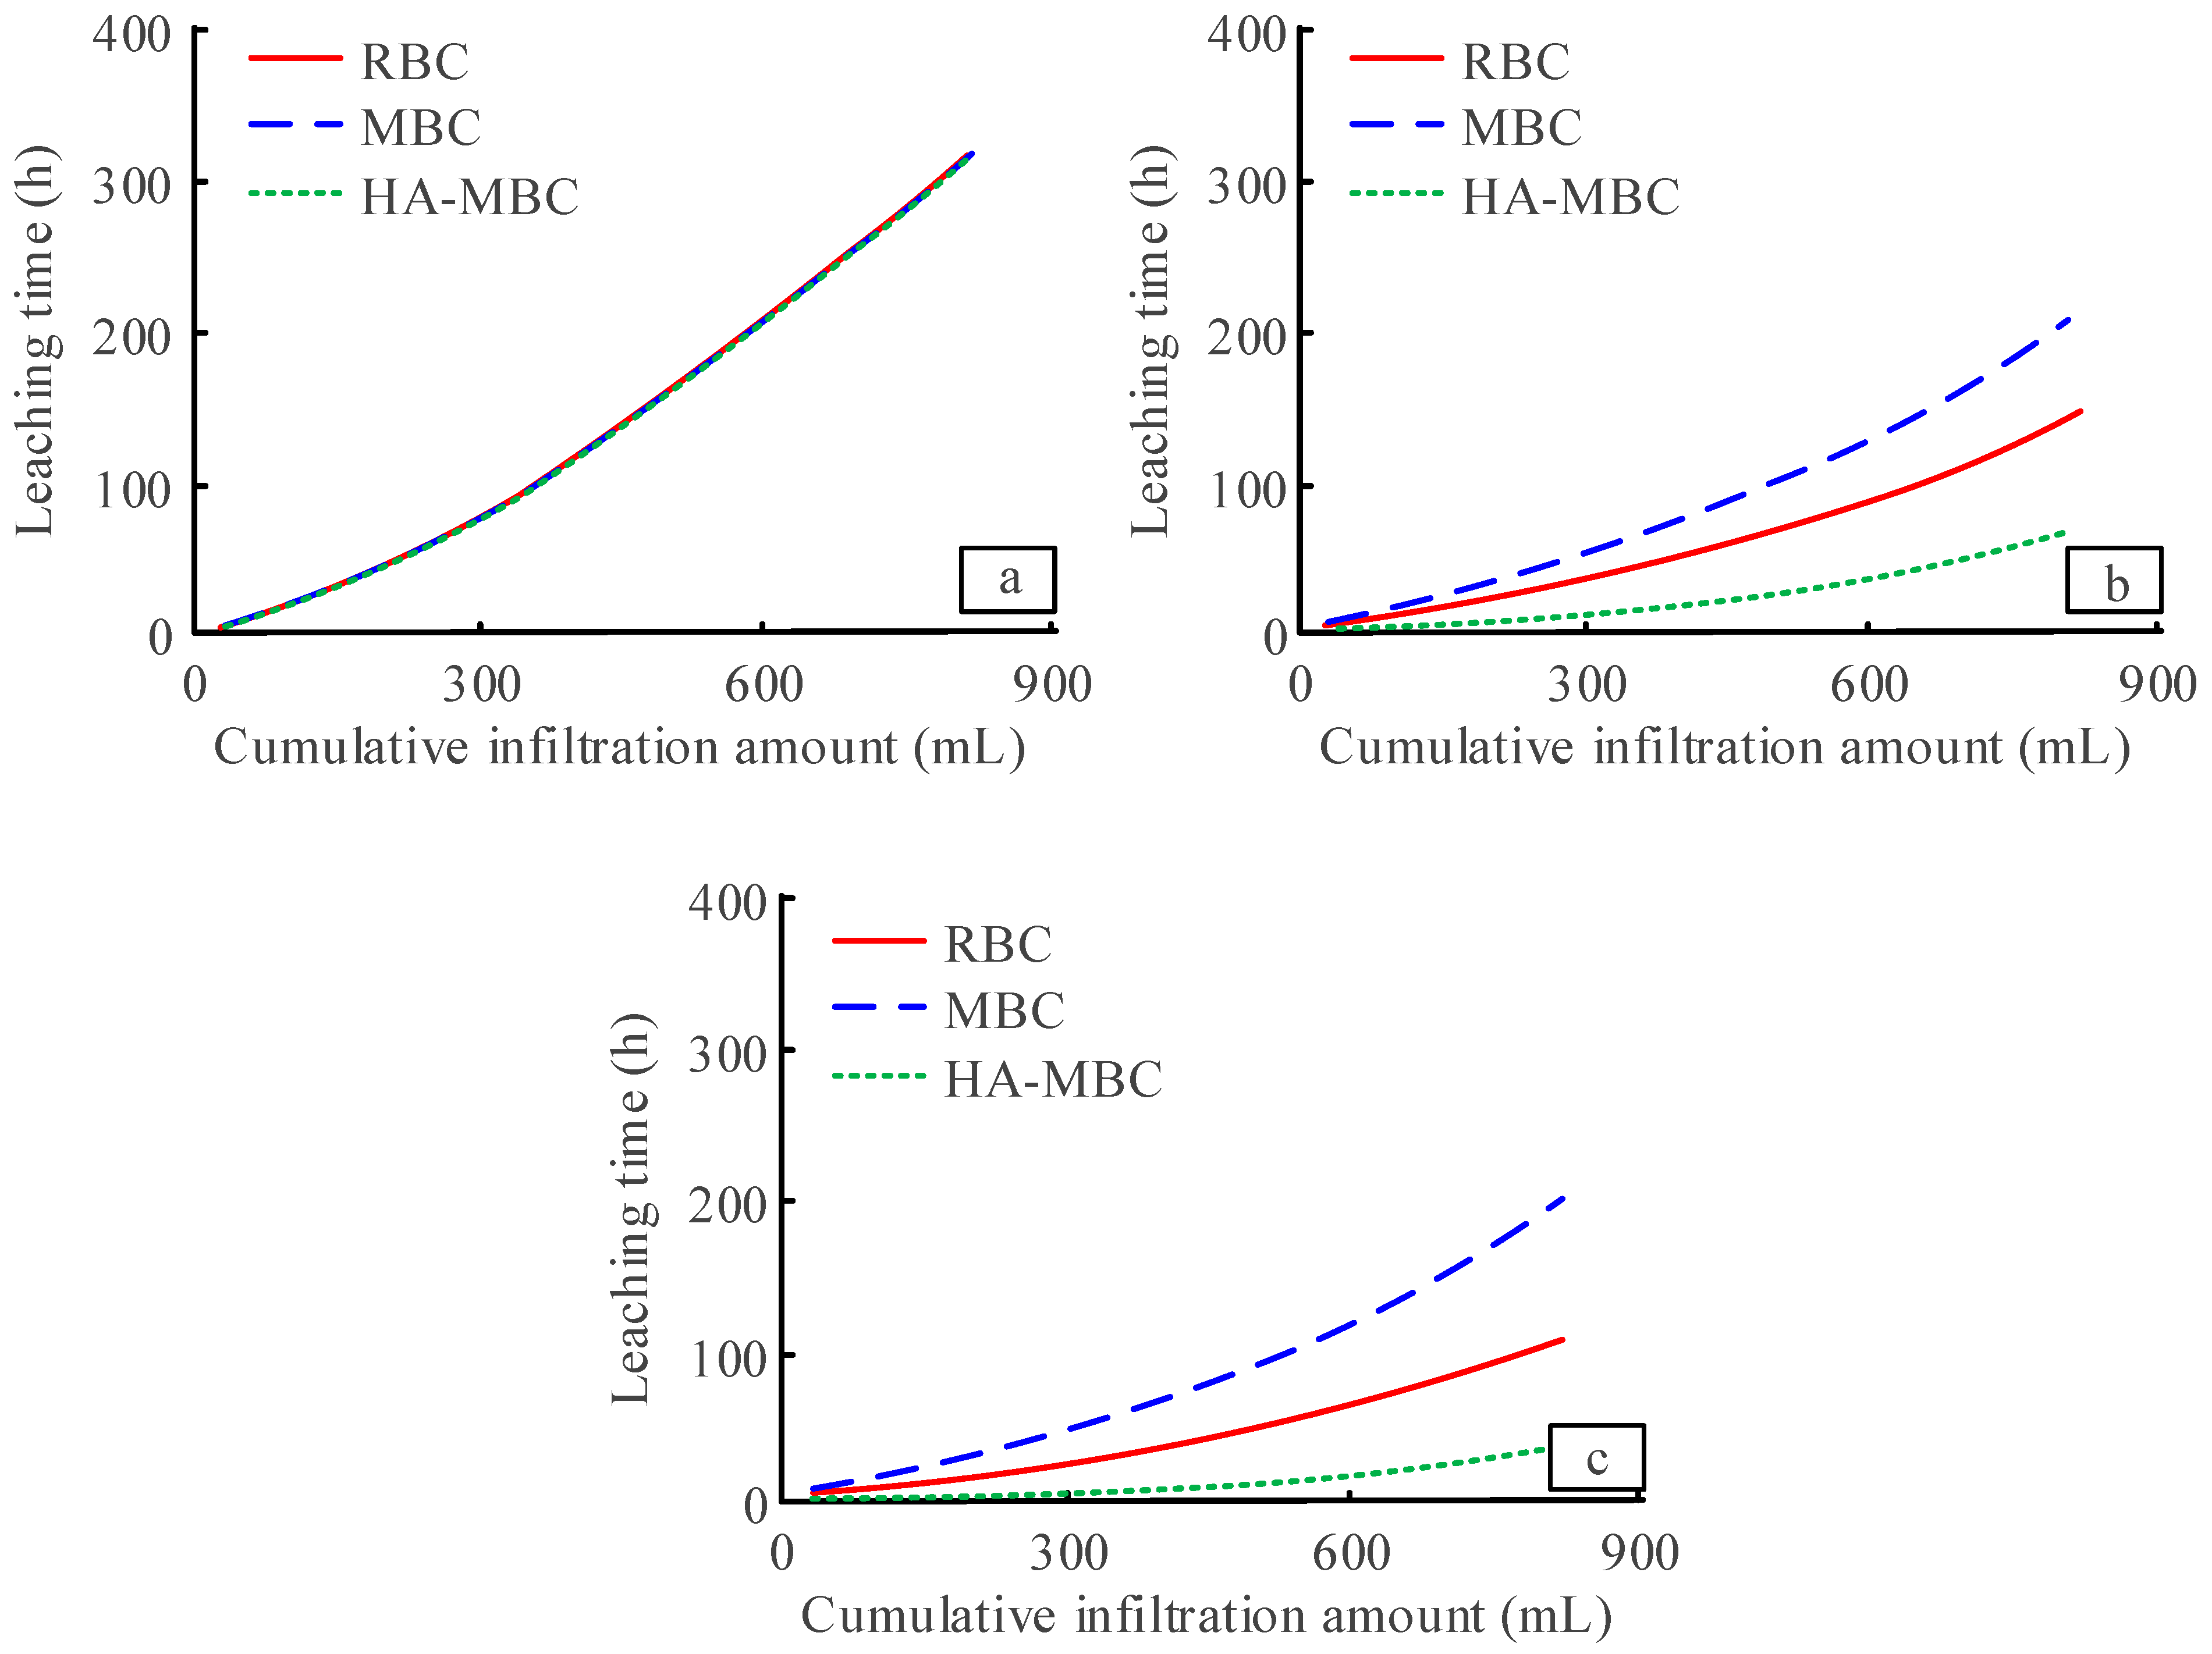
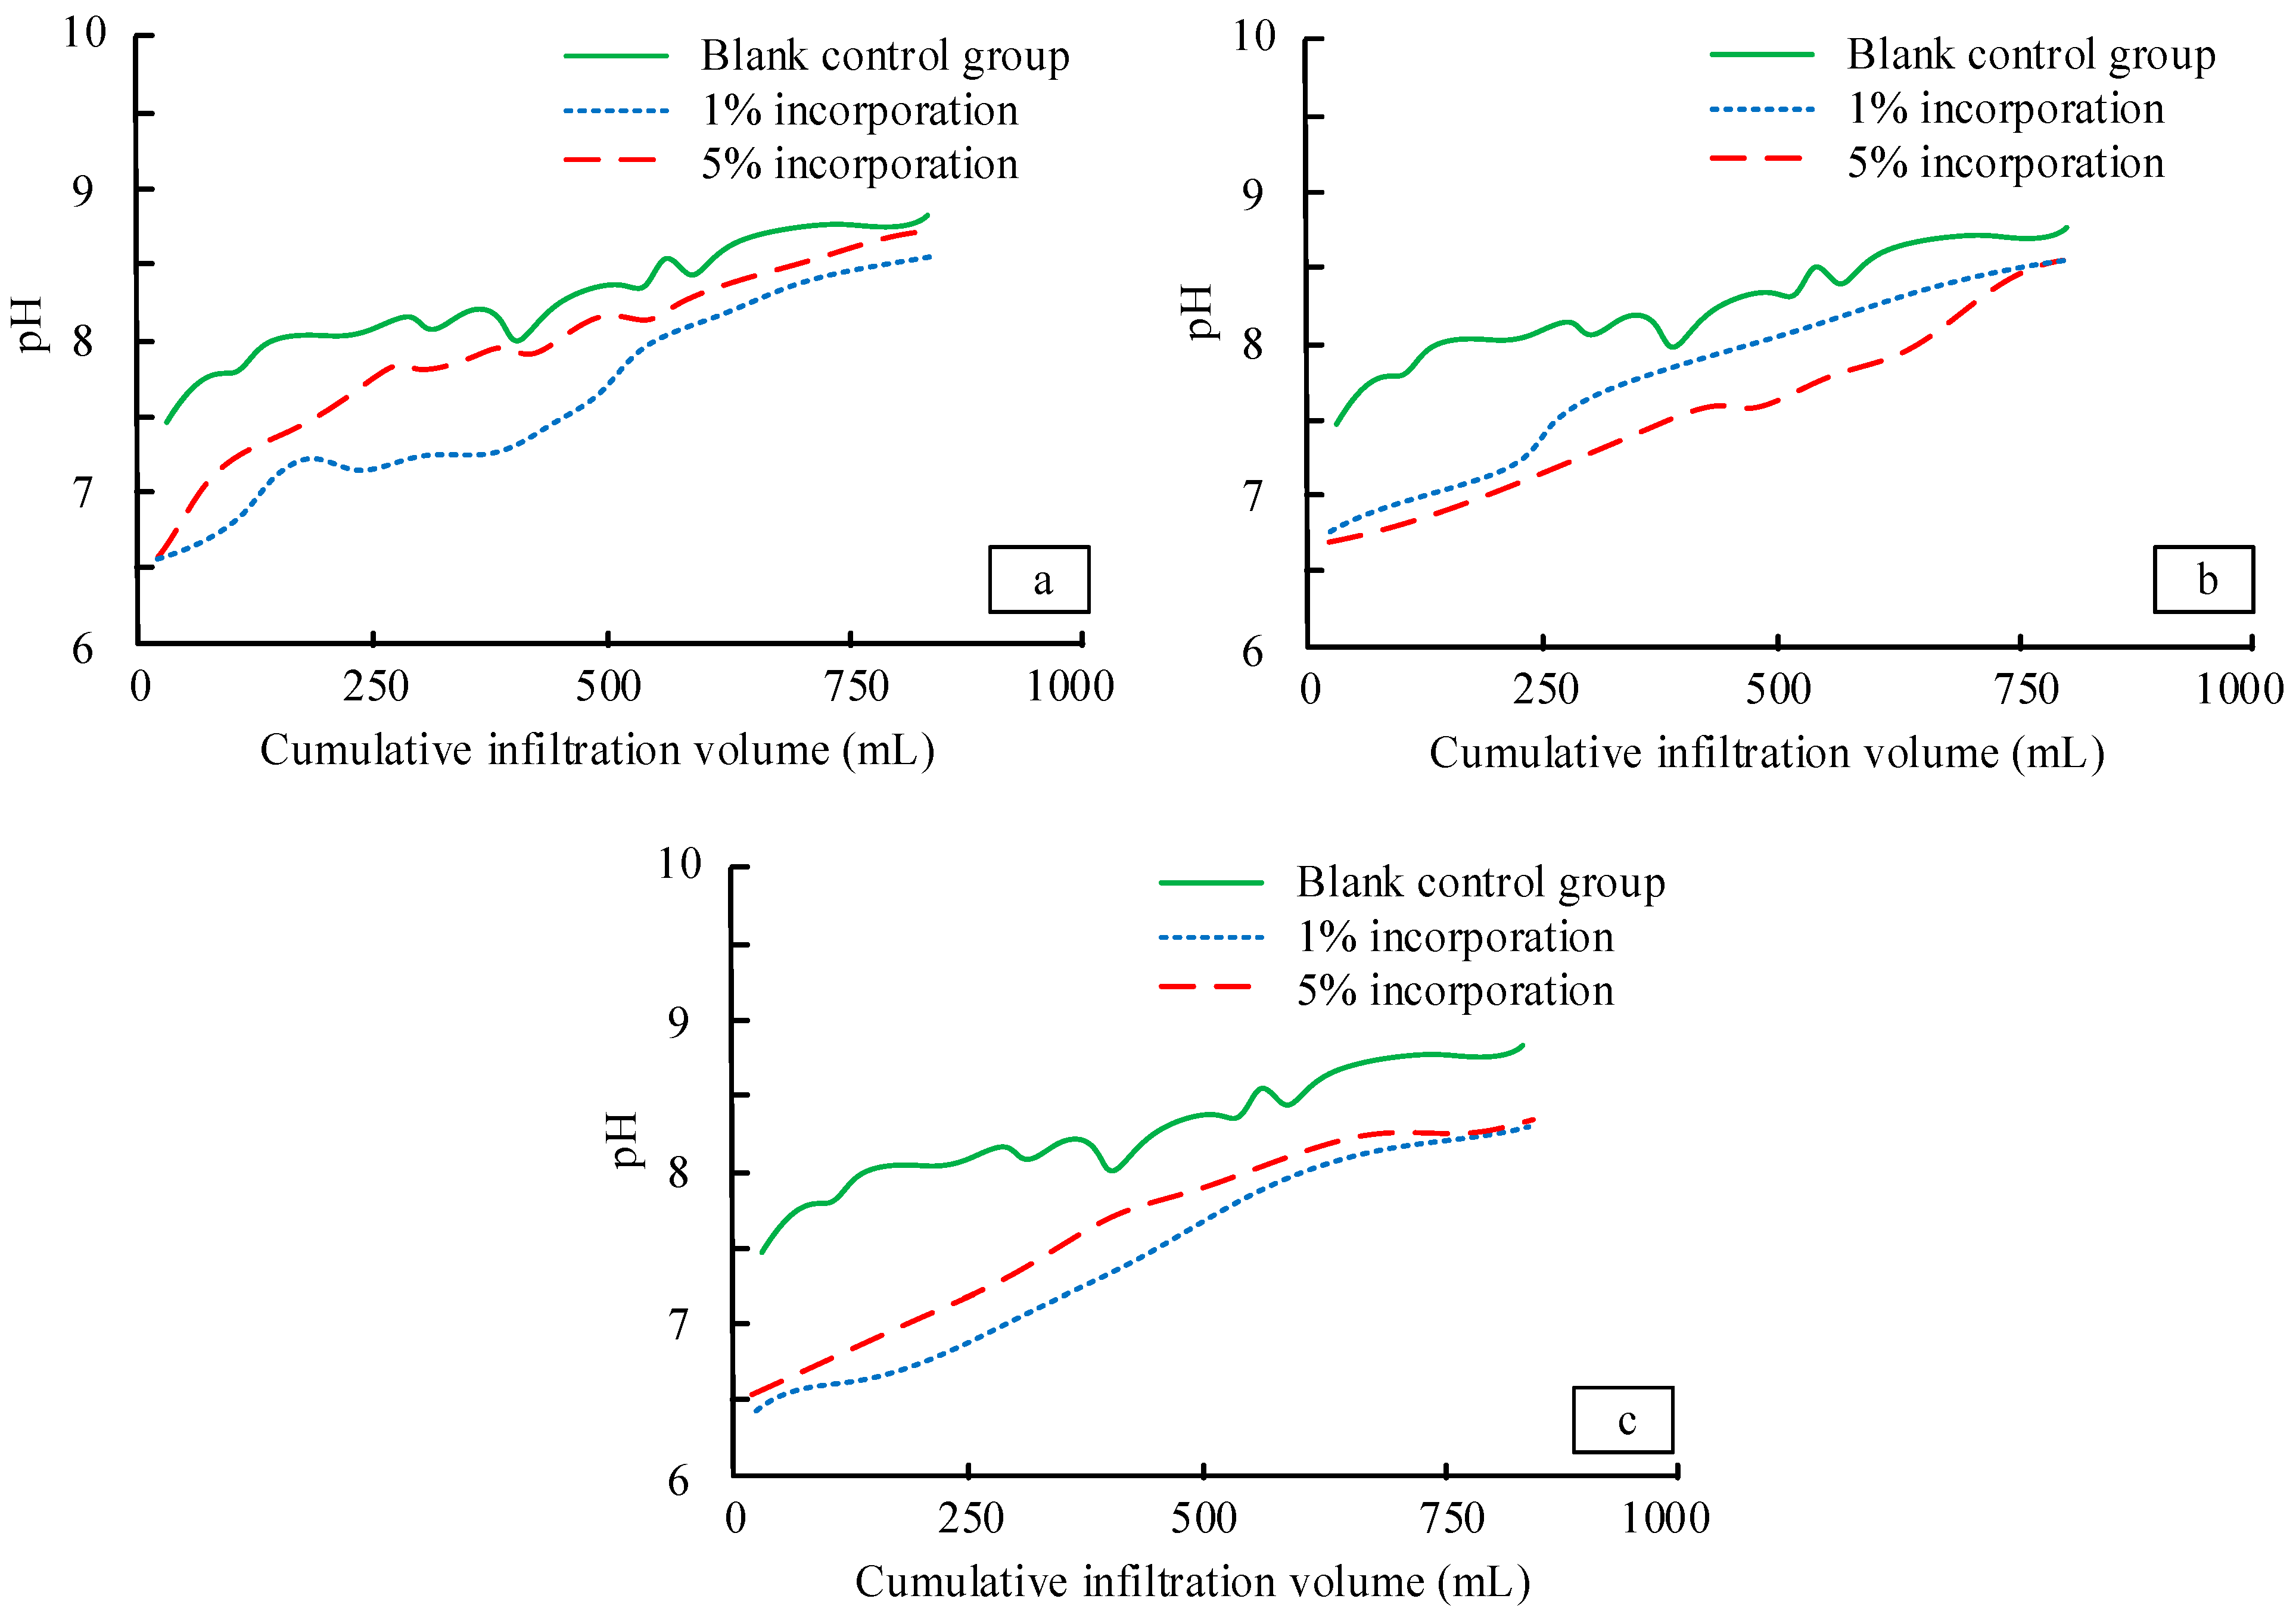
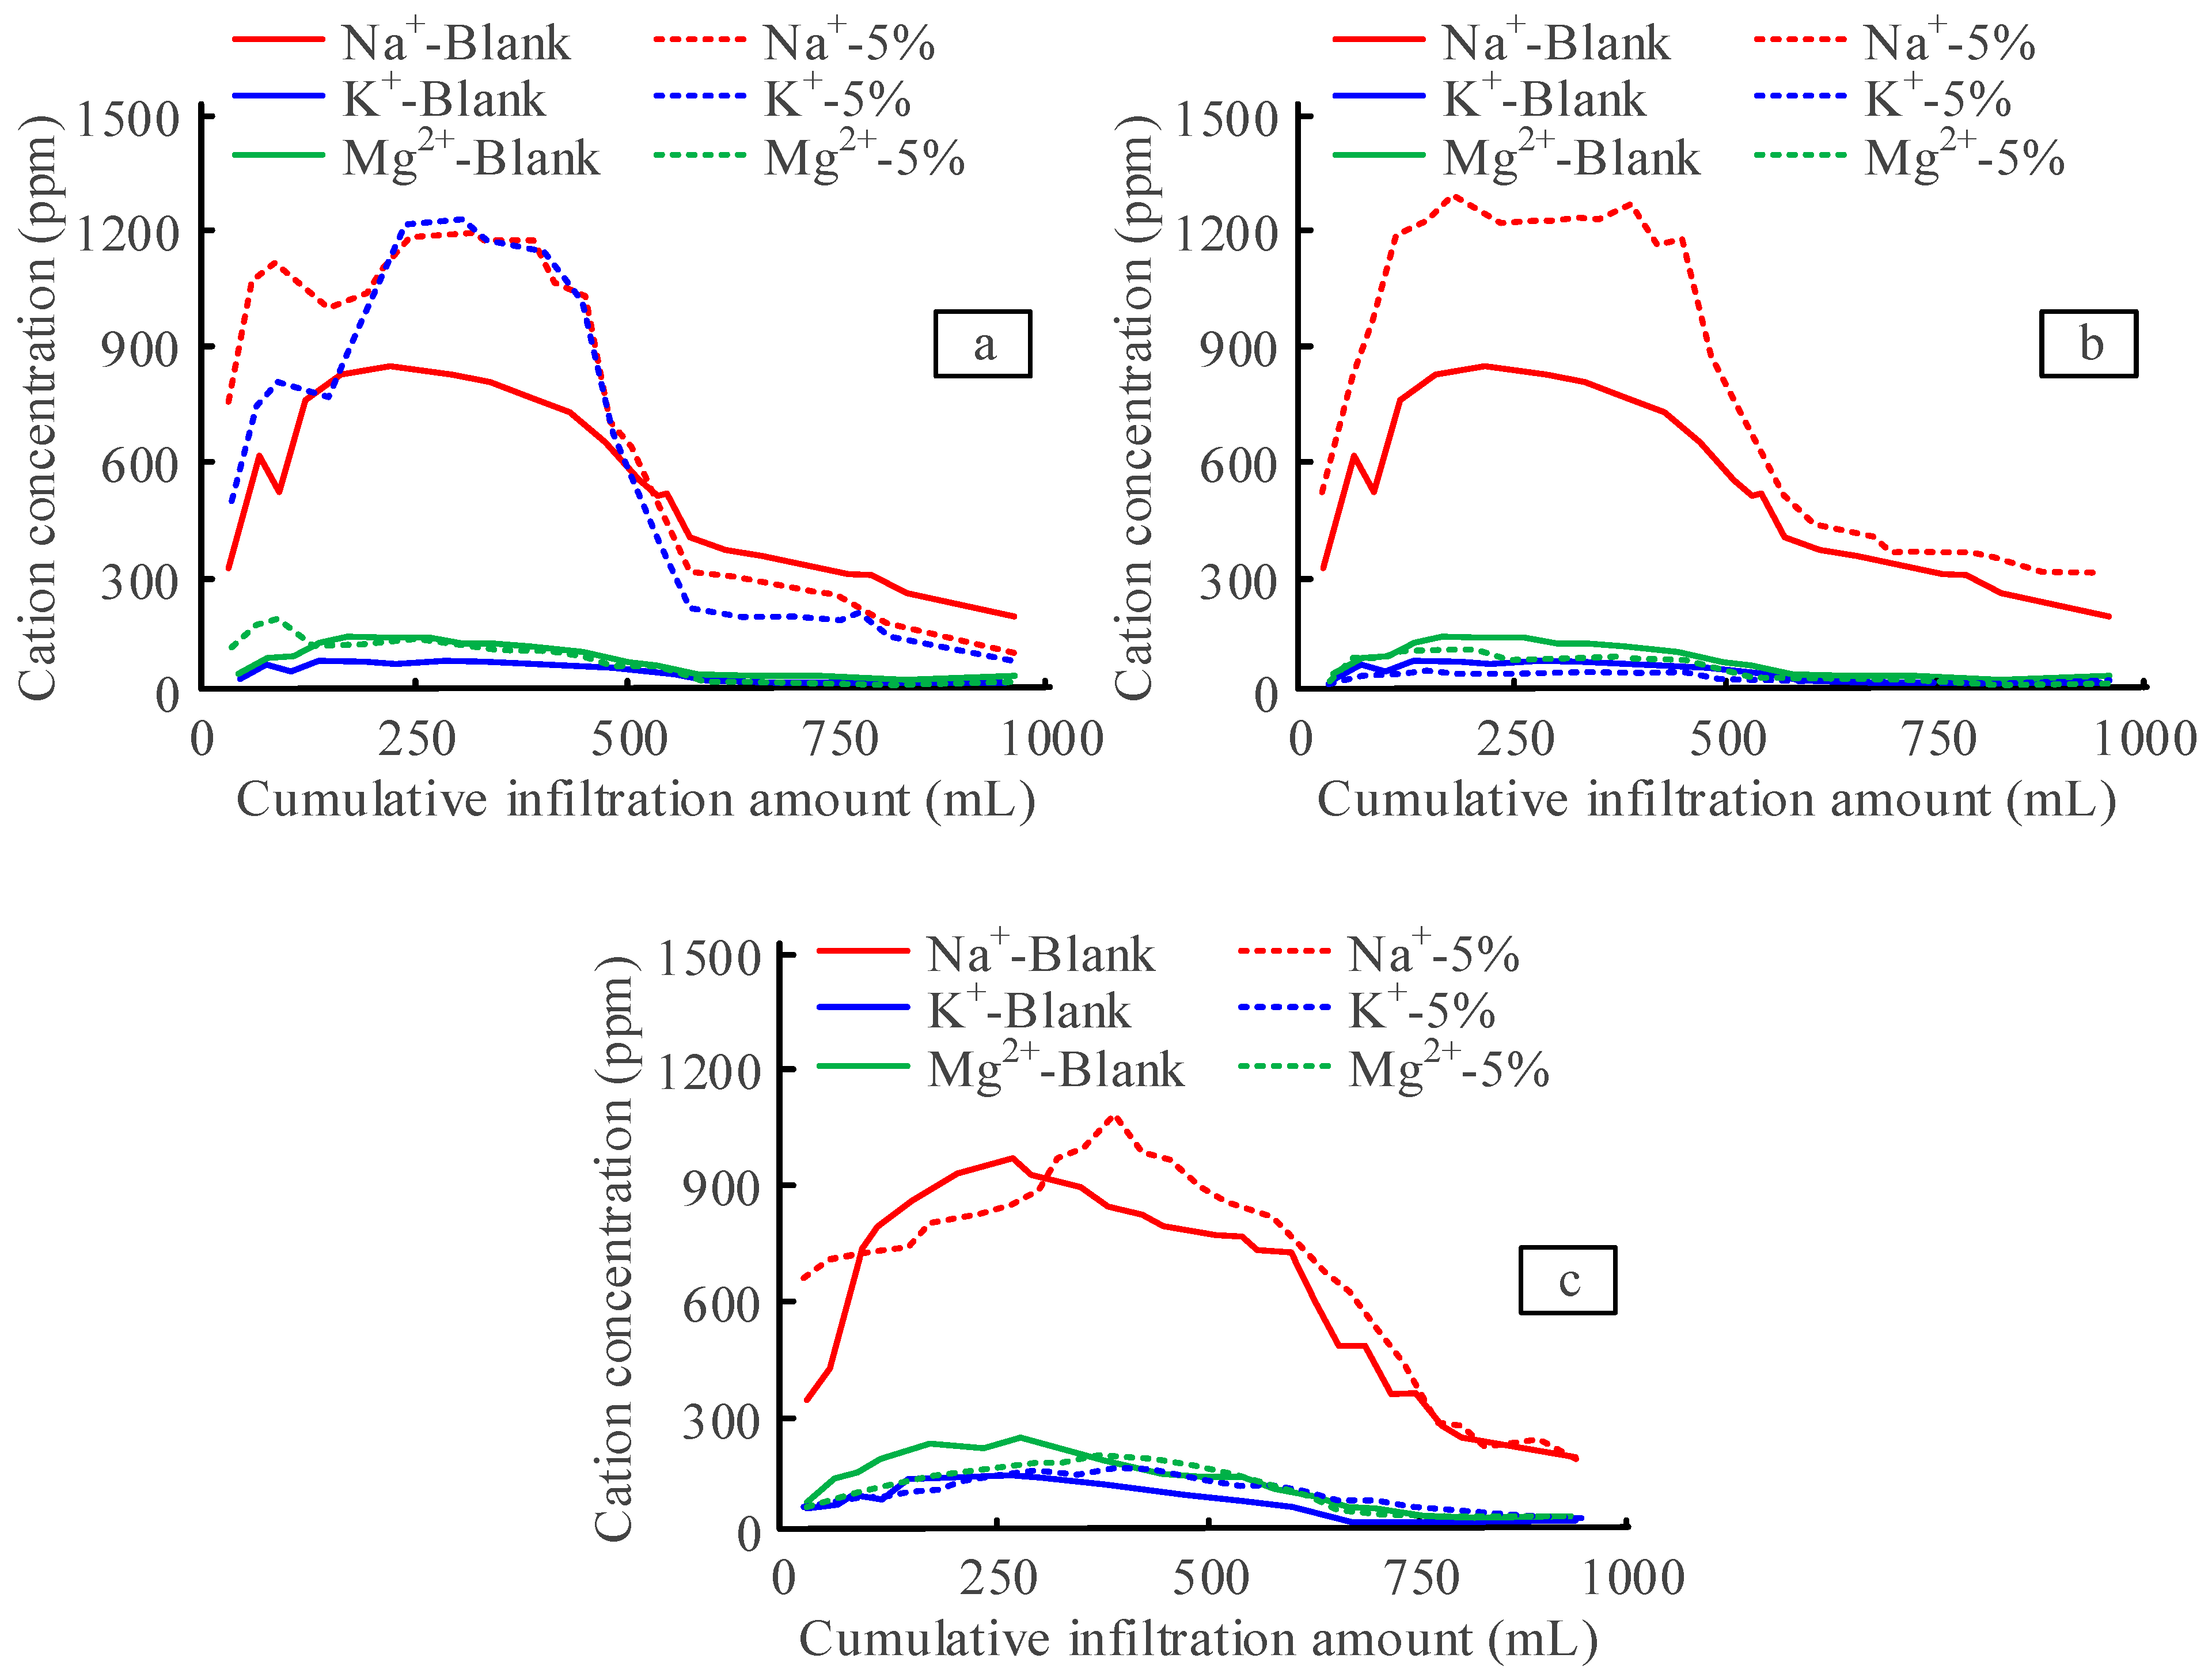
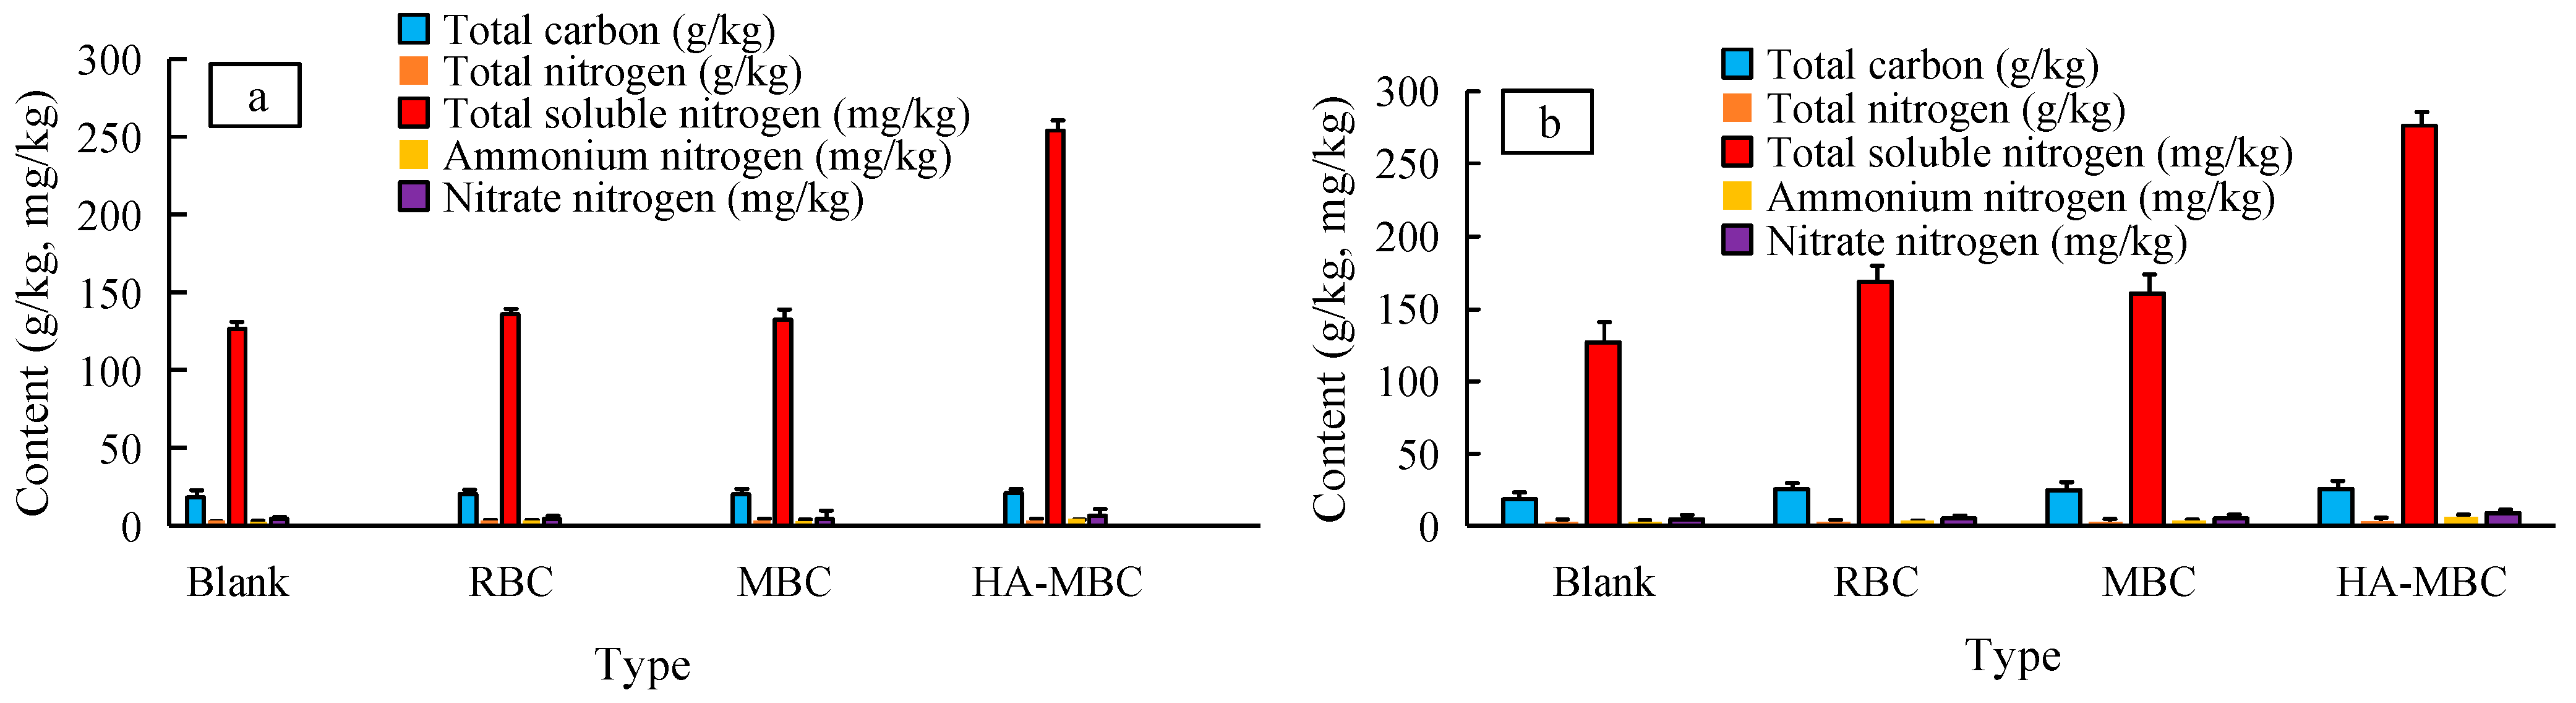
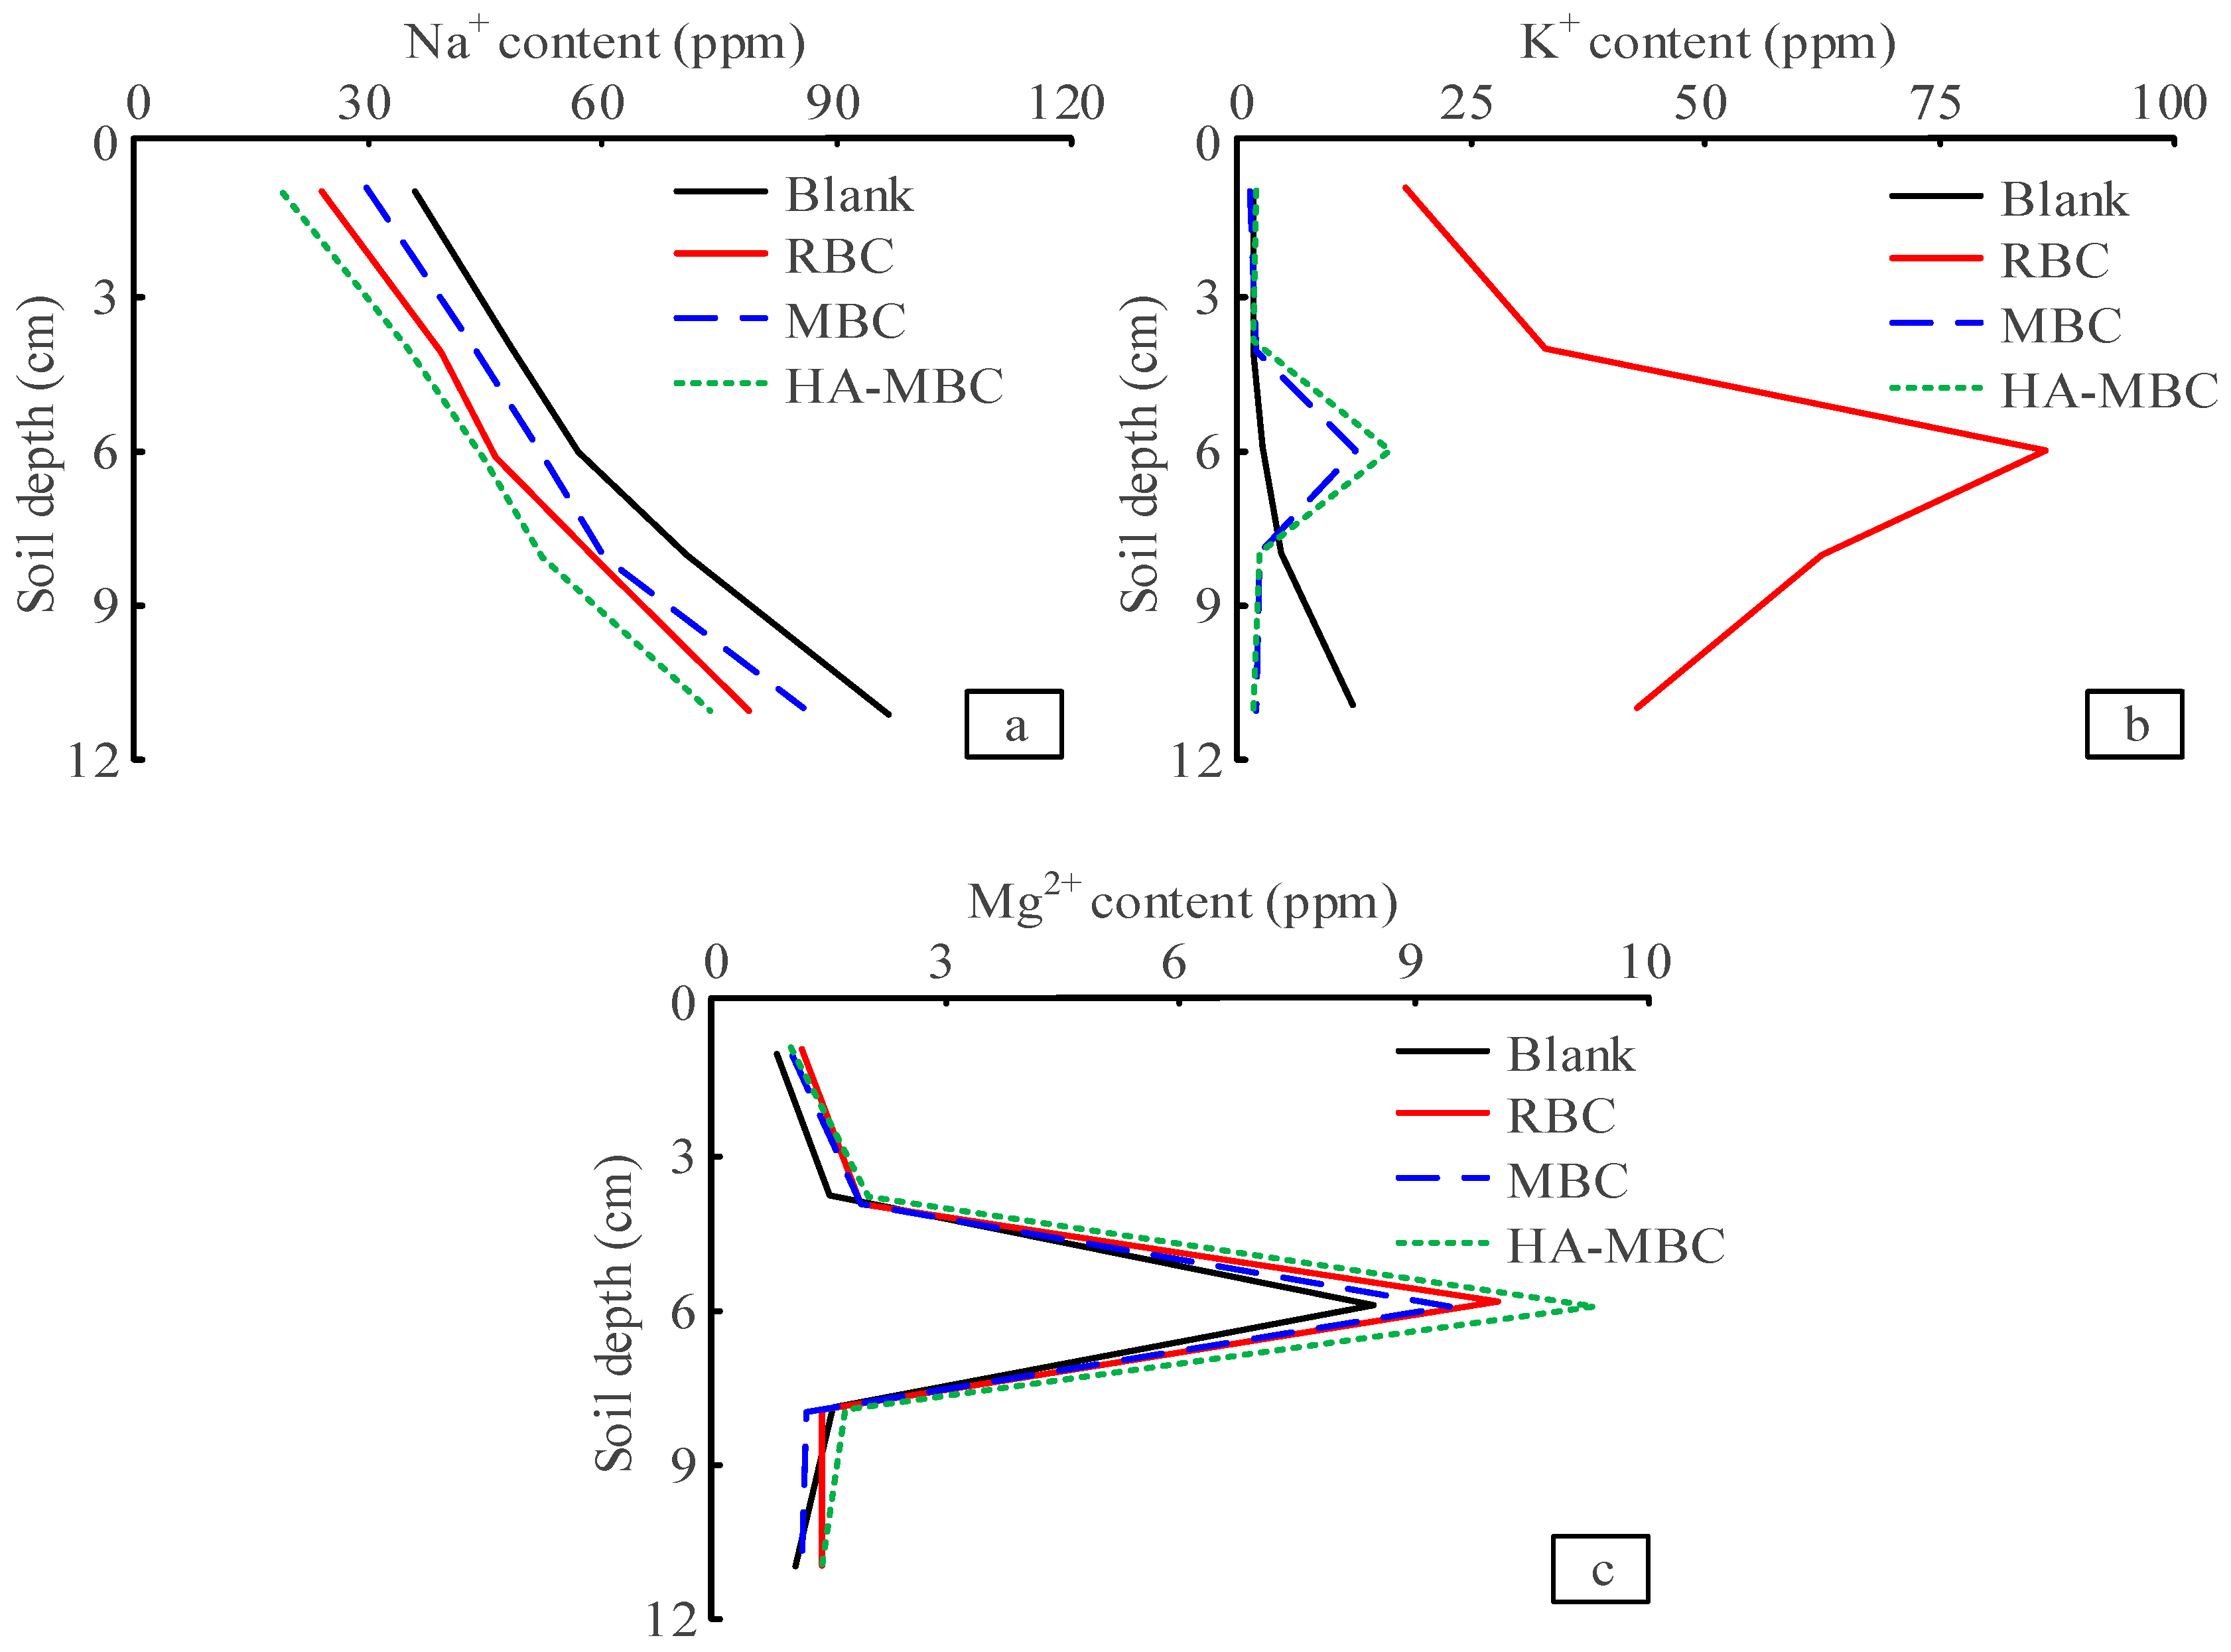
3.2. Results and Analysis of Soil Remediation by Modified Biochar

Biochar’s influence on the leaching rate of saline–alkali soil is shown in Figure 5. From the cumulative leaching time curve of the leaching experiment, the addition of biochar significantly increases the leaching rate. Under the same conditions as water head pressure, the average infiltration rate of the blank control group is 2.61 mL/h, and the average infiltration rate of 1% straw biochar and 5% straw biochar is 5.73 and 7.49 mL/h. The average infiltration rate of 1% magnetic biochar and the average infiltration rate of 5% magnetic biochar are 3.83 and 4.02 mL/h. The average infiltration rates of 1% humic acid–magnetic biochar and 5% humic acid–magnetic biochar are 11.43 and 25.08 mL/h, respectively. The 5% humic acid–magnetic biochar has the best effect. The introduction of biochar can effectively improve the permeability of saline–alkali soil. Compared with the change in the amount of biochar added with different ginseng, the leaching rate increases with the increase in the added amount of biochar.
Biochar’s effect on the pH value of soil leachate is shown in Figure 6. The pH value curve of soil leachate shows an upward trend, and the rising speed changes from fast to slow. With the increase in infiltration, the leaching rate gradually decreases. Compared with the blank control group, the addition of biochar reduced the pH value of soil leachate, and the humic acid–magnetic biochar group decreased the most. The magnetic modification treatment and the grafting of humic acid make the pH value of humic acid–magnetic biochar lower. So, the humic acid–magnetic biochar has the greatest impact on the pH of soil leachate, which is similar to previous research results [28,29]. The main source of soil alkalinity is CO32− and HCO3. CO32− and HCO3 are soluble, so they will enter the sampling bottle together with the extract, making the pH value of the leachate show a trend of rising from fast to slow. On the other hand, hydrothermal carbon can promote the degradation of methane in the soil, thus producing carbon dioxide, resulting in a reduction in the soil’s pH value.
Biochar’s effect on the cation concentration of soil leachate is shown in Figure 7. The cation concentration of soil leachate shows a trend of rising first and then falling. The main cations in the soil leachate of the blank control group are sodium ions. After adding 5% straw biochar, the potassium ion concentration in the leachate increases significantly due to the large amount of potassium ions in the straw. After adding 5% magnetic biochar, the concentration of potassium ions in the leachate changes little, and the concentration of sodium ions increases gradually due to the leaching treatment of biochar in the magnetic modification. After adding 5% humic acid–magnetic biochar, the grafting of humic acid makes the oxygen-containing functional groups of biochar significantly increase, which may have an adsorption effect with sodium ions, so the concentration of sodium ions in the leachate decreases.
Biochar’s effect on the physical property as well as chemical properties of saline–alkali soil is shown in Figure 8. After leaching treatment and adding biochar, the conductivity of saline–alkali soil decreases, which proves that leaching treatment and biochar can decrease saline–alkali soil’s salt content effectively. After adding 5% humic acid–magnetic biochar, the soil moisture content is the highest, which is 13.85%, increased by 3.76%. This proves that the addition of biochar can effectively improve the water-holding capacity of saline–alkali soil, consistent with previous research results [30,31]. The addition of biochar increases saline–alkali soil’s cation exchange capacity, and the humic acid–magnetic biochar group’s change is the most significant, which is the same as previous research results [32,33]. After adding different biochar, soil organic matter content in saline–alkali soil increases significantly, which proves that the addition of biochar can effectively improve the fertility of saline–alkali soil. The humic acid–magnetic biochar group has the highest content of soil organic matter. Magnetic modification and humic acid grafting have a synergistic effect on soil organic matter. The surface of biochar has a special microporous structure, the specific surface area of biochar is large, and the adsorption of phosphate ions is strong. Therefore, biochar can effectively reduce the loss of phosphorus in soil and promote the increase in soil nutrient concentration.
Biochar’s influence on the nitrogen form of saline–alkali soil is shown in Figure 9. The incorporation of biochar increased the total carbon content and total nitrogen content of the soil, with the largest increase in the 5% humic acid–magnetic biochar group. It is 7.14 and 0.16 g/kg higher than the blank control group, respectively. The addition of humic acid–magnetic biochar increases the total soluble nitrogen content of the soil and promotes the nitrogen cycle of soil through nitrogen mineralization and nitrification regulation. The content of nitrate nitrogen in straw biochar and magnetic biochar is not high. The reason may be the relatively large soil void, which makes nitrate nitrogen leach with water. The soil formed by organic matter is not strong in the adsorption capacity of nitrate nitrogen, while the addition of humic acid–magnetic biochar can inhibit the leaching of nitrate nitrogen and maintain the nitrogen content in the soil. On the other hand, the increase in soil porosity promotes the reduction in nitrate nitrogen content with water leaching. So, if the added amount of biochar is greater, the nitrate nitrogen content in the soil is higher. The addition of humic acid–magnetic biochar can inhibit the leaching of nitrate nitrogen and maintain the nitrogen content in the soil.
Biochar’s influence on the distribution of soil cations after leaching treatment is shown in Figure 10. Compared with the blank control group, the soil’s sodium ion content decreases after adding biochar, and the content of potassium ions and magnesium ions increases at 0–7 cm of soil depth. It shows a downward trend at 7–11 cm of soil depth. In previous studies, potassium ions and magnesium ions were the main polluting elements in deep soil, and biochar could reduce the content of contaminated elements in deep soil to a large extent, which confirms the view of the current study [34,35]. As can be seen from Figure 10c, the Mg2+ content of humic acid–magnetic biochar is higher in the whole soil profile than the other two biochars, proving that the addition of humic acid–magnetic biochar can provide more Mg2+ to the soil. Because straw biochar contains a large amount of potassium ions, the incorporation of straw biochar significantly increases the content of potassium ions in the soil. Compared with straw biochar and magnetic biochar, the content of sodium ions in the soil after humic acid–magnetic biochar incorporation is lower, while the content of potassium ions and magnesium ions is higher. The grafting of humic acid introduces a large number of oxygen-containing functional groups, effectively increases the surface complexation of sodium ions and hydroxyl groups, and converts potassium, calcium, and magnesium in biochar into an effective state.

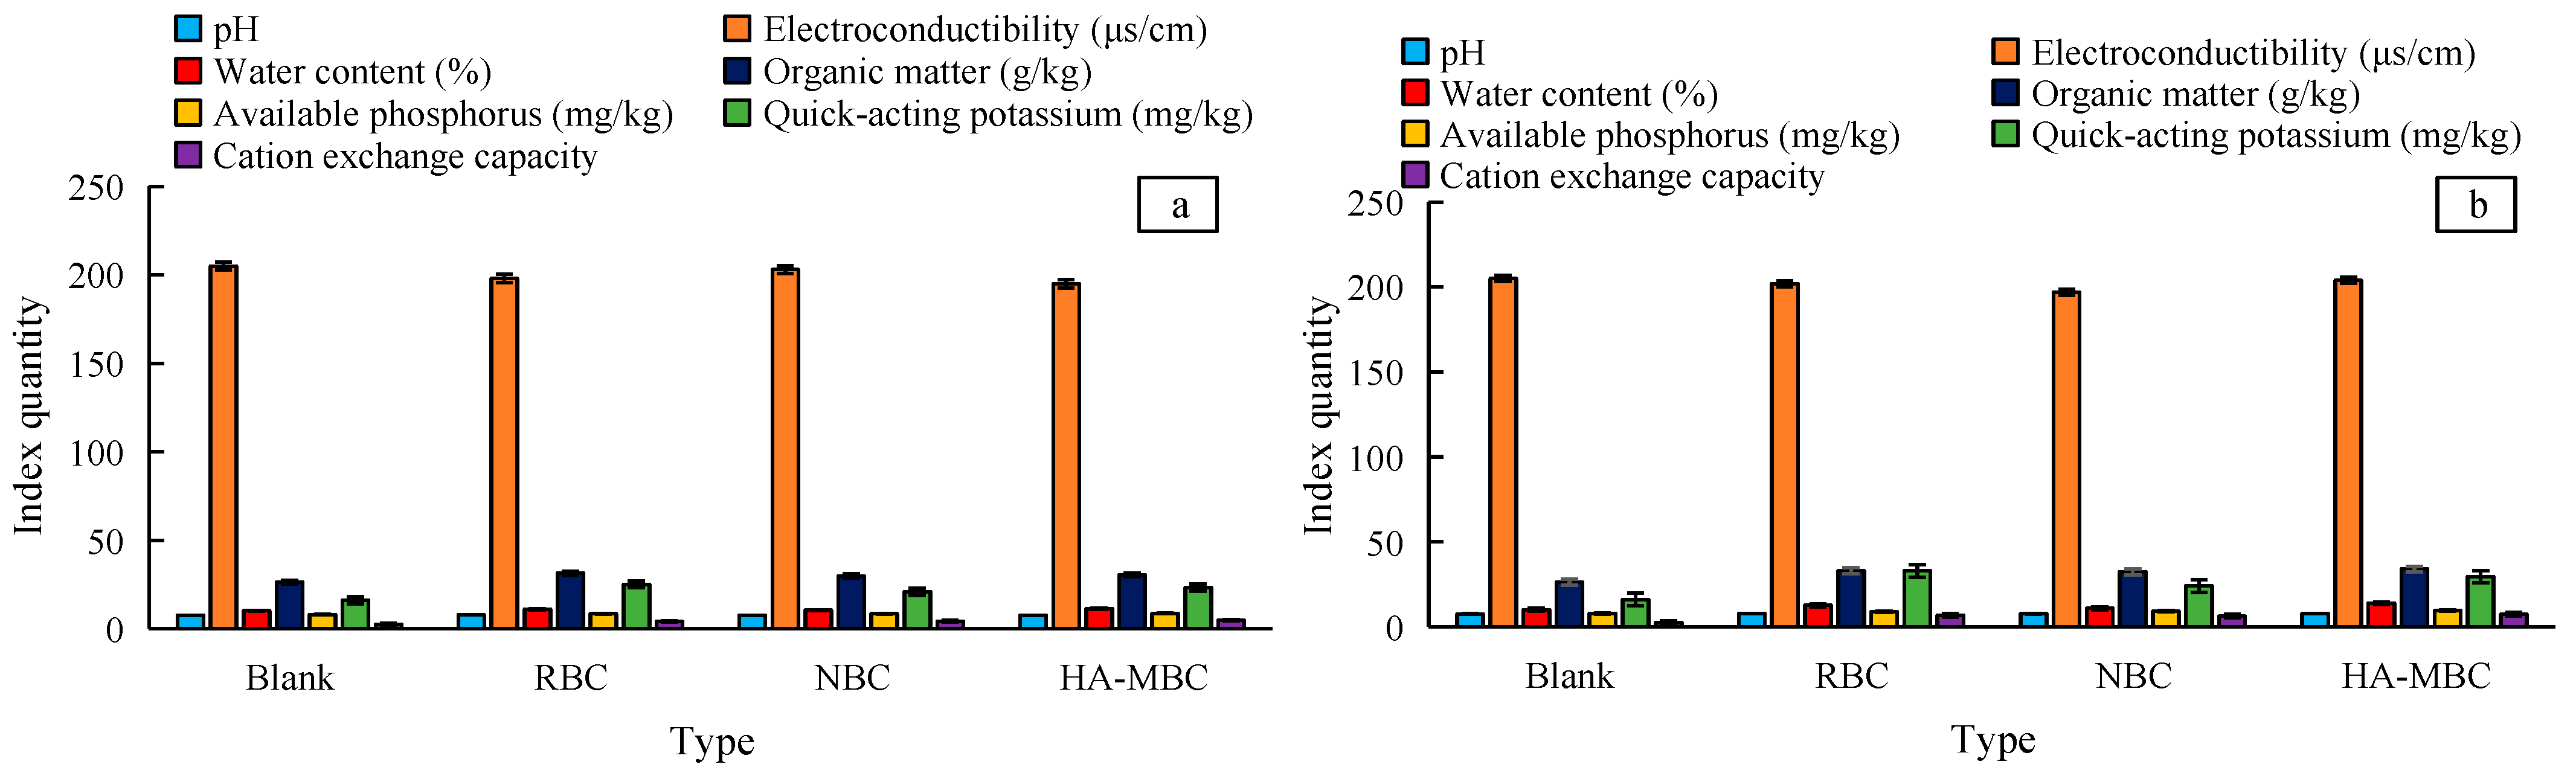
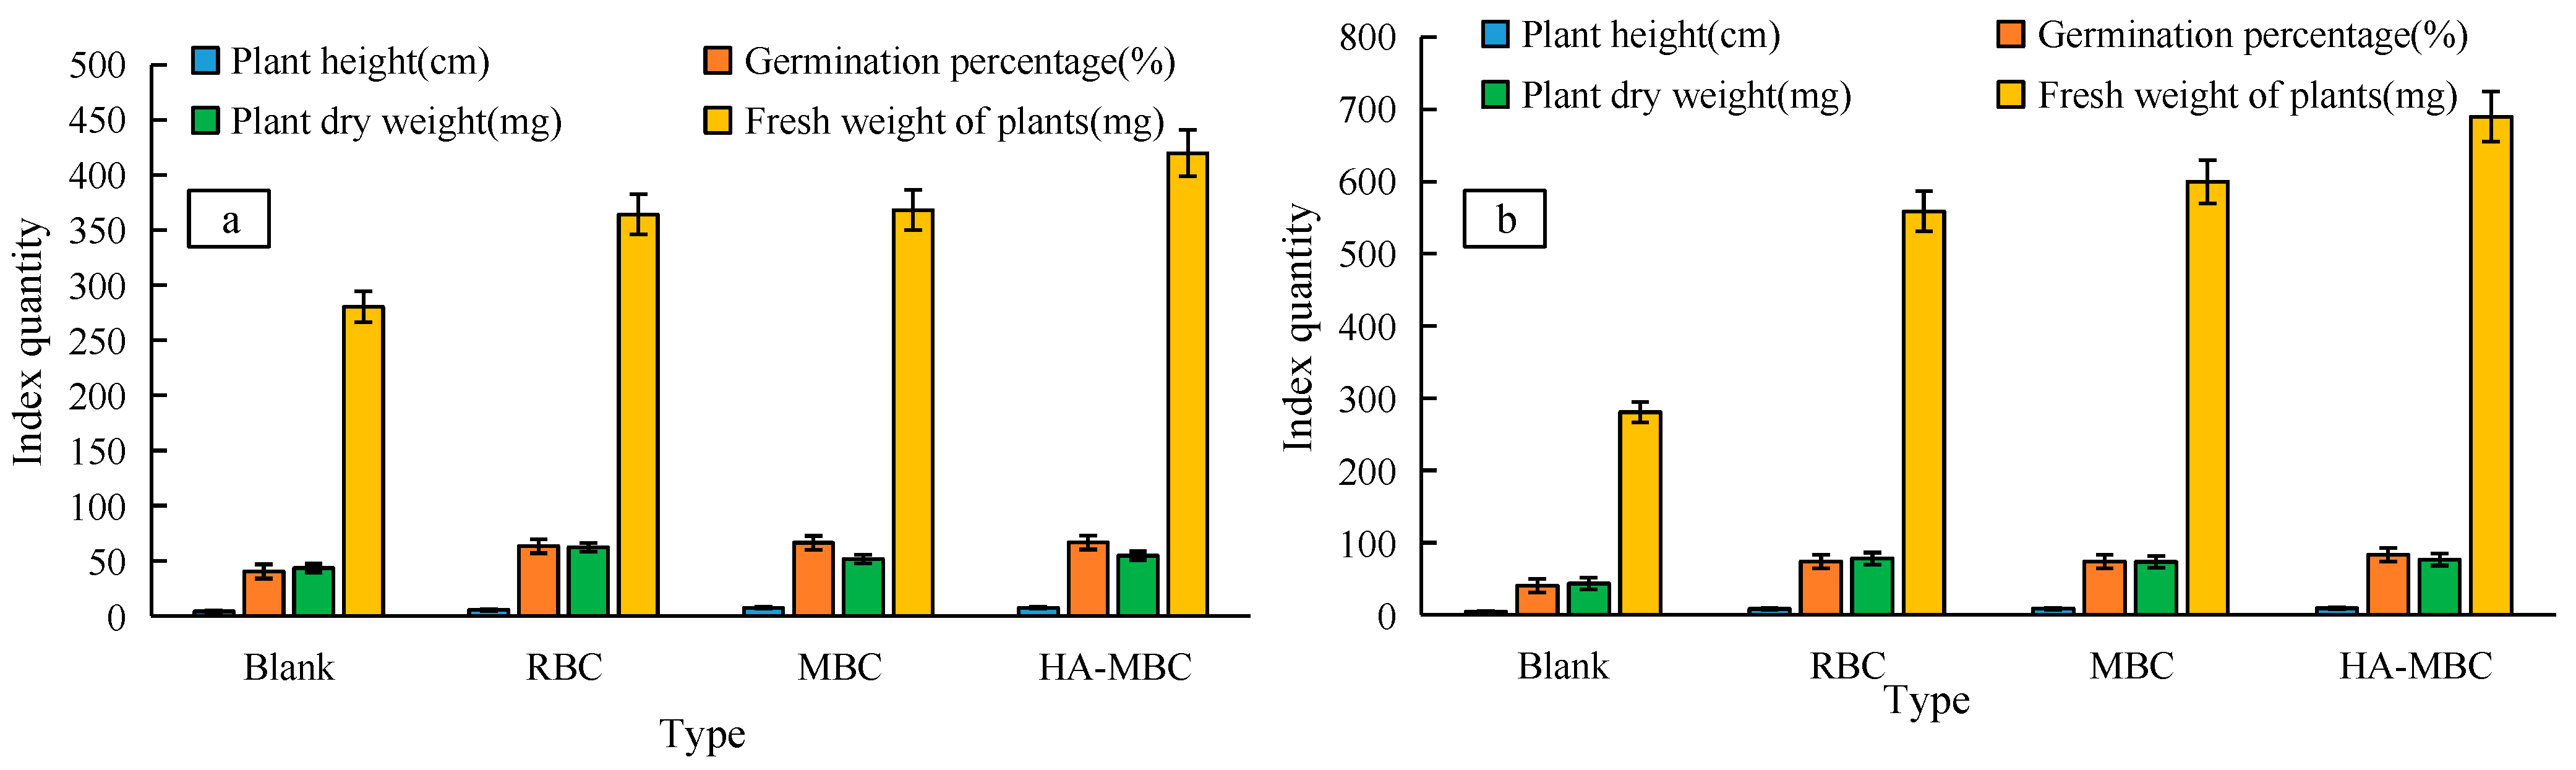
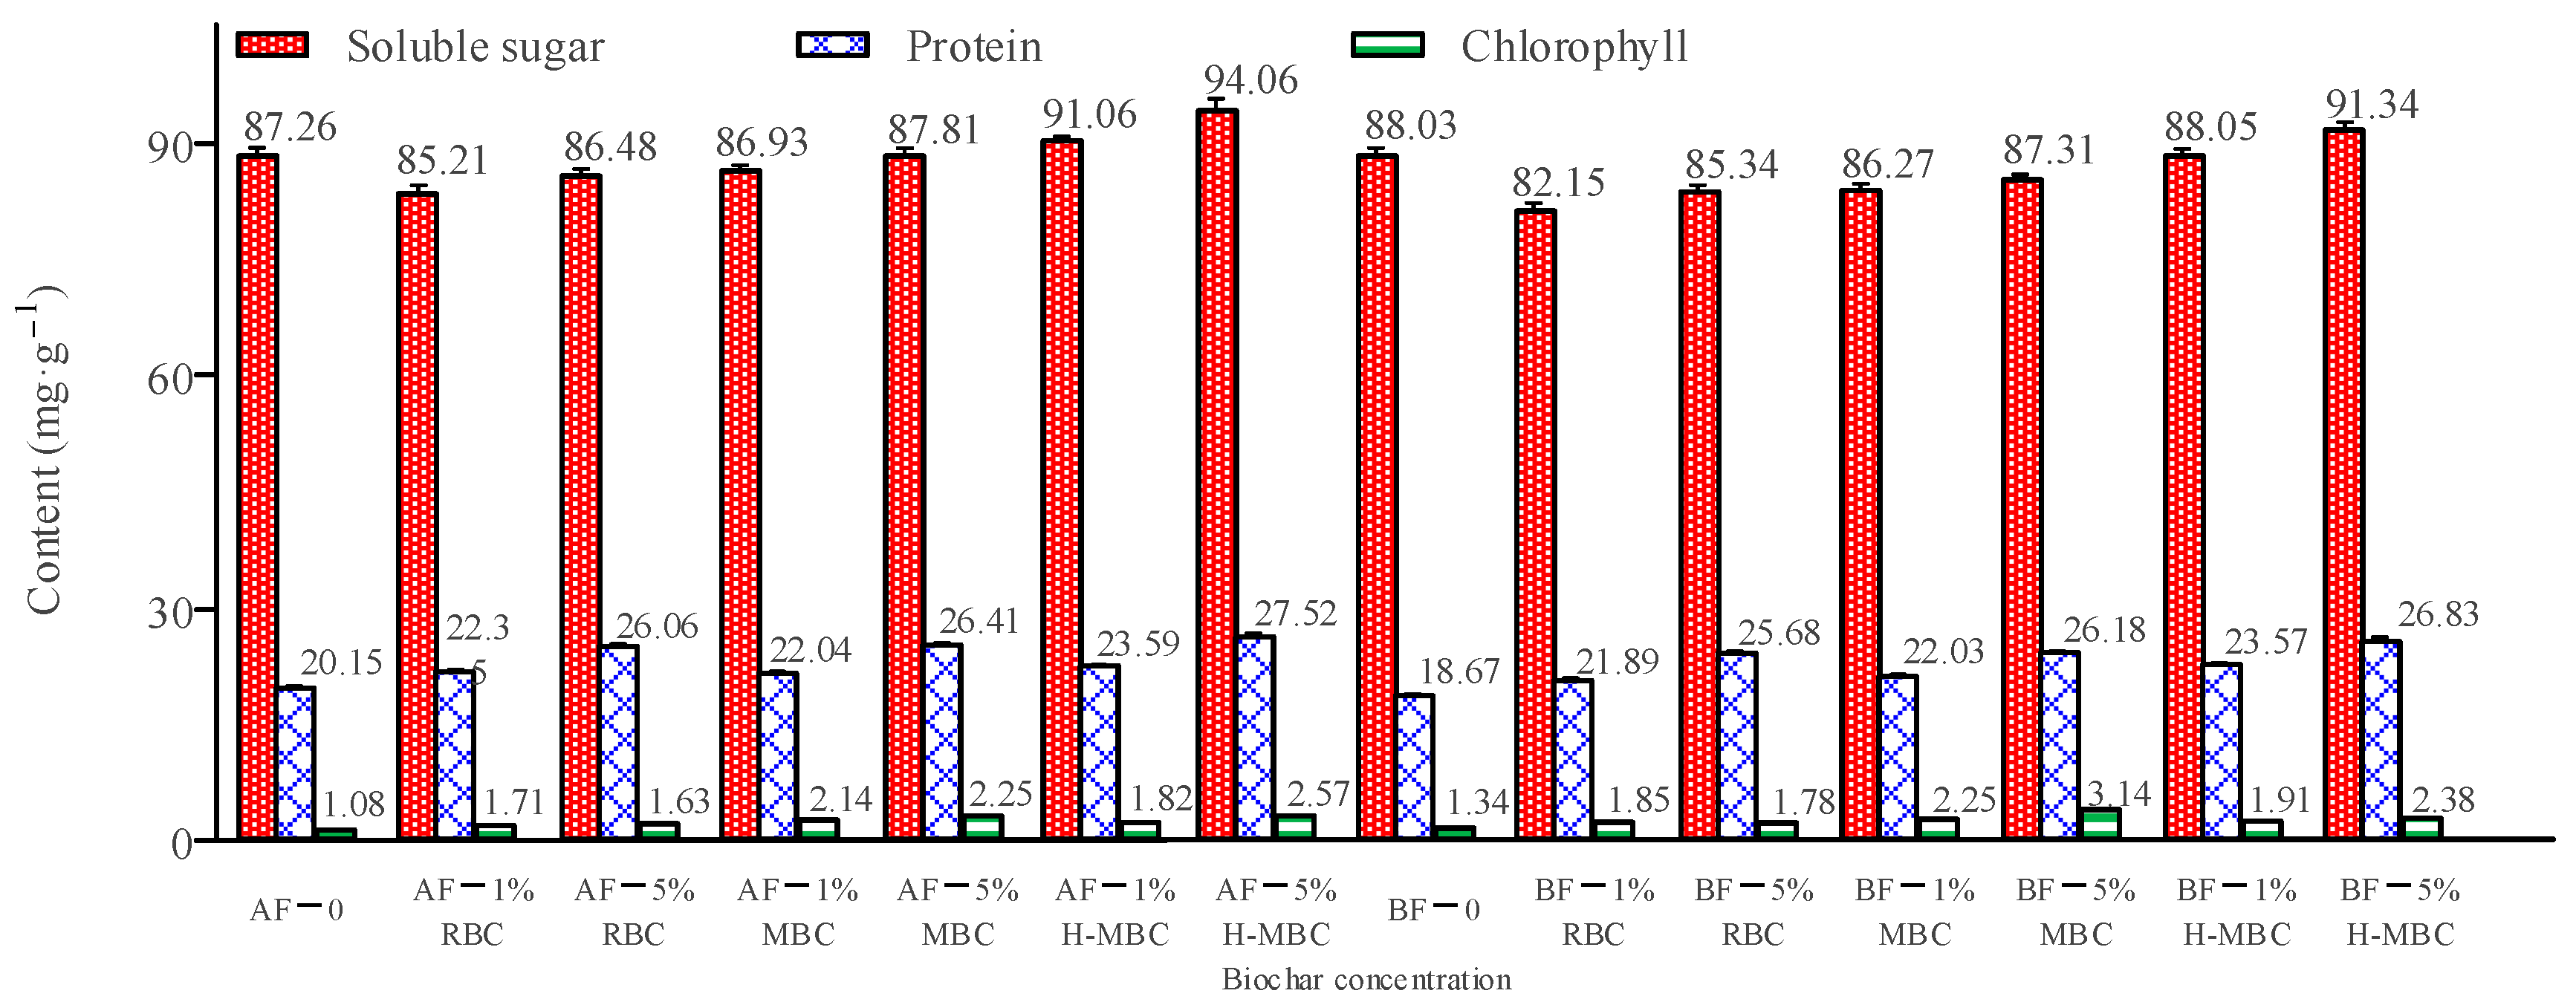
3.3. Results and Analysis of the Impact of Modified Biochar on Crop Growth and Quality

The effects of the three kinds of biochar on the growth biological characteristics of Chinese cabbage are shown in Figure 11. The height of Chinese cabbage plants increases significantly after the incorporation of biochar. The height of rice straw biochar and magnetic biochar groups is almost twice that of the blank control group. The plant height of the 5% humic acid–magnetic biochar group was the highest, 9.16 ± 0.19 cm. The germination rate of plants in the 5% humic acid–magnetic biochar group was 83.33 ± 5.54%. If the added amount of biochar is higher, the impact on the dry weight and fresh weight of Chinese cabbage is greater. The maximum dry weight of Chinese cabbage was 77.89 ± 1.23 mg with the addition of 5% straw biochar. With the addition of 5% humic acid–magnetic biochar, the maximum fresh weight of Chinese cabbage was 689.78 ± 11.58 mg. The plants’ dry weight in the 5% straw biochar, 5% magnetic biochar, and 5% humic acid–magnetic biochar groups increased by 79.68%, 69.34%, and 76.49%, respectively, and the wet weight of the plants increased by 99.19%, 113.84%, and 145.95%, respectively. The difference in dry weight and fresh weight of pakchoi also reflects biochar’s impact on the water content of pakchoi. The physical and chemical properties of the soil directly affect the growth of pakchoi. Leaching treatment and the introduction of biochar effectively improve the physical and chemical properties of saline–alkali soil, increase soil fertility, and have a positive role in promoting crop growth. Nutrients are the primary factor that restricts crop growth. After biochar is applied to soil, it can promote the transformation of phosphorus in soil from a solid to an effective state and directly increase the concentration of available phosphorus. The excessive accumulation of Na in plants easily causes oxidative stress, which seriously threatens the cell membrane system of plants and is not conducive to plant growth. The application of biochar greatly reduced the amount of Na+ absorbed by Chinese cabbage in the soil and increased the amount of potassium absorbed by Chinese cabbage, thus alleviating the salt-induced oxidative stress.
The effect of three kinds of biochar on the quality of Chinese cabbage is shown in Figure 12. The soil before and after leaching treatment is marked as BF and AF respectively. After the leaching treatment, the blank control group’s chlorophyll content of pakchoi increased, but the chlorophyll content of pakchoi decreased after adding biochar. The chlorophyll content of Chinese cabbage increased by 57.59%, 136.11%, and 138.62% after adding 5% straw biochar, 5% magnetic biochar, and 5% humic acid–magnetic biochar, while the chlorophyll content increased by 38.51%, 142.09%, and 76.83% after leaching. The leaching process may lead to the leaching of chlorophyll synthesis elements, so the leaching treatment has a negative effect on the chlorophyll content of Chinese cabbage. After leaching, the soluble protein content of Chinese cabbage increased slightly. In previous studies, it was found that after leaching treatment, plant cells would have significant changes and showed a trend of decreasing chlorophyll, which was consistent with the current research results [36,37]. The effect of adding 5% humic acid–magnetic biochar is the best. The soluble protein content increased by 35.29%. Soluble sugar is one of the solutes induced by salt stress and has the function of stress regulation. Pakchoi’s soluble sugar content increases slightly after leaching but decreases after adding biochar, which proves that biochar has a negative effect on pakchoi’s soluble sugar content.

4. Conclusions

The salinization of coastal soil degrades the soil structure and properties, which makes agricultural productivity decline and seriously hinders coastal areas’ agricultural development. To repair the coastal saline–alkali soil, the preparation of biochar from rice straw was studied, and magnetic biochar and humic acid–magnetic biochar were prepared by magnetic modification and humic acid grafting. The study analyzed the remediation effect of modified biochar on the coastal saline–alkali land in different amounts and explored the effect of different modified biochars on the growth of crops in saline–alkali land with Chinese cabbage as the experimental object. The introduction of biochar could effectively improve the permeability of saline–alkali soil, and the soil leaching rate of 5% humic acid–magnetic biochar was 25.08 mL/h. Leaching treatment and biochar could make saline–alkali soil’s salt content reduce effectively, improving the water-holding capacity and soil fertility of saline–alkali soil, and the effect of humic acid–magnetic biochar was the best. The introduction of biochar had a positive effect on crop growth. After the introduction of 5% humic acid–magnetic biochar, the plant height of Chinese cabbage was 9.16 ± 0.19 cm, the plant germination rate reached 83.33 ± 5.54%, and the chlorophyll content and soluble protein content increased significantly. The results showed that soil leaching treatment combined with humic acid–magnetic biochar can effectively repair coastal saline soil. This was consistent with the results of previous studies and concluded that modified biochar could affect crop growth [38].

Author Contributions

Methodology, C.L.; Validation, C.L.; Formal analysis, X.R.; Investigation, Z.W.; Data curation, Z.W., Y.X. and J.S.; Writing—original draft, X.M. and X.H.; Supervision, P.L. All authors have read and agreed to the published version of the manuscript.

Funding

This work was sponsored in part by the National Natural Science Foundation of China (32001224; 41571049; 41461010).

Institutional Review Board Statement

Not applicable.

Informed Consent Statement

Not applicable.

Data Availability Statement

The data used to support the findings of this study are available from the corresponding author upon request.

Conflicts of Interest

The authors declare no conflict of interests.

References

  1. Hailu, B.; Mehari, H. Impacts of soil salinity/sodicity on soil-water relations plant growth in dry land areas: A review. J. Nat. Sci. Res. 2021, 12, 1–10. [Google Scholar]
  2. Meena, M.D.; Narjary, B.; Sheoran, P.; Jat, H.S.; Joshi, P.K.; Chinchmalatpure, A.R. Changes in physical and chemical properties of saline soil amended with municipal solid waste compost and chemical fertilizers in a mustard–pearl millet cropping system. Land Degrad. Dev. 2022, 33, 1677–1688. [Google Scholar] [CrossRef]
  3. Zhang, Y.; Yang, J.; Yao, R.; Wang, X.; Xie, W. Short-term effects of biochar and gypsum on soil hydraulic properties and sodicity in a saline-alkali soil. Pedosphere 2020, 30, 694–702. [Google Scholar] [CrossRef]
  4. Selim, A.; Bari, E.; Rahaman, M.H.; Rahman, M.M. Phytosociology and biodiversity of roadside herbs in a salinity-affected coastal area of bangladesh. Heliyon 2021, 7, e07813. [Google Scholar] [CrossRef] [PubMed]
  5. Zhang, X.; Zhang, Z.; Wang, W.; Fang, W.T.; Ju, H. Vegetation successions of coastal wetlands in southern Laizhou Bay, Bohai Sea, northern China, influenced by the changes in relative surface elevation and soil salinity. J. Environ. Manag. 2021, 293, 112964. [Google Scholar] [CrossRef]
  6. Fouladidorhani, M.; Shayannejad, M.; Shariatmadari, H.; Mosaddeghi, M.R.; Arthur, E. Biochar, manure, and super absorbent increased wheat yields and salt redistribution in a saline-sodic soil. Agron. J. 2020, 112, 5193–5205. [Google Scholar] [CrossRef]
  7. Zhu, Y.; Shao, T.; Zhou, Y.; Zhang, X.; Rengel, Z. Periphyton improves soil conditions and offers a suitable environment for rice growth in coastal saline alkali soil. Land Degrad. Dev. 2021, 32, 2775–2788. [Google Scholar] [CrossRef]
  8. Wang, Z.; Yin, D.; Wang, H.; Zhao, C.; Li, Z. Effects of biochar on waterlogging and the associated change in micro-ecological environment of maize rhizosphere soil in saline-alkali land. Bioresources 2020, 15, 9303–9323. [Google Scholar] [CrossRef]
  9. Tao, Q.; Li, B.; Chen, Y.; Zhao, J.; Wang, V. An integrated method to produce fermented liquid feed and biologically modified biochar as cadmium adsorbents using corn stalks. Waste Manag. 2021, 127, 112–120. [Google Scholar] [CrossRef]
  10. Duan, M.; Liu, G.; Zhou, B.; Chen, X.; Wang, Q.; Zhu, H.; Li, Z. Effects of modified biochar on water and salt distribution and water-stable macro-aggregates in saline-alkaline soil. J. Soil Sediment. 2021, 21, 2192–2202. [Google Scholar] [CrossRef]
  11. Sun, J.; Fan, Q.; Ma, J.; Cui, L.; Quan, G.; Yan, J. Effects of biochar on cadmium (Cd) uptake in vegetables and its natural downward movement in saline-alkali soil. Env. Pollut. Bioavail. 2020, 32, 36–46. [Google Scholar] [CrossRef]
  12. Choudhary, P.; Pramitha, L.; Rana, S.; Verma, S.; Aggarwal, P.R.; Muthamilarasan, M. Hormonal crosstalk in regulating salinity stress tolerance in graminaceous crops. Physiol. Plant. 2021, 173, 1587–1596. [Google Scholar] [CrossRef] [PubMed]
  13. Dourado, P.R.M.; Souza, E.R.D.; Santos, M.A.D.; Lins, C.M.T.; Monteiro, D.R.; Paulino, M.K.S.S.; Schaffer, B. Stomatal regulation and osmotic adjustment in sorghum in response to salinity. Agric 2022, 12, 658. [Google Scholar] [CrossRef]
  14. Lew, S.; Glińska-Lewczuk, K.; Burandt, P.; Kulesza, K.; Kobus, S.; Obolewski, K. Salinity as a determinant structuring microbial communities in coastal lakes. Int. J. Environ. Res. Public Health 2022, 19, 4592. [Google Scholar] [CrossRef]
  15. Qados, A. Mechanism of nanosilicon-mediated alleviation of salinity stress in faba bean (vicia faba l.) plants. Am. J. Exp. Agric 2015, 7, 78–95. [Google Scholar] [CrossRef]
  16. Wu, N.; Li, Z.; Tang, M. Impact of salt and exogenous AM inoculation on indigenous microbial community structure in the rhizosphere of dioecious plant, Populus cathayana. Sci. Rep. 2021, 11, 18403. [Google Scholar] [CrossRef]
  17. Wang, S.; Ai, S.; Nzediegwu, C.; Kwak, J.H.; Chang, S.X. Carboxyl and hydroxyl groups enhance ammonium adsorption capacity of iron (III) chloride and hydrochloric acid modified biochars. Bioresour. Technol. 2020, 309, 123390. [Google Scholar] [CrossRef]
  18. Roy, H.; Prantika, T.R.; Riyad, M.H.; Paul, S.; Islam, M.S. Synthesis, characterizations, and RSM analysis of Citrus macroptera peel derived biochar for textile dye treatment. S. Afr. J. Chem. Eng. 2022, 41, 129–139. [Google Scholar] [CrossRef]
  19. Shi, Y.; Liu, X.; Zhang, Q.; Gao, P.; Ren, J. Biochar and organic fertilizer changed the ammonia-oxidizing bacteria and archaea community structure of saline–alkali soil in the North China Plain. J. Soil. Sediment. 2020, 20, 12–23. [Google Scholar] [CrossRef]
  20. Wang, S.; Gao, P.; Zhang, Q.; Shi, Y.; Guo, Y.; Lv, Q.; Wu, W.; Zhang, X.; Li, M.; Meng, Q. Application of biochar and organic fertilizer to saline-alkali soil in the Yellow River Delta: Effects on soil water, salinity, nutrients, and maize yield. Soil. Use Manag. 2022, 38, 1679–1692. [Google Scholar] [CrossRef]
  21. Haider, F.U.; Coulter, J.A.; Liqun, C.A.I.; Hussain, S.; Cheema, S.A.; Wu, J.; Zhang, R. An overview on biochar production, its implications, and mechanisms of biochar-induced amelioration of soil and plant characteristics. Pedosphere 2022, 32, 107–130. [Google Scholar] [CrossRef]
  22. Li, K.; Kong, W.; Xu, W.; Liu, C. Impacts of application patterns and incorporation rates of dredged Yellow River sediment on structure and infiltration of saline-alkali soil. Int. J. Agric. Biol. Eng. 2022, 15, 139–146. [Google Scholar] [CrossRef]
  23. Li, K.; Li, Q.; Geng, Y.; Liu, C. An evaluation of the effects of microstructural characteristics and frost heave on the remediation of saline-alkali soils in the Yellow River Delta, China. Land Deg. Dev. 2021, 32, 1325–1337. [Google Scholar] [CrossRef]
  24. Guo, M.; Ma, X.L.; Han, X.; Zhang, S.; Yuan, M.; Wang, B. Effects of corn stalks biochar amendment and freezing-thawing on the cd adsorption of saline-alkali soil. Soil. Sediment Contam. 2022, 31, 925–940. [Google Scholar] [CrossRef]
  25. Hall, A.G.; King, J.C.; McDonald, C.M. Comparison of serum, plasma, and liver zinc measurements by AAS, ICP-OES, and ICP-MS in diverse laboratory settings. Biol. Trace Elem. Res. 2022, 200, 2606–2613. [Google Scholar] [CrossRef]
  26. Zeiri, O.; Fruchter, N.; Elish, E.; Gizbar, H.; Shamir, D.; Sedgi, I. Determination of Uranium Isotopic Ratio by ICP-OES Using Optimal Sensitivity Position Analysis. Anal. Chem. 2021, 93, 5123–5128. [Google Scholar] [CrossRef]
  27. Pradhan, S.K.; Ambade, B. A scheme for sequential separation of thorium, lanthanides, uranium in geo-materials and their ICP-OES determination. J. Radioanal. Nucl. Chem. 2021, 329, 115–125. [Google Scholar] [CrossRef]
  28. Feng, L.; Xu, W.; Sun, N.; Mandal, S.; Wang, H.; Geng, Z. Efficient improvement of soil salinization through phytoremediation induced by chemical remediation in extreme arid land northwest China. Int. J. Phytoremediat. 2020, 22, 334–341. [Google Scholar] [CrossRef]
  29. Kudakwashe, M.; Qiang, L.I.U.; Shuai, W.U.; Yuan, Y. Plant-and microbe-assisted biochar amendment technology for petroleum hydrocarbon remediation in saline-sodic soils: A review. Pedosphere 2022, 32, 211–221. [Google Scholar]
  30. Yin, F.; Zhang, F. Reclamation of abandoned saline-alkali soil increased soil microbial diversity and degradation potential. Plant Soil. 2022, 477, 521–538. [Google Scholar] [CrossRef]
  31. Li, K.; Li, Q.; Liu, C. Effect of freezing temperature and water content on pore structure characteristics of coastal saline-alkali soil under frost heave. J. Soil Sediment. 2022, 22, 1819–1827. [Google Scholar] [CrossRef]
  32. Murtaza, G.; Ditta, A.; Ullah, N.; Usman, M.; Ahmed, Z. Biochar for the management of nutrient impoverished and metal contaminated soils: Preparation, applications, and prospects. J. Soil Sci. Plant. Nut. 2021, 21, 2191–2213. [Google Scholar] [CrossRef]
  33. Wang, L.; O’Connor, D.; Rinklebe, J.O.Y.; Tsang, D.; Shen, Z.; Hou, D. Biochar aging: Mechanisms, physicochemical changes, assessment, and implications for field applications. Environ. Sci. Technol. 2020, 54, 14797–14814. [Google Scholar] [CrossRef] [PubMed]
  34. Huang, R. The effect of humic acid on the desalinization of coastal clayey saline soil. Water Supply. 2022, 22, 7242–7255. [Google Scholar] [CrossRef]
  35. Tian, T.; Zhang, C.; Feng, Z.; Yuan, S.; Guo, Y.; Xue, S. Effect of phosphogypsum on saline-alkalinity and aggregate stability of bauxite residue. Trans. Nonferrous Met. Soc. China 2021, 31, 1484–1495. [Google Scholar] [CrossRef]
  36. Sales, B.K.; Bryla, D.R.; Trippe, K.M. Biochar as an Alternative Soil Amendment for Establishment of Northern Highbush Blueberry. HortScience 2022, 57, 277–285. [Google Scholar] [CrossRef]
  37. Gao, N.; Du, W.; Zhang, M.; Ling, G.; Zhang, P. Chitosan-modified biochar: Preparation, modifications, mechanisms and applications. Int. J. Biol. Macromol. 2022, 209, 31–49. [Google Scholar] [CrossRef]
  38. Hung, C.; Chen, C.; Huang, C.; Lam, S.S.; Dong, C. Peroxymonosulfate activation by a metal-free biochar for sulfonamide antibiotic removal in water and associated bacterial community composition. Bioresour. Technol. 2022, 343, 126082.1–126082.9. [Google Scholar] [CrossRef]
Figure 1. Preparation process of three kinds of biochar.
Sustainability 15 05593 g001
Figure 2. Biochar’s basic physical properties as well as chemical properties. (a) Difference between pH, Productivity, Ash content. (b) Difference between Specific surface area, Pore volume.
Sustainability 15 05593 g002
Figure 3. Element analysis results of three kinds of biochar.
Sustainability 15 05593 g003
Figure 4. Three kinds of biochar’s infrared spectra.
Sustainability 15 05593 g004
Figure 5. Biochar’s effect on the leaching rate of saline–alkali soil. (a) Blank group. (b) 1% incorporation. (c) 5% incorporation.
Sustainability 15 05593 g005
Figure 6. Biochar’s effect on the pH value of soil leachate. (a) RBC. (b) MBC. (c) HA-MBC.
Sustainability 15 05593 g006
Figure 7. Biochar’s effect on the cation concentration of soil leachate. (a) RBC. (b) MBC. (c) HA-MBC.
Sustainability 15 05593 g007
Figure 8. Effects of three kinds of biochar on the physical properties as well as chemical properties of saline–alkali soil. (a) 1% content. (b) 5% content.
Sustainability 15 05593 g008
Figure 9. Effects of three kinds of biochar on nitrogen forms in saline–alkali soil. (a) 1% content. (b) 5% content.
Sustainability 15 05593 g009
Figure 10. Biochar’s effects on the distribution of soil cations after leaching treatment. (a) Soil Na+ distribution. (b) Soil K+ distribution. (c) Soil Mg2+ distribution.
Sustainability 15 05593 g010
Figure 11. Effects of three kinds of biochar on the growth and biological characteristics of Chinese cabbage. (a) 1% content. (b) 5% content.
Sustainability 15 05593 g011
Figure 12. Biochar’s effect on the quality of Chinese cabbage.
Sustainability 15 05593 g012
Table 1. Comparison of the different types of biochar.
TypeMeritShortcomingInnovation
RICE SHELL CHARCOALLightweight, non-toxic, strong water absorptionAlkaline and easily accumulates in water/
CHARCOALEffective removal of CO2Interdiction of the substance’s transmission and diffusion/
BAMBOO CHARCOALAdsorption of harmful air and sterilizationAir pollution/
STRAW STRAW MODIFICATIONImprovement of soilLow strength(1) Physical and chemical remediation are combined; (2) the migration law of soluble salt ions is explored.
Table 2. Soil properties.
IndexData
pH8.41
Total carbon18.34 g/kg
Total nitrogen1.23 g/kg
Organic matter28.52 g/kg
Available phosphorus8.53 mg/kg
Quick-acting potassium16.86 mg/kg
Cation exchange capacity2.21
Disclaimer/Publisher’s Note: The statements, opinions and data contained in all publications are solely those of the individual author(s) and contributor(s) and not of MDPI and/or the editor(s). MDPI and/or the editor(s) disclaim responsibility for any injury to people or property resulting from any ideas, methods, instructions or products referred to in the content.

