Article

Effect of Water Level Reduction on the Littoral Zone in Terms of Its Efficiency in Lake Protection

by
Agnieszka Ławniczak-Malińska
Department of Ecology and Environmental Protection, Poznan University of Life Sciences, Piątkowska 94C, 60-649 Poznań, Poland
Sustainability 2023, 15(6), 5563; https://doi.org/10.3390/su15065563
Submission received: 9 February 2023 / Revised: 8 March 2023 / Accepted: 10 March 2023 / Published: 22 March 2023

Abstract

:
Decreased water levels due to climate change cause many negative effects on lake ecosystems. The aim of this study was to (a) assess the effect of the reduction of water levels on nutrient availability in the sediment in the littoral zone; (b) evaluate the effect of changes in water level on biomass productivity and nutrient concentrations in the aboveground biomass of four emergent species: Phragmites australis (Cav.) Trin. ex Steud., Typha angustifolia L., Carex acutiformis L., Glyceria maxima (C. Hartm.) Holmb; and (c) assess the efficiency of the littoral zone in the reduction of nutrient pollution. The study hypothesis was that water level reduction has a positive effect on the plant biomass of high productive species. The study was carried out in the littoral zone of Tomickie Lake, situated in the western part of Poland. This lake is located in the protected area—the buffer zone of Wielkopolska National Park, and at the international level—Natura 2000. Six transects, perpendicular to the shoreline, were selected at two subzones—permanently and seasonally flooded. Analyses of nutrient concentrations in sediments and plant species were performed. The results show the higher productivity of reeds in the zone where water occurs seasonally at the site through the year, which reached 1193 g dry weight/m2. The decline of the water level may lead to the increased growth of highly productive species as emergent vegetation with a broad ecological scale in terms of nutrient concentrations and changes of water depth, i.e., Phragmites australis (Cav.) Trin. ex Steud. Species that prefer growth in the deeper part of the lake will be characterized by lower productivity, despite the high availability of nutrients. Changes in the availability of nutrients may cause the intensification of lake overgrowth by very productive species, which may affect biodiversity, which is particularly high in protected areas.

1. Introduction

In recent decades, we have faced intensive changes in meteorological conditions due to climate change [1,2,3,4]. The decreasing precipitation levels, occurrence of snowless winters, and episodes of intensive precipitation interspersed with long periods of drought cause the problem of decreasing amounts of water supplied to lake ecosystems [5,6]. Increasing temperature contributes to the intensification of evapotranspiration, combined with the increased escalation of algal blooms due to raised concentrations of nutrients in water. In many lakes, the occurrence of algal blooms has been observed from early spring until late autumn [7,8]. Moreover, this phenomenon has also been noted in recent years during winter time [9]. In addition, during summer, fish kills were observed in many lakes (USA, Australia, Poland) where drought has played a role as a catalyst for the advanced stage of eutrophication [10].
An improvement in hydrological conditions seems to be crucial to reduce the advanced process of eutrophication. Moreover, higher water levels will not reduce the amount of nutrients in lakes but only dilute these concentrations. Then, the reduction of the sources of nutrients supplied to lakes becomes crucial to reduce the effects of eutrophication [11,12] under an elevated shortage of water. Another problem can arise concerning the release of nutrients from the bottom of littoral zones [13].
Changes to the moisture conditions in littoral zones may cause modifications in the nutrient cycle. Many authors have noted the important role of littoral zones in nutrient cycling in lake ecosystems through the prevention of nutrient loading to the lake from the catchment areas or the seasonal uptake of nutrients from the lake [14,15,16,17]. It is a natural spawning place for fish and the habitat of macroinvertebrates. Associated with macrophytes, the periphyton is reported to be an effective filter of water [18,19]. Moreover, this zone can act as a significant source of nutrients due to the mineralization of organic material cumulating at the bottom [20]. The negative effect of the littoral zone is indicated in greenhouse gas emissions, particularly under anaerobic conditions, due to the accumulation of organic material and the reduction of water movement. However, this role can be insignificant compared to the amount of carbon accumulated in the littoral zone. Moreover, the changes of water levels may have a significant impact on plant species composition as well as on nutrient availability. Increased nutrient availability due to resuspension may cause an increase in plant biomass. Conversely, the reduction of water level may cause a reduction of biomass due to a shortage of water [21]. The impact of the reduction of water depth is crucial to determine the effect of the shortage of water on the development of the littoral zone and its efficiency in nutrient storage in plants’ biomass.
Biogeochemical processes that occur in the littoral zone are mostly dominated by the interaction between macrophytes and sediments [22,23]. This effect of macrophytes on sediments can have a direct or indirect character. Directly, macrophytes can improve water quality through their uptake of available nutrients and also by stimulating microorganism activity. Microorganism activity can be encouraged mostly by nitrogen concentrations through nitrification and denitrification [24,25]. An indirect effect can be observed through the reduction of water movement, which results in changes of physical parameters of water and sediments, affecting the efficiency of nutrient uptake by vegetation [26].
In the littoral zone of a high cover of vegetation, the external loading of nutrients and other mineral particles can be efficiently limited through uptake or sedimentation, respectively. Capacity of nutrient uptake by vegetation differs according to plant species, water level, and nutrient availability [26,27]. Although the impact of macrophytes has been studied for many years, the influence of water levels on the development of the littoral zone still is not well understood. Mostly, this zone is dominated by emergent macrophytes characterized by high productivity [28,29], which are relatively resistant to water level changes [30]. Moreover, the reduction of water levels may lead to faster succession of macrophytes to open water, causing lake overgrowing or succession of terrestrial species [31,32]. Therefore, the efficiency of the littoral zone in lake protection may change due to the intensification of variability in moisture or nutrient availability. This effect needs to be better understood.
The well-developed littoral zone is divided into parts. One is permanently exposed to the presence of water where changes of water level will not affect the sediment’s moisture. The second one, located close to the shoreline, can be seasonally dry and is often exposed to repeat fluctuations in water level. These differences have consequences for nutrient resorption efficiency [32,33] and may entail raised nutrient concentrations in sediment due to the mineralization process [20]. Additionally, analyses of the changes in nutrient concentrations and the determination of the nutrient storage capacity of different components of the littoral zone may support lake management strategies and the application of the most suitable method for lake restoration and reclamation, especially as the lakeshore habitats come under increased pressure and diverse human activity. Mostly, it is connected with recreational use (fishing, swimming) or houses being built close to the shoreline [34].
The aim of the study was to (a) assess the effect of reduction of the water level on nutrient availability in sediments in the littoral zone; (b) evaluate the effect of changes of water level on biomass and nutrient concentrations in the aboveground biomass of three emergent species; (c) assess the efficiency of the littoral zone in the reduction of nutrient pollutions in different moisture conditions. The consequences of water level reduction for nutrient concentrations in different components of the lake ecosystem are addressed.

2. Methods

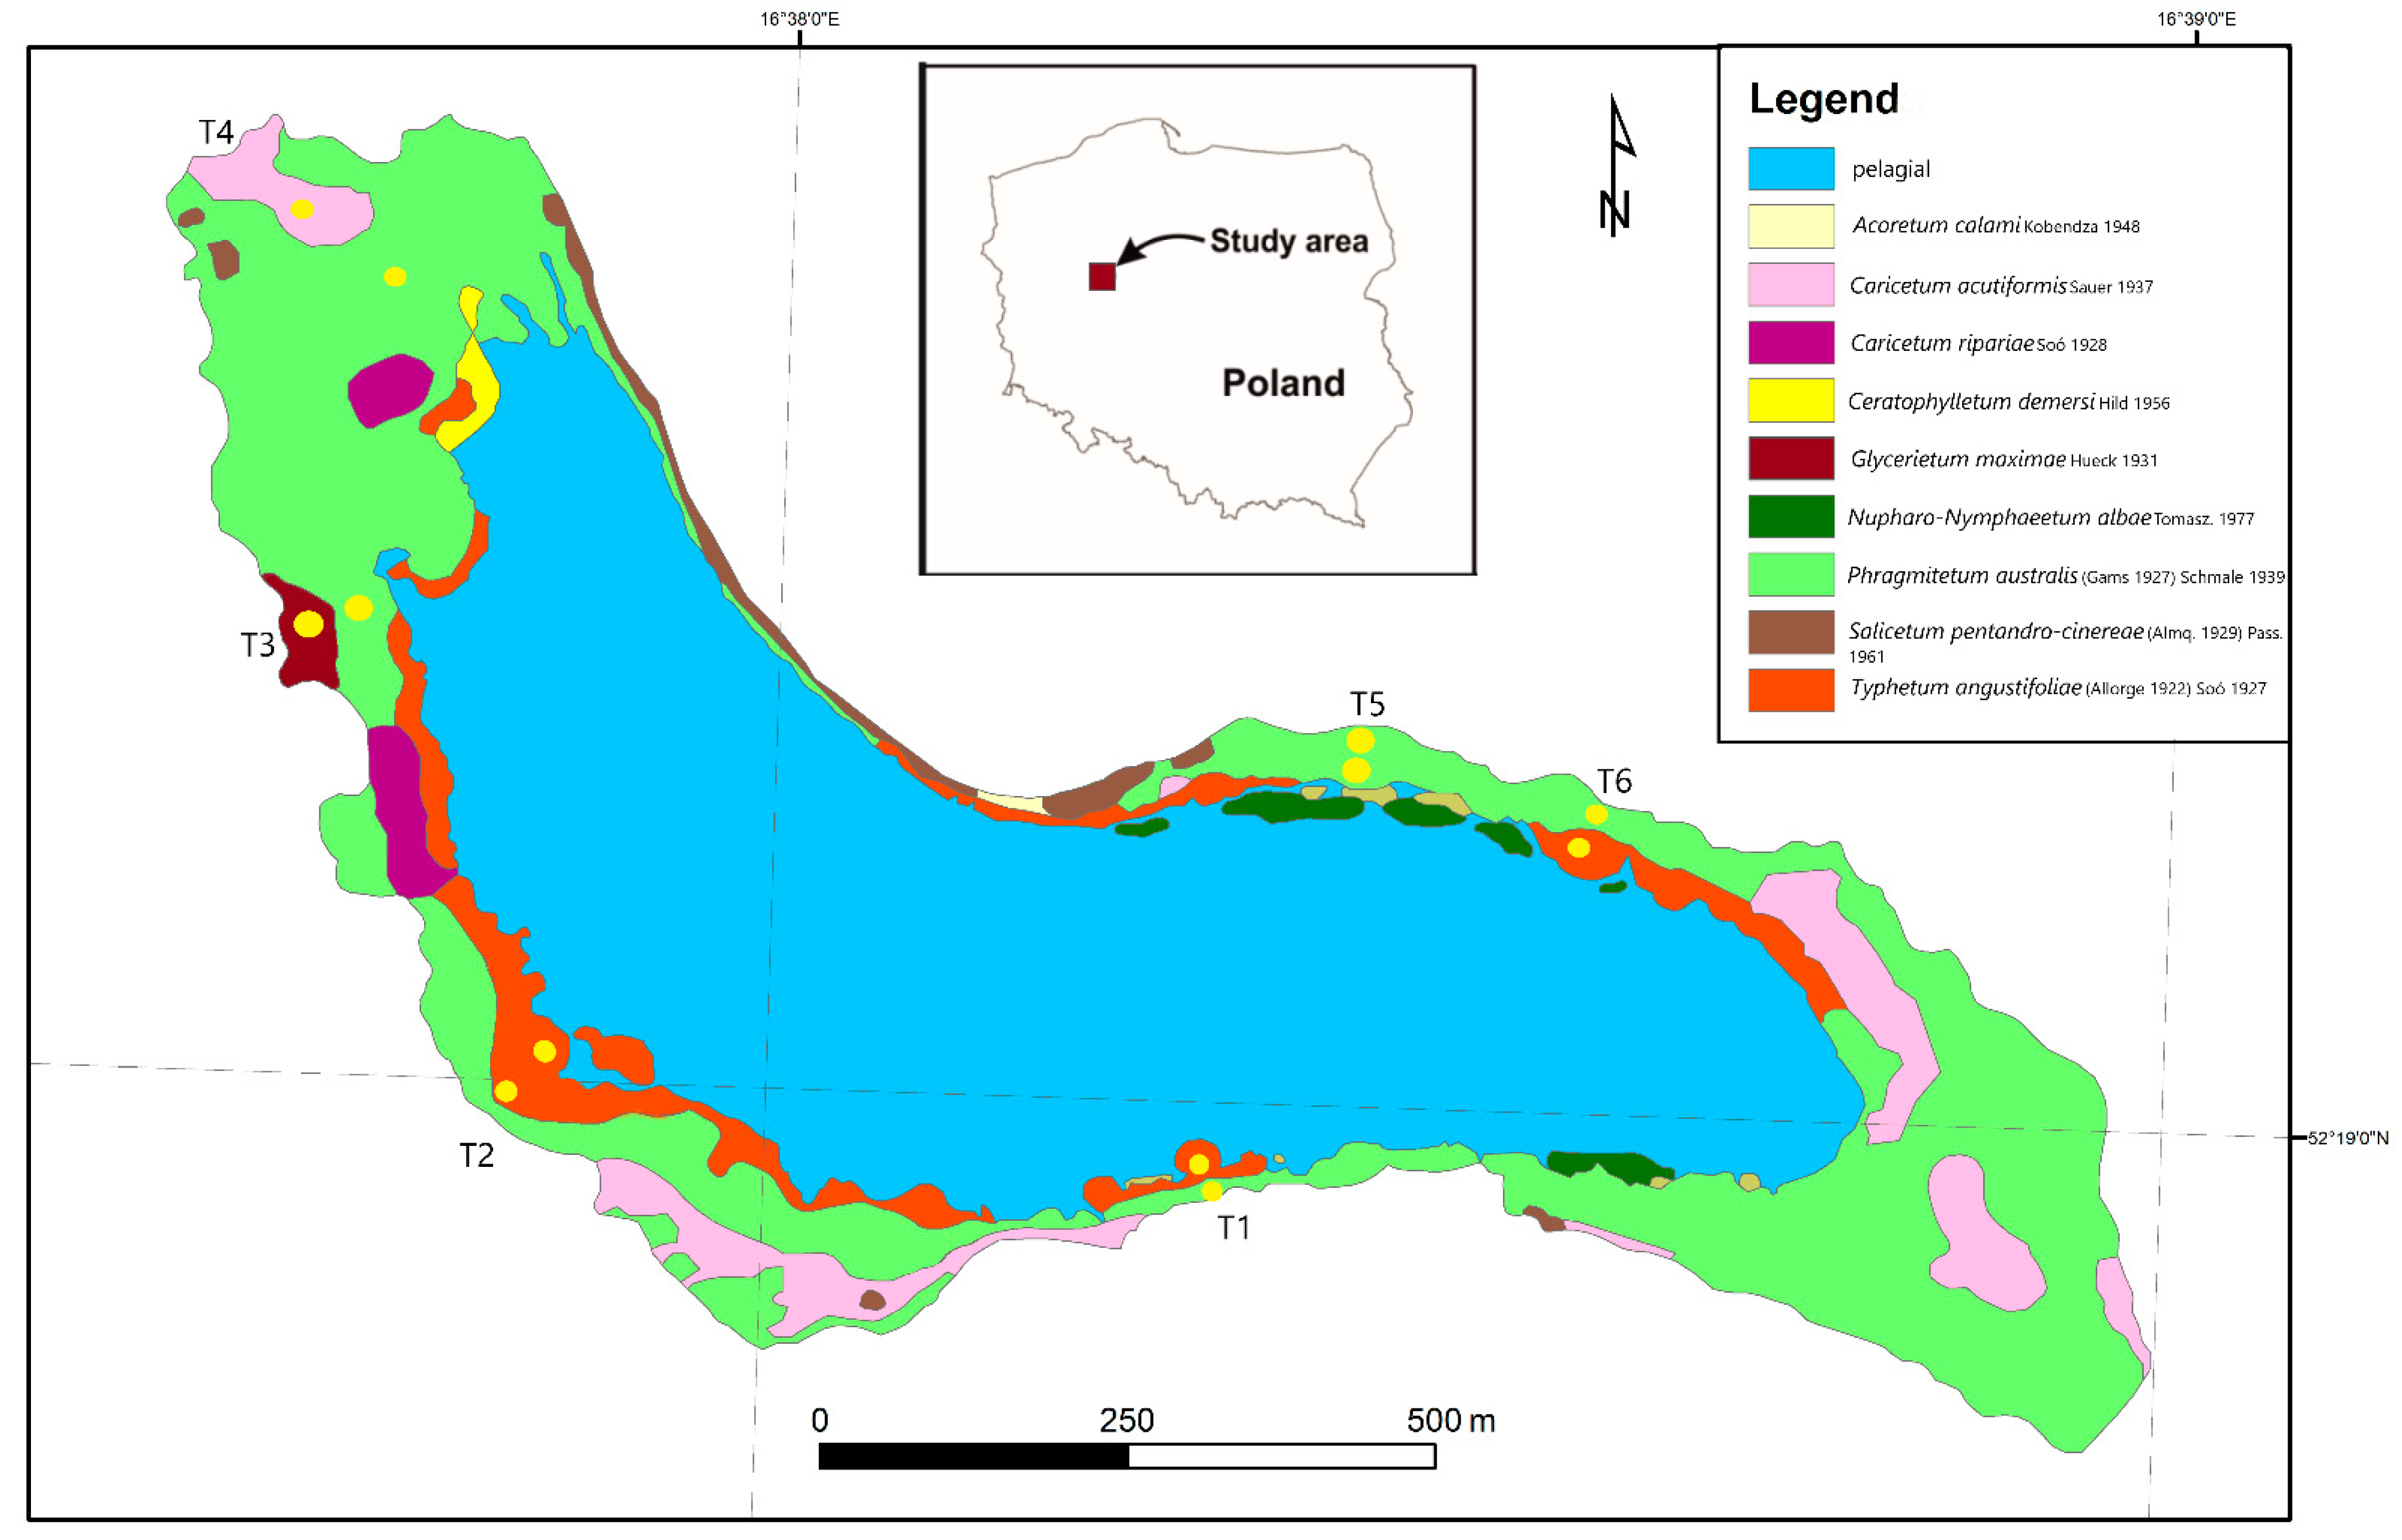
2.1. Site Description

The study was carried out in Tomickie Lake, which is located in the central western part of Poland (52°19′4.00″ N, 16°38′3.70″ E) in the buffer zone of the Wielkopolska National Park (Figure 1). Lake Tomickie is also protected at the international level, as part of two forms of nature conservation Natura 2000 sites: Ostoja Wielkopolska (special areas of conservation) and Ostoja Rogalińska (special protection area). This is a polymictic lake, with the average depth of 1.7 m, maximum 2.7 m, and surface area 36.0 ha. Water level in the lake is not regulated. However, discharge of the Samica Stęszewska River, which supplies water to the studied lake, is regulated at the outlet of Lake Niepruszewskie—the first lake in the course of the Samica Stęszewska River. Water from Lake Tomickie through Samica Stęszewska supplies two lakes located in the Wielkopolski National Park (Lakes Witobelskie and Łódzko-Dymaczewskie).
The water quality is characterized by intensive algal blooms, high nutrient concentrations, and low water transparency [35,36]. The highest water level is observed in March or April and systematically decreases until August. In 2020, annual amplitude of water level was 1.3 m. The littoral zone constitutes 34% of the lake area, with domination of Phragmites australis (Cav.) Trin. ex Steud. and Typha angustifolia L. Carex acutiformis L. occurred in the shallow part of the lake, covering 12% of the littoral zone. Share of Glyceria maxima (C. Hartm.) Holmb. was less significant and accounted for 0.5% of the littoral.
The climate in the studied area is warm summer humid continental [37] with influence of polar front, leading to changeable weather and low annual sum of precipitation (550 mm per year) [38]. An average temperature is above 19 °C during the warmest months (June–August), and the coldest month average is below −1°C (December–February). In recent years, an increase in evaporation, increasingly frequent periods with small precipitation amount, snowless winters, and extension of the growing season have been observed [39].

2.2. Field and Laboratory Procedures

The study was carried out in the well-developed parts of the littoral zones, where six transects were selected (Figure 1). Each transects was based on two sampling areas (sites) located in the two subzones: the permanently flooded part where surface water was present throughout the year (located around 2/3 width from the shoreline—called site 1), and the second part, situated closer to the shoreline, exposed to the lowering of water level, dry during summer time (around 1/3 width from the shoreline—called site 2). At each sampling site, sediment and plant material were collected monthly from March/April to September. Four species representing emergent macrophytes were selected: Phragmites australis (Cav.) Trin. ex Steud. (common reed), Typha angustifolia L. (narrowleaf cattail), Carex acutiformis L. (lesser pond sedge), Glyceria maxima (C. Hartm.) Holmb. (reed sweet grass). Additionally, sites without vegetation were analyzed. At each sampling area, seven plots of 1 m2 were selected and marked permanently with plastic sticks and strips. Each plot consisted of four subplots. Sites with vegetation were selected within the dominant species. Sediment samples from the shallow part were collected by hand with a 7 cm diameter Edelman corer, and from the deeper littoral zone from a boat with a 7 cm diameter Czapla corer. Each core was collected from the 5–10 cm sediment layer. Water levels in experimental sites were measured monthly.
The aboveground biomass of littoral vegetation for each community type was measured by harvesting at ground level three randomly placed subplots (each 50 × 50 cm) within each strip. Assessments were undertaken monthly from March or April (depending on the intensity of plant growth) to September 2016. After harvest, the plants were washed carefully in tap water to clean them of periphyton. Each sample of plant material was divided into two parts, living and dead fractions, placed into labelled paper bags, dried for until weight has stabilized (for approximately 48 h) at 70 °C and weighed. Nitrogen and phosphorus concentrations in plant material were determined in the diluted digested material. The N and P concentrations in plants were measured colorimetrically using Srecord 40, and K concentration with flame emission spectroscopy, using Sherwood Model 425.
Collected sediment samples were dried, ground, and sieved using a sieve with 0.2 mm mesh size. For further nutrient determinations, sediments were digested with the Kjeldahl procedure [40]. Analyses of total nitrogen and available phosphorus were conducted colorimetrically on a Srecord 40, and potassium concentrations using a Sherwood Model 425 flame emission spectroscope).

2.3. Statistical Analyses

Statistical analyses were performed using Statistica (StatSoft, Poland) software (licence Poznan University of Life Sciences).
In order to determine the significance of the differences of biomass productivity and nutrient concentrations in the sediments and plant material, two-way analyses of variance (ANOVA) were applied. Before the analyses, the normality of data and variances of groups were checked in order to use suitable transformation (ln, square). Principal component analysis (PCA) was applied to check the differences between the analyzed species in relation to physicochemical parameters of sediment and water depth. Canocco software was used to test the effect of water level and nutrient availability in sediments on plant biomass and nutrient concentrations in aboveground biomass using Canonical Correspondence Analysis (CCA). To investigate the statistical significance the effects of environmental variables (nutrient concentrations in sediments, water depth) on plant response parameters (biomass, nutrient concentration in plant tissues) under two moisture conditions (permanently and seasonally flooded), a Monte Carlo permutation test was applied.

3. Results

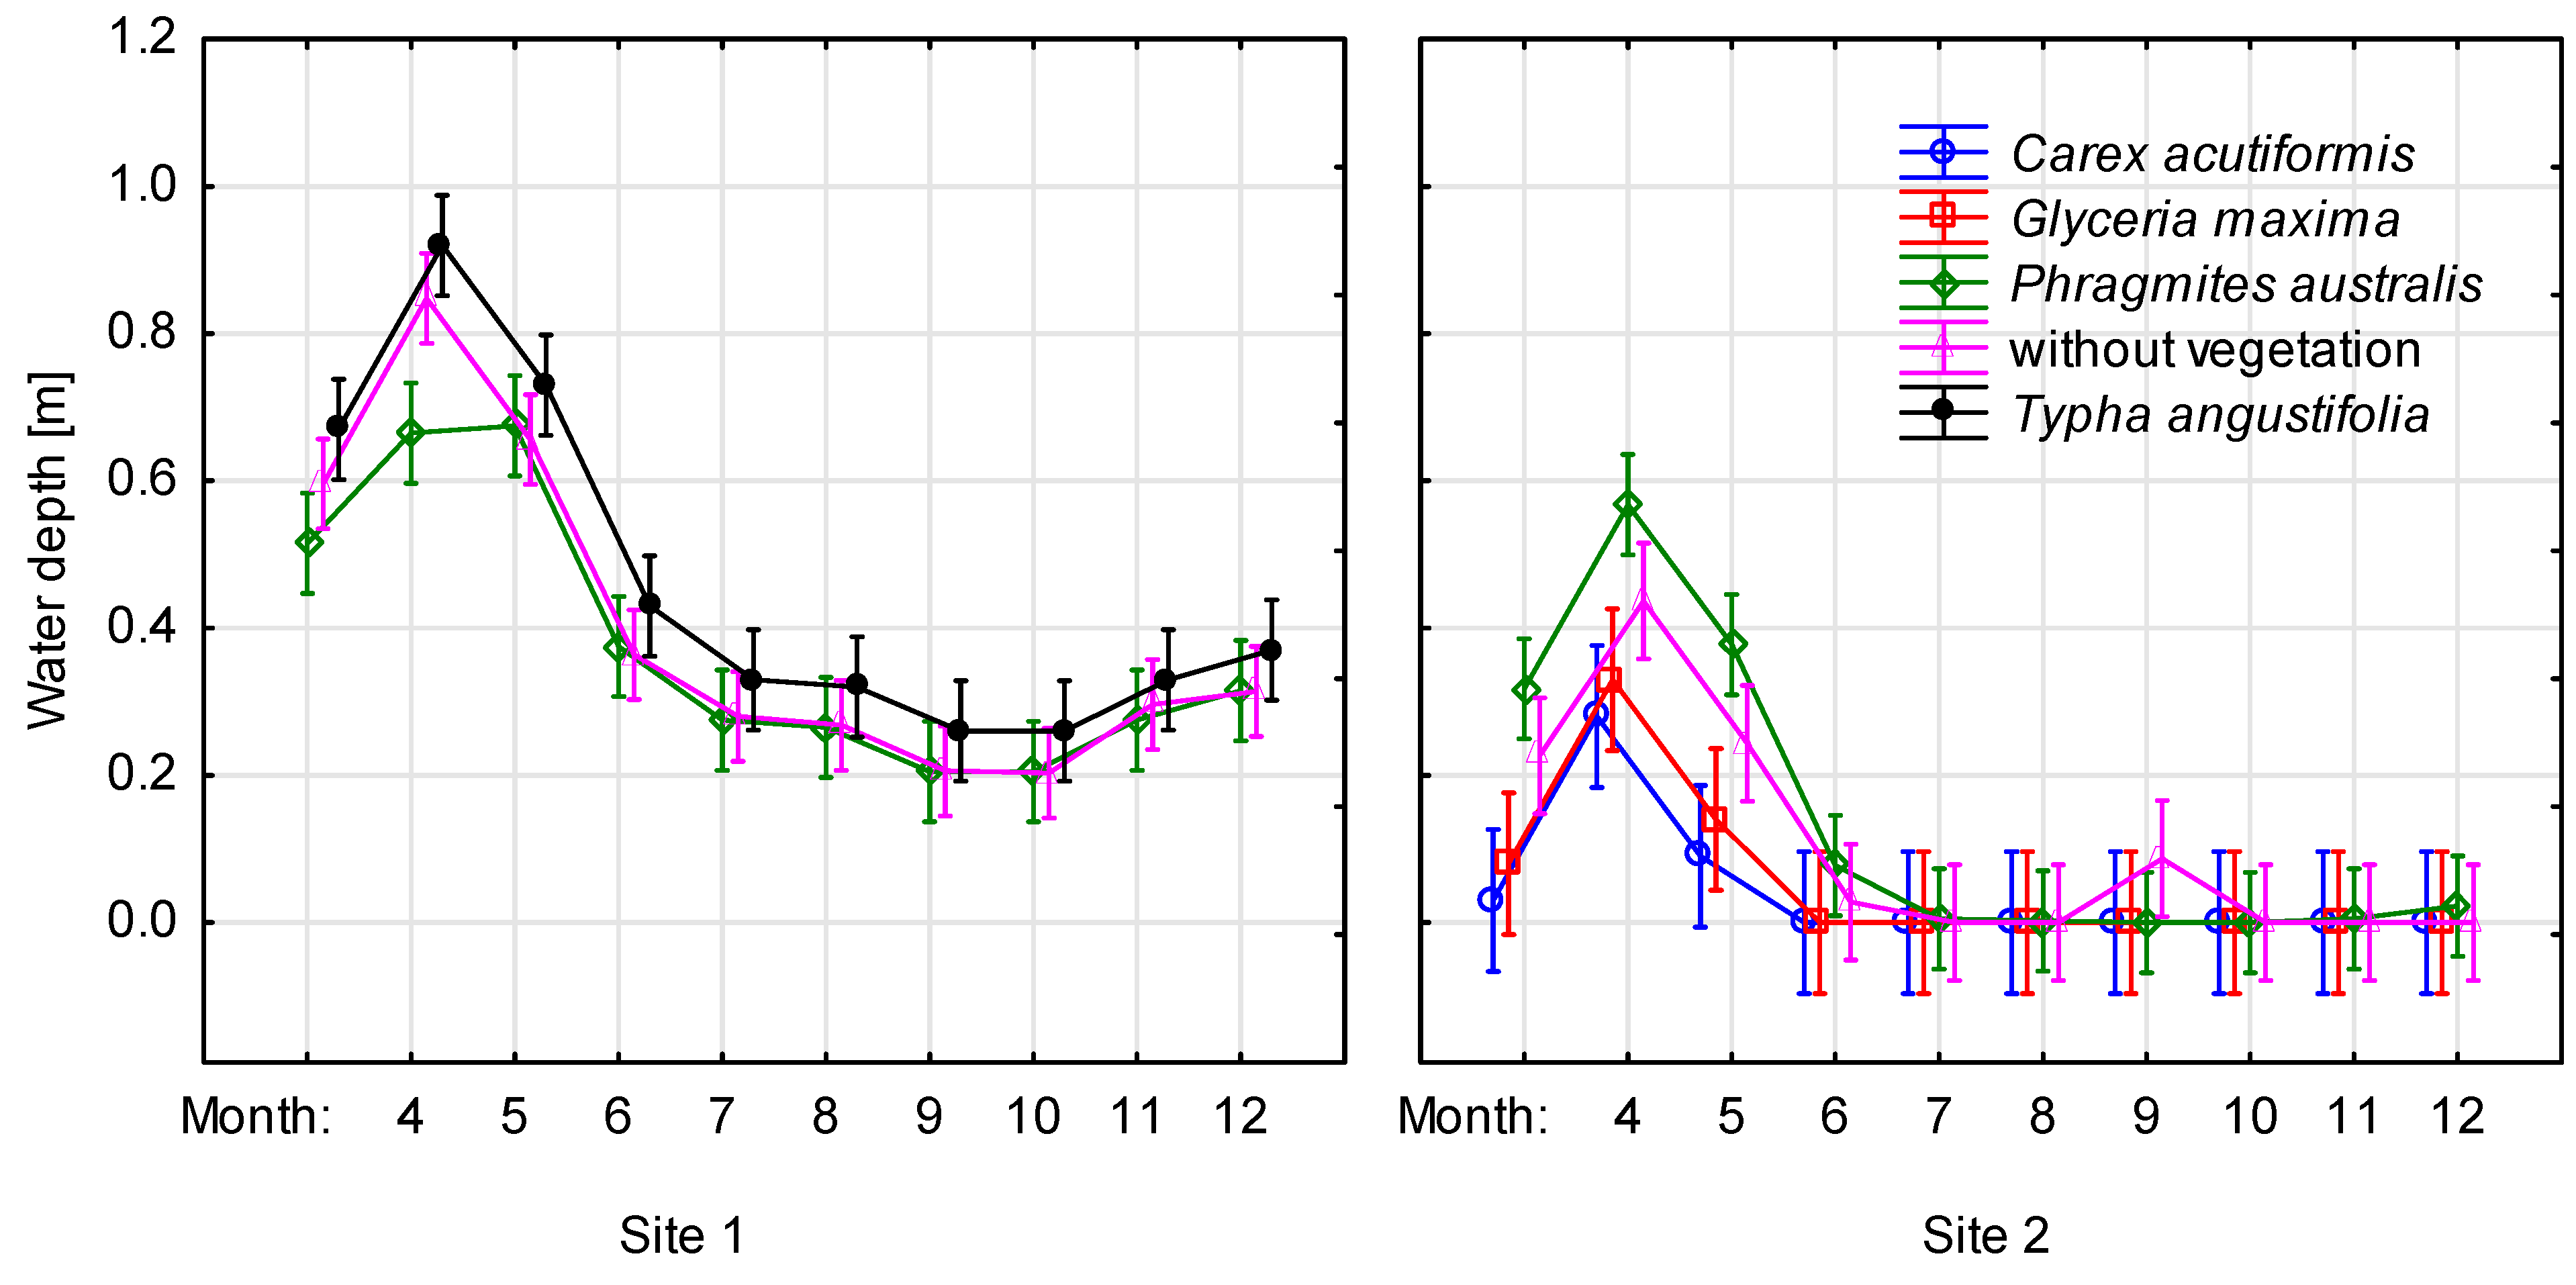
3.1. Changes of Water Level in the: Littoral Zone

Analyses of water level fluctuations in Lake Tomickie showed a 1.0 m difference between the maximum and minimum levels during a year. Permanently flooded sites were characterized by average water depth of 0.72 m in April and 0.2 m in August. Amplitude of average water level was similar at the periodically flooded sites; moreover, water depth was the highest during spring time (0.27 m) and became dry during summer time (VI-IX) (Figure 2). Differences between these sites analyzed monthly were statistically significant (F = 39.86, p < 0.000).

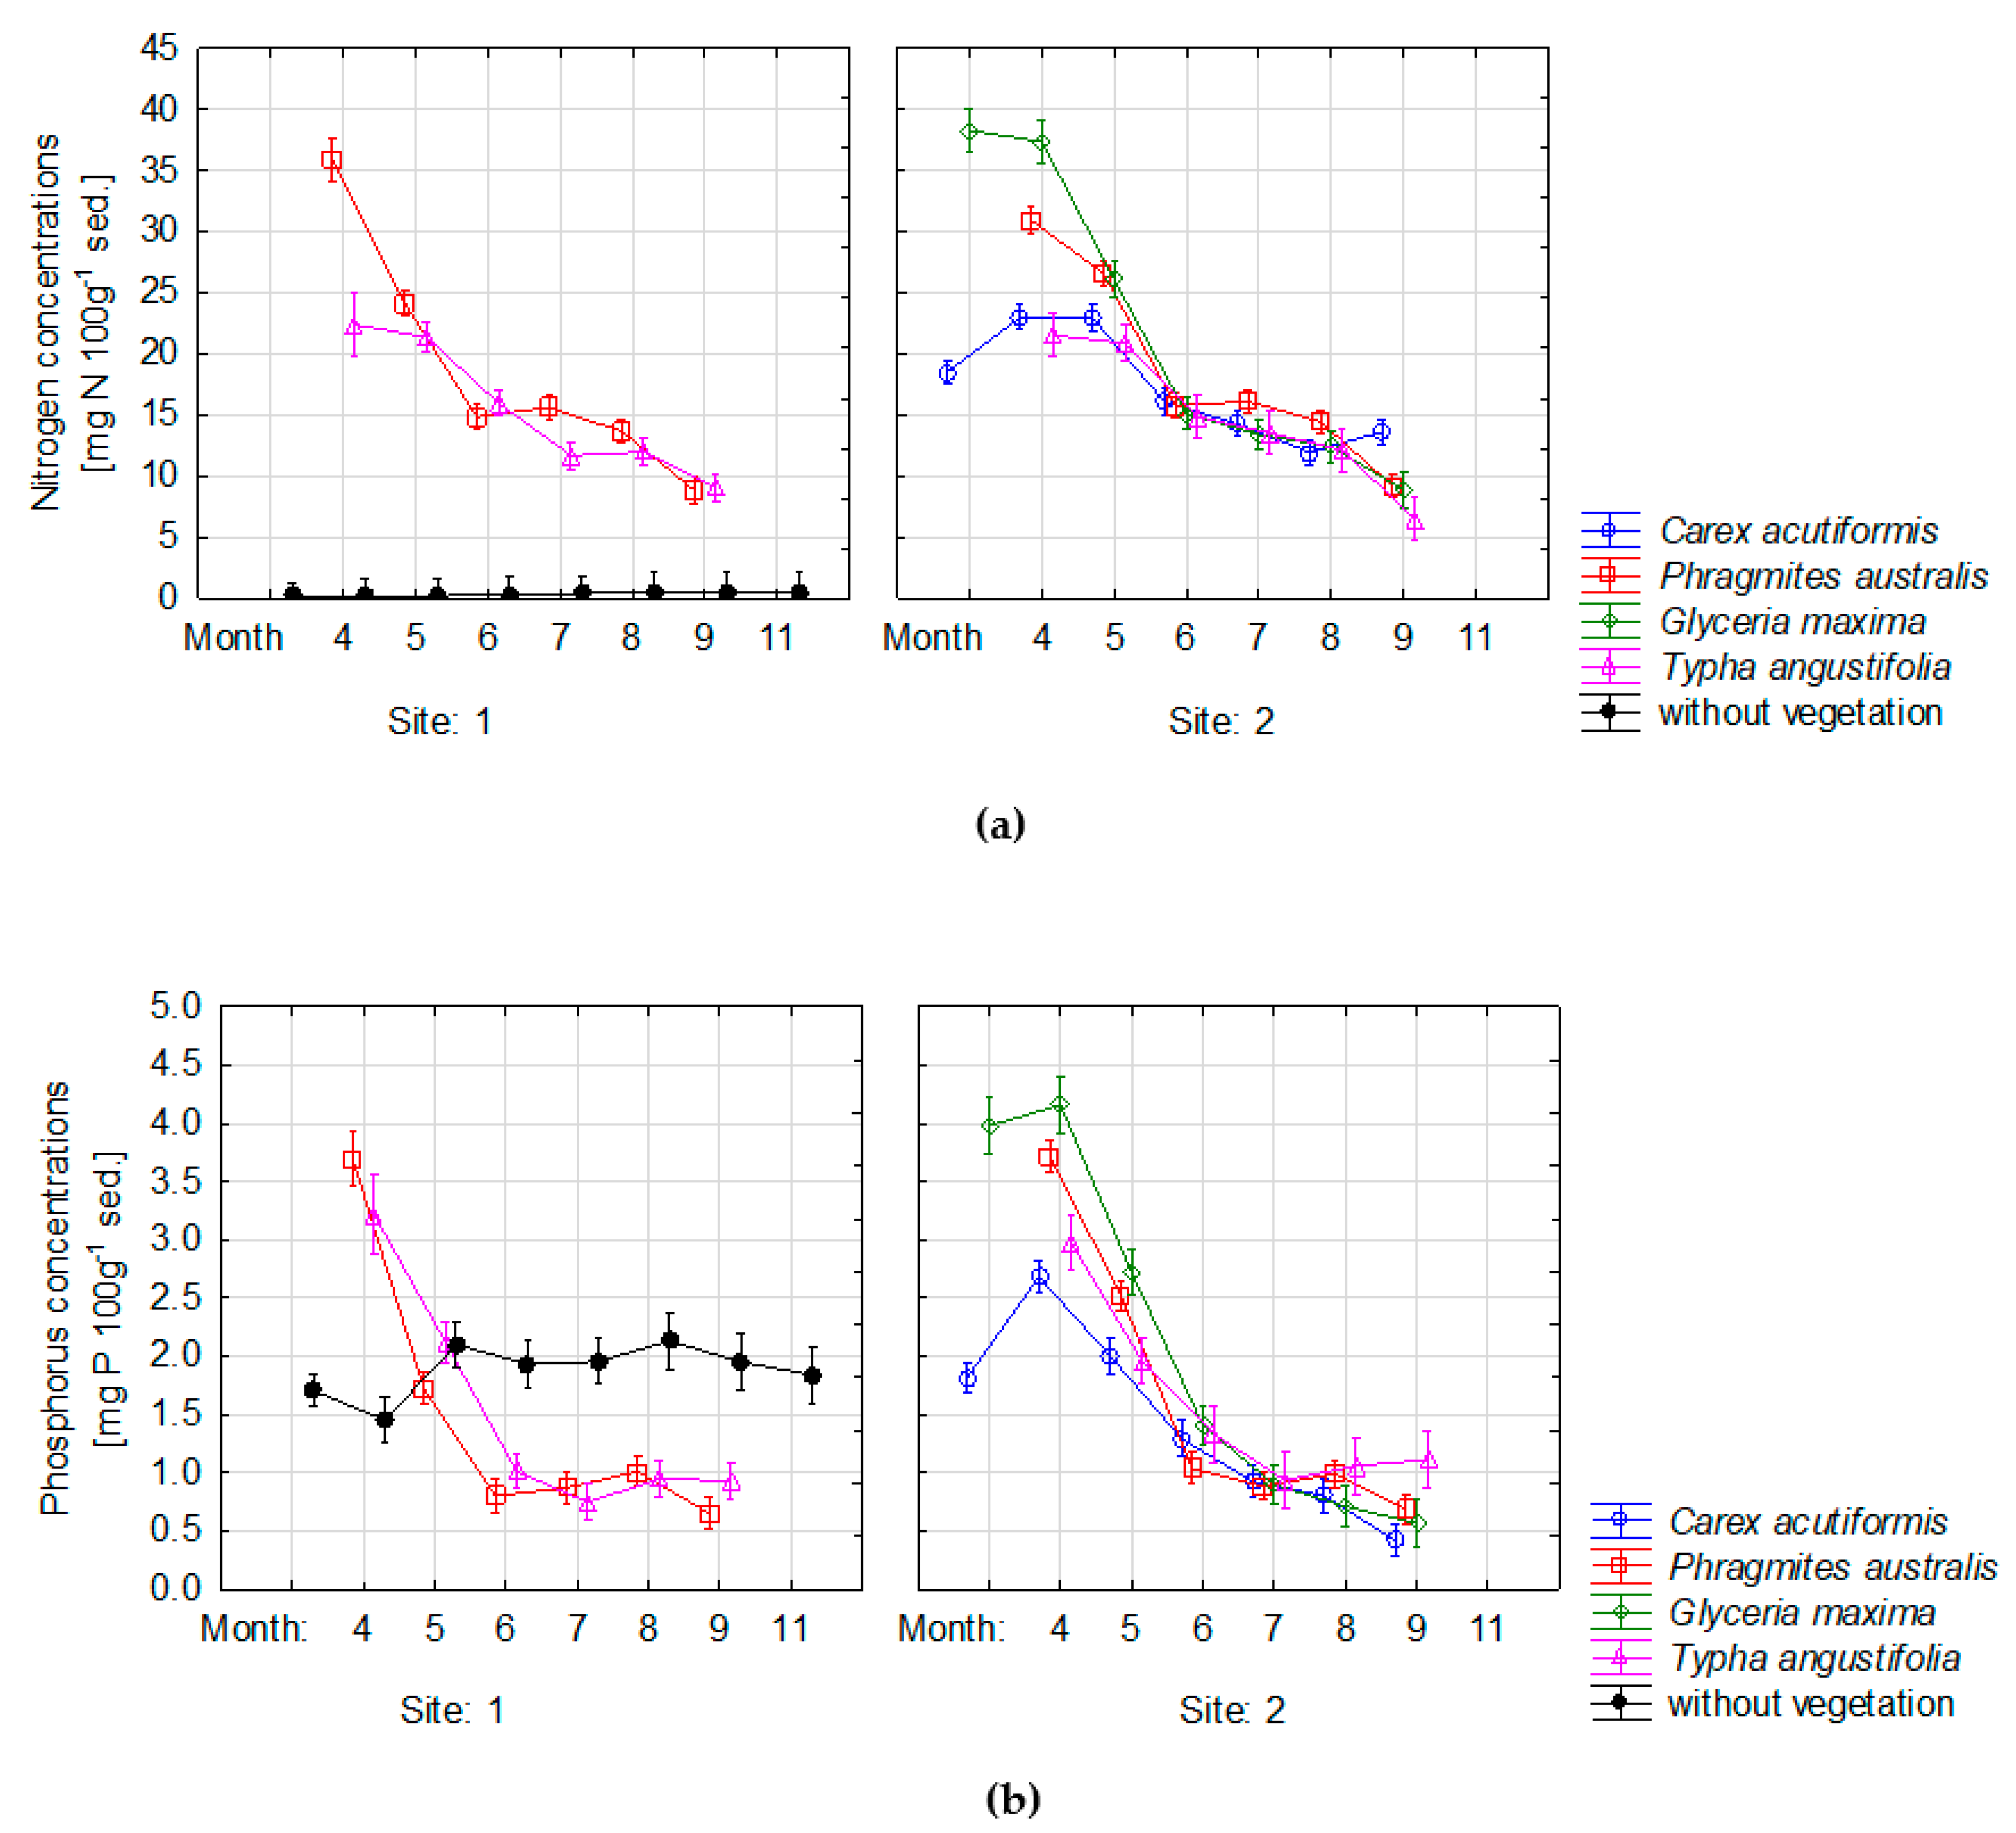
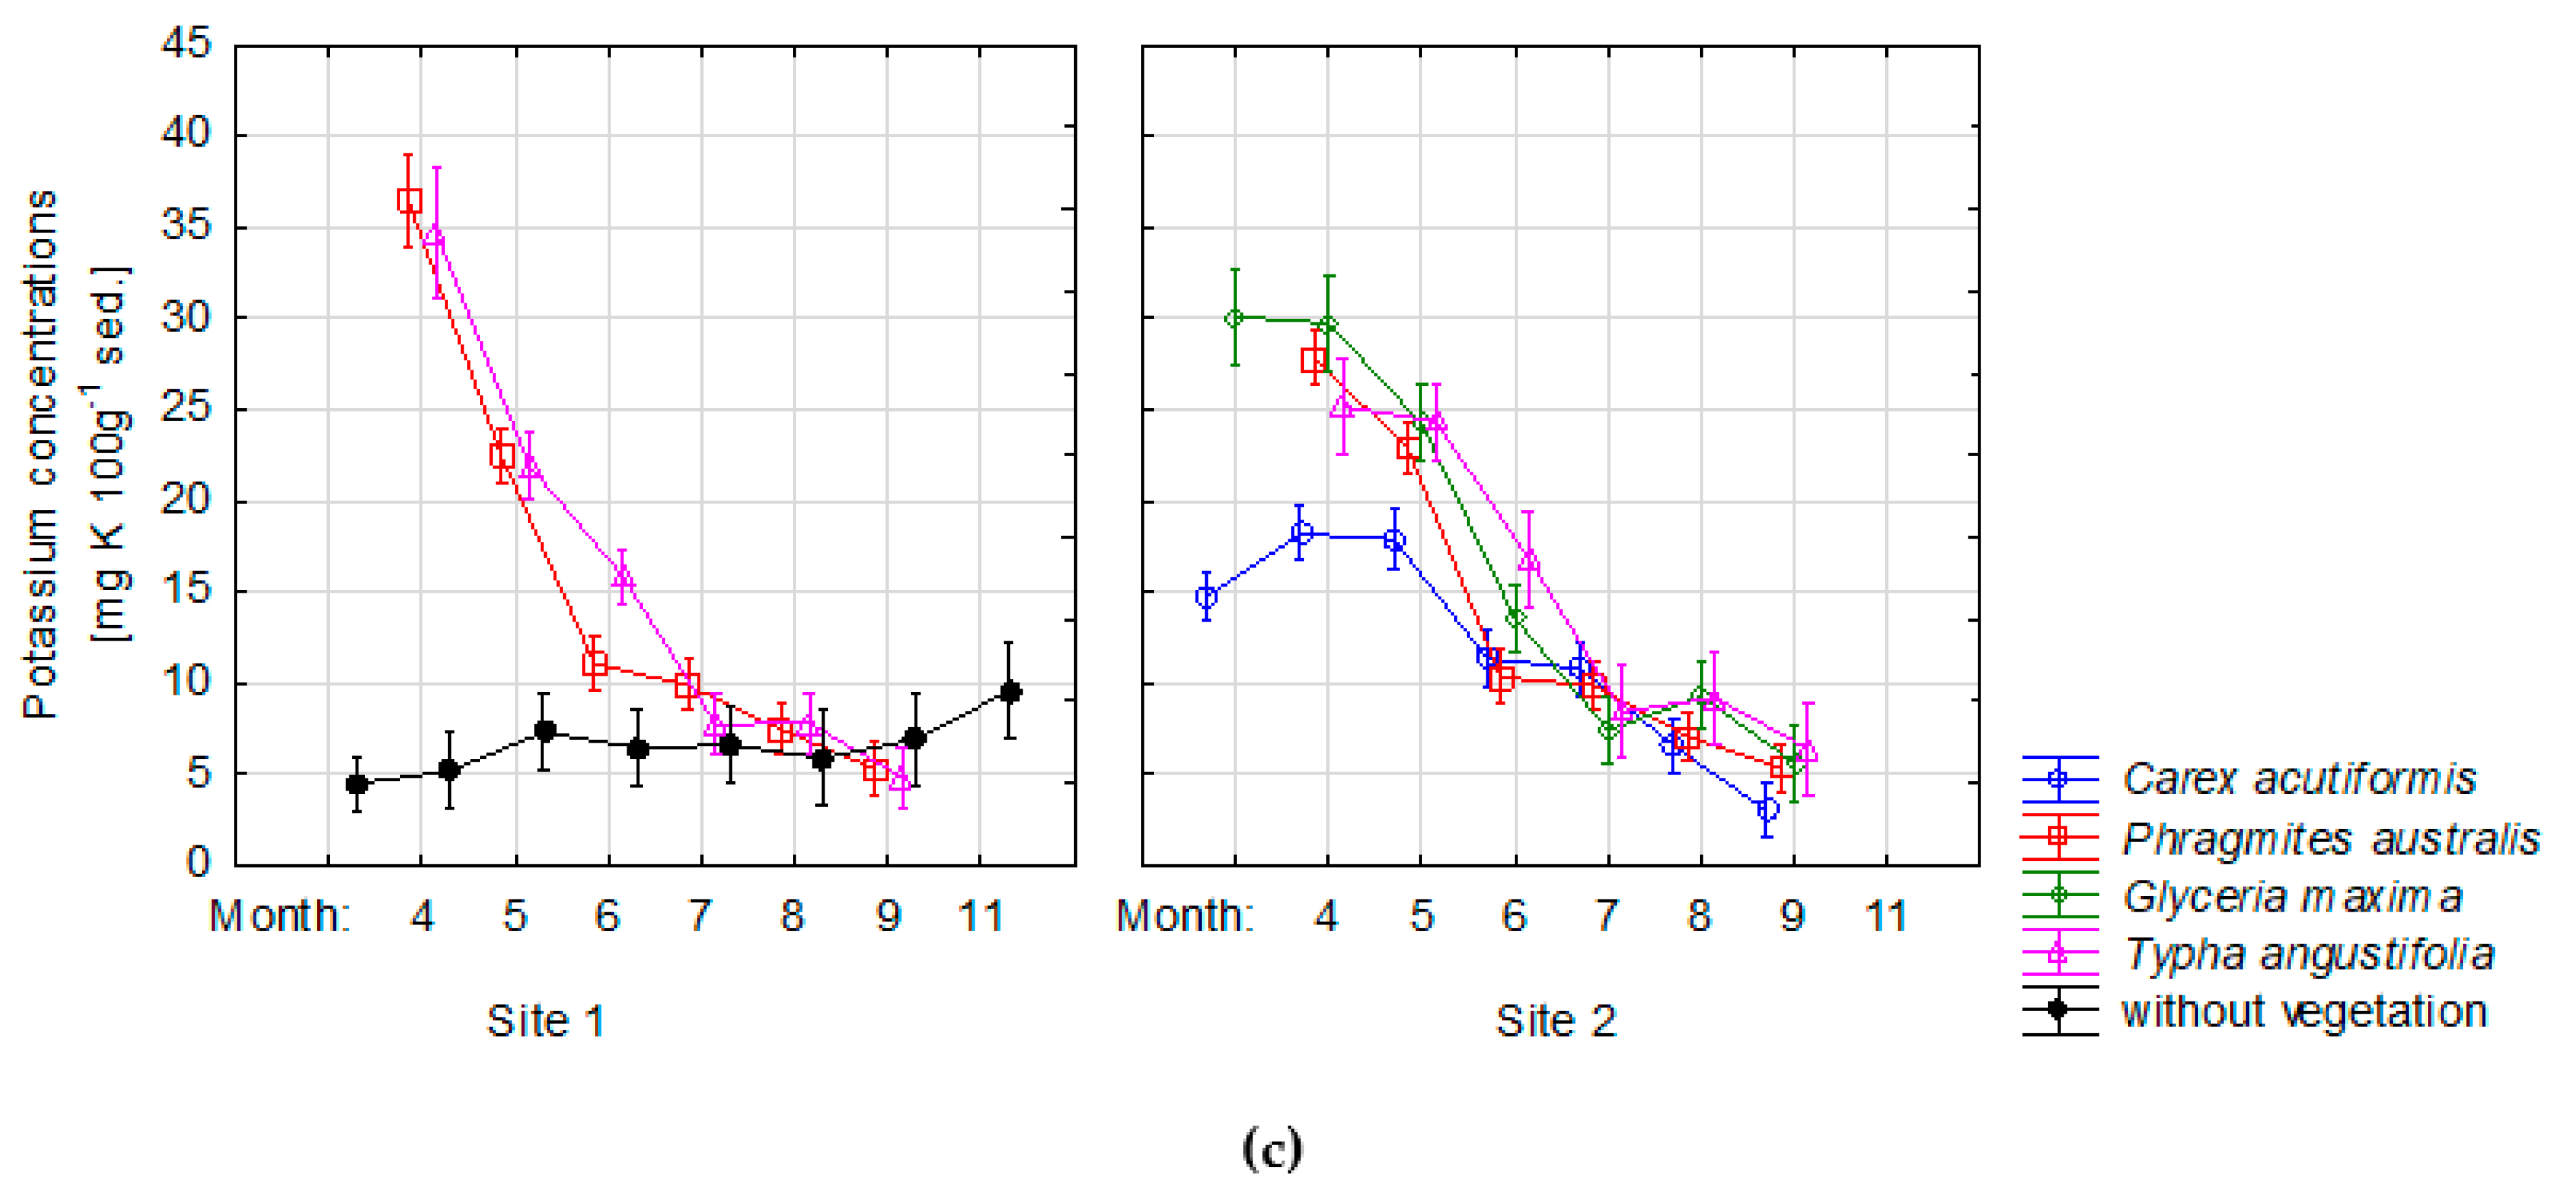
3.2. Changes of Nutrient Concentrations in Sediments

Nitrogen concentrations in the sediment varied from 5.25 mg N/100 g to 40.64 mg N/100 g sediment among studied species and sites during the vegetation season (Figure 3a, Table 1). The highest concentrations of the analyzed nutrients were observed during spring time, in March or April, and the concentrations decreased during the vegetation season. At the site without vegetation, the concentration of nitrogen was low and did not show significant differences during the analyzed period. More variations were observed with respect to phosphorus and potassium concentrations. Phosphorus concentrations in the sediment at the site without vegetation varied from 0.94 to 2.58 mg/100 g sediment (Figure 3b, Table 1). The highest concentrations were measured in the site with Glyceria maxima. The greatest variations of nitrogen and phosphorus were observed in the seasonally flooded subzones, particularly covered by Phragmites australis and Typha angustifolia.
The highest values of potassium were detected in the site permanently flooded covered by Phragmites and Typha, reaching an average of 38.9 mg K/100 g and 34.7 mg K/100 g, respectively (Figure 3c, Table 1). Reductions of N and P concentrations at both sites, and potassium in the permanently flooded site, were the most significant at the beginning of the vegetation season, including for reeds and narrow leaf cattail.

3.3. Variations of Nutrient Concentration in Sediment and Water Depth between Analyzed Sites

The principal component analysis (PCA) of the measured nutrient concentrations in sediments and water depth showed significant differences between the sites studied in Lake Tomickie (Figure 4). The first two axes were significant, and together accounted for 84.48% of the variation in the nutrient concentrations and water depth. The first principal axis accounted for 52.33% of the variation in and was negatively correlated with N (r = −0.79), P (r = −0.90), and K (r = −0.91). The second principal axis accounted for an additional 32.15% of the variation in sediment quality and water depth and was positively correlated with water depth (r = 0.85). Typha angustifolia was mostly correlated with water depth and P concentrations. Phragmites australis prefers sites with higher N and K concentrations. Glyceria maxima and Carex acutiformis prefer sites with a lower water level.

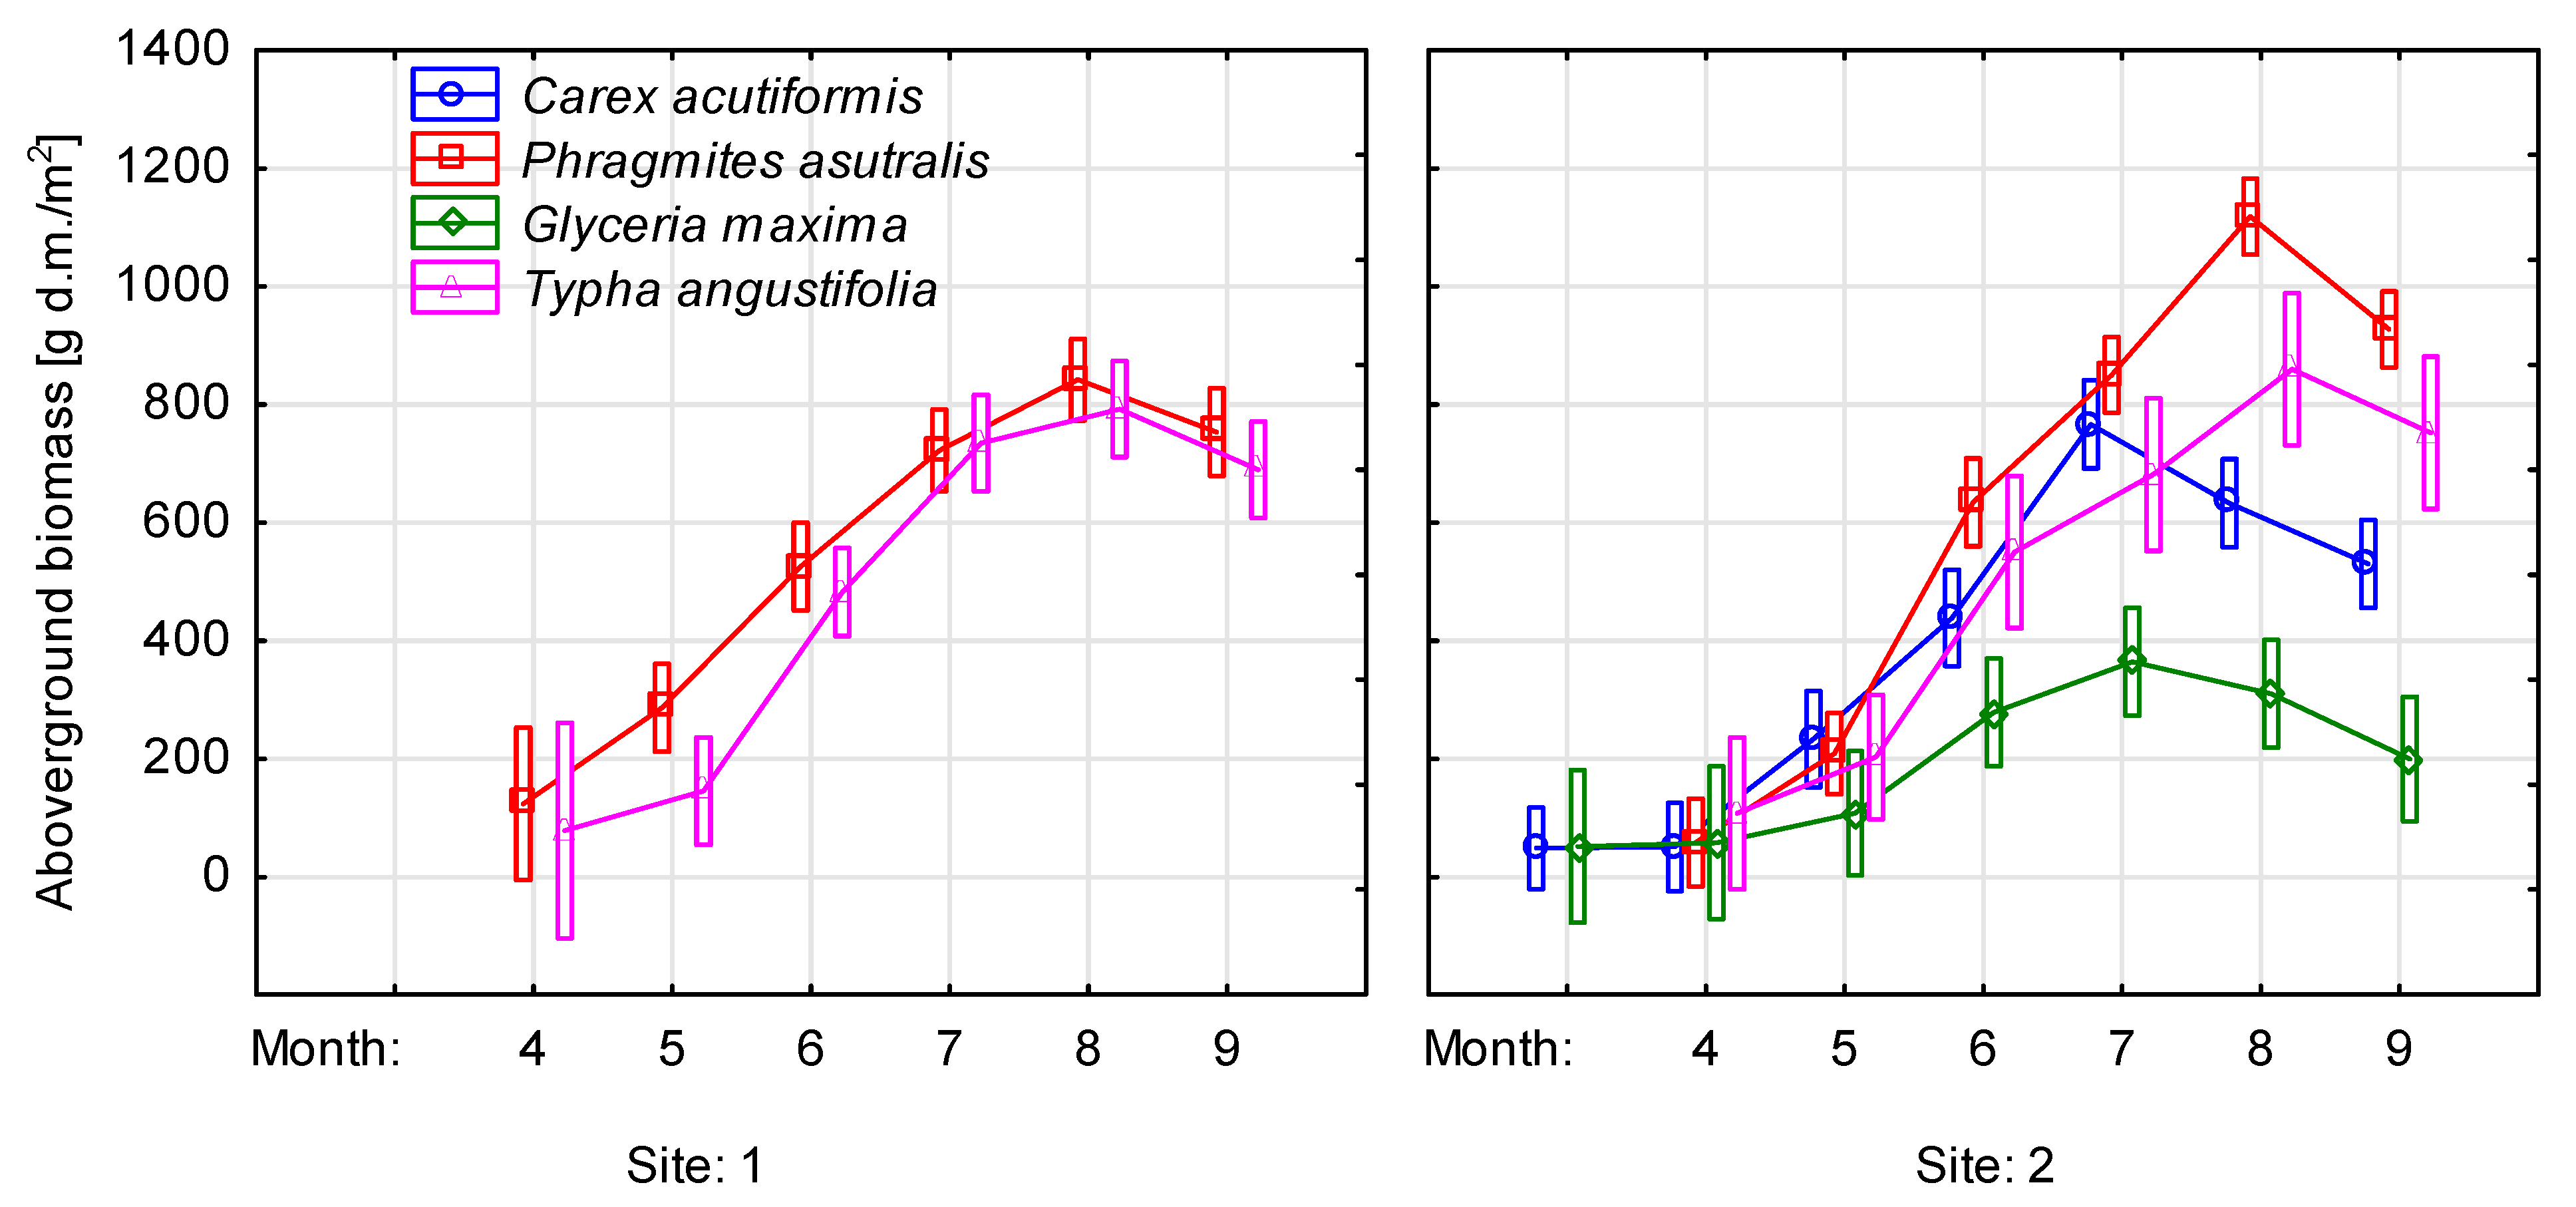
3.4. Plant Productivity

The average aboveground biomass of four tested emerged macropytes varied from 364 to 1193 g dry mass/m2 at peak standing stock (Figure 5). The highest biomass of Phragmites and Typha was observed in August. Carex acutiformis and Glyceria maxima showed the maximum growth in July. Phragmites australis showed the highest aboveground biomass productivity at the seasonally flooded site (average 1193 g d.m./m2), which was by 354 g d.m./m2 higher compared to that at the permanently flooded ones. These differences between seasonally and permanently flooded sites dominated by reeds were statistically significant (Table 1). The aboveground biomass measured for Glyceria maxima was low (340 g dry mass/m2 at peak standing stock). Carex acutiformis productivity was twice higher than Glyceria and reached 766 g dry mass/m2 at peak standing stock. These results were comparable to the productivity of reeds in July; however, Phragmites still showed further growth in time. Carex and Glyceria growth were observed in March, while the growth of Phragmites and Typha started in April. Moreover, the most significant growth was observed for Carex species in the beginning of the vegetation season.

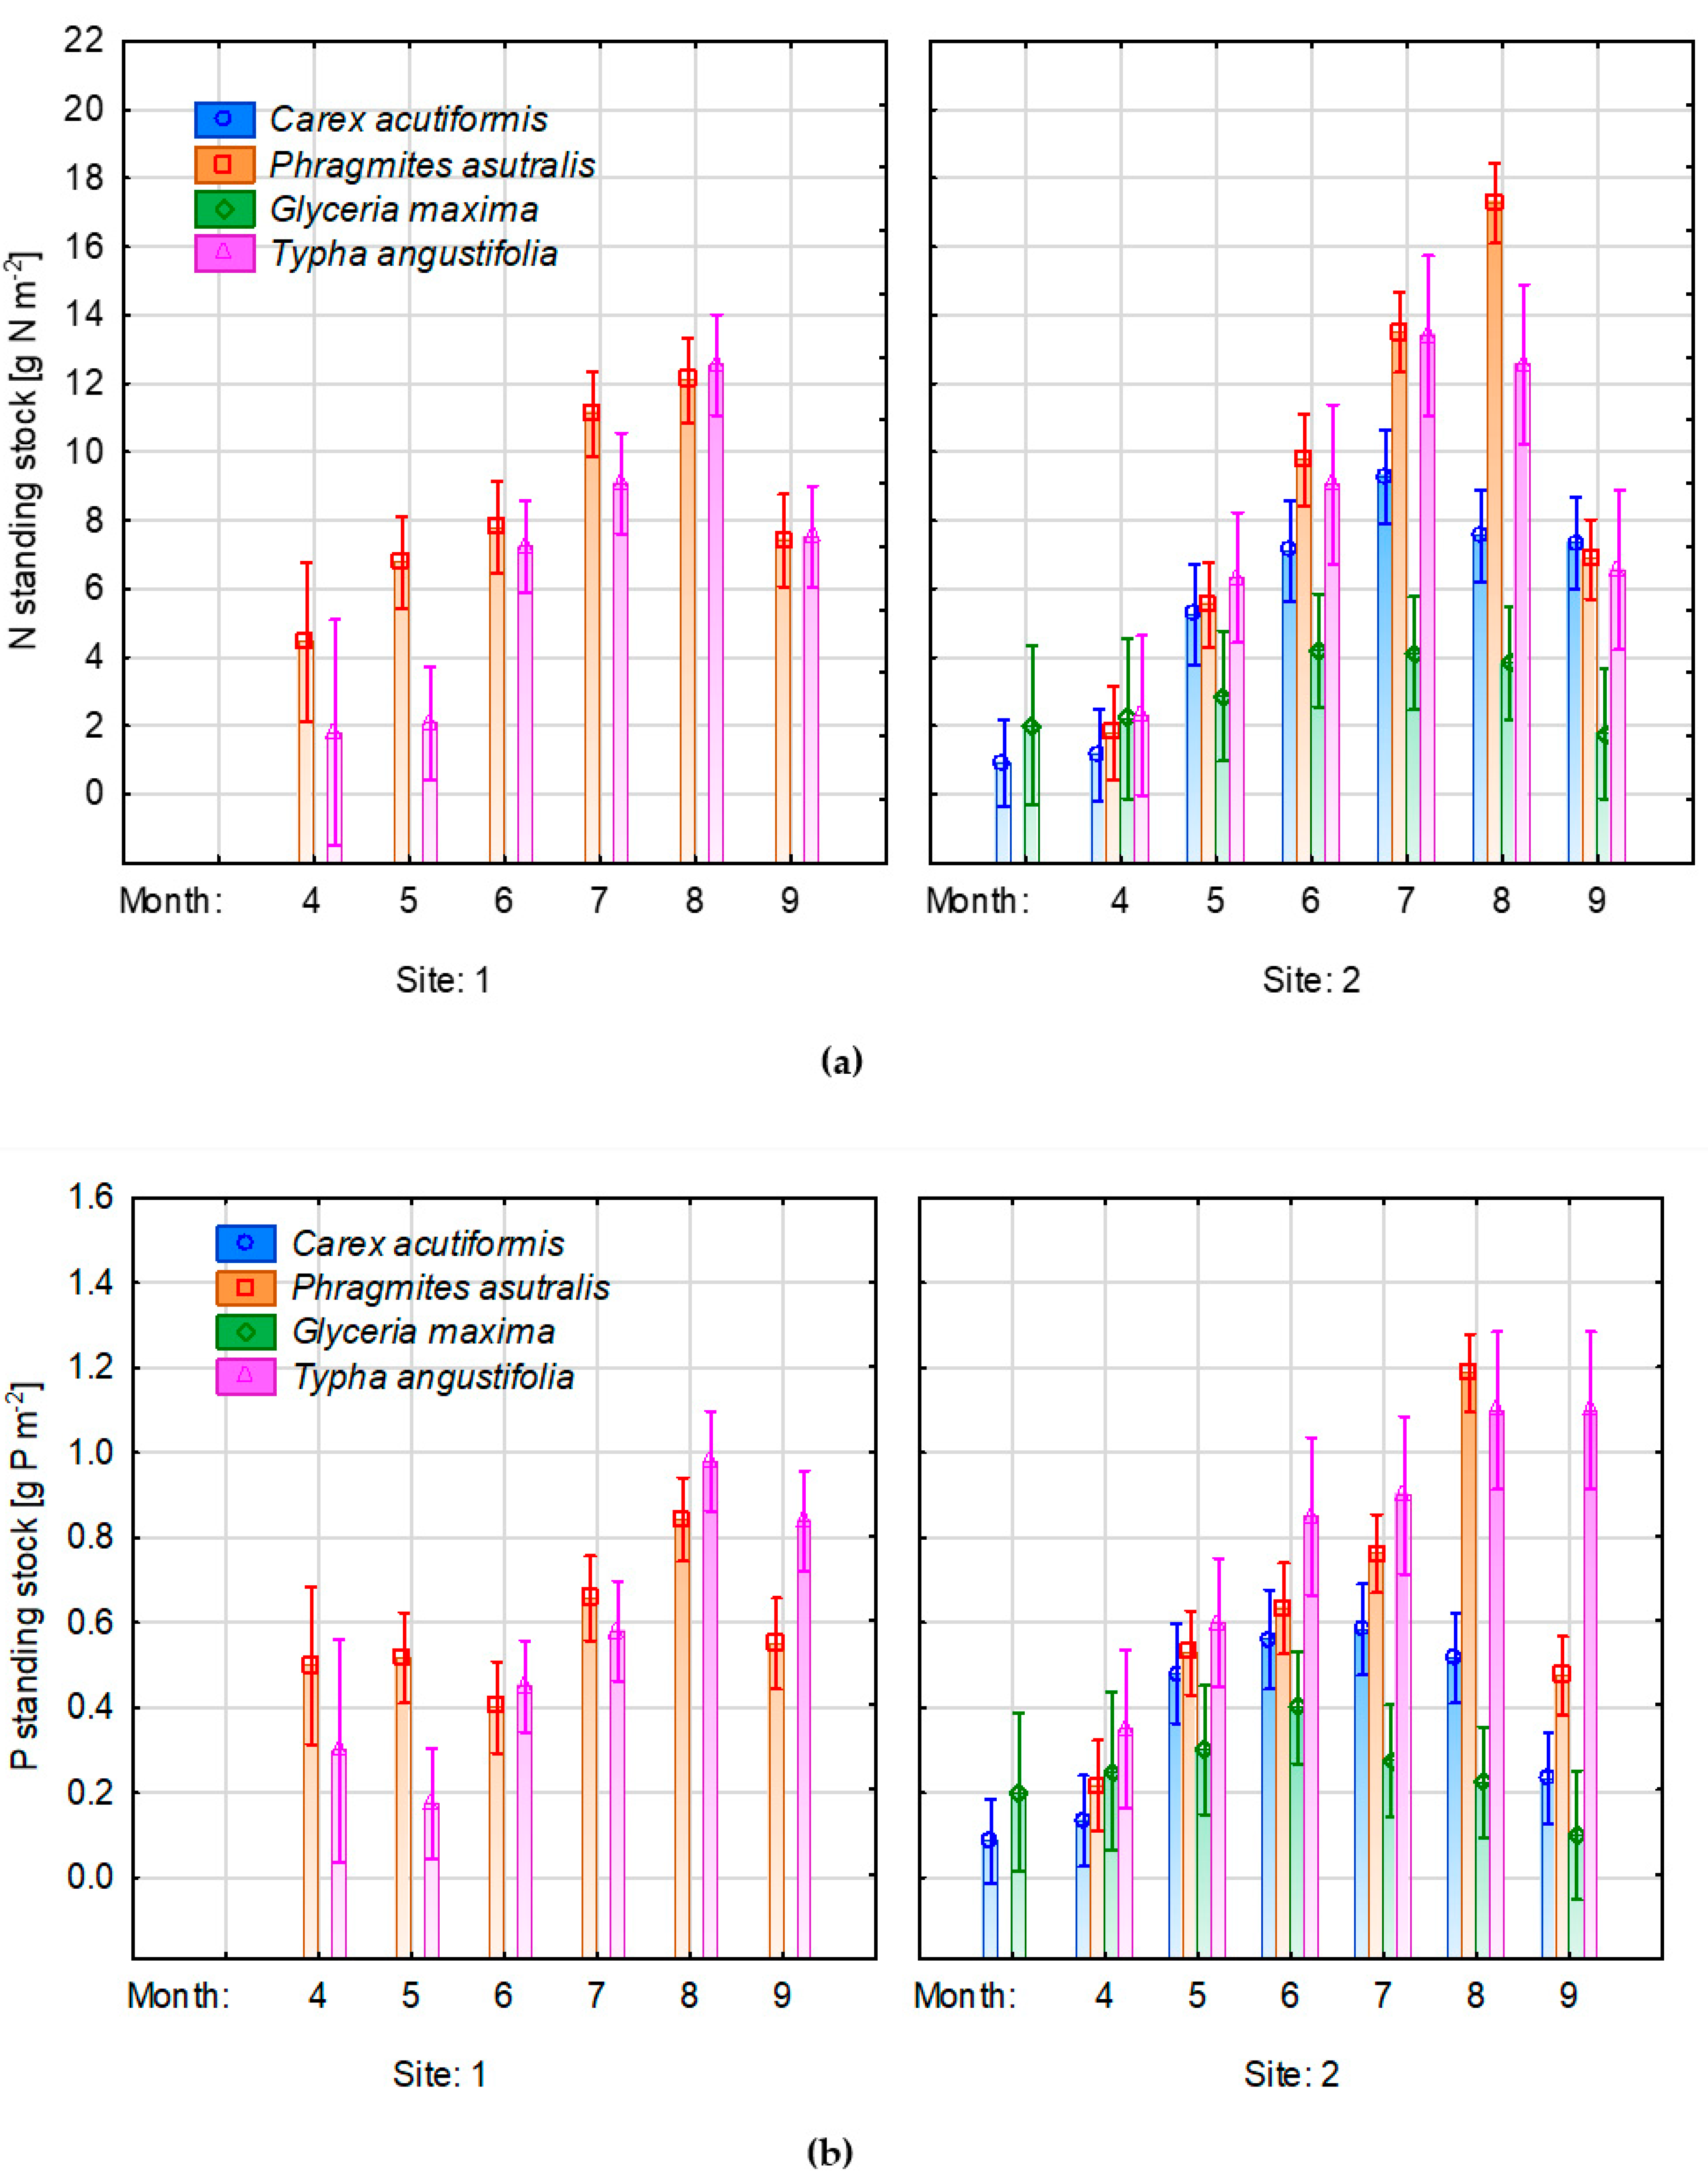
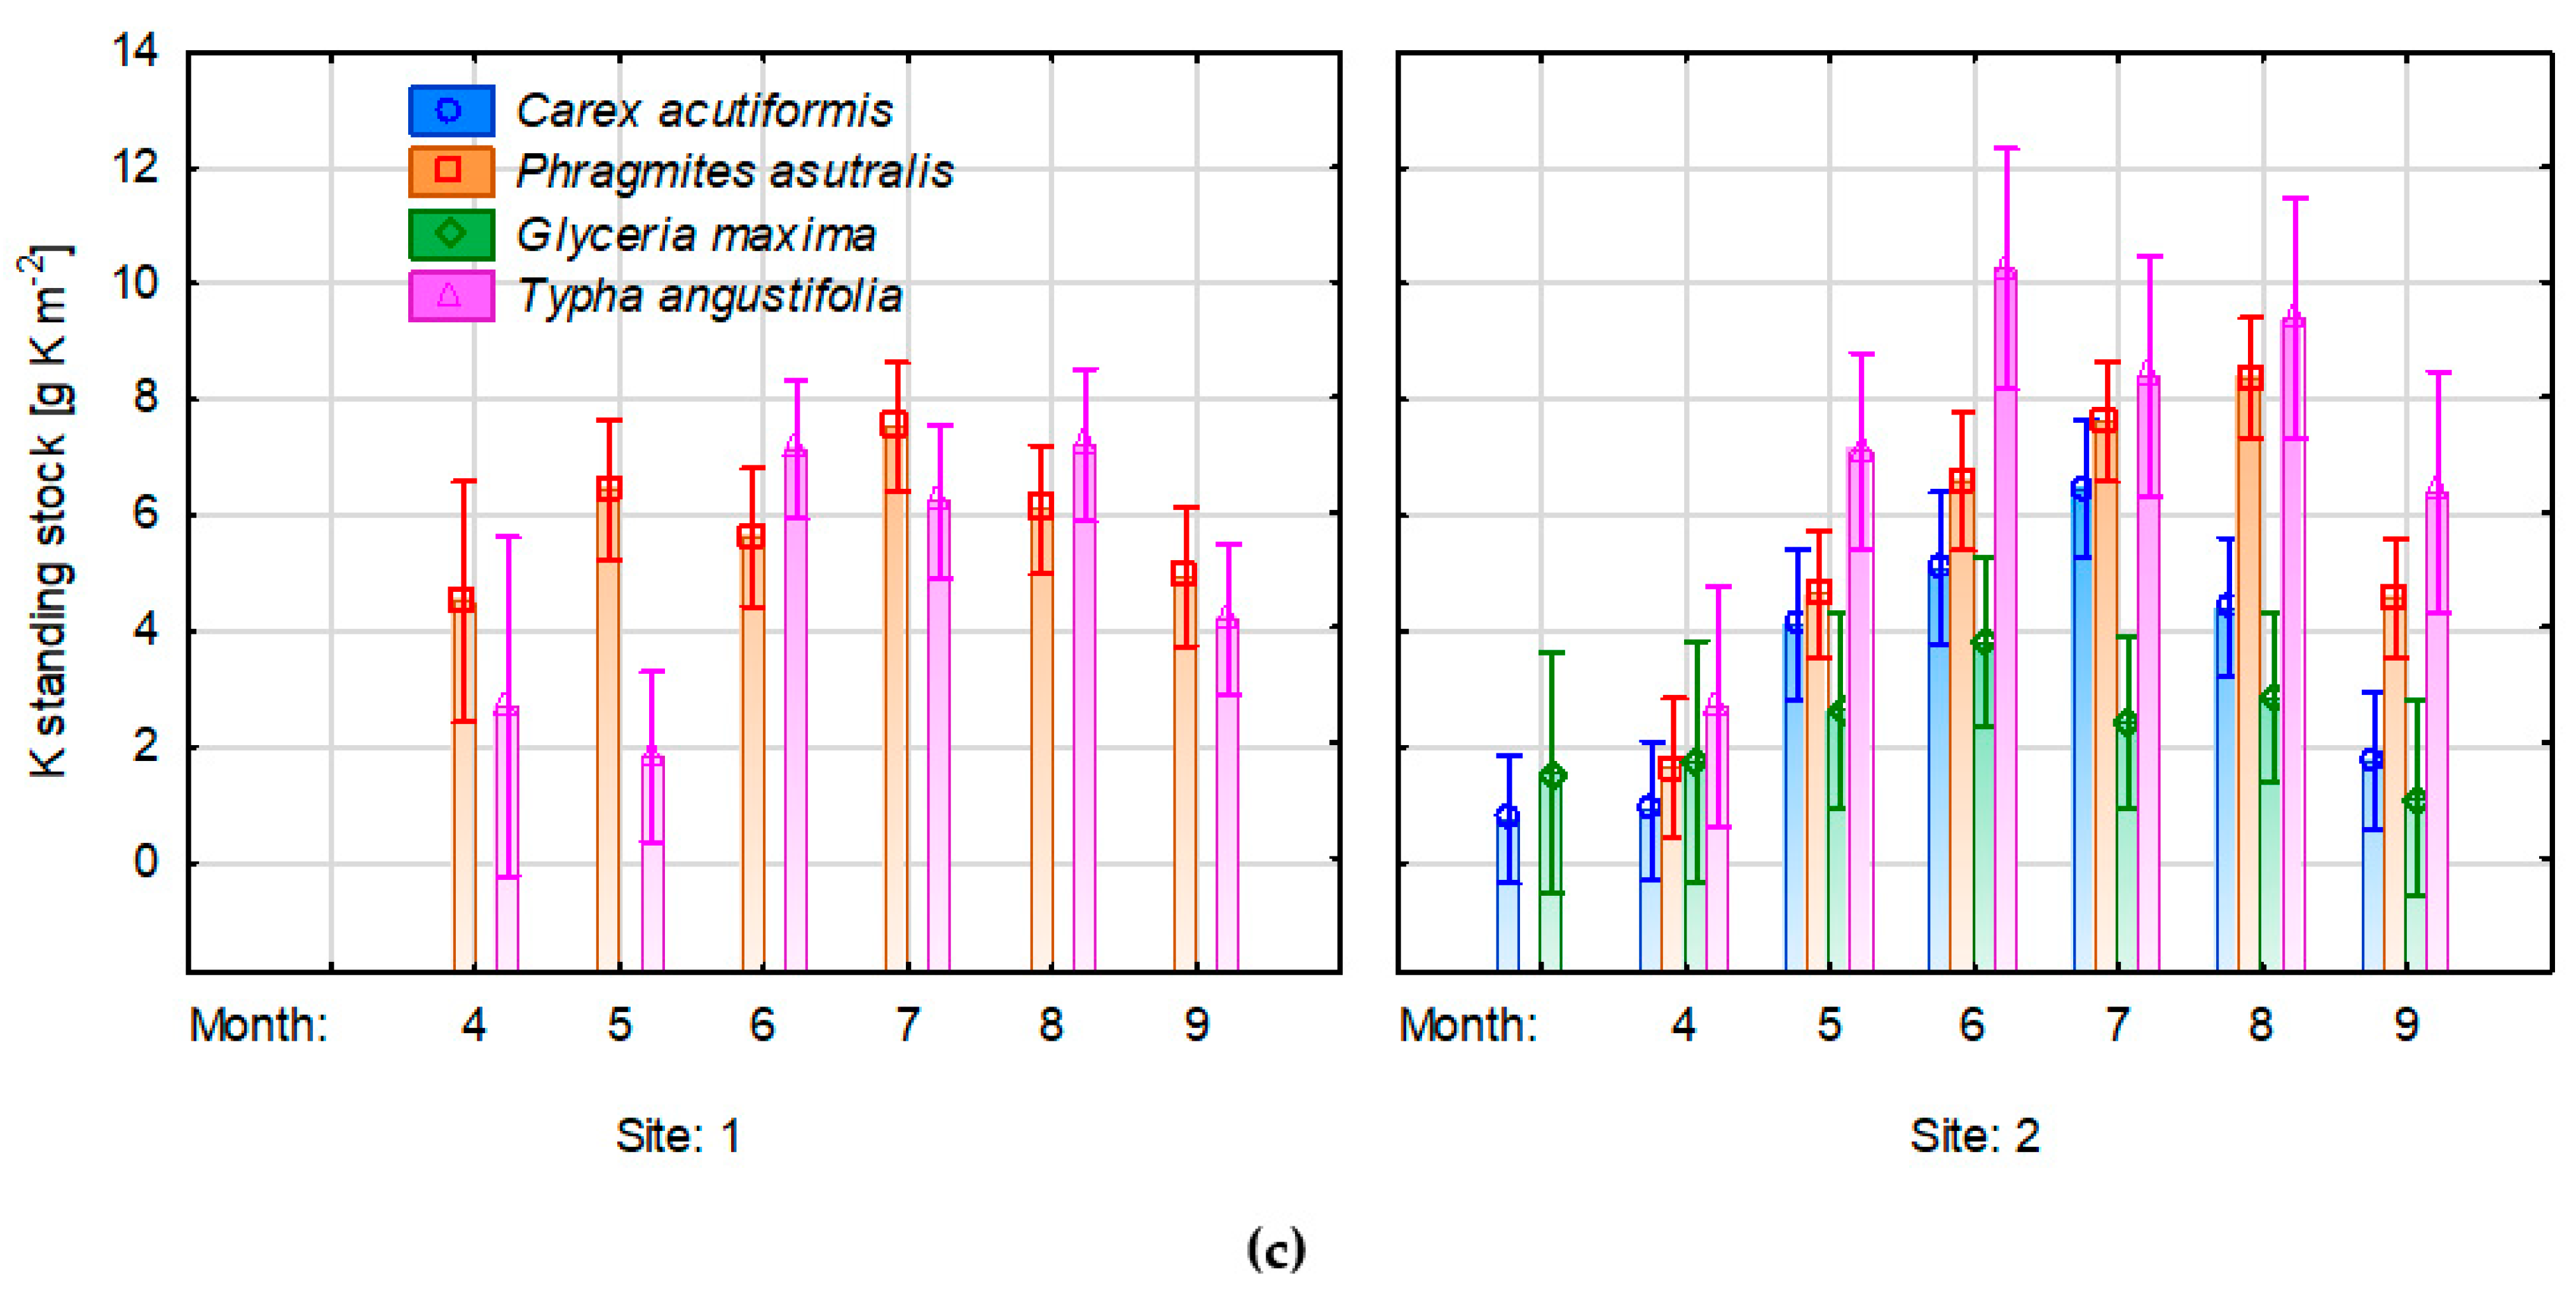
3.5. Changes of Nutrient Concentrations in Plant Biomass

Nutrient concentrations in aboveground biomass increased during the vegetation season (Figure 6a–c, Table A1). Nitrogen concentrations varied from 0.9 in March to 17.3 g m−2 in July. The highest N, P, and K were detected in the species located closer to the shoreline, particularly in Phragmites australis (17.3 g m−2, 1.19 g P m−2, 8.38 g K m−2). Typha angustifolia showed the same pattern, but only with respect to phosphorus and potassium concentrations. At the beginning of the vegetation season, the largest changes were observed in C. acutiformis, which was characterized by the most significant increase in nutrient amounts at standing stock. As for the pick of standing stock of the tallest species—Typha and Phragmites was noted in August, and Glyceria and Carex in July. In the following months, a decrease in nutrient levels in plant biomass was observed.

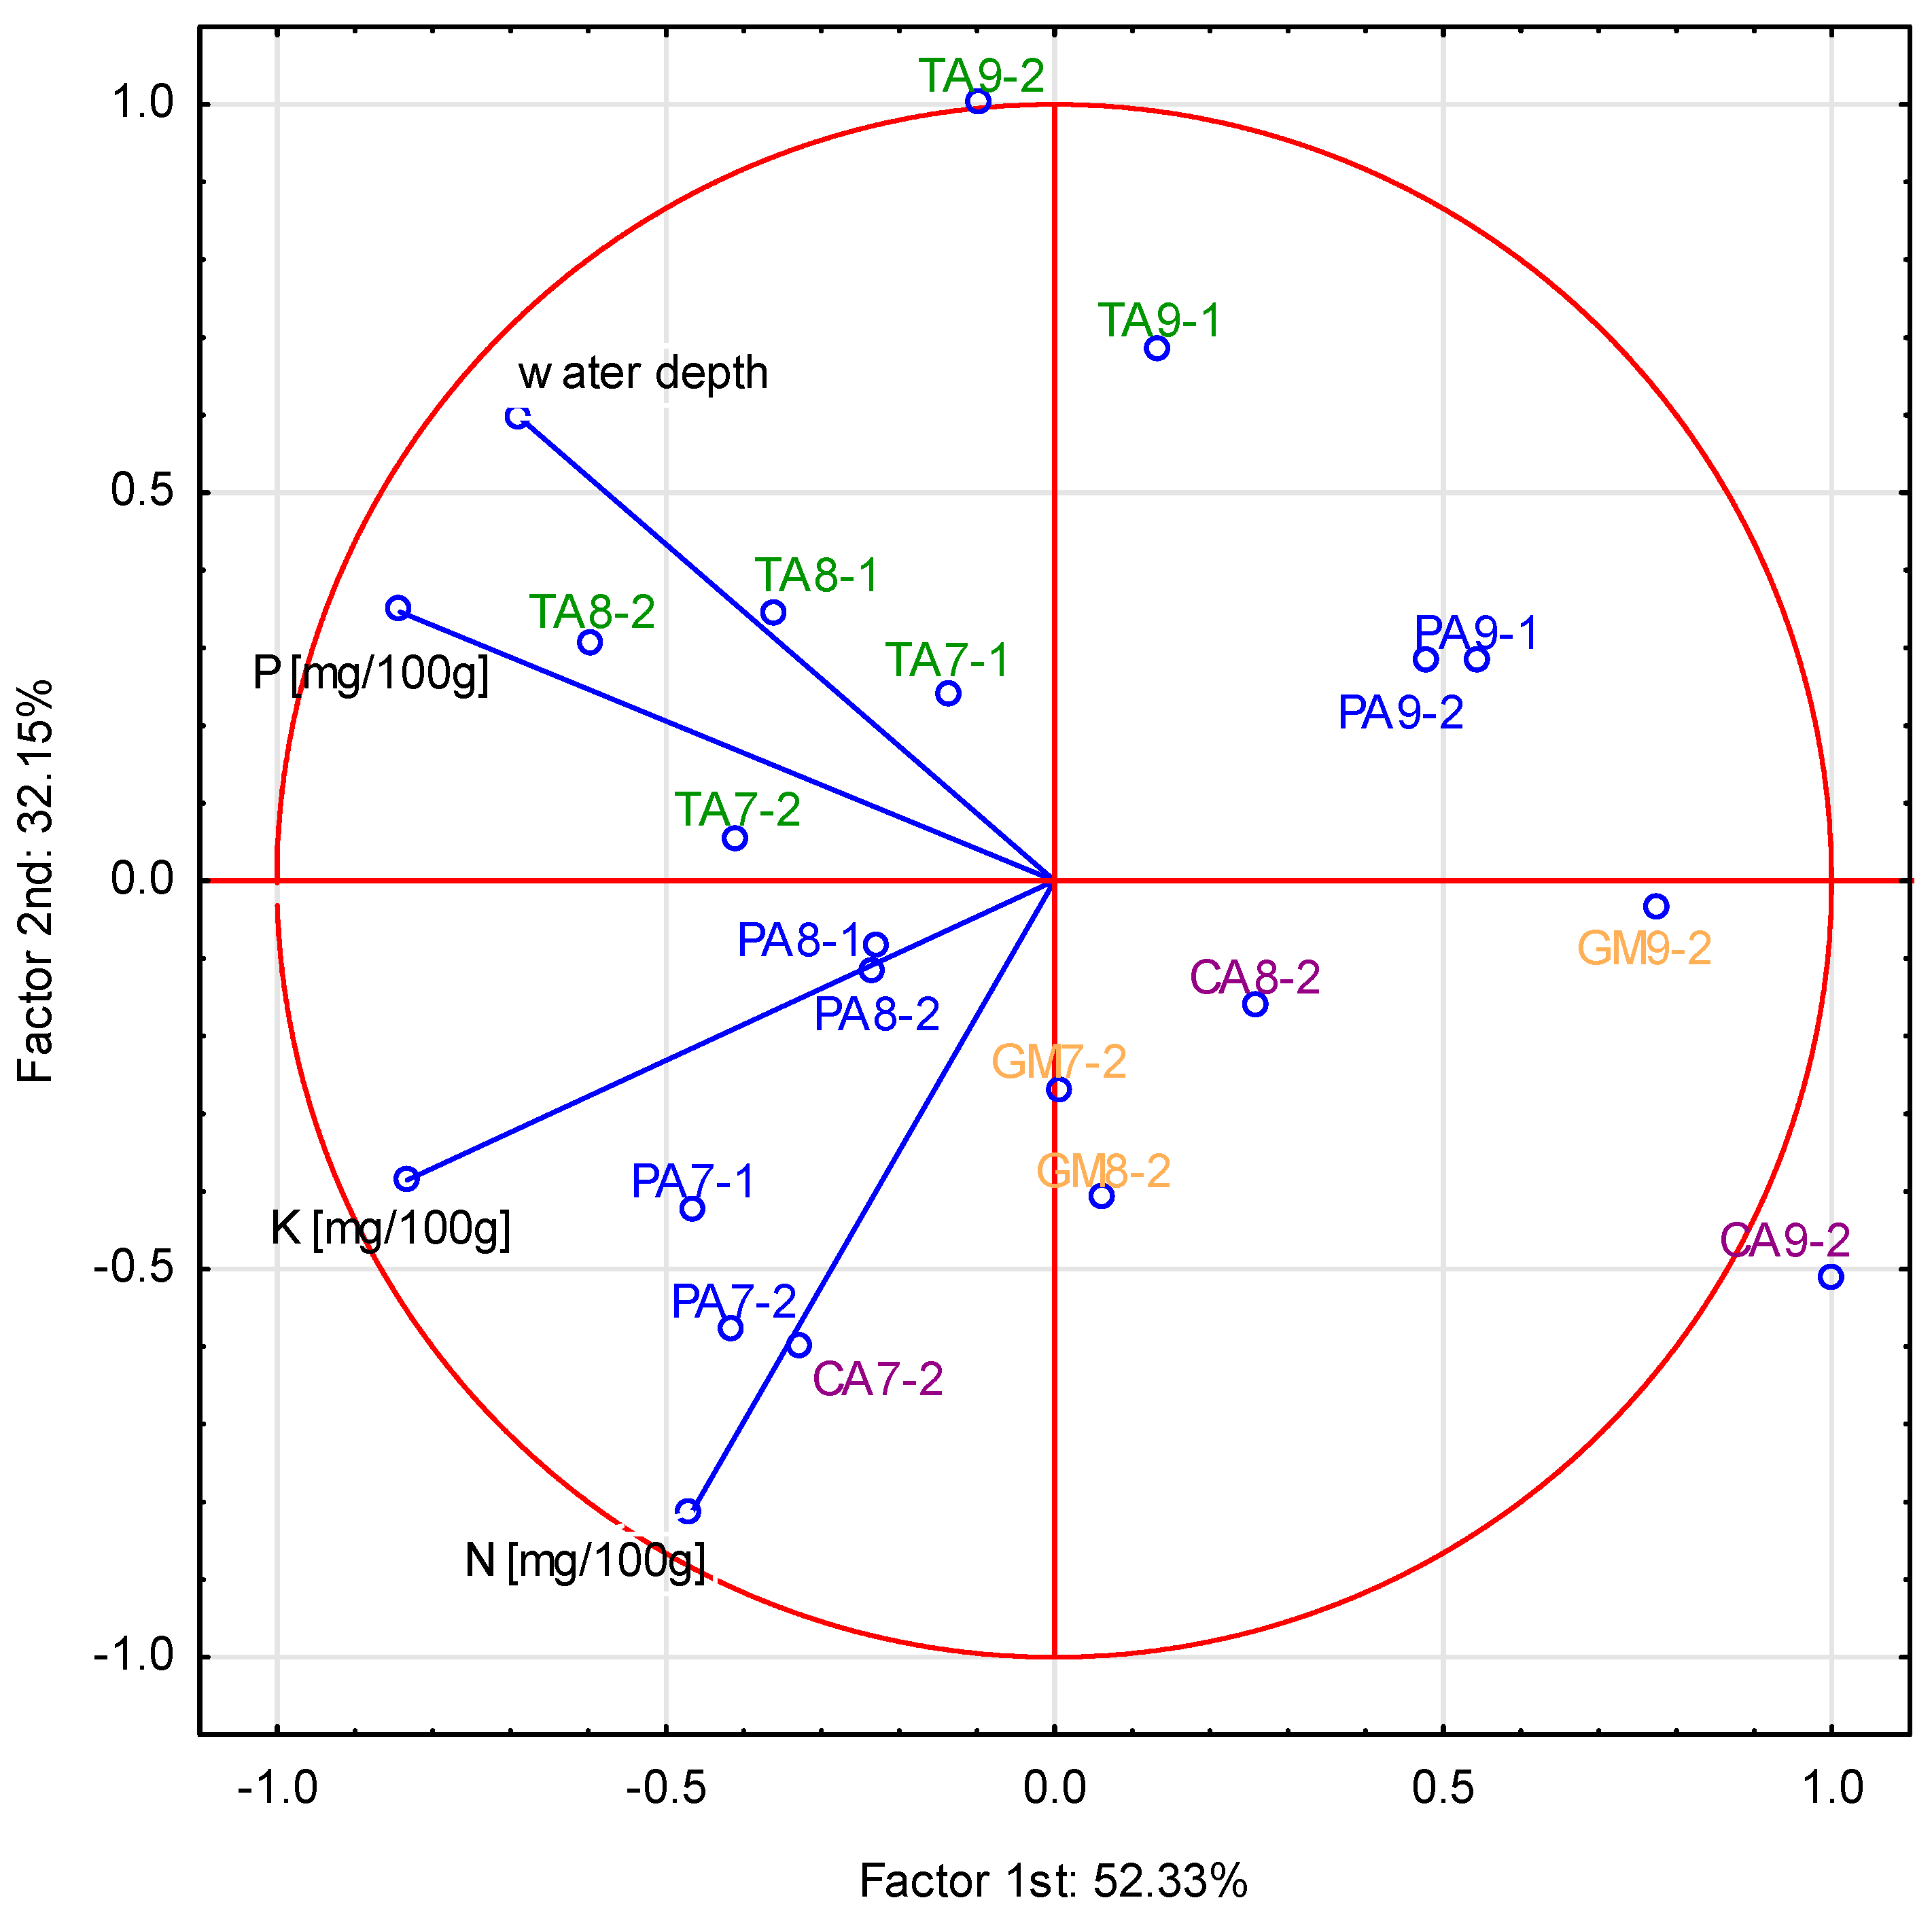
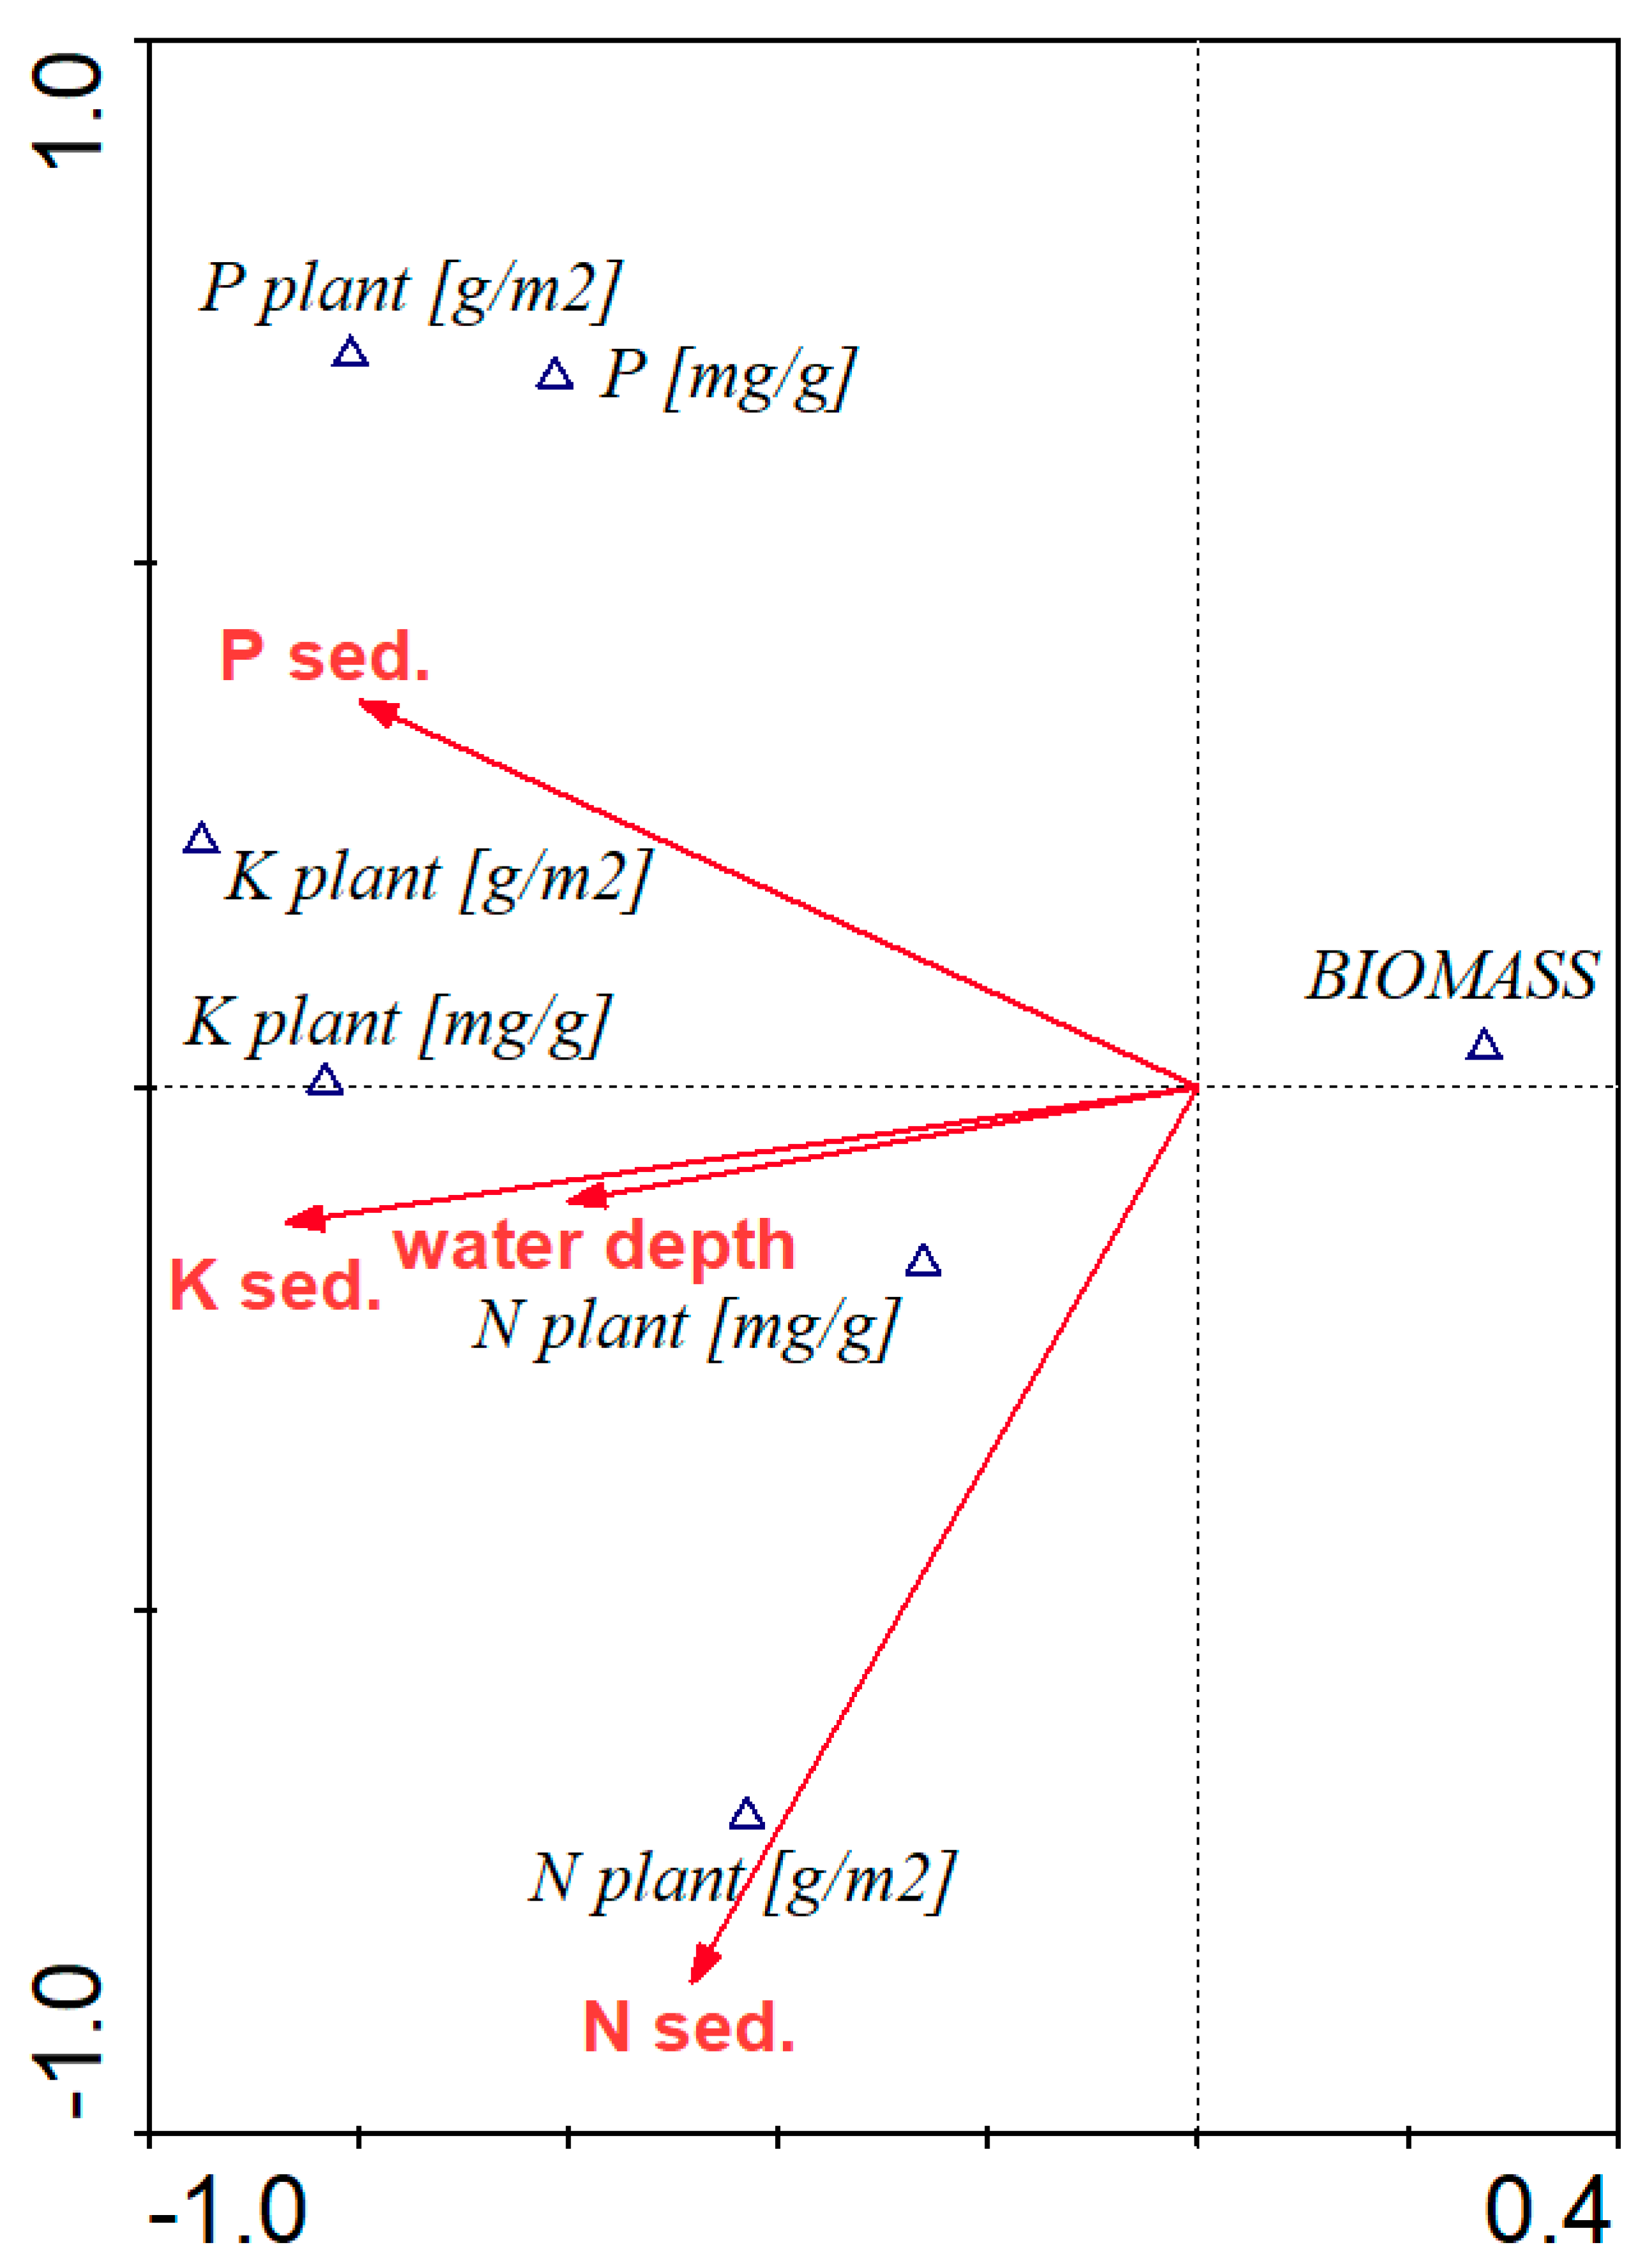
3.6. Impact of Water Level Changes and Nutrient Availability on Plant Biomass

Canonical correspondence analysis applied to evaluate the relationship between availability of nutrients, water depth, and aboveground productivity, as well as nutrient concentrations in plant tissues, showed a significant correlation. The Monte Carlo test for both the first canonical axis and overall was significant (p-value 0.0160; F-ratio = 6.65), which indicates that plant response parameters were significantly correlated with environmental variables. The first two axes explain 98.6% of the analyzed nutrient concentrations in sediments and water depth variances (Figure 7, Table 2). Biomass was negatively correlated with water depth and K concentrations in sediments. A strong positive relationship was detected between N, P, and K concentrations in plants and N, P, and K concentrations in the sediment, respectively. Additionally, K concentration showed a relationship with water depth.

4. Discussion

The performed study of the effect of water level reduction on nutrient availability in sediments and plant productivity, tested in Lake Tomickie as an example, revealed significant differences between seasonally and permanently flooded sites. The part of the littoral zone closer to the shoreline, exposed more frequently to water level fluctuations, was characterized by greater variations of nutrient concentrations than the permanently flooded sites. The differences in the studied parameters were detected between various species as well between different sites.

4.1. Effect of Reduction of the Water Level on Nutrient Availability in Sediments in the Littoral Zone

Our study revealed significant differences in nutrient concentrations in sediments at the sites of different water depth and of various species. However, our hypothesis that nutrient concentrations in the site seasonally flooded will be higher then in the sites permanently flooded was not confirmed. We did not detected an increase in phosphorus concentrations in the sediments at the seasonally flooded sites. Moreover, differences in the content of nutrients in sediments between species were significant. Our results show that Phragmites australis prefers sites with higher nitrate concentrations. However, phosphorus and potassium concentrations in the sediment were also at a high level, but not higher that at the permanently flooded site.
The sites with the highest phosphorus and potassium availability were dominated by Glyceria maxima. Tanner [41] also reported preferences of sweet grass for high nutrient availability in sediments. The concentrations of P and K in the sites with Glyceria were 0.27 mg P/g and 3.79 mg K/g. Comparable levels were detected by Lawniczak [26] in Lake Nierpuszewskie, also characterized by very eutrophic conditions. Preferences of particular species for very nutrient rich sites may indicate high plasticity of these species to environmental changes [42]. Reduction of water level due to climate changes may cause increases of nutrients, particularly due to the mineralization process. Moreover, we did not observe such a process in out experiment. In Lawniczak [43], a response of species to environmental changes in the second year of experiment has been detected. Additionally, nutrient concentrations in pore water will be necessary to analyze in order to better recognize the effect of water reduction on nutrient concentrations in sediments. Moreover, Güsewell and Koerselman [44] and Verhoeven and Aerts [45] stated that measurements of nutrient concentrations in sediments do not reflect reliable nutrient availability for plant growth. Nutrient concentrations in sediments also depends on other factors such as soil moisture, microbial activity, pH [46]. These factors may modify nutrient uptake, nutrient resorption efficiency, and proficiency of plant species, particularly wetland ones [33,47]. Conversely, Perez-Corona et al. [48] observed specific ability of some plants to solubilize theoretically unavailable phosphorus or organic nitrogen. They also suggested that nutrient concentrations in soil do not exactly reflect nutrient availability. Taking into consideration these results, the most nutrient rich sites were detected in the seasonally flooded areas. The species which prefer an elevated level of nutrients may benefit the most in this situation; for example, Glyceria maxima. Our study observations confirm the study of Wei and Chow-Frase [49], which demonstrates Glyceria as the more successful colonizer due to its rapid replacement rate.
High water levels limited the distribution of both Glyceria and Carex species due to osmotic pressure on plant cells. These species were present only in the sites seasonally flooded, which will be more exposed to environmental changes. Wei and Chow-Frase [49] suggested that the replacement of different species, i.e., Typha by Glyceria, especially in the shallow areas, could take place due to increase nutrient availability in the sediments and differences in life-history traits. Their results suggest that enhanced nutrient availability in the sediments may favour Glyceria maxima over Typha. However, we did not detect competition between Typha and Glyceria species. Weiher et al. [50] found that Typha was unable to become established in enriched sediments, which was in contrast to the study by Steinbachová-Vojtıšková et al. [51]. Our study suggested that Typha prefers a deeper part of the littoral zone. Moreover, Meeker et al. [52] reported the preferences of Typha for deeper water and Glyceria for shallower water. Glyceria appears to favour shallow water and begins growth earlier in the year [27,53], thus making it superior to Typha or Phragmites when competing for a newly released habitat. Taking into account the distribution of Glyceria in Polish lakes [31,54] we suggest that the species which will benefit the most from a decreasing water level will be Phragmites australis. However, a problem with extensive distribution of Glyceria maxima may be observed in countries where this species is considered to be invasive [55].

4.2. Changes of Water Level on Nutrient Concentrations in the Aboveground Biomass of Emergent Species

Taking into consideration of the aboveground biomass productivity of the studied species, the highest values were achieved at the sites overgrown by reeds at the seasonally flooded sites. These results are higher even than those observed in the vegetation in Lake Niepruszewskie, located in the course of Samica Stęszewska river [26], very nutrient rich. In the deeper part of the littoral zone, the growth of common reed was less intensive; however, it was not due to the pressure of water depth. Our study was conducted in the part of the littoral zone where water was present throughout the year, but the depth of water did not exceed 1.0 m. Taking into consideration the preference of Phragmites for growth in water up to the depth of 1.8 m [54], these conditions did not limit reed growth. We expected more significant changes in productivity of T. angustifolia, which occurs in a deeper part of lakes. However, our study did not show this kind of difference. The productivity of Typha was quite low compared to that determined in hypertrophic conditions [51]. The CCA analyses suggested that the productivity of narrowleaf cattail was more subjected to water stress than nutrient availability, in contrast to reeds, whose productivity was more dependent on nutrient availability, particularly to the contents of N and K, than to water depth. These results suggested that P. australis will be more sensitive to the nutrient concentrations than changes in water depth. It has been recognized as an effective colonist of littoral zones and marshes [30]. This high flexibility of reed may further impact on Typha or Glyceria, as the most commons competitor in eutrophic ecosystems. This kind of scenario is consistent with the observations by Wei and Chow-Fraser [49] that Phragmites frequently displaced Typha in Lake Ontario as a result of water level decline. In Polish lakes, reeds play an important role in the overgrowth of lakes under elevated trophic conditions [31,54,56]. These flexibility of reeds to the changes of abiotic conditions has also been detected in some countries where reeds were been recognized as invasive species [57,58].

4.3. Assessment of the Efficiency of Littoral Zone in Reduction of Nutrient Pollutions

The high availability of emergent macrophytes to nutrient uptake has been reported in many studies [12,15,27,32,37,39]. However, intensification of environmental changes may enhance lake degradation. One of the most productive species in the lakes can play the most significant role in this process. In our study, the effectiveness of nutrient uptake was higher in sites with P. australis and T. angustifolia than at those with C. acutiformis. This observation can be attributed to a higher uptake of nutrients by grass species than by sedges. However, the most significant growth was observed in Carex species in the beginning of the vegetation season. Although these species did not produce the highest biomass compared to other tested species, their achieved aboveground biomass of 766 mg m−2 was characteristic of very productive sites [59,60].
We also need to consider different tolerance levels and adaptation of particular species to changed environmental conditions, e.g., increased nutrient or water availability [60,61,62], by altering multiple functional traits and their relationships. The shift in plant traits will indicate the adaptation strategy for plants. Knowledge of plant species’ flexibility and traits under changing conditions also creates the possibility to evaluate the modifications in external resources [63].
The higher productivity of emergent species under reduced water levels in lakes may inhibit the faster process of lake overgrowth observed in very eutrophic lakes [29,64]. This process is significant in the Wielkopolska region [6,29,65], where the study was conducted due to low precipitation. Specifically, the overgrowth processes have been observed in small lakes, with low water depth, characterized by a high proportion of arable fields in catchment area, which increases the probability of lakes degradation. In consequence, high productivity of emergent vegetation also results in a decrease in biodiversity, particularly significant in protected areas. Intensification of the processes in lakes may cause problems with protection of these areas and loss of rare or endangered species. Therefore, macrophyte communities are often strongly dominated by a single species and are generally species poor at the local community level. Lake Tomickie is a good example because it is located in the buffer zone of the Wielkopolski National Park and is part of Natura 2000 sites; changes in water level may affect the growth of protected species located in the wetlands directly connected with the lake. Enhanced growth of monocultures of highly productive species such as Phragmites may cause the disappearance of rare species and, in consequence, the loss of unique areas called Trzcielińskie Bagno. Thus, the knowledge of the consequences of reducing water depth in lakes is crucial for the protection of lakes as well as the surrounding areas that strictly depend on water availability.
An intensive uptake of nutrients by vegetation and enhanced productivity may be more efficiently applied in lake reclamation through macrophytes movement [66]. Moreover, we also need to consider changes in microbial activities, physicochemical conditions influencing the decomposition of organic material, and the impact of the suggested methods on other groups of organisms. Different aspects of water level reduction need to be considered to avoid lake degradation and eventual disappearance. It is particularly important in protected areas where changes in environmental conditions may be more noticeable due to the occurrence of rare or endangered species or communities.

5. Conclusions

Our results have indicated that the aboveground biomass of emergent species was significantly increased under shortage of water. A higher water level did not significantly promote—and even inhibited—plant biomass accumulation compared to seasonally saturated sites; thus, the reduction of water depth will accelerate the effect of plant biomass productivity. An important implication of our results is that the projected water level decline due to climate change may entail an increase in a highly productive species as emergent vegetation with a broad ecological scale for nutrient concentrations and changes of water depth, i.e. Phragmites australis (Cav.) Trin. ex Steud. In our study, the most common European species—Phragmites australis (Cav.) Trin. ex Steud.—was characterized by the highest productivity. Our results indicate that due to its high plasticity to the environmental changes, its can benefit the most from water level reduction. The species that prefer growth in the deeper part of the lake, such as Typha angustifolia, will be characterized by lower productivity despite the high availability of nutrients. On the other hand, species more flexible to water changes, such as P. australis, will benefit from the situation. Carex acutiformis and Glyceria maxima, which preferred the shallow part of the lake with seasonal changes to the water level, in Polish conditions, may compete with Phragmites thanks to their faster growth at the beginning of the vegetation season. However, the high productivity of reeds may suppress their growth. This study needs to be continued to include the effects of the presence and development of other groups of organisms. Lake restoration may be difficult due to the increased availability of nutrients, which will be reflected as lake overgrowth by highly productive species.

Funding

This research received no external funding.

Institutional Review Board Statement

Not applicable.

Informed Consent Statement

Not applicable.

Data Availability Statement

I exclude this statement because I did not report any data.

Acknowledgments

I would like to thank students of the faculty of Environment Protection and B. Andrzejewska for their assistance and support with nutrient analyses.

Conflicts of Interest

The author declares no conflict of interest.

Appendix A

Table A1. Nitrogen (N), phosphorus (P), and potassium (K) concentrations [mg/g] in emergent macrophytes analyzed in the two subzones of the littoral (1—closed to open water; 2—closer to shoreline).
SpeciesSiteMonthN [mg/g]P [mg/g]K [mg/g]
MeanStand. Dev.MeanStand. Dev.MeanStand. Dev.
Carex acutiformis L. 2 30.910.350.090.050.740.33
2 41.160.100.140.030.910.19
2 55.221.970.480.234.081.81
2 67.112.860.580.255.082.01
2 79.242.910.610.296.452.35
2 87.541.510.510.194.382.78
2 97.352.950.230.101.761.48
Phragmites australis (Cav.) Trin. ex Steud.1 44.471.030.460.144.520.27
1 56.753.870.510.326.444.01
1 67.783.740.410.215.652.53
1 711.144.910.600.367.524.97
1 811.255.940.800.295.682.26
1 97.434.600.560.384.933.42
2 41.800.360.220.061.610.48
2 55.541.850.520.174.651.86
2 69.745.110.610.296.604.43
2 713.503.440.660.347.632.97
2 814.965.581.060.507.023.64
2 96.865.110.480.404.575.39
Glyceria maxima (C. Hartm.) Holmb.2 31.980.280.210.051.550.09
2 42.190.890.250.121.730.62
2 52.840.800.290.012.600.77
2 64.221.150.400.073.791.22
2 74.110.410.290.122.411.55
2 83.820.760.220.072.861.35
2 91.790.450.110.011.120.02
Typha angustifolia L.1 41.760.740.250.142.731.21
1 52.081.730.190.151.831.45
1 68.934.520.570.308.744.24
1 76.333.980.380.234.473.48
1 811.774.740.890.256.753.04
1 97.781.470.700.524.352.88
2 42.310.380.330.112.700.40
2 56.324.110.580.353.802.37
2 64.170.550.340.114.750.72
2 79.343.370.640.015.852.13
2 810.540.230.910.188.172.19
2 912.308.780.980.694.454.50

References

  1. Zhang, G.; Wu, Y.; Li, H.; Zhao, W.; Wang, F.; Chen, J.; Sivakumar, B.; Liu, S.; Qiu, L.; Wang, W. Assessment of water retention variation and risk warning under climate change in an inner headwater basin in the 21st century. J. Hydrol. 2022, 615, 128717. [Google Scholar] [CrossRef]
  2. Jeppesen, E.; Meerhoff, M.; Davidson, T.A.; Trolle, D.; Søndergaard, M.; Lauridsen, T.L.; Beklioǧlu, M.; Brucet, S.; Volta, P.; González-Bergonzoni, I.; et al. Climate change impacts on lakes: An integrated ecological perspective based on a multi-faceted approach, with special focus on shallow lakes. J. Limnol. 2014, 73, 88–111. [Google Scholar] [CrossRef] [Green Version]
  3. IPCC. Climate Change 2022: Impacts, Adaptation and Vulnerability; Cambridge University Press: Cambridge, UK; New York, NY, USA, 2022. [Google Scholar]
  4. Gizińska, J.; Sojka, M. How Climate Change Affects River and Lake Water Temperature in Central- How Climate Change Affects River and Lake Water Temperature in Central-West Poland—A Case Study of the Warta River Catchment. Atmosphere 2023, 14, 330. [Google Scholar] [CrossRef]
  5. Nowak, B.M.; Ptak, M. Natural and anthropogenic conditions of water level fluctuations in lakes-Lake Powidzkie case study (Central-Western Poland). J. Water Land Dev. 2019, 40, 13–25. [Google Scholar] [CrossRef] [Green Version]
  6. Choiński, A.; Ptak, M.; Ławniczak, A.E. Changes in water resources of Polish lakes as influenced by natural and anthropogenic factors. Polish J. Environ. Stud. 2016, 25, 1883–1890. [Google Scholar] [CrossRef] [PubMed]
  7. Freeman, E.C.; Creed, I.F.; Jones, B.; Bergström, A.-K. Global changes may be promoting a rise in select cyanobacteria in nutrient-poor northern lakes. Glob. Chang. Biol. 2020, 26, 4966–4987. [Google Scholar] [CrossRef]
  8. Kakouei, K.; Kraemer, B.M.; Anneville, O.; Carvalho, L.; Feuchtmayr, H.; Graham, J.L.; Higgins, S.; Pomati, F.; Rudstam, L.G.; Stockwell, J.D.; et al. Phytoplankton and cyanobacteria abundances in mid-21st century lakes depend strongly on future land use and climate projections. Glob. Chang. Biol. 2021, 27, 6409–6422. [Google Scholar] [CrossRef]
  9. Bullerjahn, G.S.; McKay, R.M.L.; Bernát, G.; Prášil, O.; Vörös, L.; Pálffy, K.; Tugyi, N.; Somogyi, B. Community dynamics and function of algae and bacteria during winter in central European great lakes. J. Great Lakes Res. 2020, 46, 732–740. [Google Scholar] [CrossRef]
  10. Gámez, T.E.; Benton, L.; Manning, S.R. Observations of two reservoirs during a drought in central Texas, USA: Strategies for detecting harmful algal blooms. Ecol. Indic. 2019, 104, 588–593. [Google Scholar] [CrossRef]
  11. Dunalska, J.A.; Grochowska, J.; Wiśniewski, G.; Napiórkowska-Krzebietke, A. Can we restore badly degraded urban lakes? Ecol. Eng. 2015, 82, 432–441. [Google Scholar] [CrossRef]
  12. Baastrup-Spohr, L.; Sand-Jensen, K.; Olesen, S.C.H.; Bruun, H.H. Recovery of lake vegetation following reduced eutrophication and acidification. Freshw. Biol. 2017, 62, 1847–1857. [Google Scholar] [CrossRef]
  13. Wang, M.; Zhang, H.; Du, C.; Zhang, W.; Shen, J.; Yang, S.; Yang, L. Spatiotemporal differences in phosphorus release potential of bloom-forming cyanobacteria in Lake Taihu. Environ. Pollut. 2021, 271, 116294. [Google Scholar] [CrossRef]
  14. A Rahman, A.R.A.; Sinang, S.C.; Nayan, N. Response of algal biomass and macrophyte communities to internal or external nutrient loading. Environ. Monit Assess. 2022, 194, 491. [Google Scholar] [CrossRef]
  15. Ławniczak, A. Variability of nutrient concentrations in sediments and wetland plants during the vegetation season under different sediment moisture conditions. Limnol. Rev. 2011, 11, 47–58. [Google Scholar] [CrossRef]
  16. Räty, M.; Uusi-Kämppä, J.; Yli-Halla, M.; Rasa, K.; Pietola, L. Phosphorus and nitrogen cycles in the vegetation of differently managed buffer zones. Nutr. Cycl. Agroecosyst. 2010, 86, 121–132. [Google Scholar] [CrossRef]
  17. Liira, J.; Feldmann, T.; Mäemets, H.; Peterson, U. Two decades of macrophyte expansion on the shores of a large shallow northern temperate lake-A retrospective series of satellite images. Aquat. Bot. 2010, 93, 207–215. [Google Scholar] [CrossRef]
  18. Bachmann, R.W.; Horsburgh, C.A.; Hoyer, M.V.; Mataraza, L.K.; Canfield, D.E. Relations between trophic state indicators and plant biomass in Florida lakes. Hydrobiologia 2002, 470, 219–234. [Google Scholar] [CrossRef]
  19. Ma, D.; Chen, S.; Lu, J.; Liao, H. Study of the effect of periphyton nutrient removal on eutrophic lake water quality. Ecol. Eng. 2019, 130, 122–130. [Google Scholar] [CrossRef]
  20. Seitz, C.; Scordo, F.; Vitale, A.J.; Science, C. The effects of extreme drought events on the morphometry of shallow lakes: Implications for sediment resuspension and littoral and pelagic zone distribution. J. S. Am. Earth Sci. 2020, 103, 102743. [Google Scholar] [CrossRef]
  21. Peršić, V.; Horvatić, J.; Has-Schön, E.; Bogut, I. Changes in N and P limitation induced by water level fluctuations in Nature Park Kopački Rit (Croatia): Nutrient enrichment bioassay. Aquat. Ecol. 2009, 43, 27–36. [Google Scholar] [CrossRef]
  22. Sfriso, A.; Buosi, A.; Juhmani, A.S.; Tomio, Y.; Mistri, M.; Munari, C.; Sfriso, A.A. Sedimentation Rates: Anthropogenic Impacts and Environmental Changes in Transitional Water Systems. Water 2022, 14, 3843. [Google Scholar] [CrossRef]
  23. Palmer, M.A.; Covich, A.P.; Lake, S.; Biro, P.; Brooks, J.J.; Cole, J.; Dahm, C.; Gibert, J.; Goedkoop, W.; Martens, K.; et al. Linkages between aquatic sediment biota and life above sediments as potential drivers of biodiversity and ecological processes. Bioscience 2000, 50, 1062–1075. [Google Scholar] [CrossRef]
  24. Chang, J.; Liu, D.; Cao, H.; Chang, S.X.; Wang, X.; Huang, C.; Ge, Y. NO3-/NH4+ratios affect the growth and N removal ability of Acorus calamus and Iris pseudacorus in a hydroponic system. Aquat. Bot. 2010, 93, 216–220. [Google Scholar] [CrossRef]
  25. Small, G.E.; Finlay, J.C.; McKay, R.M.L.; Rozmarynowycz, M.J.; Brovold, S.; Bullerjahn, G.S.; Spokas, K.; Sterner, R.W. Large differences in potential denitrification and sediment microbial communities across the Laurentian great lakes. Biogeochemistry 2016, 128, 353–368. [Google Scholar] [CrossRef]
  26. Ławniczak, A.E. The role of emergent macrophytes in nutrient cycling in Lake Niepruszewskie (western Poland). Oceanol. Hydrobiol. Stud. 2010, 39, 75–83. [Google Scholar] [CrossRef]
  27. Tylová, E.; Steinbachová, L.; Votrubová, O.; Lorenzen, B.; Brix, H. Different sensitivity of Phragmites australis and Glyceria maxima to high availability of ammonium-N. Aquat. Bot. 2008, 88, 93–98. [Google Scholar] [CrossRef]
  28. Alahuhta, J.; Kosten, S.; Akasaka, M.; Auderset, D.; Azzella, M.M.; Bolpagni, R.; Bove, C.P.; Chambers, P.A.; Chappuis, E.; Clayton, J.; et al. Global variation in the beta diversity of lake macrophytes is driven by environmental heterogeneity rather than latitude. J. Biogeogr. 2017, 44, 1758–1769. [Google Scholar] [CrossRef] [Green Version]
  29. Lawniczak-Malińska, A.; Ptak, M.; Celewicz, S.; Choiński, A. Impact of lake morphology and shallowing on the rate of overgrowth in hard-water eutrophic lakes. Water 2018, 10, 1827. [Google Scholar] [CrossRef] [Green Version]
  30. Song, H.; Guo, X.; Yu, X.; Liu, L.; Wang, N.; Eller, F.; Guo, W. Is there evidence of local adaptation of Phragmites australis to water level gradients and fluctuation frequencies? Sci. Total Environ. 2021, 756, 144065. [Google Scholar] [CrossRef]
  31. Kolada, A. The use of helophytes in assessing eutrophication of temperate lowland lakes: Added value? Aquat. Bot. 2016, 129, 44–54. [Google Scholar] [CrossRef]
  32. Lawniczak, A.E.; Zbierska, J.; Choiński, A.; Szczepaniak, W. Response of emergent macrophytes to hydrological changes in a shallow lake, with special reference to nutrient cycling. Hydrobiologia 2010, 656, 243–254. [Google Scholar] [CrossRef] [Green Version]
  33. Lawniczak, A.E. Nitrogen, Phosphorus, and potassium resorption efficiency and proficiency of four emergent macrophytes from Nutrient-Rich Wetlands. Polish J. Environ. Stud. 2011, 20, 1227–1234. [Google Scholar]
  34. Alahuhta, J.; Kanninen, A.; Hellsten, S.; Vuori, K.M.; Kuoppala, M.; Hämäläinen, H. Variable response of functional macrophyte groups to lake characteristics, land use, and space: Implications for bioassessment. Hydrobiologia 2014, 737, 201–214. [Google Scholar] [CrossRef]
  35. Lawniczak, A.E.; Pełechata, A.; Czerniawska-Kusza, I.; Golski, J. Wody powierzchniowe Wielkopolskiego Parku Narodowego i jego Otuliny. Tom I. JEZIORA. (Freshwaters of Wielkopolska National Park and its Buffer zone Vol. I Lakes); Bogucki Wyd. Naukowe: Poznań, Poland, 2016; Volume I, ISBN 9789896540821. [Google Scholar]
  36. Ławniczak, A.E. Long-term changes in water quality and ecological status of lakes in the Wielkopolska National Park and its buffer zone with special reference to effectiveness of the lakes’ protection. Oceanol. Hydrobiol. Stud. 2016, 45, 524–538. [Google Scholar] [CrossRef]
  37. Kottek, M.; Grieser, J.; Beck, C.; Rudolf, B.; Rubel, F. World Map of the Köppen-Geiger climate classification updated. Meteorol. Z. 2006, 15, 259–263. [Google Scholar] [CrossRef]
  38. Valjarević, A.; Milanović, M.; Gultepe, I.; Filipović, D.; Lukić, T. Updated Trewartha climate classification with four climate change scenarios. Geogr. J. 2022, 188, 506–517. [Google Scholar] [CrossRef]
  39. Kundzewicz, Z.W.; Matczak, P. Climate change regional review: Poland. WIREs Clim. Chang. 2012, 3, 297–311. [Google Scholar] [CrossRef]
  40. Bremner, J.M.; Mulvaney, C.S. Nitrogen—Total. In Methods of Soil Analysis; John Wiley & Sons, Ltd.: Hoboken, NJ, USA, 1983; pp. 595–624. ISBN 9780891189770. [Google Scholar]
  41. Tanner, C.C. Plants for constructed wetland treatment systems—A comparison of the growth and nutrient uptake of eight emergent species. Ecol. Eng. 1996, 7, 59–83. [Google Scholar] [CrossRef]
  42. Brändle, R.; Pokorný, J.; Květ, J.; Čížková, H. Wetland plants as a subject of interdisciplinary research. Folia Geobot. 1996, 31, 1–6. [Google Scholar] [CrossRef]
  43. Lawniczak, A. Response of two wetland graminoids to N:K supply ratios in a two-year growth experiment. J. Elem. 2011, 16, 421–436. [Google Scholar] [CrossRef]
  44. Güsewell, S.; Koerselman, W. Variation in nitrogen and phosphorus concentrations of wetland plants. Perspect. Plant Ecol. Evol. Syst. 2002, 5, 37–61. [Google Scholar] [CrossRef]
  45. Verhoeven, J.T.A.; Arts, H.H.M. Nutrient dynamics in small mesotrophic fens surrounded by cultivated land: II. N and P accumulation in plant biomass in relation to the release of inorganic N and P in the peat soil. Oecologia 1987, 72, 557–561. [Google Scholar] [CrossRef]
  46. Shaver, G.R.; Chapin, F.S. Long–term responses to factorial, NPK fertilizer treatment by Alaskan wet and moist tundra sedge species. Ecography 1995, 18, 259–275. [Google Scholar] [CrossRef]
  47. Lawniczak, A.E.; Drapikowska, M.; Celka, Z.; Szkudlarz, P.; Jackowiak, B. Response of Anthoxanthum Odoratum and a. Aristatum To Different Habitat Types and Nutrient Concentrations in Soil. Fresenius Environ. Bull. 2011, 20, 2465–2474. [Google Scholar]
  48. Sánchez Pérez, J.M.; Antiguedad, I.; Arrate, I.; García-Linares, C.; Morell, I. The influence of nitrate leaching through unsaturated soil on groundwater pollution in an agricultural area of the Basque country: A case study. Sci. Total Environ. 2003, 317, 173–187. [Google Scholar] [CrossRef] [Green Version]
  49. Wei, A.; Chow-Fraser, P. Synergistic impact of water level fluctuation and invasion of Glyceria on Typha in a freshwater marsh of Lake Ontario. Aquat. Bot. 2006, 84, 63–69. [Google Scholar] [CrossRef]
  50. Weiher, E.; Wisheu, I.C.; Keddy, P.A.; Moore, D.R.J. Establishment, persistence, and management implications of experimental wetland plant communities. Wetlands 1996, 16, 208–218. [Google Scholar] [CrossRef]
  51. Steinbachová-Vojtıšková, L.; Tylová, E.; Soukup, A.; Novická, H.; Votrubová, O.; Lipavská, H.; Čıžková, H. Influence of nutrient supply on growth, carbohydrate, and nitrogen metabolic relations in Typha angustifolia. Environ. Exp. Bot. 2006, 57, 246–257. [Google Scholar] [CrossRef]
  52. Meeker, J.E.; Wilcox, D.A.; Johnson, S.E.; Tillison, N. Tracking vegetation transitions due to invasion of cattail (Typha) in lake superior coastal peatlands. Wetlands 2023, 43, 18. [Google Scholar] [CrossRef]
  53. Munzarova, E.; Lorenzen, B.; Brix, H.; Vojtiskova, L.; Votrubova, O. Effect of NH4+/NO3- availability on nitrate reductase activity and nitrogen accumulation in wetland helophytes Phragmites australis and Glyceria maxima. Environ. Exp. Bot. 2006, 55, 49–60. [Google Scholar] [CrossRef]
  54. Ciecierska, H. Macrophyte based indices of the ecological state of lakes. In Dissertations and Monographs, 139; University of Warmia and Mazury in Olsztyn: Olsztyn, Poland, 2008. [Google Scholar]
  55. Available online: http://www.iucngisd.org/gisd/species.php?sc=891 (accessed on 20 November 2022).
  56. Lawniczak-Malińska, A.E.; Achtenberg, K. Indicator values of emergent vegetation in overgrowing lakes in relation towater and sediment chemistry. Water 2018, 10, 498. [Google Scholar] [CrossRef] [Green Version]
  57. Saltonstall, K. Cryptic invasion by a non-native genotype of the common reed, Phragmites australis, into North America. Proc. Natl. Acad. Sci. USA 2002, 99, 2445–2449. [Google Scholar] [CrossRef] [Green Version]
  58. Kirk, H.; Paul, J.; Straka, J.; Freeland, J.R. Long-distance dispersal and high genetic diversity are implicated in the invasive spread of the common reed, Phragmites australis (Poaceae), in northeastern North America. Am. J. Bot. 2011, 98, 1180–1190. [Google Scholar] [CrossRef]
  59. Eller, F.; Skálová, H.; Caplan, J.S.; Bhattarai, G.P.; Burger, M.K.; Cronin, J.T.; Guo, W.-Y.; Guo, X.; Hazelton, E.L.G.; Kettenring, K.M.; et al. Cosmopolitan Species As Models for Ecophysiological Responses to Global Change: The Common Reed Phragmites australis. Front. Plant Sci. 2017, 8, 1833. [Google Scholar] [CrossRef] [PubMed] [Green Version]
  60. Banaszuk, P.; Kamocki, A.K.; Wysocka-Czubaszek, A.; Czubaszek, R.; Roj-Rojewski, S. Closing the loop-Recovery of nutrients and energy from wetland biomass. Ecol. Eng. 2020, 143, 105643. [Google Scholar] [CrossRef]
  61. Gonzalez Mateu, M.; Yarwood, S.A.; Baldwin, A.H. Positive interactions occur between Phragmites australis lineages across short term experimental nutrient regimes. Aquat. Bot. 2021, 172, 103382. [Google Scholar] [CrossRef]
  62. Portielje, R.; Van der Molen, D.T. Relationships between eutrophication variables: From nutrient loading to transparency. Hydrobiologia 1999, 409, 375–387. [Google Scholar] [CrossRef]
  63. Vukov, D.; Ili, M.; Mirjana, Ć.; Igi, R. Environmental Drivers of Functional Structure and Diversity of Vascular Macrophyte Assemblages in Altered Waterbodies in Serbia. Diversity 2023, 15, 231. [Google Scholar] [CrossRef]
  64. Ławniczak, A. Overgrowing of two polymictic lakes in Central-Western Poland. Limnol. Rev. 2010, 10, 147–156. [Google Scholar] [CrossRef] [Green Version]
  65. Ławniczak, A.E.; Choiński, A.; Kurzyca, I. Dynamics of lake morphometry and bathymetry in various hydrological conditions. Polish J. Environ. Stud. 2011, 20, 931–940. [Google Scholar]
  66. Zhao, J.; Liu, C.; Li, H.; Liu, J.; Jiang, T.; Yan, D.; Tong, J.; Dong, L. Review on Ecological Response of Aquatic Plants to Balanced Harvesting. Sustainability 2022, 14, 2451. [Google Scholar] [CrossRef]
Figure 1. Localization of the Tomickie Lake with indication of the study sites (T1–T6—analyzed transects) and dominant plant communities.
Sustainability 15 05563 g001
Figure 2. Changes of water depth in the two subzones of the littoral zone (1—close to open water; 2—closer to the shoreline) at five sites (without and with vegetation).
Sustainability 15 05563 g002
Figure 3. (a) Nitrogen, (b) phosphorus, and (c) potassium concentrations in sediment collected in the two littoral subzones (1—close to open water; 2—closer to the shoreline) at five sites (without and with vegetation). Boxplots: mean (small tag), standard errors (SE, box edges).
Sustainability 15 05563 g003aSustainability 15 05563 g003b
Figure 4. Principal component analysis of water depth and nutrient concentrations in sediments in the different species under diverse moisture conditions at peak standing stock. Abbreviations: N [mg/100 g]—nitrogen concentrations in sediments; P [mg/100 g]—phosphorus concentrations in sediments; K [mg/100 g]—potassium concentrations in sediments; PA—Phragmites australis (Cav.) Trin. ex Steud.; TA—Typha angustifolia L.; CA—Carex acutiformis L.; GM—Glyceria maxima (C. Hartm.) Holmb.; 7,8,9—month; sites: 1—close to open water—permanently flooded; 2—close to the shoreline—seasonally flooded.
Sustainability 15 05563 g004
Figure 5. Aboveground productivity of four emergent macrophytes analyzed in the two littoral subzones (1—close to open water; 2—closer to the shoreline). Box represents ± standard error.
Sustainability 15 05563 g005
Figure 6. (a) Nitrogen, (b) phosphorus, and (c) potassium concentrations in emergent macrophytes analyzed in the two littoral subzones (1—close to open water; 2—closer to the shoreline). Vertical bars represent ± standard error.
Sustainability 15 05563 g006aSustainability 15 05563 g006b
Figure 7. Canonical correspondence analysis (CCA) comparing chemical composition and biomass of the macrophytes and abiotic conditions (nutrient concentrations in sediments and water depth).
Sustainability 15 05563 g007
Table 1. Results of the three-way repeat measurement of ANOVA tests of the effects of the time and the differences between species in nitrogen, phosphorus, and potassium concentrations (ln-transformed) within seasonally and permanently flooded sites.
Source NPKBiomass
dfFSig.FSig.FSig.FSig.
Month631.103***13.449***16.621***41.429***
Species310.444***10.345***10.901***4.535*
Site19.909**6.214*14.821**4.535*
Site * Species56.317***6.225***6.875***7.480***
Month * Site 6.317***6.225***6.875***20.175***
Month * Species1216.550***8.014***10.246***7.480***
Month * Site * Species379.641***4.668***4.689***14.241***
Significance: * < 0.05, ** < 0.001, *** < 0.0001, ns—no significant.
Table 2. Summary of the CCA results including eigenvalues, correlations, and percentage variation explained by two canonical axes (CCA1 and CCA2).
Axes1234Total Variance
Eigenvalues:0.447 0.005 0.002 0.0001.000
Water quality–environment correlations:0.676 0.628 0.816 0.286
Cumulative percentage variance
of water quality data:44.7 45.2 45.4 45.5
of water quality–environment relation:98.3 99.4 99.9 100.0
Sum of all eigenvalues 1
Sum of all canonical eigenvalues 0.455
Disclaimer/Publisher’s Note: The statements, opinions and data contained in all publications are solely those of the individual author(s) and contributor(s) and not of MDPI and/or the editor(s). MDPI and/or the editor(s) disclaim responsibility for any injury to people or property resulting from any ideas, methods, instructions or products referred to in the content.

