Article

Assessing the Future Streetscape of Rimini Harbor Docks with Virtual Reality

1
COSYS-GRETTIA, University Gustave Eiffel, F-77447 Marne-la-Vallée, France
2
Department of Civil, Chemical, Environmental and Materials Engineering (DICAM), University of Bologna, 40126 Bologna, Italy
3
Higher School of Engineering and Technology, Universidad de La Laguna, 38071 San Cristóbal de La Laguna, Spain
*
Author to whom correspondence should be addressed.
Sustainability 2023, 15(6), 5547; https://doi.org/10.3390/su15065547
Submission received: 23 February 2023 / Revised: 14 March 2023 / Accepted: 16 March 2023 / Published: 21 March 2023

Abstract

:
The human factor plays an important role in the successful design of infrastructure to support sustainable mobility. By engaging users early in the design process, information can be obtained before physical environments are built, making designed spaces more attractive and safer for users. This study presents the collected data of a virtual reality (VR) application in which user perception has been evaluated within an urban redevelopment context. The area under consideration is the Canal of the Port of Rimini (Italy), a degraded area not connected to the city center. The redevelopment of degraded urban areas is the first step towards achieving the sustainability aims set out in the Sustainable Development Goals. Prior to this work, evaluation methods were developed in the decision-making process, considering different social, economic, and environmental aspects in order to obtain a priority scale of interventions for urban regeneration. Architectural solutions were proposed to represent targeted and specific interventions that are designed precisely for the context to which they are dedicated in order to make the Canal Port area a continuum with its urban context and to improve its perception by tourists and inhabitants. To assess these proposed infrastructure modifications, two models of VR were created, one relevant to the current condition and one representing the future condition after redevelopment of the area. Virtual visits to the Canal of the Port of Rimini were created under two scenarios, namely, the current situation and the future situation after redevelopment of the infrastructure. Then, human participants were involved through two different questionnaires. The first allowed participants validate the VR model created by comparing it with the real context, while the second served to evaluate the perceptions of users by comparing the two VR models of the canal before and after the intervention. The results of this empirical research highlight the benefits of engaging users early in the design process and improving the user experience before implementing renovation of the infrastructure.

1. Introduction

1.1. Creating Resilient Urbanism with Streetscape Design

Our analysis began with on-site inspections to assess the urban and territorial system of the Canal of the Port of Rimini in Italy, illustrated in Figure 1, to identify deficiencies in terms of services, connections, availability of spaces, cycle-pedestrian paths, and carriageable roads [1]. This analysis led us to identify needs to support the functionality of the port as a whole, on the basis of which various alternative project scenario were proposed for the urban redevelopment of the Canal Port.
After proposition of a regeneration project of the canal by architects, described in [2], a before–after comparison between the design scenarios was necessary in order to evaluate the improvement of the future layout of the canal. We decided to do this using virtual reality; the present paper describes the scene construction and methodology used to visually compare the baseline scenario and the project situation. Using TwinMotion software, a model was created in virtual reality representing the existing infrastructure and current situation of the Port of Rimini. A second VR model was created, the post-intervention scenario, to analyze mobility and infrastructure in the study area by evaluating opportunities and risks in the new port area envisioned as part of the project.
The research previously begun in [1,2] suggests a method of supporting and justifying project proposals in the complex case of regeneration of port areas. The aim is to show how important sustainable mobility is within a deep urban redevelopment of a historical context, such as the Canal Port of Rimini. The reconnection of cycle-pedestrian paths, the redevelopment of the quays, and the creation of urban spaces for tourists and citizens are possible solutions to improve quality of life in degraded and underutilized urban areas.
The design phase began with the identification of the height to which to lift the docks in order to solve the problem of frequent flooding due to tides and adverse weather conditions. Following an in-depth hydraulic study of the area, raising of the quays was justified and verified. Access to platforms and public spaces was designed to identify new functions for the benefit of the community. As a result of raising the docks, the cycling and pedestrian paths along the two banks of the Canal Port were revised accordingly. The new cycle and pedestrian infrastructure can improve public health and make cities more active and environmentally friendly. Recent studies have shown that the regeneration of urban public spaces is closely related to the presence of safe and connected cycling and pedestrian paths. The proposed solutions are currently being defined and refined, and could receive funding from the Municipality of Rimini to be implemented; however, they need to be validated. This paper proposes a methodology for prospective validation.
The solutions proposed in this contribution represent targeted and specific interventions that are designed precisely for the context to which they are dedicated in order to make the Canal Port area a continuum with its urban context and to improve its perception by tourists and inhabitants. Although the proposed solution is tailor-made for this specific case, the developed approach is based on a strong scientific basis of urban regeneration projects founded on multi-criteria analysis and sets of indicators. The applied strategy can be replicated in any other similar case requiring an urban regeneration intervention. The benefits of this urban regeneration project include:
  • Improved aesthetic quality of urban spaces
  • Improved environmental quality of urban spaces
  • Reduction of pollutant emissions through the increase in green and permeable areas
  • Increased user flow (residents and tourists) in areas that are currently poorly frequented
  • Increased social well-being of the regenerated area.
All these aspects could potentially result in higher economic productivity in the area. Better urban quality may lead to an increase in the real estate value of the area and implementation of new economic activities. As a future development of the research, it is proposed to deepen an economic feasibility study of the interventions. This should be convenient for the municipality, as it does not involve actions of deep urban transformation and demolition, only simple local interventions of renovation of public spaces. The proposed urban regeneration project focuses exclusively on the redevelopment of bicycle and pedestrian routes, and aims to represent a good example of how soft mobility plays a fundamental role in urban regeneration.

1.2. Virtual Scene for Streetscape Assessment

New urban planning and design tools making the use of public space more efficient are now being sought in all cities in order to build healthy and liveable urban environments and encourage the development of infrastructure [3]. Good urban planning should consider several aspects, such as the physical environment (location, climate, resources, etc.), the social environment (planning the right areas to promote socialization among people), and the economic environment supporting business [4]. The same global and integrated vision applies to urban regeneration, which aims to establish satisfactory government conditions for areas subject to transformation [5,6] and to make lasting economic, social, physical, and environmental changes by reducing problems towards a more sustainable city [7]. Urban regeneration is a new way of rethinking the use of space by combining and harmonizing economic, social, physical, and environmental issues in the same context [8]. Urban regeneration aims to redevelop abandoned areas and transform them into new attractive centers [9,10], encouraging inclusive growth of urban spaces. By focusing on social progress rather than on progress for its own sake, urban regeneration fosters the transition from an individualistic model to a more participatory one involving the development of collective thinking.
Urban planning and regeneration, along with model design, have always taken a very long time due to the many requirements involved in proposing ideas, looking for investments, presenting and adapting projects, etc. It is often months or even years before a project is approved and work can begin. Moreover, many projects are rejected because investors cannot obtain financing. In addition, the different needs and expectations of stakeholders and different perceptions of the project are sometimes not recognized or respected, and this may give rise to conflicts [11,12]. Shared urban regeneration planning is an opportunity to understand how stakeholders perceive urban heritage and how they can contribute [13]. Moreover, the participation and empowerment of stakeholders in the processes of planning and territorial regeneration is essential to overcome disparities of power and commitment of the different parties and possible lack of communication [14]. For this reason, stakeholders should be involved from the beginning to identify the criticalities of an area, rather than asking them about proposals for urban redevelopment after the project has been approved [15]. However, although it is important, few citizens participate in urban planning [16], and when they do it is unfortunately only possible to do so passively. Du et al. (2019) [16] asserted that this can lead to the exclusion of many people, resulting regret around urban projects when they are carried out. Thanks to technology, eParticipation and mParticipation have been introduced, and mobile web devices can be useful communication channels between institutions and citizens to facilitate the participation of a digital and network-connected society.
To encourage active participation in public planning, the right tools for understanding the scope of innovation should be identified. Citizens, investors, and stakeholders sometimes reject projects because of a lack of visualization and intuitive observation of how the resulting project may appear in reality [17].
An intuitive, engaging, and user-friendly approach such as VR is capable of offering a 3D vision of the project, and can be used to connect stakeholders and groups from different strata of society by bridging the information gap. Researchers in completely different fields, such as education [18,19], entertainment [20], health [21], and marketing [22] agree that the use of virtual reality improves learning experiences, promotes cooperation [23], and can enhance creativity and commitment [24].
3D models have been used in urban planning through CAD (Computer Aided Design) software for about thirty years. From the initial execution of 2D projects with maps presented on fixed screen or drawn or printed on paper, CAD has moved to support 3D virtualization [25] thanks to data access and the internet. The resulting maps are dynamic and highly interactive tools modifiable by a human by interacting with a computer, thereby becoming a real human processing system. Depending on the context, maps are likely to become increasingly interactive and intelligent in the near future, and may even be able to imitate the human brain [26]. In their paper, Jamei et al. [27] considered VR as the next step in 3D visualization.
Today, Computer-Aided Design technologies are among the most advanced tools for urban planning and modelling processes [28]. In this context, Virtual Reality (VR) is becoming common in urban planning and design [29]. By applying virtual reality technology, a project can be displayed on a computer, allowing architects and engineers to intuitively model, visualize, and observe the entire project in a realistic three-dimensional environment [30,31]. Adjustments can be made to the project to make it similar to the desired reality. Real objects and people can be placed and moved on a surface, and thanks to image recognition, these can be digitally recorded [32]. Depending on the hardware and software configurations available, the applications of VR in urban planning can be very different. Further studies on VR for architectural representation are recommended by [33], who highlighted its importance as an effective tool in urban planning.
The World Economic Forum has recognized that Virtual Reality in the public sector can help support citizen engagement, strengthen resource management and maintenance, improve public safety and emergency services, and aid in public health, sustainability, transport, urban mobility, common heritage, and tourism. In addition, virtual reality is a useful tool to demonstrate the efficiency of infrastructure initiatives by involving stakeholders in decision-making processes that directly or indirectly affect city life.
Two extremes of Virtual Reality can be recognized depending on the level of interaction with the artificial environment, namely, immersive or non-immersive. As the definition suggests, immersive technology allows users to feel fully immersed in virtual reality, blurring the boundary between real and virtual worlds [34,35]. Through a head-mounted display (HMD), the user is transported into a three-dimensional virtual world (3D), providing a truly realistic and more visceral experience than other models [36]. On the contrary, in non-immersive virtual reality the project is displayed on the screen of a computer, television, or mobile phone; no special devices are needed, and the user is not surrounded by a virtual environment [37,38]. The difference in use between the two technologies is strongly affected by the context and the type of user they are directed at. A study of age-related differences was conducted in 2019 by Plechatá et al. [39]. The performance of the elderly was much higher when using immersive reality, while for the young it was unchanged. However, in both groups immersive reality caused stress and fatigue.
The purpose of this study is to verify the validity of an urban regeneration project using non-immersive virtual reality as an assessment tool. Two different scenarios have been created, one representing the current condition and one the post-project reality. Through an online questionnaire, the perception of the relationship between actual reality (Google Earth) and virtual reality was evaluated. Then, the two virtual scenarios were compared to evaluate citizen and stakeholder perceptions of the quality of the urban spaces before and after redevelopment.

2. Context and Architectural Data

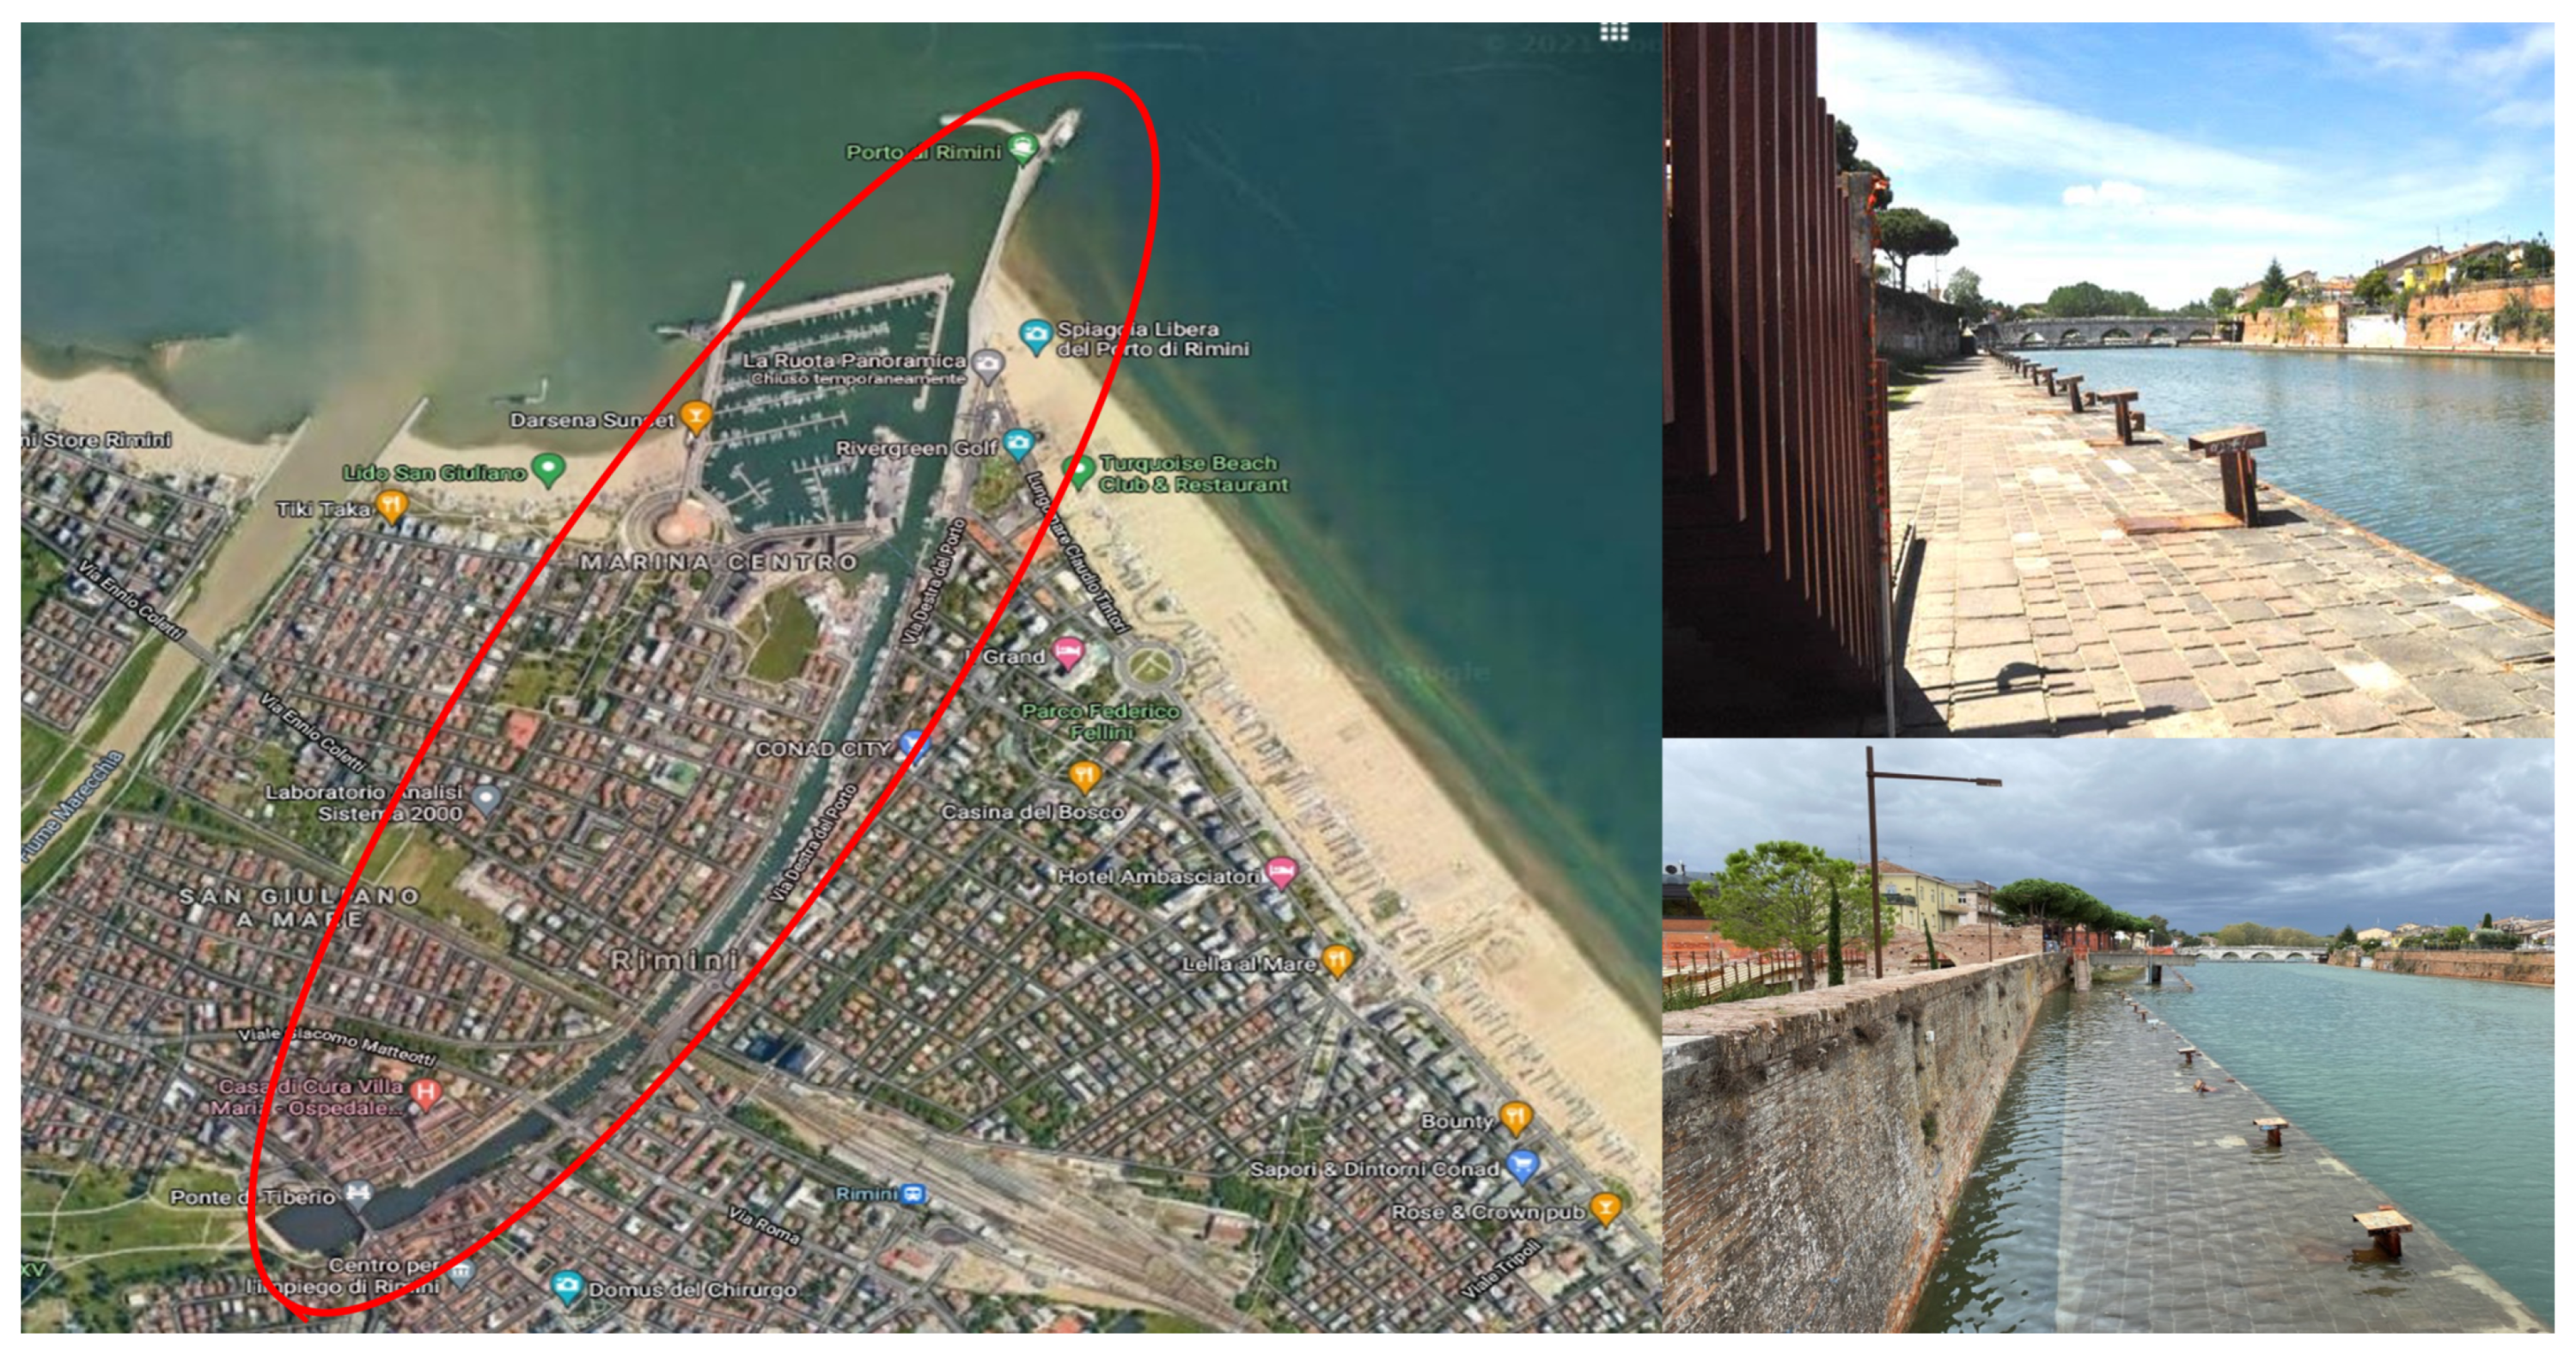
2.1. Analysis of the Rimini Area

Rimini is a sea town in northern Italy located along the Adriatic coast. Internationally famous for its long sand beach and the sea, tourism in Rimini is linked to the hotel industry for fairs, congresses, and events. The Canal of the Port of Rimini is a rather extended structure situated near the historical centre; unfortunately, it is in a state of degradation and impoverishment, and is not adequately exploited and used. In this sense, the project carried out for the Canal of the Port of Rimini has been directed to the requalification of an entire area that, while it is considered particularly degraded, has excellent potential for use.
The Canal of the Port of Rimini is located on the original mouth of the river Marecchia, and consists of docks on two sides extending on two piers. The channel is 2.2 km long, 46 m wide at the entrance and 40 m along its length up to “Parco XXV Aprile”, and divides the historic centre of Rimini from San Giuliano a Mare, an important district north of the city. All the various activities related to sea life are located on the left of the port: shipyards, mechanical workshops, the fish wholesale market, and nautical shops. Historical and cultural attractions such as “Porta Galliana” and the lighthouse, a symbol of the navy, are located on the right side. If well-connected, these could increase the charm of a place that, despite its nature of urban mobility space and the points of interest present along its course, is currently anything but a pole of attraction.
After an analysis of the urban context of the Canal, a study on the microclimate of the zone was considered, including “Parco XXV Aprile” and the seafront called “Parco del Mare”, two recently requalified areas near the canal. The study showed that the average values of temperature and humidity are within the standard values of temperate climates and the prevailing directions of the winds are east and northwest, i.e., the wind is from the sea. During the day the heat island is along the coast, while at night it is in inner city. In addition, in certain periods lower temperature values are accompanied by heavy above-average rainfall, and in certain cases higher values of the average annual temperature are linked to drier years.
A comprehensive analysis of all aspects of the study area allowed us to highlight the main problems to be addressed and solved. First of all, poor planning of transport and related infrastructure is evident. The port space is used inadequately and inefficiently, and the infrastructure in the area is degraded. In addition, the links with the main nodes of sustainable mobility, such as the railway station, have serious shortcomings and do not represent a real alternative to the use of private cars. Second, the entire area of the quays is subject to frequent flooding due to a design error dating back to 1977. This discourages people from passing through. In 1980, several water drainage channels were built; today, however, they are old and filled with stagnant water and algae, especially in summer. As a result, the whole area is full of mosquitoes that prevent tourists from exploring the place. Finally, access to the quays is possible only through stairs, which greatly reduces the usability of the area and represents a serious architectural barrier.
Based on this analysis, for the redevelopment of this area any successful project must first facilitate access to the Canal by promoting sustainable transport systems, in particular, by moving from car mobility to soft mobility. In addition, the urban space of the quays and existing road infrastructure has to be harmonized and made more functional. From this perspective, the Canal of the Port of Rimini represents a useful example for evaluating a synergistic approach to urban regeneration that considers the different aspects of urban planning, infrastructure, social cohesion, and sustainability. Priority actions were identified as the reconnection of cycle and pedestrian paths with the urban transportation infrastructure and the redevelopment and raising the docks to avoid flooding due to tides and adverse sea weather conditions. In order to allow boats to pass under bridges, in particular the “Ponte della Resistenza”, which is the lowest and therefore the most critical to cross, docks were raised to a height between 1.30 m a.s.l. and 1.50 m a.s.l. depending on the section of the port concerned. While this does not definitively solve the problem of flooding, it lengthens the return time with which flood events occur.

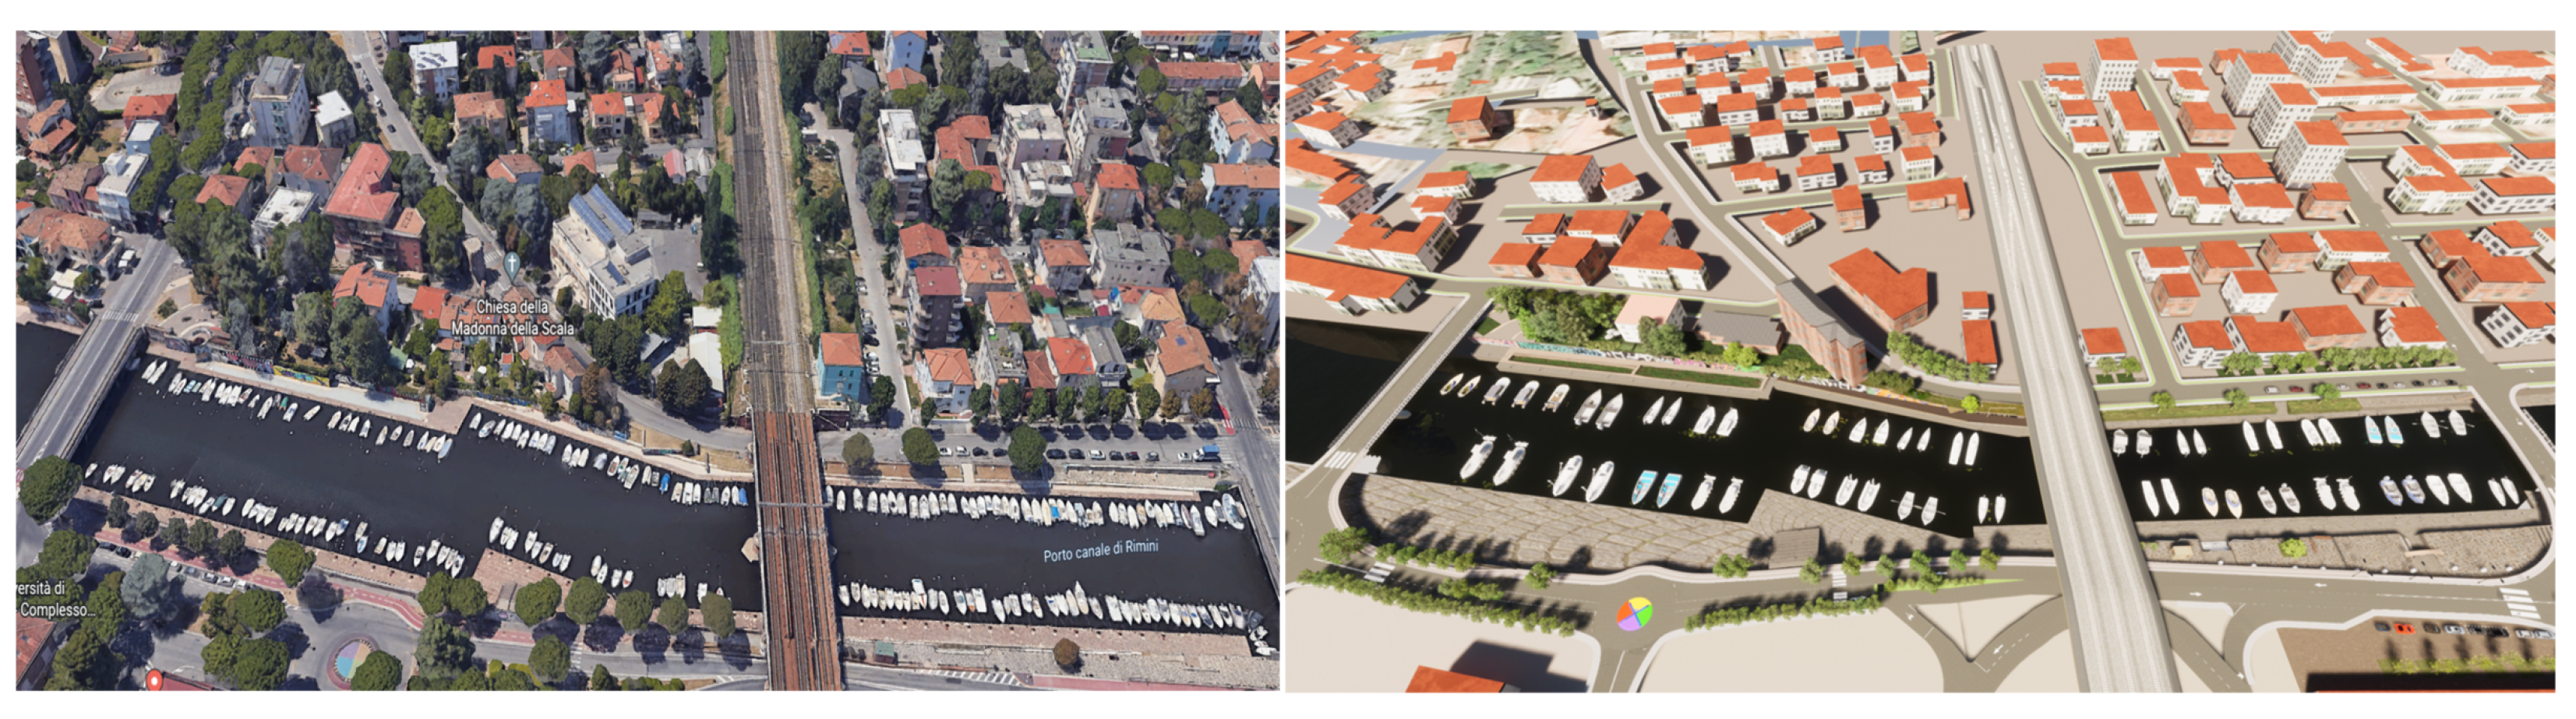
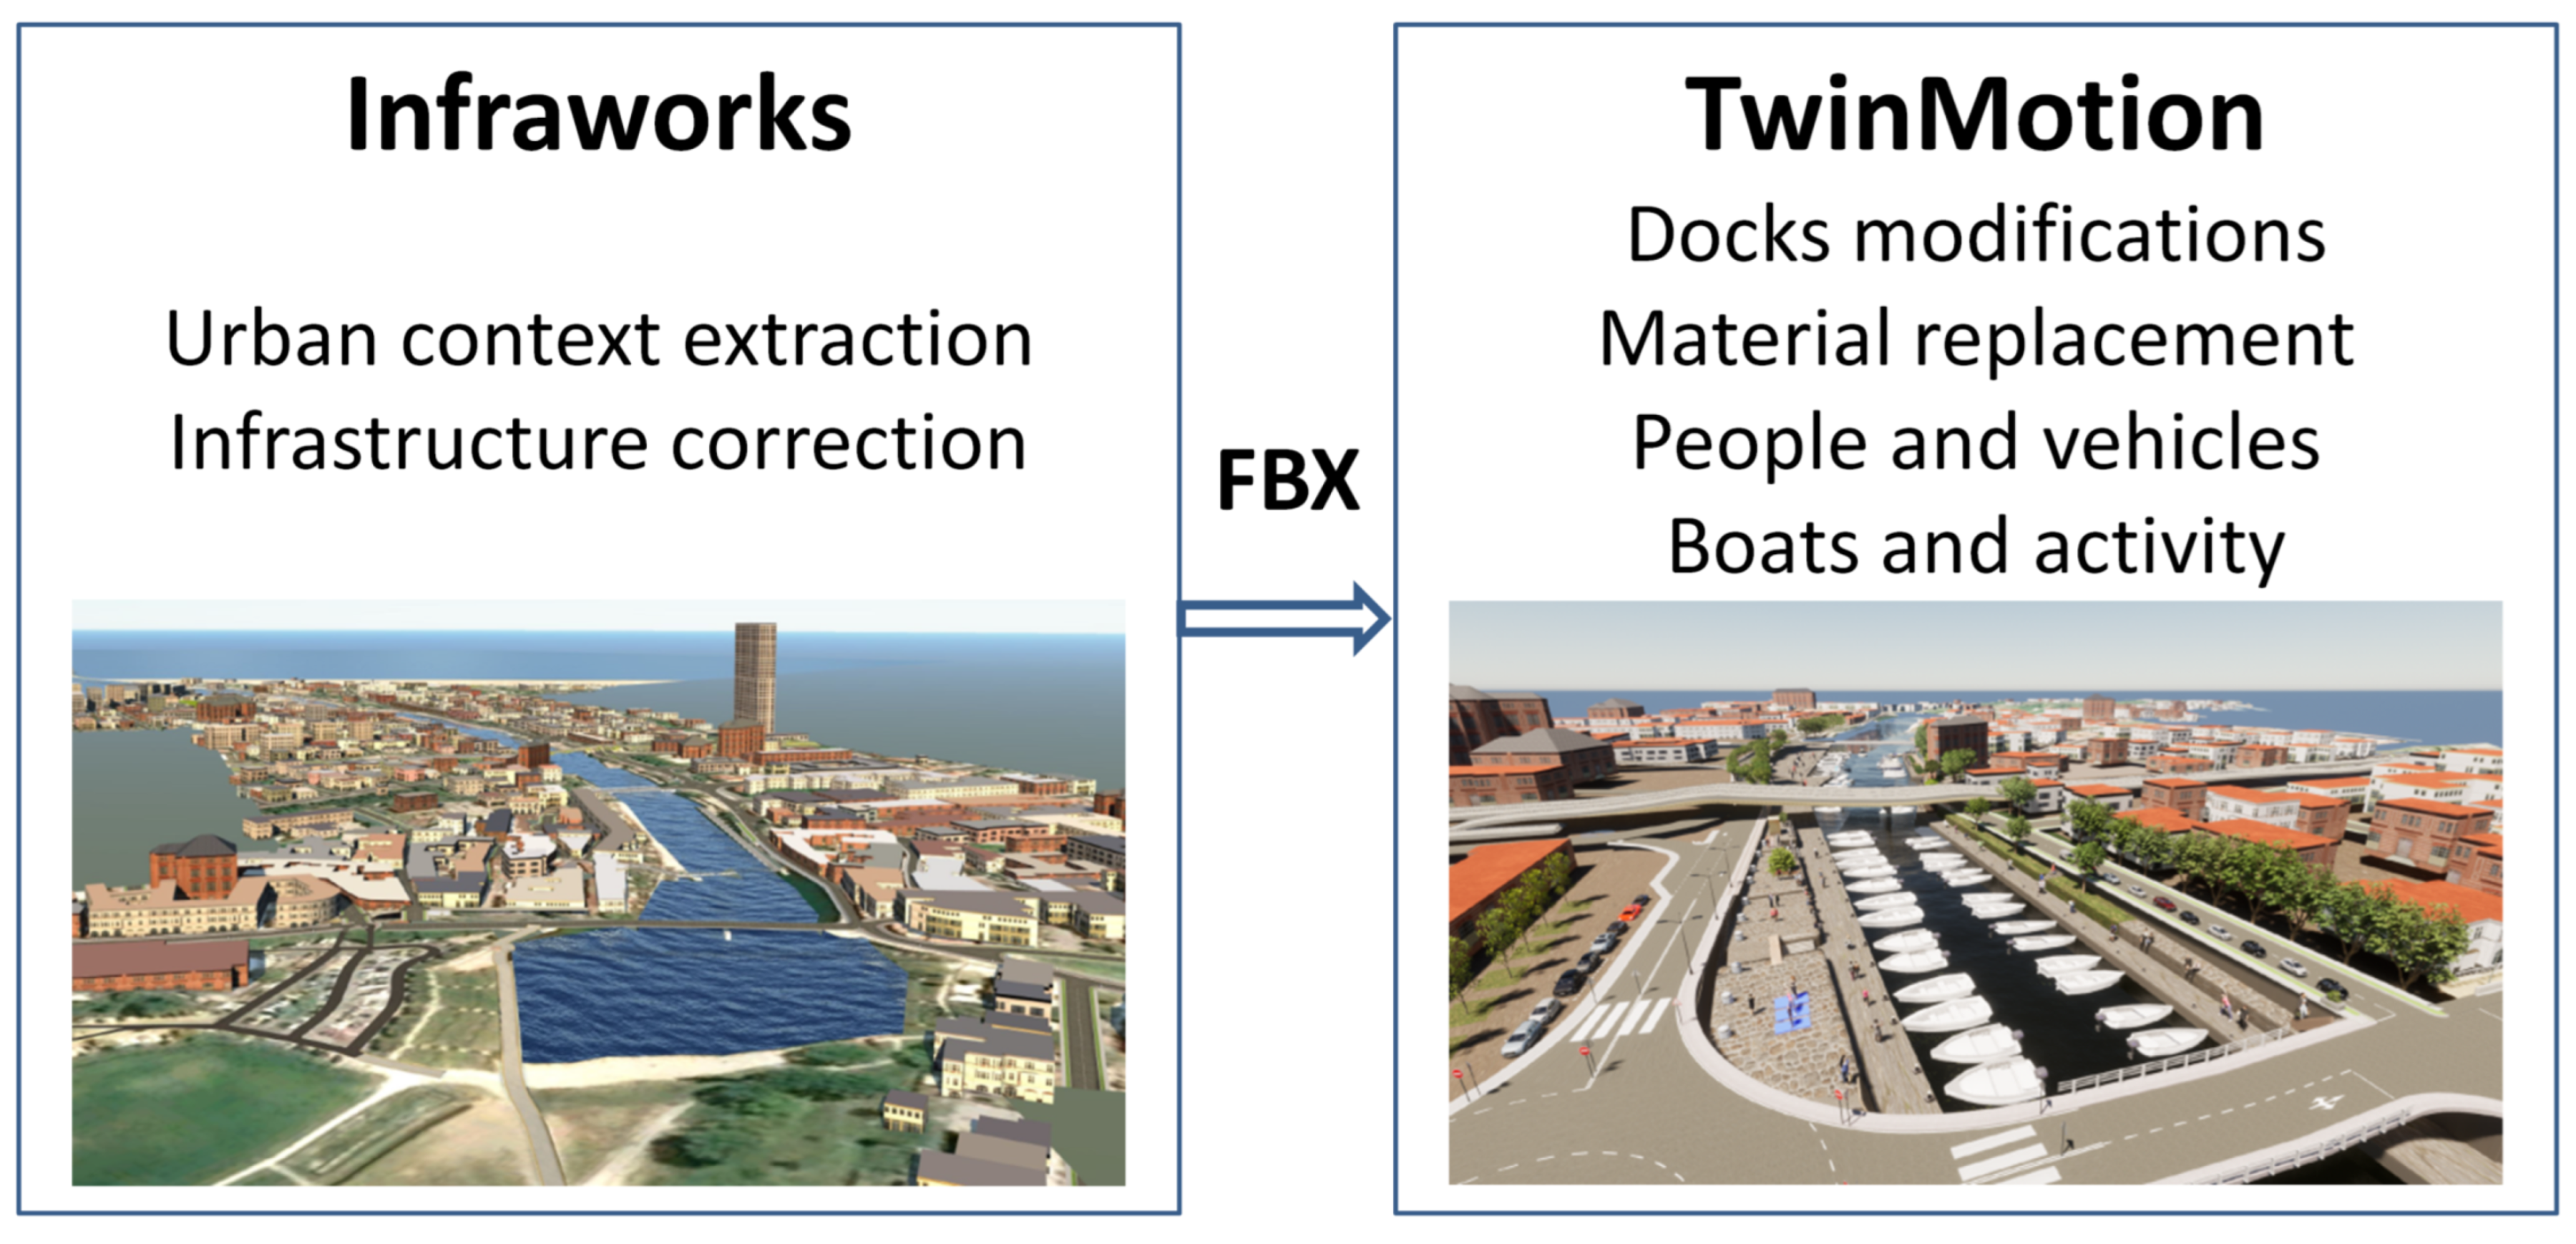
2.2. Virtual Scene Construction

Virtual reality involves an artificial three-dimensional environment that can be created with or without the use of special equipment. Virtual reality technology-based tools in city planning can be categorized into three main categories: viewing or visualization, modeling, and simulating. First, virtual reality technology as a modeling tool can be used in the process of creating 3D models of a city plan. This means that architects and engineers can use virtual reality to create a 3D model of a city [30]. Second, virtual reality as a visualization tool facilitates 3D visualization of built scenes to correct the design and development of urban cities, thereby enhancing the artistry of urban architecture and the aesthetics of urban design [40]. This can help city planners to visualize how new buildings and public spaces will look and feel and to identify potential problems before they happen. It can be used as a supplementary presentation to imagery and animations used to present 3D models for non-technical team members such as stakeholders. For instance, it can be utilized to show the public how a city will look after a major renovation or redevelopment project. Third, simulations with virtual reality technology in city planning projects can be used to predict various scenarios. This type of simulation can help in evaluating and analyzing the outcome of the various scenarios during the planning process, and can be used to make decisions based on them. Public space, for instance, is one aspect of city planning that is often used in simulations, in order to predict how specific features in a city plan will affect the public space of the area. Thus, VR is an effective way to model, visualize, and simulate the environment, and planners can use it to analyze and modify the city virtually before initiatives are properly implemented in the real world [41,42].
It is important to employ the right VR software. TwinMotion is one of the most popular and powerful virtual reality tools. It is an advanced architecture software with many essential and useful features. An overview of the city can be assessed from any angle, with options including lighting, shadowing, and a considerable amount of 3D assets. The content of the city can resolve tiny detail, including buildings, bridges, harbors, structures, road systems, green areas, facilities such as playgrounds and parks, etc., with a very realistic level of detail.
This part of the study involved the use of quantitative methods to support the participatory urban planning processes. Thus, VR technology as an effective tool in the participatory urban planning processes was applied to the case study of the Rimini Port Canal. The aim of using this tool was to depict the proposed redevelopment and re-connection of pedestrian and cycle paths. TwinMotion was used to create a design for a sidewalk that can help users navigate through the area efficiently. In addition, it was used to model different cycling and street infrastructure options. For this purpose, a 3D VR model of the Rimini Canal was created and was used to create two scenarios: one representing the current situation before urban regeneration, and the other representing the future after urban regeneration. The final phase included creating an online survey to obtain feedback from the study participants.
The design proposal for the project focused on the area between the Ponte della Resistenza Bridge and the Tiberius Bridge, as illustrated in Figure 2. A technique was applied to enable the visualization of Rimini’s topography and streets in combination with the morphology of the ground in order to better understand the area. Following careful investigation, it appeared that the InfraWorks software would be the most suitable alternative.
It is possible for professionals to model, evaluate, and visualize infrastructure design concepts in the context of a construction site using InfraWorks conceptual design software. Because of this particularity, it was possible to extrapolate the affected area of Rimini from the surrounding environment using the “Model Builder” command.
With this command, the user selects the region to be modeled or imports it as a polygon. The computer processes the request and generates the required model within a few minutes. The program mostly displays data from OpenStreetMap; in detail, the urban context includes:
  • Highways and railroads: the model’s road and rail elements are created using the OpenStreetMap highway and rail databases.
  • Buildings: the OpenStreetMap collection includes information about buildings.
  • Images: Microsoft® Bing Maps satellite imagery is used to cover the model’s topography.
  • Elevation: global terrain data are provided in Digital Elevation Models (DEM) of 10 and 30 m in resolution depending on the region of interest and its geographic location. Terrain data for the US and its territories are based on 10 m USGS DEM data from the National Elevation Dataset (NED). Between −60° and +60° latitudes, 30 m DEM SRTMGL1 data are utilized. For latitudes between + 60 and + 83 degrees, DEM ASTER GDEM v2 data with a resolution of 30 meters are utilized.
  • Water: data on water bodies are derived from the OpenStreetMap dataset.
The model created in InfraWorks was exported as an .FBX file and imported into TwinMotion after being rendered in the software. The workflow of the construction of the virtual scene is illustrated in Figure 3.
InfraWorks allowed us to extract the urban context of the project, that is, the infrastructure and buildings with texture. Nonetheless, it was a coarse model, and structural corrections had to be made manually for the elevation of bridges, roads, and roundabouts. In addition, the docks and roads are displayed at the same altitude as the water, which does not match reality. The representation of the docks was particularly coarse, and had to be completely redone for this study. We used TwinMotion archviz software for local refinement of the 3D models.
The docks were redrawn to match the reality of the current layout of the port of Rimini based on DWG drawings of the area. Their elevation was corrected to ensure that the levels between the roads and the docks and between the docks and the water conformed to reality. The materials of the street were replaced as well in order to be more photorealistic, and we added people and vehicles to the virtual scenes. These characters in the scene only stand or sit; we chose to use a static study, as including moving people and vehicles was beyond the scope of the presented work. The same number of people were included on the docks for both the current and prospective scenarios. We added boats on the water to reflect the port environment, and activities were added following the architectural proposition described in [2].
Three videos illustrate the content of the study:
  • A comparison between the real environment and virtual scene for the urban context in the reference scenario is illustrated in Video 1 www.youtube.com/watch?v=FGt6tZ7YvXI, accessed on 20 March 2023. We used Google Earth Studio to visualize the current real environment.
  • Current situation in 2022: the virtual scene of the reference situation can be seen in Video 2 www.youtube.com/watch?v=nY7cNg0jIgs, accessed on 20 March 2023.
  • The urban regeneration project representing the proposed future situation can be seen in Video 3 www.youtube.com/watch?v=2olh-JRaNr4, accessed on 20 March 2023.
Figure 4 shows extracted examples of these 3D virtual scenes.

2.3. Assessment of the Renovation Project

2.3.1. Which Features of Streetscape Impact the Public Experience?

The term streetscape is applied to characterize the natural and built fabric of a street, and is outlined as the design features and visual effect of the street, especially how the paved area is structured and maintained. Sustainable streetscape design involves technology that controls flood risk and lowers carbon footprint to make sure that spaces are long-lasting and that their features are components of the wider ecosystem. This can help to produce better places to live for current and future citizens [43]. A streetscape is a public space that promotes vitality and shows a sense of belonging to a city. It can be defined as a neighborhood’s character in terms of its physical infrastructure, cultural history, and interaction with other people. These factors influence the quality of life and the mental and physical wellness of its residents [44]. The design and appearance of the streetscape can help to create a visual image of a sustainable city. It is one of the most important elements in helping to attract tourists to a city [45]. Therefore, one of the most important factors for evaluating the success of the city is the design of the streetscape.
Unfortunately, there are many cities that do not have the proper standards for streetscaping, which can negatively affect the visual image of their cities [43]. In this context, our research explored the various aspects of sustainable streetscaping to determine how it can be integrated into the urban development and infrastructure framework in the Canal of Rimini area to create an attractive and safe environment.
The key performance indicators that must be designed and implemented properly to improve the area are identified as follows:
  • Sociality: the ability of people to communicate is a basic and fundamental kind of social interaction.
  • Walkability: facilitation of mixed-use development (i.e., residential, commercial, institutional) where people can comfortably walk to services within a reasonable distance.
  • Accessibility: improving access to the docks to increase their public usage.
  • Intermodality: use of multimodal transportation by making its modalities easily accessible.
  • Activities: intensify life on the docks by providing more activities.
  • Aesthetics: contribute to the improvement of the natural landscape and effectively interact with the modern structure of urban territory (roads, spaces, and paths) within the landscape.
  • Services and functions: provide leisure services such as bars, tourism, sports facilities, and outdoor activities.
  • Connectivity: ensure that individuals can move easily between and within the central city and suburbs.
  • Sustainable mobility: sharing services, use of cycling and pedestrian paths, ICT services.
  • Safety: make sure public places and spaces are as safe and pleasant for people as possible.
There is no shortage of research on the characteristics of spaces designed to accommodate walkers or bicycle users [46], and there are many lists of criteria and tools for checking them [47,48]. Many studies have looked at walkability; for example, [49] proposed five criteria for a walkable city: convivial, convenient, connected, clear, and comfortable. According to [50], walkability can be considered either as a characteristic of a place or as an evaluation by an individual. More broadly, walkability is related to the physical characteristics of a space, such as the width of the sidewalks, the density of traffic, the shade provided by trees, population density, and weather, as well as the characteristics of urban design that influence the perception of users from a more subjective point of view (whether it is memorable, provokes feelings, is well-defined while being connected to the rest of the city, its a human scale, and whether it is organized and clean). Walkability can include what can be achieved within a spaces, in particular the presence of shops and services [51]. Finally, walkability is related to peoples’ frequenting of a place (number, type, appearance, and activities) or the presence of nature (sound, smell, and sight) [52]. Other studies that have not directly addressed walkability or cyclability have studied the “atmosphere” of an area using criteria such as safety, beauty, smell, feeling of safety (lighting, perception of spaces, level of road traffic), feeling of comfort [53], and sociability [54].
In our Rimini Port Canal case study, the objective of designing a good streetscape is to enhance social and economic interaction through improving the environmental quality, creating social well-being by establishing streets that are a good fit for public walking, and providing gathering areas where social interaction can occur regularly, while encouraging outdoor activities. Other goals include to maintain the urban fabric by enhancing the appearance of the city and to improve public health by supporting and facilitating walking and other leisure activities.

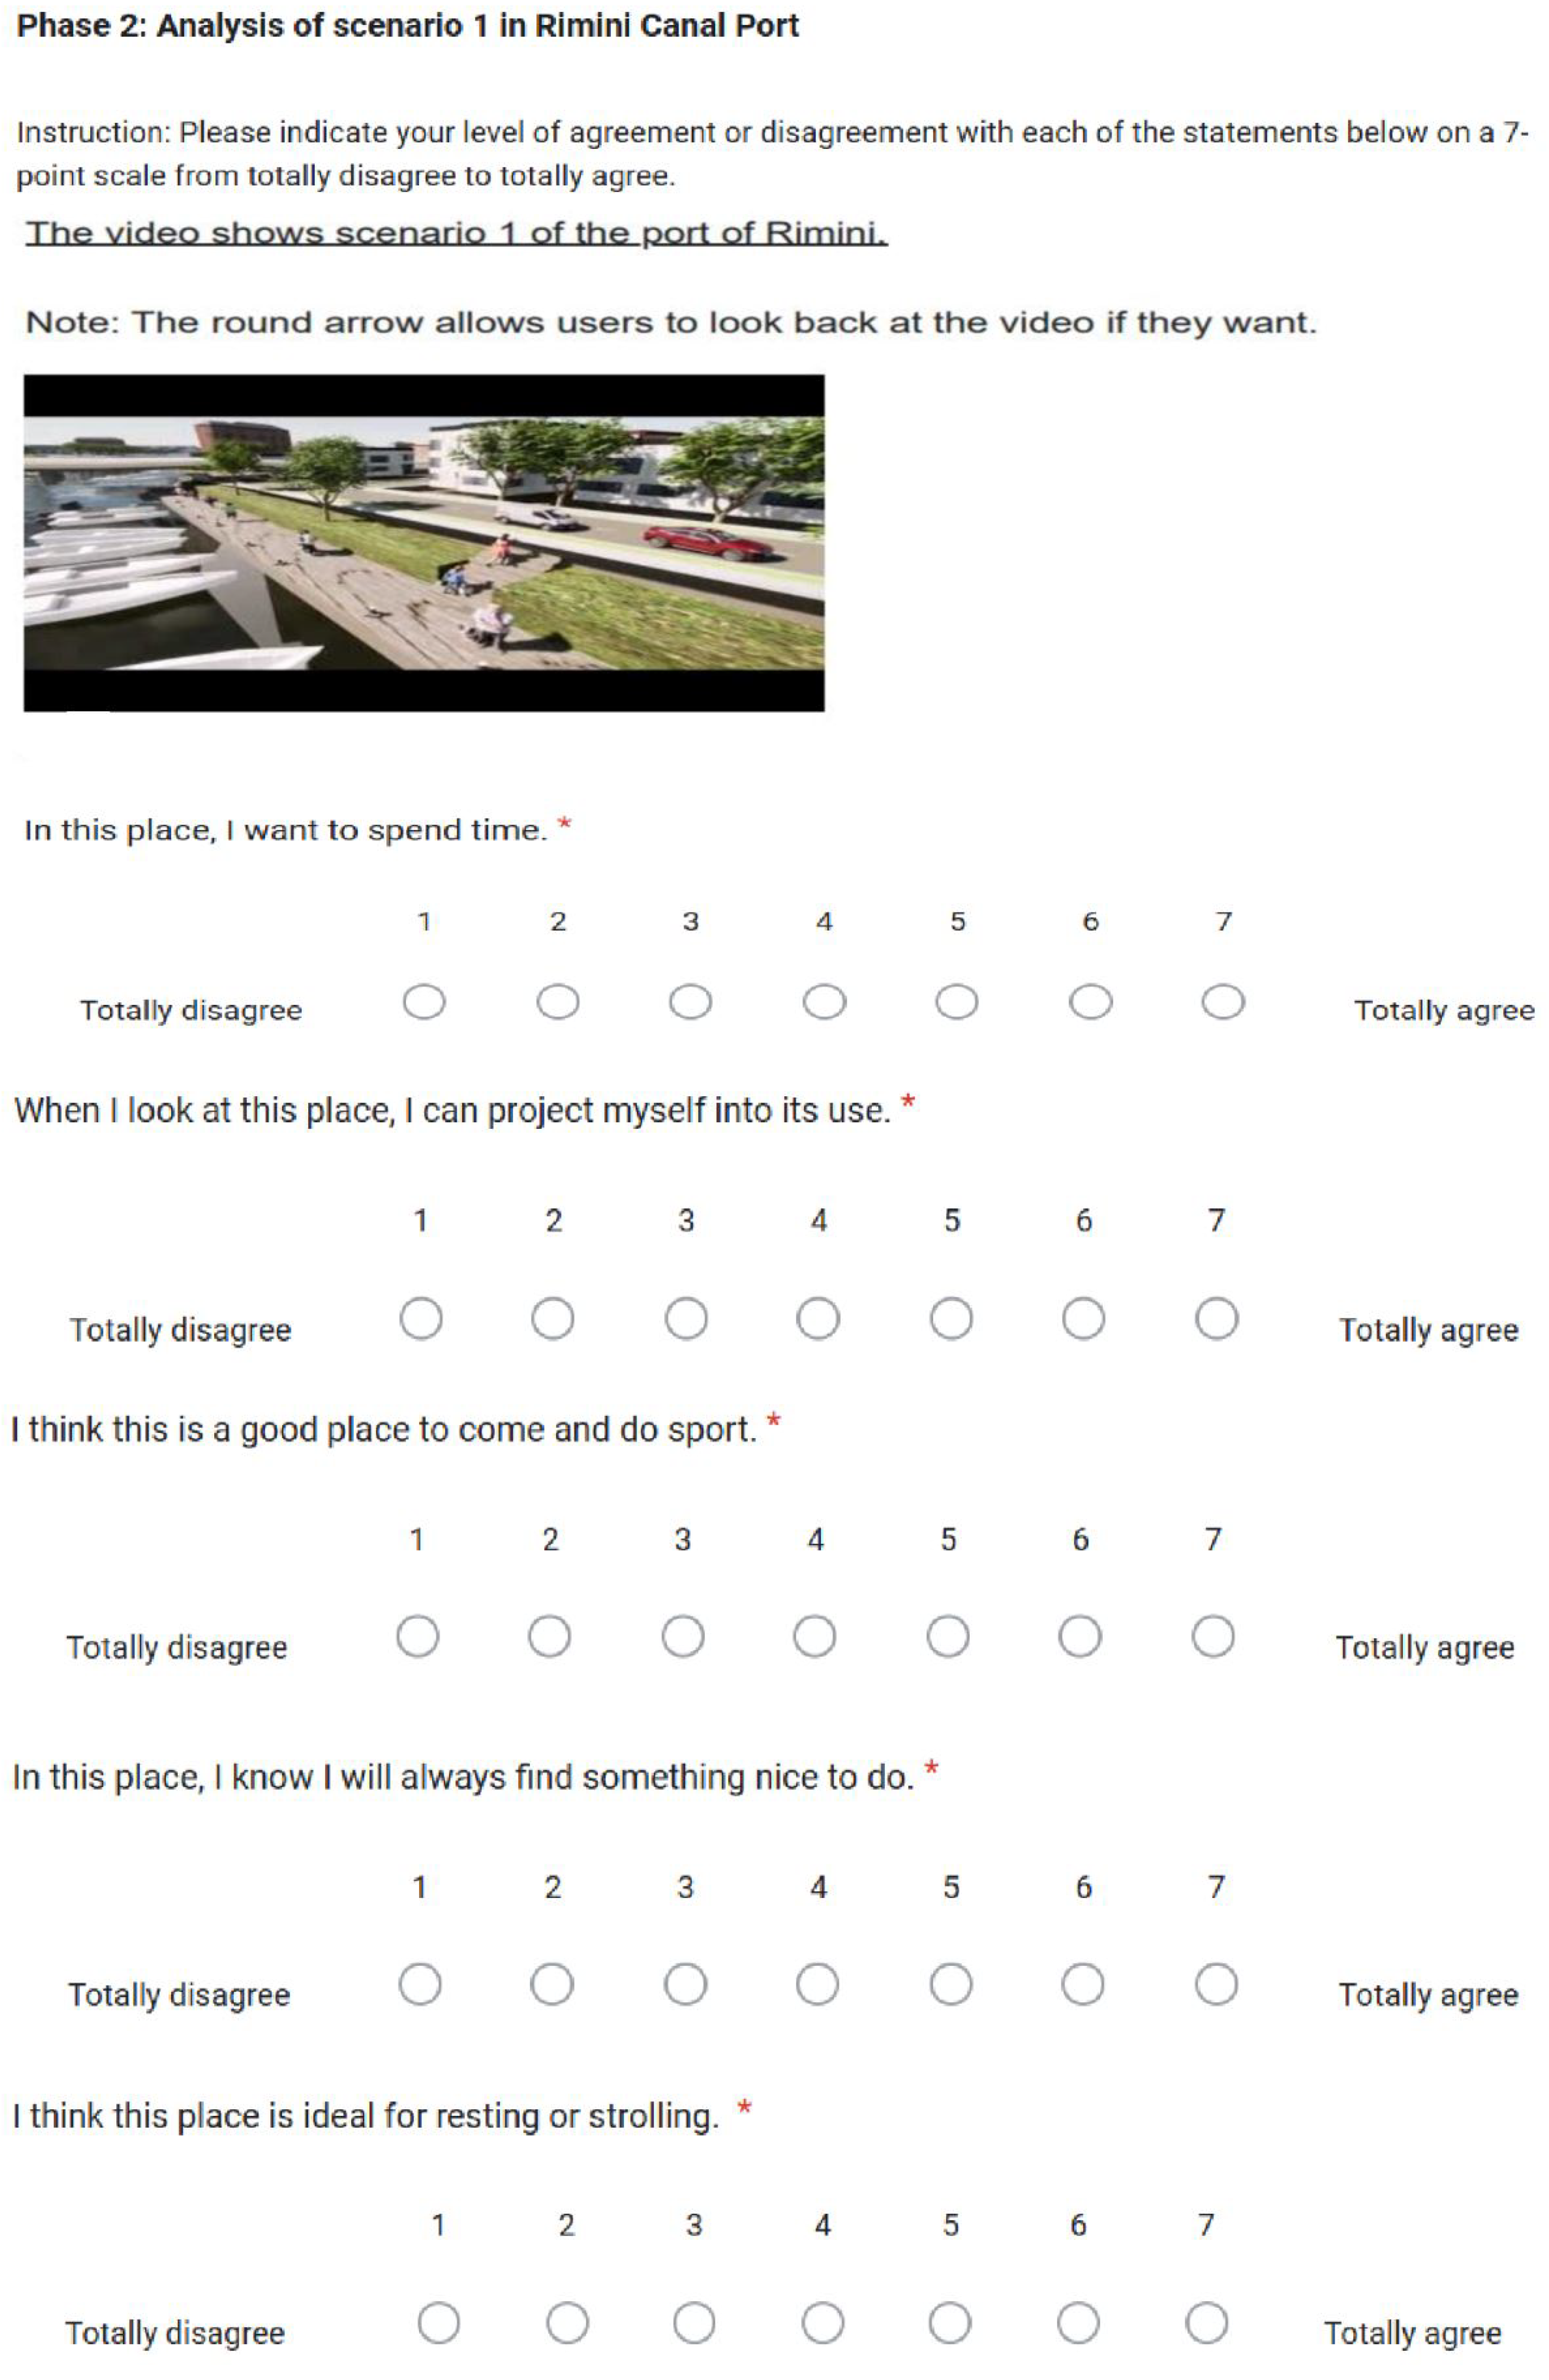
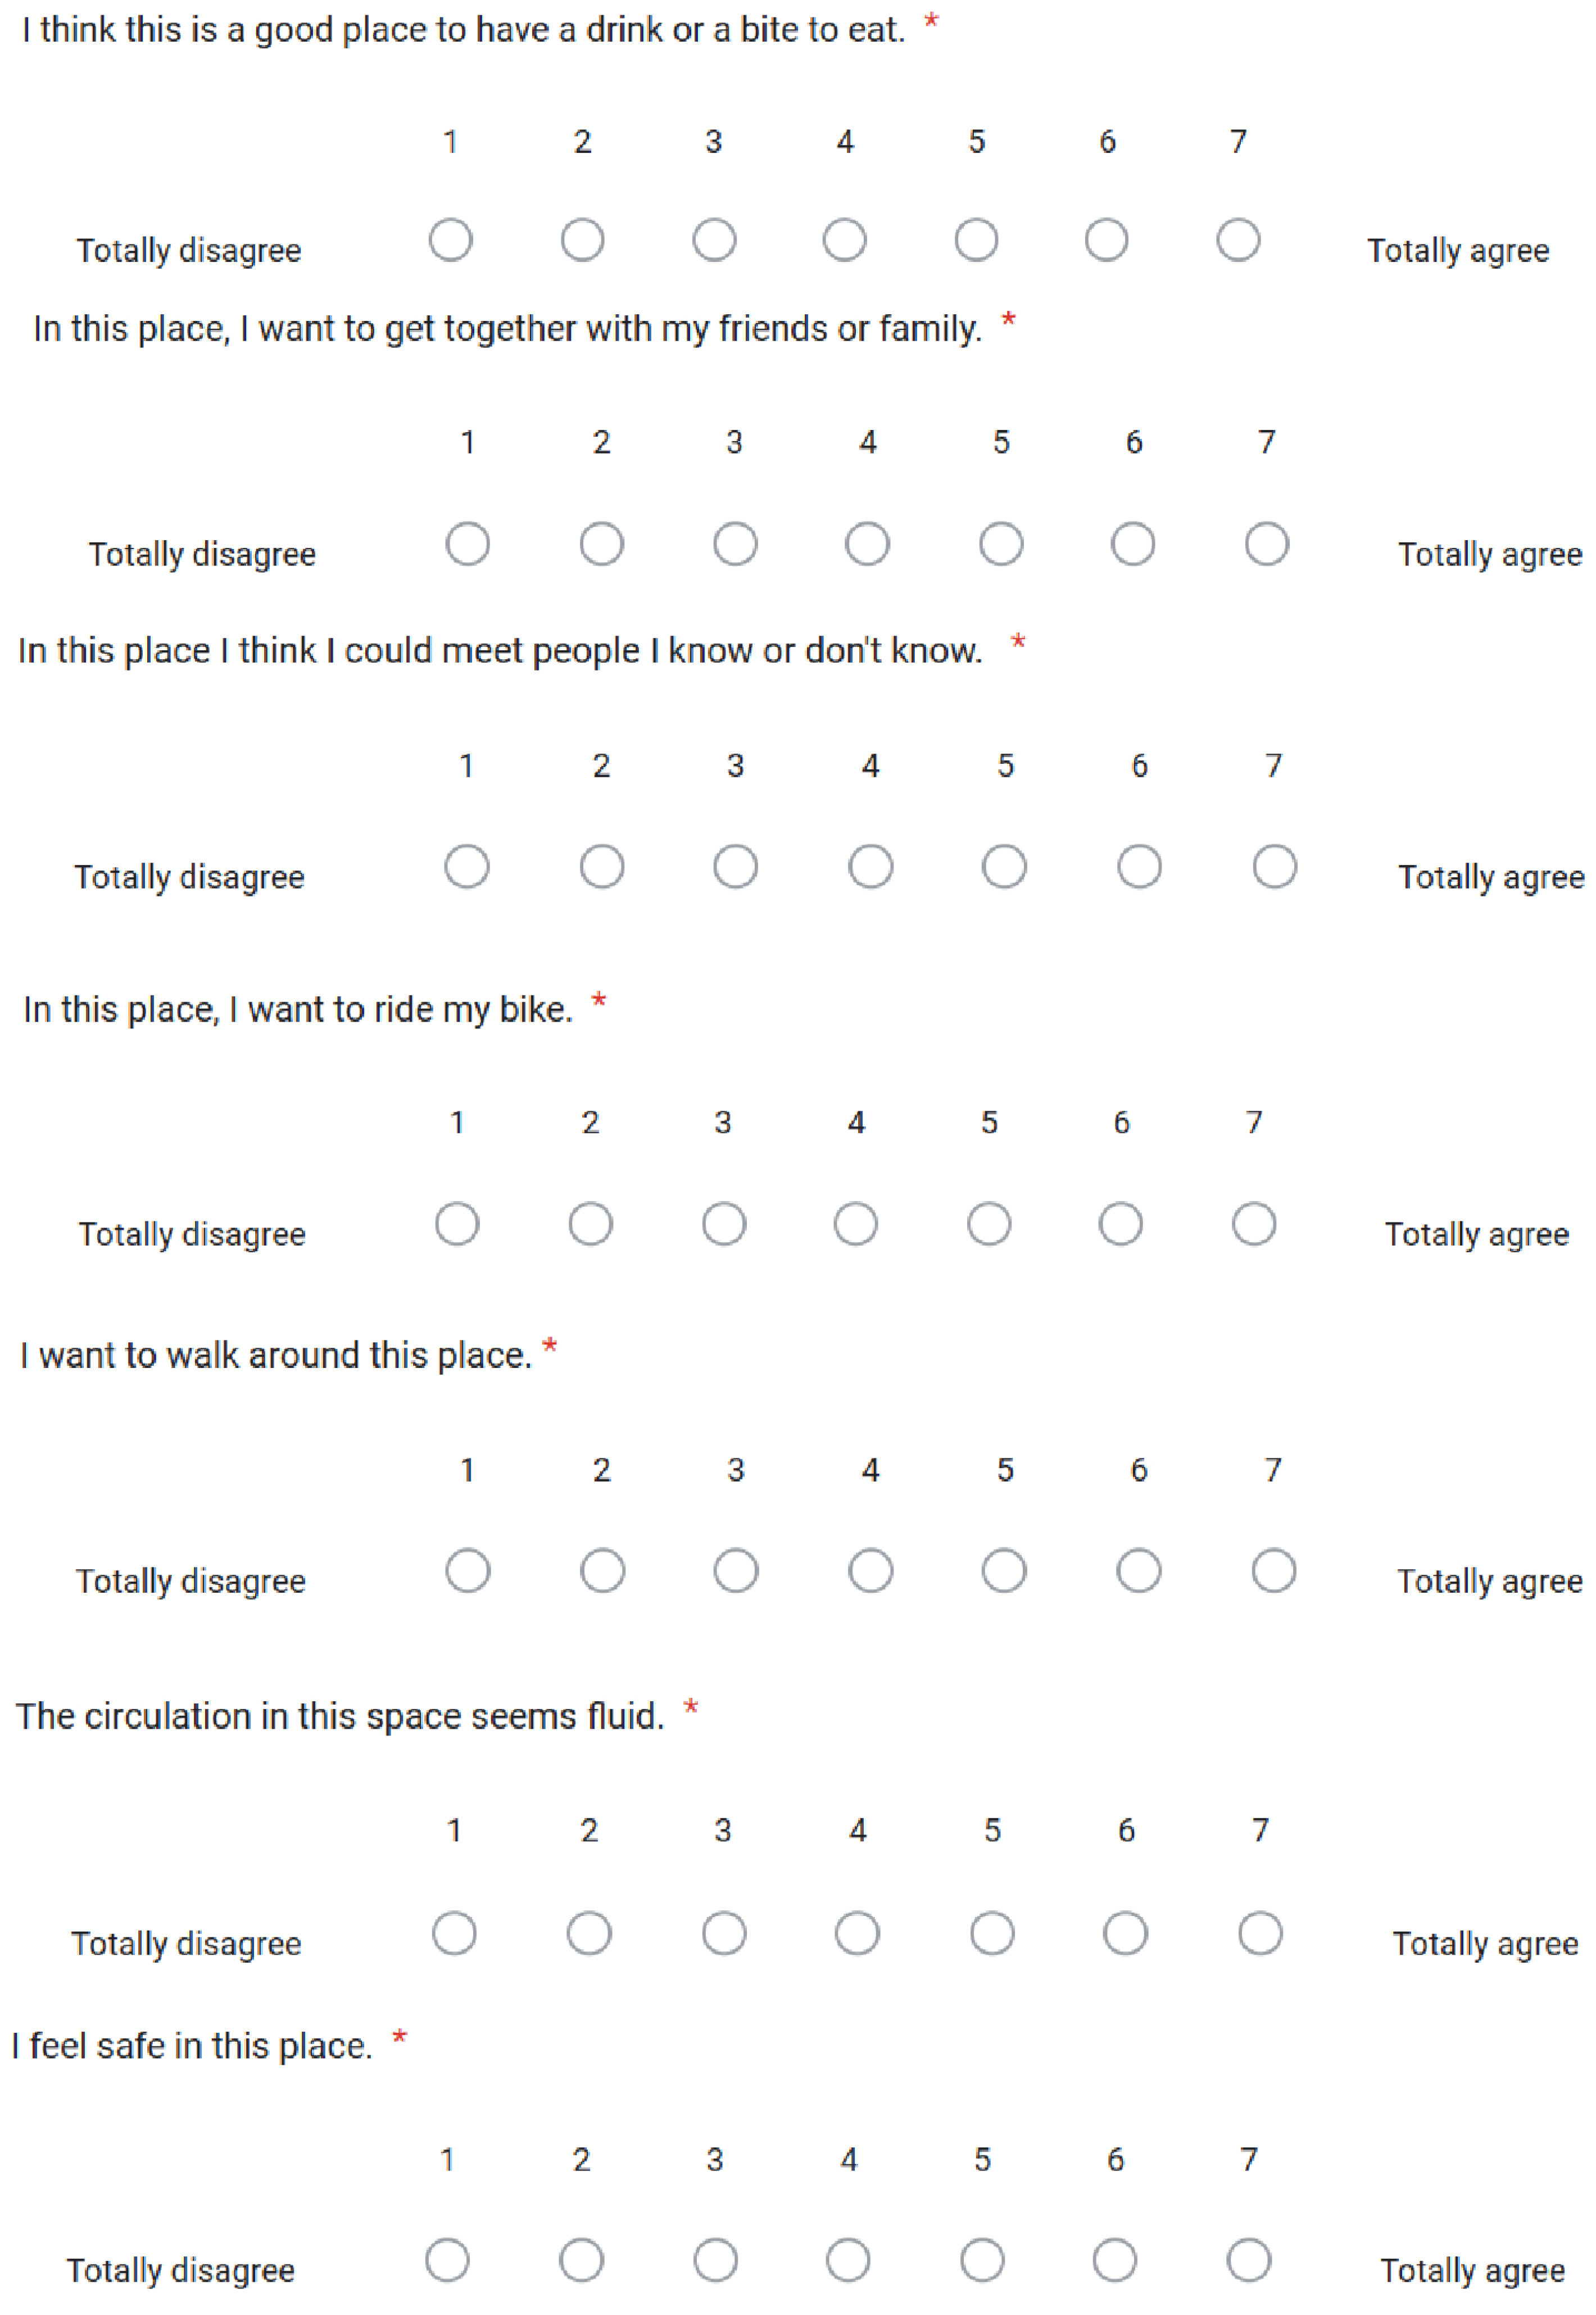
2.3.2. Participatory Sustainable Design through an Online Questionnaire

After the 3D model and immersive visits were built, a questionnaire-based approach was conducted. The aim of the questionnaire was to collect data about the quality of public spaces and social interactions based on the perceptions of stakeholders. The survey’s questions were derived from the literature and references concerning the factors that influence the quality of public spaces, as well as from the results of the previous steps in this study. The subject matter included the type of life on the docks, services and functions, sociality, walkability and cyclability, aesthetics, and access to the docks.
Multiple-choice questionnaires were designed with Google Forms and sent online to various groups and individuals from the University of Bologna and University Gustave Eiffel. The participants involved in this phase were workers, researchers, and students at both Universities.
The questionnaire was grouped into four parts. Part 1 focused on the comparison between the current situation as displayed by Google Earth and as displayed by TwinMotion. Part 2 concentrated on analysis of Scenario 1 for the Rimini Canal. Part 3 was centered on analysis of Scenario 2 for the Rimini Canal. Finally, Part 4 aimed to retrieve general information about the participants. The questionnaire was completely anonymous and took less than 10 min to complete.
Part 1 aimed to validate the realism of the virtual reconstruction of the current situation of the channel of the Rimini Port Canal in 2022. Two videos were displayed simultaneously, one showing the current situation with Google Earth imagery and the other showing the virtual scene of the Rimini Port Canal as displayed by TwinMotion. Participants were asked to compare the differences or similarities between the two videos with a set of four questions: a general question, then questions about specific characteristics of the scene such as green areas, access, and bicycle spaces. Figure A1 summarizes the questions asked on this topic. In order to allow for comparison, the two videos were presented simultaneously, and used the same angle and viewing distance.
In Part 2, a two-minute video was presented showing the current situation in virtual reality before urban regeneration. Participants were asked to assess the space presented in the video based on various criteria, such as willingness to spend time there, projected use, and willingness to practice activities (see Table 1).
In Part 3, a two-minute video was presented showing the future situation in virtual scenes after urban regeneration. Participants were asked to assess the space presented in the video based on the same criteria as in Part 2. The results are shown in Figure A4. The videos used in Parts 2 and 3 were made from the same model, with the same tour of the docks and the same number of passers-by, in order to control the effect of density on the evaluation.
For the three first parts, we used a seven-items Likert-type scale, ranging for the first part from Totally Different (1) to Totally the Same (7) and for the two next parts from Totally Disagree (1) to Totally Agree (7).
Part 4 was optional and related to general information about participants, including their age, gender, occupation, and mode of transport used. This part aimed to collect information in order to test the links between the respondents’ perceptions and their individual and mobility characteristics. Figure A5 illustrates this last part of the questionnaire.

3. Experimental Results

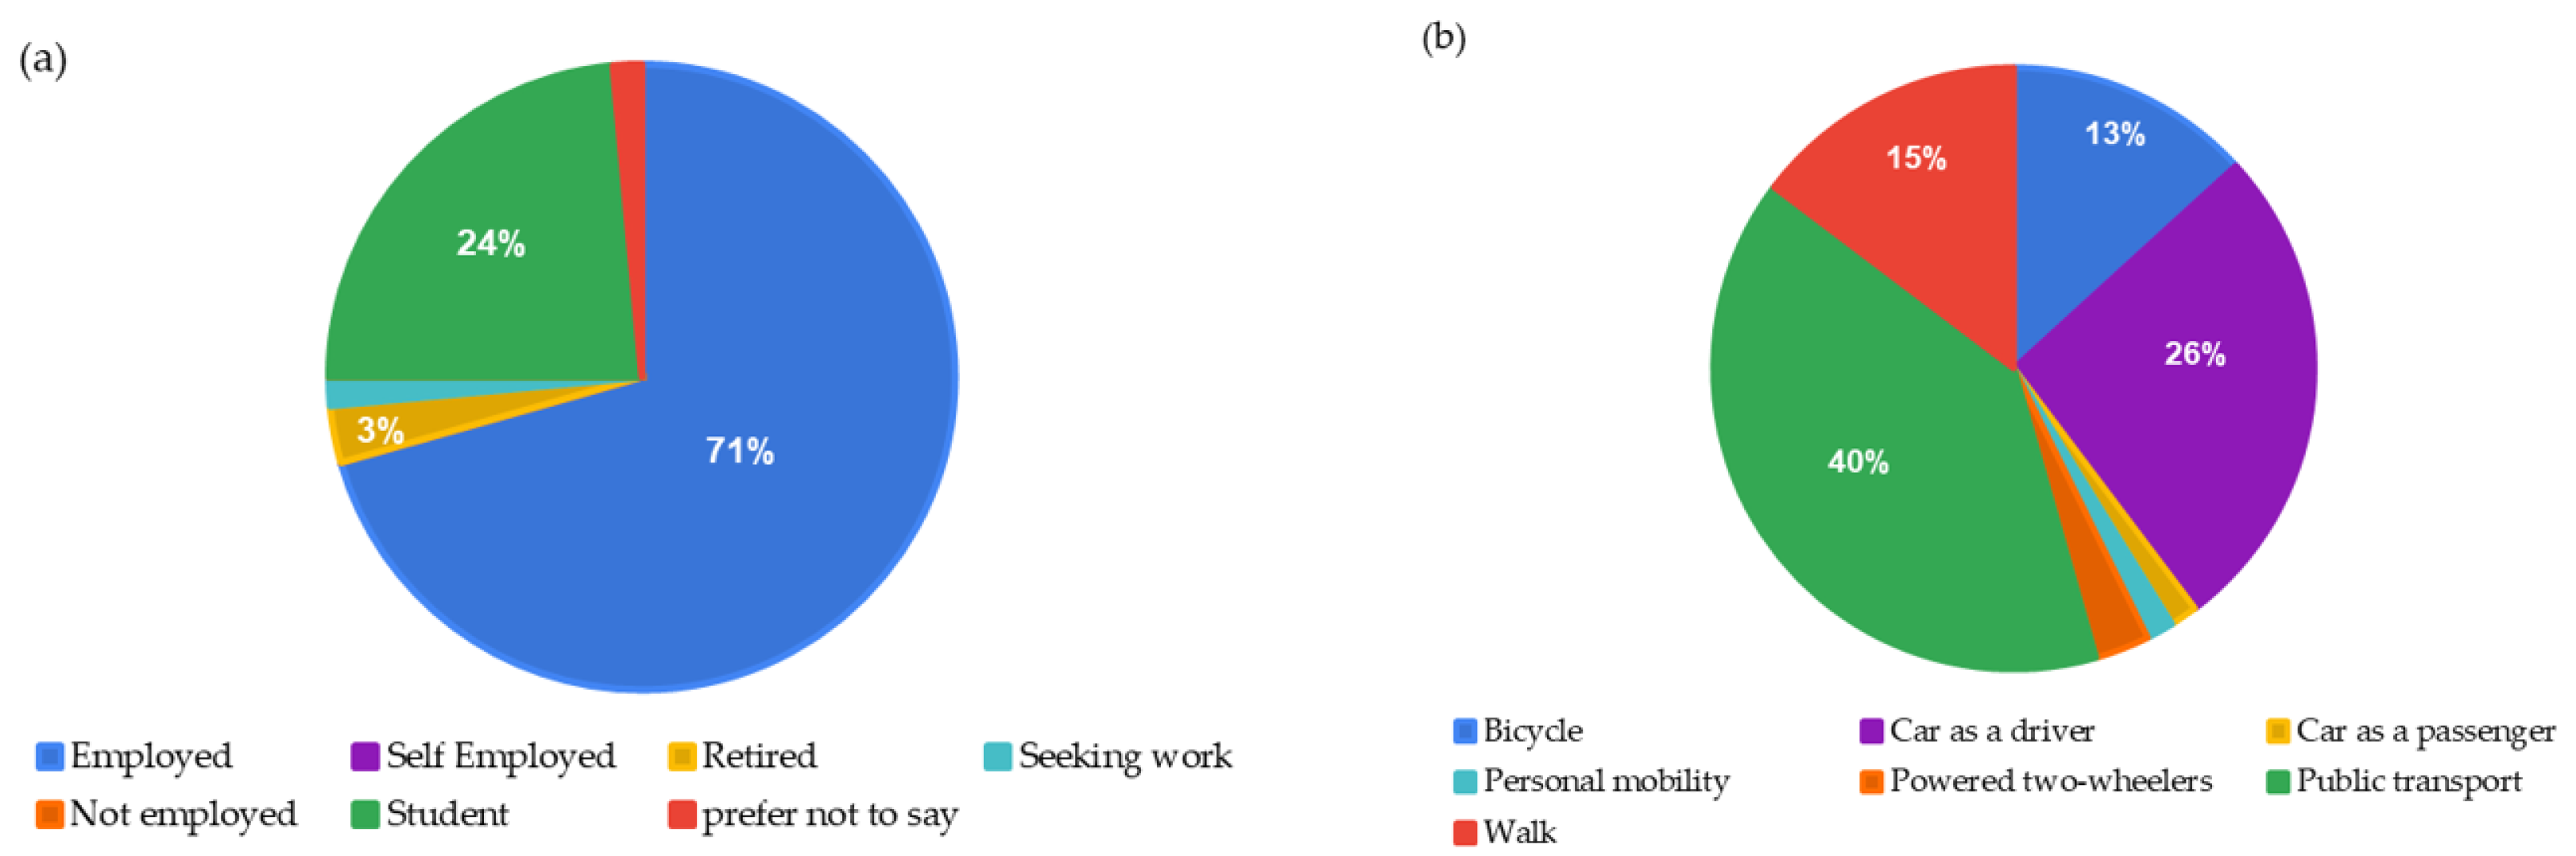
3.1. Sample Individuals

The questionnaire was proposed online for three weeks. A set of answers from N = 68 participants was collected. The sample was roughly half male and half female, with ages between 22 to 66 years old (M = 36.52, SD = 12.99). As shown in Figure 5a, a quarter of the respondents were students and three-quarters were personnel from the two universities, either professors or researchers. As for the main transportation modes, public transportation was the main mode and was used by 40% of the respondents, as illustrated by Figure 5b; 25% generally used a private vehicle, while a third of the participants used soft transportation, which was equally split between walking and bicycling.

3.2. Realism of the Virtual Scene

We produced two visualizations of the same area of the Port of Rimini under the current scenario. As illustrated by Figure 2, Visualization 1 represents the real world images made with Google Earth Studio and Visualization 2 is its virtual counterpart tailored for this project. Four questions were included in the survey to qualify aspects related to the similarity of the represented area, green spaces, cycle spaces, and access to the docks.
It has to be noted than one limitation of this work is the resolution of the two videos presented in Visualization 1 and Visualization 2. The overall objective of the project was to provide a methodology for visual comparison between two scenes of the infrastructure before and after modification. While the resolution difference between the Google Earth Studio video and the TwinMotion video undoubtedly had an impact on the respondents’ perception of the scene, it was impossible to address this as they used two different software types. However, because we are mostly interested in functional aspects of the virtual representation, we believe that ensuring a similar resolution is not an imperative element of this study.
The first part of the survey provides information about the realism of the virtual representation of the studied area. For this, we asked participants to evaluate the similarity between the real current situation and the current situation as represented by TwinMotion with respect to four aspects. Figure 6 shows the result of this first part of the study. From the point of view of the global evaluation, the participants seemed to think that the two situations were rather similar, as shown in Table 2 (M = 4.09, SD = 1.50). This allows us to consider the results obtained subsequently as valid. On the other hand, in terms of detail the respondents were more reserved on the similarity from the point of view of green spaces (M = 3.99, SD = 1.81), cycling spaces (M = 3.97, SD = 1.78), and access to platforms (M = 3.91, SD = 1.71). This is evidenced by the dispersion of the scores obtained in Figure 7, Figure 8, Figure 9, Figure 10 and Figure 11. This obliges us to consider the results obtained for certain questions in Parts 2 and 3 with more caution.

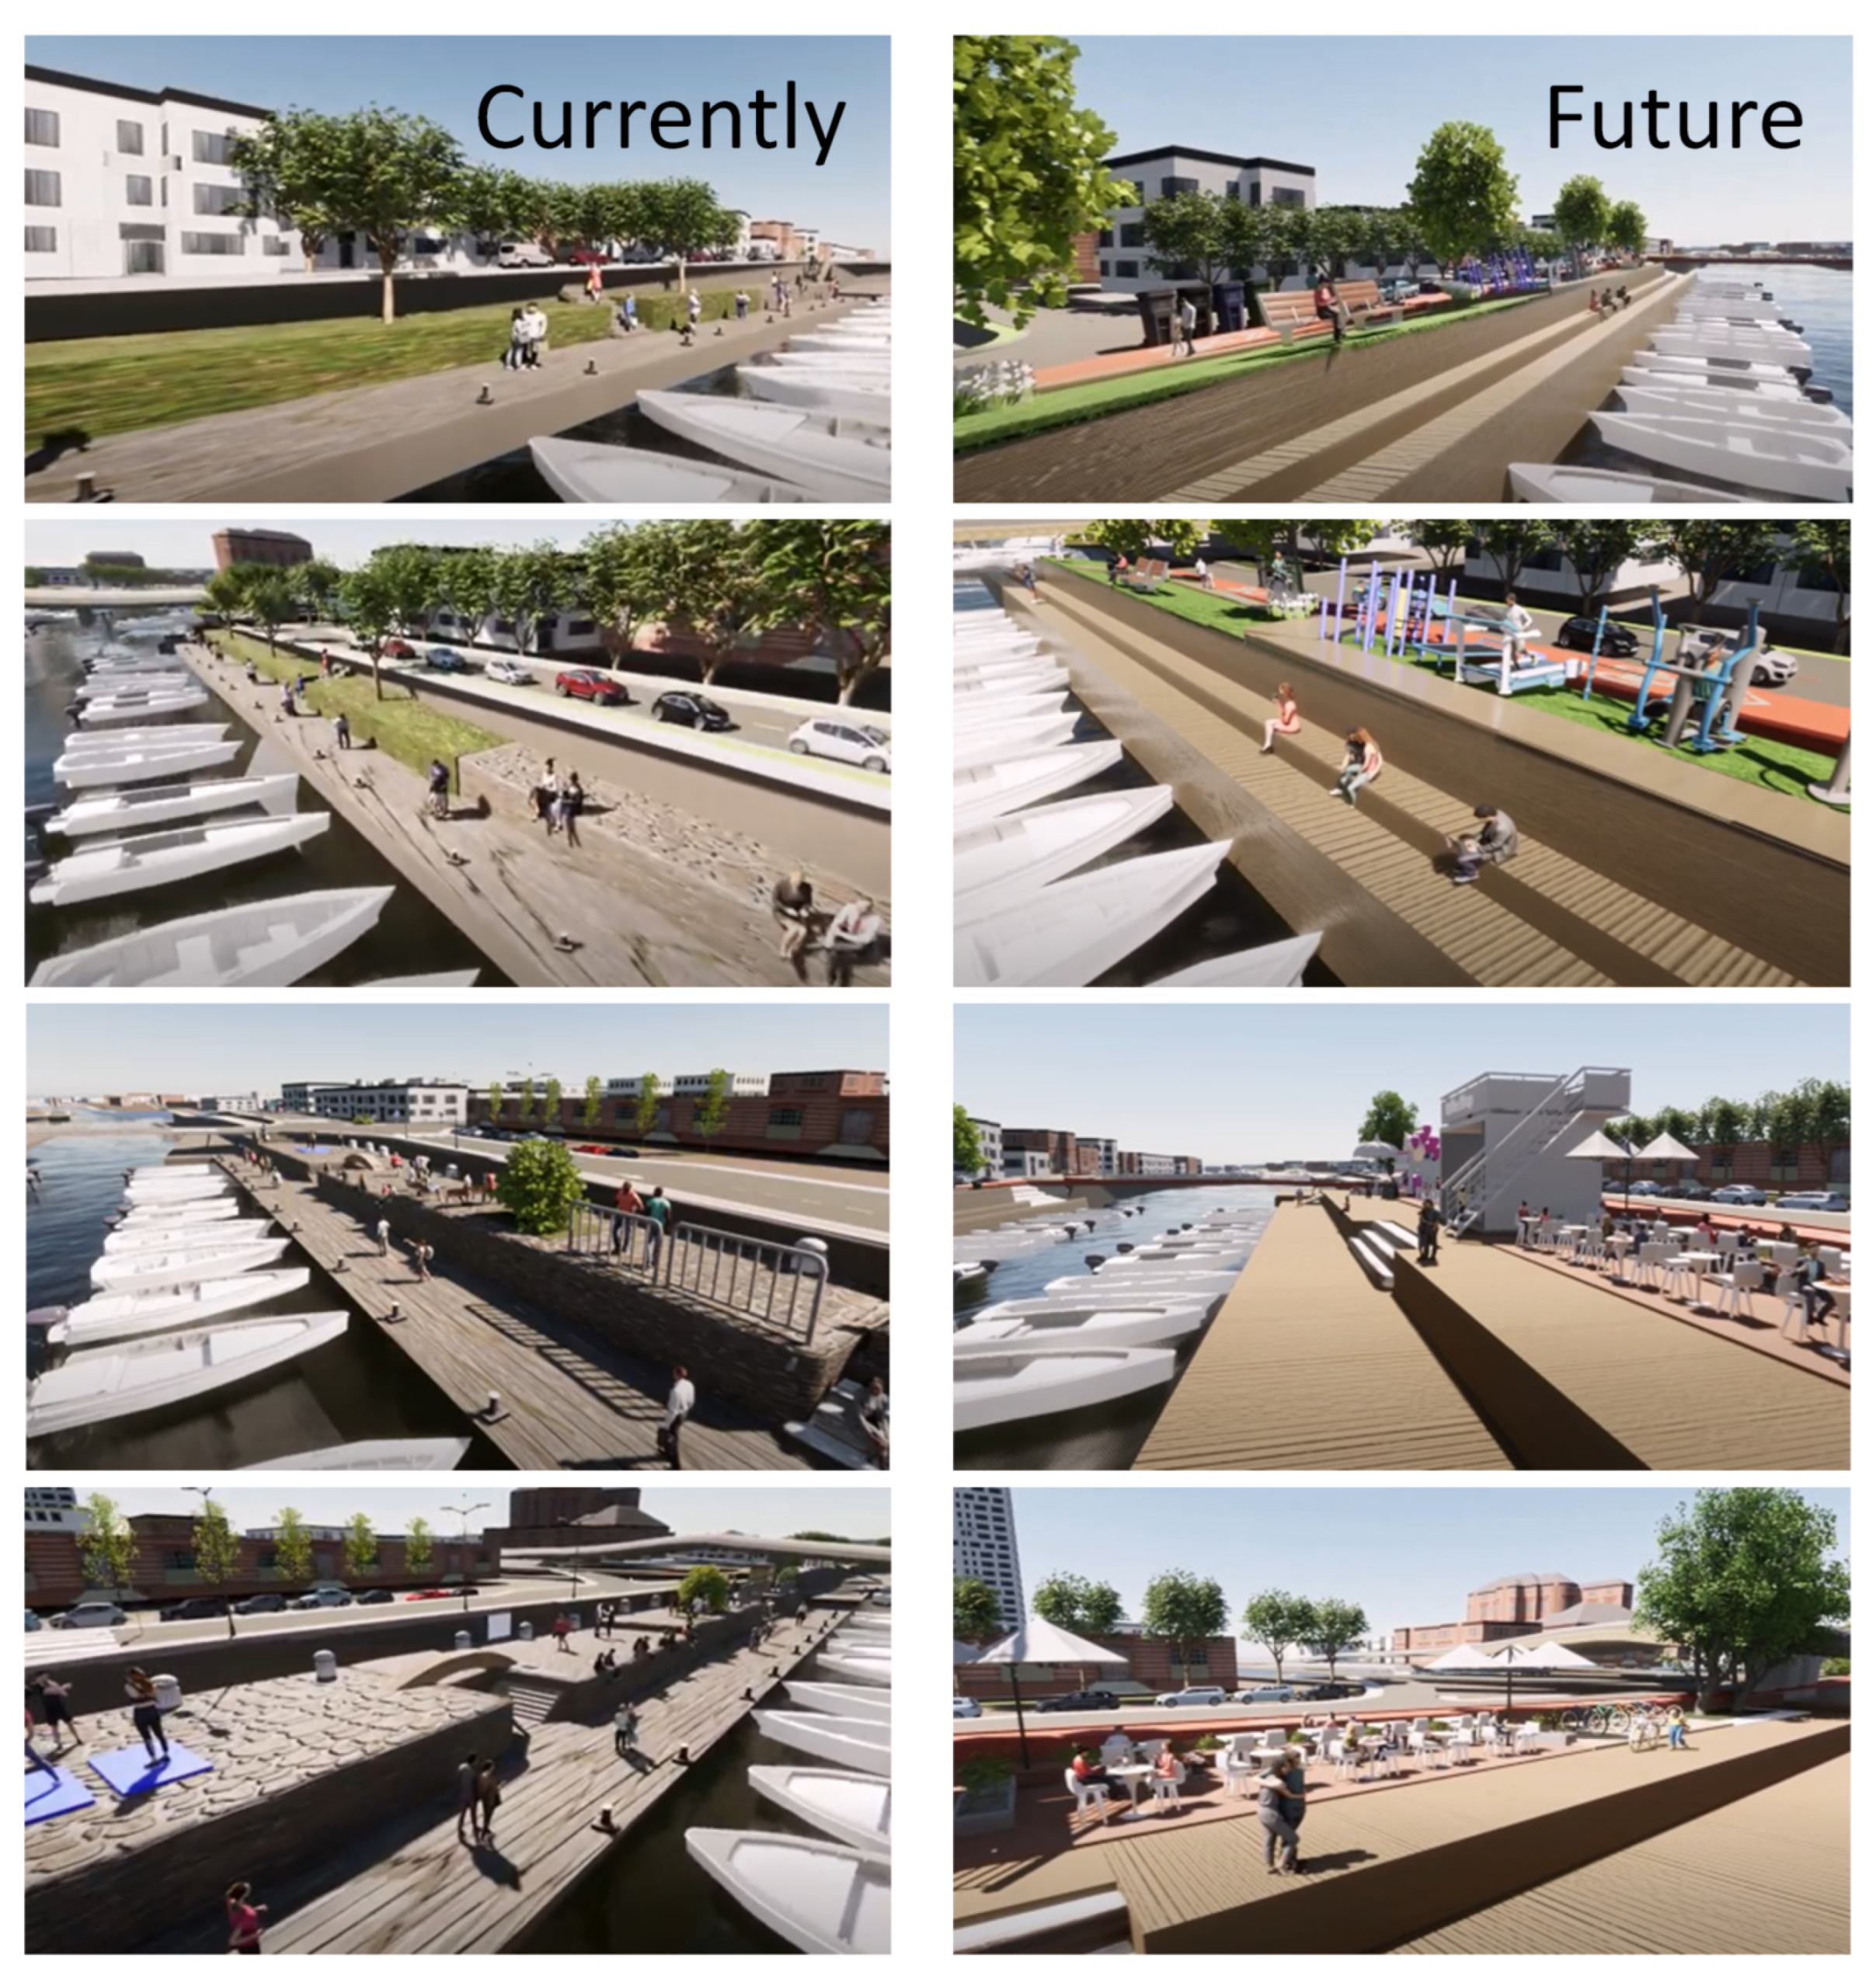
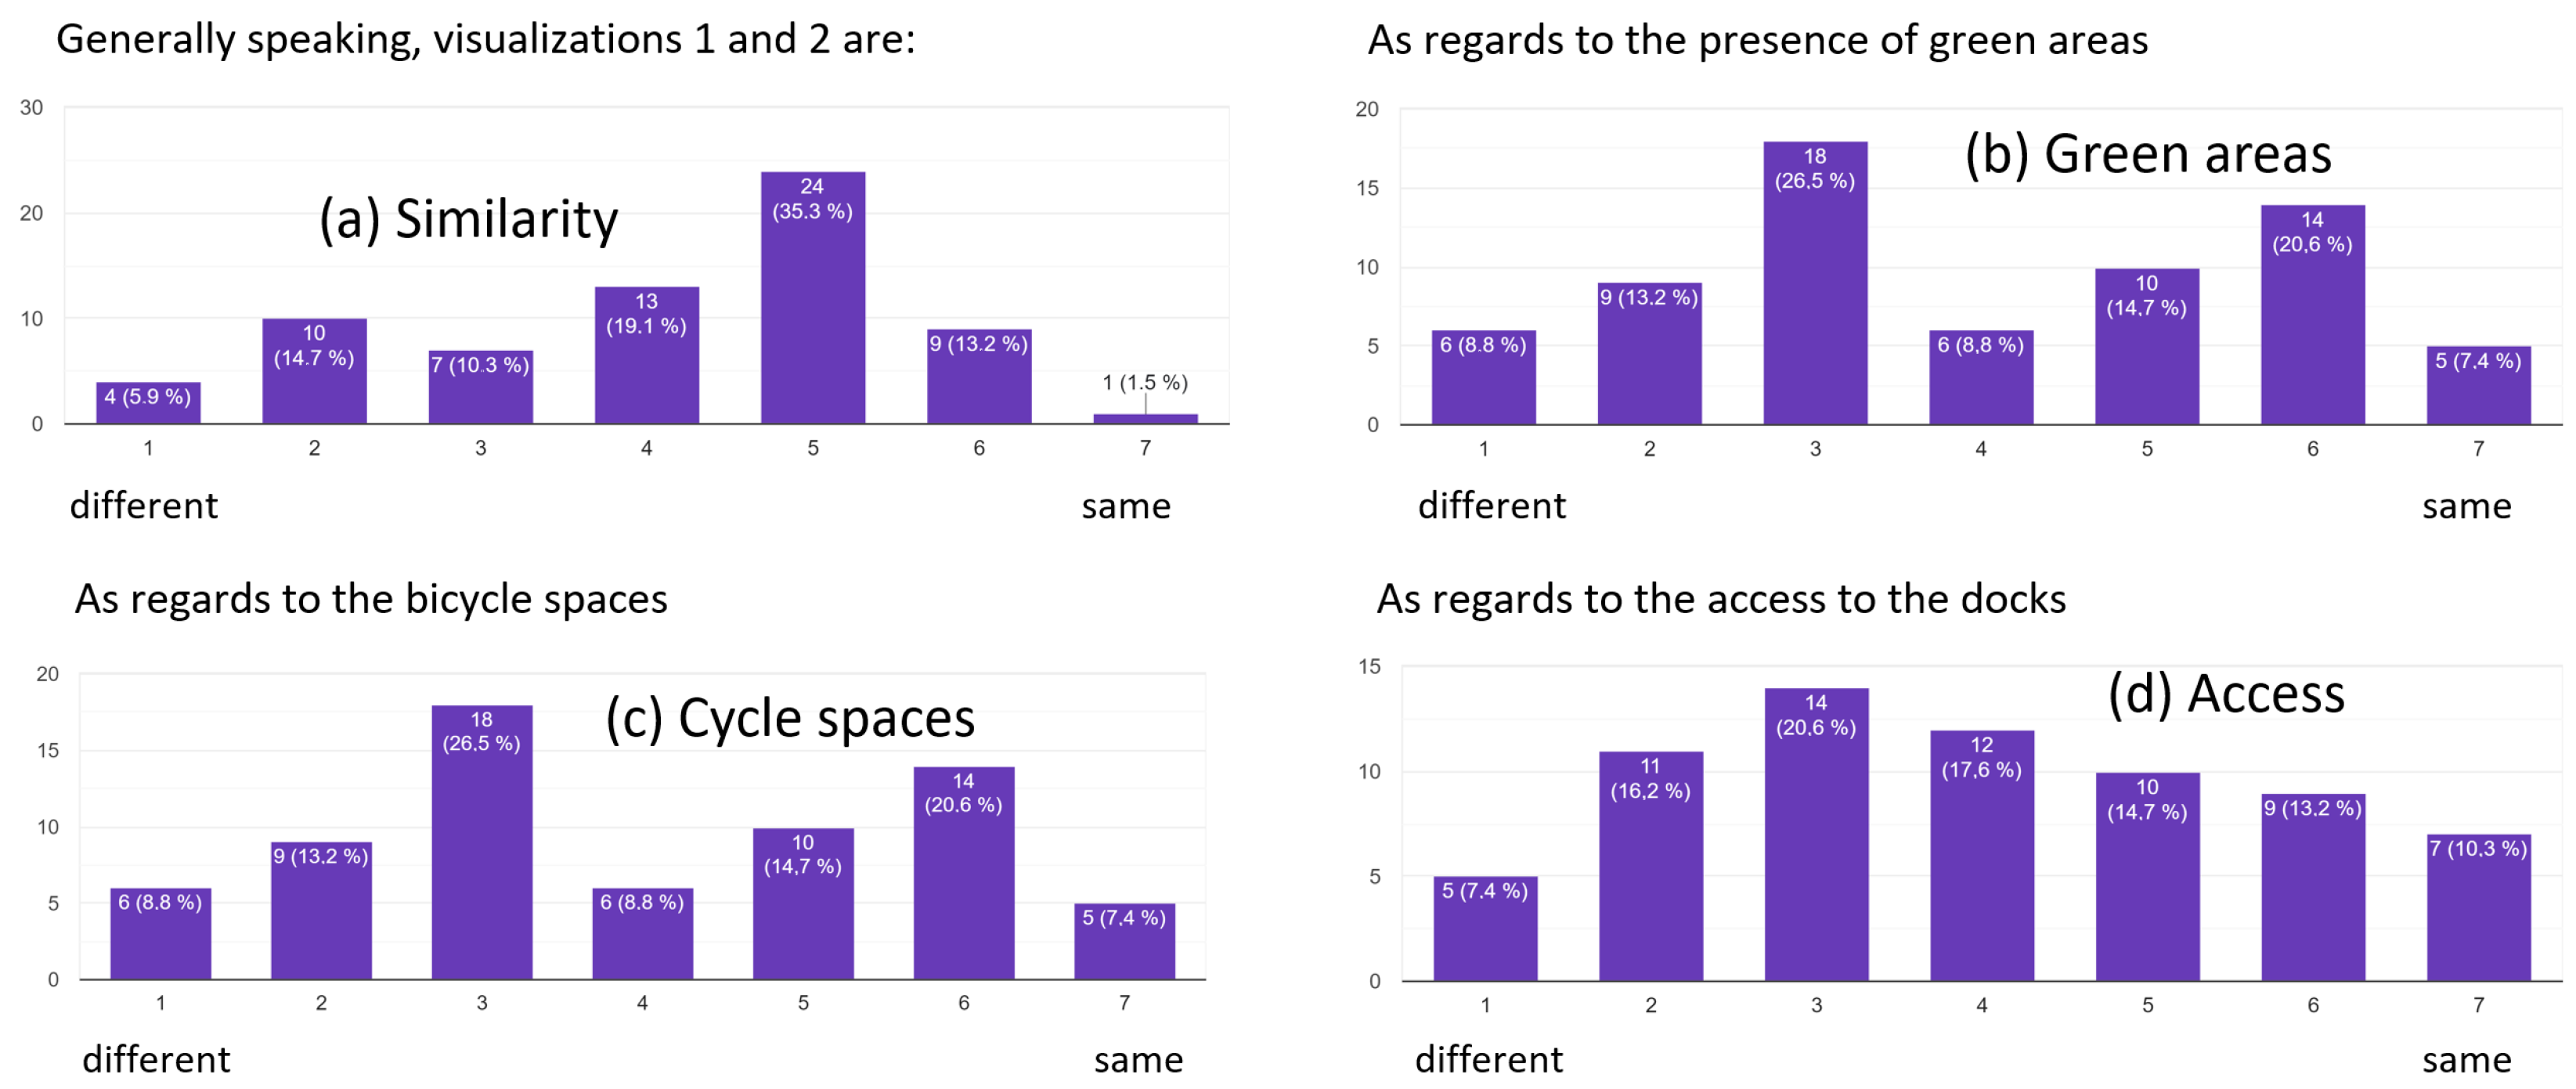
3.3. Overview of the Comparison before and after Renovation

In Parts 2 and 3 of the study, the perceptions of the participants about the quality of public space and usage in the project were gathered based on six indicators: life on the docks, services and functions, sociability, walkability and cyclability, aesthetics, and access to the docks.
Regarding the results obtained in Part 2 and 3 of the questionnaire, shown in Table 1, we can distinguish three main pieces of information. For several of the measured dimensions, the prospective situation does not really add value compared to the current situation. This is the case, for example, for the visibility of platform access (Mcurrent = 5.22 vs. Mfuture = 5.34) as well as for walkability (Mcurrent = 5.06 vs. Mfuture = 5.43) and ease of orientation (Mcurrent = 5.54 vs. Mfuture = 5.60). It should be noted that all these aspects are already evaluated rather favorably in the current situation, and are not those that evolve in terms of priority. On the other hand, all the other scores are higher in the future situation than in the current situation, with differences ranging from 0.52 to 1.05 points. Considering our intentions when developing the questions, it can be noted that the questions that seem to make the most difference between the current and future situation are related to the usefulness of the area (services and shops), which are questions 3 through 6. This is where we see the two largest deviations from the mean. In addition, there is an improvement in the beauty of the place (questions 14 to 18). Considering the fact that these are the elements of the place evaluated the most unfavorably for the current situation, they would seem to be priorities for implementation. In addition, it is important to carefully consider the answers to the questions relating to access to the platforms, the presence of green spaces, and cyclability.
In the following subsection, we break down the study into separate part according to the aspect surveyed. To facilitate interpretation, we clustered the answers into three groups related to the scale: for “Disagree with the statement” we regrouped the answers using a scale from (1) Totally Disagree to (3) Mildly Disagree; answers (4) are considered as “Neutral”; for “Agree with the statement”, we regrouped the answers using a scale (5) Mildly Agree to (7) Totally Agree.

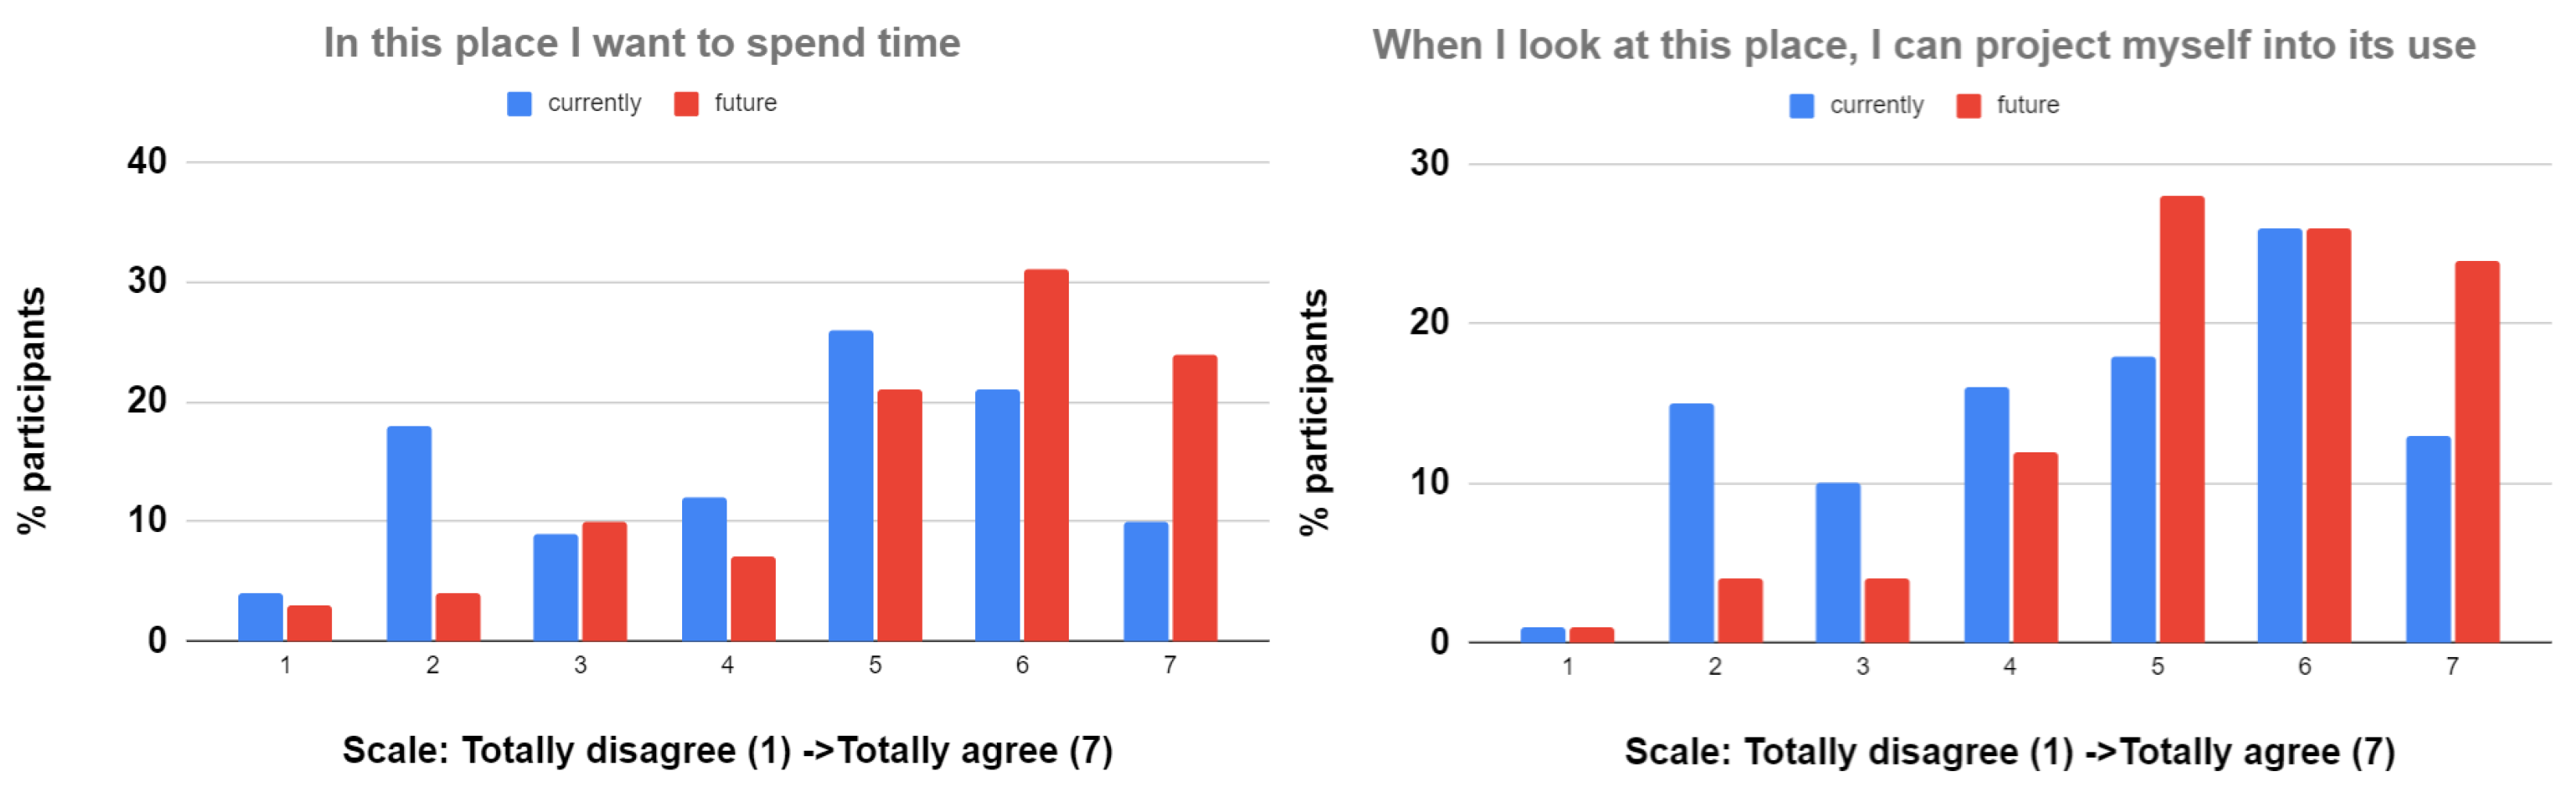
3.4. Life on the Docks

Regarding life on the docks, two questions were included in the survey. The results of the respondents’ perception of life on the docks is shown in Figure 7. The figure compares the outcome between the two scenarios involving the current and the future situations regarding participants’ responses to the questions “I want to spend time in this place” and “When I look at this place, I can project myself into its use”.
Figure 7 (left) shows that in the current situation, for the statement that respondents want to spend time in this place, precisely 57% of them agree with the statement and 31% of disagree. For the future situation, 75% of the participants agreed with the statement that they wanted to spend time in this place and only 9% disagreed, indicating a much more favorable perception of spending time in this place. Thus, after making a comparison between the two scenarios, the questionnaire survey established that the majority perceived that they wanted to spend more time in the future situation, i.e., after renovation of the canal.
Figure 7 (right) reveals less differences between responses to the question “When I look at this place, I can project myself into its use”. Globally, participants were satisfied projecting themselves into the use of the place in both scenarios, though the responses show more participants agreeing for the future renovated scene and more disagreeing for the current situation of Rimini Port.

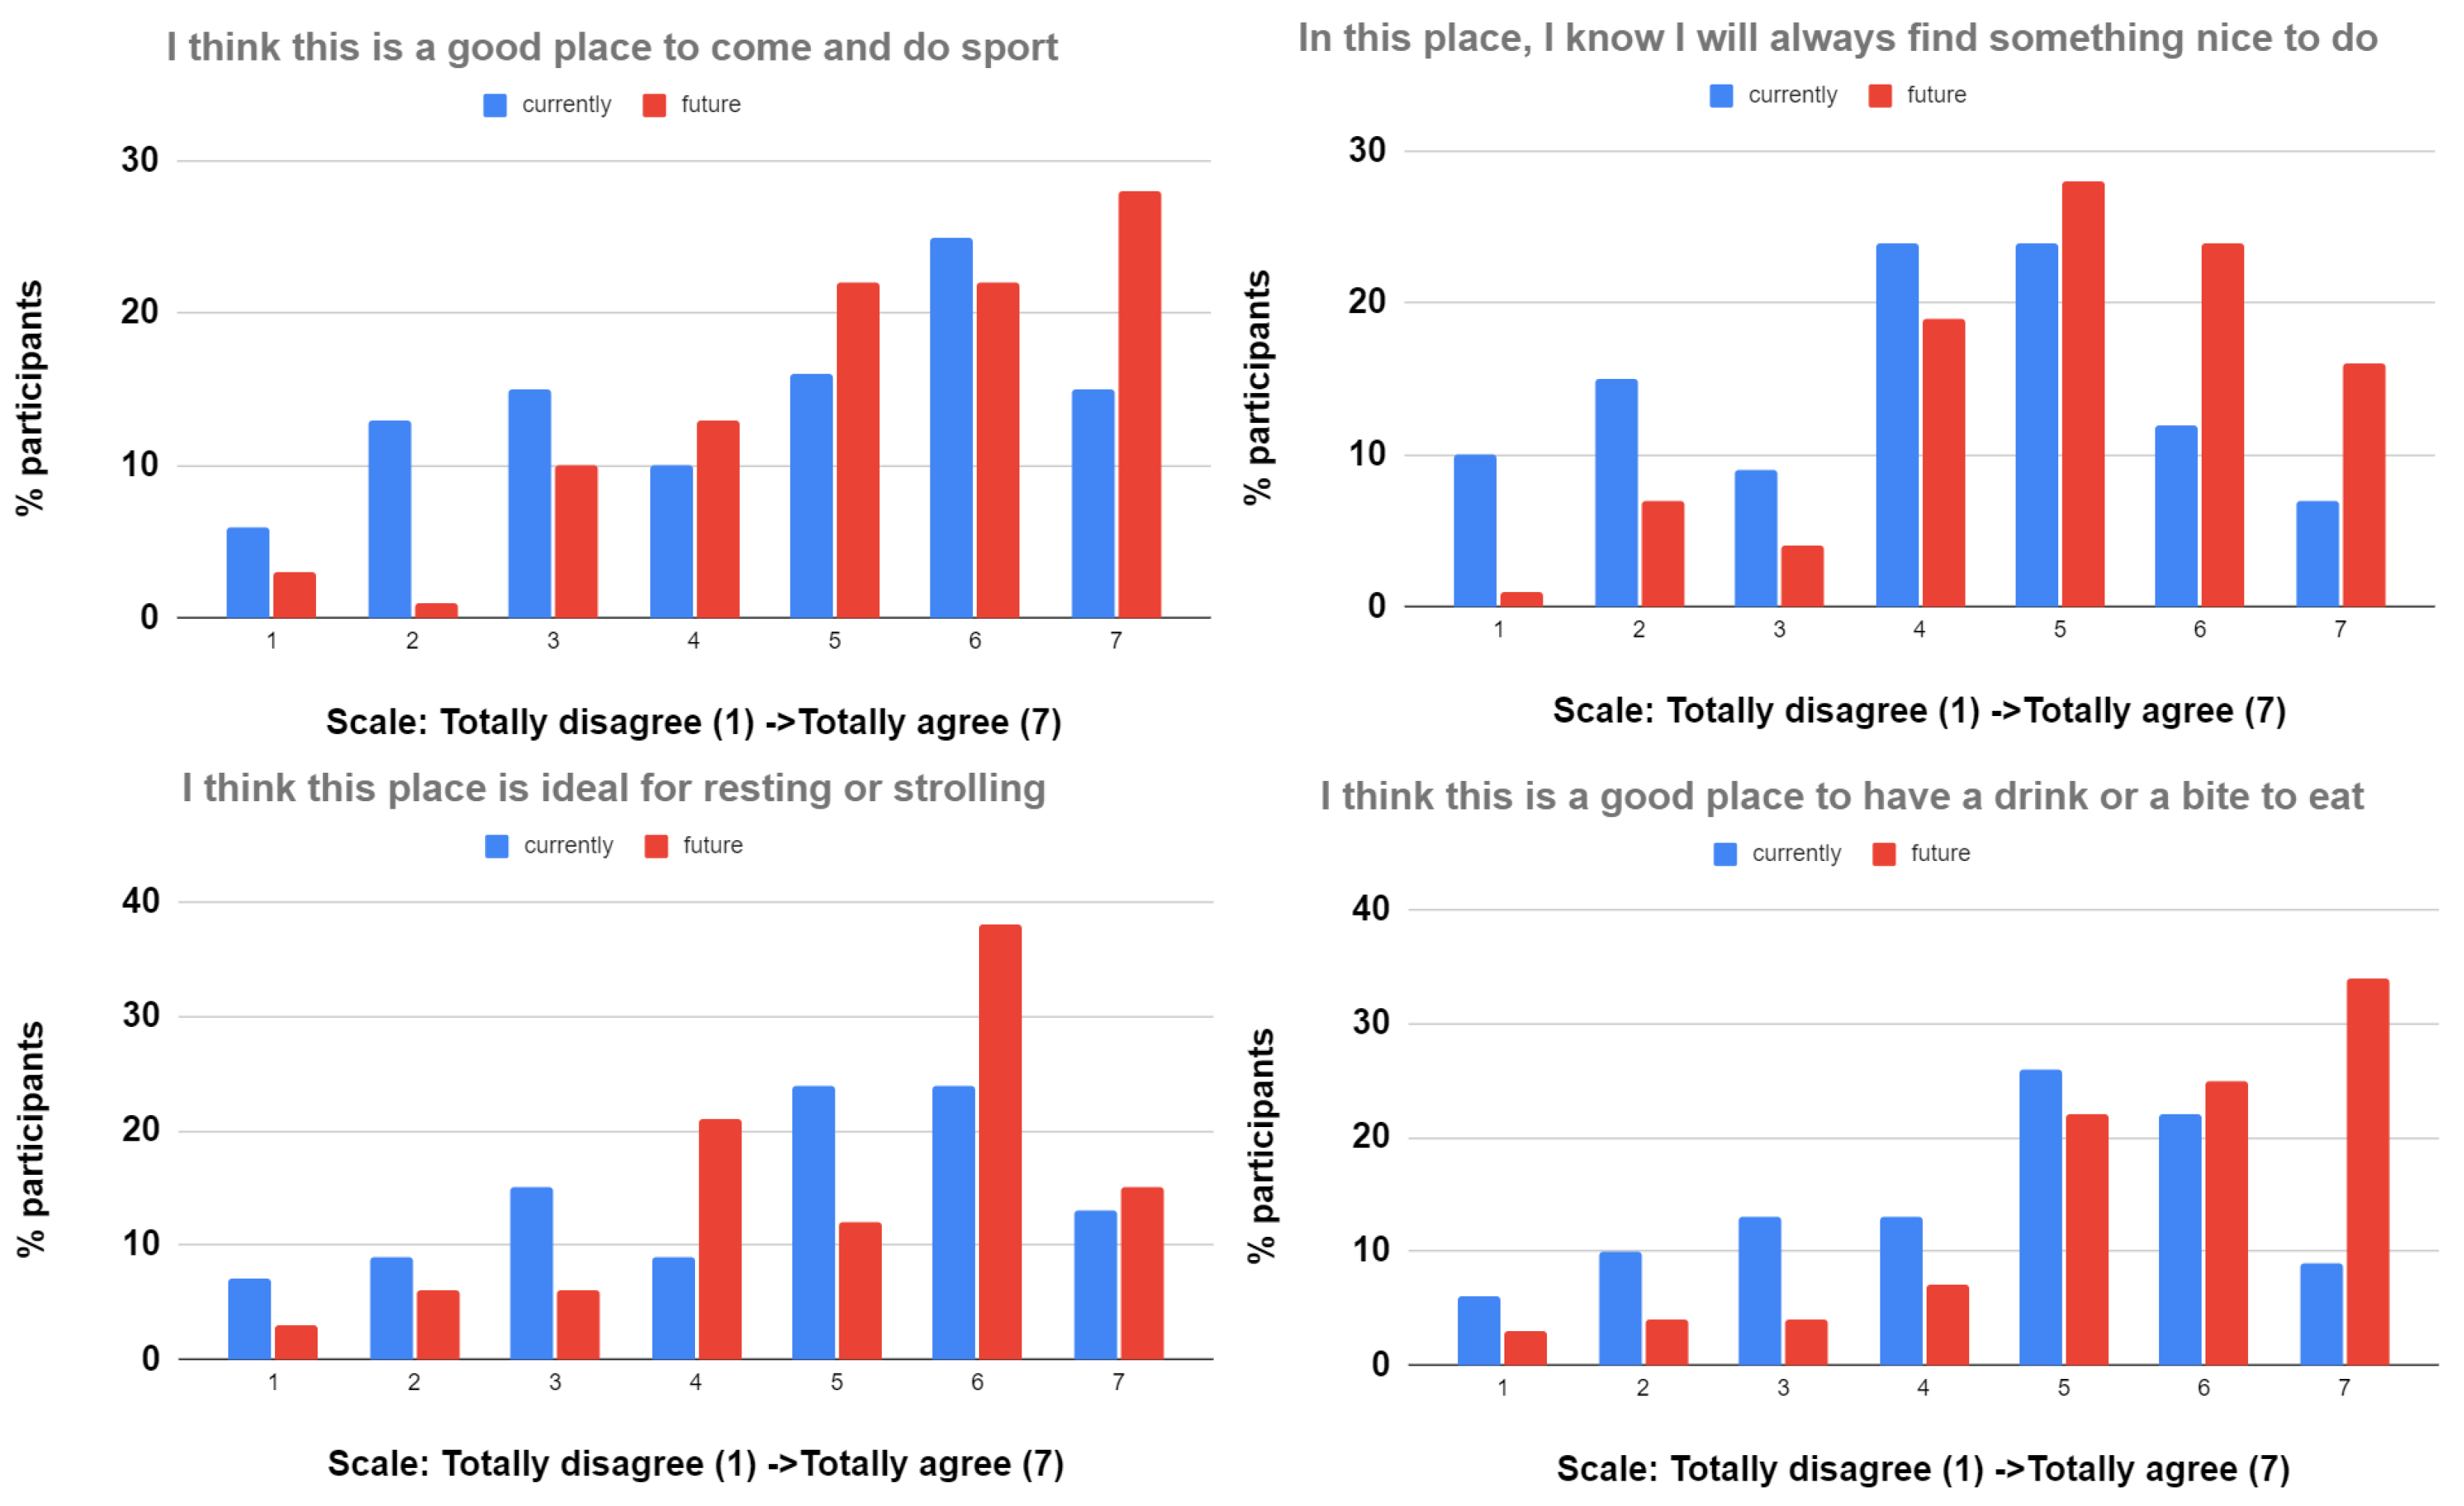
3.5. Services and Functions
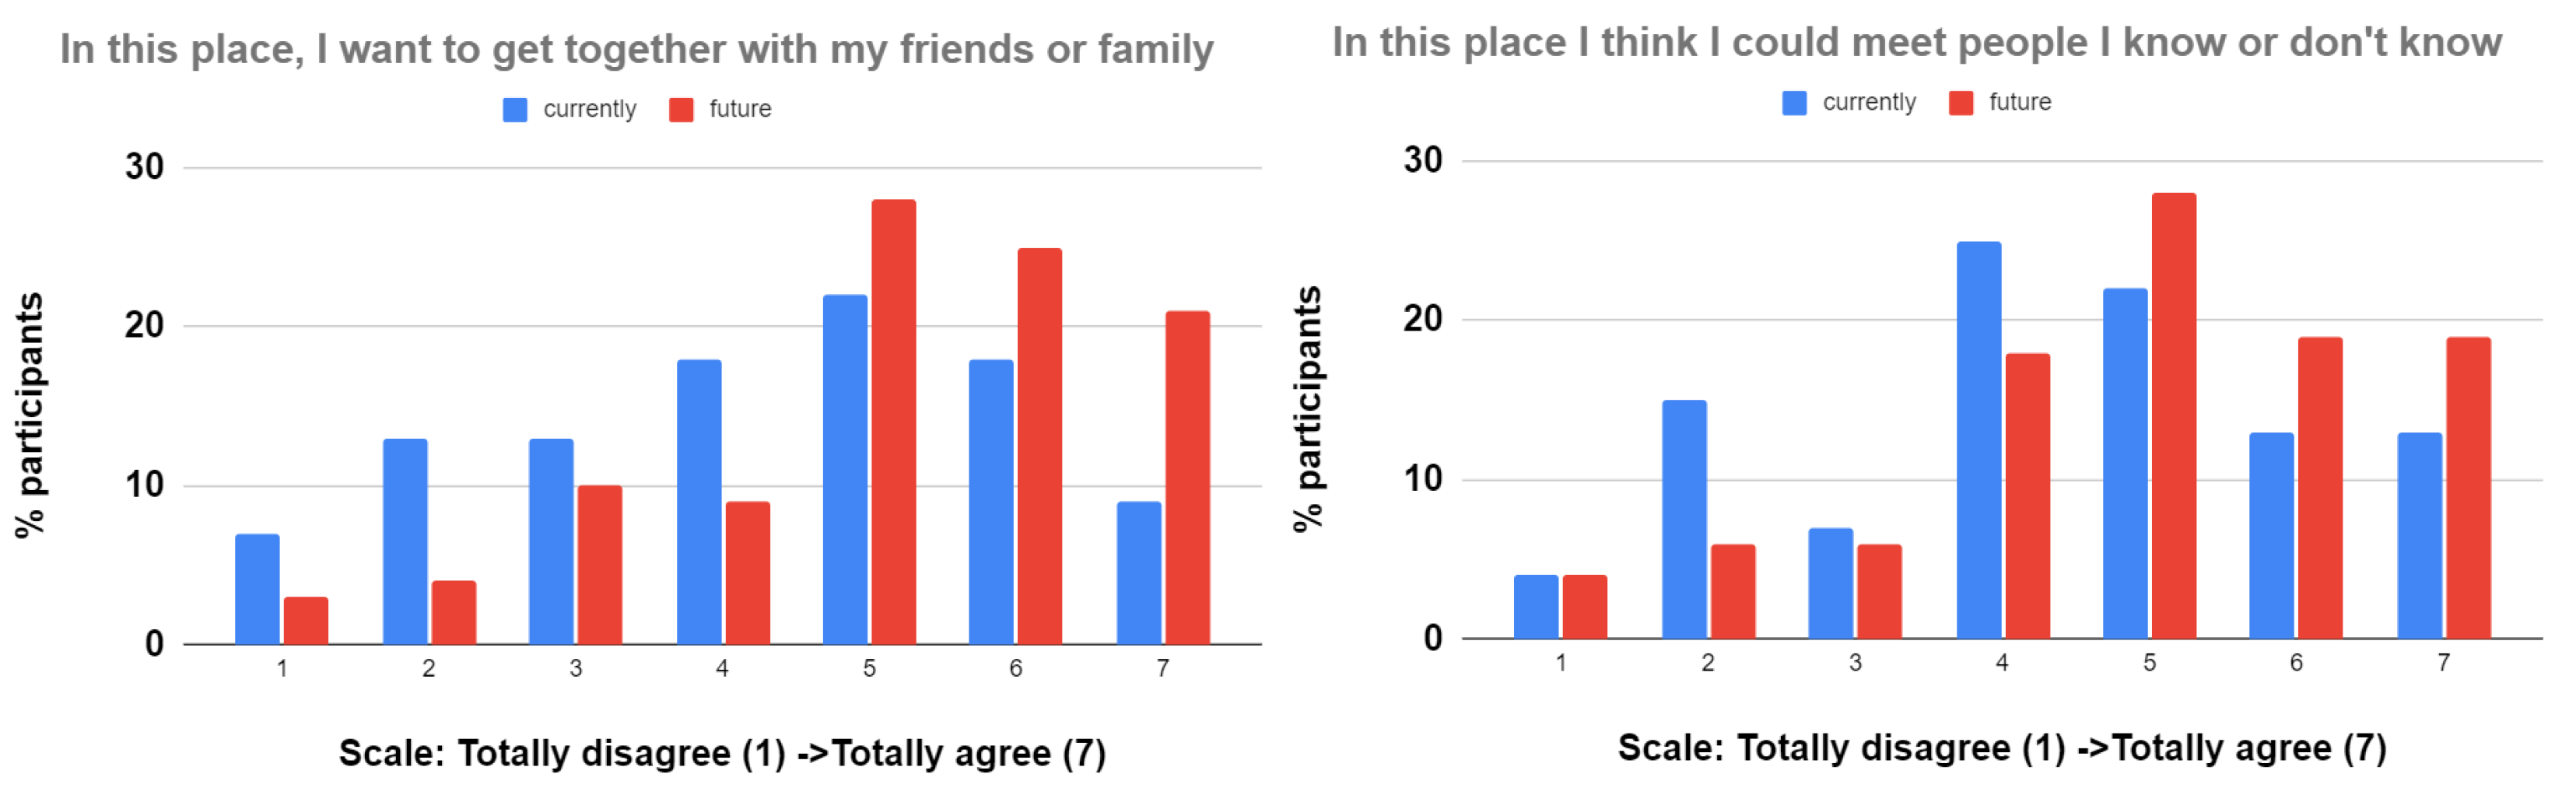
Regarding services and functions, four question were included in the survey. The results for the respondents’ perceptions of services and functions are shown in Figure 8. The figure compares the outcomes between the two scenarios involving the current and the future situation regarding respond to the question “I think this is a good place to come and do sport”, “In this place, I know I will always find something nice to do”, “I think this place is ideal for resting or strolling”, and “I think this is a good place to have a drink or a bite to eat”.
When asked “I think this is a good place to come and do sport”, in the current situation 56 % of the participants agreed or strongly agreed that the place is good for doing sport. In turn, for the future situation 77% of the participants agreed or strongly agreed with the statement that the place was a good place for sport activities.
When asked the question “In this place, I know I will always find something nice to do”, in the current situation the response shows that 43% of participants agreed with the statement, 24% were neutral, and 34% did not agree, which confirms one of the results of the SWOT analysis in [1]. In the future situation, 68% of participants agreed that they would find something nice to do in this place and 19% were neutral on this aspect, revealing that most people felt they could find something nice to do in the future scenario.
When the respondents were asked to state their opinion about “I think this place is ideal for resting or strolling”, 61% of them agreed with the statement in the current situation, while 65% preferred the future infrastructure, showing less difference on this aspect. This result shows that water is always inspiring for resting or strolling, whatever the other available activities.
A larger difference appears with respect to leisure activities. On the aspect of having a drink or eating in the area, 81% considered the renovated place good for this, while only 57% were satisfied with the current version of the Canal.
After conducting a comparative analysis of the two scenarios regarding their services and functions, the results of the survey revealed that most people would prefer to use the services and functions available in the future scenario.

3.6. Sociality

The essay of Tyler [54] suggested that urban engineering should refocus on the idea of sociality, that is, that the most important element of a city is its people, not its structures. What the author calls ‘sociality’ is the propensity of one person to interact freely with another person. People need to be able to greet known or unknown others and to have small group conversations. To build a sustainable and successful city, the city needs to ensure that it provides an environment that can facilitate conversation and sociality.
We characterize sociality with the two following statements: “In this place, I want to get together with my friends or family” and “In this place, I think I could meet people I know or don’t know”, as shown in Figure 9.
Placed in the future renovated area, 74% agreed with the statement that they wanted to get together with friends or family, and 66% felt that they could meet known or unknown people. On the other hand, only 49% wanted to get together in the current version of the Canal, and 48% thought they could meet people there. Clearly, the renovated area seems more auspicious for interaction than the current area, which mean that the proposed modification could solve the troubles pointed out in [1].

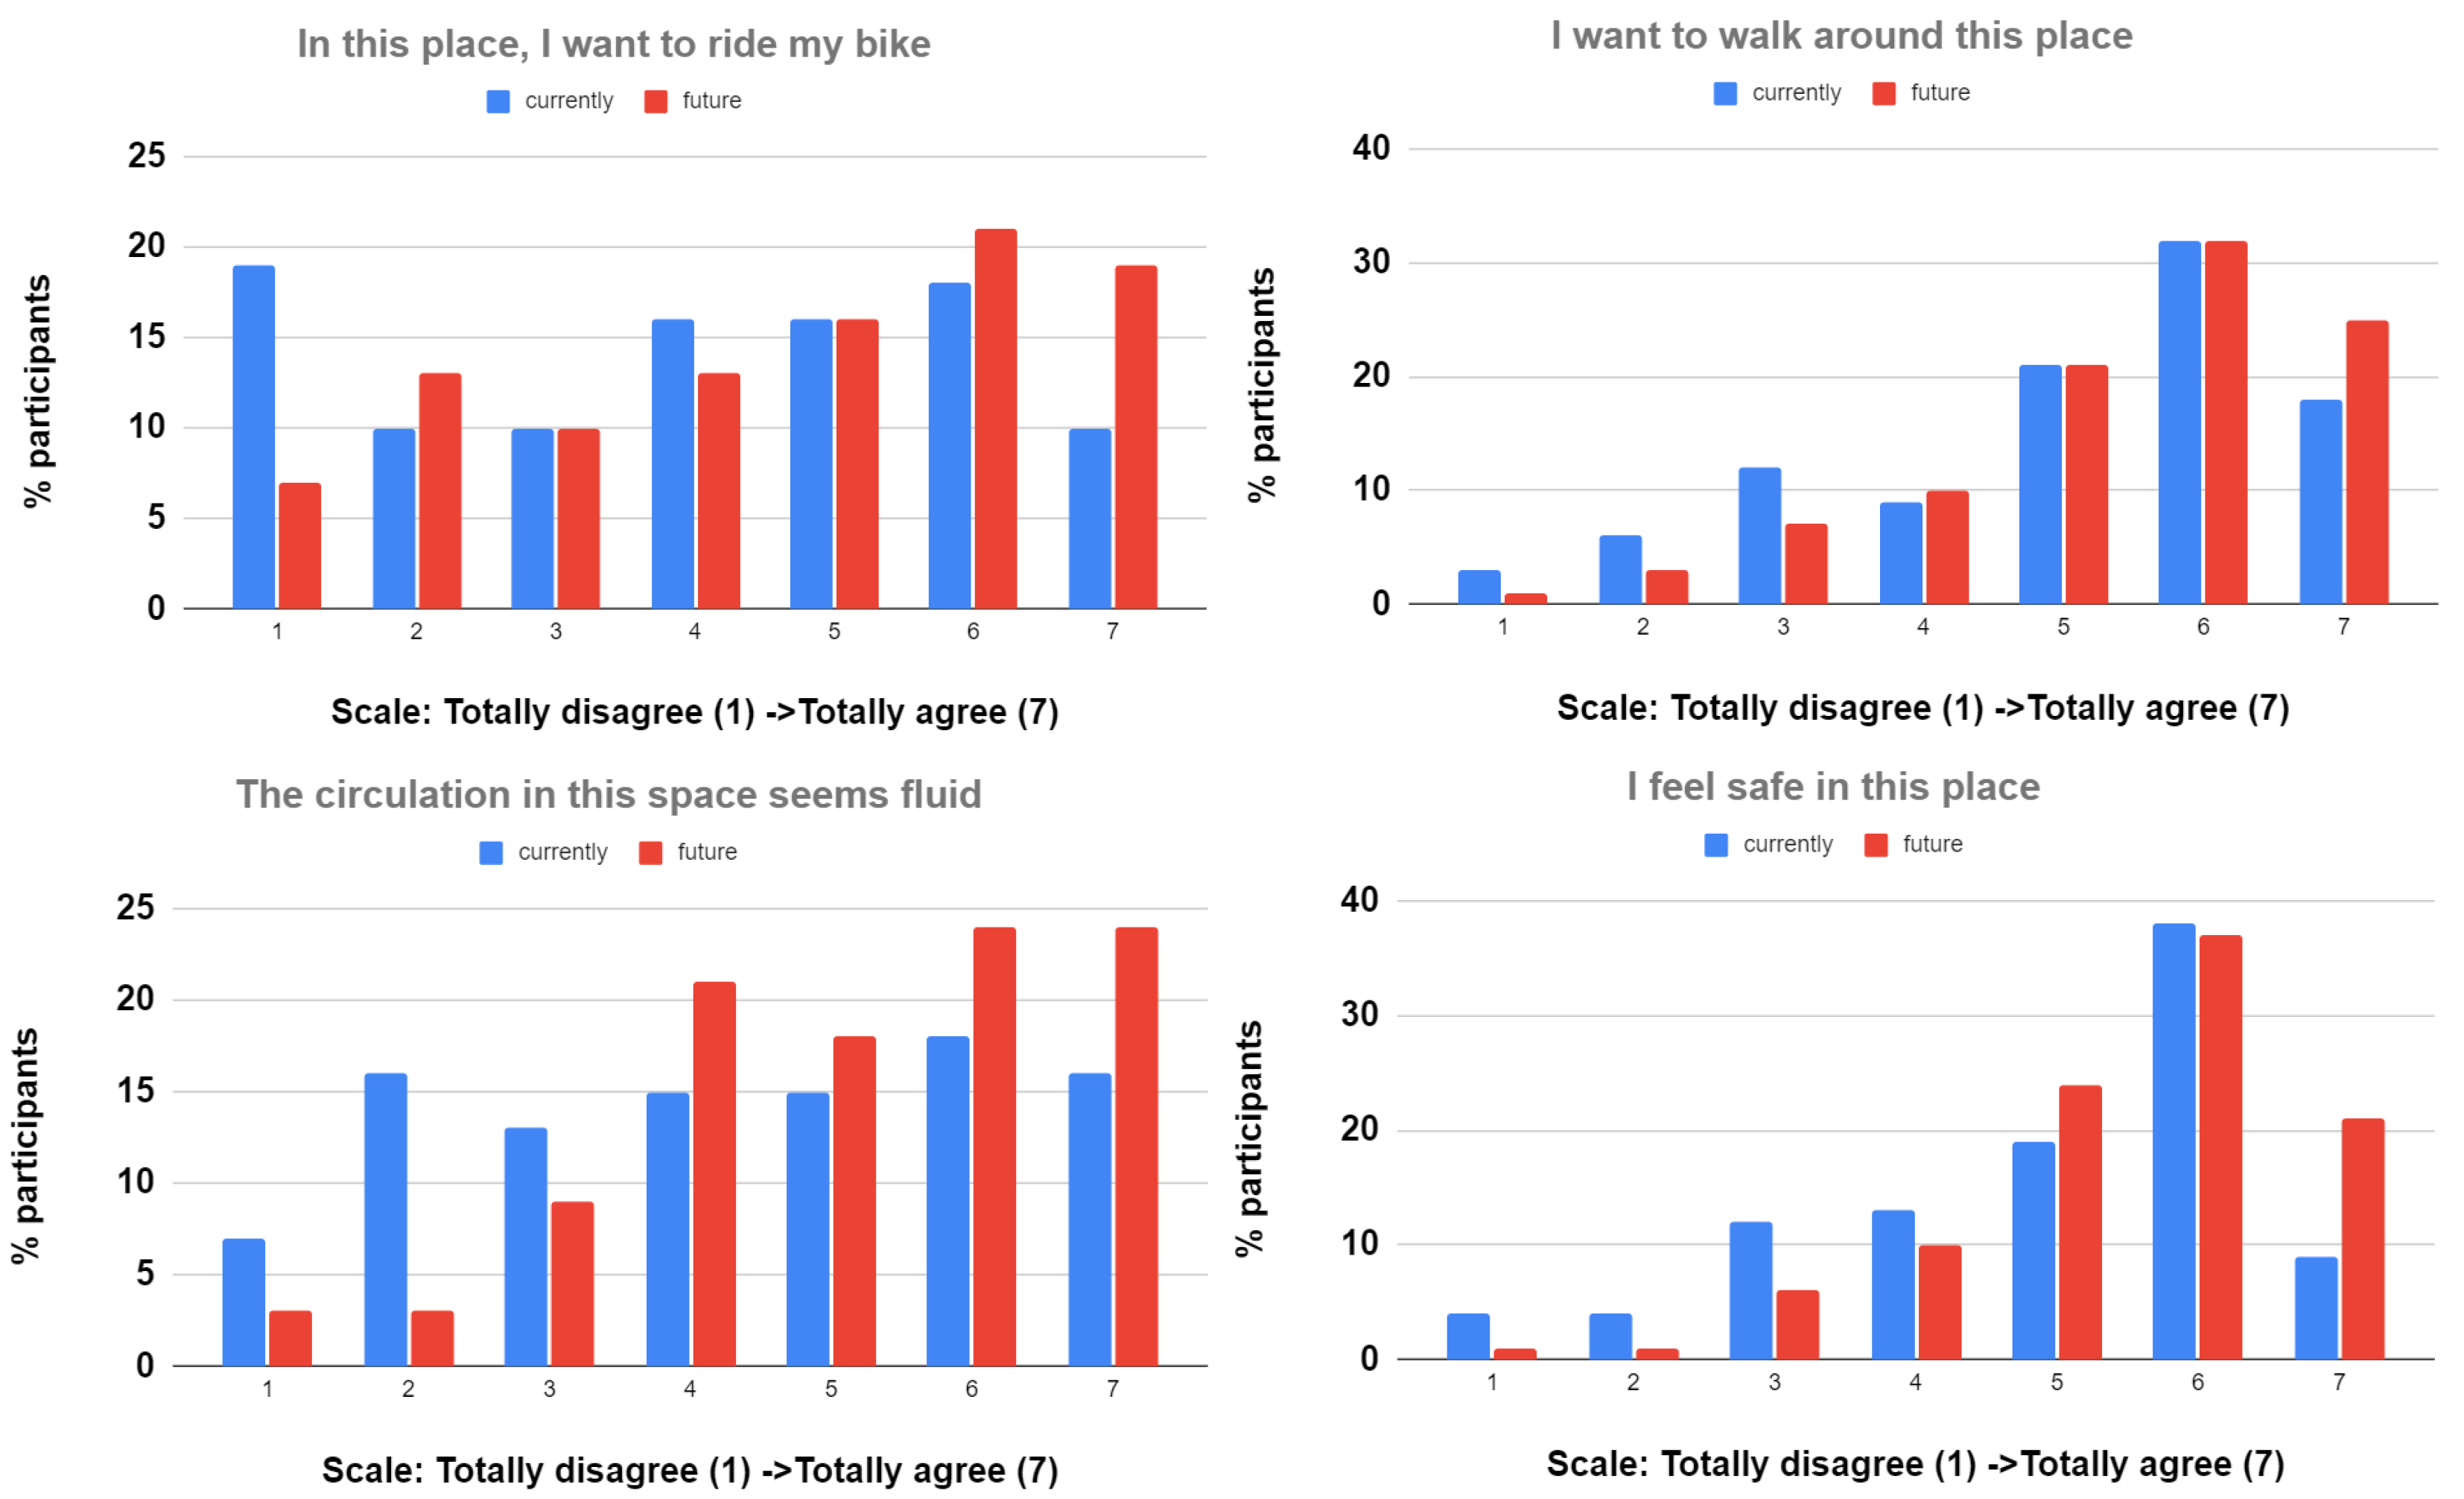
3.7. Walkability and Cyclability

Figure 10 shows that there is an obvious improvement in cycling infrastructure when comparing the renovated docks to the current one, with 56% of participants against 44% wishing to ride their bike in the area. Yet, this is not a high score, which shows that maybe the cycling infrastructure could be enhanced, although here there is a problem with the available space on the docks. Surprisingly enough, the walkability of the renovated docks increases agreement with the statement “I want to walk around this place” by only 7%, which show that there is room for improvement in this area as well.
The renovated docks felt safer to the respondents than the current situation, with 82% agreement against 66%; thus, the proposed modification should clearly improve the sensation of security in this public place. Moreover, the fluidity of walking trips is improved to 66% in the future scenario against 49% in the current one.

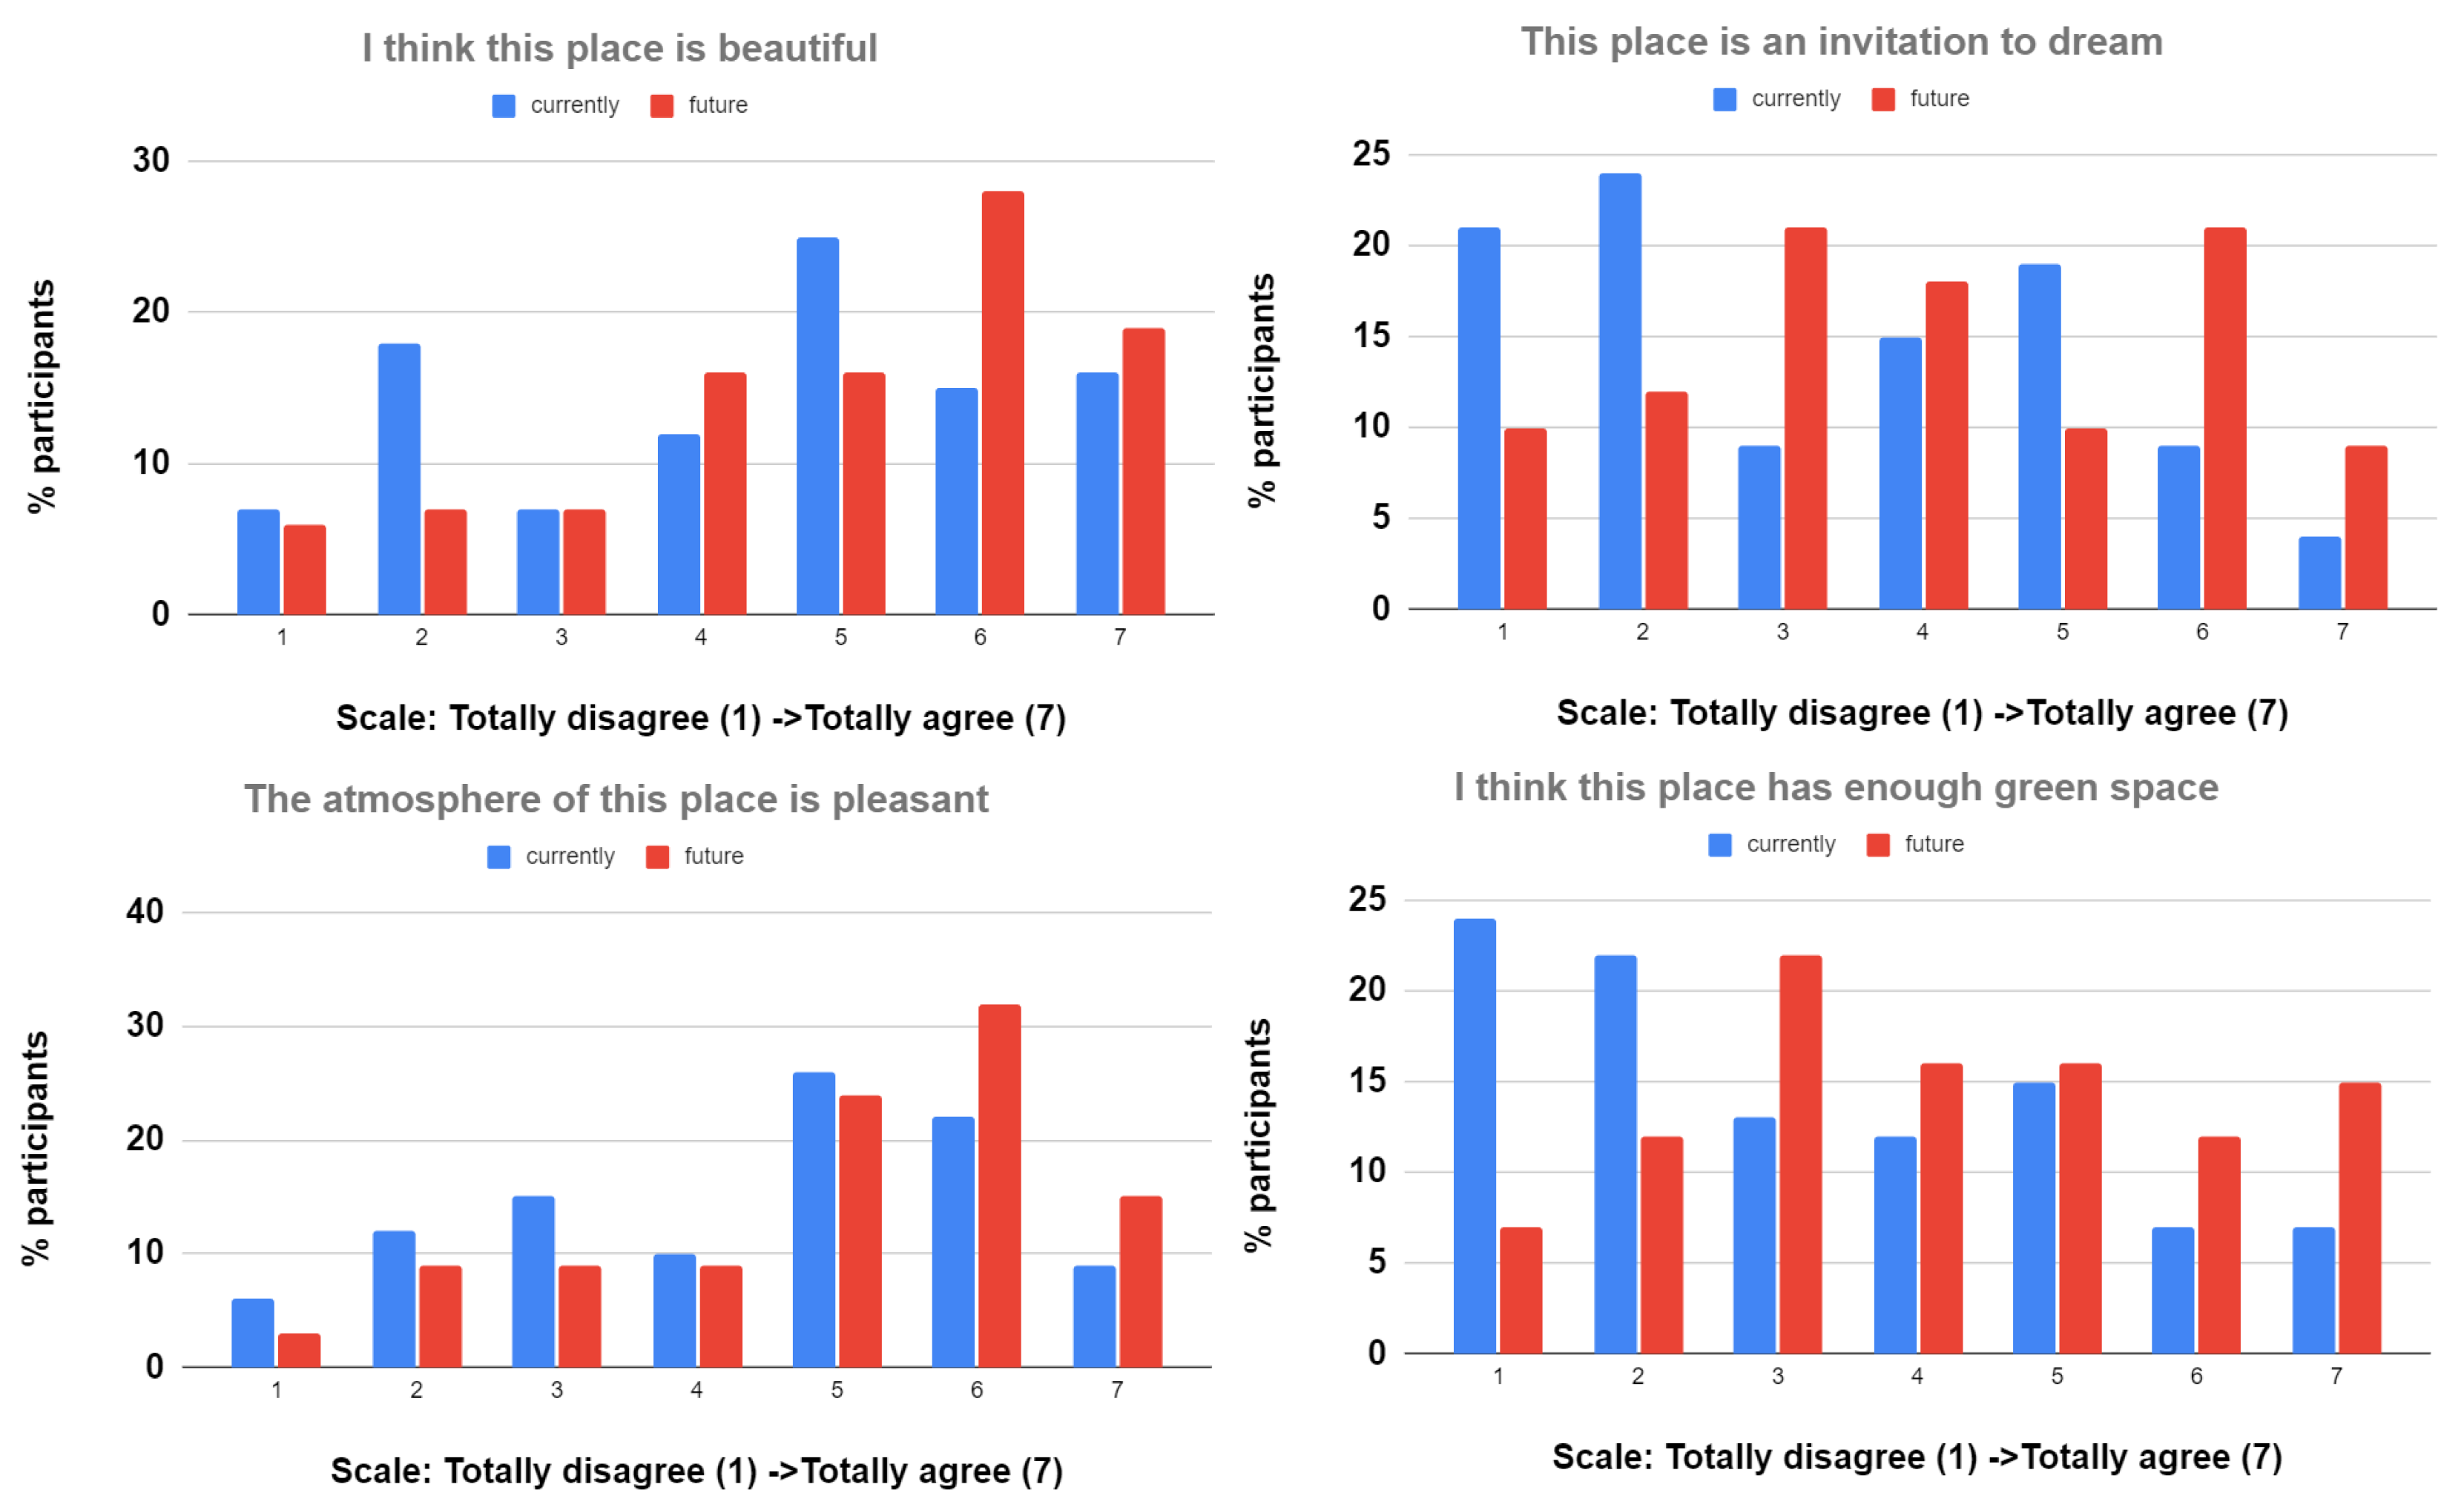
Aesthetics and Atmosphere

Figure 11 shows a clear improvement in the aesthetics and general ambiance of the renovated area compared to the current version of the docks. Around 7% more of the respondents felt that the future place is an invitation to dream and is beautiful; while this is not a particularly high difference, the conviction is higher for both statements.
The respondents considered the atmosphere to be more pleasant in the renovated place, at 71% against only 57% in the current version of the docks. This is a favorable element for the proposed modification, as the general ambiance of the current version of the docks has been deemed gloomy [2]. As for the presence of vegetation, the improvement is clear, with 60% of participants feeling that there is not enough green space in the current docks, while agreement with this statement decreased to 40% for the future scene. Nonetheless, only 43% felt that there was enough vegetation in the future scenario, which is an element that can be improved.

4. Discussion and Conclusions

The objective of this study was to assess whether it is possible to use non-immersive virtual reality as a tool to analyse the perceptions of the realization of a project by users. The aim was to demonstrate how the involvement of human participants from the earliest stages of the project is an effective means of evaluating the success or failure of a project proposal. Numerous studies have shown that the active participation of investors, stakeholders, and citizens in the design of public spaces leads to their greater involvement. In this way, any criticality not initially taken into account, or any particular requests not expressed, can be more easily identified.
The context of this work started with an analysis of the Rimini area, with the redevelopment of degraded urban areas being a first step towards achieving the sustainability aims set out in the Sustainable Development Goals. In this context, evaluation methods were developed in [1] for the decision-making process, considering different social, economic, and environmental aspects in order to obtain a priority scale of interventions for urban regeneration.
Following this work, architectural solutions were proposed in [2] that represent targeted and specific interventions designed precisely for the context to which they are dedicated in order to make the Port’s canal area a continuum with its urban context and to improve its perception by tourists and inhabitants. These propositions were based on the knowledge of architectural experts. Therefore, while these two studies [1,2] provided an analysis and solutions based on socioeconomic, environmental, and architectural aspects and knowledge, their proposals need to be validated. The contribution of this paper is to provide a methodology to compare two scenarios, namely, before and after modification of the area, using virtual scenes.
To actively involve non-experts in the work to be done, intuitive tools are needed that can visualize the proposed project. The lack of such tools often creates a barrier between designers and the public, resulting in indifference and discontent around the realization of the project itself. Not understanding what is to be achieved leads to a separation of the parties involved; the public may not feel listened to and able to participate by making useful contributions.
To this end, virtual reality is a tool with a strong visual impact that allows non-specialist citizens to see and imagine the expected reality when the project is completed. This makes everyone more involved and committed, as they can understand and manage the reality around them, and even change it accordingly by expressing problems and needs. The World Economic Forum describes virtual reality use in the public sector as a means of involving citizens, optimizing resources, and improving transport with a view to environmental sustainability, thereby promoting tourism.
In this study, virtual reality has been used to analyze the case of the re-qualification of the Canal of the Port of Rimini, a famous tourist town situated in northern Italy along the Adriatic coast. Although located in the city centre, the canal port area is degraded, poorly connected to the main points of interest, and not used productively. The proposed requalification project consists of creating new access points to the canal port and raising the level of the docks to allow the construction of new cycling and pedestrian paths. This project is in accordance with recent studies that show how the redevelopment of urban public spaces is closely linked to the presence of safe and well-connected cycling and pedestrian paths, which in turn promotes environmental sustainability and the general health and livability of public spaces [1,2].
To involve stakeholders and citizens, we used the virtual reality to create two project scenarios, one representing the current condition of the Canal and the other showing the future reality after realization of the proposed project. We used an online questionnaire in several parts to obtain participant feedback. The first part was aimed at assessing the perceptions of users about the correspondence between the actual reality and virtual reality scenarios. The results after viewing a comparison video showed that the two conditions were perceived by the participants in a similar way; therefore, the analysis tool can be considered valid. More perplexities emerged from the considerations on the comparison between green spaces, cycle paths, and access to the docks that are less similar between the current reality and virtual reality scenarios. This is probably due in part to the fact that the area was shown with a top view, excluding certain details and providing only a general indication of the situation.
A number of details were highlighted in the subsequent videos and analyzed through Parts 2 and 3 of the questionnaire. While the creation of easy access and new cycling and pedestrian paths was privileged by the project, the involvement of users allowed to focus more attention on how the points of attraction of a place are of primary importance when enhancing the local infrastructure. The motivation to move is fundamental for the use of a sustainable means of transport such as the bicycle. Linked to this aspect is the assessment of the beauty of a place. After the project, users have noted that the Port’s Canal was more attractive, and declared themselves more eager to frequent it.
The VR methodology used in this study proved useful in providing important results for an initial assessment of project adequacy. Future studies will consider in detail those aspects of the present study specifically related to the design of access points to the quays in order to better evaluate the perceptions of users.

Author Contributions

Conceptualization, R.B., S.A., M.P. and C.L.; methodology, S.A., C.D., M.P. and C.L.; software, R.B., I.I. and M.P.; validation, R.B., S.A. and M.P.; formal analysis, R.B., S.A. and C.D.; investigation, R.B., I.I., S.A., C.D., M.P. and E.D.G.; writing—original draft preparation, R.B., M.P., S.A., C.D. and I.I.; writing—review and editing, R.B., M.P., I.I., S.A., C.D., C.L., E.D.G. and V.V.; visualization, R.B., I.I. and M.P.; supervision, R.B., S.A., C.L. and V.V. All authors have read and agreed to the published version of the manuscript.

Funding

The research was carried out within the “FRAMESPORT” project, funded by the European Interreg Italy–Croatia project under Application ID No 10253074.

Institutional Review Board Statement

Not applicable.

Informed Consent Statement

Not applicable.

Data Availability Statement

The data that support the findings of this study are available on request from the corresponding author upon reasonable request.

Conflicts of Interest

The authors declare no conflict of interest.

Appendix A

Figure A1. Virtual reality opinion survey—Part 1.
Sustainability 15 05547 g0a1
Figure A2. Virtual reality opinion survey—Part 2.
Sustainability 15 05547 g0a2
Figure A3. Virtual reality opinion survey—Part 2.
Sustainability 15 05547 g0a3
Figure A4. Virtual reality opinion survey—Part 2.
Sustainability 15 05547 g0a4
Figure A5. Virtual reality opinion survey—Part 4.
Sustainability 15 05547 g0a5

References

  1. Pazzini, M.; Corticelli, R.; Lantieri, C.; Mazzoli, C. Multi-Criteria Analysis and Decision-Making Approach for the Urban Regeneration: The Application to the Rimini Canal Port (Italy). Sustainability 2023, 15, 772. [Google Scholar] [CrossRef]
  2. Corticelli, R.; Pazzini, M.; Mazzoli, C.; Lantieri, C.; Ferrante, A.; Vignali, V. Urban Regeneration and Soft Mobility: The Case Study of the Rimini Canal Port in Italy. Sustainability 2022, 14, 14529. [Google Scholar] [CrossRef]
  3. dos Santos Figueiredo, Y.D.; Prim, M.A.; Dandolini, G.A. Urban regeneration in the light of social innovation: A systematic integrative literature review. Land Use Policy 2022, 113, 105873. [Google Scholar] [CrossRef]
  4. Delhoum, Y.; Belaroussi, R.; Dupin, F.; Zargayouna, M. Activity-Based Demand Modeling for a Future Urban District. Sustainability 2020, 12, 5821. [Google Scholar] [CrossRef]
  5. Sessa, M.R.; Russo, A.; Sica, F. Opinion paper on green deal for the urban regeneration of industrial brownfield land in Europe. Land Use Policy 2022, 119, 106198. [Google Scholar] [CrossRef]
  6. Couch, C.; Sykes, O.; Börstinghaus, W. Thirty years of urban regeneration in Britain, Germany and France: The importance of context and path dependency. Prog. Plan. 2011, 75, 1–52. [Google Scholar] [CrossRef]
  7. Cucchiella, F.; Rotilio, M.; Annibaldi, V.; Berardinis, P.D.; Ludovico, D.D. A decision-making tool for transition towards efficient lighting in a context of safeguarding of cultural heritage in support of the 2030 agenda. J. Clean. Prod. 2021, 317, 128468. [Google Scholar] [CrossRef]
  8. Evans, J.P.; Jones, P. Rethinking sustainable urban regeneration: Ambiguity, creativity, and the shared territory. Environ. Plan. 2008, 40, 1416–1434. [Google Scholar] [CrossRef] [Green Version]
  9. Martinez-Fernandez, C.; Audirac, I.; Fol, S.; Cunningham-Sabot, E. Shrinking Cities: Urban Challenges of Globalization; Wiley: Hoboken, NJ, USA, 2012; Volume 36, pp. 213–225. [Google Scholar] [CrossRef]
  10. Leccis, F. Regeneration programmes: Enforcing the right to housing or fostering gentrification? The example of Bankside in London. Land Use Policy 2019, 89, 104217. [Google Scholar] [CrossRef]
  11. Liu, Y.; Dupre, K.; Jin, X.; Weaver, D. Dalian’s unique planning history and its contested heritage in urban regeneration. Plan. Perspect. 2020, 35, 873–894. [Google Scholar] [CrossRef]
  12. Demgenski, P. Dabaodao: The planning, development, and transformation of a Chinese (German) neighbourhood. Plan. Perspect. 2019, 34, 311–333. [Google Scholar] [CrossRef]
  13. Liu, Y.; Jin, X.; Dupre, K. Engaging stakeholders in contested urban heritage planning and management. Cities 2022, 122, 103521. [Google Scholar] [CrossRef]
  14. Erfani, G.; Roe, M. Institutional stakeholder participation in urban redevelopment in Tehran: An evaluation of decisions and actions. Land Use Policy 2020, 91, 104367. [Google Scholar] [CrossRef]
  15. Ratanaburi, N.; Alade, T.; Saçli, F. Effects of stakeholder participation on the quality of bicycle infrastructure. A case of Rattanakosin bicycle lane, Bangkok, Thailand. Case Stud. Transp. Policy 2021, 9, 637–650. [Google Scholar] [CrossRef]
  16. Du, G.; Kray, C.; Degbelo, A. Interactive Immersive Public Displays as Facilitators for Deeper Participation in Urban Planning. Int. J. Hum. Comput. Interact. 2020, 36, 67–81. [Google Scholar] [CrossRef]
  17. Nguyen, M.T.; Nguyen, H.K.; Vo-Lam, K.D.; Nguyen, X.G.; Tran, M.T. Applying virtual reality in city planning. In Proceedings of the Virtual, Augmented and Mixed Reality: 8th International Conference, VAMR 2016, Held as Part of HCI International 2016, Toronto, ON, Canada, 17–22 July 2016; pp. 724–735. [Google Scholar]
  18. Frank, J.A.; Kapila, V. Mixed-reality learning environments: Integrating mobile interfaces with laboratory test-beds. Comput. Educ. 2017, 110, 88–104. [Google Scholar] [CrossRef] [Green Version]
  19. Pribeanu, C.; Balog, A.; Iordache, D.D. Measuring the perceived quality of an AR-based learning application: A multidimensional model. Interact. Learn. Environ. 2017, 25, 482–495. [Google Scholar] [CrossRef]
  20. Arino, J.J.; Juan, M.C.; Gil-Gómez, J.A.; Mollá, R. A comparative study using an autostereoscopic display with augmented and virtual reality. Behav. Inf. Technol. 2014, 33, 646–655. [Google Scholar] [CrossRef] [Green Version]
  21. Zhao, M.Y.; Ong, S.K.; Nee, A.Y.C. An Augmented Reality-Assisted Therapeutic Healthcare Exercise System Based on Bare-Hand Interaction. Int. J. Hum. Comput. Interact. 2016, 32, 708–721. [Google Scholar] [CrossRef]
  22. Huang, T.L.; Liao, S.L. Creating e-shopping multisensory flow experience through augmented-reality interactive technology. Internet Res. 2017, 27, 449–475. [Google Scholar] [CrossRef]
  23. Fonseca, D.; Martí, N.; Redondo, E.; Navarro, I.; Sánchez, A. Relationship between student profile, tool use, participation, and academic performance with the use of Augmented Reality technology for visualized architecture models. Comput. Hum. Behav. 2014, 31, 434–445. [Google Scholar] [CrossRef]
  24. Huang, H.M.; Rauch, U.; Liaw, S.S. Investigating learners’ attitudes toward virtual reality learning environments: Based on a constructivist approach. Comput. Educ. 2010, 55, 1171–1182. [Google Scholar] [CrossRef]
  25. Wu, H.; He, Z.; Gong, J. A virtual globe-based 3D visualization and interactive framework for public participation in urban planning processes. Comput. Environ. Urban Syst. 2010, 34, 291–298. [Google Scholar] [CrossRef]
  26. Celikcan, U.; Askin, M.B.; Albayrak, D.; Capin, T.K. Deep into visual saliency for immersive VR environments rendered in real-time. Comput. Graph. 2020, 88, 70–82. [Google Scholar] [CrossRef]
  27. Jamei, E.; Mortimer, M.; Seyedmahmoudian, M.; Horan, B.; Stojcevski, A. Investigating the role of virtual reality in planning for sustainable smart cities. Sustainability 2017, 9, 2006. [Google Scholar] [CrossRef] [Green Version]
  28. Roumpani, F. Developing Classical and Contemporary Models in ESRI’s City Engine; Working Papers Series; UCL: London, UK, 2013; p. 191. [Google Scholar]
  29. Zhang, C.; Zeng, W.; Liu, L. UrbanVR: An immersive analytics system for context-aware urban design. Comput. Graph. 2021, 99, 128–138. [Google Scholar] [CrossRef]
  30. Belaroussi, R.; Dai, H.; González, E.D.; Gutiérrez, J.M. Designing a Large-Scale Immersive Visit in Architecture, Engineering, and Construction. Appl. Sci. 2023, 13, 3044. [Google Scholar] [CrossRef]
  31. Jo, H.I.; Jeon, J.Y. Perception of urban soundscape and landscape using different visual environment reproduction methods in virtual reality. Appl. Acoust. 2022, 186, 108498. [Google Scholar] [CrossRef]
  32. Gómez-Tone, H.C.; Martin-Gutierrez, J.; Bustamante-Escapa, J.; Bustamante-Escapa, P. Spatial skills and perceptions of space: Representing 2D drawings as 3D drawings inside immersive virtual reality. Appl. Sci. 2021, 11, 1475. [Google Scholar] [CrossRef]
  33. Zaini, A.I.; Embi, M.R. Virtual Reality for Architectural or Territorial Representations: Usability Perceptions. Int. J. Built Environ. Sustain. 2017, 4. [Google Scholar] [CrossRef]
  34. Suh, A.; Prophet, J. The state of immersive technology research: A literature analysis. Comput. Hum. Behav. 2018, 86, 77–90. [Google Scholar] [CrossRef]
  35. Lee, H.G.; Chung, S.; Lee, W.H. Presence in virtual golf simulators: The effects of presence on perceived enjoyment, perceived value, and behavioral intention. New Media Soc. 2013, 15, 930–946. [Google Scholar] [CrossRef]
  36. Jensen, L.; Konradsen, F. A review of the use of virtual reality head-mounted displays in education and training. Educ. Inf. Technol. 2018, 23, 1515–1529. [Google Scholar] [CrossRef] [Green Version]
  37. Yoon, H.J.; Kim, J.; Park, S.W.; Heo, H. Influence of virtual reality on visual parameters: Immersive versus non-immersive mode. BMC Ophthalmol. 2020, 20, 1–8. [Google Scholar] [CrossRef] [PubMed]
  38. Gomez-Tone, H.C.; Chávez, M.A.; Samalvides, L.V.; Martin-Gutierrez, J. Introducing Immersive Virtual Reality in the Initial Phases of the Design Process—Case Study: Freshmen Designing Ephemeral Architecture. Buildings 2022, 12, 518. [Google Scholar] [CrossRef]
  39. Plechatá, A.; Sahula, V.; Fayette, D.; Fajnerová, I. Age-related differences with immersive and non-immersive virtual reality in memory assessment. Front. Psychol. 2019, 10, 1330. [Google Scholar] [CrossRef]
  40. Portman, M.E.; Natapov, A.; Fisher-Gewirtzman, D. To go where no man has gone before: Virtual reality in architecture, landscape architecture and environmental planning. Comput. Environ. Urban Syst. 2015, 54, 376–384. [Google Scholar] [CrossRef]
  41. Lehtola, V.V.; Koeva, M.; Elberink, S.O.; Raposo, P.; Virtanen, J.P.; Vahdatikhaki, F.; Borsci, S. Digital twin of a city: Review of technology serving city needs. Int. J. Appl. Earth Obs. Geoinf. 2022, 114, 102915. [Google Scholar] [CrossRef]
  42. Dodge, M. Towards the virtual city: VR & internet GIS for urban planning. GIS Eur. 1998, 6, 26–29. [Google Scholar]
  43. Rehan, R.M. Sustainable streetscape as an effective tool in sustainable urban design. HBRC J. 2013, 9, 173–186. [Google Scholar] [CrossRef] [Green Version]
  44. Verma, D.; Mumm, O.; Carlow, V.M. Identifying Streetscape Features Using VHR Imagery and Deep Learning Applications. Remote. Sens. 2021, 13, 3363. [Google Scholar] [CrossRef]
  45. Wang, R.; Rasouli, S. Contribution of streetscape features to the hedonic pricing model using Geographically Weighted Regression: Evidence from Amsterdam. Tour. Manag. 2022, 91, 104523. [Google Scholar] [CrossRef]
  46. Delhoum, Y.; Belaroussi, R.; Dupin, F.; Zargayouna, M. Analysis of MATSim Modeling of Road Infrastructure in Cyclists’ Choices in the Case of a Hilly Relief. Infrastructures 2022, 7, 108. [Google Scholar] [CrossRef]
  47. Brownson, R.C.; Ramirez, L.K.B.; Hoehner, C.M.; Cook, R.A. Analytic Audit Tool and Checklist Audit Tool. 2003. Available online: https://bel.uqtr.ca/id/eprint/3348/1/Audittoolanalyticversion.pdf (accessed on 20 January 2023).
  48. Moudon, A.V.; Lee, C. Walking and Bicycling: An Evaluation of Environmental Audit Instruments. Am. J. Health Promot. 2003, 18, 21–37. [Google Scholar] [CrossRef]
  49. Gardner, K.; Johnson, T.; Buchan, K.; Pharaoh, T. Developing a Pedestrian Strategy for London. Transport Policy and its Implementation. In Proceedings of Seminar B Held at the 24th European Transport Forum, Brunel University, Londen, UK, 2–6 September 1996. [Google Scholar]
  50. Ewing, R.; Handy, S.; Brownson, R.C.; Clemente, O.; Winston, E. Identifying and Measuring Urban Design Qualities Related to Walkability. J. Phys. Act. Health 2006, 3, S223–S240. [Google Scholar] [CrossRef]
  51. Levitte, A. Piéton et perception visuelle: Le design visité par les sciences cognitives. Actes INRETS (Arcueil) 2008, 115, 227–235. [Google Scholar]
  52. Brown, B.B.; Werner, C.M.; Amburgey, J.W.; Szalay, C. Walkable route perceptions and physical features: Converging evidence for en route walking experiences. Environ. Behav. 2007, 39, 34–61. [Google Scholar] [CrossRef]
  53. Thibaud, J.P. En Quête D’ambiances: éprouver la Ville en Passant; MétisPresses: Genève, Switzerland, 2015. [Google Scholar] [CrossRef]
  54. Tyler, N. Next-generation infrastructure for next-generation people. Proc. Inst. Civ. Eng. Smart Infrastruct. Constr. 2020, 173, 24–28. [Google Scholar] [CrossRef]
Figure 1. Canal of the Port of Rimini (in red) and pictures of its current quays. Imagery taken from Google Earth.
Sustainability 15 05547 g001
Figure 2. Study area: VR overview and virtual scene with its urban context.
Sustainability 15 05547 g002
Figure 3. Immersive visit design: workflow diagram from GIS urban context extracted with InfraWorks to virtual reality refined scene with TwinMotion.
Sustainability 15 05547 g003
Figure 4. Before/after project comparison using virtual scenes: examples of the current version of the docks (left) and prospective views of the docks in the future scenario (right).
Sustainability 15 05547 g004
Figure 5. Characteristics of the participants: (a) occupation and (b) mode of transportation.
Sustainability 15 05547 g005
Figure 6. Part 1 answers of the 68 participants: (a) similarity between current situation and virtual reality; (b) presence of green areas; (c) bicycle spaces; (d) ways to access the docks.
Sustainability 15 05547 g006
Figure 7. Street life: the answers for current situation are in blue and the answers for the prospective scenario are in red.
Sustainability 15 05547 g007
Figure 8. Services and functions: the answers for current situation are in blue and the answers for the prospective scenario are in red.
Sustainability 15 05547 g008
Figure 9. Sociality reflects the adequacy of a place for people to interact in.
Sustainability 15 05547 g009
Figure 10. Characterization of walkability and cycling infrastructure.
Sustainability 15 05547 g010
Figure 11. Aesthetics and atmosphere of the current area (blue) and renovated area (red).
Sustainability 15 05547 g011
Table 1. Part 2 and Part 3: mean and standard deviation for each question for the current situation and for the prospective scenario.
QuestionMeanSD
Part 2Part 3Part 2Part 3
In this place, I want to spend time.4.415.251.761.61
When I look at this place, I can project myself into
its use.
4.665.341.691.43
I think this is a good place to come and do sport.4.515.281.861.56
In this place, I know I will always find something
nice to do.
4.005.001.741.48
I think this place is ideal for resting or strolling.4.565.061.811.56
I think this is a good place to have a drink or a
bite to eat.
4.465.511.691.58
In this place, I want to get together with my
friends or family.
4.225.121.741.57
In this place I think I could meet people I know
or don’t know.
4.384.931.701.62
In this place, I want to ride my bike.3.944.562.021.93
I want to walk around this place.5.065.431.621.44
The circulation in this space seems fluid.4.315.121.931.58
I feel safe in this place.4.885.461.571.31
I can easily find my way around this place.5.545.601.231.17
I think this place is beautiful.4.384.901.911.77
This place is an invitation to dream.3.324.031.851.84
It is a pleasure for the eyes to look at this place.3.744.631.891.83
The atmosphere of this place is pleasant.4.414.971.721.63
I think this place has enough green space.3.244.161.921.83
When I look at this place, I can quickly see
how to get to the edge of the water.
5.225.341.451.41
Table 2. Part 1: mean and standard deviation for each question.
QuestionMeanSD
Similarity between current situation and virtual reality4.091.50
Presence of green areas3.991.81
Bicycle spaces3.971.78
Ways to access the docks3.911.71
Disclaimer/Publisher’s Note: The statements, opinions and data contained in all publications are solely those of the individual author(s) and contributor(s) and not of MDPI and/or the editor(s). MDPI and/or the editor(s) disclaim responsibility for any injury to people or property resulting from any ideas, methods, instructions or products referred to in the content.

