
How Does Green Finance Affect the Sustainable Development of the Regional Economy? Evidence from China

Abstract
:1. Introduction
2. Data Source and Index Construction
2.1. Data Source
- Green credit data come from the China Stock Market and Accounting Research (CSMAR) database and China Financial Statistics Yearbook.
- Green stock data come from the Wind database.
- Green insurance data come from China Insurance Yearbook.
- Other green finance indices data come from China Statistical Yearbook.
- The data on the SDRE are all from the China Statistical Yearbook.
2.2. Construction of Green Finance Indices
2.3. Construction of SDRE Indices
3. Development and Coupling Coordination Measurement for Green Finance and SDRE
3.1. Development Level of Green Finance and SDRE
3.1.1. Entropy Method
3.1.2. Comprehensive Score of Green Finance
3.1.3. Comprehensive Score of SDRE
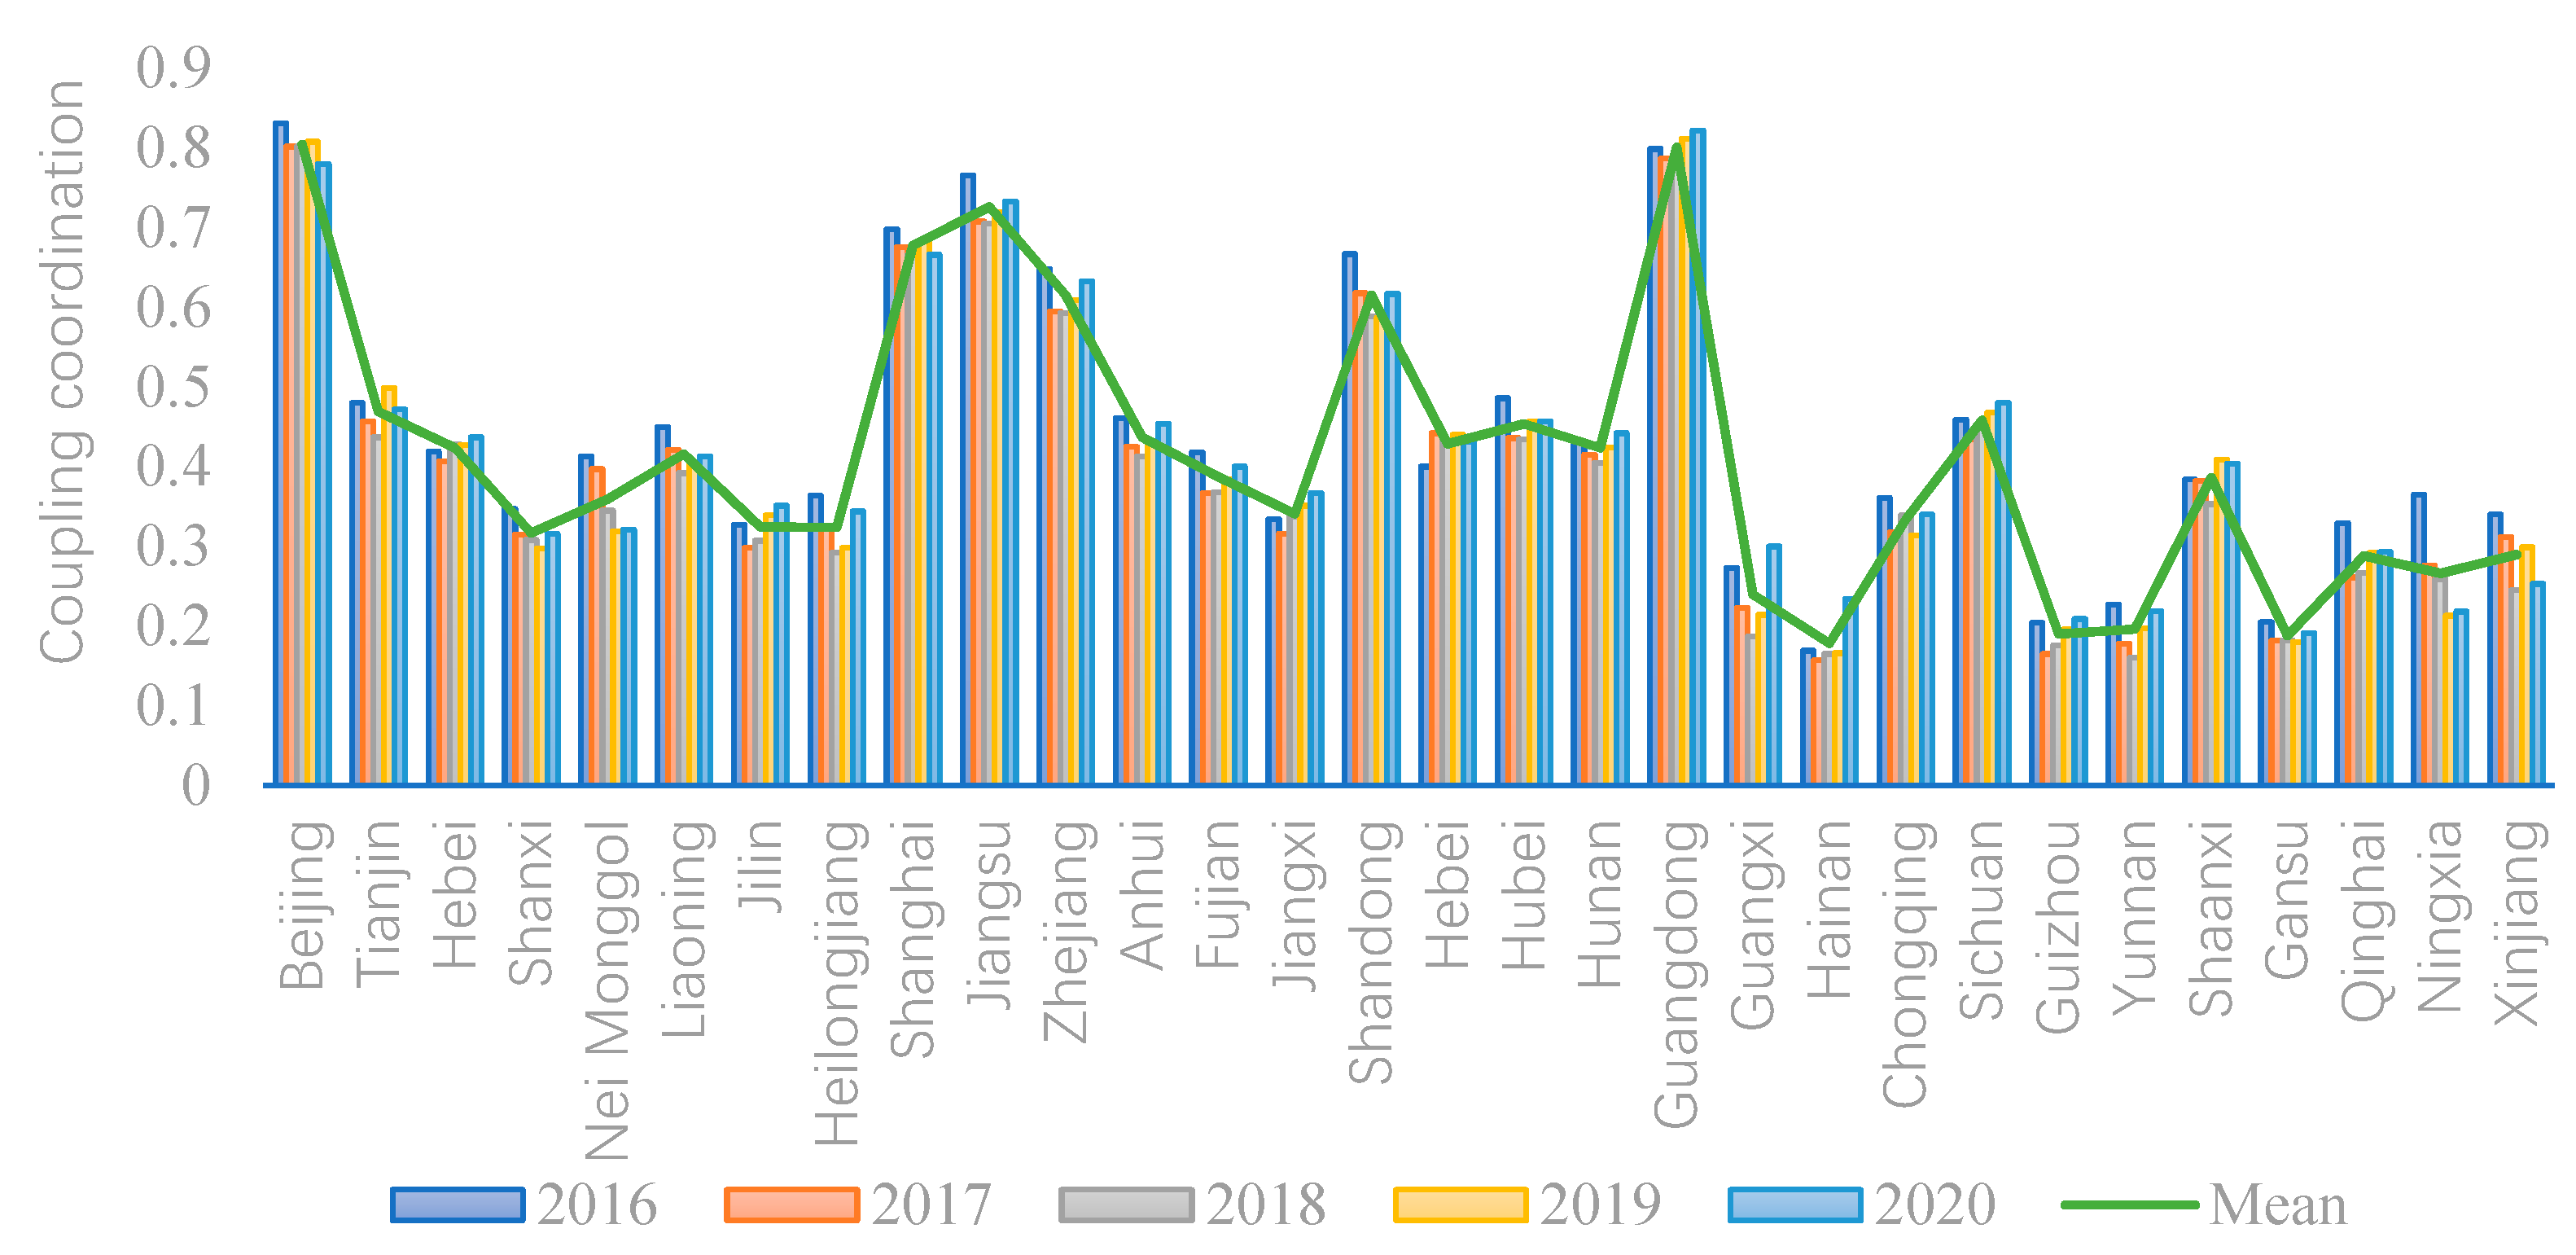
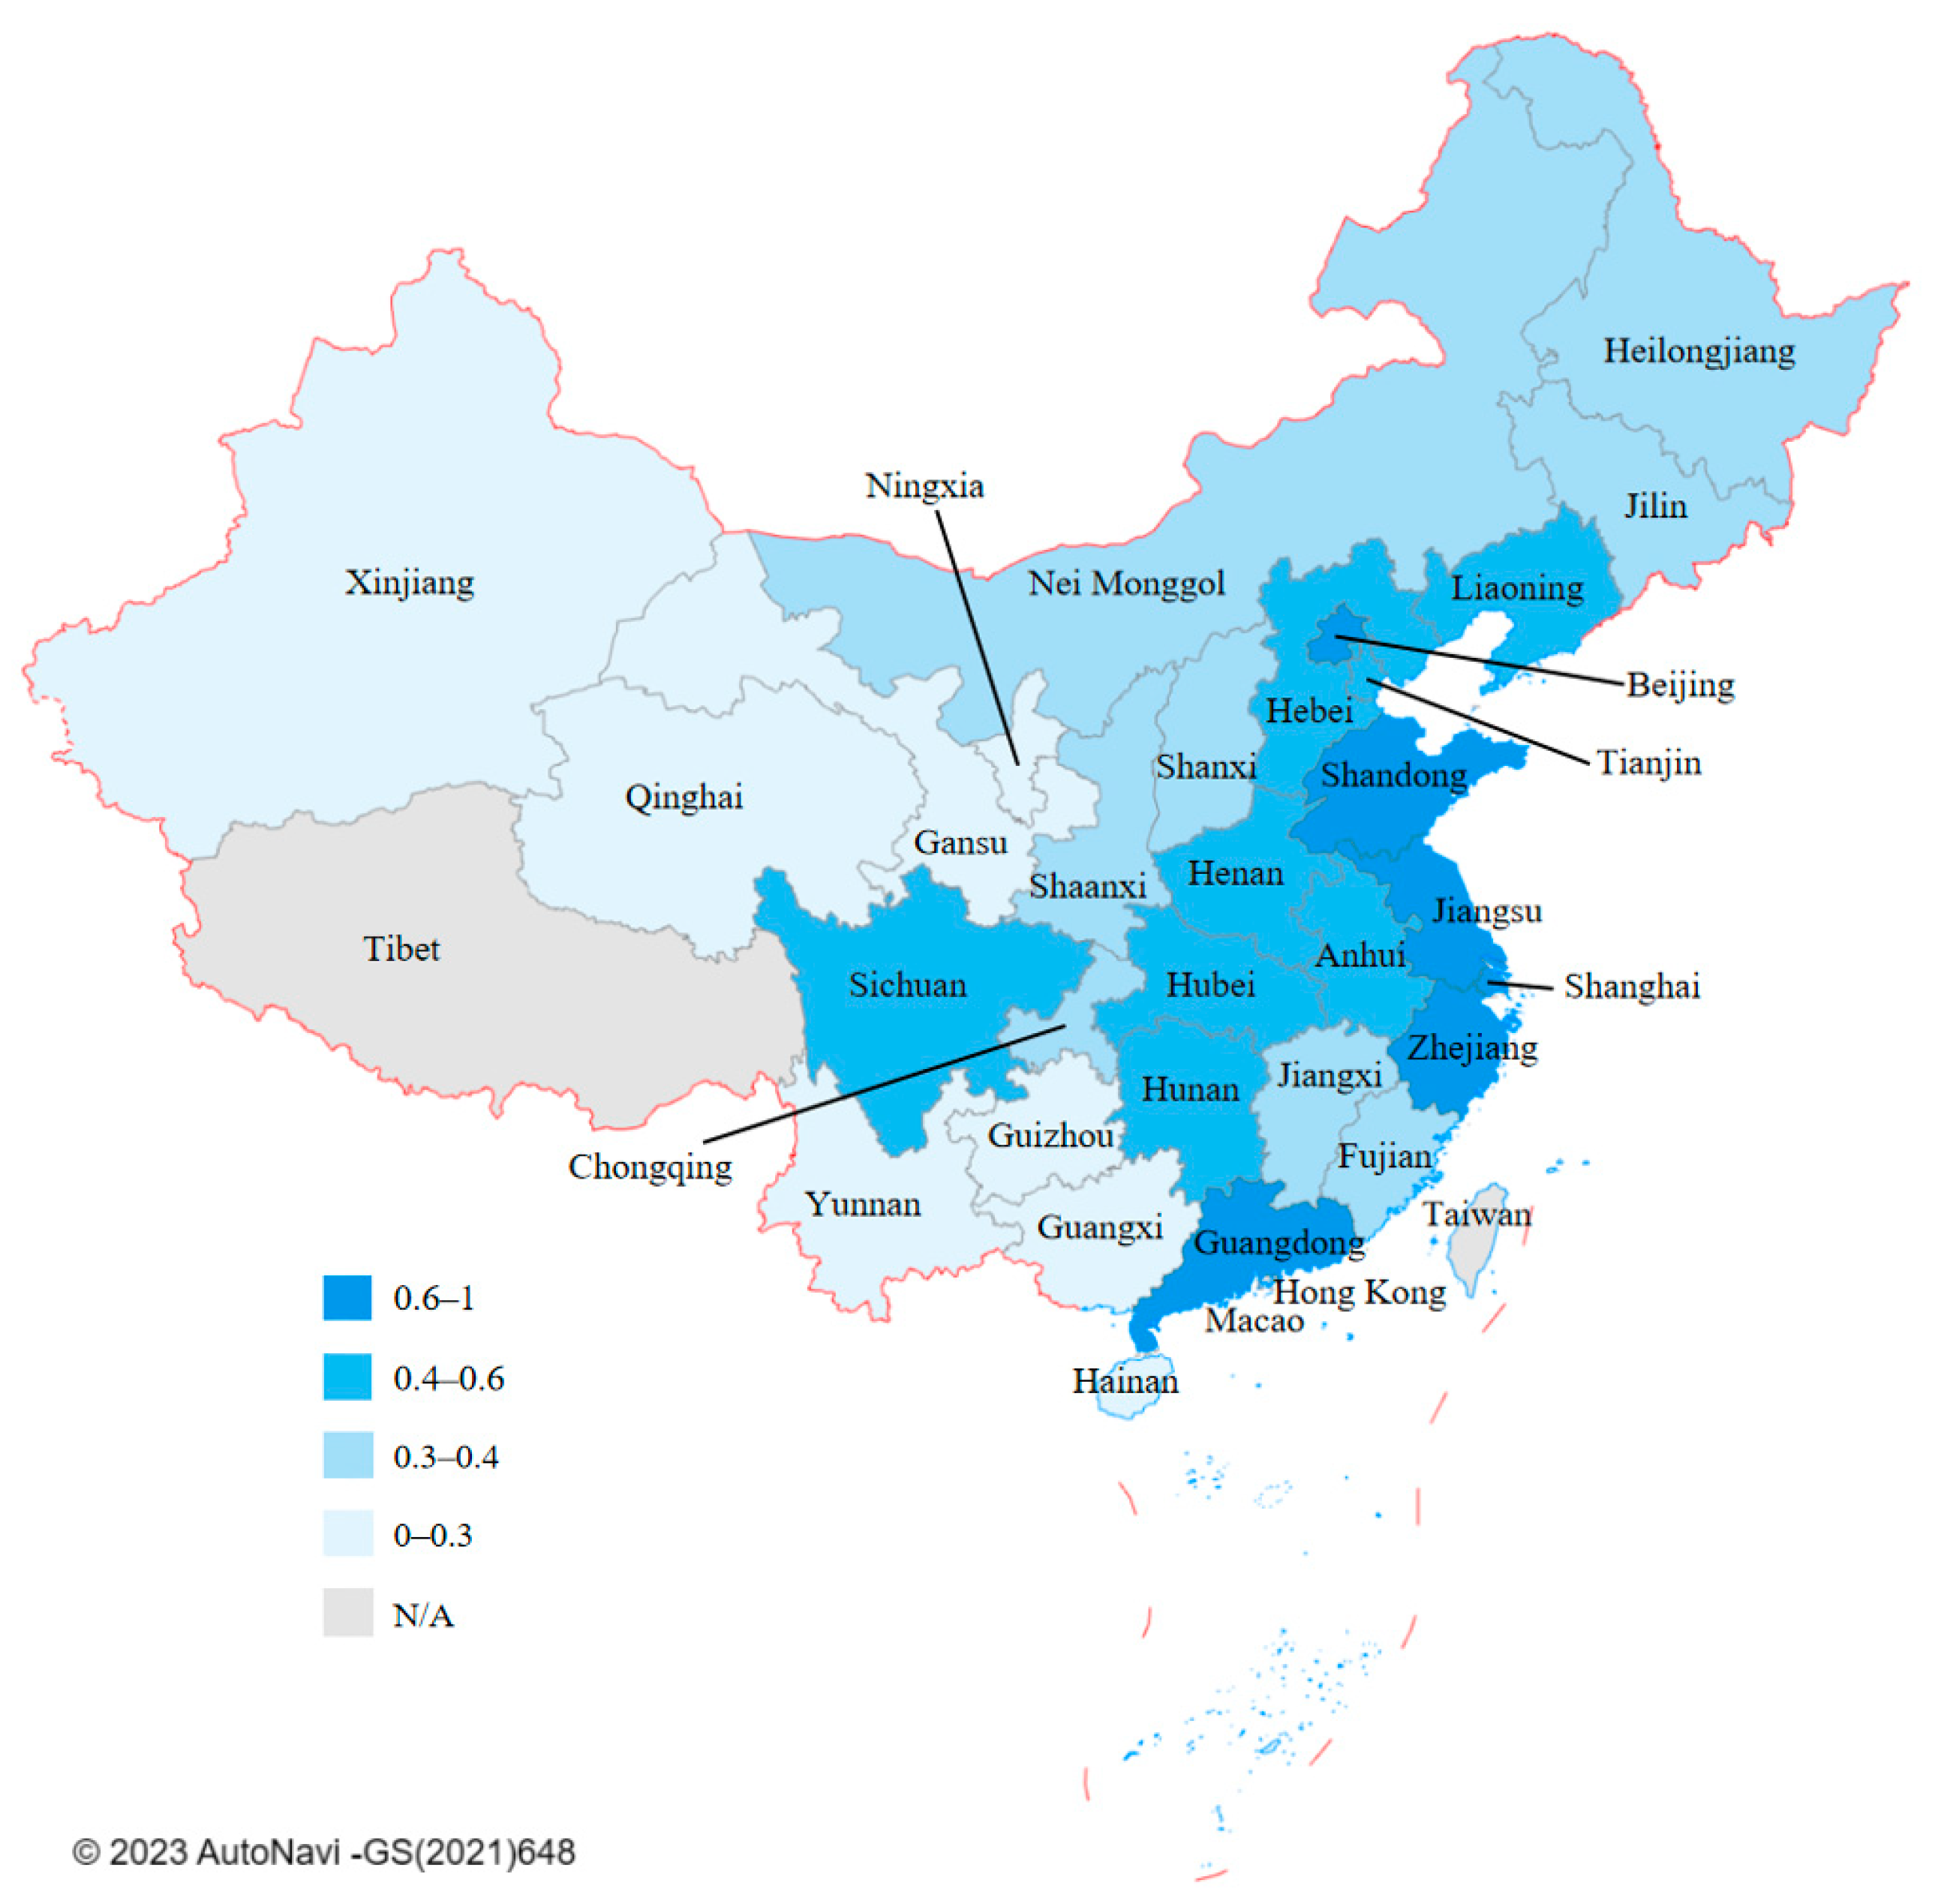
3.2. Analysis of Coupling Coordination Degree between Green Finance and SDRE
4. Panel Regression Analysis of Green Finance’s Impact on SDRE
4.1. Descriptive Analysis
4.2. Pearson Correlation Test
4.3. Panel Data Regression Analysis
4.4. Regional Heterogeneity Analysis
- (1)
- Compared with other regions, green finance in the 1st echelon in which regions have a significant role in promoting the SDRE. The p-value is less than 0.05 and the coefficient is 0.6947. Due to the increasingly mature financial industry, sound green finance policies, the green finance market in China is prosperous. The urbanization rate is significant at the 1% level, with a coefficient of 1.7988, while the level of scientific research input Invest and education expenditure Education has no significant influence. That might be because the development level of scientific innovation and urbanization in the 1st echelon regions have been maintained in a high state. These impacts have not been fully revealed.
- (2)
- Green finance shows a certain inhibition effect on the SDRE in the 2nd echelon regions, with a p-value less than 0.1 and a coefficient of −0.0894. The possible reason may be that the development of regional green finance in the 2nd echelon needs to catch up since the sustainable economy is still in the fundamental stage. An unreasonable industrial structure need to continuous restructure, superabundant energy-intensive industries also need more capital support for the transition to environmental friendly industries. In addition, the innovation cycle of scientific technology and education takes a long time to achieve; thus, it might not play an obvious role in the process of SDRE in the short term. Therefore, the coupling coordination between green finance and SDRE in the 2nd echelon needs to be strengthened.
- (3)
- Due to the geographical disadvantages of the 3rd and 4th echelon regions, green finance has problems such as late start and policy lag. It plays a minor role in promoting regional sustainability. However, the control variable Invest has significant positive feedback in the 4th echelon, possibly due to new scientific research forces have been introduced in economically backward regions recent years. The influence of education expenditure level is insignificant because the period of education investment return is longer, and it is only a tiny link in the SDRE.
5. Robustness Test
- (1)
- The explained variable lags one phase to prove the original regression model’s reliability.
- (2)
- To confirm the rationality of the empirical analysis, the comprehensive level of SDRE was divided into two groups: the high stage and the primary stage.
- (3)
- To further verify the impact of green finance on the SDRE, the explanatory variable green financial development level was divided into two groups: good level and laggard level.
- (1)
- Results of the explained variable lag one phase. According to test Ⅰ in Table 12, the regression results of lagging the explained variable SDRE for one phase show that the core explanatory variables GFin and the control variables Invest, Urban, and Education are significantly verified, with p-values of less than 0.01. It proves that the original regression model is reliable.
- (2)
- Grouping regression results of SDRE. The panel data were divided into two groups according to the median of the SDRE: the high stage and the primary stage for the robustness test. According to test Ⅱ in Table 12, green finance significantly impacts the SDRE in the two stages, which have passed the robustness verification. The GFin’s coefficient in primary stage is 0.0492, while in high stage is 0.6906, meaning that green finance has a more substantial promoting effect on the SDRE at the high stage.
- (3)
- Group regression results of green finance. According to test Ⅲ in Table 12, green finance is divided into two groups of regression: good level and laggard level. In the group of good level, green finance has a significant positive role in promoting SDRE. The p-value of GFin is less than 0.05, and the coefficient is 0.2258. Additionally, the control variables Invest, Urban, and Education are significantly verified with p-values of less than 0.01, which means our model can be considered stable. However, the green finance of the laggard level group has an insignificant impact on the SDRE, which may be due to the deviation effect caused by their low comprehensive ranking and relative imbalance. This finding corroborates the studies mentioned in the literature review [19]. The results show that the laggard level of green finance cannot be effectively connected with industrial restructuring and SDRE, resulting in the insignificant support of green finance on economic growth.
6. Conclusions and Expectations
- According to the comprehensive scores of green finance and SDRE calculated using the entropy method, the overall levels of green finance and SDRE have steadily improved from 2016 to 2020. Generally, most eastern coastal regions have been leading the ranking, while the development score of the central and western regions has increased but still lags significantly behind the former.
- The coupling coordination analysis shows that the eastern coastal region is mainly in good or excellent coupling coordination, the central regions are mainly at the basic coupling stage, and the western inland regions are mainly at a low level. The difference depends on the development level of green finance and SDRE.
- According to the analysis of regional heterogeneity, green finance has the most significant positive impact in the 1st echelon, followed by an insignificant role in the 3rd and 4th echelons. Nevertheless, it has a certain inhibition effect in the 2nd echelon, showing vigorous characteristics of regional heterogeneity.
Author Contributions
Funding
Institutional Review Board Statement
Informed Consent Statement
Data Availability Statement
Conflicts of Interest
References
- Huang, Z.; Dong, H.; Jia, S. Equilibrium pricing for carbon emission in response to the target of carbon emission peaking. Energy Econ. 2022, 112, 106160. [Google Scholar] [CrossRef]
- Sadiq, M.; Amayri, M.A.; Paramaiah, C.; Mai, N.H.; Ngo, T.Q.; Phan, T.T.H. How green finance and financial development promote green economic growth: Deployment of clean energy sources in South Asia. Environ. Sci. Pollut. Res. 2022, 29, 65521–65534. [Google Scholar] [CrossRef]
- Mngumi, F.; Shaorong, S.R.; Shair, F.; Maqas, M. Does green finance mitigate the effects of climate variability: Role of renewable energy investment and infrastructure. Environ. Sci. Pollut. Res. 2022, 29, 59287–59299. [Google Scholar] [CrossRef]
- Jia, Q.X. The impact of green finance on the level of decarbonization of the economies: An analysis of the United States’, China’s, and Russia’s current agenda. Bus. Strategy Environ. 2022, 32, 110–119. [Google Scholar] [CrossRef]
- Zhou, X.G.; Tang, X.M.; Zhang, R. Impact of green finance on economic development and environmental quality: A study based on provincial panel data from China. Environ. Sci. Pollut. Res. 2020, 27, 19915–19932. [Google Scholar] [CrossRef]
- Wang, X.Y.; Zhao, H.K.; Bi, K.X. The measurement of green finance index and the development forecast of green finance in China. Environ. Ecol. Stat. 2021, 28, 263–285. [Google Scholar] [CrossRef]
- Mohsin, M.; Taghizadeh-Hesary, F.; Panthamit, N.; Anwar, S.; Abbas, Q.; Vo, X.V. Developing Low Carbon Finance Index: Evidence From Developed and Developing Economies. Financ. Res. Lett. 2020, 43, 101520. [Google Scholar] [CrossRef]
- Ren, S.Y.; Wu, H.T. Path to green development: The role environmental regulation and labor skill premium on green total factor energy efficiency. Green Financ. 2022, 4, 387–410. [Google Scholar] [CrossRef]
- Wan, Q.L.; Qian, J.E.; Yu, M.M. Analysis of Green Financial Policy Utility: A Policy Incentive Financial Mechanism Based on State Space Model Theory Algorithm. J. Sens. 2022, 2022, 5978122. [Google Scholar] [CrossRef]
- Bai, J.C.; Chen, Z.L.; Yan, X.; Zhang, Y.Y. Research on the impact of green finance on carbon emissions: Evidence from China. Econ. Res.-Ekon. Istraz. 2022, 35, 6965–6984. [Google Scholar] [CrossRef]
- Xing, L.N.; Li, J.; Yu, Z. Green Finance Strategies for the Zero-Carbon Mechanism: Public Spending as New Determinants of Sustainable Development. Front. Environ. Sci. 2022, 10, 925678. [Google Scholar] [CrossRef]
- Flammer, C. Corporate green bonds. J. Financ. Econ. 2021, 142, 499–516. [Google Scholar] [CrossRef]
- Ye, T.F.; Xiang, X.L.; Ge, X.Y.; Yang, K.L. Research on Green Finance and Green Development Based Eco-Efficiency and Spatial Econometric Analysis. Sustainability 2022, 14, 2825. [Google Scholar] [CrossRef]
- Lin, T.; Du, M.Y.; Ren, S.Y. How do green bonds affect green technology innovation? Firm evidence from China. Green Financ. 2022, 4, 492–511. [Google Scholar] [CrossRef]
- Wang, K.H.; Zhao, Y.X.; Jiang, C.F.; Li, Z.Z. Does green finance inspire sustainable development? Evidence from a global perspective. Econ. Anal. Policy 2022, 75, 412–426. [Google Scholar] [CrossRef]
- Huang, Y.M.; Chen, C.; Lei, L.J.; Zhang, Y.P. Impacts of green finance on green innovation: A spatial and nonlinear perspective. J. Clean. Prod. 2022, 365, 132548. [Google Scholar] [CrossRef]
- Zhang, J.; Ke, H.Q. The Moderating Effect and Threshold Effect of Green Finance on Carbon Intensity: From the Perspective of Capital Accumulation. Complexity 2022, 2022, 4273691. [Google Scholar] [CrossRef]
- Zhou, H.J.; Xu, G.Y. Research on the impact of green finance on China’s regional ecological development based on system GMM model. Resour. Policy 2022, 75, 102454. [Google Scholar] [CrossRef]
- Yin, X.L.; Xu, Z.R. An empirical analysis of the coupling and coordinative development of China’s green finance and economic growth. Resour. Policy 2022, 75, 102476. [Google Scholar] [CrossRef]
- Zeng, Y.T.; Wang, F.; Wu, J. The Impact of Green Finance on Urban Haze Pollution in China: A Technological Innovation Perspective. Energies 2022, 15, 801. [Google Scholar] [CrossRef]
- Lee, C.C.; Lee, C.C. How does green finance affect green total factor productivity? Evidence from China. Energy Econ. 2022, 107, 105863. [Google Scholar] [CrossRef]
- Ge, L.; Zhao, H.X.; Yang, J.Y.; Yu, J.Y.; He, T.Y. Green finance, technological progress, and ecological performance-evidence from 30 Provinces in China. Environ. Sci. Pollut. Res. 2022, 29, 66295–66314. [Google Scholar] [CrossRef]
- Li, Y.; Zhang, X.T.; Gao, X.X. An Evaluation of the Coupling Coordination Degree of an Urban Economy-Society-Environment System Based on a Multi-Scenario Analysis: The Case of Chengde City in China. Sustainability 2022, 14, 6790. [Google Scholar] [CrossRef]
- Huan, Y.Z.; Liang, T.; Li, H.T.; Zhang, C.S. A systematic method for assessing progress of achieving sustainable development goals: A case study of 15 countries. Sci. Total Environ. 2021, 752, 141875. [Google Scholar] [CrossRef]
- Gao, J.L.; Shao, C.F.; Chen, S.H.; Zhang, X.T. Spatiotemporal evolution of sustainable development of China’s provinces: A modelling approach. Ecosyst. Health Sustain. 2021, 7, 1965034. [Google Scholar] [CrossRef]
- Jin, H.; Qian, X.Y.; Chin, T.C.; Zhang, H.J. A Global Assessment of Sustainable Development Based on Modification of the Human Development Index via the Entropy Method. Sustainability 2020, 12, 3251. [Google Scholar] [CrossRef] [Green Version]
- Cheng, Z.; Zhao, T.Y.; Zhu, Y.X.; Li, H.S. Evaluating the Coupling Coordinated Development between Regional Ecological Protection and High-Quality Development: A Case Study of Guizhou, China. Land 2022, 11, 1775. [Google Scholar] [CrossRef]
- Chen, L.F.; Wu, H. Measuring the Level of Regional Economic Synergistic Development and Its Driving Factors. Emerg. Mark. Financ. Trade 2022, 1–18. [Google Scholar] [CrossRef]
- Liu, R.Y.; Wang, D.Q.; Zhang, L.; Zhang, L.H. Can green financial development promote regional ecological efficiency? A case study of China. Nat. Hazards 2019, 95, 325–341. [Google Scholar] [CrossRef]
- Tang, M.L.; Ding, J.N.; Kong, H.J.; Bethel, B.J.; Tang, D.C. Influence of Green Finance on Ecological Environment Quality in Yangtze River Delta. Int. J. Environ. Res. Public Health 2022, 19, 10692. [Google Scholar] [CrossRef]


| Primary Indices | Secondary Indices | Tertiary Indices | Computing Method | Attribute |
|---|---|---|---|---|
| Environmental protection fund support | Green credit | Interest scale of energy-intensive consuming credit | Interest expense of energy-intensive industries/Total industrial interest expense | − |
| Regional green credit scale | Regional green credit balance/Loan balance of financial institutions | + | ||
| Green stock | The market value of energy-intensive industries | The market value of six energy-intensive industries/Total A-share market value of China | − | |
| Green insurance | Agricultural insurance proportion | Agricultural insurance premium income/Total agricultural output value | + | |
| The proportion of environmental pollution investment | Investment in pollution control/Regional GDP | + | ||
| Green investment | The proportion of investment in environmental infrastructure construction | Investment in environmental infrastructure construction/Regional GDP | + | |
| Carbon finance | Carbon emission intensity | Total carbon dioxide emissions/GDP | − | |
| Government support | Emphasis on green finance | The proportion of the added value of the tertiary industry | The added value of the tertiary industry/GDP | + |
| The proportion of turnover in the technology market | Technical market turnover/Regional GDP | + | ||
| Support for green finance | The proportion of energy conservation and environmental protection expenditure | Financial expenditure on energy conservation and environmental protection/Total financial expenditure | + |
| Primary Indices | Secondary Indices | Tertiary Indices | Computing Method | Attribute |
|---|---|---|---|---|
| Innovation ability | Input intensity | The proportion of R&D expenditure | R&D expenditure/GDP | + |
| Output efficiency | Number of patent applications | — | + | |
| Coordination and stability | Urban-rural gap | The ratio of disposable income of urban and rural residents | Urban residents’ disposable income/Rural residents’ disposable income | − |
| The ratio of urban and rural consumption levels | Consumption expenditure of urban residents/Consumption expenditure of rural residents | − | ||
| Industrial optimization | Industrial structure rationalization index | Value added of secondary industry/Value added of tertiary industry | − | |
| Development benefits | The proportion of the manufacturing industry | The added value of secondary industry/GDP | + | |
| Green sustainability | Ecological environment | Solid waste discharge per unit of GDP | Industrial solid waste discharge/GDP | − |
| Green health | Greening coverage rate of built-up area | — | + | |
| Waste treatment | Domestic garbage harmless treatment rate | — | + | |
| Dual opening | International openness | Trade openness | Total volume of import and export trade/GDP | + |
| Foreign direct investment | Total foreign direct investment | + | ||
| Interregional openness | Interregional division of labor | Regional GDP/National GDP | + | |
| Achievement sharing | Regional benefits | Number of hospital beds per 1000 people | — | + |
| Medical supply | Health technicians per 1000 people | + | ||
| Cultural supply | Financial expenditure on culture, sports and media/Total regional population | + | ||
| Quality of people’s livelihood | Per capita income level of residents | Per capita disposable annual income of residents | + | |
| Consumption welfare level of residents | Per capita consumption expenditure of residents | + | ||
| Employment fluctuation | The registered urban unemployment rate | — | − | |
| Welfare guarantee | The proportion of social security and employment expenditure | Social security and employment expenditure/Public finance expenditure | + |
| Regions | 2016 | 2017 | 2018 | 2019 | 2020 | Mean | Rank |
|---|---|---|---|---|---|---|---|
| Beijing | 0.572 | 0.603 | 0.610 | 0.625 | 0.641 | 0.610 | 1 |
| Tianjin | 0.185 | 0.205 | 0.198 | 0.302 | 0.275 | 0.233 | 9 |
| Hebei | 0.203 | 0.222 | 0.255 | 0.248 | 0.253 | 0.236 | 7 |
| Shanxi | 0.195 | 0.216 | 0.205 | 0.222 | 0.206 | 0.209 | 14 |
| Nei Monggol | 0.219 | 0.223 | 0.184 | 0.172 | 0.164 | 0.192 | 15 |
| Liaoning | 0.180 | 0.180 | 0.165 | 0.182 | 0.191 | 0.180 | 18 |
| Jilin | 0.152 | 0.171 | 0.174 | 0.226 | 0.205 | 0.186 | 17 |
| Heilongjiang | 0.177 | 0.170 | 0.157 | 0.176 | 0.187 | 0.173 | 20 |
| Shanghai | 0.294 | 0.301 | 0.304 | 0.334 | 0.327 | 0.312 | 2 |
| Jiangsu | 0.286 | 0.273 | 0.271 | 0.290 | 0.306 | 0.285 | 4 |
| Zhejiang | 0.241 | 0.230 | 0.230 | 0.243 | 0.268 | 0.242 | 6 |
| Anhui | 0.226 | 0.218 | 0.206 | 0.221 | 0.216 | 0.217 | 11 |
| Fujian | 0.148 | 0.144 | 0.147 | 0.154 | 0.160 | 0.151 | 25 |
| Jiangxi | 0.154 | 0.161 | 0.177 | 0.190 | 0.186 | 0.174 | 19 |
| Shandong | 0.284 | 0.271 | 0.259 | 0.274 | 0.282 | 0.274 | 5 |
| Henan | 0.156 | 0.227 | 0.221 | 0.231 | 0.211 | 0.209 | 13 |
| Hubei | 0.217 | 0.204 | 0.204 | 0.224 | 0.224 | 0.215 | 12 |
| Hunan | 0.178 | 0.186 | 0.182 | 0.197 | 0.209 | 0.190 | 16 |
| Guangdong | 0.286 | 0.296 | 0.298 | 0.330 | 0.346 | 0.311 | 3 |
| Guangxi | 0.137 | 0.124 | 0.113 | 0.120 | 0.151 | 0.129 | 27 |
| Hainan | 0.089 | 0.104 | 0.104 | 0.101 | 0.095 | 0.099 | 30 |
| Chongqing | 0.136 | 0.137 | 0.150 | 0.137 | 0.149 | 0.142 | 26 |
| Sichuan | 0.207 | 0.208 | 0.230 | 0.237 | 0.247 | 0.226 | 10 |
| Guizhou | 0.118 | 0.116 | 0.124 | 0.136 | 0.138 | 0.126 | 28 |
| Yunnan | 0.123 | 0.118 | 0.113 | 0.122 | 0.116 | 0.118 | 29 |
| Shaanxi | 0.221 | 0.220 | 0.212 | 0.253 | 0.260 | 0.233 | 8 |
| Gansu | 0.170 | 0.154 | 0.156 | 0.152 | 0.163 | 0.159 | 23 |
| Qinghai | 0.203 | 0.141 | 0.159 | 0.171 | 0.157 | 0.166 | 22 |
| Ningxia | 0.229 | 0.164 | 0.163 | 0.136 | 0.141 | 0.167 | 21 |
| Xinjiang | 0.161 | 0.172 | 0.134 | 0.173 | 0.147 | 0.157 | 24 |
| Regions | 2016 | 2017 | 2018 | 2019 | 2020 | Mean | Rank |
|---|---|---|---|---|---|---|---|
| Beijing | 0.310 | 0.323 | 0.343 | 0.368 | 0.353 | 0.339 | 5 |
| Tianjin | 0.206 | 0.208 | 0.214 | 0.213 | 0.216 | 0.211 | 8 |
| Hebei | 0.143 | 0.156 | 0.168 | 0.187 | 0.201 | 0.171 | 17 |
| Shanxi | 0.113 | 0.118 | 0.130 | 0.138 | 0.154 | 0.131 | 26 |
| Nei Monggol | 0.133 | 0.150 | 0.154 | 0.161 | 0.174 | 0.154 | 19 |
| Liaoning | 0.183 | 0.202 | 0.210 | 0.215 | 0.222 | 0.206 | 10 |
| Jilin | 0.122 | 0.125 | 0.139 | 0.151 | 0.170 | 0.141 | 22 |
| Heilongjiang | 0.127 | 0.137 | 0.142 | 0.150 | 0.174 | 0.146 | 21 |
| Shanghai | 0.347 | 0.381 | 0.387 | 0.402 | 0.405 | 0.384 | 4 |
| Jiangsu | 0.481 | 0.496 | 0.528 | 0.547 | 0.577 | 0.526 | 2 |
| Zhejiang | 0.343 | 0.360 | 0.383 | 0.408 | 0.429 | 0.385 | 3 |
| Anhui | 0.157 | 0.170 | 0.184 | 0.205 | 0.239 | 0.191 | 14 |
| Fujian | 0.192 | 0.207 | 0.217 | 0.235 | 0.248 | 0.220 | 7 |
| Jiangxi | 0.124 | 0.139 | 0.154 | 0.169 | 0.189 | 0.155 | 18 |
| Shandong | 0.313 | 0.330 | 0.326 | 0.326 | 0.380 | 0.335 | 6 |
| Henan | 0.165 | 0.177 | 0.189 | 0.205 | 0.221 | 0.191 | 13 |
| Hubei | 0.180 | 0.190 | 0.204 | 0.224 | 0.235 | 0.207 | 9 |
| Hunan | 0.170 | 0.189 | 0.200 | 0.218 | 0.234 | 0.202 | 12 |
| Guangdong | 0.551 | 0.635 | 0.669 | 0.692 | 0.726 | 0.655 | 1 |
| Guangxi | 0.107 | 0.122 | 0.131 | 0.146 | 0.170 | 0.135 | 24 |
| Hainan | 0.122 | 0.128 | 0.147 | 0.163 | 0.306 | 0.173 | 16 |
| Chongqing | 0.159 | 0.168 | 0.181 | 0.192 | 0.202 | 0.180 | 15 |
| Sichuan | 0.167 | 0.184 | 0.198 | 0.225 | 0.240 | 0.203 | 11 |
| Guizhou | 0.095 | 0.106 | 0.116 | 0.131 | 0.139 | 0.117 | 29 |
| Yunnan | 0.099 | 0.109 | 0.119 | 0.137 | 0.155 | 0.124 | 28 |
| Shaanxi | 0.120 | 0.143 | 0.145 | 0.174 | 0.179 | 0.152 | 20 |
| Gansu | 0.088 | 0.100 | 0.111 | 0.125 | 0.132 | 0.111 | 30 |
| Qinghai | 0.106 | 0.125 | 0.130 | 0.149 | 0.163 | 0.135 | 25 |
| Ningxia | 0.112 | 0.119 | 0.126 | 0.135 | 0.141 | 0.127 | 27 |
| Xinjiang | 0.123 | 0.130 | 0.135 | 0.151 | 0.150 | 0.138 | 23 |
| Year | C-Value | T-Value | D-Value | Coordination Level | Coupling Coordination Degree |
|---|---|---|---|---|---|
| 2016 | 0.535 | 0.064 | 0.186 | 1 | Low coordination |
| 2017 | 0.937 | 0.183 | 0.414 | 3 | Good coordination |
| 2018 | 0.296 | 0.223 | 0.257 | 1 | Low coordination |
| 2019 | 0.991 | 0.777 | 0.878 | 4 | Excellent coordination |
| 2020 | 1.000 | 0.990 | 0.995 | 4 | Excellent coordination |
| Regions | 2016 | 2017 | 2018 | 2019 | 2020 | Mean | Coordination Level | Coordination Situation |
|---|---|---|---|---|---|---|---|---|
| Beijing | 0.831 | 0.802 | 0.802 | 0.808 | 0.780 | 0.805 | 4 | Excellent coordination |
| Tianjin | 0.480 | 0.457 | 0.437 | 0.499 | 0.472 | 0.469 | 3 | Good coordination |
| Hebei | 0.419 | 0.407 | 0.428 | 0.427 | 0.437 | 0.424 | 3 | Good coordination |
| Shanxi | 0.347 | 0.315 | 0.308 | 0.298 | 0.316 | 0.317 | 2 | Basic coordination |
| Nei Monggol | 0.413 | 0.398 | 0.345 | 0.319 | 0.321 | 0.359 | 2 | Basic coordination |
| Liaoning | 0.450 | 0.421 | 0.392 | 0.404 | 0.414 | 0.416 | 3 | Good coordination |
| Jilin | 0.327 | 0.298 | 0.307 | 0.339 | 0.351 | 0.324 | 2 | Basic coordination |
| Heilongjiang | 0.364 | 0.323 | 0.292 | 0.298 | 0.345 | 0.324 | 2 | Basic coordination |
| Shanghai | 0.698 | 0.676 | 0.665 | 0.683 | 0.666 | 0.678 | 4 | Excellent coordination |
| Jiangsu | 0.766 | 0.708 | 0.705 | 0.720 | 0.733 | 0.726 | 4 | Excellent coordination |
| Zhejiang | 0.648 | 0.595 | 0.593 | 0.609 | 0.633 | 0.616 | 4 | Excellent coordination |
| Anhui | 0.461 | 0.425 | 0.413 | 0.432 | 0.454 | 0.437 | 3 | Good coordination |
| Fujian | 0.417 | 0.367 | 0.368 | 0.384 | 0.400 | 0.387 | 2 | Basic coordination |
| Jiangxi | 0.334 | 0.316 | 0.337 | 0.351 | 0.367 | 0.341 | 2 | Basic coordination |
| Shandong | 0.667 | 0.618 | 0.589 | 0.587 | 0.617 | 0.616 | 4 | Excellent coordination |
| Henan | 0.400 | 0.442 | 0.432 | 0.440 | 0.431 | 0.429 | 3 | Good coordination |
| Hubei | 0.486 | 0.436 | 0.434 | 0.457 | 0.457 | 0.454 | 3 | Good coordination |
| Hunan | 0.432 | 0.415 | 0.405 | 0.424 | 0.442 | 0.424 | 3 | Good coordination |
| Guangdong | 0.799 | 0.787 | 0.786 | 0.812 | 0.822 | 0.801 | 4 | Excellent coordination |
| Guangxi | 0.273 | 0.223 | 0.187 | 0.214 | 0.299 | 0.239 | 1 | Low coordination |
| Hainan | 0.169 | 0.157 | 0.165 | 0.166 | 0.234 | 0.178 | 1 | Low coordination |
| Chongqing | 0.361 | 0.318 | 0.339 | 0.314 | 0.340 | 0.334 | 2 | Basic coordination |
| Sichuan | 0.459 | 0.434 | 0.451 | 0.468 | 0.480 | 0.458 | 3 | Good coordination |
| Guizhou | 0.204 | 0.165 | 0.176 | 0.197 | 0.208 | 0.190 | 1 | Low coordination |
| Yunnan | 0.227 | 0.178 | 0.160 | 0.198 | 0.219 | 0.196 | 1 | Low coordination |
| Shaanxi | 0.384 | 0.382 | 0.354 | 0.409 | 0.404 | 0.387 | 2 | Basic coordination |
| Gansu | 0.205 | 0.182 | 0.182 | 0.180 | 0.191 | 0.188 | 1 | Low coordination |
| Qinghai | 0.329 | 0.261 | 0.267 | 0.292 | 0.293 | 0.288 | 1 | Low coordination |
| Ningxia | 0.365 | 0.277 | 0.259 | 0.213 | 0.218 | 0.266 | 1 | Low coordination |
| Xinjiang | 0.340 | 0.312 | 0.245 | 0.299 | 0.253 | 0.290 | 1 | Low coordination |
| Echelons | Regions |
|---|---|
| 1st | 6 regions (Beijing; Guangdong; Jiangsu; Shanghai; Zhejiang; Shandong) |
| 2nd | 8 regions (Tianjin; Sichuan; Hubei; Anhui; Henan; Hebei; Hunan; Liaoning) |
| 3rd | 8 regions (Fujian; Shaanxi; Nei Monggol; Jiangxi; Chongqing; Jilin; Heilongjiang; Shanxi) |
| 4th | 8 regions (Xinjiang; Qinghai; Ningxia; Guangxi; Yunnan; Guizhou; Gansu; Hainan) |
| Variables | Number | Mean | Standard Deviation | Minimum | Maximum |
|---|---|---|---|---|---|
| SDRE | 150 | 0.218 | 0.128 | 0.088 | 0.726 |
| GFin | 150 | 0.211 | 0.093 | 0.089 | 0.641 |
| Invest | 150 | 0.023 | 0.016 | 0.005 | 0.068 |
| Urban | 150 | 0.623 | 0.106 | 0.446 | 0.893 |
| Education | 150 | 0.159 | 0.025 | 0.103 | 0.209 |
| Variables | SDRE | GFin | Invest | Urban | Education |
|---|---|---|---|---|---|
| SDRE | 1 | — | — | — | — |
| GFin | 0.574 *** | 1 | — | — | — |
| Invest | 0.790 *** | 0.667 *** | 1 | — | — |
| Urban | 0.594 *** | 0.654 *** | 0.650 *** | 1 | — |
| Education | 0.217 *** | −0.022 | 0.156 * | −0.357 *** | 1 |
| Variables | OLS | RE | FE | Controls |
|---|---|---|---|---|
| GFin | 0.0103 | 0.1674 ** | 0.2033 ** | N |
| (0.0948) | (0.0776) | (0.0797) | ||
| Invest | 4.2718 *** | 2.1161 *** | 1.8032 *** | Y |
| (0.6388) | (0.5143) | (0.5283) | ||
| Urban | 0.4077 *** | 0.8352 *** | 0.9580 *** | Y |
| (0.1014) | (0.0874) | (0.0905) | ||
| Education | 1.2910 *** | 0.5136 ** | 0.3581 | Y |
| (0.3056) | (0.2359) | (0.2382) | ||
| Constant | −0.3390 *** | −0.4666 *** | −0.5190 *** | — |
| (0.0876) | (0.0723) | (0.0737) | ||
| R2 | 0.6759 | 0.6517 | 0.6581 | — |
| N | 150 | 150 | 150 | — |
| Variables | 1st Echelon | 2nd Echelon | 3rd Echelon | 4th Echelon |
|---|---|---|---|---|
| GFin | 0.6947 ** | −0.0894 * | 0.0911 | 0.4125 |
| (0.3105) | (0.0481) | (0.0571) | (0.2744) | |
| Invest | 0.4537 | 0.1097 | 0.0325 | 6.5224 *** |
| (0.9656) | (0.3964) | (0.4318) | (1.9537) | |
| Urban | 1.7988 *** | 1.0807 *** | 0.9184 *** | 0.9005 *** |
| (0.3463) | (0.0795) | (0.0598) | (0.2014) | |
| Education | 0.2261 | −0.1753 | 0.1327 | 0.2038 |
| (0.6649) | (0.2029) | (0.1555) | (0.7068) | |
| Constant | −1.2084 *** | −0.4193 *** | −0.4510 *** | −0.5183 ** |
| (0.2383) | (0.0620) | (0.0491) | (0.2183) | |
| R2 | 0.8325 | 0.9467 | 0.9363 | 0.5801 |
| N | 30 | 40 | 40 | 40 |
| Test I | Test II | Test III | |||
|---|---|---|---|---|---|
| Lagged SDRE | High Stage | Primary Stage | Good Level | Laggard Level | |
| GFin | 0.2491 *** | 0.6906 ** | 0.0492 * | 0.2258 ** | −0.1112 |
| (0.0707) | (0.2886) | (0.0295) | (0.1120) | (0.2261) | |
| Invest | 1.2251 *** | 0.5705 | 0.2946 | 1.6262 *** | 4.0222 *** |
| (0.4159) | (0.8557) | (0.2671) | (0.5785) | (1.1082) | |
| Urban | 0.9618 *** | 1.7460 *** | 0.7819 *** | 1.2809 *** | 0.7273 *** |
| (0.0824) | (0.3148) | (0.0335) | (0.1418) | (0.1343) | |
| Education | 0.6594 *** | 0.2380 | −0.2652 ** | 1.0105 *** | −0.5206 |
| (0.1812) | (0.6092) | (0.1017) | (0.3084) | (0.3904) | |
| Constant | −0.5805 *** | −1.1351 *** | −0.2765 *** | −0.8396 *** | −0.2294 * |
| (0.0602) | (0.2130) | (0.0301) | (0.1058) | (0.1149) | |
| R2 | 0.7483 | 0.8296 | 0.9134 | 0.7878 | 0.6069 |
| N | 120.0000 | 41.0000 | 109.0000 | 75.0000 | 75.0000 |
Disclaimer/Publisher’s Note: The statements, opinions and data contained in all publications are solely those of the individual author(s) and contributor(s) and not of MDPI and/or the editor(s). MDPI and/or the editor(s) disclaim responsibility for any injury to people or property resulting from any ideas, methods, instructions or products referred to in the content. |
© 2023 by the authors. Licensee MDPI, Basel, Switzerland. This article is an open access article distributed under the terms and conditions of the Creative Commons Attribution (CC BY) license (https://creativecommons.org/licenses/by/4.0/).
Share and Cite
Ma, H.; Miao, X.; Wang, Z.; Wang, X. How Does Green Finance Affect the Sustainable Development of the Regional Economy? Evidence from China. Sustainability 2023, 15, 3776. https://doi.org/10.3390/su15043776
Ma H, Miao X, Wang Z, Wang X. How Does Green Finance Affect the Sustainable Development of the Regional Economy? Evidence from China. Sustainability. 2023; 15(4):3776. https://doi.org/10.3390/su15043776
Chicago/Turabian StyleMa, Huizi, Xuan Miao, Zhen Wang, and Xiangrong Wang. 2023. "How Does Green Finance Affect the Sustainable Development of the Regional Economy? Evidence from China" Sustainability 15, no. 4: 3776. https://doi.org/10.3390/su15043776