1. Introduction
An important strategy for reducing the vehicular traffic in urban areas and, consequently, the relative impacts linked to air and noise pollution and safety consists surely of increasing the use of sustainable transport modes, such as walking, which is the most basic form of transport. The benefits of increased walking include not only reductions in traffic congestion and pollution but also improvements in public health, community relations and economic and real estate performance [
1]. The literature dealing with this theme is rich in studies analyzing walkability, defined as the extent to which an environment enables walking [
2] and is pedestrian-friendly [
3]. Considering the importance of pedestrian mobility as an opportunity to enhance quality of life in urban areas, it is necessary to provide tools that could allow an evaluation of the existing walking environment in order to identify the criticalities of the various pedestrian paths with the final aim to improve them and to consequently increase the number of trips by walking and creating a competition with motorized transport modes. In this paper, we want to provide a practical tool for evaluating pedestrian paths characterized by different peculiarities. Pedestrian environments can be very different among them. As an example, there are segregation-oriented projects based on the assumption that pedestrians need an exclusive space to walk and that the interaction with other transport modes should be reduced, while there are also interaction-oriented projects based on the assumption that interaction between motorized modes and pedestrians is a key to achieving sustainable mobility patterns [
4]. When such different contexts have to be evaluated, an approach that can take into account different aspects becomes particularly useful.
This work defines indicators for measuring the various performance criteria for evaluating the different alternative pedestrian paths. Objective and subjective indicators were adopted for measuring performance criteria that can be suitable for evaluating the various pedestrian environments. The objective indicators are based on the use of information obtained on the field, such as the presence of furniture or the presence of the sidewalk and so on; on the other hand, the subjective indicators represent the pedestrians’ perceptions about some elements or characteristics of the path, collected by ad hoc surveys. When the same aspect or characteristic can be measured both objectively and subjectively, the two kinds of information could be opportunely combined in mixed indicators. In order to verify their effectiveness, the proposed indicators are introduced in a multi-criteria decision analysis (MCDA), which was chosen as a tool for evaluating the various alternatives (pedestrian paths) by considering different performance criteria.
The main scope of this work is to propose a methodology for comparing the various alternatives on the basis of criteria or indicators that measure different aspects, because if pedestrian environment could be regarded as the best one according to a specific criterion, the same environment could be regarded as the worst according to another criterion. A MCDA is applied to identify which criteria or indicators are most appreciated by pedestrians on each path, in order to direct the design of pedestrian paths towards the needs of pedestrians. The study concerns a small urban area in Southern Italy where active mobility (walking and cycling) is little practiced and scarcely encouraged.
In the following section, we report the literature review, followed by the description of the methodology.
Section 4 concerns the description of the case study.
Section 5 regards the outcomes related to the definition of the indicators and provided by the multi-criteria decision analysis. Finally, we discuss the results and make some conclusive considerations.
2. Literature Review
Walking can be considered as a sensorial experience given by pedestrian interaction with infrastructure, other individuals and the surroundings. Considering only physical characteristics of the infrastructures could result in a superficial analysis of walking. For designing appropriate policies aimed at improving pedestrian activity, it is necessary to have a previous understanding of pedestrian perceptions and subjective attributes [
5].
Several reasons determine the residences’ preference for a pedestrian path in an urban environment. For example, the surroundings and the presence of shops and services along the path constitute attractive aspects for the choice of the path. Furthermore, the choice of a pedestrian path strongly depends on the time taken to move on foot. Analyzing the pedestrian mobility, the distance that the pedestrian plans to walk needs to be considered. As argued by [
6] the urban environment, it should be reformulated on the basis of the 15-min city concept, whose central idea is walkability of public amenities, workplaces and public spaces from the place of residence. This model of urban space involves a reorganization of infrastructure and services to make sure that the time required to reach them by active mobility (on foot or by bicycle) oscillates within 15 min.
In urban and rural environment, pedestrian paths are also used for sports [
7]. Its positive impact on individuals and communities contributes to making small-town life more attractive, which can be gradually expanded through conscious constructions.
The creation of a sustainable mobility system cannot be limited only to pedestrian mobility or urban mobility as a whole but must be strongly integrated within a regional sustainable development project [
8].
The study of pedestrian mobility began in the 70s, with the definition of the Level of Service (LOS) for pedestrian infrastructures. The pedestrian LOS (PLOS), introduced by [
9], considered only flow and geometry attributes for evaluating pedestrian infrastructure as urban sidewalks. Until the end of the 1980s, this indicator was derived from the level of service concept for highway design contained in the Highway Capacity Manual [
10].
Starting from the 1990s, the proposed methodologies for evaluating pedestrian facilities began to include the attributes recognizing pedestrian interactions when walking, as surrounding attributes, up to including the perceptions of pedestrians. The more recent studies are based on the collection of pedestrian perceptions in terms of ratings expressed on evaluation scales.
A PLOS model that covers various street conditions for pedestrians with different ranges of abilities was proposed by [
11]. They included in the analysis many attributes related to the characteristics of the sidewalk and to the street condition, which were evaluated by the pedestrians. Some of these attributes are: slower traffic speed, buffers and barriers, fewer traffic lanes, landscape and trees, furniture, footpath pavements, markings (crosswalks), width of footpath, lighting, slope, tactile pavement, ramp, bench and seating areas and drinking fountains.
Talavera-Garcia et al. [
12] developed an alternative walking index, named Quality of Pedestrian Level of Service (Q-PLOS). This index is based on the quality of urban design for pedestrians and their relationship with walking needs. They grouped the factors considering the following walking needs: accessibility, safety, comfort and attractiveness. Then they defined the relevant factors in pedestrian mobility publications, according to relevance, applicability and understanding criteria. The variables included in the model were connectivity, pavement width, traffic speed, tree density and commercial density.
Bivina et al. [
13] developed a pedestrian level of service (PLOS) model to assess street level sidewalk infrastructure facilities from various land uses considering pedestrians’ perceptions. They argued that most of the studies conducted previously have neglected the importance of considering pedestrians’ perception in assessing PLOS of sidewalks. In order to encourage the walking practice, it is essential to be aware of the current status of satisfaction of pedestrians in using sidewalks’ infrastructures and factors that are being considered important while walking. In this regard, the authors considered physical characteristics (such as sidewalk surface, sidewalk width, obstruction, the potential for vehicular conflict, continuity) and user characteristics (such as encroachment, availability of crossing facilities, security, walk environment, comfort) in their study.
Vallejo-Borda et al. [
14] proposed a cognitive map to understand and explain pedestrian sidewalk quality of service of a given infrastructure when walking, based on perceptions. They gathered the perceptions of 1056 pedestrians on-site and found that seven latent variables (i.e., sidewalk characteristics, externalities, surrounding, discomfort, bike hassles, protection and amenities) interrelate to each other, forming a pedestrian cognitive map. The cognitive map showed three latent variables related to the interaction between pedestrians and other transportation modes (i.e., externalities, discomfort and bike hassles) that impact the perceived quality of service negatively and four latent variables related to the interaction between pedestrians and different elements of the sidewalk (i.e., sidewalk characteristics, surrounding, amenities and protection) that impact the perceived quality of service positively.
For providing a comfortable and safe walking environment, it may also be useful to consider the effect of potentially negative factors on pedestrian mobility, such as the presence of bicycles. The research of [
15] studied how pedestrians perceive LOS on sidewalks shared with bicycles under various urban–street conditions.
Many factors significantly affected LOS perceptions, including sidewalk width, the presence of a barrier separating the sidewalk from motor-vehicle traffic, the presence of parking next to the sidewalk, the presence of businesses along the sidewalk, the bicycle flow rate, the speed of the bicyclist, whether or not bicycles were riding against the flow of pedestrians, weather conditions, time of day and age of the respondent. Kang et al. [
15] found that the bicycle flow rate, maximum speed and bicyclists riding against the pedestrian flow all have a strong negative impact on pedestrian perceptions of LOS.
On the basis of the literature, in our paper, we define indicators for measuring the various performance criteria and develop a MCDA for evaluating the different alternative pedestrian paths.
In the literature, MCDA methods have already been developed to study pedestrian mobility. For example, Ruiz-Padillo et al. [
16] proposed a weighted walkability index, constructed on the basis of the relative importance of their attributes calculated by the application of the Fuzzy Analytic Hierarchy Process (FAHP). An analysis based on the Analytical Hierarchy Process (AHP) method was proposed by Campisi et al. [
17] to compare different pedestrian routes, including several factors relating to the surrounding environment and psychological and perceptual aspects. Bivina and Parida [
18] enhanced the comprehension of the decision-making process of pedestrians using the AHP to acquire priorities for various criteria that affect pedestrians’ choice of walking.
Compared to the studies already present in the literature, the objective of the proposed work is to identify the aspects of different pedestrian paths that are more pleasing to pedestrians, i.e., which aspects determine the choice to make a move on foot.
3. Methodology
3.1. Indicators
The pedestrian paths were evaluated by considering indicators taking into account the objective presence of elements along the path or representing geometric characteristics, together with the perceptions or opinions of the pedestrians really walking on the various paths [
13,
19]. We have calculated subjective, objective and mixed indicators.
The subjective indicators were elaborated starting from the data collected by the survey about the pedestrians’ perceptions on different aspects of the walkways. The pedestrians’ perceptions can be classified into three main factors: perceived level of comfort (about temperature, lighting, smell, environment closed to the path, cleanliness, landscape); perceived degree of nuisance (about street lane width, street lane number, traffic volume, traffic speed, pollution, noise); and perceived degree of protection (about theft or robbery, accidents on the pedestrian path, accident involving vehicles, weather, stray animals). The subjective indicators are the following:
comfort due to other pedestrians;
nuisance for cyclists (related to bike flow, high speed);
nuisance for obstacles;
nuisance for vehicles (related to vehicle flow, high speed);
nuisance for pollution (related to air pollution and noise);
comfort and environment (related to temperature, lighting, smell, environment close to the path, cleanliness, landscape, furniture);
protection (from theft or robbery, accidents, weather, stray animals).
The objective indicators are measurements performed on the field. Two objective measurements are included:
The mixed indicators were defined by combining pedestrians’ perceptions and measured quantities regarding pavement width, pavement conditions, slope, benches and other equipment and shady areas. In particular, the mixed indicators elaborated are the following:
shops, mixing the pedestrians’ perceptions about the level of comfort related to presence of shops and the measurement along the path of the number of shops per kilometer;
tree-lined path, related to the level of comfort for shade of trees expressed by respondents and to the measurement of a tree-lined path;
type of road, considering the degree of nuisance related to width and the number of vehicular lanes and the type of road in relation to the functional classification of the roads (neighborhood street, main street);
path width, calculated starting from the pedestrians’ evaluation of the path width and the measured path width;
path continuity, defined combining the pedestrians’ evaluation of continuity and demarcation of the path and the calculated percentage of sidewalks on the total length of the walkway;
pavement conditions, calculated considering the pedestrians’ evaluation of the pavement state and the technical takeover of the state of the pavement;
accessibility to public transport, measured combining the pedestrians’ evaluation of accessibility of public transport and the number of public transport stops per kilometer along the pedestrian path.
3.2. Multi-Criteria Decision Analysis
This work adopts a MCDA considering four pedestrian paths as alternatives. The decision-makers deal with the pedestrian path that best meets their needs. The main purpose is ranking the four walkways and highlighting how the influence of the walkability criteria varies among alternatives. A MCDA allows the treatment of complex problems distinguished by multiple, conflicting and incommensurate objectives.
MCDA methods proposed in the literature start from the same evaluation table, but they require different additional information. Among the different MCDA methods, we have adopted PROMETHEE (Preference Ranking Organization METHod for Enrichment of Evaluations), which belongs to the class of outranking methods [
20]. It consists in a preference function associated to each criterion as well as weights describing their relative importance. We have chosen this method because it requires very clear additional information (between the criteria and within each criterion), which is easily obtained and understood by both decision-makers and analysts [
21]. Information between the criteria represents weights of relative importance of the different criteria. These weights are non-negative numbers, independent from the measurement units of the criteria. Information within each criterion concerns the preference function that is based on pairwise comparisons. Six types of particular preference functions were proposed in PROMETHEE; we have chosen the V-shape criterion.
The definition of the criteria is the step following the identification of the alternatives. We decided to adopt the subjective, objective and mixed indicators defined in the previous paragraph as criteria. For establishing the weights associated with the criteria, a panel of experts was contacted; more specifically, we asked about 10 university colleagues, with knowledge and experience in transportation planning, who gave us very useful suggestions in the selection of the criteria and expressed their opinion about the importance (i.e., weight) of each criteria. We elaborated upon the data using the Visual PROMETHEE software (
www.promethee-gaia.net/, accessed on 10 February 2023).
The output of the method consists of a series of measurement, as positive and negative outranking flows and net outranking score. The positive outranking flow expresses how an alternative is outranking all the others. It is its power. The negative outranking flow expresses how an alternative is outranked by all the others. It is its weakness. The net outranking score is the balance between the positive and the negative outranking flows. The higher is the net flow, the better is the alternative. In addition, the method provides the single criterion net flow obtained when an only criterion is considered. For each alternative, the set of all the single criterion net flows forms the profiles of the alternatives, which are useful to compare the alternatives on the different criteria.
4. Case Study
The case study includes four pedestrian paths in an urban area of southern Italy, where about 100,000 inhabitants live. The urban area, made up of the cities of Cosenza and Rende, extends without interruption. The urbanized area is much smaller than the entire surface of the two cities, as shown in
Figure 1. Mobility within the urban area consists almost entirely of travel by car. The percentage of active mobility (walking and cycling) is very low. More specifically, in Italy in 2022, the percentage of trips by car was about 65%, while pedestrian and cycling mobility does not reach 25%. However, in southern Italy, this difference is much more marked [
22]. The four pedestrian paths cross the entire urban area in succession from north to south (
Figure 1). These pedestrian paths differ in terms of width, pavement and other characteristics and are sited in areas with different urban configurations (
Table 1).
Walkway 1 (
Figure 2a) is an urban road and connects a higher school with a city park. The pavement was partly made of a mixture of cement and red gravel and partly of red concrete slabs. The lighting is adequate; along the path there are trees of different types, fountains for the distribution of drinking water, benches and seats. In addition, some points are positioned along the route to carry out free body exercises (benches, bars, etc.) together with signs advising the exercises to be performed and the total route. Despite the present equipment, the route would need some maintenance.
Walkway 2 (
Figure 2b) is made up of a side lane, for each direction of travel. It runs alongside two vehicle lanes and allows a quick connection between the most important residential areas of the city. The route has level access roads to the lanes intended for cars, horizontal and vertical signs. The flooring is made of natural stone and is waterproof, anti-slip and anti-freeze, resistant to loads and atmospheric agents as well as to sudden changes in temperature, with a low propensity to mold and stains. The lighting consists of warm light street lamps, and there are benches along the path. In addition, the entire route is lined with flower beds and trees but has no public toilets and bus stops. The two analyzed walkways have been recently built; therefore, the pedestrian paths meet the minimum construction standards.
Walkway 3 (
Figure 2c) is located in a residential neighborhood near the town hall. The pavement is made up of a layer of fine-grained bituminous conglomerate (wear mat) in red. The route has several crossing points, and someone is without horizontal and vertical signs. The lighting, consisting of warm light street lamps, is not sufficient. The route is free of obstacles (grills, benches, fountains, bus stops, etc.) and without public toilets and commercial premises.
Walkway 4 (
Figure 2d) connects a residential neighborhood with the university campus of the urban area and is characterized by a marked heterogeneity regarding the construction materials, the walking surface, the commercial activities, the equipment arranged along the path. As shown in
Table 1, this last path is the richest of shops (even if only in some segments), and it is the sole path without bike lanes.
For collecting the pedestrians’ perceptions about the walkways, we conducted a survey interviewing the pedestrians along the four paths. A total sample of 220 pedestrians was involved in the survey, through face-to-face interviews conducted from mid-September to the end of October in the year 2019. The questionnaire, composed of five sections, allowed the collection of information regarding the perception of pedestrians on the level of comfort, the degree of nuisance and the degree of protection along the path, the level of satisfaction about some physical and functional aspects of the path. The core of the questionnaire is the part containing the questions regarding pedestrians’ perceptions about the path characteristics reported in
Table 2, but there are some other sections aimed at collecting general information about the trip and the socioeconomic characteristics of the interviewed pedestrian, reported in
Table 3. The judgments were required on an 11-point Likert scale (from 0 to 10). Each interviewee expressed his/her own assessments with reference to the pedestrian path on which he/she was walking.
The preliminary statistics of pedestrians’ perceptions (
Table 2) showed the positives and negatives for each walkway. For example, walkway 1 comes out on top in nuisance due to obstacles, vehicle flow and speed, air pollution and noise. On the other side, walkway 1 has received low ratings in relation to the level of comfort due to the presence of shops, the degree of nuisance due to the width and number of vehicular lanes, to the accessibility to public transport. Walkway 2 results ranked well in terms of comfort and environment (related to temperature, lighting, smell, environment closed to the path, cleanliness, landscape, furniture), of comfort related to the presence of shops, of path width and pavement condition; but the pedestrians have poorly evaluated the nuisance due to bike flow and high speed. Walkway 3 gives a good comfort due to other pedestrians and a good sense of protection from theft or robbery, accidents, weather, stray animals. Then the pedestrians well evaluated the level of comfort for shade of trees and continuity and demarcation of the path, and accessibility to public transport. A negative aspect is the degree of nuisance for obstacles along the path. Walkway 4 is found to be the worst rated pedestrian path by respondents. Negative aspects are the degree of disturbance due to vehicular flow and speed, the level of air pollution and noise, the evaluation of comfort and the environment (related to temperature, lighting, smell, environment closed to the path, cleanliness, landscape, furniture), the level of protection (from theft or robbery, accidents, weather, stray animals), the path continuity and the pavement condition. Observing these results, it can be seen how pedestrian perceptions highlight the positive characteristics that a pedestrian path should have and the critical aspects that should be overcome.
In addition, the questionnaire includes questions regarding the trip (as origin and destination, estimated time to arrive at destination, frequency of trips made by using the same path, and trip purpose) and the socio-demographic characteristics (as age, gender, employment and marital status, place where the interviewed person lives and number of persons living with them).
Table 3 highlights the differences among the walkways. While walkways 1 and 2 are used prevalently by males, the other two paths are used mostly by females. Concerning age, it emerges that walkway 4 is used by pedestrians with an average age of 24 years, being this path is a connection of the urban area with the university campus; for the other paths, the average age is higher. The sample interviewed on walkway 4 is composed only by students, and it is used almost always for study purposes, while on the other paths, many pedestrians walk for sport training or shopping. Finally, walkway 4 is the path most frequently used.
5. Results
Starting from the perceptions of pedestrians and information obtained on the field, we have calculated subjective (Sub), objective (Obj) and mixed (Mix) indicators. All indicators were normalized and measured on a scale from 0 to 1, as reported in
Table 4.
The PROMETHEE method was used to evaluate the four pedestrian paths characterized by different peculiarities. The results identify the ranking of the walkways on the basis of the weights given by the panel of experts.
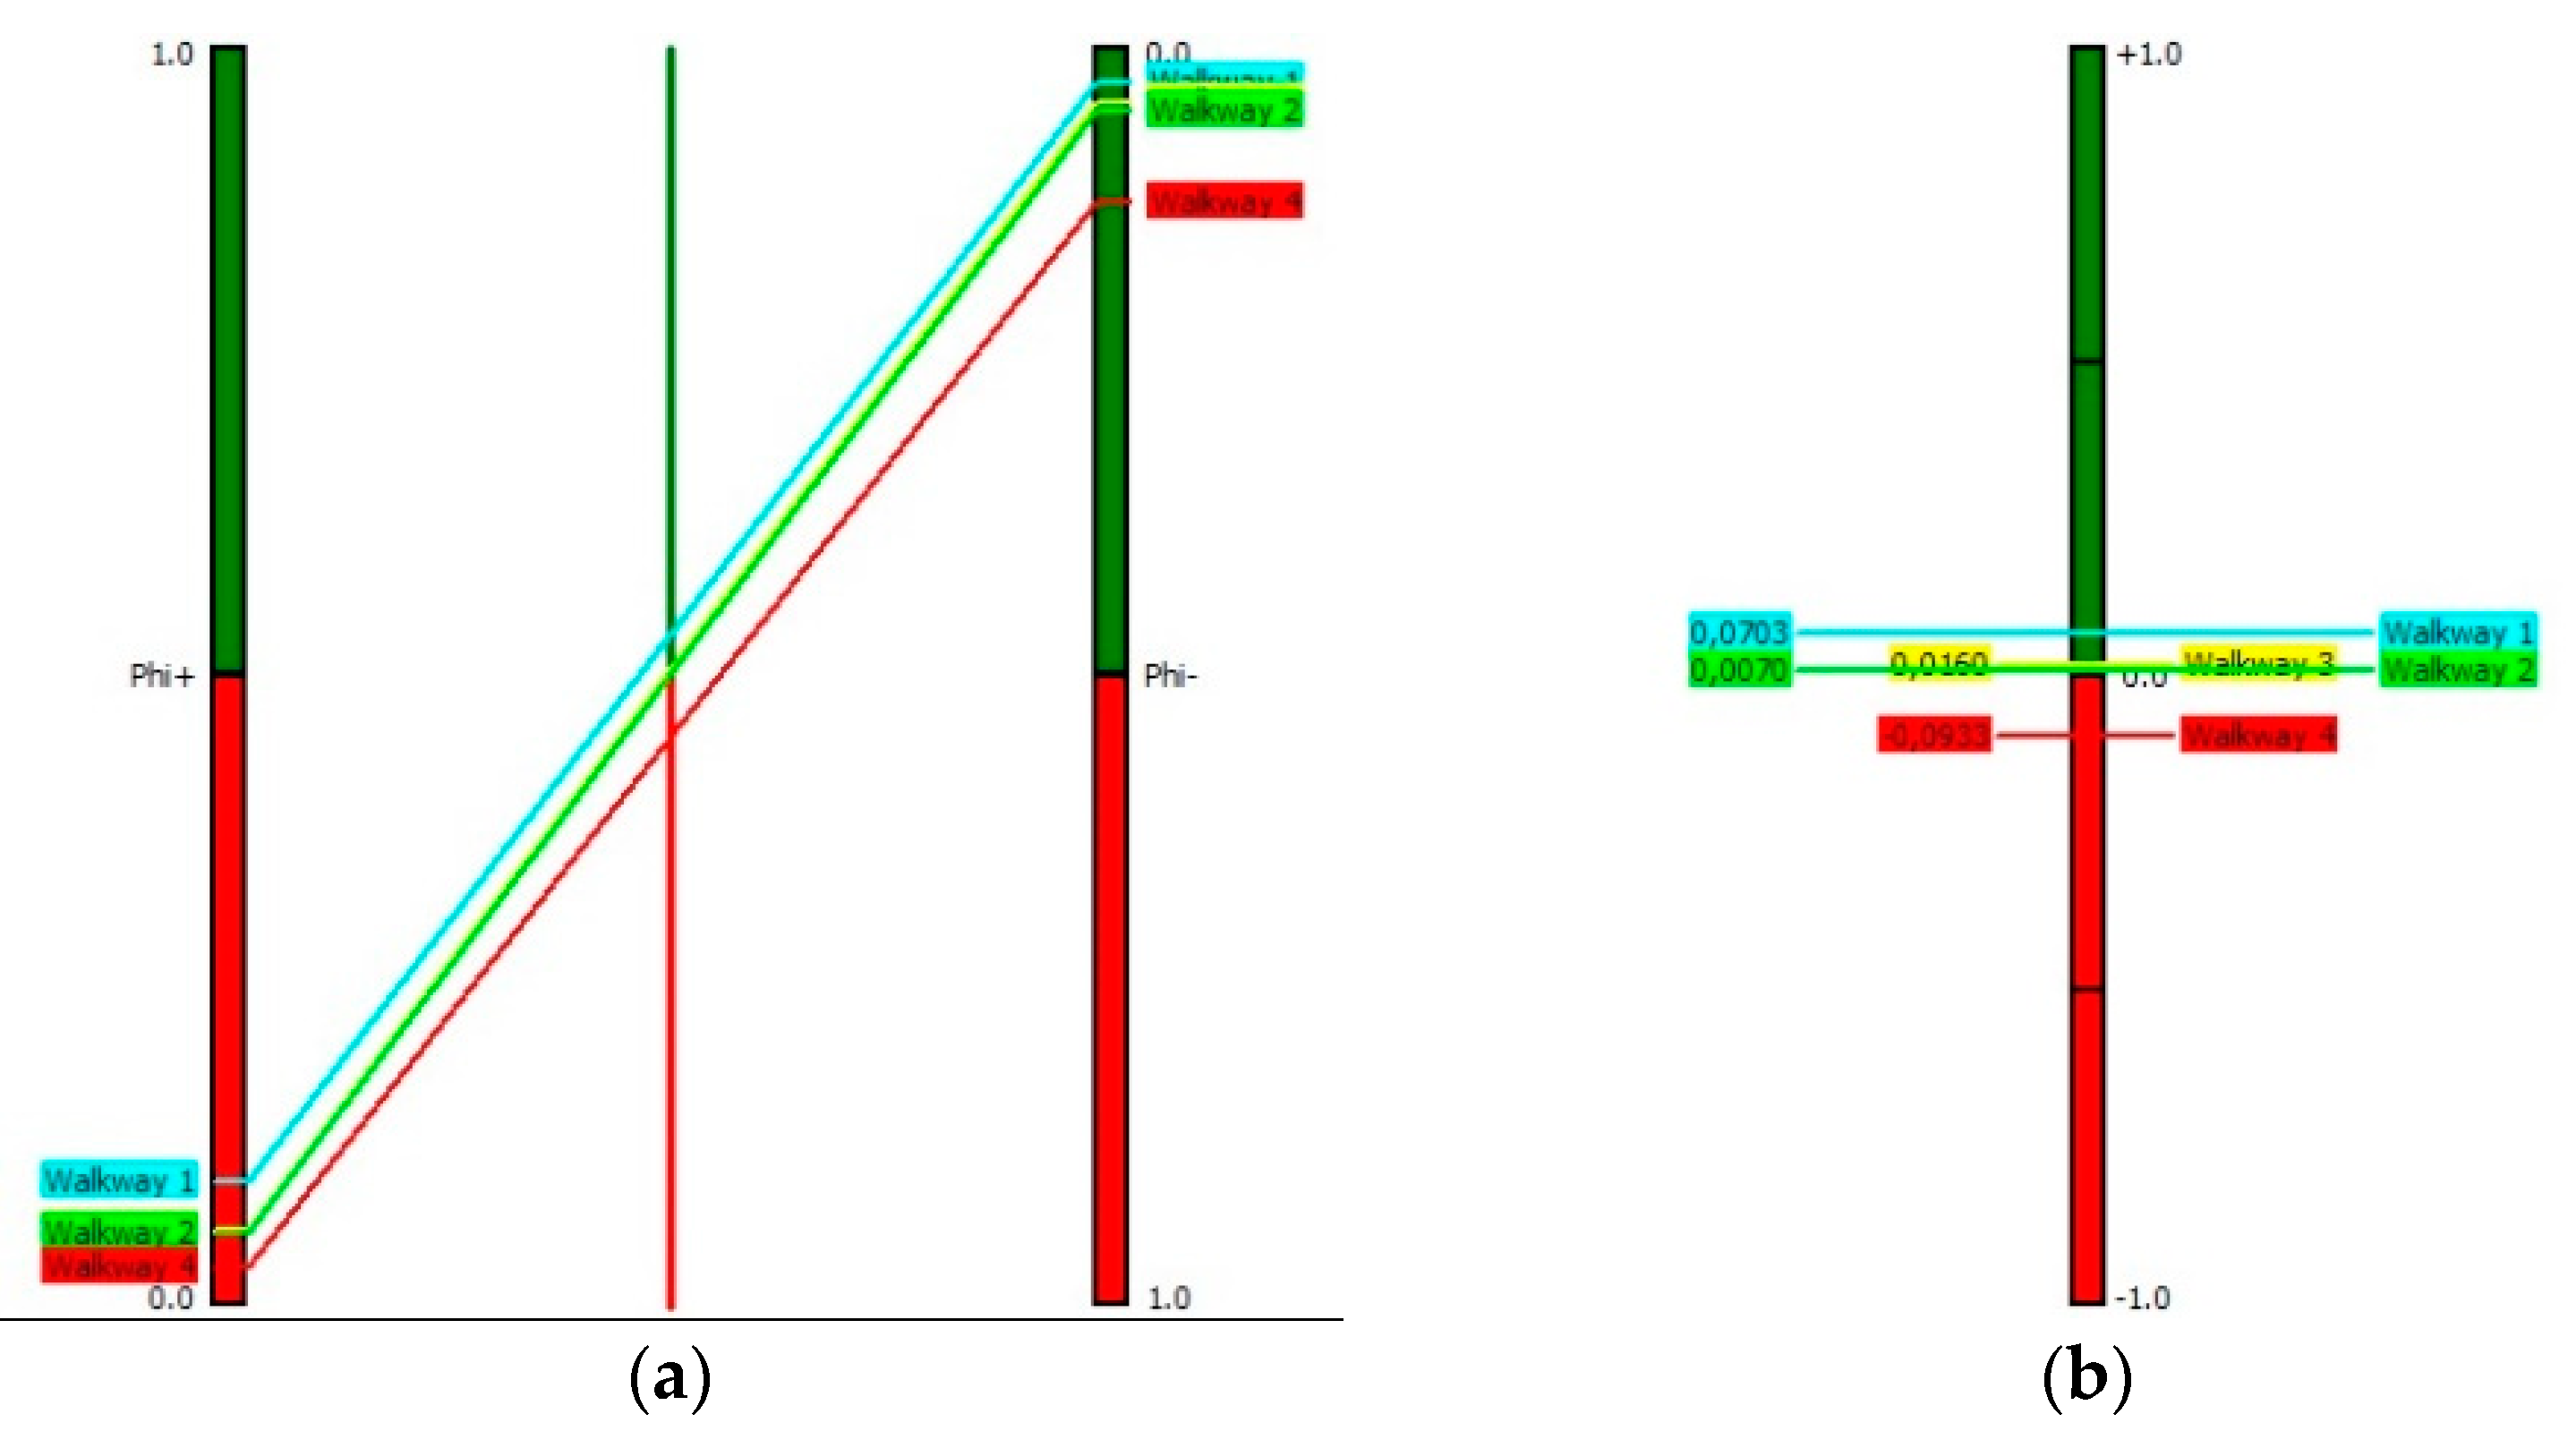
Table 5 contains the positive outranking flows (Phi+), the negative outranking flows (Phi−) and the net outranking scores (Phi). Observing the values of Phi+, Walkway 1 has the highest positive outranking flow and represents the better alternative if compared with the other ones. On the contrary, Walkway 4 has the lowest Phi+. In relation to the negative outranking flows, Walkway 4 has the highest value, and this means that this alternative is outranked by all the others. The better alternative is Walkway 1 because it has the lowest value of Phi−, which represents weakness.
The same results of outranking flows are reported in
Figure 3a. There are not incompatibilities between couples of alternatives because the lines linking Phi+ and Phi− of the same alternative are not overlapped. Walkway 1 is the alternative having the highest values of Phi+ and Phi−, followed by Walkway 3 and Walkway 2. Walkway 4 is the alternative having the lowest values of Phi+ and Phi−.
Figure 3b displays the net flow score Phi. For all the alternatives the values are close to zero. This could be caused by the reference scale used in this work. Walkway 1 has the highest value; Walkway 3 and Walkway 2 have similar values close to zero but positives. Walkway 4 has the lowest and negative Phi score. On the basis of this analysis, Walkway 1 results as the preferred alternative.
A deep analysis regards the proposed indicators for measuring the various performance criteria that can be adopted for evaluating the different alternative pedestrian paths. The single criterion net flows for each walkway have been used for comparing the alternatives on each different criterion (
Figure 4). This analysis is useful for verifying the appropriateness of the criteria. The criteria that positively influence the net outranking score of Walkway 1 are the objective indicators, as number of crosswalk (Obj1) and percentage of bike-lanes (Obj2). Few are the indicators that affect negatively. In particular, Mix2 (Tree-lined path) has a greater net flow in the negative sense.
For Walkway 2, Mix2 (Tree-lined path) has the biggest positive impact on the net flow, whereas Sub3 (Nuisance of obstacles) impacts negatively. For Walkway 3, Mix2 (Tree-lined path) is the criterion that most determine the net outranking score, followed by Obj2 (Percentage of bike-lines). Some indicators have values close to zero, and Sub2 (Nuisance for cyclists) is the criterion having the lowest net flow. Looking at the profile of Walkway 4, we can see that the majority of the criteria has negative net flows. In particular, Obj2 and Mix2 seem to be the indicators that more negatively determine the net outranking score of the alternative. Only Sub2 (Nuisance for cyclists), Sub3 (Nuisance for obstacles) and Mix1 (Shops) have positive signs, but values less than the negative indicators.
6. Discussion and Conclusions
The results showed that the MCDA, in particular the PROMETHEE method, is suitable for performing walkability analysis. In particular, the methodology allows the comparison and ranking of four alternatives on the basis of the defined criteria. Starting from positive, negative, and net outranking flow scores, the strengths and weaknesses of each alternative can be calculated. The outcomes of the multi-criteria decision analysis have identified Walkway 1 as the best alternative among the considered four paths. The ranking then provides Walkway 3 and Walkway 2. The last alternative in order of preference is Walkway 4. These results are understandable if we consider the general characteristics of the considered pedestrian paths. As already affirmed, Walkway 1 is the best pedestrian path from the infrastructural point of view, whereas Walkway 4 has serious constructive deficiencies.
By specifically analyzing the results relating to the single indicators, for Walkway 1, the objective indicators have a great impact in the preference function. This confirms the good constructive characteristics of the path. Among the subjective indicators, comfort due to other pedestrians, comfort and environment, and protection have not relevant influence. Not significant indicators are also presence of shops along the path and type of road. This result can be explained by considering that pedestrians run across Walkway 1 mainly for sport training. The strength of Walkway 2 is the presence of trees along the path, while the weakness aspects are the presence of cyclists, obstacles along the path and the number of crosswalks. Comfort and environment and protection positively affect the evaluation of the alternative but are not relevant. The other indicators are not very significant. For this path, the constructive characteristics less adequate is related to crosswalk. Tree-lined path is the strength also for Walkway 3, in conjunction with percentage of bike lanes. Nuisance for cyclists is the most important weakness. Considering the physical characteristics of the pedestrian path, this result can be caused by a weak separation of pedestrian and cycle paths. Walkway 4 presents many negative net flows. This path is lacking in terms of infrastructural aspects, commercial services, comfort for the pedestrian. Presence of cyclists in this case represents a strength aspect.
By comparing paths with different characteristics, common observations can however be obtained. Firstly, an aspect that was found to be relevant positively or negatively is the presence of areas in the shade of trees along the path. Pedestrians seem to appreciate the tree-lined paths. The presence of other cyclists is also an indicator that we have found in various alternatives. In some cases, the presence of cyclists can give a sense of security. In other cases, the cyclists cause disturbance for pedestrians, so it is better to clearly separate the two types of users. Number of crosswalks is relevant in the evaluation of pedestrian path, especially when there are shops along the path. Less relevant are the aspects related to the conditions of the pavement and to comfort and environment, while the analysis showed that pedestrians really appreciate tree-lined paths.
This finding clearly contradicts the findings of the work of Fonseca et al. [
23], where the presence of sidewalks in good condition, walk on unobstructed sidewalks and walk on streets with wide sidewalks were critical for pedestrians. Fonseca et al. [
23] also found that walk on sidewalks with trees/greenery was less relevant. Similar conclusions can be found in the studies of Larranaga et al. [
24] and Moura et al. [
25].
Comfort in terms of temperature, lighting, smell, cleanliness and landscape supplies is also important for pedestrians to play sports. Among the indicators, crucial is the degree of security, intended both as protection from theft or robbery, accidents, weather, stray animals, and in terms of road safety as the number of pedestrian crossings. Furthermore, the presence of other pedestrians along the path does not represent a negative aspect (overcrowding of the path) but is seen as an element of safety. Similarly, the presence of bicycles, which could be a nuisance on the one hand, is rather considered as an increase in the sense of security.
The use of both subjective and objective indicators allows the consideration of some different aspects and the discovery of more interesting findings. By considering the results of the proposed analysis, management strategies could be oriented to make the paths more delightful and serviceable for the users, so that their walking becomes more pleasant and the pedestrian mode is considered an advantageous transport alternative reducing the use of motorized transport modes. From this perspective, we can conclude that our findings can help planners and researchers in developing more walkable cities, characterized by environment more oriented to the pedestrian use, more comfortable, secure and pleasant for pedestrians.
A limitation of the work could regard the sample size, which could be more conveniently increased, also for enriching the database with more recent data that could give interesting results after the years marked by the COVID-19 pandemic.


