

Expansion of Geological CO2 Storage Capacity in a Closed Aquifer by Simultaneous Brine Production with CO2 Injection

SK Earthon Co., Ltd., Seoul 03188, Republic of Korea
Sustainability 2023, 15(4), 3499; https://doi.org/10.3390/su15043499
Submission received: 19 December 2022
/
Revised: 12 January 2023
/
Accepted: 9 February 2023
/
Published: 14 February 2023
(This article belongs to the Topic Carbon Capture Science & Technology (CCST))
Abstract
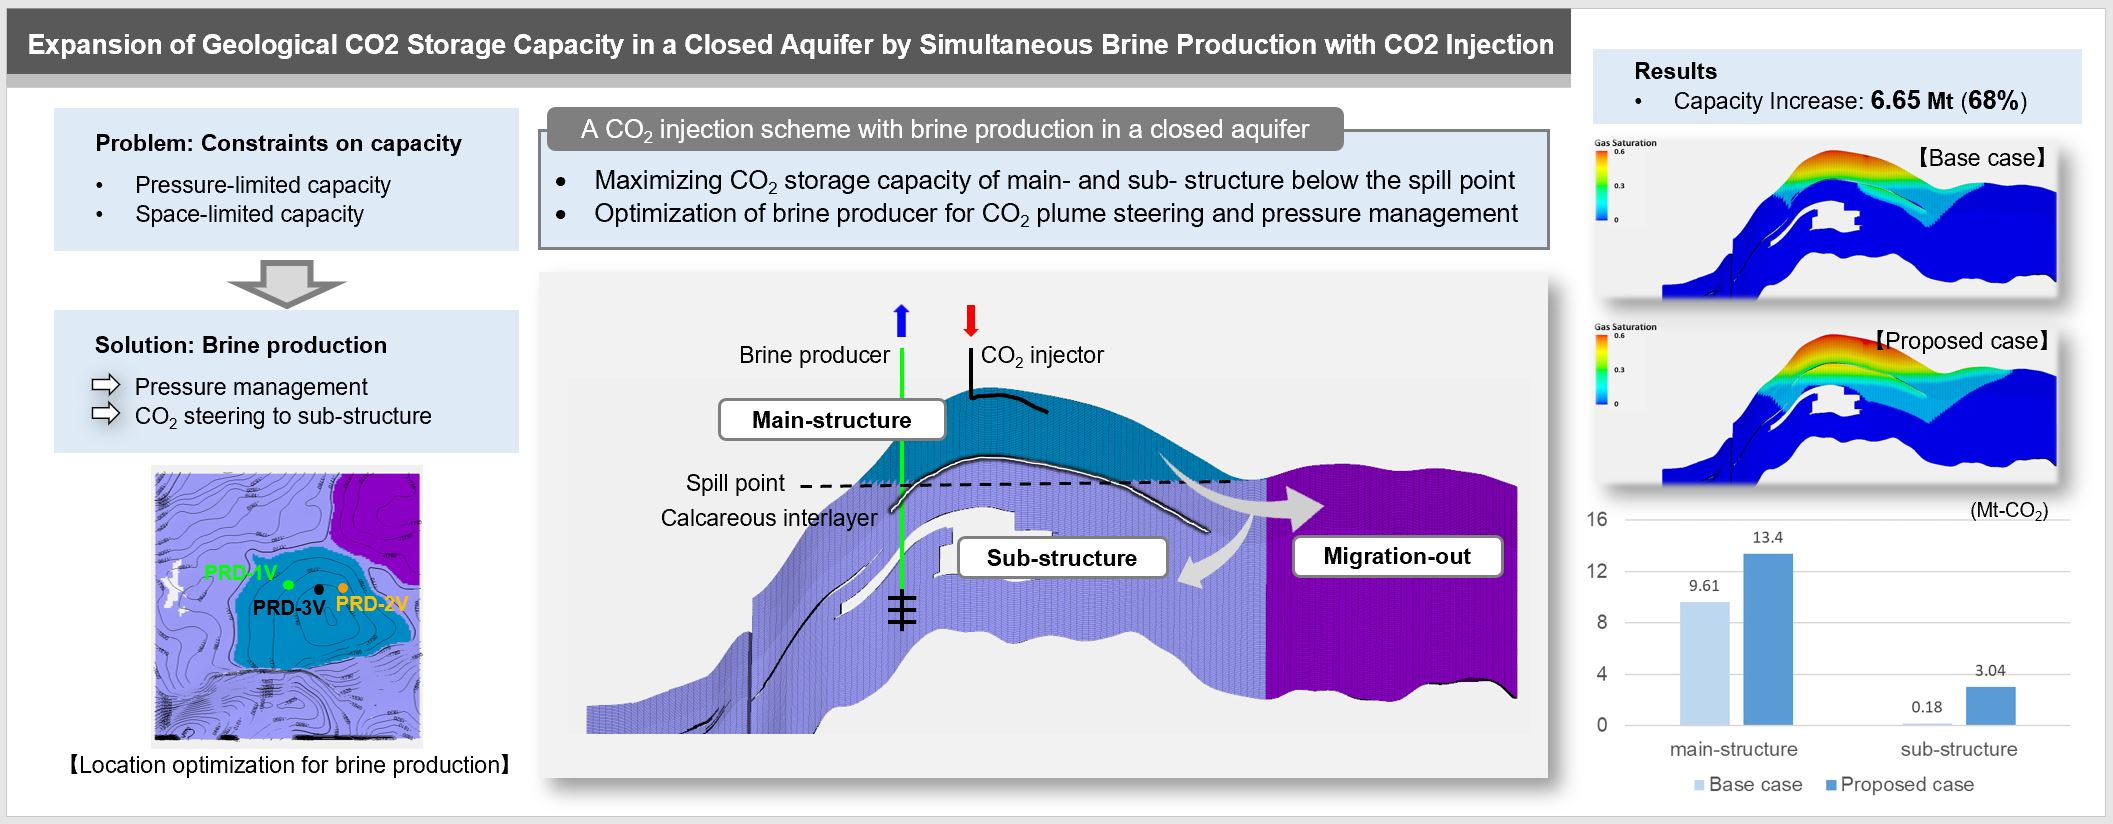
:Structural trapping is the primary mechanism for intensive CO2 sequestration in saline aquifers. This is the foundation for increasing global CO2 storage; gradual switch to preferable trapping mechanisms, such as residual saturation, dissolution, and mineral trapping, will require a long-time scale. The major constraints limiting the storage capacity of structural trapping are formation pressure and structure size. Over-pressure owing to CO2 injection causes a disruption of seal integrity indicating a failure in geological sequestration. The other constraint on storage capacity is a spill point determining geological storage volume. Overflowing CO2, after filling the storage volume, migrates upward along the aquifer geometry with buoyancy. This study proposes a methodology to maximize CO2 storage capacity of a geological site with a substructure created by an interbedded calcareous layer below spill point. This study provides various conceptual schemes, i.e., no brine production, simultaneous brine production and pre-injection brine production, for geological CO2 storage. By the comparative analysis, location of brine producer, production rate, and distance between injector and producer are optimized. Therefore, the proposed scheme can enhance CO2 storage capacity by 68% beyond the pressure and migration limits by steering CO2 plume and managing formation pressure.

1. Introduction
Global climate change caused by rapidly increasing greenhouse gas content in the atmosphere poses a great risk to humans. To mitigate this risk, the Paris Climate Change Accord defines the limit of temperature increase to avoid irreversible changes and encourages each member country to meet its own CO2-reduction targets [1]. For mitigation measures, energy transition from fossil fuels to renewable energy has progressed, but it can only reduce the emission amount of greenhouse gases. Reducing the emission amount alone is not sufficient, and hence, a measure to reduce the overall greenhouse gas content is required. Carbon capture, utilization, and storage (CCUS) is recommended as a key technique that enables the removal of significant amounts of CO2 from a project perspective.
Aquifers are considered prospective sites for geological sequestration of greenhouse gases. Aquifers containing brine can dissolve CO2. Particularly, aquifers can sequester CO2 with high storage efficiency by maintaining the injected CO2 in a liquid or supercritical phase owing to the hydrostatic pressure and geothermal temperature. However, it has a technical problem of salt precipitation [2], which may clog pore throat resulting in decreasing CO2 injectivity, and a limitation on the injection volume. The limitation is that the injection volume should not exceed the fracturing pressure of the formation, particularly in a closed aquifer. Injected fluid can induce fractures in formations [3], micro-seismic events [4], and earthquakes [5]. Additionally, a formation pressure higher than the cap rock capillary entry pressure can break the stability of the CO2 storage system. The fracturing pressure against regional pressurization due to CO2 injection is a key constraint on the CO2 storage capacity.
The size of the geological structure is another constraint on the CO2 storage. The CO2 storage resource management system (SRMS) highlights a high confidence in the commercial storage of geological formations, as supported by confinement [6]. According to the principle of hydrocarbon fill-and-spill, the remaining CO2 after displacing the native formation water of the structure migrates upward beyond the spill point. It may be untraceable during the migration along the aquifer; i.e., whether it reaches the biosphere may not be clear. During migration, it can be trapped by residual saturation, mineralization, dissolution, or other structures. However, it can also leak to the surface. The geological structure is the most reliable confinement for geological storage projects. The structure size is generally regarded as pre-determined, but it can be increased if the geological conditions meet specific requirements. Interbedded impermeable layer below the spill point is a potential opportunity for storage capacity expansion. If the injected CO2 plume is steered to the substructure generated by the cap rock with the interbedded impermeable layer, the storage capacity can be increased without an additional injector.
A traditional strategy is to inject CO2 and let it flow upwards [7]. Once an injector is drilled in the lower part of the aquifer, CO2 tends to migrate upward because of its lower density than that of brine. If the upper seal rock functions effectively, injected CO2 can be trapped in the structure. This concept is applied to depleted oil or gas reservoirs [8], which have a proven sealing structure and reduced formation pressure due to the long period of hydrocarbon production. However, it is challenging to apply this concept to aquifers. The increased aquifer pressure due to the injected CO2 may result in the mechanical instability of the formation. To mitigate this risk, several concepts of pressure management were suggested in earlier studies [9,10,11,12,13].
Here, an injection scheme with an additional substructure below the spill point is investigated for the structural trap in the aquifer. It applies the strategy of pressure management to prevent the formation of fractures and to steer CO2 plumes as long as the brine producer does not produce injected CO2. This study investigates the potential candidate schemes, which are a combination of various types of injectors and producers, from the perspective of quantities of trapped CO2 in the main structure and substructure, and evolution of the CO2 plume.
2. Background
2.1. Storage Capacity
Many CO2 resource management systems were developed for storage estimation, classification, and categorization by various institutes. Most existing storage-resource methodologies approach a volumetric basis [14,15,16,17]. It consists of calculating the geological volume in which CO2 can potentially be stored, and the storage efficiency factor is applied to the calculated volume. The geological storage volume can be calculated numerically using input parameters, despite the inherent uncertainty. The problem is that the storage efficiency factor comprises complicated dynamic factors such as trapping mechanisms, boundary condition, number and type of well, water extraction, and other in situ parameters, which are all related. The volumetric method can only be utilized if sufficient data from regional storage projects are available. Although storage efficiency factors can be revised to reflect pilot tests or actual injection projects, it is technically difficult to evaluate the actual efficiency factor of an individual project. Furthermore, the CCUS industry is still in its initial stage [18,19,20,21], and hence, a database for the efficiency factor was never constructed.
The dynamic approach can consider site-specific dynamic factors [22,23,24]. It simulates the dynamic behavior, which is the result of site operation based on the static model from geological data. The benefits of the dynamic approach are as follows:
- Field specific storage capacity;
- Optimization tool for the development design and operation plan;
- Sensitivity analysis on the uncertainties;
- Fate of CO2 plume over time.
As with all the simulation methods, it still requires a high cost of computation time and resources and qualified input data for accurate results. However, it is preferable to avoid determining an ambiguous storage efficiency factor.
2.2. Injection Strategy and Pressure Management
The traditional injection scheme involves injecting CO2 from the lower injector of the aquifer, then let CO2 upward and trapped by the seal rock [7]. The injected CO2 is driven to rise through the aquifer due to its lower density than that of the aquifer brine. This results in a larger contact area between the CO2 and brine with a longer exposure time. Thus, the injected CO2 plume can be trapped by a stable mechanism such as residual saturation, dissolution, or mineralization. However, the CO2 quantities trapped by these mechanisms are difficult to measure. Additionally, the remaining mobile CO2 not trapped by the above mechanisms may migrate outward from the storage site. The structural trap is a reliable storage site to apply the injection scheme of injecting CO2 from the lower part of the aquifer without migration risk.
However, a structural trap is likely to be a closed system with boundaries by fault, pinch-out, or reservoir heterogeneity. If industrial-scale CO2 is injected into the compartmentalized formation, it may cause a significant pressure build-up in the aquifer, which can trigger micro-seismic rupture, fault reactivation, and seal fracturing. This can limit the storage capacity of the project. Pressure management by brine production was proposed as a mitigation method. The common advantage of pressure management is that it increases the storage capacity by impeding the pressure build-up to the pressure limit. Additionally, it provides a margin between the actual pressure and estimated pressure limit from a conservative perspective. The methodology is categorized in detail as follows:
- Passive extraction;
- Simultaneous brine production;
- Pre-injection brine production.
The principle of passive extraction is to produce brine from the formation equaling the pressure build-up by CO2 injection [12]. It exploits the pressure buildup to generate a pressure drawdown of the producer, which is drilled at a location close to the injector. This prevents overpressure near the producer, although its impact on pressure management is limited. The pressure propagates into the entire formation, and therefore, it is not sufficient to relieve the formation pressure by only limiting the pressure drawdown of the producer. Although passive extraction restricts CO2 breakthrough in the producer, CO2 breakthrough eventually occurs in the long cycle of the injection operation. This is much worse for pressure management.
Simultaneous brine production [9,10,11] is an alternative method to passive extraction. The methodology was verified through the industrial-scale project, Gorgon CCS in Australia [25]. As long as the producer is drilled sufficiently far away from the injector, it can produce more brine in a decisive manner with a lower risk of CO2 breakthrough. However, the brine producer should be drilled in this position for effective pressure propagation for pressure management purposes. However, the efficiency of pressure management has a trade-off with the CO2 breakthrough. The location of the brine producer should be optimized for each project.
Furthermore, the brine production scheme advances pre-injection brine production [13]. This creates the CO2 storage site low-pressured zone which provides the same environment as the depleted gas or oil reservoir for the CO2 storage site. Although it delays the CO2 injection time in the project life cycle, it is an effective method of pressure management with additional benefits. First, it can reduce drilling costs because the injector can be utilized as a producer prior to injection. It also provides operational benefits such as a smaller area of review (AoR) and less post-injection monitoring. Additionally, through prior brine production as an extended pressure drawdown test, pressure drawdown data can be acquired to estimate the injectivity for actual CO2 injection. Injection design using injectivity analysis can mitigate the risks of CO2 injection projects.
In this study, a pressure management scheme for the target storage site is proposed considering the geological and engineering conditions. Several cases representing each injection scheme were applied to the target storage site. By analyzing the pressure behavior and evolution of the CO2 plume, operational conditions, such as the location of the brine producer and brine production method, were optimized to enhance the CO2 storage capacity.
3. Evaluation Method
3.1. Geological Description of the Target Aquifer
The target of this study is a hypothetical aquifer, the geological concept of which is based on actual field data. The aquifer was formed between the ancient delta system facies and the uplift carbonate platform facies. The aquifer formation is dominated by marine delta sediments, although there is also a carbonate platform with a stable lateral distribution. As the transgression continued to a late age, carbonate deposition did not occur. The underwater channel and river mouth bar within the delta front facies mainly developed until the seawater reached the carbonate compensation depth. The shore–marine delta deposition system generated thick layers that were stably developed with good lateral continuity. With this geological background, an interbedded calcareous layer can be deposited and a substructure can develop within the main structure. The aquifer structure, including the substructure considered in this study, is illustrated in Figure 1.
3.2. Storage Resources of This Research
This study focuses on the technical storage volume for comparison among storage scheme candidates regardless of project maturity, commerciality, regulations, and other social conditions. The technical storage volume is calculated using dynamic simulations, which can reflect the geological properties and operational conditions of the potential CO2 sequestration project. To calculate the technical storage volume, the following assumptions on the specific criteria are applied.
3.2.1. Pressure Threshold
A cap rock is the weakest part of geological storage because it is generally more fragile than aquifer formations in terms of lithology [26]. The role of the cap rock is to provide sealing storage so that the injected CO2 cannot migrate out of the geological storage. Thus, the mechanical stability of the cap is an important aspect of CO2 geological storage projects. In this study, the upper part of the aquifer formation immediately below the cap rock was considered as a reference point. The fracturing of the cap rock is assumed to occur when the pressure at the point is higher than the fracturing pressure of the cap rock. The fracturing pressure of the cap rock can be estimated by formation leak-off test, destructive testing of the sampled core, mud loss while drilling, or empirical correlations [27]. For this research, the fracturing pressure with depth was estimated by information from offset wells, the seismic velocity, and the empirical correlation [28], which indicated that the fracturing pressure of the cap rock was 27.6 MPa.
For a more reasonable analysis, a geo-mechanical simulation integrated with flow simulation is required. Although the coupled model using the multiphase flow and the geo-mechanical process has been applied to the CO2 sequestration study [29], several limitations, i.e., instability in low permeability zone and computational bottleneck in industry scaled model were issued [30]. This integrated model cannot guarantee the accuracy of the estimation despite its high computational cost. Considering the estimation uncertainty, 80% of the fracturing pressure of the cap rock was applied as the pressure threshold from a practical perspective. The CO2 injection duration was from the initial injection to the shut-down point as soon as the local pressure of the reference point reached the pressure threshold for fracturing the cap rock.
3.2.2. Sequestration Mechanism
The injected CO2 can be stored in the aquifer through the following four mechanisms:
- Structural and stratigraphic trap;
- Residual saturation trap;
- Dissolution trap;
- Geochemical trap.
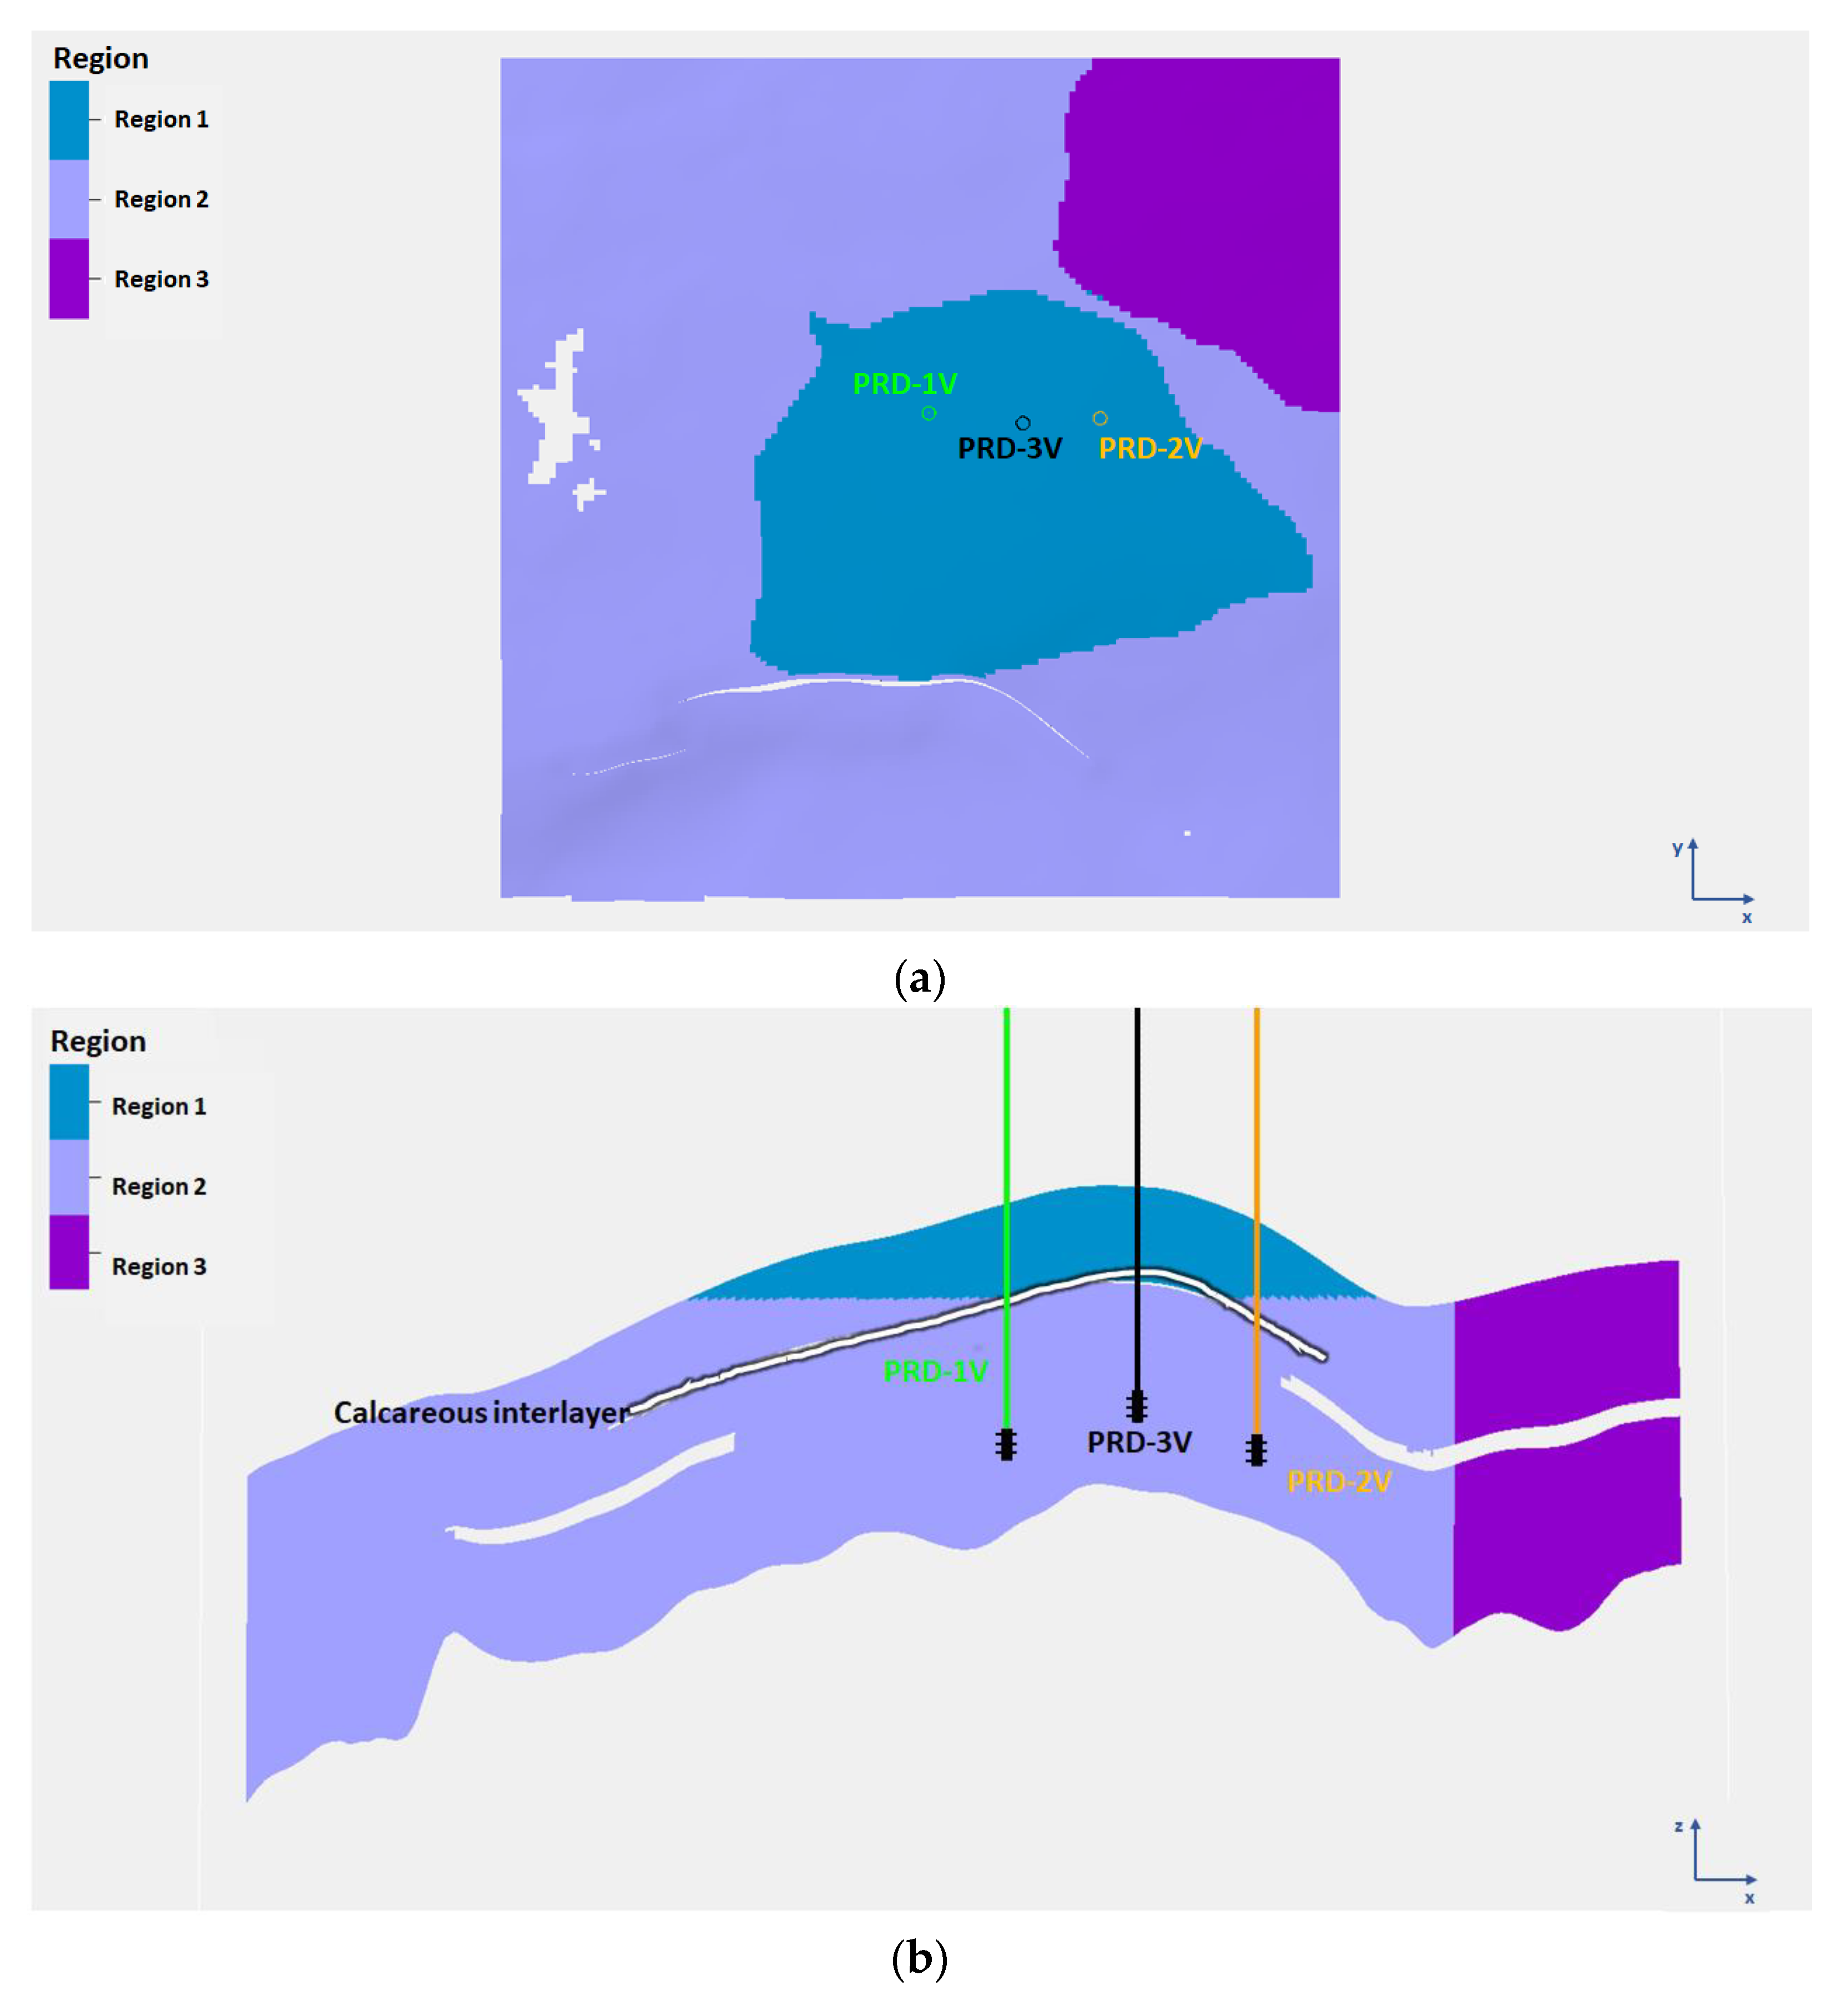
Estimates obtained by numerical simulation have a wide range of uncertainty in CO2 storage capacity, especially for residual traps, solution traps, and mineralization, which are caused by highly uncertain input data for the simulation. These trapping mechanisms categorized into the secondary mechanisms depend on the highly site-specific coefficients and take hundreds of years for the process [20]. The quantity of sequestrated CO2 is related to the actual cash flow enabled by the government or the trade of carbon credit. From a conservative point of view, the CO2 quantity in a structure is certified by the storage capacity of the aquifer. The mobile phase and the residual trapped inside the structure were applied as the criteria of a CO2 storage capacity. For this purpose, the aquifer was categorized into three regions, as shown in Figure 2. Regions 1 and 3 were the main structures above the spill point and beyond the structure diverging outward, respectively. Region 2 was the other region, including the substructure below the main structure.
3.2.3. Timescale
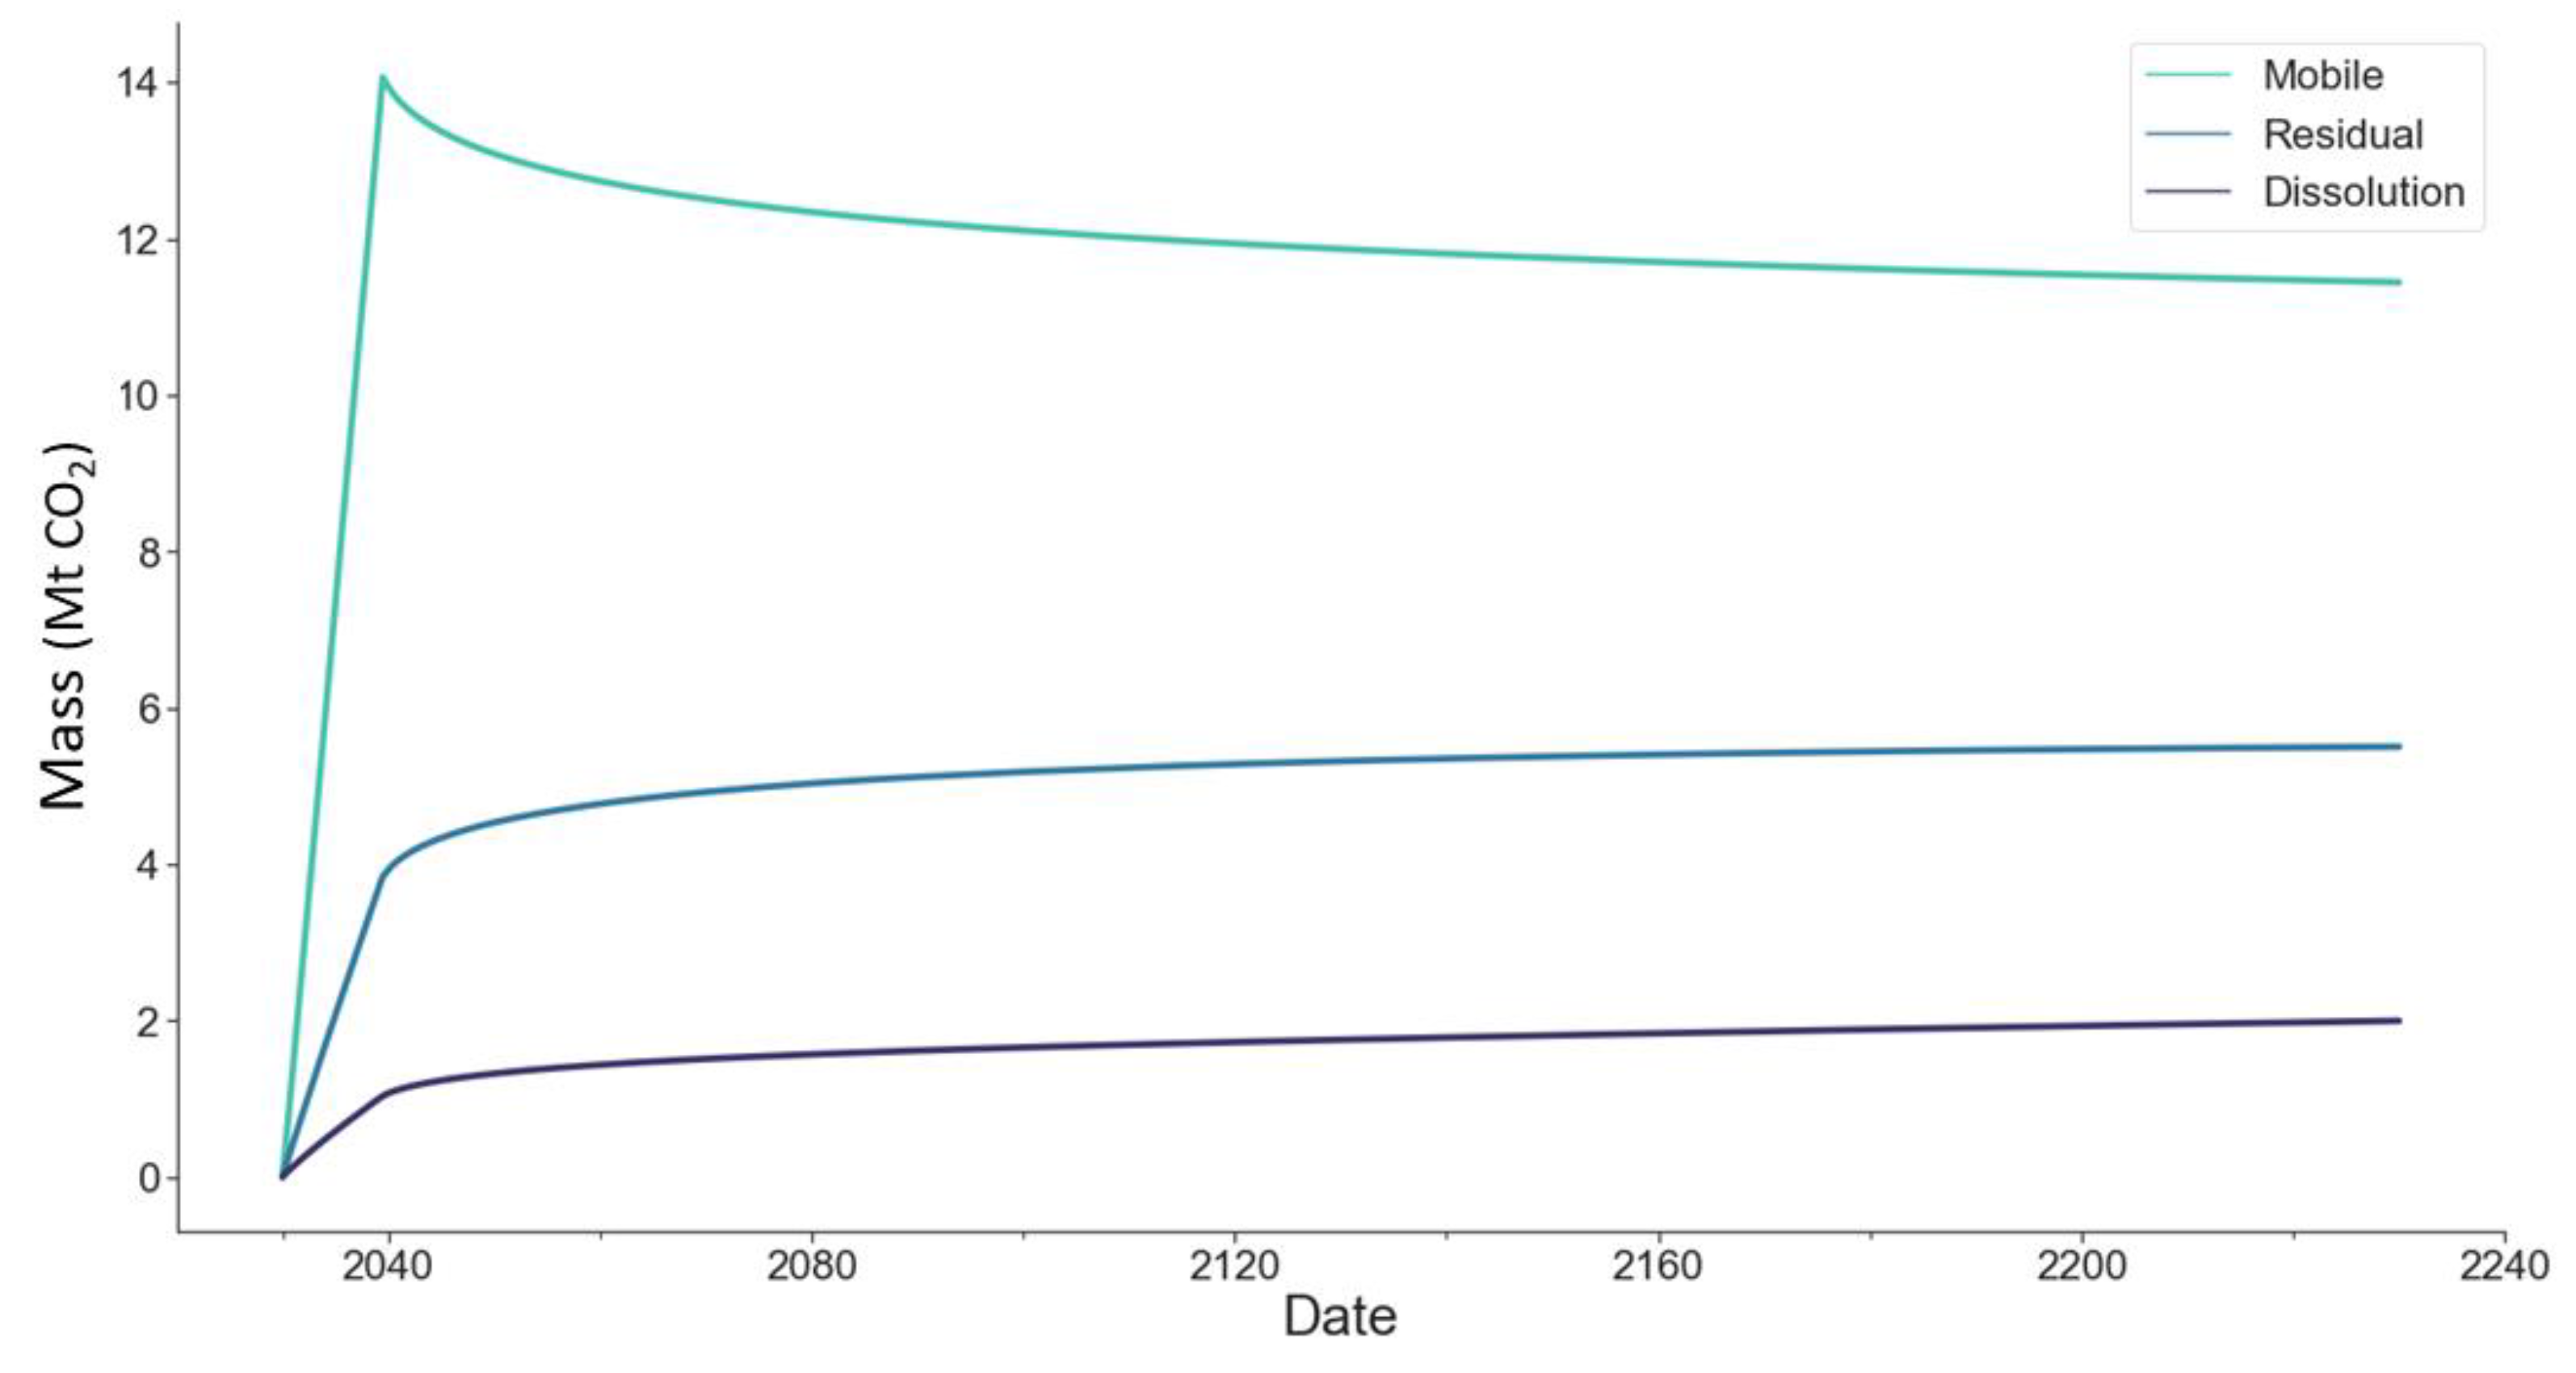
There are two important points in a CO2 sequestration project: the time of injection cessation and the time of immobilization of free-phase CO2 [31]. The former is already described in the pressure-threshold section. The injection was stopped as soon as the local formation pressure reached the threshold pressure defined above. The sequestration type of injected CO2 can be transformed into the above sequestration mechanisms. Generally, while the mobile phase of CO2 migrates, it is trapped in pore volumes up to the critical saturation or dissolves into the aquifer brine. It can also be mineralized by chemical interactions with specific components of the formation rock. It may have transformed for tens of hundreds of years, but the quantity of transformation decreased after a stabilized CO2 plume. Through test simulations for the target site, it was confirmed that the transition rate from the mobile phase gradually decreased and the mobile CO2 plume stabilized approximately 200 years later, as shown in Figure 3. In this research, the storage capacity of CO2 was determined by the quantity in the structures at 200 years later from commencing injection as the time of immobilization of CO2.
Summarily, an accurate quantity of CO2 sequestration on a reasonable time scale established by the project requires an industrial perspective. It is not only the operational information of a company for ESG management, but also financial information directly related to the commercial activity of the company. If the quantity of CO2 sequestration is certified as Certificated Emissions Reduction, then it is traded in the carbon credit market, which can be additional earnings for a company. Therefore, the quantity of sequestrated CO2 should be certified by a strict evaluation method, including monitoring for a sufficiently long period of time. The trapped CO2 in a structure is more convenient for surveillance than trapped by other mechanisms of residual trapping, dissolution, and mineralization outside of a structure. While these mechanisms relying on parameters with high uncertainty have difficulties in tracking for a sufficiently long time, CO2 trapped in a structure can be monitored within a limited region with a more confident method. Hence, the quantity of structural and residual saturation trap in a structure is exploited as the main CO2 storage capacity in this research.
3.3. Model Description
For CO2 sequestration simulation in a saline aquifer, an isothermal compositional model was utilized [32]. The detailed parameters of the simulation are summarized in Table 1. It is a CO2-H2O system in which each component dissolves other components. Sodium chloride, which is the only solid component, determines the salinity of the aquifer. This is a key factor that affects the dissolution of CO2 in the water phase. As the solid phase is not considered in this study, sodium chloride is assumed to remain in the aqueous phase only.
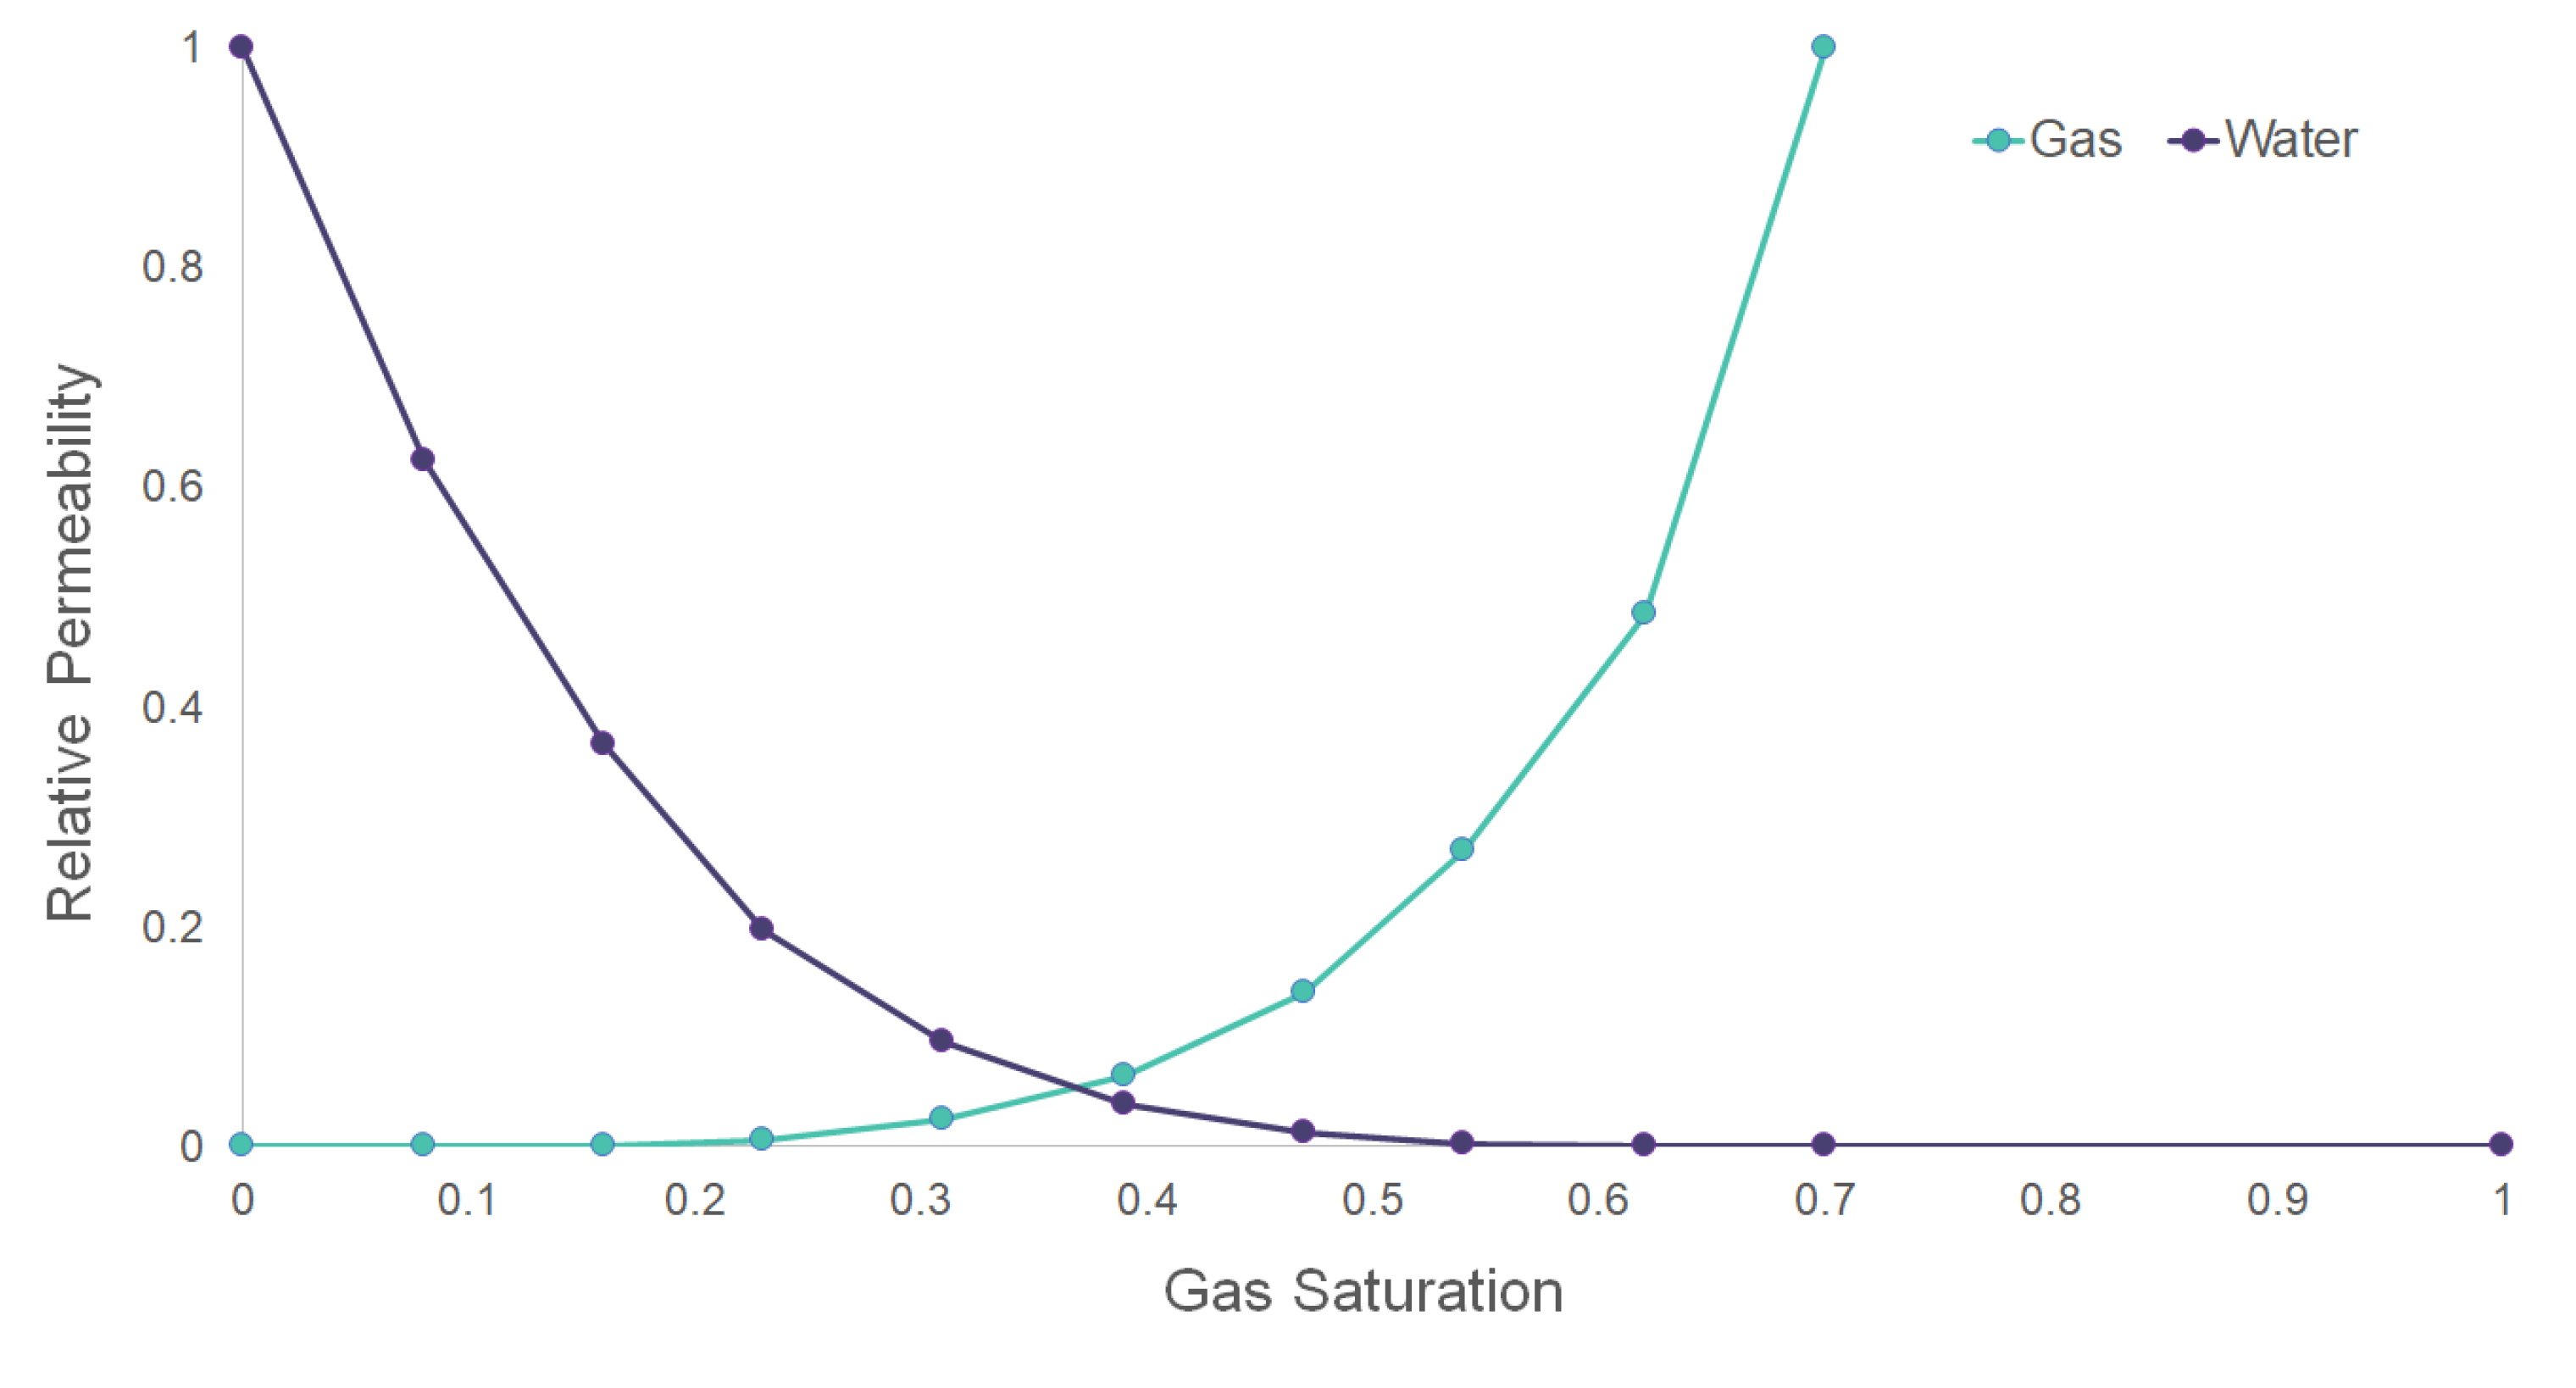
A geological model of the potential sequestration site was constructed using the properties summarized in Table 2. The model has 3,232,584 grid blocks covering a 7.5 km by 7.5 km area and 100 m thickness. The relative permeability of CO2–H2O system [32] applied to a dynamic simulation is shown in Figure 4.
For computational efficiency, the aquifer model can be extended by attaching an analytic aquifer, which is a widely applied concept in reservoir engineering. The model can be constructed by focusing on the area of review where the injected CO2 plume migrates or remains. The outside of the model interacts with the numerical model, communicating the pressure by flowing aquifer brine only. The properties of the analytical aquifer are listed in Table 3. The Carter–Tracy aquifer model [34] was adopted as an analytic model, and the influence function assumed that the radius of the analytic aquifer was twice that of the numerical aquifer.
3.4. CO2 Injection Scenarios
For a comparative analysis of the CO2 capacity, six scenarios in Table 4 were defined in combination with CO2 injection and brine production. The first two cases were designed to investigate the effects of the injector location on CO2 storage. The location of the CO2 injector is illustrated in Figure 5. The location of the lower injector is below the substructure, which can be filled first with CO2. The upper injector is located within the main structure immediately below the cap rock. The following four cases were designed to optimize the injection schemes with brine production. CASE 3 applies pre-injection brine production using a single dual-mode well. Brine production and CO2 injection were performed sequentially in the same well. The last three cases were designed to analyze the effects of the producer location as shown in Figure 6. The schemes involve CO2 simultaneous injection with brine production. CASE 4 has a brine producer in opposite direction of the migration pathway. CASE 5 is a revised case of CASE 4 by moving the location of the brine producer close to the migration pathway. The location of the brine producer in CASE 6 is under the crest of the substructure which is sufficient distance apart from the migration pathway. Additionally, the permeability of the completion intervals of CASE 5 and 6 was much higher than that of CASE 4.
The injection condition was to inject CO2 at a constant rate of 2 Mt/year. When the reference pressure reaches the fracture pressure, CO2 injection ceases by shut-in. The production condition is a constant rate of production with a lower limit of bottom-hole pressure. The producer was set to produce water at 5000 m3/day to maintain a bottom-hole pressure higher than 5 MPa. For the cases of simultaneous brine production, brine production stops just before CO2 reaches the brine producers.
4. Results and Discussion
The pressure management strategy was optimized by comparing cases with various combinations of injectors and producers to meet the following requirements. The formation pressure does not exceed the threshold pressure for the fracturing pressure of the cap rock. The injected CO2 was not produced by brine production. The injected CO2 can be trapped in the structure as much as possible, particularly in the substructure, by steering the CO2 plume.
Table 5 summarizes the injection time, total injection mass, and CO2 capacity, and shows the pressure constraints and effects of pressure management. The lower injector of CASE 1 has a limited effect on the pressure constraint because the injector is located far away from the reference point for the formation fracture, as shown in Figure 5. Additionally, it takes a long time to propagate the pressure buildup from the aquifer bottom due to the calcareous barrier ceiling of the substructure. Additional CO2 can be injected during the extended time over CASE 2 until the formation pressure reaches the threshold pressure of formation fracture. However, it is the highest limit because the scheme has an obstacle for brine production due to the CO2 production associated with brine production. The migration direction due to buoyancy is the main reason for not locating the brine producer, even in the upper part of the aquifer. More injection volume without brine production causes the over-pressure around the weak formation, which can be a potential risk on the structure stability.
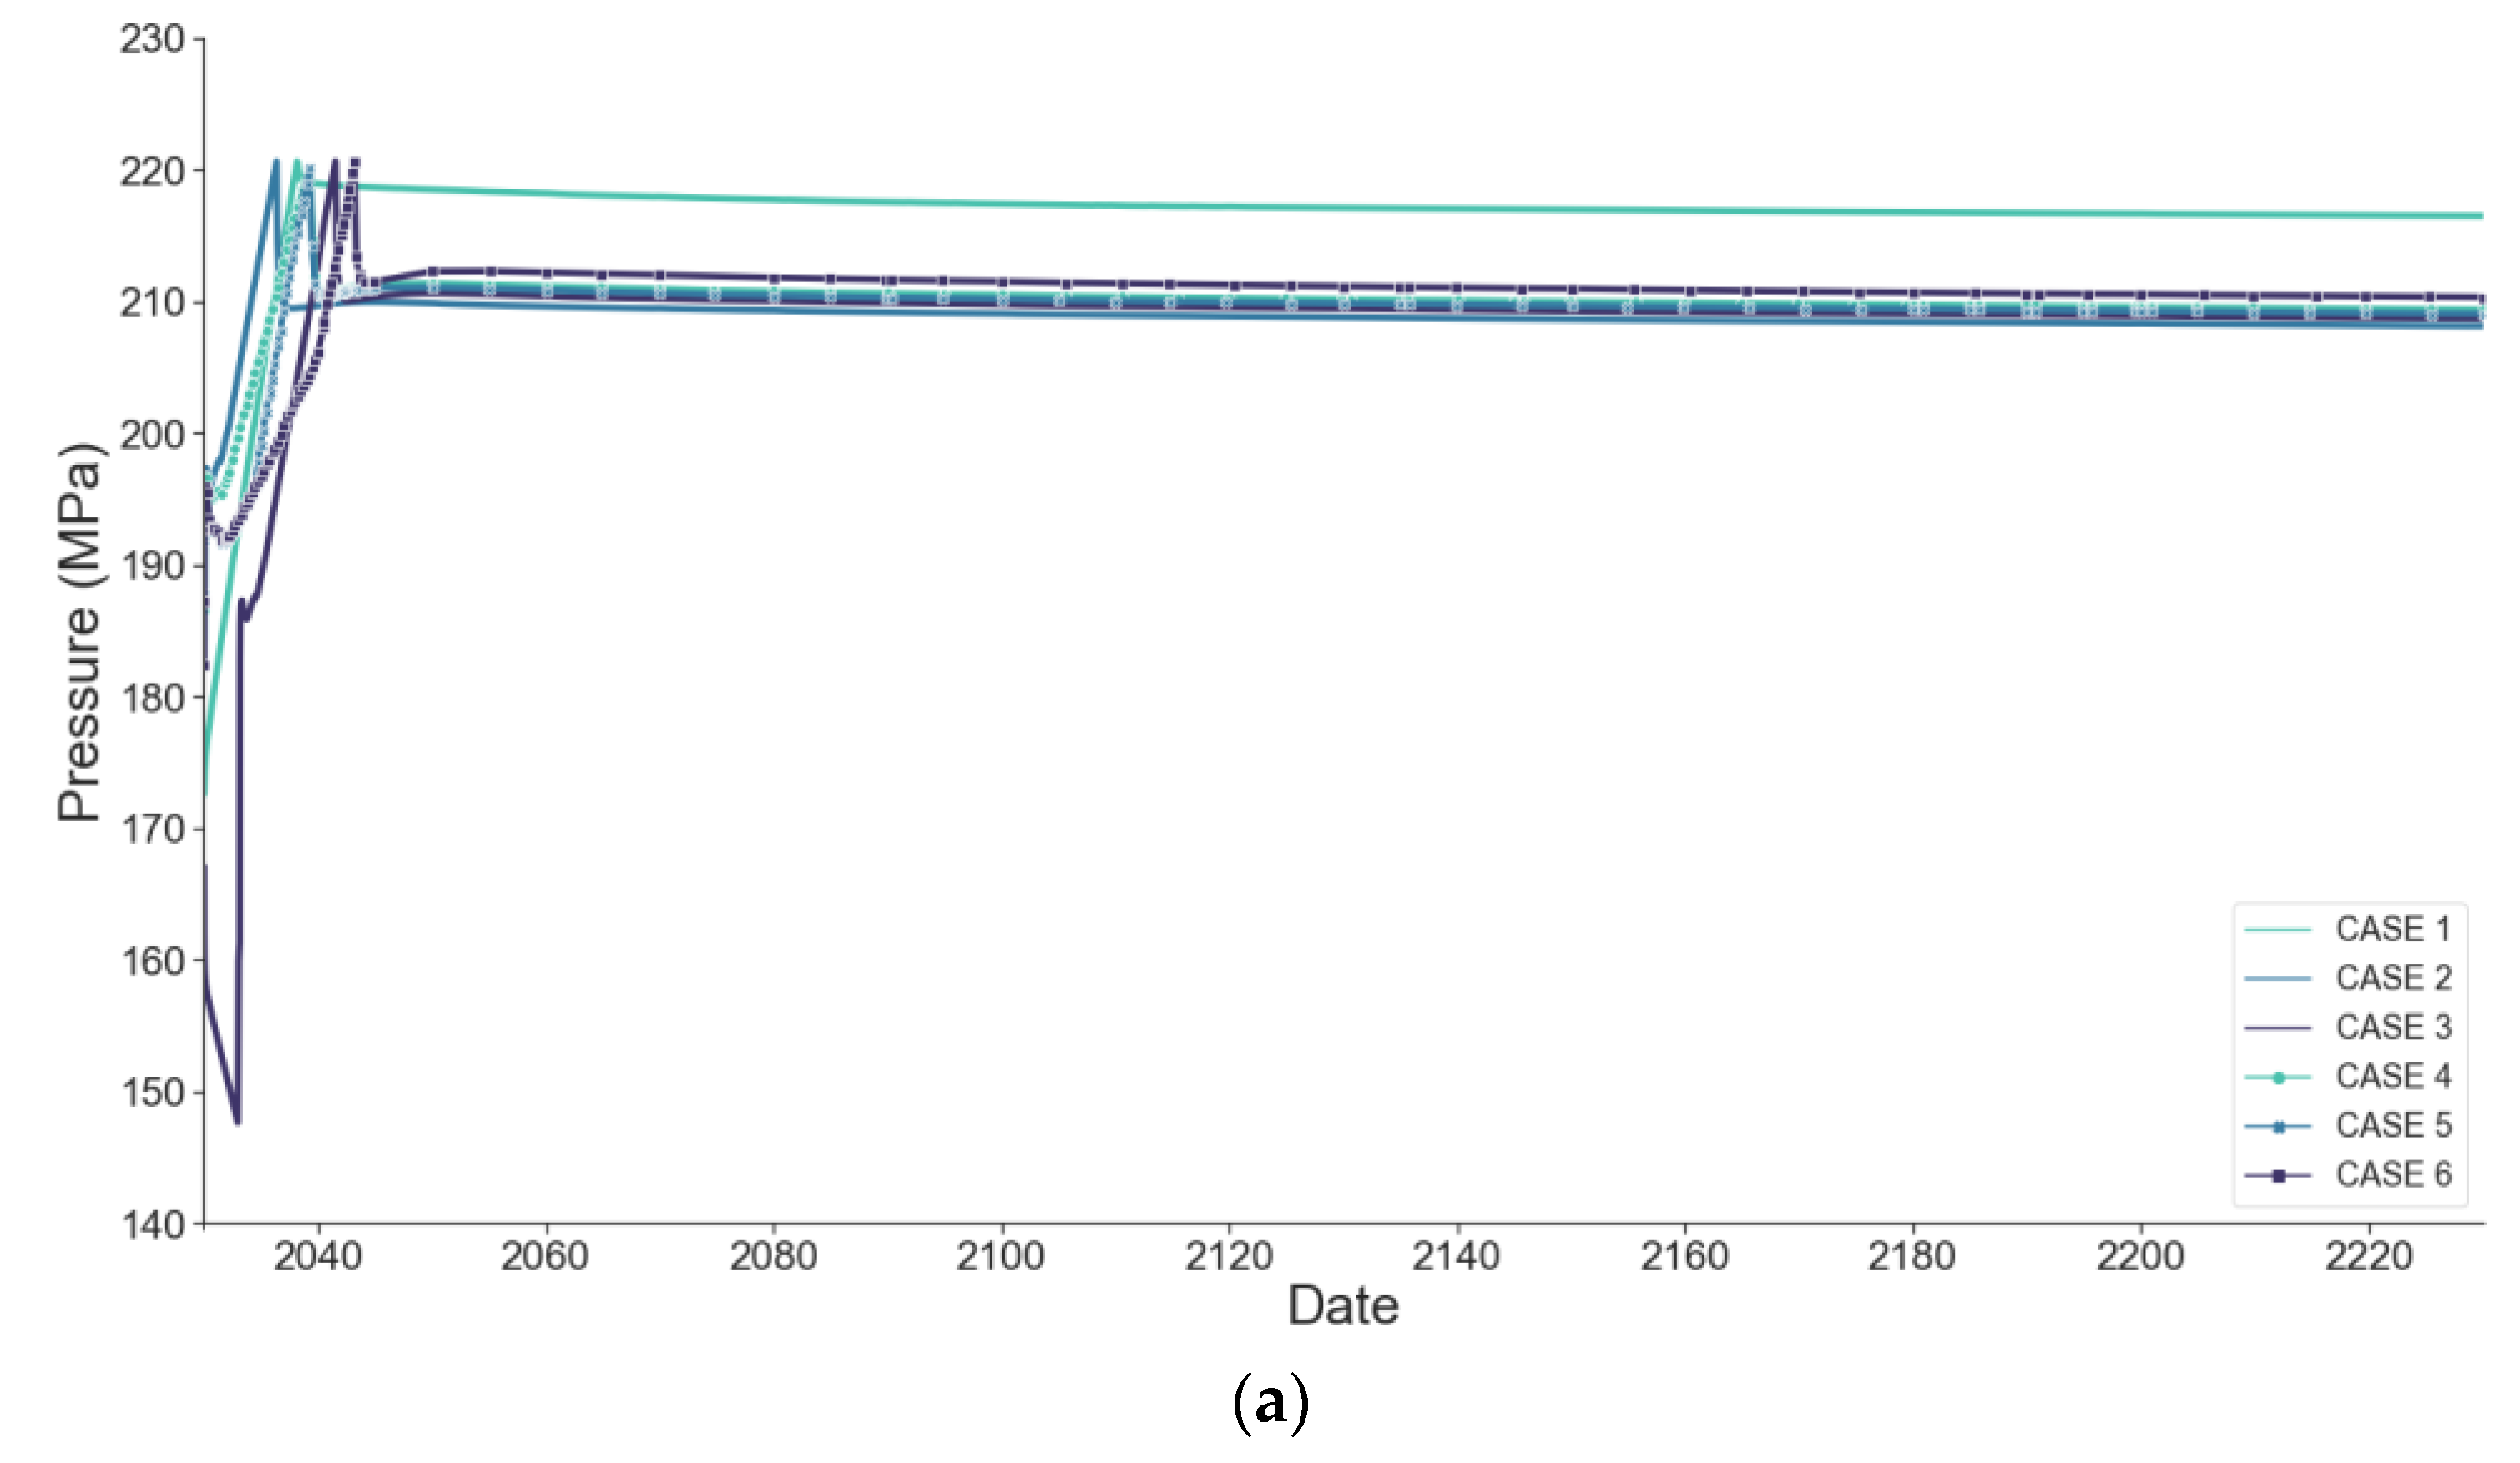
Pressure management has a significant effect on the CO2 injection mass summarized in Table 5. It enables at most 6.8 years of additional injection time compared to the cases without brine production. From the formation pressure behaviors shown in Figure 7, the formation pressure of CASE 3, pre-injection brine production, was reduced linearly below the initial formation pressure before ceasing brine production. Then, the formation pressure increased discretely for 3 months, i.e., a shut-in period of 3 months to convert the brine producer into a CO2 injector. Once CO2 was injected into the aquifer, the formation pressure increased rapidly until it reached the pressure threshold of the fracturing pressure of the cap rock. The simultaneous brine production case of CASE 4 exhibits a trend of formation pressure increase with a gradual slope. The target production rate is set to 5000 m3/d, but it cannot meet the target due to the lower limit of bottomhole pressure, as shown in Figure 8. The simultaneous injection with higher rate production in CASE 5 has a dual slope, and its intersection is the point at which brine production stops due to CO2 breakthrough. Despite the relatively short period of brine production (4.4 years) indicated in Figure 8, a low formation pressure can be maintained due to the higher production rate. Well completion in the interval with higher permeability enables the brine production as much as CASE 4 in a shorter period. CASE 6 shows the longest CO2 injection time owing to the higher production rate and delayed CO2 breakthrough. It drives CO2 injection for 13.2 years, which is longer than that of any other pressure management case.
The injected CO2 masses categorized by sequestration mechanism and region are summarized in Table 6. The combination of sequestration mechanisms and sequestrated regions can provide a basis for prioritizing the sequestration concept. The sequestration mass by structural traps and residual saturation traps in the main- and the sub-structure was determined as the CO2 capacity, as discussed in Section 3.2. The mass beyond the spill point cannot be certified as a proven storage even if it is trapped by saturation residual or dissolution in the simulation results. Although the sequestrated mass by residual and dissolution is known to be stable, the actual quantity is highly uncertain depending on the parameters or coefficients.
The effects of the injector location were analyzed in two cases, as described in Section 3.3. Only CASE 1 had an injector below the substructure. It fills the substructure first, and then the injected CO2 migrates to the main structure. Because of the buoyancy of CO2, its dominant migration direction is vertical. This resulted in a negligibly small mass of migration beyond the spill. While vertically migrating long distances from the aquifer bottom to the top, it sequestrates the large amount of residual trapped CO2. CASE 1, which sequestrates the most mass in the substructure, contains CO2 in the main structure as well, as shown in Figure 9a. However, the amount in the main structure is relatively small compared to the whole size of the main structure, and hence, CASE 1 cannot be an efficient sequestration concept. Contrarily, CASE 2 cannot fill the substructure as shown in Figure 9b. The calcareous layer, which is a cap rock of the substructure, acts as a bottom barrier, and buoyancy causes the CO2 plume to migrate out of the structure.
For the pre-injection brine production in CASE 3, a single well was drilled and utilized as a brine producer and a CO2 injector sequentially. It is less effective from a pressure management perspective compared to that of CASE 4, 5, or 6 because of the rapid build-up of formation pressure. When shut-in for well conversion, the formation pressure of the reference location recovers immediately. Once the CO2 injection commences, the recovered formation pressure, which is still below the initial pressure, starts to build up rapidly and finally reaches the pressure threshold of the fracturing pressure, as shown in Figure 7b. As CO2 is injected into the under-pressured zone by brine production, the scheme displaces the zone with CO2 rather than overflowing beyond the spill, as shown in Figure 9c. Although it has the disadvantages of project delay and less efficiency, it can be selected for reasons of less CAPEX (capital expenditure) and confident operation based on the test analysis through prior drawdown.
CASE 4 implements pressure management by simultaneous brine production using an additional well. The results show that this is a measure to extend the sequestration capacity by overcoming pressure constraints. It enables an additional 3.1 years of CO2 injection compared to that of the control case (CASE 2). The additional injection mass was almost 6.1 Mt, although the migration mass beyond the spill increased proportionally to the total injection mass. It still cannot make better use of the substructure for sequestration site considering only 0.98 Mt sequestration mass in the substructure. The brine producer was drilled below the substructure, away from the CO2 injector, and perforated in the interval with poor permeability. The effects of pressure management were not directly propagated to the reference point of the cap rock. Additionally, the producer is located in the opposite direction to the migration pathway; therefore, there is no drive for the CO2 plume to dig beneath the cap rock of the substructure. The CO2 plume from the main structure developed to be distributed both in the substructure and beyond the spill, as shown in Figure 9d.
CASE 5 has a producer inside the substructure along the migration pathway. The formation pressure was reduced around the brine producer, which drove the CO2 plume to migrate beneath the top of the substructure. If the brine producer is close to the migration pathway, the steering effects to the substructure can be enhanced, rather than migrating beyond the spill as illustrated in Figure 10. However, early CO2 breakthrough eventually leads to cessation of CO2 injection. It acts as another constraint of the CO2 storage capacity judging from less CO2 capacity than that of CASE 4.
The trade-off between CO2 steering and pressure management is confirmed through CASE 4 and CASE 5. The key optimization point for maximizing storage capacity is the producer location. Thus, the location of the producer in CASE 6 is moved to the center of the substructure away from the migration pathway. The requirement of the brine producer is to make under-pressured zone near the migration pathway, but sufficient distance away from the migration pathway to delay CO2 breakthrough. Through the application of this scheme, the substructure accounted for 18% of the total storage capacity. The contribution of the substructure secures an additional 2.1 Mt of CO2 storage capacity compared to that of CASE 4. The distribution of sequestrated CO2 plume in the substructure is shown in Figure 9f. The residual trap is depicted in light green color according to the footprint of the CO2 plume movement. The remaining mobile CO2 after being trapped by residual saturation is distributed in the top of the substructure with a high concentration of CO2.
5. Conclusions
Several injection strategies were investigated to overcome the constraints of formation fracture pressure and structure size, which are major constraints that limit the storage capacity in a closed aquifer. The lower injection scheme below substructure showed a good performance only among the cases without pressure management. However, it has no upside potential for the injection period extension because of the systematic limits of CO2 production associated with brine production. The pressure management with brine extraction was verified as an effective technology from a pressure constraint perspective. It enabled the additional CO2 injection range from 31% to 106% compared to the cases without pressure management. Focusing on the CO2 storage capacity, sequestration mass was increased by 6.65 Mt, which is an improvement by 68%. The brine extraction scheme was optimized to maximize the storage capacity by overcoming the constraint of the structure size in the target site, which is part of a closed aquifer with a substructure inside the main structure. Through the optimization, the location of the brine producer was concluded a key parameter for steering the injected CO2 plume toward the inside of the substructure. For a brine producer, a sufficient distance from the migration pathway and perforation in the high permeability interval have a significant impact on the direction of CO2 plume movement and evolution.
Conclusively, a CO2 sequestration strategy to overcome the constraints limiting the CO2 storage capacity is suggested. Brine extraction extends the CO2 injection period and evolves the injected CO2 plume inside the substructure. Through verification of the applicability of brine production, the proposed CO2 injection scheme can provide key insight into the optimization of a target aquifer considering its geological characteristics. Moreover, the methodology of this study is expected as a practical tool for tacking injected CO2 plume when combined with the post-injection monitoring data.
Funding
The author received financial support for this article from SK earthon Co., Ltd. (http://www.skearthon.com/).
Institutional Review Board Statement
Not applicable.
Informed Consent Statement
Not applicable.
Data Availability Statement
Not applicable.
Acknowledgments
This publication has been produced with support and permission from the China business division, SK earthon. The author acknowledges the VP of the China Business division, Dooyun Park. The review comments on the geological description of the target aquifer from Sr. Geologist, Peter Bahn, are much appreciated. The author would like to thank to Rev. Fr. Daniel M. Kim who motivated the author for this study.
Conflicts of Interest
The author declares no conflict of interest.
References
- UNFCCC. Paris Agreement. In Proceedings of the Conference of the Parties COP 21, Paris, France, 30 November–12 December 2015. [Google Scholar]
- Cui, G.; Hu, Z.; Ning, F.; Jiang, S.; Wang, R. A Review of Salt Precipitation during CO2 Injection into Saline Aquifers and Its Potential Impact on Carbon Sequestration Projects in China. Fuel 2023, 334, 126615. [Google Scholar] [CrossRef]
- Espinoza, D.N.; Santamarina, J.C. CO2 breakthrough—Caprock Sealing Efficiency and Integrity for Carbon Geological Storage. Int. J. Greenh. Gas Control 2017, 66, 218–229. [Google Scholar] [CrossRef]
- Goertz-Allmann, B.P.; Kühn, D.; Oye, V.; Bohloli, B.; Aker, E. Combining Microseismic and Geomechanical Observations to Interpret Storage Integrity at the In Salah CCS Site. Geophys. J. Int. 2014, 198, 447–461. [Google Scholar] [CrossRef]
- Ellsworth, W.L.; Giardini, D.; Townend, J.; Ge, S.; Shimamoto, T. Triggering of the Pohang, Korea, Earthquake (M w 5.5) by Enhanced Geothermal System Stimulation. Seismol. Res. Lett. 2019, 90, 1844–1858. [Google Scholar] [CrossRef]
- Frailey, S.; Koperna, G.; Tucker, O. The CO2 Storage Resources Management System (SRMS): Toward a Common Approach to Classifying, Categorizing, and Quantifying Storage Resources. In Proceedings of the 14th Greenhouse Gas Control Technologies Conference, Melbourne, Australia, 21–26 October 2018. [Google Scholar]
- Kumar, A.; Ozah, R.; Noh, M.; Pope, G.A.; Bryant, S.; Sepehrnoori, K.; Lake, L.W. Reservoir Simulation of CO2 Storage in Deep Saline Aquifers. SPE J. 2005, 10, 336–348. [Google Scholar] [CrossRef]
- Bouquet, S.; Gendrin, A.; Labregere, D.; Le Nir, I.; Dance, T.; Xu, J.; Cinar, Y. CO2CRC Otway Project, Australia: Parameters Influencing Dynamic Modeling of CO2 Injection into a Depleted Gas Reservoir. In Proceedings of the SPE Offshore Europe Oil and Gas Conference and Exhibition, Aberdeen, UK, 8–11 September 2009. [Google Scholar]
- Bergmo, P.E.S.; Grimstad, A.-A.; Lindeberg, E. Simultaneous CO2 Injection and Water Production to Optimise Aquifer Storage Capacity. Int. J. Greenh. Gas Control 2011, 5, 555–564. [Google Scholar] [CrossRef]
- Buscheck, C.A.; Sun, Y.; Chen, M.; Hao, Y.; Wolery, T.J.; Bourcier, W.L.; Court, B.; Celia, M.A.; Friedmann, S.J.; Aines, R.D. Active CO2 Reservoir Management for Carbon Storage: Analysis of Operational Strategies to Relieve Pressure Buildup and Improve Injectivity. Int. J. Greenh. Gas Control 2012, 6, 230–245. [Google Scholar] [CrossRef]
- Court, B.; Bandilla, K.W.; Celia, M.A.; Buscheck, T.A.; Nordbotten, J.M.; Dobossy, M.; Janzen, A. Initial Evaluation of Advantageous Synergies Associated with Simultaneous Brine Production and CO2 Geological Sequestration. Int. J. Greenh. Gas Control 2012, 8, 90–100. [Google Scholar] [CrossRef]
- Dempsey, D.; Kelkar, S.; Pawar, R. Passive Injection: A Strategy for Mitigating Reservoir Pressurization, Induced Seismicity and Brine Migration in Geologic CO2 Storage. Int. J. Greenh. Gas Control 2014, 28, 96–113. [Google Scholar] [CrossRef]
- Buscheck, T.A.; Bielicki, J.M.; White, J.A.; Sun, Y.; Hao, Y.; Bourcier, W.L.; Carroll, S.A.; Aines, R.D. Managing Geologic CO2 Storage with Pre-injection Brine Production in Tandem Reservoirs. Energy Procedia 2017, 114, 4757–4764. [Google Scholar] [CrossRef]
- Bachu, S.; Bonijoly, D.; Bradshaw, J.; Burress, R.; Christensen, N.; Holloway, S.; Mathiassen, O. Estimation of CO2 Storage Capacity in Geological Media; Carbon Sequestration Leadership Forum (CSLF): Washington, DC, USA, 2007. [Google Scholar]
- National Energy Technology Laboratory. Carbon Sequestration Atlas of the United States and Canada; US Department of Energy: Washington, DC, USA, 2008. [Google Scholar]
- Gorecki, C.; Sorensen, J.; Bremer, J.; Ayash, S.; Knudsen, D.; Holubnyak, Y.; Smith, S.; Steadman, E.; Harju, J. Development of Storage Coefficients for CO2 Storage in Deep Saline Formations; IEA Greenhouse Gas R&D Programme (IEA GHG): Cheltenham, UK, 2009. [Google Scholar]
- Brennan, S.T.; Merrill, M.D.; Buursink, M.L.; Warwick, P.D.; Cahan, S.M.; Cook, T.A.; Corum, M.D.; Craddock, W.H.; DeVera, C.A. National Assessment of Geologic Carbon Dioxide Storage Resources: Methodology Implementation; Blondes, M.S., Ed.; US Department of the Interior, US Geological Survey: Washington, DC, USA, 2013. [Google Scholar]
- Michael, K.; Golab, A.; Shulakova, V.; Ennis-King, J.; Allinson, G.; Sharma, S.; Aiken, T. Geological Storage of CO2 in Saline Aquifers—A Review of the Experience from Existing Storage Operations. Int. J. Greenh. Gas Control 2010, 4, 659–667. [Google Scholar] [CrossRef]
- Hosa, A.; Esentia, M.; Stewart, J.; Haszeldine, S. Injection of CO2 into Saline Formations: Benchmarking Worldwide Projects. Chem. Eng. Res. and Design 2011, 89, 1855–1864. [Google Scholar] [CrossRef]
- Kelemen, P.; Benson, S.M.; Pilorgé, H.; Psarras, P.; Wilcox, J. An Overview of the Status and Challenges of CO2 Storage in Minerals and Geological Formations. Front. Clim. 2019, 1, 9. [Google Scholar] [CrossRef]
- Global CCS Institute. The Global Status of CCS: 2021; Global CCS Institute: Melbourne, Australia, 2021. [Google Scholar]
- Le Guenan, T.; Rohmer, J. Corrective Measures Based on Pressure Control Strategies for CO2 Geological Storage in Deep Aquifers. Int. J. Greenh. Gas Control 2011, 5, 571–578. [Google Scholar] [CrossRef]
- Cameron, D.A.; Durlofsky, L.J. Optimization of Well Placement, CO2 Injection Rates, and Brine Cycling for Geological Carbon Sequestration. Int. J. Greenh. Gas Control 2012, 10, 100–112. [Google Scholar] [CrossRef]
- Gorecki, C.D.; Ayash, S.C.; Liu, G.; Braunberger, J.R.; Dotzenrod, N.W. A Comparison of Volumetric and Dynamic CO2 Storage Resource and Efficiency in Deep Saline Formations. Int. J. Greenh. Gas Control 2015, 42, 213–225. [Google Scholar] [CrossRef]
- Trupp, M.; Ryan, S.; Mendoza, I.B.; Leon, D.; Scoby-Smith, L. Developing the World’s Largest CO2 Injection System—A History of the Gorgon Carbon Dioxide Injection System. In Proceedings of the 15th Greenhouse Gas Control Technologies Conference, Abu Dhabi, United Arab Emirates, 16 March 2021. [Google Scholar]
- Song, J.; Zhang, D. Comprehensive Review of Caprock-sealing Mechanisms for Geologic Carbon Sequestration. Environ. Sci. Technol. 2013, 47, 9–22. [Google Scholar] [CrossRef] [PubMed]
- Zhang, J.; Yin, S.-X. Fracture Gradient Prediction: An Overview and an Improved Method. Pet. Sci. 2017, 14, 720–730. [Google Scholar] [CrossRef]
- Matthews, W.R.; Kelly, J. How To Predict Formation Pressure and Fracture Gradient. Oil Gas J. 1967, 60, 92–98. [Google Scholar]
- Masoudi, R.; Abd Jalil, M.A.; Tan, C.P.; Press, D.; Keller, J.; Anis, L.; Darman, N.; Othman, M. Simulation of Chemical Interaction of Injected CO2 and Carbonic Acid Based on Laboratory Tests in 3D Coupled Geomechanical Modelling. In Proceedings of the International Petroleum Technology Conference, Beijing, China, 26 March 2013. [Google Scholar]
- Gai, X.; Dean, R.H.; Wheeler, M.F.; Liu, R. Coupled Geomechanical and Reservoir Modeling on Parallel Computers. In Proceedings of the SPE Reservoir Simulation Symposium, Houston, TX, USA, 3 February 2003. [Google Scholar]
- Bachu, S. Review of CO2 Storage Efficiency in Deep Saline Aquifers. Int. J. Greenh. Gas Control 2015, 40, 188–202. [Google Scholar] [CrossRef]
- Schlumberger Information Solutions. Eclipse Technical Description; Schlumberger: Houston, TX, USA, 2018. [Google Scholar]
- Spycher, N.; Pruess, K. A Phase-partitioning Model for CO2-brine Mixtures at Elevated Temperature and Pressures. Transp. Porous Media 2009, 82, 173–196. [Google Scholar] [CrossRef] [Green Version]
- Carter, R.; Tracy, G. An Improved Method for Calculating Water Influx. Trans. AIME 1960, 219, 415–417. [Google Scholar] [CrossRef]
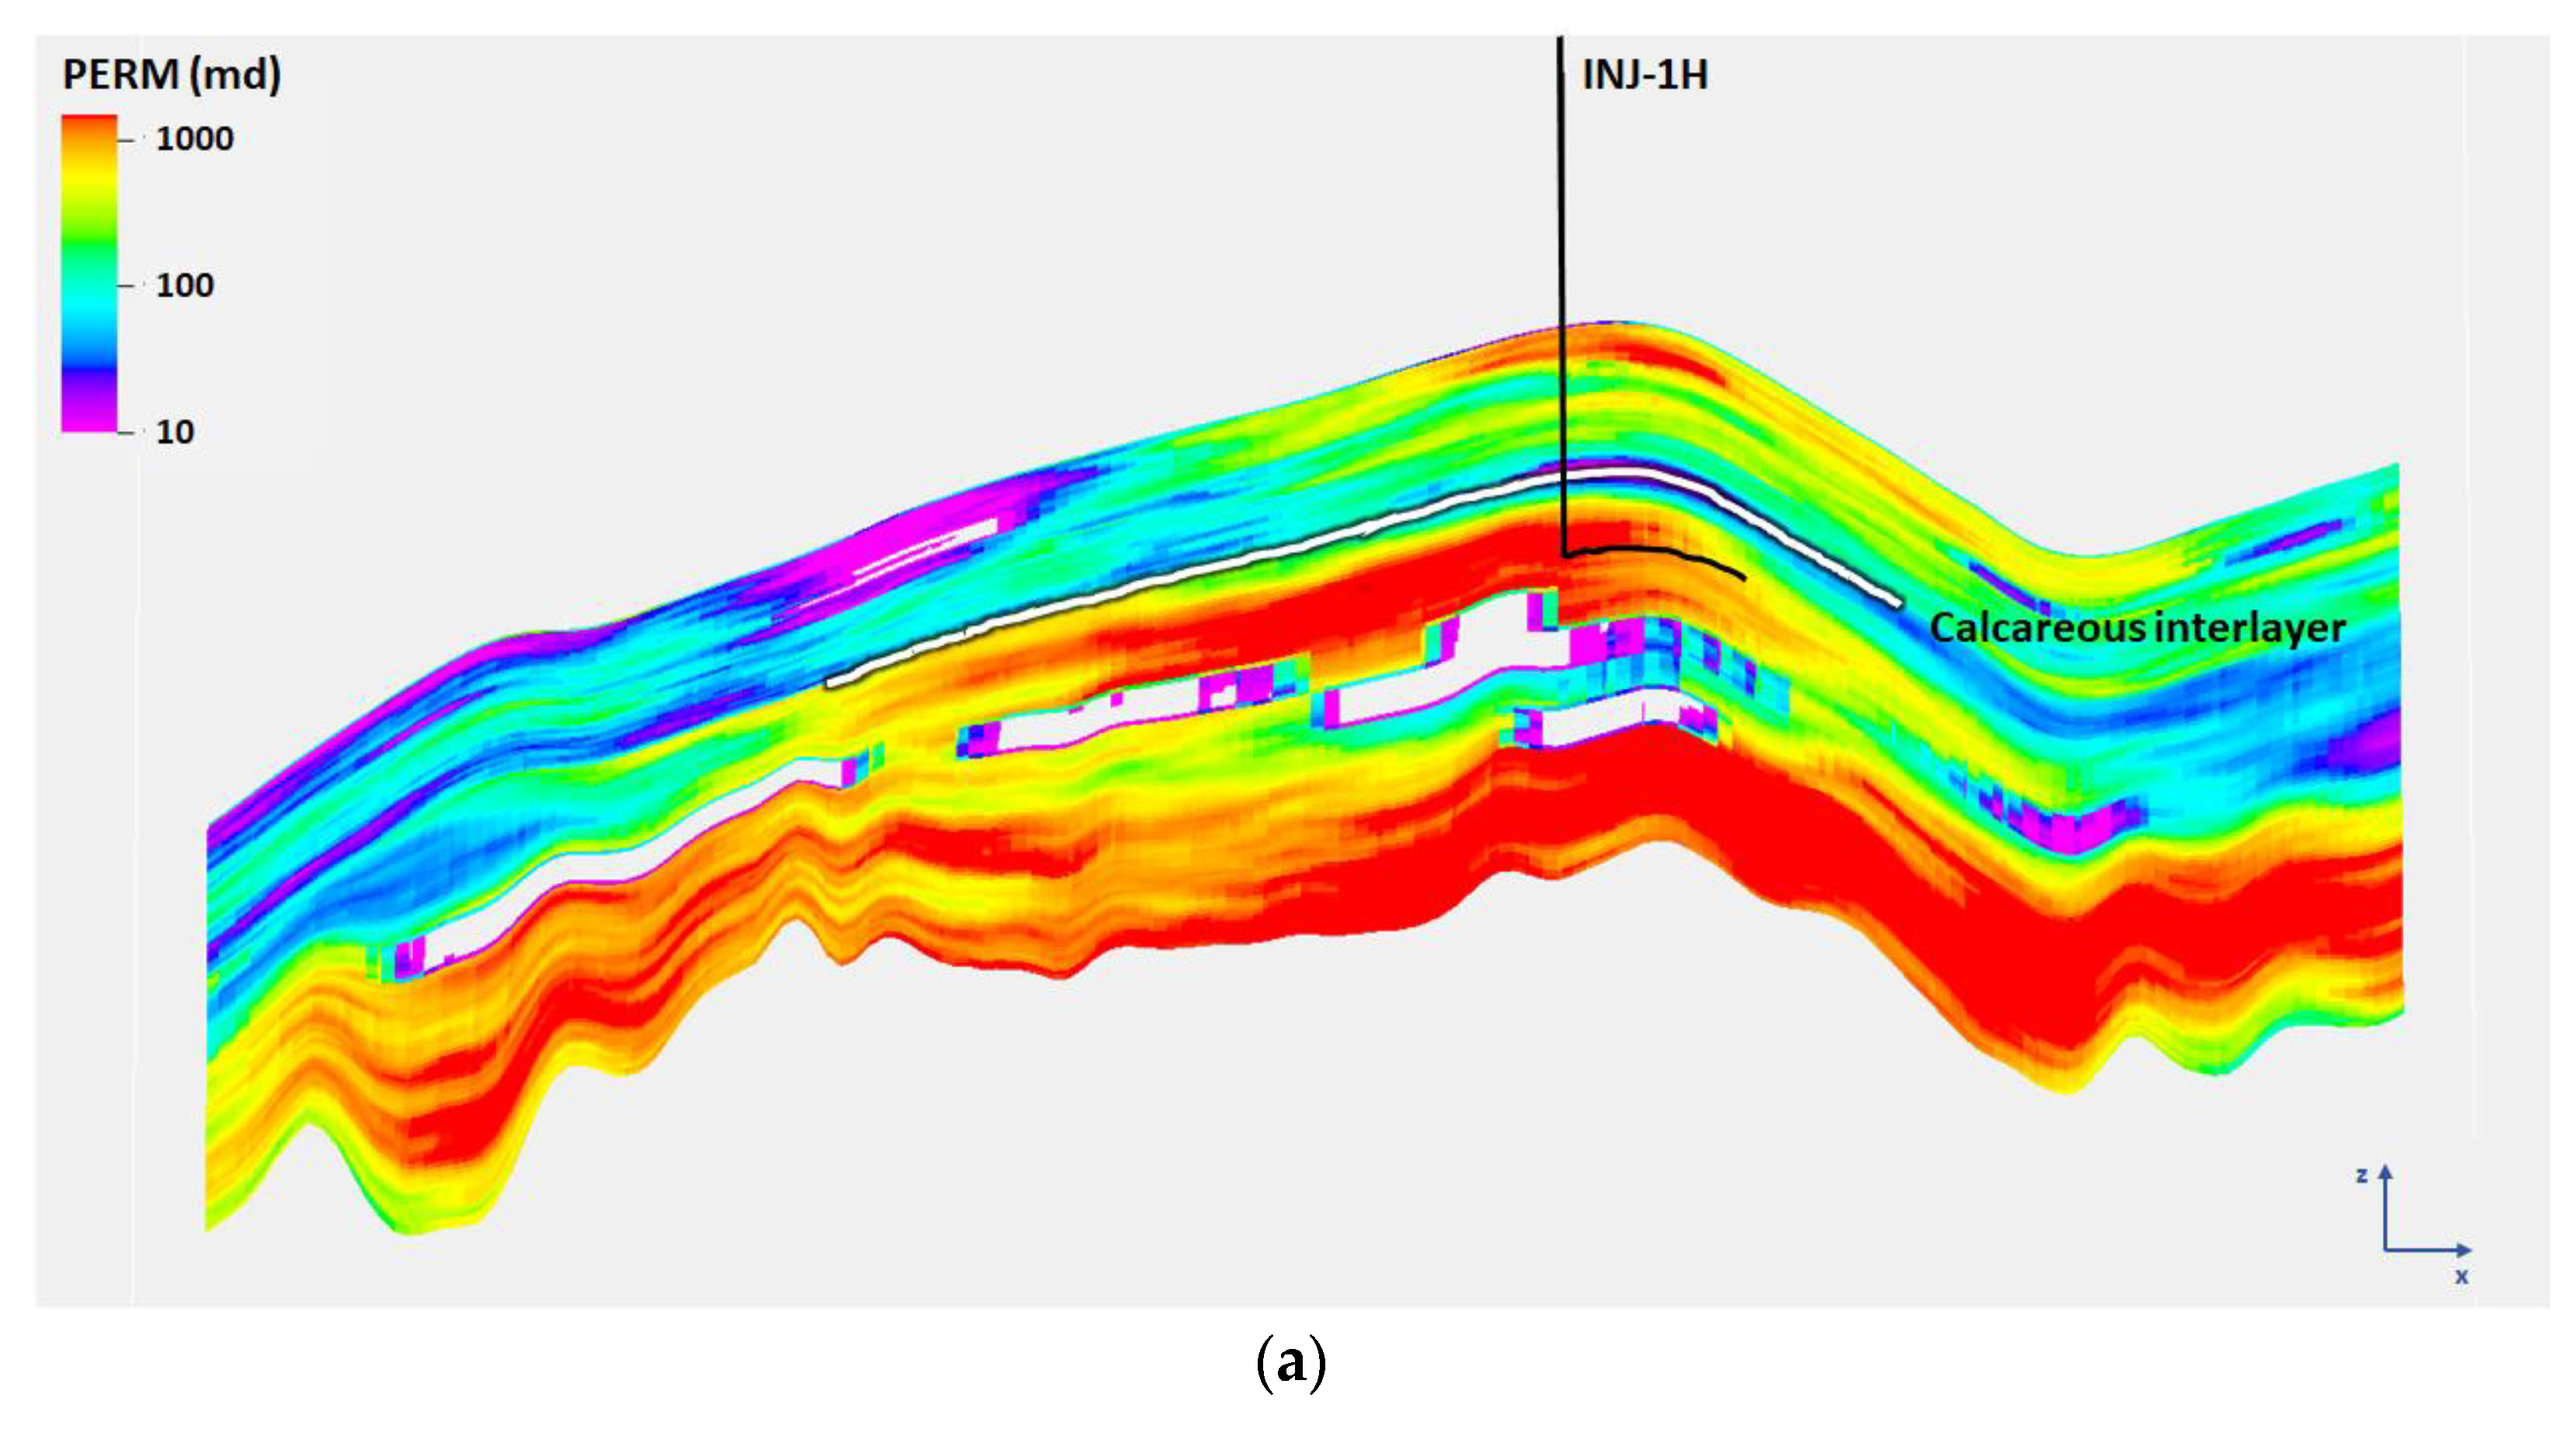
Figure 1.
Permeability maps depicting the calcareous interlayer which is a cap rock of substructure. (a) Planar view (Left: top layer, Right: 59th layer), (b) cross sectional view.
Figure 1.
Permeability maps depicting the calcareous interlayer which is a cap rock of substructure. (a) Planar view (Left: top layer, Right: 59th layer), (b) cross sectional view.


Figure 2.
Gradient images illustrating the region classification of the model. (a) Planar view, (b) cross sectional view.
Figure 2.
Gradient images illustrating the region classification of the model. (a) Planar view, (b) cross sectional view.

Figure 3.
Line graph depicting the temporal evolution of injected CO2 plume.

Figure 4.
Line graph of the relative permeability of CO2-H2O system.

Figure 5.
Permeability maps depicting the location of the injector. (a) Lower injector (CASE 1), (b) upper injector (CASE 2–CASE 6).
Figure 5.
Permeability maps depicting the location of the injector. (a) Lower injector (CASE 1), (b) upper injector (CASE 2–CASE 6).


Figure 6.
Gradient images showing the location of producer; Producer opposite direction of the migration (PRO-1V for CASE 4), producer close to the migration pathway (PRO-2V for CASE 5), and producer away from the migration pathway (PRO-3V for CASE 6). (a) Well location on a planar region map, (b) well location on a cross sectional region map, (c) well location on a cross sectional permeability map.


Figure 7.
Line graphs showing the comparison of reference pressure below cap rock. (a) Pressure behavior for whole 200 years, (b) pressure behavior for initial 15 years (CASE1–CASE3), (c) pressure behavior for initial 15 years (CASE4–CASE6).
Figure 7.
Line graphs showing the comparison of reference pressure below cap rock. (a) Pressure behavior for whole 200 years, (b) pressure behavior for initial 15 years (CASE1–CASE3), (c) pressure behavior for initial 15 years (CASE4–CASE6).


Figure 8.
Line graph depicting the summary of brine production (CASE3–CASE6).

Figure 9.
Gradient images depicting the comparison of the distributions of CO2 at 200 years later from the commencement of CO2 sequestration project. (a) CASE 1, (b) CASE 2, (c) CASE 3, (d) CASE 4, (e) CASE 5, (f) CASE 6.
Figure 9.
Gradient images depicting the comparison of the distributions of CO2 at 200 years later from the commencement of CO2 sequestration project. (a) CASE 1, (b) CASE 2, (c) CASE 3, (d) CASE 4, (e) CASE 5, (f) CASE 6.

Figure 10.
Gradient images showing the behavior of CO2 plume around the intersection point of the structure outside and the substructure inside. (a) Pressure map (cross sectional) and saturation map (planar) of CASE 4 at year 2034, (b) pressure map (cross sectional) and saturation map (planar) of CASE 5 at year 2034.


Table 1.
Parameters of CO2 sequestration model.
| Phase | CO2 rich, H2O rich |
| Fluid component | CO2, H2O, NaCl |
| Mutual solubility | Phase-partitioning [33] |
| Molecular diffusion factor | (Unit: m2/day) |
| • Water phase | H2O: 0.0005/CO2: 0.001/NaCl: 0.005 |
| • Gas phase | H2O: 0.001/CO2: 0.001 |
Table 2.
Geological property of aquifer model.
| Model dimension (i, j, k) | (152, 153, 139) |
| Porosity (max, mean, min) | (34%, 24%, 12%) |
| Permeability (max, mean, min) | (7794 md, 506 md, 3 md) |
| Vertical/horizontal ratio | 0.31 |
| Initial pressure | 17.4 MPa @1746 m |
| Initial temperature | 89 °C |
| Gas residual saturation | 30% |
| Salinity | 8% |
Table 3.
Property of analytic aquifer.
| Analytic model | Carter–Tracy |
| Radius numerical aquifer | 3800 m |
| Influence function | 2 |
| Permeability | 300 md |
| Porosity | 29% |
Table 4.
Scenario description in combination with CO2 injection and brine production.
| Case | Injector | Producer | Description |
|---|---|---|---|
| CASE 1 | Lower | N/A | Injector below substructure |
| CASE 2 | Upper | N/A | Injector right below cap rock of the main structure |
| CASE 3 | Upper | Injector | Pre-injection brine production for 3 years |
| CASE 4 | Upper | Lower | Producer in opposite to the migration direction |
| CASE 5 | Upper | Lower | Producer in the migration pathway |
| CASE 6 | Upper | Lower | Producer away from the migration pathway |
Table 5.
Summary of injection period, injected mass, and storage capacity of CO2.
| Case | Injection Time (year) | Injected Mass (Mt CO2) | CO2 Capacity (Mt CO2) |
|---|---|---|---|
| CASE 1 | 8.22 | 16.45 | 10.13 |
| CASE 2 | 6.42 | 12.83 | 9.79 |
| CASE 3 | 8.39 | 16.79 | 11.87 |
| CASE 4 | 9.47 | 18.93 | 12.92 |
| CASE 5 | 9.38 | 18.76 | 12.77 |
| CASE 6 | 13.22 | 26.43 | 16.44 |
Table 6.
Classification of sequestrated CO2 by mechanism and region at year 2230.
| Region | Mobile (Mt CO2) | Residual (Mt CO2) | Dissolution (Mt CO2) | |
|---|---|---|---|---|
| CASE 1 | Main structure | 3.38 | 1.51 | 0.49 |
| Substructure | 5.25 | 4.14 | 1.65 | |
| Beyond spill | 0.01 | 0.02 | 0.01 | |
| CASE 2 | Main structure | 7.37 | 2.24 | 0.60 |
| Substructure | 0.18 | 1.12 | 0.55 | |
| Beyond spill | 0.25 | 0.36 | 0.17 | |
| CASE 3 | Main structure | 9.02 | 2.39 | 0.60 |
| Substructure | 0.52 | 1.77 | 0.83 | |
| Beyond spill | 0.65 | 0.70 | 0.32 | |
| CASE 4 | Main structure | 9.57 | 2.37 | 0.57 |
| Substructure | 0.98 | 2.27 | 1.03 | |
| Beyond spill | 0.90 | 0.86 | 0.40 | |
| CASE 5 | Main structure | 9.47 | 2.37 | 0.57 |
| Substructure | 0.93 | 2.21 | 1.01 | |
| Beyond spill | 0.92 | 0.88 | 0.41 | |
| CASE 6 | Main structure | 10.98 | 2.42 | 0.54 |
| Substructure | 3.04 | 3.65 | 1.52 | |
| Beyond spill | 2.17 | 1.45 | 0.65 |
Disclaimer/Publisher’s Note: The statements, opinions and data contained in all publications are solely those of the individual author(s) and contributor(s) and not of MDPI and/or the editor(s). MDPI and/or the editor(s) disclaim responsibility for any injury to people or property resulting from any ideas, methods, instructions or products referred to in the content. |
© 2023 by the author. Licensee MDPI, Basel, Switzerland. This article is an open access article distributed under the terms and conditions of the Creative Commons Attribution (CC BY) license (https://creativecommons.org/licenses/by/4.0/).
Share and Cite
MDPI and ACS Style
Jung, S. Expansion of Geological CO2 Storage Capacity in a Closed Aquifer by Simultaneous Brine Production with CO2 Injection. Sustainability 2023, 15, 3499. https://doi.org/10.3390/su15043499
AMA Style
Jung S. Expansion of Geological CO2 Storage Capacity in a Closed Aquifer by Simultaneous Brine Production with CO2 Injection. Sustainability. 2023; 15(4):3499. https://doi.org/10.3390/su15043499
Chicago/Turabian StyleJung, Seungpil. 2023. "Expansion of Geological CO2 Storage Capacity in a Closed Aquifer by Simultaneous Brine Production with CO2 Injection" Sustainability 15, no. 4: 3499. https://doi.org/10.3390/su15043499
Note that from the first issue of 2016, this journal uses article numbers instead of page numbers. See further details here.