Review

Examining the Optimal Choice of SEM Statistical Software Packages for Sustainable Mathematics Education: A Systematic Review

by
Darmaraj Sakaria
,
Siti Mistima Maat
* and
Mohd Effendi Ewan Mohd Matore
Faculty of Education, Universiti Kebangsaan Malaysia, Bangi 43600, Malaysia
*
Author to whom correspondence should be addressed.
Sustainability 2023, 15(4), 3209; https://doi.org/10.3390/su15043209
Submission received: 19 December 2022 / Revised: 23 January 2023 / Accepted: 6 February 2023 / Published: 9 February 2023

Abstract

:
Intending to analyze structural relationships between measured variables and latent constructs, researchers tend to adopt structural equation modeling (SEM) through either “covariance-based SEM” (CB-SEM) or “variance-based SEM” (VB-SEM)/“partial least squares SEM” (PLS-SEM) by using numerous statistical applications. Nevertheless, the reviews on understanding the optimal choice of proprietary statistical software packages in SEM approaches are scarce despite its immense importance in sustaining education. Therefore, a systematic review would be obligated to scrutinize the empirical studies to fill this gap. By employing the Preferred Reporting Items for Systematic Review and Meta-Analyses (PRISMA) guidelines, a total of 47 publications that met the inclusion criteria were obtained. To extract articles from August 2018 to 2022, Scopus, Web of Science (WoS), and The Education Resources Information Center (ERIC) databases were adopted. The findings imply that six types of proprietary statistical software packages emerged as an optimal choice: Lisrel, Amos, Mplus, SmartPLS, R package (plspm), and WarpPLS. Despite the widespread usage of a variety of statistical applications, SmartPLS and AMOS were rigorously utilized in VB-SEM/PLS-SEM and CB-SEM, respectively. This review is important for practitioners to discover which statistical tools are relevant to use and to identify gaps in order to sustain mathematics education for the future.

1. Introduction

Sustainable Development Goals (SDGs) are relevant in multiple industries; however, there is no disputing that the education sector is as significant as other industries [1]. The fourth United Nations Sustainable Development Goal (SDG4) emphasized the importance of high-quality education to support the sector’s sustainability as it prepares for the year 2030 [2,3]. To accomplish that aim, research regarding structural equation modeling, or SEM for short, has gained greater traction in mathematics education. As the latest method for multivariate data analysis [4,5], SEM was pioneered by Sewall Wright in 1934. The analysis method was developed as an alternative to regression modeling through the Ordinary Least Square (OLS) method [6,7]. Since this method was found to be able to overcome the limitations found in the regression modeling analysis, it is often referred to as the Second-Generation multivariate analysis method [6,7,8] in the mathematical landscape.
Despite analyzing structural relationships among constructs and indicators, SEM permits researchers to simultaneously model and estimate complex relationships among multiple dependent and independent variables. In the mathematical area, prior researchers used SEM as their preference over the traditional multivariate method. This is because SEM provides explicit evaluation of measurement error, estimates the latent variables via observed/manifest variable, and is capable of model testing, in which a structure may be imposed and the data’s fit can be verified. In addition, most multivariate approaches, by not explicitly modeling measurement error, accidently disregard it, whereas the SEM model estimates these error variance parameters for both exogenous and endogenous variables. Another reason why previous mathematics scholars preferred SEM is that it offers the estimation of latent variables from observed variables such that the creation of composites considers measurement error. Eventually, completely developed models can be tested against data using SEM as a conceptual or theoretical framework or mathematical model, and their fit to the sample data can be evaluated. Researchers generally draw on two appropriate statistical methods to estimate SEM—CB-SEM or VB-SEM/PLS-SEM [4,8,9,10,11,12]. Looking across the literature, PLS-SEM is also referred to as PLS path modeling (PLS-PM) [13,14]. The study in [15] noted that researchers must be aware of the variations in order to implement the appropriate methodology, since each estimation is ideal for a different research circumstance. Neither method is generally preferable over the other, and neither is acceptable in every context [16] of mathematics.
This is because CB-SEM in mathematics research, in fact, is generally employed to confirm (or reject) theories and the underlying hypotheses. It tends to confirm or reject hypotheses by evaluating how closely a suggested theoretical model can replicate the covariance matrix for an observed sample dataset [8]. On the contrary, PLS has been established as a “causal-predictive” approach to SEM, which focuses on explaining the variance in the models’ dependent variables [17]. In short, CB-SEM is the prominent method for testing more established theories, while VB-SEM/PLS-SEM is a more applicable strategy that permits exploratory research in causal research, especially building and predicting new theory [11,18]. Consequently, the choice between both SEM approaches is highly considered around the globe due to the need for this methodology in sustainable mathematics education. As a result, SEM statistical software packages are expanding quickly to serve in this matter. This is because the SEM tool and its method are closely associated and have an impact on the outcomes and the analysis carried out [19,20] by mathematics scholars.
Current literature has underlined the statistical applications, such as EQS [6,7,9,21,22], Amos [4,6,7,9,21,22,23,24,25], Lisrel [4,6,7,9,21,22,25], Stata (Builder, Sem, Gsem) [9,22], STAT PROC CALIS (SAS) [6,7,9,22], Statistica (Sepath) [9,22], Simplis [6,7], Systat (Ramona) [22], ῼnyx [9,22], Prelis, and a number of R-based packages (Lavaan, Sem, OpenMx, Lava, and Systemfit) [9,22]. These are most widely used for mathematical research applying CB-SEM studies. While users who prefer open-source environments may discover the R packages appealing, there are also other commercial software packages in CB-SEM that are rapidly evolving, particularly Mplus [4,6,7,9,22,25,26]. VB-SEM/PLS-SEM, the second approach, concentrates on the analysis of variance and can be performed by applying PLS-Graph [25], SmartPLS [4,9,25,27], WarpPLS [9,25,28], Adonco [25,29], Xlstat [25], Stata [4], SAS, LVPLS, and VisualPLS. Research has brought forward several packages for the R environment such as SEMinR [25,30,31], cSEM [9,25,30,32], semPLS [33], plspm [34], and Matrixpls, the use of which has recently become more ubiquitous. It can also be carried out using the PLS module in the “R” statistical software package.
Since statistical applications have been established as a significant predictor of SEM outcomes, extensive mathematics research has been executed to elevate the SEM statistical software package features and to identify the nature and elements of it. Aligned with increasing mathematics research on SEM statistical software packages, limited literature reviews were conducted to synthesize prior studies from different circumstances. The studies included a review and comparative study on software packages for SEM [21], a review of eight software packages for SEM [35], and a review of PLS-SEM statistical programs [25]. The process of synthesis is lacking in the articles; for instance, most systematic reviews did not mention the databases that were used to retrieve the articles, which led to unreliable results. To counter these limitations, it has been recommended to use Scopus and WoS databases, as they are well known for being the complete data sources for many applications and bibliometric analysis [36]. In addition, ERIC is another choice as it offers mathematics academic scholars, educators, academicians, or the general public with a comprehensive, rich, searchable, user-friendly, internet-based bibliographic and full-text database of mathematics education research and information. Generally, those sources used high-quality systematic reviews, meta-analyses, meta-synthesis, and bibliometric studies in the context of mathematics.
Furthermore, it has been noticed that the PRISMA guidelines are not promoted in those studies, resulting in misinterpretation and inadvertent bias [37]. While these studies were carried out prior to this review and informed the direction for future studies through basic guidelines, they could not provide overall current research trends on the optimal choice of CB-SEM and VB-SEM/PLS-SEM statistical applications through comparing perspectives via a single review article in the field of mathematics, thereby leaving insufficient systematic reviews as a source of reference for the mathematics researchers. Apart from systematic reviews, previous empirical studies looked at numerous SEM statistical applications from various angles [30,38,39,40,41,42]. Those studies highlighted various SEM statistical applications used for analysis of SEM. However, given that there are not many mathematics researchers that systematically reviewed the current research patterns on the optimal choice of statistical applications in mathematics education, those studies are still inadequate.
In a case where the existing review lacks a solid synthesis in the mathematical context, a systematic review might be a useful technique [43]. This is because it gathers pertinent data about a specific subject that met the pre-established eligibility requirements and provided an accurate solution to the research questions that had been posed [44]. Therefore, a systematic review of previous mathematics research is essential to identify the current research trends by examining the optimal choices of proprietary statistical software packages in SEM approaches, respectively, for sustainable mathematics education. By detecting these gaps, this study attempts to conduct a systematic review to evaluate the latest research trends in mathematics education with the following research question:
  • RQ: What are the optimal choices of proprietary statistical software packages in SEM approaches for sustainable mathematics education?
With this purpose in mind, we started to compile the scholarly articles that used SEM statistical applications within the mathematical area. To do so, the method of systematic review was employed, targeting main articles published in Scopus, WoS, and ERIC. Since systematic literature reviews (SLRs) are deemed to be highly transparent and are seen as a rigorous search procedure, identifying the protocol or the guidelines before carrying out the review process is crucial. As such, the authors adopted the PRISMA guidelines involving four robust steps: identification, screening, eligibility, and inclusion. Every step was performed correctly, such as the keywords and the selection of articles, which are described in detail. Beginning with the identification steps, the authors identified 396 publications in total, of which the sample was reduced to 47 papers over the next three phases. This review took up the challenges to contribute to the existing body of knowledge by conducting an SLR on the optimal choice of SEM tools in mathematics research. Based on these ideas, this study aims to accommodate the gap by careful review of the past studies to acquire a better knowledge of the optimal choice of SEM tools in the context of mathematics learning.
In this regard, a few contributions were configured. First, this review serves as a guide for mathematics users to comprehend the distinctive features of each SEM statistical application and make informed decisions on the most appropriate application for future mathematics research. In addition, it may aid the upcoming mathematics researchers and educators in planning future studies by assisting them in understanding research patterns in this field. This is in line with [45], who emphasized that publishing trends are a crucial signal for identifying a field’s development. Furthermore, the stakeholders, non-government, and government parties, such as mathematics educators and experts or curriculum developers, can now understand the necessities of arranging the forum or seminar with hands-on activity dealing with SEM statistical tools, instead of conducting SEM methodological class virtually for upcoming mathematics scholars. On top of that, this study provides specific areas that should be the target of future mathematics researchers and beginners. The basic structure of this paper follows these phases: introduction, methods, results, discussion, and conclusion.

2. Methodology

An overview of the research methods used in the current study will be provided in this section. Five main sub-sections—PRISMA, resources, inclusion and exclusion criteria, systematic review process, and data abstraction and analysis—will be discussed comprehensively.

2.1. The Review Protocol (PRISMA)

PRISMA is a peer-reviewed standard approach that employs a checklist of recommendations to ensure the consistency and quality of the revision process [46]. PRISMA suits SLR in the social sciences with three main tangible benefits [47]. First, it is able to define clear research questions that permit systematic research. Second, it can identify inclusion and exclusion criteria. Lastly, PRISMA can examine a large database of scientific literature in a defined time. Since this approach is deemed suitable to identify the relevant statistical applications used in SEM approaches in mathematics coherently, it was adopted in this review. In order to produce a well-organized and transparent systematic review, a few phases of identification, screening, eligibility, and exclusion were carried out [48,49].

2.2. Resources

Acknowledged as premier journal databases amongst bibliographic databases [50] and for being the most comprehensive data sources for numerous applications and bibliometric analysis [36], Scopus and WoS were applied as the primary databases. As for journal coverage, both complemented each other in terms of impact, prestige, and influence [51]. WoS was the first comprehensive international bibliographic database. As a result, it evolved into the most significant source of bibliographic data for tasks like journal selection, research evaluation, bibliometric analysis, and others over time [52]. The WoS Core Collection comprises about 74.8 million academic data and datasets, 1.5 billion referenced references (going back to 1900), and 254 topic disciplines, according to the most recent figures from 2020 [36].
Nevertheless, Scopus has proven to be reliable and, in some ways, even better than WoS, earning its place as a comprehensive bibliographic data source [53]. The authors of [54] added it is an international database of peer-reviewed publications from all over the world. Scopus has updated its content coverage guide, which now lists 206,000 books from more than 5000 international publishers, about 120,000 conferences, and 23,452 current journal titles [36]. Because it is primarily a resource for education-related texts (80%) with the largest index of articles, Eric was included as a supporting database to determine more empirical research regarding SEM in the mathematics field. Over 250 journals are currently available in ERIC, and they were chosen for inclusion in the database based on certain standards. The database search cannot be limited to a single database [43]. Thus, employing these three databases is deemed sufficient.

2.3. Systematic Review Process

As it is less stringent [55] with a reliable, reproducible, and methodical approach, extensive applications, and explicit execution [56], SLR is known as the most reputable research method. It acts as a replicable methodology for finding, evaluating, and synthesizing information with a high level of objectivity [43]. The study in [57] emphasized that when conducting systematic reviews, adherence to a pre-established and explicitly stated protocol is crucial. Due to this, this SLR consolidates four phases as per the PRISMA 2020 guidelines as recommended by [58], reflected in Figure 1.

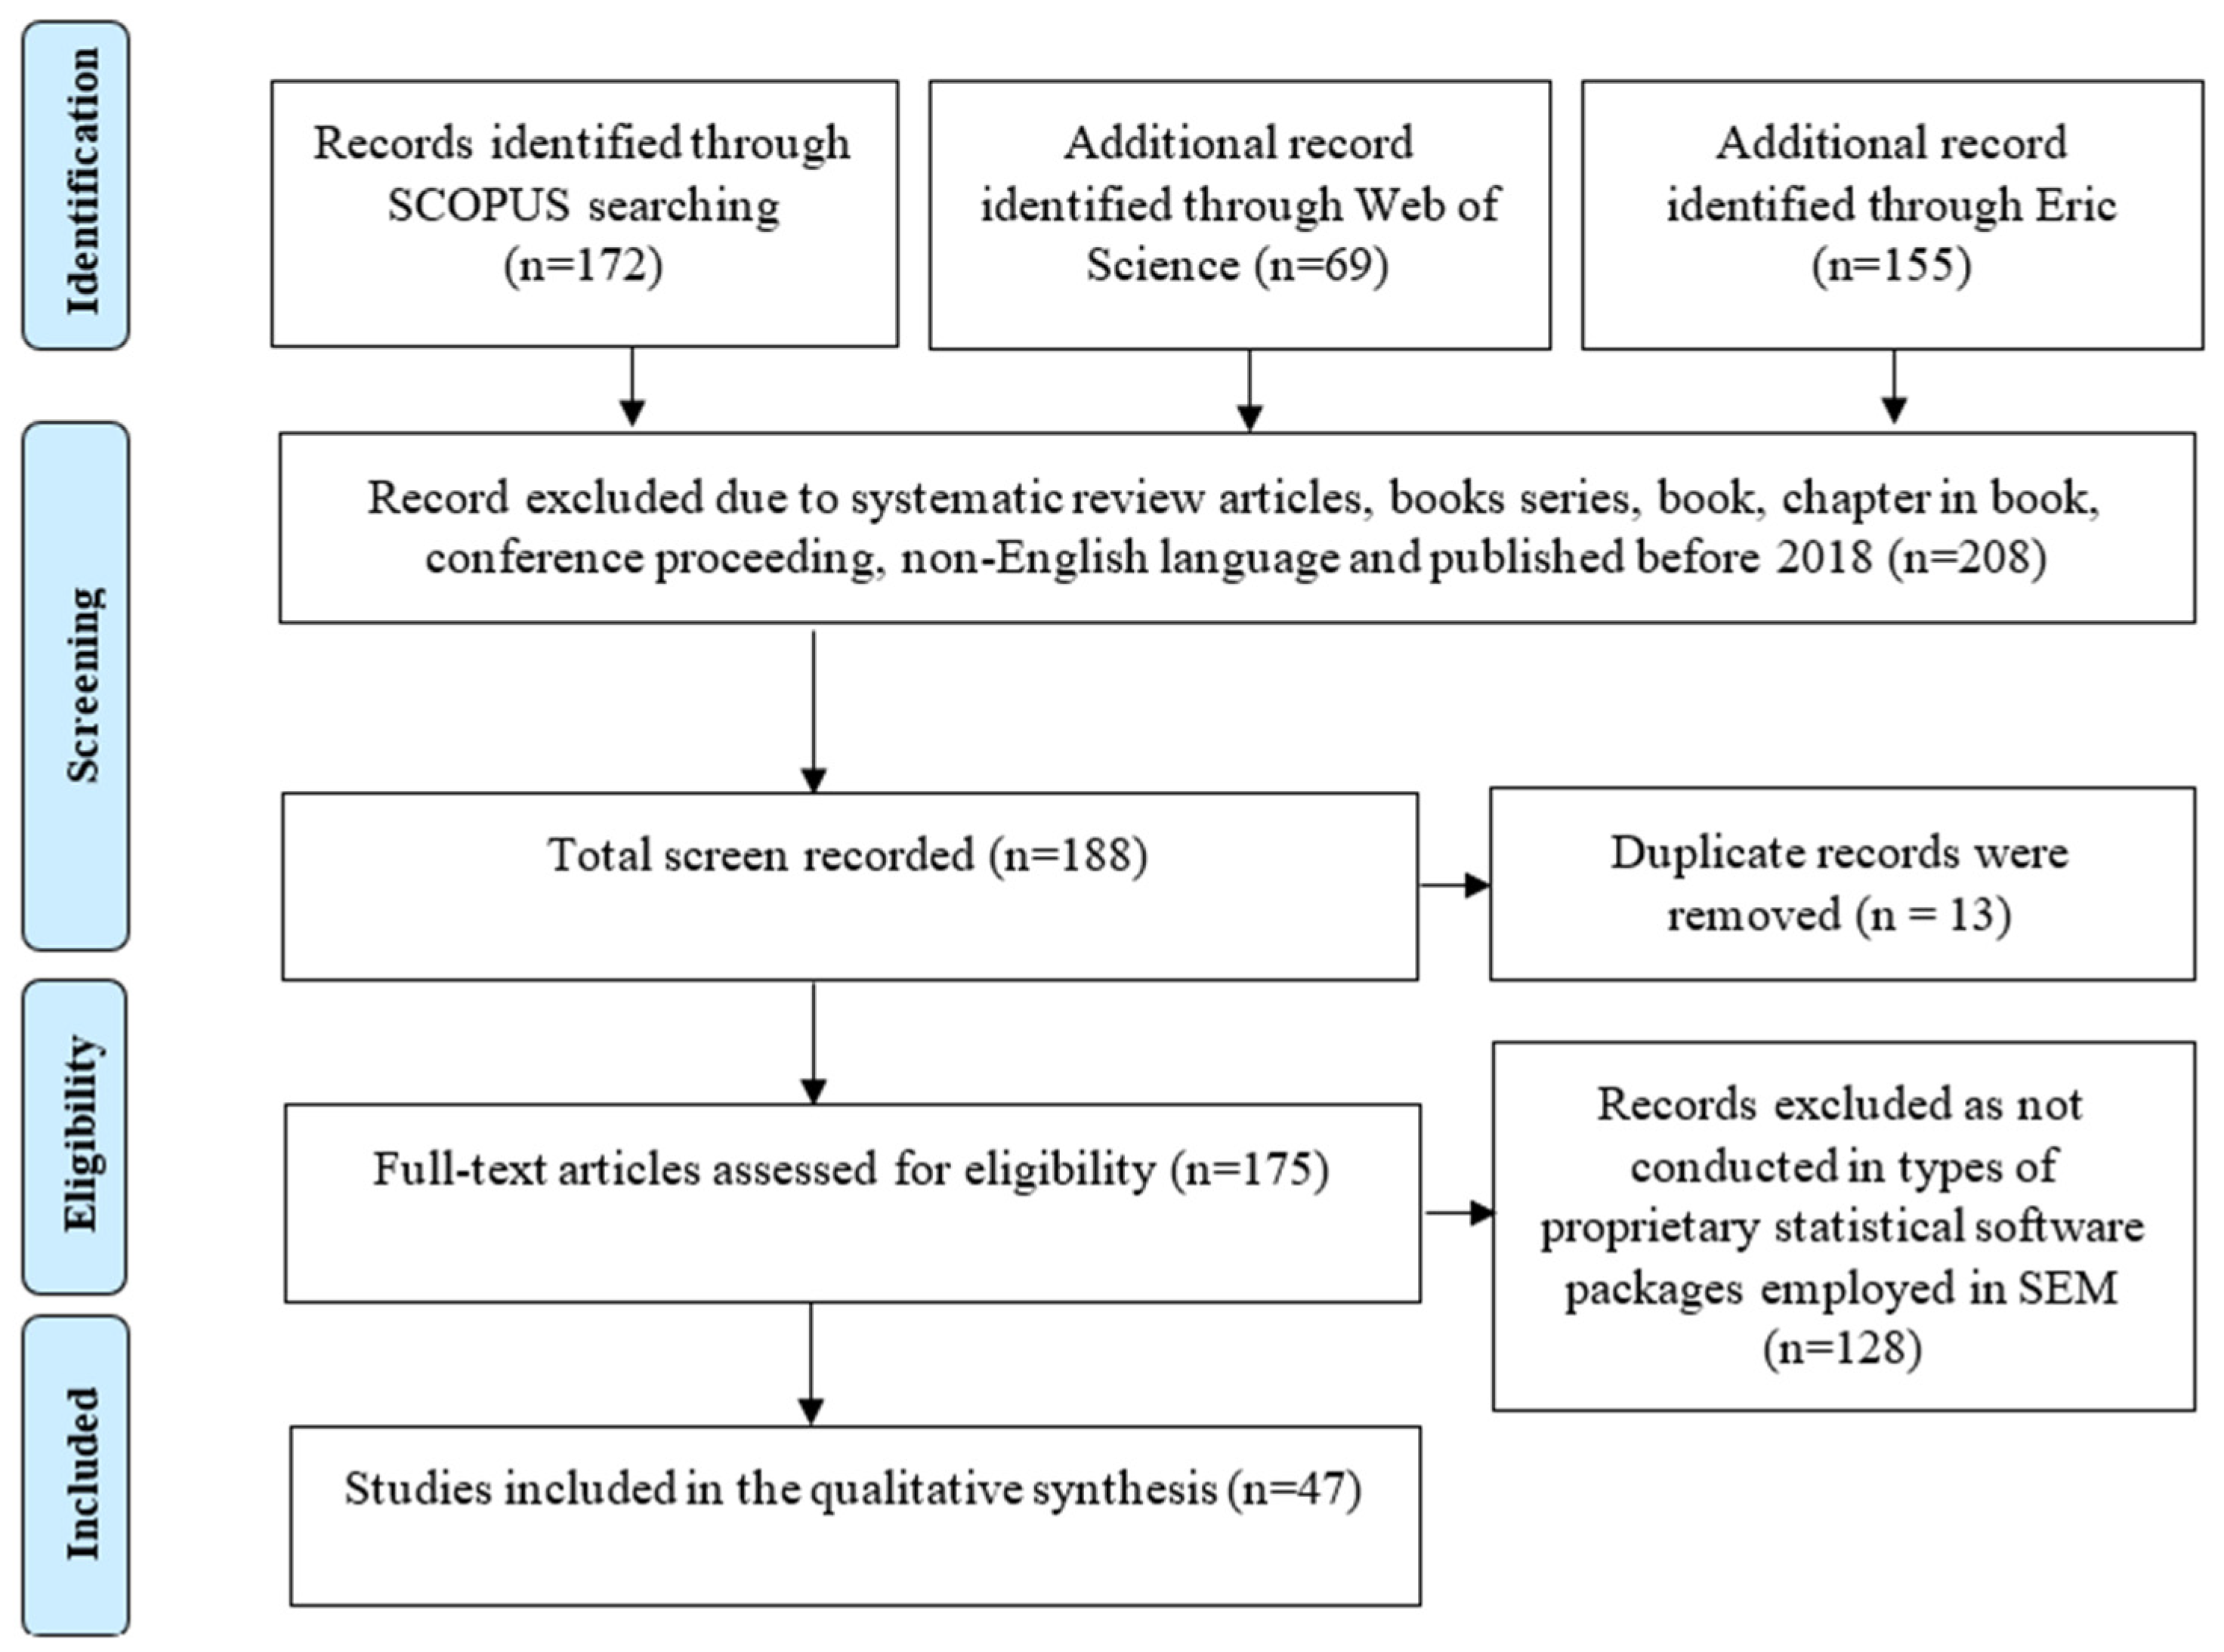
2.3.1. Identification

Identification is the first phase of applying several procedures to enrich major keywords so that articles from the database may be retrieved as widely as feasible. By the time of the protocol, reviewers should have determined the keywords that dictate which documents are obtained [59]. Consultations with experts might help find more keywords [43]. Since one author in this systematic review is an expert in the field, a discussion was held. A cross-reading of a few articles served to identify missing keywords for the search strings [43]. On top of that, to improve the quality of the main keywords, a list of synonyms and similar terms was garnered using the electronic dictionary Thesaurus and Oxford Lexico, dictionaries, and encyclopedia, resulting in 23 keywords.
An advanced search was employed in this review to enable extensive search queries employing field codes, Boolean, and proximity operators to limit the search. Thus, Boolean AND OR were used to broaden the scope of the search as recommended by [60]. Employing informatics phrase searching, wild cards, truncation, and mixed Boolean operators, Table 1 displays the search terms for Scopus. The identical search term was then entered utilizing the title search (TS) feature into the WoS database. However, the search term varied for ERIC due to its different features. A systematic search of “Structural equation modeling” OR “SEM” AND “Mathematics” OR “Mathematics education” was used for ERIC. The specified databases produced a total of 396 possible articles (Scopus, N = 172, WoS, N = 69 & ERIC, N = 155).

2.3.2. Screening

The process of including or excluding articles generated by databases is known as screening in the second phase. The inclusion and exclusion of studies determines the scope and validity of systematic review results [61] in order to find suitable documents [62]. Thus, multiple sets of inclusion and exclusion criteria were applied. Practically, the review must always be constrained to studies relevant to the research question [63]. Since this review attempted to gain more data on empirical documents, the journal articles that used empirical evidence were chosen. This action was the first criterion. On the contrary, systematic reviews, non-empirical articles, book series, chapters in books, and conference proceedings were excluded because they were deemed as unnecessary articles [48]. The study in [64] mentioned that conference proceedings and book chapters are less comprehensive. Second, concentrating on English-language journal articles made it possible to avoid the prospect of difficult or ambiguous translations [65] and reduce misunderstandings.
Before reviewing the articles, writers should ascertain the time period covered by the articles [66]. Thus, for the third inclusion, authors set the time range. Although a short time span could significantly reduce the number of research articles that are eligible [61], authors considered articles published within the last five years. The criterion was set because years from 2017 to 1990 produced less than ten articles each year for Scopus and Wos, respectively. This proved that many articles pertaining to SEM statistical tools in mathematics were published in numbers reaching over ten each year after 2017. The review’s scope may be restricted to a few high-quality journals or only include publications in a particular field of study [67]. Therefore, articles that were distributed globally in mathematics education/subject/discipline/literacy/Teaching and Learning (TnL) were concentrated in the final part of the inclusion and exclusion procedure. At the completion of the review procedure, 175 articles were discovered after the exclusion of 208 articles that were unrelated to the criteria/topic and 13 duplicate articles, as shown in Figure 1. Table 2 featured the summary of the included and excluded criteria.

2.3.3. Eligibility

The third step is eligibility. A total of 175 articles were verified to see if they fulfilled the requirements for inclusion and were compatible with the objectives of the current research. This was achieved by reading through the titles, abstracts, methods, results, and discussions. Only 47 potential publications were ready for further analysis after the elimination of 128 papers. Those 128 articles were not in the mathematics context, although they elaborated upon SEM statistical applications. This was also applied for Science, Technology, Engineering, and Mathematics (STEM), since it was referred to as multidisciplinary [68,69] and was not focused on just the field of mathematics, although the use of publications from other disciplines [43] leads to a broad view and provides the foundation to synthesize the research field from different perspectives [70]. Surprisingly, six studies were eligible in the targeted field; however, methodological flaws existed, as they never mentioned the SEM statistical applications [71,72,73,74,75,76]. Since those studies were deemed as useful for this systematic review, authors contacted the authors via email. By prompt reply from them, those studies were included.

2.3.4. Inclusion Criteria

The articles were retained and met the criteria for analysis during the final phase, known as the inclusion criteria. The 47 articles for this systematic review revolved around SEM statistical applications in mathematics education. Previous literature underscored that the number of articles to be included in SLRs is never more than 50 [77]. Thus, 47 articles are deemed sufficient to carry out a systematic review in line with the statement. The availability of adequate literature on the issue to support a synthesis serves as the foundation for writing an SLR [78]. Thus, it was believed that those 47 articles are sufficient to produce a holistic finding.

2.4. Data Abstraction and Analysis

Those 47 articles were evaluated, reviewed, and analyzed; the results are explained in depth in this report.

3. Results

3.1. General Findings

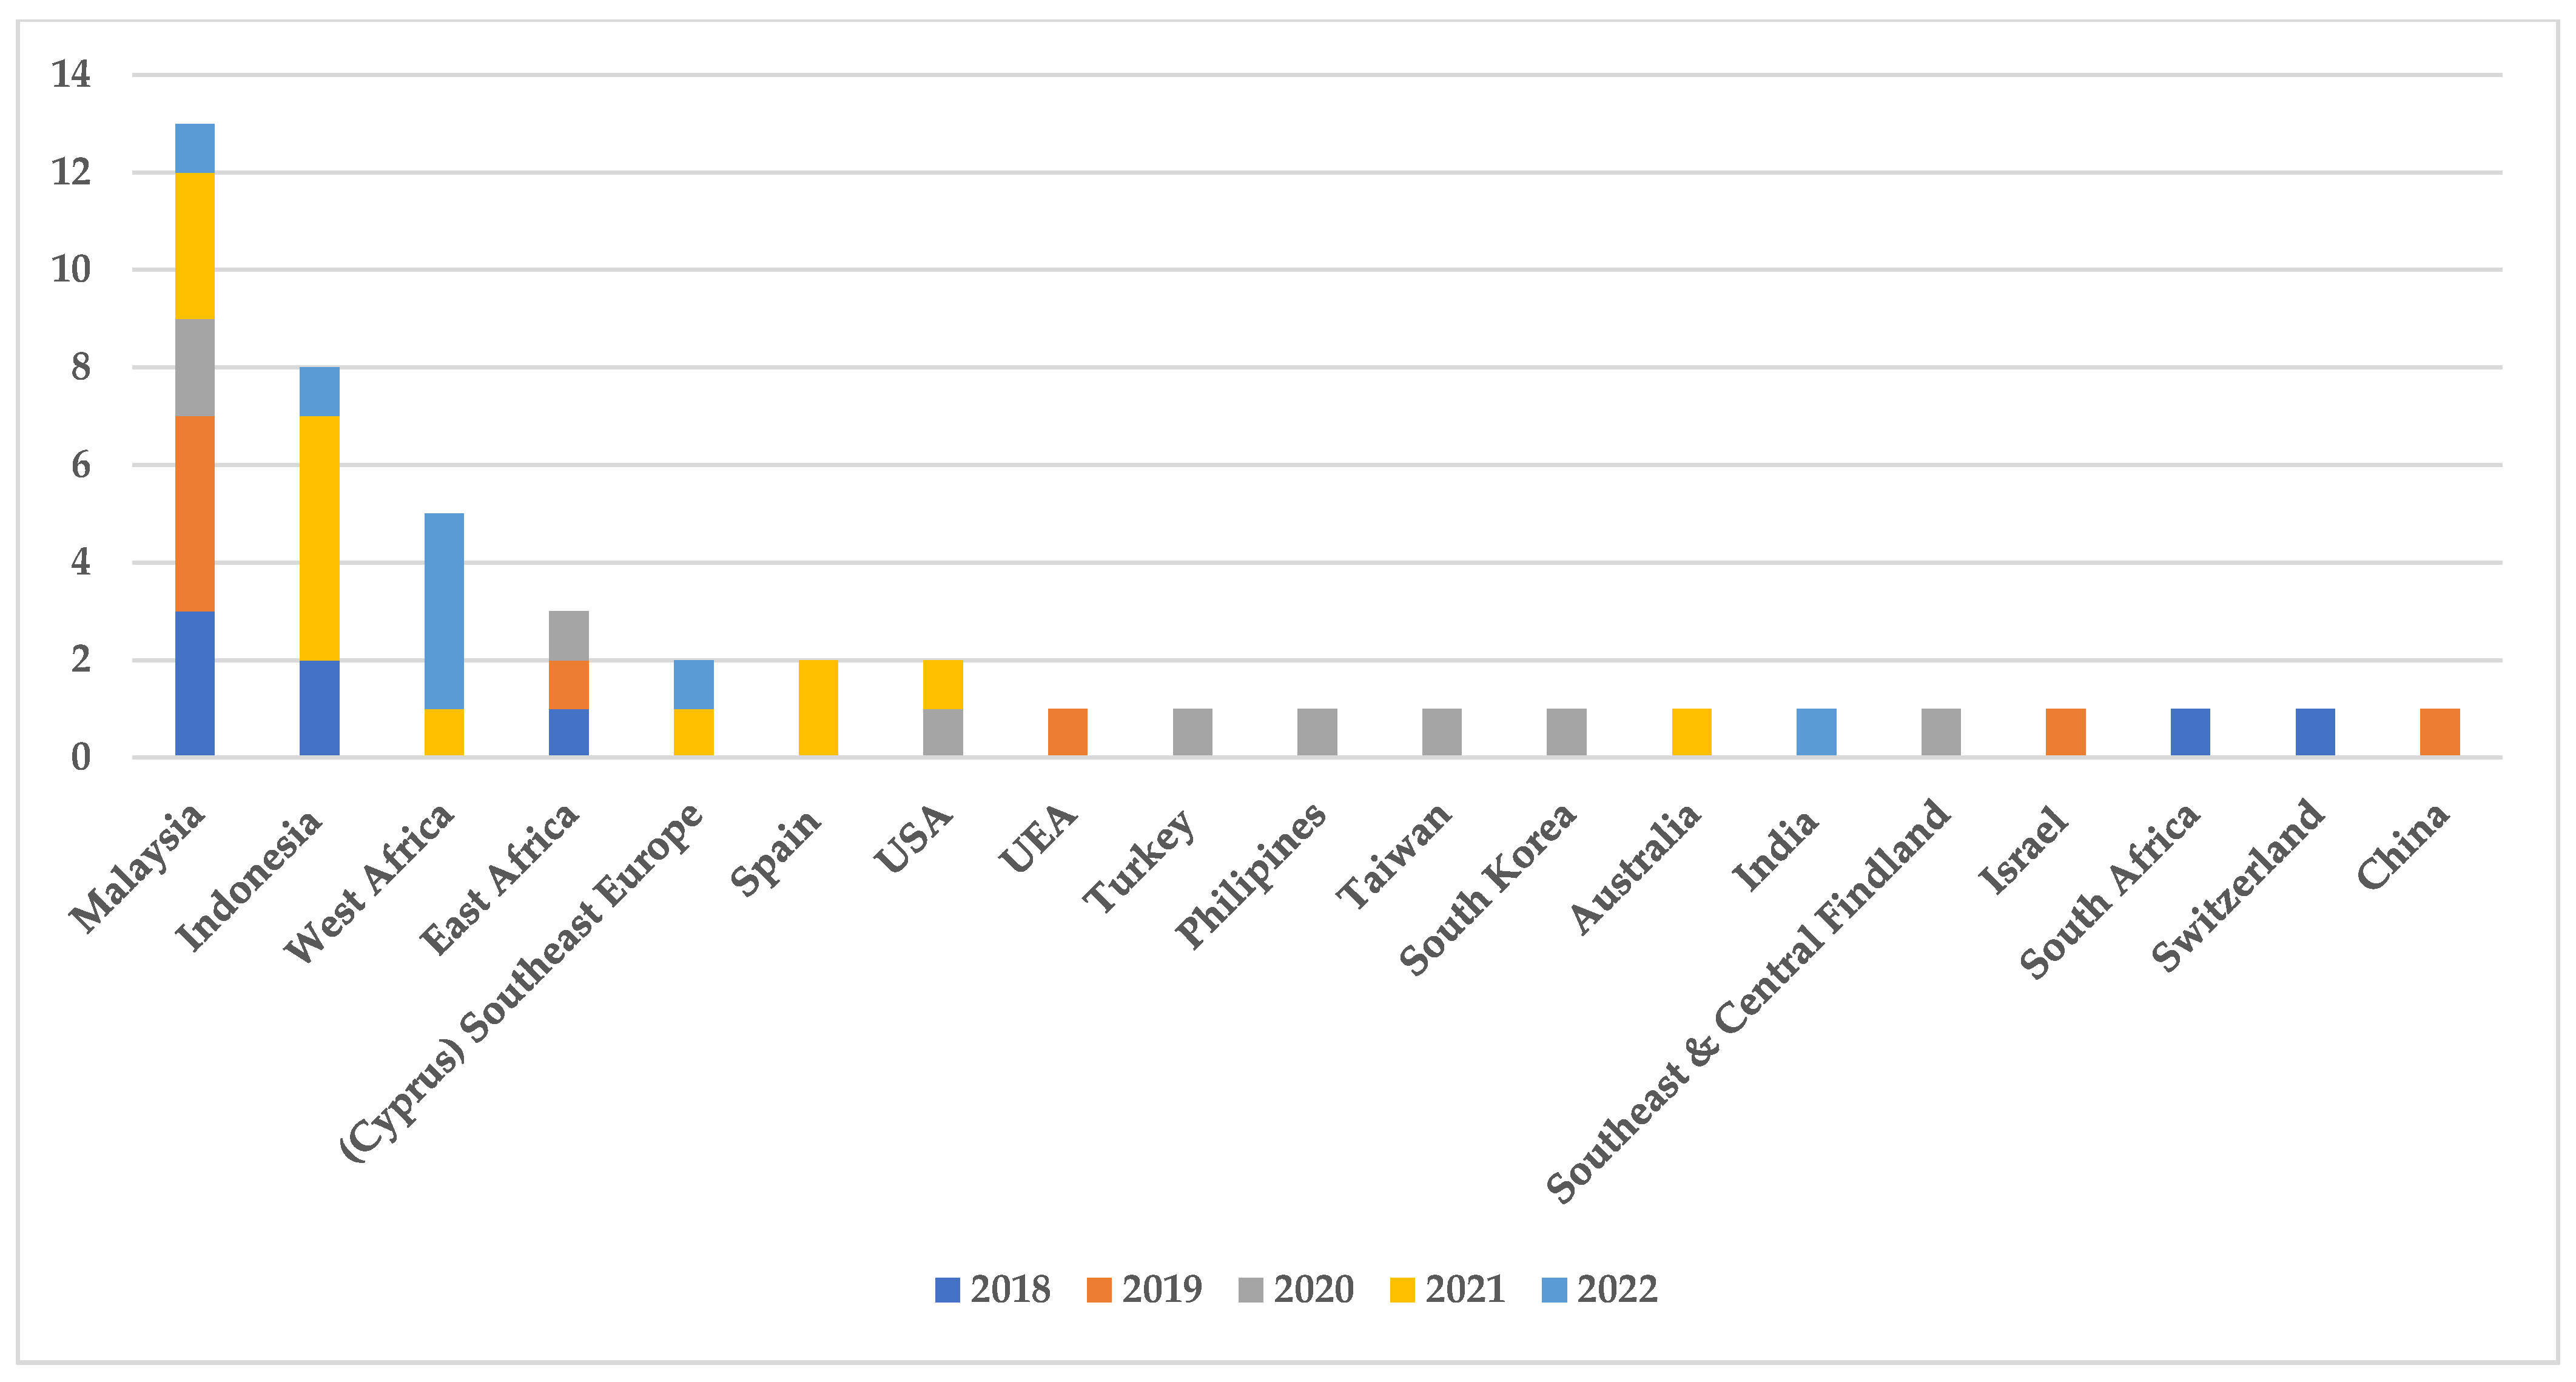
3.1.1. Distribution of Publications Based on Countries

Figure 2 displays the distribution of articles by country. Only the nation of the primary author can receive the maximum score of 1 for each publication. By producing 27.7% or 13 articles, Malaysia was identified as a prominent country that embraced the trend of SEM applications in mathematics education, followed by Indonesia (N = 8 and 17.0%), West Africa (N = 5 and 10.6%), and East Africa (N = 3 and 6.4%). There are three countries with two papers on SEM statistical applications: (Cyprus) Southeast Europe, Spain, and USA. United Arab Emirates, Turkey, Philippines, Taiwan, South Korea, Australia, India, Southeast and Central Finland, Israel, South Africa, Switzerland, and China, the other 12 remaining countries, published one paper each. It was discovered that the top seven nations contributed about 66.0% of all relevant publications related to the target field over the previous five years.

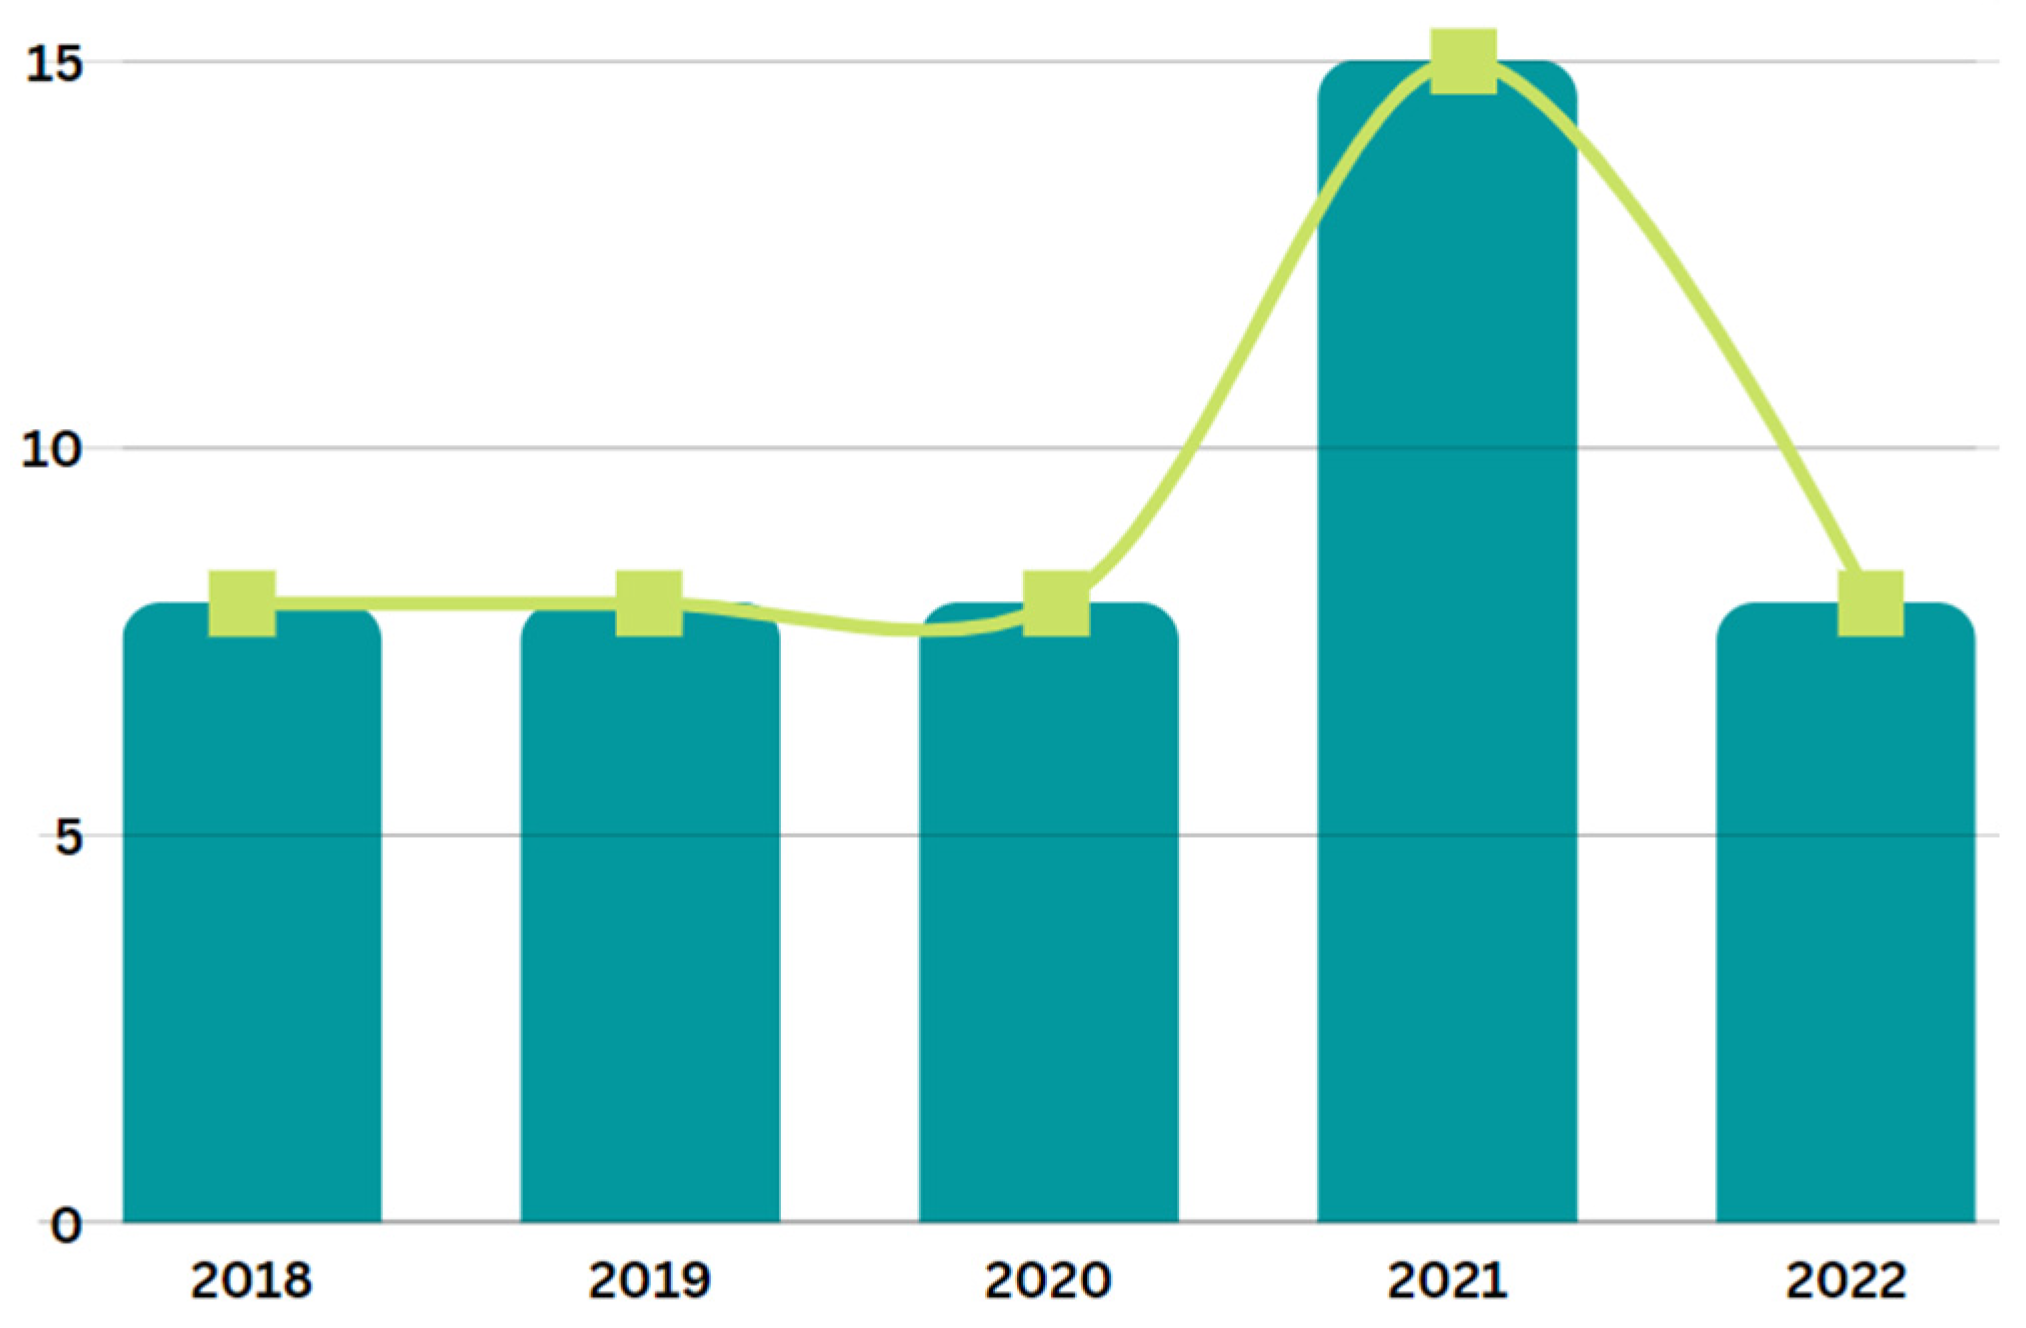
3.1.2. Distribution of Publications Based on Years

Based on the results from Figure 2, the authors have demonstrated the growth of SEM tool publications in the period from June 2018 to June 2022 via Figure 3. Although there have been fluctuations in the number of papers issued, the findings revealed that the interest in the area has been stable from 2018 to 2020, with eight papers written each year. At the peak of targeted research publications in 2021, Indonesia (N = 5) had more papers published than Malaysia (N = 3), Spain (N= 2), West Africa (N = 1), (Cyprus) Southeast Europe (N = 1), USA (N = 1), and Australia (N = 1). This year contributed 31.9% to the field. The number of reviewed articles increased and declined by 53.3% in the last three consecutive years (2020, 2021, 2022).

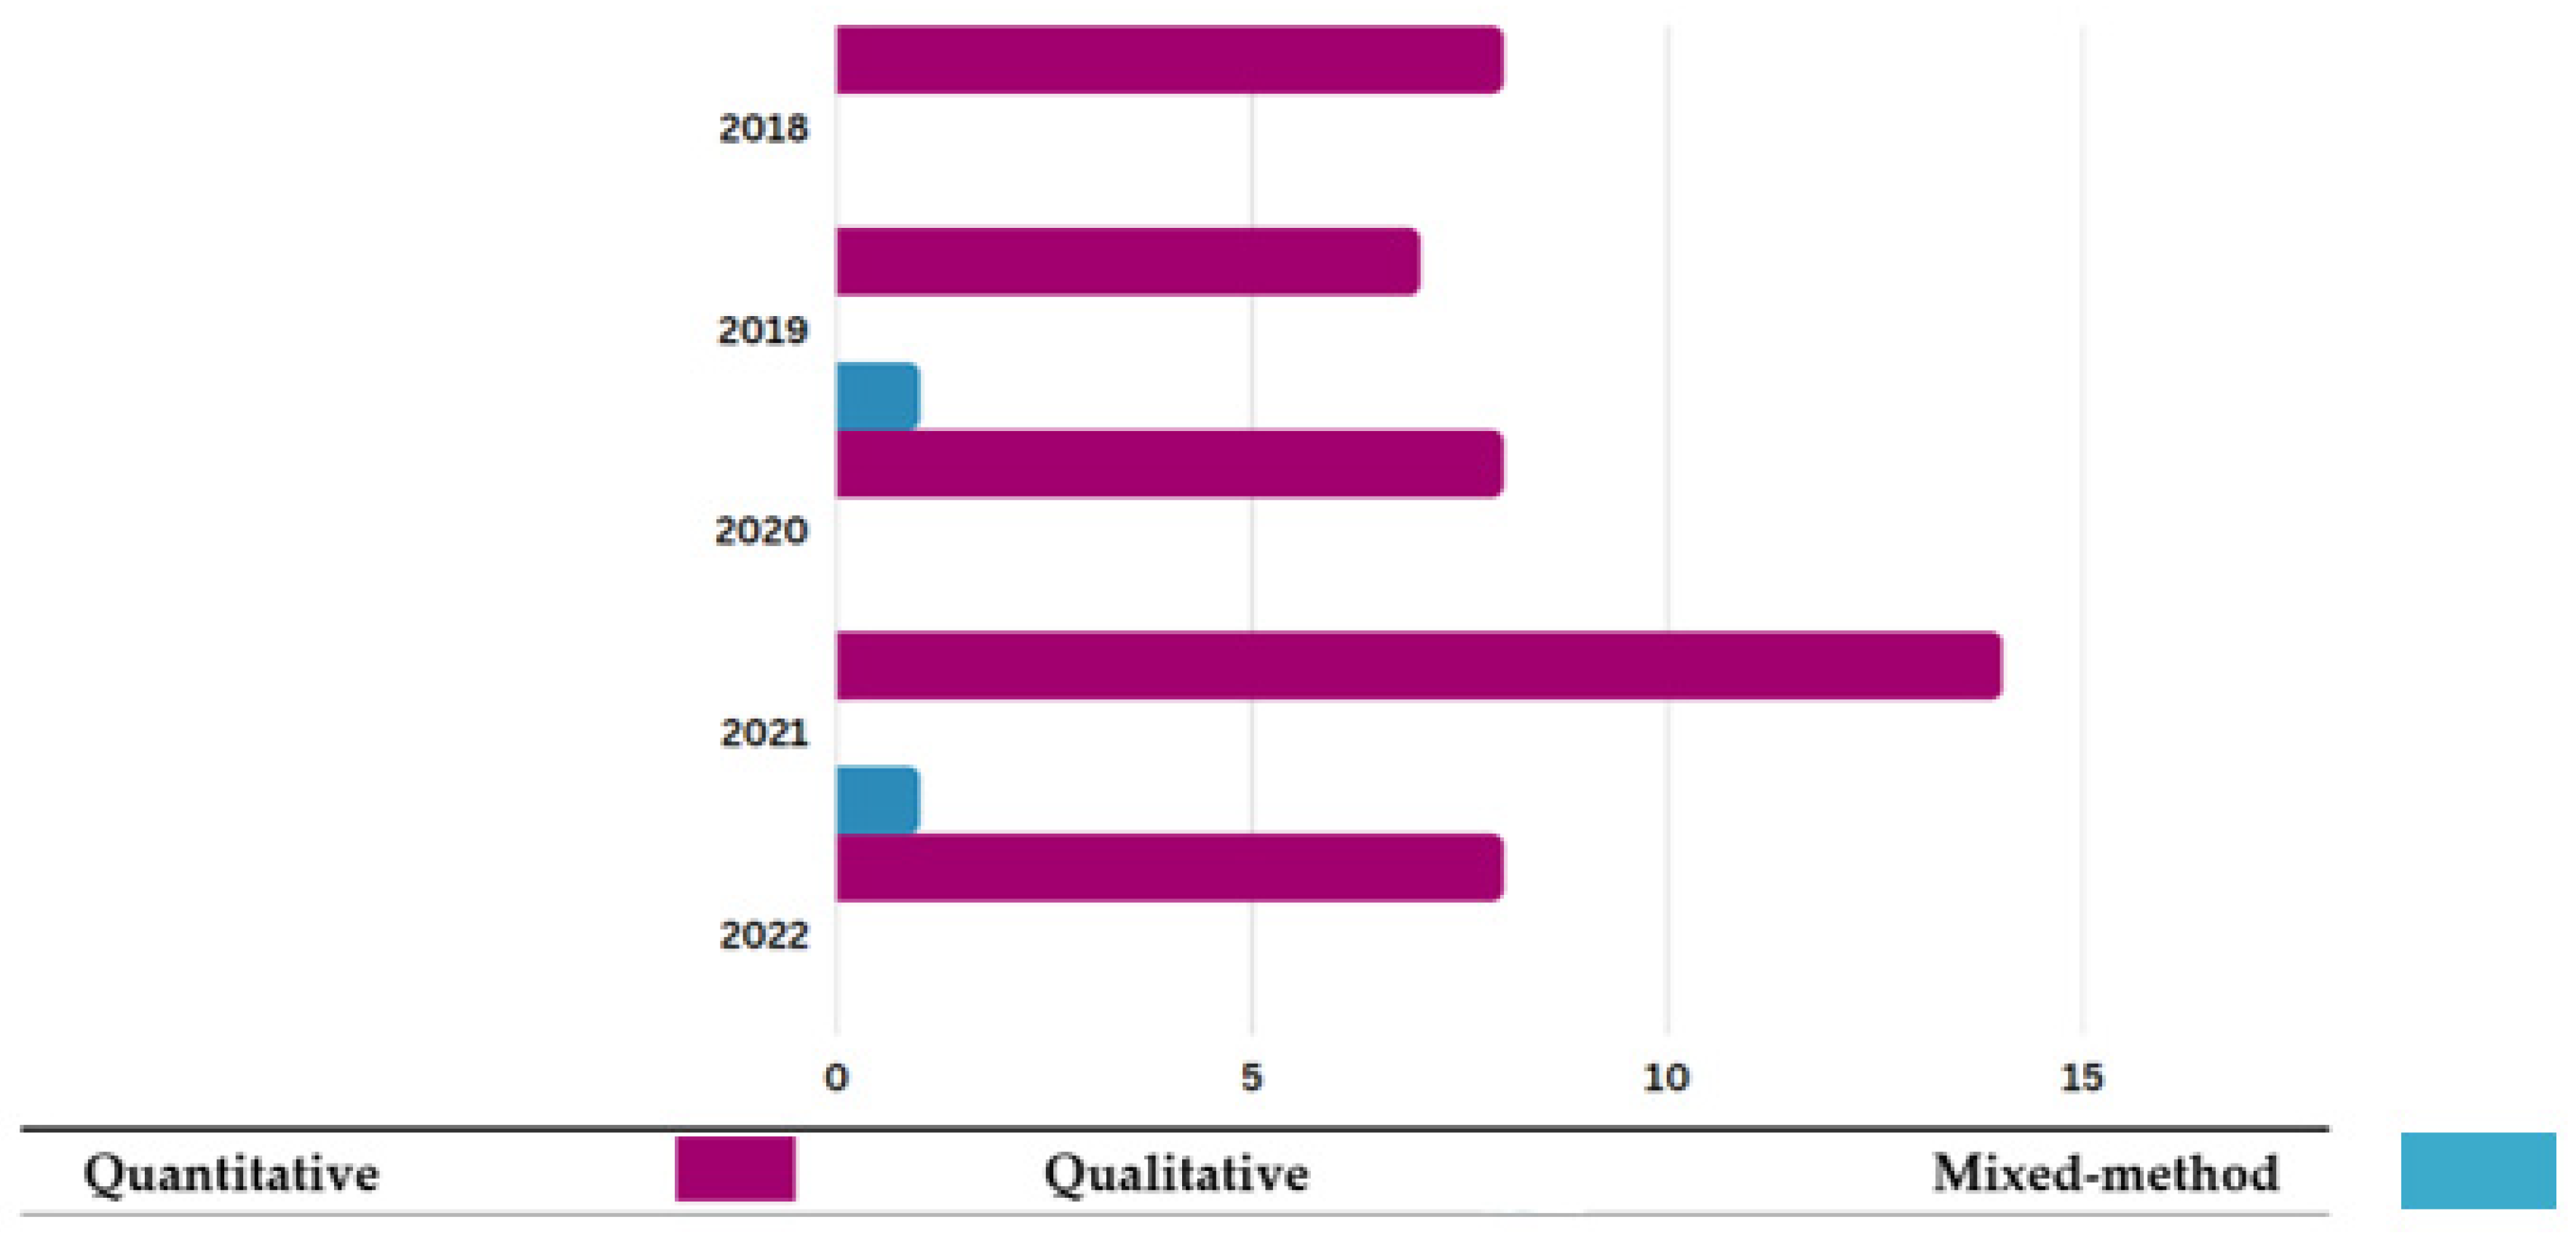
3.1.3. Distribution of Publications Based on Research Design

The relationship/correlations shown by SEM correspond to the researchers’ hypotheses. Thus, the SEM approach entails correlational or causal assumptions together with quantitative data in the model [6,7]. Parallel to the above statements, the findings of the study underscored that almost all researchers (N = 45 and 95.7%) employed quantitative design in their study, followed by qualitative (N = 0 and 0%) and mixed method (N = 2 and 4.3%). The trends in quantitative methods appear to be applied consistently throughout the last five years, even though the number of papers in this field has fluctuated, as shown in Figure 4. Years 2019 and 2021 are the only two years focused on mixed method. This shows more studies should utilize this technique in the upcoming year. However, there are no studies undertaken that use a qualitative research method.

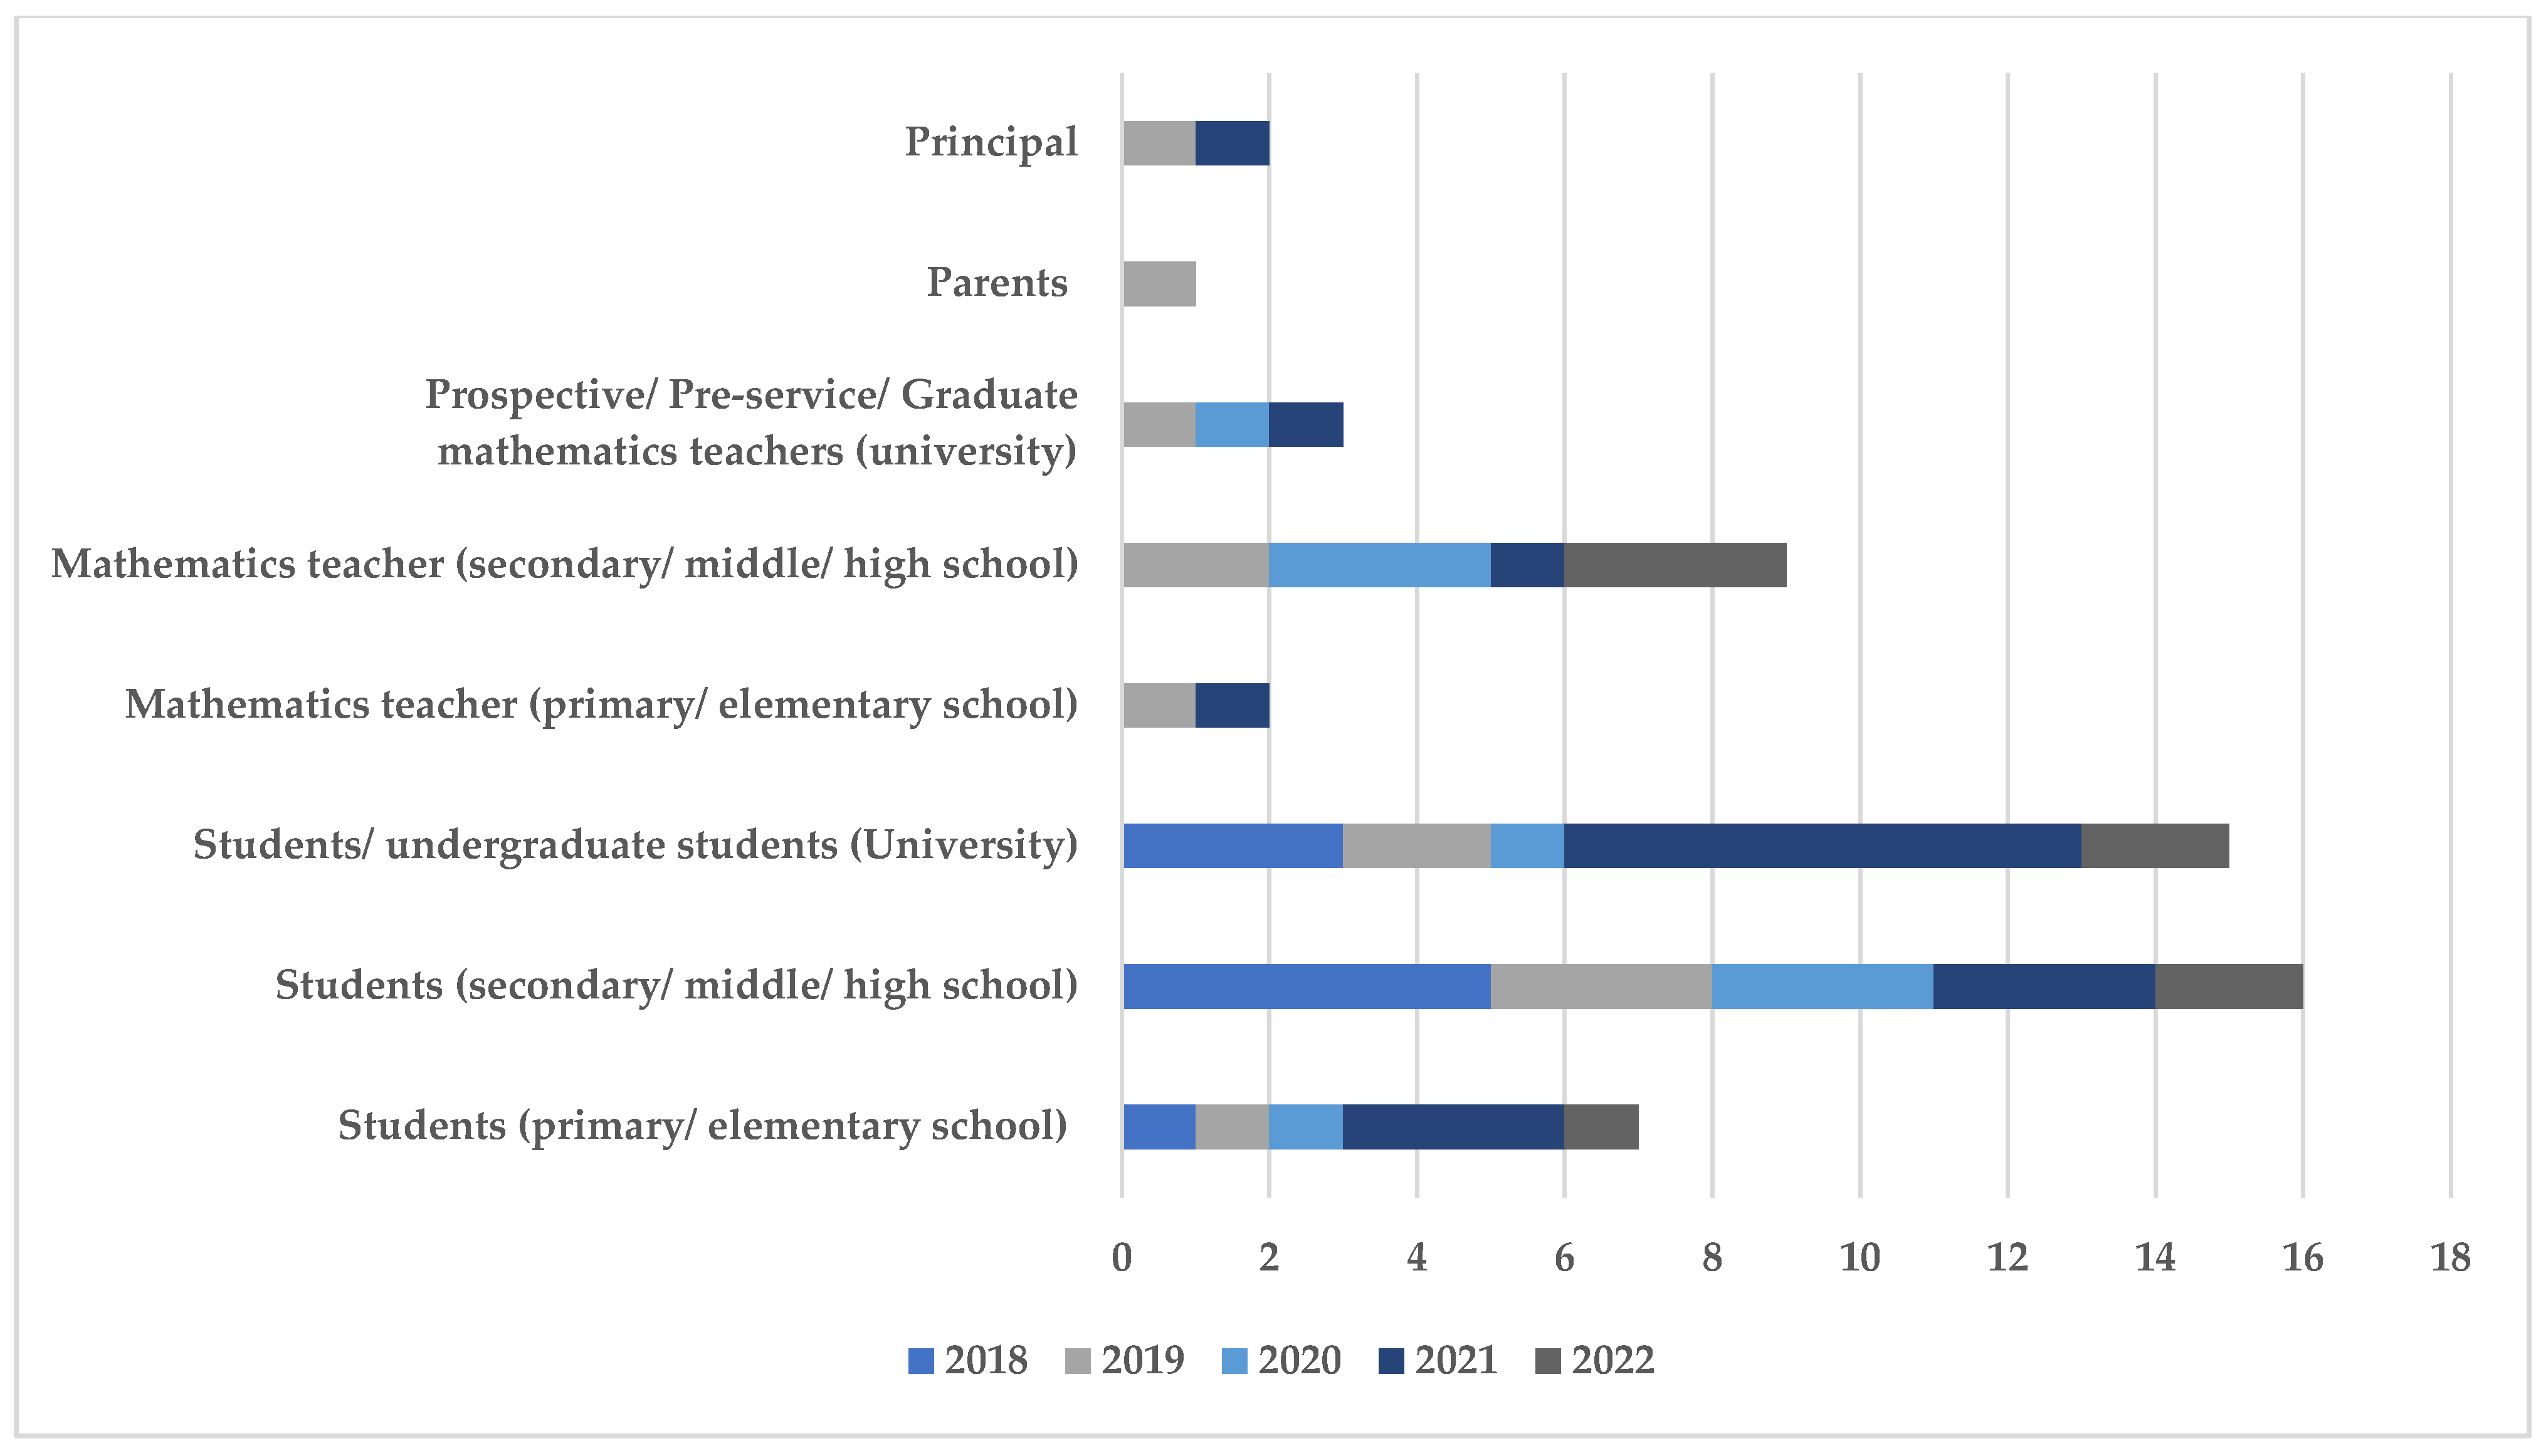
3.1.4. Distribution of Publications Based on Samples

The distribution of papers by sample is shown in Figure 5. Articles that prioritize the students from secondary/middle/high school (N = 16) are commonly found, followed by students/undergraduate students from university (N = 15), mathematics teachers from secondary/middle/high school (N = 9), students from primary/elementary school (N = 7), prospective/pre-service/graduate mathematics teachers from university (N = 3), mathematics teachers from primary/elementary school (N = 2), principal (N = 2), and parents (N = 1). Samples from students were high (N = 28) compared to others. All eight categories of samples were fully discussed in 2019, but not in other years. Other samples might appear, such as learners, educators, pre-school students, pre-school mathematics teachers, novice/in-service mathematics teachers, lectures, professors, doctors, and so on, but this review solely covered empirical articles from 2018 to 2022.

3.2. Main Findings

Proper SEM statistical applications are considered vital for good SEM results. This notwithstanding, SEM statistical applications in mathematics are a cause for concern. The question “Which statistical application should I use for my data analysis in SEM?” is commonly asked by numerous scholars [25]. There are no trends that attempt to steer clear of direct answers to such inquiries; instead, recommendations are made that readers read papers with proper direction. By implementing the proper SEM statistical applications in SEM approaches in mathematics education, these issues could be resolved. Thus, we feel a little pressured and motivated by the requirement to offer a thorough evaluation of these applications by a systematic review in order to comply with requests, as well as to close the gap.
The study in [79] highlighted that systematic reviews are inspiring, valuable, and essential for identifying the precedence of future research and the range of human knowledge in order to reach an appropriate and authoritative conclusion. Thus, it is believed that the findings of this systematic review can aid researchers in better comprehending and choosing appropriate statistical analysis tools in the field of mathematics. Therefore, for the thematic analysis, 47 articles were reviewed over two themes, namely CB-SEM and VB-SEM/PLS-SEM statistical applications, to overcome the issues undertaken in mathematics education. The studies included are displayed in Table 3. A total of six sub-themes were found based on the two themes reviewed in this systematic review. The following sub-topics provide an overview for each of the themes and their sub-themes.
According to Table 3, the authors offer a systematic review to explore the optimal choice of SEM statistical software packages for sustainable mathematics education. The authors used the PRISMA protocol for the systematic review, which has four phases. Starting with the identification phase in three databases (Scopus, WoS, and ERIC), the authors identified 396 studies in total, from which the sample was reduced over the next three phases to a total of 47 articles. Based on the author’s findings, there are six software packages that emerged: Lisrel (N = 4), Amos (N = 11), Mplus (N = 7), SmartPLS (N = 23), the R package (plspm) (N = 1), and WarpPLS (N = 2). Nevertheless, the findings led to the identification that two packages, namely SmartPLS (VB-SEM/PLS-SEM) and Amos (CB-SEM), have been highly considered by researchers in mathematics education.

3.2.1. CB-SEM Statistical Applications

The CB-SEM statistical software applications in this systematic review were classified into three categories—Lisrel, Amos, and Mplus. For an appropriate categorization of statistical software package implementation in the context of mathematics fields based on the literature review, these subgroups were designed. Table 4 depicts the different types of categorizations together with the associated articles (N = 22) that were employed in this study. As displayed in Table 4, four articles were connected to the implementation of Lisrel in the field of mathematics. Results from Lisrel v.9.20 highlighted the significance of the attitudes and behavior of teachers, parents, and students in TIMSS scores [84]. Using Lisrel v.8.80, the factors that affect the difficulty of students learning mathematics (campus environment, family environment, community environment, and seating) significantly affected the students’ self [90]. The data analyses in [99] used descriptive statistics, confirmatory factor analysis (CFA), and SEM. Furthermore, findings illustrated that the levels of all aspects of students’ mathematics anxieties (N = 109) in online mathematics learning were at the medium level. The authors included further outcomes that showed that other than physiological and behavioral, two anxiety aspects—affective and cognitive—affected mathematics learning achievement. As such, ref. [111] noted a positive correlation between blended professional training on mathematics teachers’ creativity and their teaching effectiveness through the Lisrel program.
On top of that, also included in this review were 11 studies that demonstrated Amos as another type of proprietary statistical software package used in mathematics (Table 4). The SEM was run in Amos (v.23) to test the various hypotheses in the first four studies [80,81,82,83]. Yarhands Dissou Arthur, being a main author for these studies, emphasized that the results of the studies were positive. For instance, school-related factors and ICT training significantly enhanced the perceived ease of use and perceived usefulness of ICT by mathematics teachers [80]. Among senior high school students (N= 321) in Ghana, peer tutoring, teaching quality, and motivation had significant positive effects on mathematics achievement [83]. The path analysis by using Amos in another study exhibits that the mediating role of student learning interest partially mediated the relationships between learning motivation and mathematics performance, as well as between teaching quality and mathematics performance [82]. In [81], the additional variables, among which was airline, however, show that there is no significant effect on mathematics achievement. On the contrary, the effect of peer-assisted mathematics learning on mathematics performance was fully mediated by students’ learning interest. The Amos version 23, continued by [117] with findings, shows that learning intentions, success criteria, and peer assessments are significant predictors of teachers’ evaluating skills.
In [91], the CFA method by AMOS (v.18) software verified that the questionnaire of achievement goal was appropriate for the context of Indonesian students. The authors also mentioned that 538 Indonesian students adopted other avoidance and self-approach goals in order to determine the nature of achievement goals in mathematics education programs. Likewise, refs. [92,93] handled AMOS (v.18). A study from [92] demonstrates that while task and self-approach had a significant and positive impact on mathematical modeling competency, task avoidance goals had a significant and detrimental impact. Furthermore, the findings depicted that metacognition and mathematical modeling had a direct correlation that was statistically significant [93]. Additionally, the authors argued that the interrelationships between mathematical modeling competency and metacognitive strategies are considerably moderated by academic year level, which acts as a partial moderator. By utilizing the other version of Amos, which is v.22, the results from [109] reflect how TAM constructs significantly influence the acceptance of e-books among mathematics and statistics students at universities. A discussion in [119] was related to the interrelationships between these factors and the learning effects on advanced mathematics. The result of the study revealed that the affective support of teachers is positively correlated with students’ learning cognition and learning self-efficacy. These data were analyzed using software AMOS (v.19). Although the author used an old version of Amos, version 7.0, the outcome was stable by illustrating that effective teaching strategies and student achievement are positively and significantly impacted by principal evaluation [97].
Mplus is the other type of statistical software that is considered in this review apart from Lisrel and Amos. Most of the studies revealed a positive finding regarding the integration of the Mplus tool in SEM analysis. For instance, there is a significant connection between students’ cognitive appraisals with enjoyment and mathematics anxiety [106], and punishment sensitivity with psychological strain (motivational appraisals and task achievement) [107]. Moreover, in fourth grade, students who participate in more early numeracy activities at home are more likely to perform well in mathematics [94]. Next, authors ran an SEM mediation path analysis using MPlus software [100]. Based on this review, the output from Mplus indicated significant direct and indirect effects for all pathways (math attitude, math pre-test, math digital game use, helping affordance perception, hindering affordance perception, post-test performance) for all 187 children. In [112], the cross-lagged models were computed using Mplus v.7.3 to test the reciprocal effects between self-determined motivation (intrinsic and identified motivation) and negative emotions (anxiety, anger, and boredom) in mathematics. The authors claimed that regarding the influence of students’ emotions on their motivation, the relationship had a consistent direction for all emotions. Furthermore, the results from Mplus v.7.02 emphasized the value of parental interactions and the necessity of putting into action effective strategies for fostering parental interactions [108]. According to survey data analyzed using SEM by Mplus v.7.31, students’ perceptions of the effectiveness of teachers’ feedback delivery and perceived scaffolding positively predicted students’ use of feedback, whereas perceived monitoring adversely predicted the use of feedback [98].

3.2.2. VB-SEM/PLS-SEM Statistical Applications

The authors of 26 articles were quite enthusiastic regarding VB-SEM/PLS-SEM statistical software applications, as seen by the fact that most of them embraced it in their articles. The articles that addressed VB-SEM/PLS-SEM statistical applications in the context of mathematics are presented in Table 5. Findings indicate that most authors discussed the smartPLS as an analysis tool for SEM analysis. Based on the data gathered from the sample, each study (N = 23) using SmartPLS showed a significant and positive relationship between endogenous and exogenous variables, as illustrated in Table 6. Another type of VB-SEM/PLS-SEM statistical software application is plspm from R packages. The authors in [107] proved from their studies that the integration of the R package (plspm) in the mathematics classroom showed a significant relationship between eighth graders’ temperamental reward and punishment sensitivities and their motivational appraisals (interest, strain, effort). As illustrated in Table 5, two articles mentioned the choice of WarpPLS, especially versions 5.0 and 6.0, to analyze SEM in their studies. These two articles [86,120] have similar findings whereby the implementation of WarpPLS in mathematics education provides benefits to the research findings of SEM. For example, the individual institutional leadership model had a significant and favorable impact on scientific output [86]. The findings from [120] revealed that because teachers offer greater possibilities for content engagement, in-class computer use was indirectly related to mathematical achievement.

4. Discussion

The review’s main findings betokened the various types of proprietary statistical software packages used in analysis of CB-SEM and VB-SEM/PLS-SEM in the field of mathematics. Ultimately, the results led to the identification of numerous statistical applications: Lisrel, Amos, Mplus, SmartPLS, R package (plspm), and WarpPLS. This notwithstanding, the results of this review revealed that, when compared to the other five statistical applications, smartPLS was the most extensively used in the domain of mathematics. This demonstrates that smartPLS is increasingly commonly employed to solve the SEM analysis that mathematics researchers encountered, especially in VB-SEM/PLS-SEM. Findings indicated that 23 studies showed a significant positive correlation among the variables employed. Through a sophisticated reporting feature, a user-friendly interface, advanced reporting capabilities, and availability at no cost to academics and researchers, the software has gained popularity in mathematics. Being a freely available and graphical user interface software, it was designed in a contemporary Java-based programming environment [25]. Following the 2003 launch of the initial online version, SmartPLS 2 was released in 2005. The program was updated and extended in 2015 [27]. The software has been developed to be very applicable and user-friendly to assist experts and beginners in creating scientifically sound and state-of-the-art VB-SEM/PLS-SEM analyses [121].
To enhance modeling and analysis capabilities, regular upgrades and additions are offered. Current versions of Apple and Microsoft operating systems are also compatible with the application. In addition, many analytical functions were automated in the subsequent iteration of SmartPLS, and PLS-SEM applications in journals expanded substantially [4]. Since it is known as a scientifically grounded software, it strives to provide complete transparency on how results are computed mathematically in order to ensure the repeatability of outcomes. Results from SmartPLS are presented in neatly organized tables and, in certain cases, in illuminating results graphics [122,123]. Additionally, users can save the outcomes or reports in Excel, HTML, and R formats for subsequent use or collaboration with others [25]. If there are subgroups spanning the entire theoretical model simultaneously, the SmartPLS software has numerous methods for finding them. These methods belong to the broad category of models known as latent class methods [4]. Although smartPLS was identified as the most prevalent statistical application in the mathematical perspective, other types of proprietary statistical software packages play an important part in SEM analysis, and their contributions cannot be discounted. For instance, becoming a growing trend in mathematics next to SmartPLS, Analysis of Moment Structures, or Amos for short, revealed a significant and favorable impact on the variables that were examined in 11 studies. Amos is known by another name: IBM SPSS AMOS. This software (Amos Development Corporation, 1983–2013) is for Windows computers. The authors in [22] emphasized that Amos is composed of two primary components: Amos Graphics and a separate Program Editor for working with Amos syntax. Having a fantastic graphical user interface, Amos can be quickly accessible and has an organized output format. It incorporates special features, such as a search for specifications in the absence of theory, diverse bootstrapping options, and a restricted application of Bayesian estimation. A highly intriguing feature of AMOS has been created within the Microsoft Windows interface, enabling mathematics researchers to either directly write the equation statements via AMOS graphics, or to specify the model by drawing a path diagram illustrating the relationships between variables.
However, since AMOS graphics offer all the tools that will ever be required for developing and dealing with SEM path diagrams, researchers will always choose to leverage it to easily detect relationships between the variables [21]. This software is most suitable and practical to use for post-graduates because they can convert the research framework into IBM-SPSS-AMOS graphics for analysis [6,7]. In addition to being a module in SPSS, AMOS is one of the first SEM tools that largely relies on a graphical interface for all functions, so researchers never have to use syntactic commands or computer code [4]. Through AMOS software, mathematics researchers can test the validity and reliability of a construct measurement model built by using the CFA procedure. After completing the CFA report, the mathematics researcher can model all these constructs into a structural model for analysis. Therefore, this resource is the best and most user-friendly method for analyzing and testing a theory [6,7]. The literature has underlined that although Amos is under CB-SEM, somehow it can handle analysis of PLS-SEM [124]. Although SmartPLS and Amos dominated among other software packages in mathematics education, Lisrel, Mplus, R package (Plpsm), and WarpPLS still have different strengths, special features, areas of improvement, estimation methods, and limitations that could influence a researcher’s choice. For instance, like Amos, the other two packages, Lisrel and Mplus, allow users to estimate parameters for models with well-defined structures [35] and present a specific version of the maximum likelihood for incomplete data files that operate in the way just explained [22]. The main difference between these packages is the presence of a graphical interface for model specification and results presentation. Historically, the first commercial CB-SEM program to become widely used was LISREL [9,125,126], although it was not the first software to perform path analysis or SEM [126]. The name was derived from LInear Structural RELations [4]. LISREL is a versatile program that may be applied in a wide range of contexts (including cross-sectional, experimental, quasi-experimental, and longitudinal investigations) and at one point nearly entirely replaced SEM.
Next, a modeling program with numerous approaches, called Mplus, also includes a graphical user interface [127]. Despite the fact that there are several software packages available today, most require data that are continuous. In several types of analysis, Mplus permits the use of binary, ordinal, and censored variables. As if that were not enough, Mplus integrates some types of analysis that are difficult to access in other statistical packages (such as latent class analysis) and enables the researcher to use novel approaches that are not available elsewhere, like exploratory structural equation modeling (ESEM) [26]. Furthermore, Mplus has a very active community where mathematics researchers can get troubleshooting assistance if needed. The other VB-SEM/PLS-SEM software program that is still under active development is WarpPLS. Like SmartPLS, WarpPLS is very user-friendly with its modeling interface, and analyses may be carried out without any programming knowledge. The program has a graphical user interface for variance-based and factor-based SEM, employing classic composite-based PLS and more modern factor-based techniques [25]. Unlike SmartPLS, WarpPLS is categorized under commercial software. Hence, it was developed by Ned Kock in 2009. WarpPLS’s capacity to recognize and model non-linearity among variables in path models, whether these variables are measured as latent variables or not, is one of its key advantages. This capability results in parameters that take relevant underlying heterogeneity into consideration. However, plspm is an R package including a collection of functions for doing PLS-PM analysis on both metric and non-metric data, as well as REBUS analysis. The project began in the fall of 2005 [14]. The first R package for PLS-PM was released in 2009, almost four years later. The absence of a graphical interface for creating path diagrams is one of the primary distinctions between plspm and other PLS-PM applications [14].
In a nutshell, although the first commercial software that appeared on the market was LISREL, other statistical software programs and approaches have emerged over time [9]. SEM is a versatile approach to examining how things are related to each other in the context of mathematics. Therefore, SEM statistical applications can appear quite different [10]. Findings of a review revealed that among 47 articles, a total of 26 studies were analyzed through VB-SEM/PLS-SEM statistical applications, whereas 22 publications were examined through the CB-SEM software packages. The trends reflects that these six SEM tools were the optimal choices among researchers in mathematics education at present. To ensure inclusive and equitable quality education and create opportunities for lifelong learning in the mathematical landscape, each mathematics researcher used relevant statistical software to undertake their analysis, although their features are varied. Some statistical applications are more established and provide a wide range of mathematical analysis, whilst the rest are newer and focus on a specific sort of analysis. Thus, trying to identify which is best would be an incorrect approach, since there are several advocates and users of each application. Each package differs in terms of strengths, limitations, areas of improvement, and special features that may dictate the choice of selection in the field of mathematics, as indicated by the findings of this systematic review.

5. Conclusions

To explore the latest trends of multiple CB-SEM and VB-SEM/PLS-SEM statistical applications in mathematics education was the aim of this systematic review. This research thereby fills the gap left by the paucity of systematic reviews on SEM statistical applications in mathematics. Additionally, this research covers a knowledge gap in lifelong learning through research trends on optimal choices of proprietary statistical software packages in SEM approaches, which may be essential for achieving the SDG4. Three databases have been included to retrieve 47 potential articles in accordance with the guidelines issued by PRISMA. Dealing with those studies showed the same results according to each statistical application. No study shows significantly different results, and suspicion was not raised [128]. The main findings have sought to explain that there are six different commercial/free software packages with “stand alone”/“packages” CB-SEM and VB-SEM/PLS-SEM applications, respectively, with graphical user interfaces that were identified, namely Lisrel, Amos, Mplus, SmartPLS, WarpPLS, and R package (plspm). This indicated that those statistical applications have been the optimal choices for researchers in the field of mathematics.
Although six SEM statistical application trends emerged from this review, the results add to our understanding that SmartPLS (VB-SEM/PLS-SEM) and Amos (CB-SEM) have been highly considered by researchers in mathematics education. This result was in tandem with earlier research indicating that SmartPLS and Amos were the best software packages for SEM approaches [9]. Recently, in a bibliometric review, ref. [129] analyzed 164 documents from Brazilian journals from the EBSCO and PROQUEST database during 1996–2015. They pointed out that the nearly 50% of publications (N = 82) used Amos, followed by 30% of articles using the SmartPLS (N = 31) and Lisrel (N = 19). AMOS (part of SPSS) was the most frequently used software, with 13 papers (40.6%) found in other systematic reviews that were conducted in 2009 [130]. On the contrary, Mplus, with 23 studies (37.0%), dominated Amos and Lisrel, with 14 studies (24.0%) each in another review [131]. Furthermore, findings from other reviews portrayed SmartPLS [121] and Amos [132] as comprehensive software programs compared to others. This implies that in order to facilitate diverse analyses, SmartPLS and Amos will, in essence, be gradually developed in the coming years. By gaining notoriety, both can be predicted to have a successful future and will keep solidifying their position as premier standard statistical software solutions for research in mathematics education.
This study has several limitations. The first limitation of the study is that only six statistical applications were the subject of this paper. The other SEM statistical applications were not mentioned as a trend in this review. This limitation undoubtedly creates new possibilities in the future, particularly in terms of choosing mathematics research for other different SEM statistical applications. Second, this review was conducted only using three databases: Scopus, WoS, and Eric. Consequently, incorporating articles from additional databases could produce various outcomes; therefore, further studies can investigate the same subjects by including more articles from different databases such as Mendeley, Google Scholar, Semantic scholar, Dimension.ai, PsycInfo, Science Direct, Ebsco, Proquest, Social Science Citation Index (SSCI), and so on. The study’s exclusion of dissertations, theses, and manuscripts produced in languages other than English is its third limitation. Fourth, this review used literature from the last five years. Therefore, a longer time span should be used in literature review studies in the future. It was observed that contrasting CB-SEM and VB-SEM/PLS-SEM applications in a single review may produce a comparison between the statistical applications and their respective analytical techniques. Consequently, the future review should focus on either CB-SEM or VB-SEM/PLS-SEM applications separately in mathematics education.
Next, other statistical applications, such as R packages (sem, Lavaan and OpenMx) [21,35], EQS, PROC CALIS (SAS) [35], ADANCO [25], EQS [130], Stata, DEA Warwick, EBTs, and EQS [129], have been discussed in the respective prior reviews. Some of the articles examined in this review did not describe those statistical applications. Future studies could examine the relationships between learners, educators, academics, and context in order to further assess those statistical applications in mathematics education. Despite its limitations, this study makes a few vital contributions and implications to the body of knowledge relating to mathematics education and to practical concerns. The outcomes of this review function as a manual to help mathematics users and practitioners understand the unique characteristics of each SEM software program and decide which is best for their research, resulting in closing the gap found in the field of mathematics. Even though there are numerous statistical analysis programs in SEM approaches available on the market, when they are applied properly with the suitable research design and procedures, there is little difference between these programs in terms of their findings. Thus, it was recommended that mathematics researchers and interested parties should comprehend the most recent SEM statistical application adaptations and strategically select an appropriate application based on their research questions and design, as well as their pertinence to the system of education in the respective country for sustainable mathematics education. We hope that this systematic review will act as a springboard for understanding the various applications in SEM approaches before making the best decision in mathematics education, as well as contribute to the knowledge gap in promoting lifelong learning via SEM statistical applications, which could be valuable for achieving the fourth SDG, especially in the area of mathematics.

Author Contributions

Conceptualization, D.S., S.M.M. and M.E.E.M.M.; methodology, S.M.M. and M.E.E.M.M.; software, D.S.; validation, D.S., S.M.M. and M.E.E.M.M.; writing—original draft preparation, D.S.; writing—review and editing, D.S., S.M.M. and M.E.E.M.M.; visualization, D.S.; supervision, S.M.M. and M.E.E.M.M. All authors have read and agreed to the published version of the manuscript.

Funding

This research was funded by the Universiti Kebangsaan Malaysia, grant number GG-2022-021 and GG-2020-026.

Institutional Review Board Statement

Not applicable.

Informed Consent Statement

Not applicable.

Data Availability Statement

Not applicable.

Acknowledgments

The authors would like to thank the anonymous reviewers for the valuable comments and suggestions regarding improving the quality, content, and presentation of this paper.

Conflicts of Interest

The authors declare no conflict of interest.

References

  1. Ramalingam, S.; Yunus, M.M.; Hashim, H. Blended Learning Strategies for Sustainable English as a Second Language Education: A Systematic Review. Sustainability 2022, 14, 8051. [Google Scholar] [CrossRef]
  2. Boeren, E. Understanding Sustainable Development Goal (SDG) 4 on “quality education” from micro, meso and macro perspectives. Int. Rev. Educ. 2019, 65, 277–294. [Google Scholar] [CrossRef]
  3. Hogan, D.; O’Flaherty, J. Exploring the nature and culture of science as an academic discipline: Implications for the integration of education for sustainable development. Int. J. Sustain. High. Educ. 2022, 23, 120–147. [Google Scholar] [CrossRef]
  4. Hair, J.J.F.; Black, W.C.; Babin, B.J.; Anderson, R.E. Multivariate Data Analysis, 8th ed.; Cengage Learning EMEA: Andover, UK, 2019. [Google Scholar]
  5. Mondiana, Y.Q.; Pramoedyo, H.; Sumarminingsih, E. Structural Equation Modeling on Likert Scale Data with Transformation by Successive Interval Method and with No Transformation. Int. J. Sci. Res. Publ. 2018, 8, 398–405. [Google Scholar] [CrossRef]
  6. Awang, Z. SEM Made Simple, a Gentle Approach to Learning Structural Equation Modelling; MPWS Rich Publication: Selangor, Malaysia, 2015. [Google Scholar]
  7. Awang, Z.; Lim, S.H.; Awang, N.F. Pendekatan Mudah SEM: Structural Equation Modelling; MPWS Rich Publication: Selangor, Malaysia, 2018. [Google Scholar]
  8. Hair, J.F.J.; Hult, G.T.M.; Ringle, C.M.; Sarstedt, M.; Danks, N.P.; Soumya, R. Review of Partial Least Squares Structural Equation Modeling (PLS-SEM) Using R: A Workbook; Springer Nature: Cham, Switzerland, 2021. [Google Scholar]
  9. Alcaraz, J.L.G.; Vargas, A.R. Algorithms and Computational Techniques Applied to Industry; Springer Nature: Cham, Switzerland, 2022. [Google Scholar]
  10. Hair, J.F.; Hult, G.T.M.; Ringle, C.M.; Sarstedt, M. A Primer on Partial Least Squares Structural Equation Modeling (PLS-SEM), 2nd ed.; Sage: Thousand Oaks, CA, USA, 2014. [Google Scholar]
  11. Jaya, I.G.M.; Hermina, N.; Sunengsih, N. CB-SEM and VB-SEM: Evaluating Measurement model of Business Strategy of Internet Industry in Indonesia. Int. J. Sci. Eng. Res. 2019, 10, 878–883. [Google Scholar]
  12. Mohamad, M.; Afthanorhan, A.; Awang, Z.; Mohammad, M. Comparison between CB-SEM and PLS-SEM: Testing and confirming the Maqasid Syariah quality of life measurement model. J. Soc. Sci. Res. 2019, 5, 608–614. [Google Scholar] [CrossRef]
  13. Henseler, J.; Hubona, G.; Ray, P.A. Using PLS path modeling in new technology research: Updated guidelines. Ind. Manag. Data Syst. 2016, 116, 2–20. [Google Scholar] [CrossRef]
  14. Sanchez, G. PLS Path Modeling with R. R Package Notes 235. 2013. Available online: http://gastonsanchez.com/PLS_Path_Modeling_with_R.pdf (accessed on 10 October 2022).
  15. Rigdon, E.E.; Sarstedt, M.; Ringle, C.M. On comparing results from CB-SEM and PLS-SEM: Five perspectives and five recommendations. Mark. ZFP 2017, 39, 4–16. [Google Scholar] [CrossRef]
  16. Petter, S. “Haters gonna hate”: PLS and information systems research. ACM SIGMIS Database DATABASE Adv. Inf. Syst. 2018, 49, 10–13. [Google Scholar] [CrossRef]
  17. Chin, W.W.; Cheah, J.-H.; Liu, Y.; Ting, H.; Lim, X.-J.; Cham, T.H. Demystifying the role of causal-predictive modelling using partial least squares structural equation modelling in information systems research. Ind. Manag. Data Syst. 2020, 120, 2161–2209. [Google Scholar] [CrossRef]
  18. Nejati, M.; Rabiei, S.; Chiappetta Jabbour, C.J. Envisioning the invisible: Understanding the synergy between green human resource management and green supply chain management in manufacturing firms in Iran in light of the moderating effect of employees’ resistance to change. J. Clean. Prod. 2017, 168, 163–172. [Google Scholar] [CrossRef]
  19. Albright, J.J.; Park, H.M. Confirmatory Factor Analysis using Amos, LISREL, Mplus, SAS/ STAT CALIS; Working Paper; The University Information Technology Services (UITS) Center for Statistical and Mathematical Computing, Indiana University, Indiana University Publishing: Bloomington, IN, USA, 2009; Available online: www.indiana.edu/~statmath (accessed on 15 October 2022).
  20. Marôco, J. Análise de Equações Estruturais: Fundamentos Teóricos, Software & Aplicações, 2nd ed.; Rolo & Filhos II, SA: Mafra, Portugal, 2014. [Google Scholar]
  21. El-Sheikh, A.A.; Abonazel, M.R.; Gamil, N. A Review of Software Packages for Structural Equation Modeling: A Comparative Study. Appl. Math. Phys. 2017, 5, 85–94. [Google Scholar]
  22. Kline, R.B. Principles and Practice of Structural Equation Modelling, 4th ed.; The Guilford Press: New York, NY, USA, 2016. [Google Scholar]
  23. Arbuckle, J.L. Amos 7.0 User’s Guide; SPSS Inc.: Chicago, IL, USA, 2014. [Google Scholar]
  24. Arbuckle, J.L. Amos (Version 25.0); Computer; IBM SPSS: Chicago, IL, USA, 2017. [Google Scholar]
  25. Memon, M.A.; Ramayah, T.; Cheah, J.-H.; Ting, H.; Chuah, F.; Cham, T.H. PLS-SEM Statistical Programs: A Review. J. Appl. Struct. Equ. Model. 2021, 5, i–xiv. [Google Scholar] [CrossRef] [PubMed]
  26. Kelloway, E.K. Using Mplus for Structural Equation Modeling, 2nd ed.; SAGE: Thousand Oaks, CA, USA, 2015. [Google Scholar]
  27. Ringle, C.M.; Wende, S.; Becker, J.M. SmartPLS 3; SmartPLS GmbH.: Boenningstedt, Germany, 2015. [Google Scholar]
  28. Kock, N. WarpPLS 6.0 User Manual. 2017. Available online: http://warppls.com/ (accessed on 21 October 2022).
  29. Henseler, J.; Dijkstra, T.K. ADANCO; GmbH & Co.: Kleve, Germany, 2015. Available online: http://www. compositemodeling.com (accessed on 27 October 2022).
  30. Chuah, F.; Memon, M.A.; Ramayah, T.; Cheah, J.H.; Ting, H.; Cham, T.H. PlS-SEM using R: An introduction to cSEM and SEMinR. J. Appl. Struct. Equ. Model. 2021, 5, 1–35. [Google Scholar] [CrossRef] [PubMed]
  31. Ray, S.; Danks, N.P.; Calero Valdez, A. R Package Seminr: Domain-Specifc Language for Building and Estimating Structural Equation Models Version 2.1.0 [Computer Software]. 2021. Available online: https://cran.r-project.org/web/packages/seminr/ (accessed on 25 October 2022).
  32. Rademaker, M.E.; Schuberth, F.; Schamberger, T.; Klesel, M.; Dijkstra, T.K.; Henseler, J. R Package cSEM: Composite-Based Structural Equation Modeling Version 0.3.0 [Computer Software]. 2020. Available online: https://cran.r-project.org/web/packages/cSEM/ (accessed on 24 October 2022).
  33. Monecke, A.; Leisch, F. R package semPLS: Structural Equation Modeling using Partial Least Squares Version 1.0–10 [Computer Software]. 2013. Available online: https://cran.r-project.org/web/ packages/semPLS/ (accessed on 2 November 2022).
  34. Sanchez, G.; Trinchera, L.; Russolillo, G. Plspm: Tools for Partial Least Squares Path Modeling (PLS-PM); R package: Boston, MA, USA, 2015. [Google Scholar]
  35. Narayanan, A. A review of eight software packages for structural equation modeling. Am. Stat. 2012, 66, 129–138. [Google Scholar] [CrossRef]
  36. Singh, V.K.; Singh, P.; Karmakar, M.; Leta, J.; Mayr, P. The journal coverage of Web of Science, Scopus, and Dimensions: A comparative analysis. Scientometrics 2021, 126, 5113–5142. [Google Scholar] [CrossRef]
  37. Selcuk, A.A. A Guide for Systematic Reviews: PRISMA. Turk. Arch. Otorhinolaryngol. 2019, 57, 57–58. [Google Scholar] [CrossRef]
  38. Mirazchiyski, P.V. RALSA: The R analyzer for large-scale assessments. Large-Scale Assess. Educ. 2021, 9, 21. [Google Scholar] [CrossRef]
  39. Ringienė, L.; Žilinskas, J.; Jakaitienė, A. ILSA Data Analysis with R Packages. In Modelling, Computation and Optimization in Information Systems and Management Sciences; Le Thi, H.A., Pham Dinh, T., Le, H.M., Eds.; MCO 2021. Lecture Notes in Networks and Systems; Springer: Cham, Switzerland, 2022; Volume 363. [Google Scholar]
  40. Serang, S.; Jacobucci, R.; Stegmann, G.; Brandmaier, A.M.; Culianos, D.; Grimm, K.J. Mplus Trees: Structural Equation Model Trees Using Mplus. MPLUS TREES 2021, 28, 127–137. [Google Scholar] [CrossRef]
  41. Wang, W.; Tien, L.; Du, Y. The Construction of the Influence Model of Artistic Creativity Based on AMOS Data Analysis. In 2021 International Conference on Big Data Analytics for Cyber-Physical System in Smart City. BDCPS 2021; Atiquzzaman, M., Yen, N., Xu, Z., Eds.; Lecture Notes on Data Engineering and Communications Technologies; Springer: Singapore, 2022; Volume 102. [Google Scholar]
  42. Wong, K.K.-K. Partial Least Squares Structural Equation Modeling (PLS-SEM) Techniques Using SmartPLS. Mark. Bull. 2013, 24, 1–32. [Google Scholar]
  43. Kraus, S.; Breier, M.; Dasi-Rodriguez, S. The art of crafting a systematic literature review in entrepreneurship research. Int. Entrep. Manag. J. 2020, 16, 1023–1042. [Google Scholar] [CrossRef]
  44. Mengist, W.; Soromessa, T.; Legese, G. Method for conducting systematic literature review and meta-analysis for environmental science research. MethodsX 2020, 7, 100777. [Google Scholar] [CrossRef] [PubMed]
  45. Subramaniam, S.; Maat, S.M.; Mahmud, M.S. Computational thinking in mathematics education: A systematic review. Cypriot J. Educ. 2022, 17, 2029–2044. [Google Scholar] [CrossRef]
  46. Abelha, M.; Fernandes, S.; Mesquita, D.; Seabra, F.; Ferreira-Oliveira, A.T. Graduate employability and competence development in higher education: A systematic literature review using PRISMA. Sustainability 2020, 12, 5900. [Google Scholar] [CrossRef]
  47. Sierra-correa, P.C.; Ricardo, J.; Kintz, C. Ecosystem-based adaptation for improving coastal planning for sea-level rise: A systematic review for mangrove coasts. Mar. Policy 2015, 51, 385–393. [Google Scholar] [CrossRef]
  48. Mohamed, R.; Ghazali, M.; Samsudin, M.A. A Systematic Review on Mathematical Language Learning Using PRISMA in Scopus Database. Eurasia J. Math. Sci. Technol. Educ. 2020, 16, em1868. [Google Scholar] [CrossRef]
  49. Moher, D.; Shamseer, L.; Clarke, M.; Ghersi, D.; Liberati, A.; Petticrew, M.; Shekelle, P.; Stewart, L.A. Preferred reporting items for systematic review and meta-analysis protocols (PRISMA-P) 2015 statement. Syst. Rev. 2015, 4, 1. [Google Scholar] [CrossRef]
  50. Pranckute, R. Web of Science (WoS) and Scopus: The Titans of Bibliographic Information in Today’s Academic World. Publications 2021, 9, 12. [Google Scholar] [CrossRef]
  51. Joshi, A. Comparison between Scopus & ISI Web of Science. J. Glob. Values 2016, 7, 976–9447. [Google Scholar]
  52. Li, K.; Rollins, J.; Yan, E. Web of Science use in published research and review papers 1997–2017: A selective, dynamic, cross-domain, content-based analysis. Scientometrics 2018, 115, 1–20. [Google Scholar] [CrossRef]
  53. Harzing, A.W.; Alakangas, S. Google Scholar, Scopus, and the Web of Science: A longitudinal and cross-disciplinary comparison. Scientometrics 2016, 106, 787–804. [Google Scholar] [CrossRef]
  54. Perevochtchikova, M.; De la Mora-De la Mora, G.; Hernández Flores, J.Á.; Marín, W.; Langle Flores, A.; Ramos Bueno, A.; Rojo Negrete, I.A. Systematic review of integrated studies on functional and thematic ecosystem services in Latin America, 1992–2017. Ecosyst. Serv. 2019, 36, 100900. [Google Scholar] [CrossRef]
  55. Snyder, H. Literature Review as a Research Methodology: An Overview and Guidelines. J. Bus. Res. 2019, 104, 333–339. [Google Scholar] [CrossRef]
  56. Xiao, Y.; Watson, M. Guidance on Conducting a Systematic Literature Review. J. Plan. Educ. Res. 2019, 39, 93–112. [Google Scholar] [CrossRef]
  57. Mariano, D.C.B.; Leite, C.; Santos, L.H.; Rocha, R.E.; de Melo-Minardi, R.C. A guide to performing systematic literature reviews in bioinformatics. arXiv 2017, arXiv:1707.05813. [Google Scholar]
  58. Page, M.J.; McKenzie, J.E.; Bossuyt, P.M.; Boutron, I.; Hoffmann, T.C.; Mulrow, C.D.; Shamseer, L.; Tetzlaff, J.M.; Akl, E.A.; Brennan, S.E.; et al. The PRISMA 2020 statement: An updated guideline for reporting systematic reviews. BMJ 2021, 372, 105906. [Google Scholar]
  59. Thornley, C.; Gibb, F. Meaning in philosophy and meaning in information retrieval (IR). J. Doc. 2009, 65, 133–150. [Google Scholar] [CrossRef]
  60. Grewal, A.; Kataria, H.; Dhawan, I. Literature search for research planning and identification of research problem. Indian J. Anaesth. 2016, 60, 635–639. [Google Scholar] [CrossRef]
  61. Meline, T. Selecting Studies for Systemic Review: Inclusion and Exclusion Criteria. Contemp. Issues Commun. Sci. Disord. 2006, 33, 21–27. [Google Scholar] [CrossRef]
  62. Nang, A.F.M.; Maat, S.M.; Mahmud, M.S. Teacher Technostress and Coping Mechanisms during COVID-19 Pandemic: A Systematic Review. Pegem Egit. Ve Ogretim Derg. 2022, 12, 200–212. [Google Scholar]
  63. Dawson, K.; Ferdig, R.E. Commentary: Expanding notions of acceptable research evidence in educational technology: A response to Schrum et al. Contemp. Issues Technol. Teach. Educ. 2006, 6, 133–142. [Google Scholar]
  64. González-Albo, B.; Bordons, M. Articles vs. proceedings papers: Do they differ in research relevance and impact? A case study in the Library and Information Science field. J. Informetr. 2011, 5, 369–381. [Google Scholar] [CrossRef]
  65. Rahman, N.A.; Rosli, R.; Rambely, A.S.; Halim, L. Mathematics teachers’ practices of stem education: A systematic literature review. Eur. J. Educ. Res. 2021, 10, 1541–1559. [Google Scholar]
  66. Okoli, C. A guide to conducting a standalone systematic literature review. Commun. Assoc. Inf. Syst. 2015, 37, 879–910. [Google Scholar] [CrossRef]
  67. Singh, G.; Haddad, K.M.; Chow, C.W. Are articles in “top” management journals necessarily of higher quality? J. Manag. Inq. 2007, 16, 319–331. [Google Scholar] [CrossRef]
  68. Bybee, R.W. The Case for STEM Education: Challenges and Opportunities; National Science Teachers Association: Arlington, VI, USA, 2013. [Google Scholar]
  69. Vasquez, J.; Sneider, C.; Comer, M. STEM Lesson Essentials, Grades 3–8: Integrating Science, Technology, Engineering, and Mathematics; Heinemann: Portsmouth, NH, USA, 2013. [Google Scholar]
  70. Pittaway, L.; Holt, R.; Broad, J. (Eds.) Synthesising Knowledge in Entrepreneurship Research: The Role of Systematic Literature Reviews (Handbook of Research on Small Business and Entrepreneurship); Edward Elgar: London, UK, 2014. [Google Scholar]
  71. Albelbisi, N.A.; Yusop, F.D. Secondary School Students’ Use of and Attitudes toward Online Mathematics Homework. TOJET Turk. Online J. Educ. Technol. 2018, 17, 144–153. [Google Scholar]
  72. Albelbisi, N.A. The Effect of Web-based Homework on Student’s Mathematics Self-Efficacy. Int. J. Technol. Math. Educ. 2021, 27, 181–190. [Google Scholar]
  73. Albelbisi, N.A.; Al-Adwan, A.S.; Habibi, A.; Rasool, S. The relationship between students’ attitudes toward online homework and mathematics anxiety. Int. J. Math. Educ. Sci. Technol. 2022. [Google Scholar] [CrossRef]
  74. Jeong, J.S.; González-Gómez, D. Flipped-ocn method in mathematics learning to analyze the attitudes of pre-service teachers. Mathematics 2021, 9, 607. [Google Scholar] [CrossRef]
  75. Khan, T.; Thomas, S. Promoting Positive Education through Constructivist Digital Learning Heutagogy: An Intervention Outcome. J. Learn. Dev. 2022, 9, 305–316. [Google Scholar] [CrossRef]
  76. Sawyerr, A.; Agyei, D.D. Mathematics teachers’ use of ICT in classroom instruction: Exploring the will-skill-tool-pedagogy model in the Ghanaian context. Educ. Inf. Technol. 2022. [Google Scholar] [CrossRef]
  77. Robinson, P.; Lowe, J. Literature reviews vs systematic reviews. Aust. N. Z. J. Public Health 2015, 39, 103. [Google Scholar] [CrossRef] [PubMed]
  78. Hodgkinson, G.P.; Ford, J.K. What makes excellent literature reviews excellent? A clarification of some common mistakes and misconceptions. J. Organ. Behav. 2015, 36, S1–S5. [Google Scholar] [CrossRef]
  79. Higgins, J.P.T.; Thomas, J.; Chandler, J.; Cumpston, M.; Li, T.; Page, M.J.; Welch, V.A. Cochrane Handbook for Systematic Reviews of Interventions, 2nd ed.; John Wiley & Sons: Hoboken, NJ, USA, 2019. [Google Scholar]
  80. Arthur, Y.D. Mathematics Teachers’ Acceptance of ICT in Teaching and Learning: An Extended Technology Acceptance Model. Probl. Educ. 21st Century 2022, 80, 408–425. [Google Scholar] [CrossRef]
  81. Arthur, Y.D.; Dogbe, C.S.K.; Asiedu-Addo, S.K. Modeling students’ mathematics achievement and performance through teaching quality: SERVQUAL perspective. J. Appl. Res. High. Educ. 2021, 14, 1509–1523. [Google Scholar] [CrossRef]
  82. Arthur, Y.D.; Dogbe, C.S.K.; Asiedu-Addo, S.K. Enhancing Performance in Mathematics Through Motivation, Peer Assisted Learning, And Teaching Quality: The Mediating Role of Student Interest. Eurasia J. Math. Sci. Technol. Educ. 2022, 18, em2072. [Google Scholar] [CrossRef]
  83. Arthur, Y.D.; Boadu, S.K.; Asare, B. Effects of Peer Tutoring, Teaching Quality and Motivation on Mathematics Achievement in Senior High Schools. Int. J. Educ. Sci. 2022, 37, 35–43. [Google Scholar]
  84. Badri, M. School emphasis on academic success and TIMSS science/math achievements. Int. J. Res. Educ. Sci. 2019, 5, 176–189. [Google Scholar]
  85. Başaran, B. Investigating science and mathematics teacher candidate’s perceptions of TPACK-21 based on 21st century skills. Elem. Educ. Online 2020, 19, 2212–2226. [Google Scholar]
  86. Cardona, R.S. The Enablers and Outcomes of Research Productivity among Junior High School Mathematics Teachers: A Structural Model. Eurasia J. Math. Sci. Technol. Educ. 2020, 16, em1901. [Google Scholar] [CrossRef]
  87. Chen, C.L.; Wu, C.C. Students’ behavioral intention to use and achievements in ICT-Integrated mathematics remedial instruction: Case study of a calculus course. Comput. Educ. 2020, 145, 103740. [Google Scholar] [CrossRef]
  88. Cob, Z.C.; Ali, N.; Ramli, R. An empirical evidence of geometers’ sketchpad acceptance. Int. J. Eng. Adv. Technol. 2019, 9, 3436–3439. [Google Scholar] [CrossRef]
  89. Davadas, S.D.; Lay, Y.F. Factors affecting students’ attitude toward mathematics: A structural equation modeling approach. Eurasia J. Math. Sci. Technol. Educ. 2018, 14, 517–529. [Google Scholar]
  90. Elastika, R.W.; Sukono; Dewanto, S.P. Analysis of factors affecting students’ mathematics learning difficulties using sem as information for teaching improvement. Int. J. Instr. 2021, 14, 281–300. [Google Scholar]
  91. Hidayat, R.; Syed Zamri, S.N.A.; Zulnaidi, H. Exploratory and confirmatory factor analysis of achievement goals for indonesian students in mathematics education programmes. Eurasia J. Math. Sci. Technol. Educ. 2018, 14, em1648. [Google Scholar] [CrossRef]
  92. Hidayat, R.; Zamri, S.N.A.S.; Zulnaidi, H. Does mastery of goal components mediate the relationship between metacognition and mathematical modelling competency? Educ. Sci. Theory Pract. 2018, 18, 579–604. [Google Scholar]
  93. Hidayat, R.; Syed Zamri, S.N.A.; Zulnaidi, H.; Abdullah, M.F.N.L.; Adnan, M. The Interrelationships between Metacognition and Modeling Competency: The Moderating Role of the Academic Year. Eur. J. Educ. Res. 2021, 10, 1853–1866. [Google Scholar] [CrossRef]
  94. Hwang, S. Examining the effect of students’ early numeracy activities at home on later mathematics achievement via early numeracy competencies and self-efficacy beliefs. Int. Electron. J. Elem. Educ. 2020, 13, 47–56. [Google Scholar] [CrossRef]
  95. Irakleous, P.; Christou, C.; Pitta-Pantazi, D. Mathematical imagination, knowledge, and mindset. ZDM Math. Educ. 2022, 54, 97–111. [Google Scholar] [CrossRef]
  96. Ji, R.; Yue, X.; Zheng, X. Using PLS-SEM to Examine the Structure of First-year University Students’ Mathematics-related Beliefs. High. Educ. Stud. 2021, 11, 7. [Google Scholar] [CrossRef]
  97. Kazi, M. Instructional leadership: Teaching evaluation as a key element for 6th grade student’s achievement in mathematics. Int. J. Educ. Manag. 2021, 35, 1191–1204. [Google Scholar] [CrossRef]
  98. Kyaruzi, F.; Strijbos, J.W.; Ufer, S.; Brown, G.T.L. Students’ formative assessment perceptions, feedback use and mathematics performance in secondary schools in Tanzania. Assess. Educ. Princ. Policy Pract. 2019, 26, 278–302. [Google Scholar] [CrossRef]
  99. Lailiyah, S.; Hayat, S.; Urifah, S.; Setyawati, M. Levels of students’ mathematics anxieties and the impacts on online mathematics learning. Cakrawala Pendidik. 2021, 40, 107–119. [Google Scholar] [CrossRef]
  100. Litster, K.; Lommatsch, C.W.; Novak, J.R.; Moyer-Packenham, P.S.; Ashby, M.J.; Roxburgh, A.L.; Bullock, E.P. The Role of Gender on the Associations Among Children’s Attitudes, Mathematics Knowledge, Digital Game Use, Perceptions of Affordances, and Achievement. Int. J. Sci. Math. Educ. 2021, 19, 1463–1483. [Google Scholar] [CrossRef]
  101. Mailizar, M.; Almanthari, A.; Maulina, S. Examining teachers’ behavioral intention to use e-learning in teaching of mathematics: An extended tam model. Contemp. Educ. Technol. 2021, 13, ep298. [Google Scholar] [CrossRef]
  102. Mohamed, Z.; Ubaidullah, N.H. Evaluation of the teaching quality model and its relationship with students’ academic performance through partial least squares-structural equation model. Int. J. Recent Technol. Eng. 2019, 8, 4035–4039. [Google Scholar] [CrossRef]
  103. Mohamed, Z.; Zain, H.H.M.; Yahya, R.A.S.; Damanhuri, M.I.M. Assessing the relationship between program education objectives and program learning outcomes in outcome-based education using partial least squares-structural equation model. Int. J. Innov. Technol. Explor. Eng. 2019, 8, 1709–1713. [Google Scholar] [CrossRef]
  104. Mustafa, N.; Mohamed, Z.; Ubaidullah, N.H. Modeling of statistical reasoning and students’ academic performance relationship through partial least squares-structural equation model (PLS-SEM). Univers. J. Educ. Res. 2020, 8, 3519–3526. [Google Scholar] [CrossRef]
  105. Mustafa, N.; Ubaidullah, N.H.; Ahmad, M.Z.; In’am, A. PLS-SEM Model of Students’ Attitudes toward Statistics, Reasoning of Statistics, Self-Efficacy, Motivation and Academics Performance. Rev. Int. Geogr. Educ. Online 2021, 11, 992–1003. [Google Scholar]
  106. Muwonge, C.M.; Ssenyonga, J.; Kwarikunda, D. Cognitive Appraisals, Achievement Emotions, and Motivation towards Learning Mathematics among Lower Secondary Students. Afr. J. Res. Math. Sci. Technol. Educ. 2018, 22, 243–253. [Google Scholar] [CrossRef]
  107. Rawlings, A.M.; Tapola, A.; Niemivirta, M. Temperamental Sensitivities Differentially Linked with Interest, Strain, and Effort Appraisals. Front. Psychol. 2021, 11, 551806. [Google Scholar] [CrossRef] [PubMed]
  108. Shapira-Lishchinsky, O.; Zavelevsky, E. Multiple Appearances of Parental Interactions and Math Achievement on TIMSS International Assessment. Int. J. Sci. Math. Educ. 2020, 18, 145–161. [Google Scholar] [CrossRef]
  109. Smeda, A.; Shiratuddin, M.F.; Wong, K.W. A structural equation modelling approach for adoption of e-book amongst mathematics and statistics (MAS) students at higher education institutions in Libya. Int. J. Inf. Learn. Technol. 2018, 35, 240–254. [Google Scholar] [CrossRef]
  110. Somasundram, P. The Role of Cognitive Factors in Year Five Pupils’ Algebraic Thinking: A Structural Equation Modelling Analysis. Eurasia J. Math. Sci. Technol. Educ. 2021, 17, em1935. [Google Scholar] [CrossRef] [PubMed]
  111. Suryanti, S.; Arifani, Y. The Relationship between Blended Mathematics Professional Training and Teachers’ Creativity and Effectiveness. Int. J. Instr. 2021, 14, 139–154. [Google Scholar] [CrossRef]
  112. Sutter-Brandenberger, C.C.; Hagenauer, G.; Hascher, T. Students’ self-determined motivation and negative emotions in mathematics in lower secondary education-Investigating reciprocal relations. Contemp. Educ. Psychol. 2018, 55, 166–175. [Google Scholar] [CrossRef]
  113. Tee, K.N.; Leong, K.E.; Abdul Rahim, S.S. The Mediating Effects of Critical Thinking Skills on Motivation Factors for Mathematical Reasoning Ability. Asia-Pac. Educ. Res. 2018, 27, 373–382. [Google Scholar] [CrossRef]
  114. Tee, K.N.; Leong, K.E.; Rahim, S.S.A. Modeling relationships of affective and metacognitive factors on grade eleven students’ mathematics achievement. Int. J. Res. Educ. Sci. 2019, 5, 295–308. [Google Scholar]
  115. Tee, K.N.; Leong, K.E.; Abdul Rahim, S.S. A Self-Regulation Model of Mathematics Achievement for Eleventh-Grade Students. Int. J. Sci. Math. Educ. 2020, 19, 619–637. [Google Scholar] [CrossRef]
  116. Valls Martínez, M.D.C.; Martín-Cervantes, P.A.; Sánchez Pérez, A.M.; Martínez Victoria, M.D.C. Learning mathematics of financial operations during the COVID-19 era: An assessment with partial least squares structural equation modeling. Mathematics 2021, 9, 2120. [Google Scholar] [CrossRef]
  117. Wafubwa, R.N.; Csíkos, C. Formative Assessment as a Predictor of Mathematics Teachers’ Levels of Metacognitive Regulation. Int. J. Instr. 2020, 14, 983–998. [Google Scholar] [CrossRef]
  118. Wijaya, T.T.; Cao, Y.; Bernard, M.; Rahmadi, I.F.; Lavicza, Z.; Surjono, H.D. Factors influencing microgame adoption among secondary school mathematics teachers supported by structural equation modelling-based research. Front. Psychol. 2022, 13, 952549. [Google Scholar] [CrossRef] [PubMed]
  119. Xiang, J.; Wan, Y.; Zhou, J. Factors affecting the learning effect of advanced mathematics among Chinese college students in social science majors. Eurasia J. Math. Sci. Technol. Educ. 2019, 15, em1770. [Google Scholar] [CrossRef]
  120. Zhang, Y.; Wang, Q. Content learning opportunities, computer-based instruction, and students’ mathematics and science achievement. Int. J. Math. Educ. Sci. Technol. 2020, 51, 1164–1180. [Google Scholar] [CrossRef]
  121. Sarstedt, M.; Cheah, J.H. Partial Least Squares Structural Equation Modeling Using SmartPLS: A Software Review. J. Mark. Anal. 2019, 7, 196–202. [Google Scholar] [CrossRef]
  122. Hair, J.F.; Hult, G.T.M.; Ringle, C.M.; Sarstedt, M. A Primer on Partial Least Squares Structural Equation Modeling (PLS-SEM), 3rd ed.; SAGE: Thousand Oaks, CA, USA, 2022; forthecoming. [Google Scholar]
  123. Ramayah, T.; Jun-Hwa, C.; Chuah, F.; Ting, H.; Memon, M.A. Partial Least Squares Structural Equation Modeling (PLS-SEM) using SmartPLS 3.0: An Updated Guide and Practical Guide to Statistical Analysis, 2nd ed.; Pearson: Kuala Lumpur, Malaysia, 2018. [Google Scholar]
  124. Zamir, S.; Yang, Z.; Wenwu, H.; Sarwar, U. Assessing the attitude and problem-based learning in mathematics through PLS-SEM modeling. PLoS ONE 2022, 17, e0266363. [Google Scholar] [CrossRef] [PubMed]
  125. Jöreskog, K.G.; Sörbom, D. LISREL 9.20 for Windows; Scientific Software International, Inc.: Skokie, IL, USA, 2015. [Google Scholar]
  126. Hair, J.F.; Black, W.C.; Babin, B.J.; Anderson, R.E. Structural Equations Modeling Overview: Multivariate Data Analysis; Pearson Education Ltd.: London, UK, 2014. [Google Scholar]
  127. Finch, H.; Bolin, J. Multilevel Modeling using Mplus; CRC Press: Boca Raton, FL, USA, 2017. [Google Scholar]
  128. Rousseau, D.M.; Manning, J.; Denyer, D. Chapter 11: Evidence in management and organizational science: Assembling the Field’s full weight of. Acad. Manag. Ann. 2008, 2, 475–515. [Google Scholar] [CrossRef]
  129. Rivera, J.R.D.; Jacomossi, R.R.; Barrichello, A.; Morano, R.S. Using structural equation modeling: Patterns and trends of publications in Brazilian journals. Rev. De Gest. 2018, 25, 291–302. [Google Scholar] [CrossRef]
  130. Guo, B.; Brian, E.P.; David, F.G. A systematic review of structural equation modelling in Social Work Research. Br. J. Soc. Work 2009, 39, 1556–1574. [Google Scholar] [CrossRef]
  131. Okech, D.; Kim, J.; Little, T.D. Recent developments in structural equation modelling research in social work journals. Br. J. Soc. Work 2013, 45, 685–704. [Google Scholar] [CrossRef]
  132. Owolabi, H.O.; Ayandele, J.K.; Olaoye, D.D. A Systematic Review of Structural Equation Model (SEM). Open J. Educ. Dev. 2020, 1, 27–39. [Google Scholar] [CrossRef]
Figure 1. Study flow diagram (adapted from [58]).
Sustainability 15 03209 g001
Figure 2. Distribution of articles based on countries.
Sustainability 15 03209 g002
Figure 3. Distribution of articles based on years.
Sustainability 15 03209 g003
Figure 4. Distribution of articles based on research design.
Sustainability 15 03209 g004
Figure 5. Distribution of articles based on samples.
Sustainability 15 03209 g005
Table 1. The search string used for the systematic review process.
DatabaseKeywords Used
ScopusTITLE-ABS-KEY ([“structural equation modeling” OR “SEM”] AND [“covariance-based SEM” OR “CB-SEM” OR “variance-based SEM” OR “VB-SEM” OR “partial least square” OR “partial least square-SEM” OR “partial least square structural equation modeling” OR “PLS-SEM” OR “proprietary statistical software package*” OR “statistical application*” OR “statistical program*” OR “statistical software*” OR “SEM software*” OR “software package*” OR “software program”*] AND [“mathematic*” OR “mathematic* education” OR “mathematic* teach* and learning” OR “mathematic* literacy” OR “mathematic* subject” OR “mathematic* discipline”])
Table 2. The exclusion and inclusion criteria.
Criterion (C)Inclusion (I)Exclusion (E)
Type of article/literature Journal (research articles/empirical articles) Journals (systematic review/non-empirical articles), book series, chapter in book, and conference proceeding
Language English Non-English
Timeline Between 2018 and 2022<2018
Country/region All -
Field Mathematics education/subject/discipline/literacy/TnL Non-mathematics education/subject/discipline/literacy/TnL
Table 3. The findings regarding the types of proprietary statistical software packages according to SEM approaches.
NoStudyResearch DesignCountriesSample and Level Types of Proprietary Statistical Software Packages According to SEM Approaches
CB-SEMVB-SEM/PLS-SEM
LisrelAmosMplusSmartPLSR PackageWarpPLS
1[71]QN Malaysia Students (International secondary school)XXXXX
2[72]QN Malaysia Students (International secondary school)XXXXX
3[73] QN Malaysia Students (International secondary school) XXXXX
4[80]QNWest AfricaCore and elective mathematics teachers (Secondary school) XXXXX
5[81] QNWest AfricaUndergraduate students (University)XXXXX
6[82]QNWest AfricaUndergraduate students (University)XXXXX
7[83]QNWest AfricaSenior students (High school)XXXXX
8[84]QNUEAParents, Mathematics teachers, and students (Elementary school)XXXXX
9[85]QNTurkey Prospective mathematics teachers (University)XXXXX
10[86]QN PhilippinesMathematics teachers (High school)XXXXX
11[87]QN TaiwanStudents (Vocational high school)XXXXX
12[88]QN Malaysia Mathematics teachers (Secondary school)XXXXX
13[89]QN MalaysiaStudents (Secondary school)XXXXX
14[90]QN Indonesia Students (University)XXXXX
15[91]QN Indonesia Students (University)XXXXX
16[92]QN Indonesia Students (University)XXXXX
17[93] QNIndonesia Students (University)XXXXX
18[94]QNSouth KoreaStudents (Elementary school)XXXXX
19[95]QN (Cyprus) Southeast EuropeStudents (Primary school)XXXXX
20[74]QN Spain Pre-service mathematics teachers (University) XXXXX
21[96] QNAustralia Students (University)XXXXX
22[97]QN (Cyprus) Southeast EuropePrincipal, Mathematics teachers, and students (Primary school)XXXXX
23[75]QN India Undergraduate students (University) XXXXX
24[98]MMEast AfricaStudents (Secondary school)XXXXX
25[99]QN Indonesia Students (University)XXXXX
26[100]MMUSAStudents (Elementary school, charter school, and home-school groups)XXXXX
27[101]QN Indonesia Mathematics teachers (Secondary school)XXXXX
28[102]QN Malaysia Undergraduate students (University)XXXXX
29[103]QN MalaysiaGraduate mathematics teachers (University)XXXXX
30[104] QN MalaysiaUndergraduate students (University)XXXXX
31[105] QN MalaysiaUndergraduate students (University)XXXXX
32[106]QN East AfricaStudents (Lower secondary school)XXXXX
33[107] QNSouthern and central FinlandStudents (Lower and upper secondary school)XXXX
34[76] QNWest Africa Mathematics teachers (Secondary school)XXXXX
35[108]QN IsraelPrincipals, mathematics teachers, and students (Middle school)XXXXX
36[109]QN South Africa Students (Public university) XXXXX
37[110]QN Malaysia Students (Primary school)XXXXX
38[111] QN IndonesiaStudents (Secondary school)XXXXX
39[112]QN SwitzerlandStudents (Primary and secondary school)XXXXX
40[113]QNMalaysiaStudents (Private high school)XXXXX
41[114]QN MalaysiaStudents (Private high school)XXXXX
42[115]QNMalaysiaStudents (Private lower-level high school)XXXXX
43[116]QNSpain Undergraduate students (University)XXXXX
44[117] QN East AfricaMathematics teachers (Secondary school)XXXXX
45[118]QNIndonesia Mathematics teachers (Secondary school)XXXXX
46[119]QNChina Students (University)XXXXX
47[120] QNUSAMathematics teachers and students (Middle school)XXXXX
QN—Quantitative; QL—Qualitative; MM—Mixed method.
Table 4. Findings regarding CB-SEM statistical applications.
Study CB-SEM Statistical Applications
[84,90,99,111]Lisrel (N = 4 studies)
[80,81,82,83,91,92,93,97,109,117,119]Amos (N = 11 studies)
[94,98,100,106,107,108,112]Mplus (N = 7 studies)
Table 5. Findings regarding VB-SEM/PLS-SEM statistical applications.
StudyVB-SEM/PLS-SEM Statistical Applications
[71,72,73,74,75,76,85,87,88,89,95,96,101,102,103,104,105,110,113,114,115,116,118]SmartPLS (N = 23 studies)
[107]R package (plspm) (N = 1 study)
[86,120]WarpPLS (N = 2 studies)
Table 6. Findings regarding SmartPLS.
StudyFindings
[71]F1: a significant relationship between performance expectancy, effort expectancy, and student attitude toward the use of an online mathematics homework tool.
F2: a significant relationship between student attitudes and their actual use of online homework.
[72]F1: a significant relationship between perceived usefulness, perceived ease of use, and attitude toward the use of a web-based mathematics homework tool.
F2: a significant relationship between attitude and mathematics self-efficacy factor.
[73]F1: perceived usefulness and perceived ease of use are predictors of attitude toward the use of OHW.
[85]F1: direct effects of technological content knowledge (TCK), technological pedagogical knowledge (TPK21), and pedagogical content knowledge (PCK21) on TPACK-21.
F2: teachers’ content knowledge (CK), technological knowledge (TK), and pedagogical knowledge (PK21) directly affect technological content knowledge (TCK).
[87]F1: perceived usefulness significantly affected attitude toward use and behavioral intention to use.
F2: attitude toward use significantly affected behavioral intention to use.
F3: attitude toward use exhibited significant mediating effects between perceived usefulness and behavioral intention to use.
[88]F1: infrastructure support and system quality affect teachers’ intention to use geometer’s sketchpad.
[89]F1: teacher affective support and classroom instruction predict attitude towards mathematics more than parental influences.
[95]F1: the mathematical mindset of students could directly and moderately describe their mathematical knowledge.
F2: mathematical knowledge and mathematical mindset can both directly and to a significant extent be used to describe mathematical imagination.
[74]F1: component relation effects of OB, ATP, and ATN of pre-service teachers toward mathematics learning and the influence of their educational background.
F2: science and technology background were positively correlated after the flipped-OCN method compared with the rest of pre-service teachers.
[96]F1: a significant relationship between students’ self-efficacy, self-regulated learning strategies, and epistemological beliefs about mathematics as well as their perceptions of the learning environment.
[75]F1: learning through constructivist Digital Learning Heutagogy supported academic achievement, learning engagement, and positive emotions
F2: peer relationship not supported by the intervention.
[101]F1: attitude toward E-learning use and E-learning experience were the two most significant constructs in predicting E-learning use.
[102]F1: a significant relationship between teaching quality and students’ academic performance.
[103]F1: a significant relationship between Program Education Objectives (PEOs) and Program Learning Outcomes (PLOs).
[104]F1: a significant relationship between statistical reasoning and students’ academic performance.
[105]F1: students’ attitude and belief toward statistics, statistical reasoning, self-efficacy, motivation, and the relationship with academic performance are statistically important.
[76]F1: a significant relationship between the will, skill, tool, and pedagogy parameters and the stages of adoption of teachers’ use of ICT.
F2: Tool strongly predicts ICT integration.
[110]F1: a significant relationship between cognitive factors (symbol sense, pattern sense, number sense, and operation sense) and algebraic thinking.
[113]F1: task value and critical thinking skills predicts students’ performance in mathematical reasoning.
F2: critical thinking skills fully mediated with the relationship of mastery goal orientation on the students’ abilities to solve the reasoning tasks.
[114]F1: students’ formative performance predicts their summative performance.
F2: formative performance significantly mediates the relationship between self-confidence and summative performance.
[115]F1: behavioral regulations (self-observation, self-judgment, and self-reaction) significantly influence student academic achievement and mathematical reasoning ability.
F2: cognition regulation significantly mediates the relationship between motivational regulation and reasoning ability.
F3: behavioral, cognition regulation, and students’ reasoning ability significantly mediates the relationship between motivational regulation and academic achievement.
[116]F1: Format and depth of the video tutorials predict performance learning and promoting autonomy.
[118]F1: a significant relationship between perceived ease of use and subjective norm influence (PEU and SN) with teachers’ microgame usage behaviors and intentions.
F1—Finding 1; F2—Finding 2; F3—Finding 3.
Disclaimer/Publisher’s Note: The statements, opinions and data contained in all publications are solely those of the individual author(s) and contributor(s) and not of MDPI and/or the editor(s). MDPI and/or the editor(s) disclaim responsibility for any injury to people or property resulting from any ideas, methods, instructions or products referred to in the content.

