Article

The Performance of the Construction of a Water Ecological Civilization City: International Assessment and Comparison

1
College of Water Sciences, Beijing Normal University, Beijing 100875, China
2
School of GeoSciences, The University of Edinburgh, Crew Building, Alexander Crum Brown Road, Edinburgh EH9 3FF, UK
3
State Key Laboratory of Simulation and Regulation of Water Cycle in River Basin, China Institute of Water Resources and Hydropower Research, Beijing 100038, China
*
Author to whom correspondence should be addressed.
Sustainability 2023, 15(4), 3071; https://doi.org/10.3390/su15043071
Submission received: 28 December 2022 / Revised: 3 February 2023 / Accepted: 4 February 2023 / Published: 8 February 2023
(This article belongs to the Special Issue Green Infrastructure and Sustainable Urban Water Management)

Abstract

:
The water ecological environment problems brought about by rapid urbanization have prompted the proposal and implementation of different approaches to urban water ecological construction, such as eco-cities, best management practices (BMPs), and low-impact development (LID). As one of the most representative urban water ecological management policies in China, the Water Ecological Civilization City (WECC) was proposed in 2013, and 105 cities were selected for pilot construction. Many studies have evaluated the effectiveness of WECC construction, but international quantitative comparison is lacking. To address this, an urban Water-Human-Health (WHH) Assessment Model, considering water resources, ecological environment, economic and social development level, and water resources utilization, was developed and applied to five WECC pilot cities in China and 10 other cities worldwide, in which mainstream urban water ecological construction modes have been used. Principal component analysis of the index values in the assessment system was used to evaluate the current status of water ecosystem health in the 15 cities, showing that Sydney, Cleveland, and Hamburg were the most advanced in urban water ecological management. The two cities with the best evaluation results (Sydney and Cleveland), and the WECC city with the highest score (Wuhan) were selected for documentary analysis of their water ecological construction documents to identify similarities and differences to inform best practice internationally for urban water ecological construction. The results showed that Sydney and Cleveland attach similar emphasis across most constituents of urban water ecological construction, while, for Wuhan, greater importance is attached to water resource management and water culture. The advantages and disadvantages of WECC construction and international experience are discussed. The WHH assessment model proposed in this study provides a new quantitative evaluation method for international urban water ecological health evaluation, which could be further improved by including an urban flood risk indicator.

1. Introduction

The city is not only the main area of human activities, but also the centre of economic, political, and cultural development. As mentioned in the United Nations Sustainable Development Goals, half of the world’s population (c. 3.5 billion) currently lives in cities, and by 2030 this number will rise to 5 billion, accounting for 60% of the world’s population [1]. Moreover, urbanization has brought benefits, such as population aggregation, convenience, and economic efficiency [2]. However, urban expansion has also led to “urban diseases” and numerous problems, such as encroaching on ecological space and damaging the environment [3]. Among them, urban water problems, such as pollution, increased flooding frequency, and shortage of water resources, are the most prominent [4]. All these phenomena have highlighted the need to construct inclusive, safe, risk-resilient, and sustainable cities, which coincides with SDG 11 in the 2030 Agenda for Sustainable Development [1].
Many important concepts in sustainable water landscapes in cities, which are known by different names in different countries, have appeared globally, for example: Eco-cities [5,6,7], Best Management Practices (BMPs) [8,9,10], Low Impact Development (LID) [11,12,13], Green and Blue Infrastructure (GBI) [14,15,16], Water Sensitive Urban Design (WSUD) [17,18,19], and Sustainable Urban Drainage Systems (SUDS) [20,21,22]. Based on the experience of water ecological construction in world cities, and combined with China’s national conditions, the Ministry of Water Resources of China formally proposed the construction of water ecological civilizations in 2013. Following this, 105 representative cities of different conditions were selected in China to construct water ecological civilization cities (WECC) [23].
Many researchers have discussed the content of WECC construction in different types of cities, and have actively explored new paths for the development of WECC in combination with regional characteristics. Current research on WECC mainly focuses on the definition of WECC core concepts, construction of quantitative evaluation systems, and methods for measuring the construction level of WECC, as described below:
(a)
Definition of WECC. Zuo [24] suggested that the core idea of WECC is the harmonious coexistence of human beings and water. It not only emphasizes the protection of the water ecological environment, but also balances it with the creation of material wealth. Zhao et al. [25] started from the actual needs and connected water resources and social economy in a problem-oriented manner to analyze the relationship between them to explore the significance of WECC. Chao et al. [23] mainly defined WECC from two aspects of human behavior and water resources carrying capacity;
(b)
Construction of indices for evaluating WECC. To shift research on WECC from qualitative investigation to quantitative analysis, many researchers began to construct evaluation index systems. For example, Yue et al. [26] built an evaluation system based on the Driving–Pressure–State–Impact–Response(DPSIR) framework, conducted a case analysis of Wuhan City, and discussed the impact of WECC on its water ecological carrying capacity. Pi et al. [27] took Nanchang as an example to evaluate WECC from the indicators of water resources, water ecology, water utilization, water management, and water culture. The Yangtze River Economic Belt was evaluated by Qi et al. [28], using the indicators of social economy, total water resources, water use efficiency, and comprehensive environmental management based on the Pressure-State-Response (PSR) framework;
(c)
Methods for measuring the construction level of WECC. There are many evaluation methods for WECC. Tian et al. [29] used the entropy method to evaluate WECC in the Pearl River Delta, and concluded that there are obvious differences in the level of water ecological civilization among cities. Wang [30] combined the entropy method and the Delphi method to evaluate WECC of 10 transboundary river cities to explore the relationship between them. Tian et al. [31] analyzed the construction level of WECC in three urban agglomerations in the Yangtze River Economic Belt based on multicriteria analytical methods, and found that the construction level gradually increased from west to east, showing obvious spatial differences.
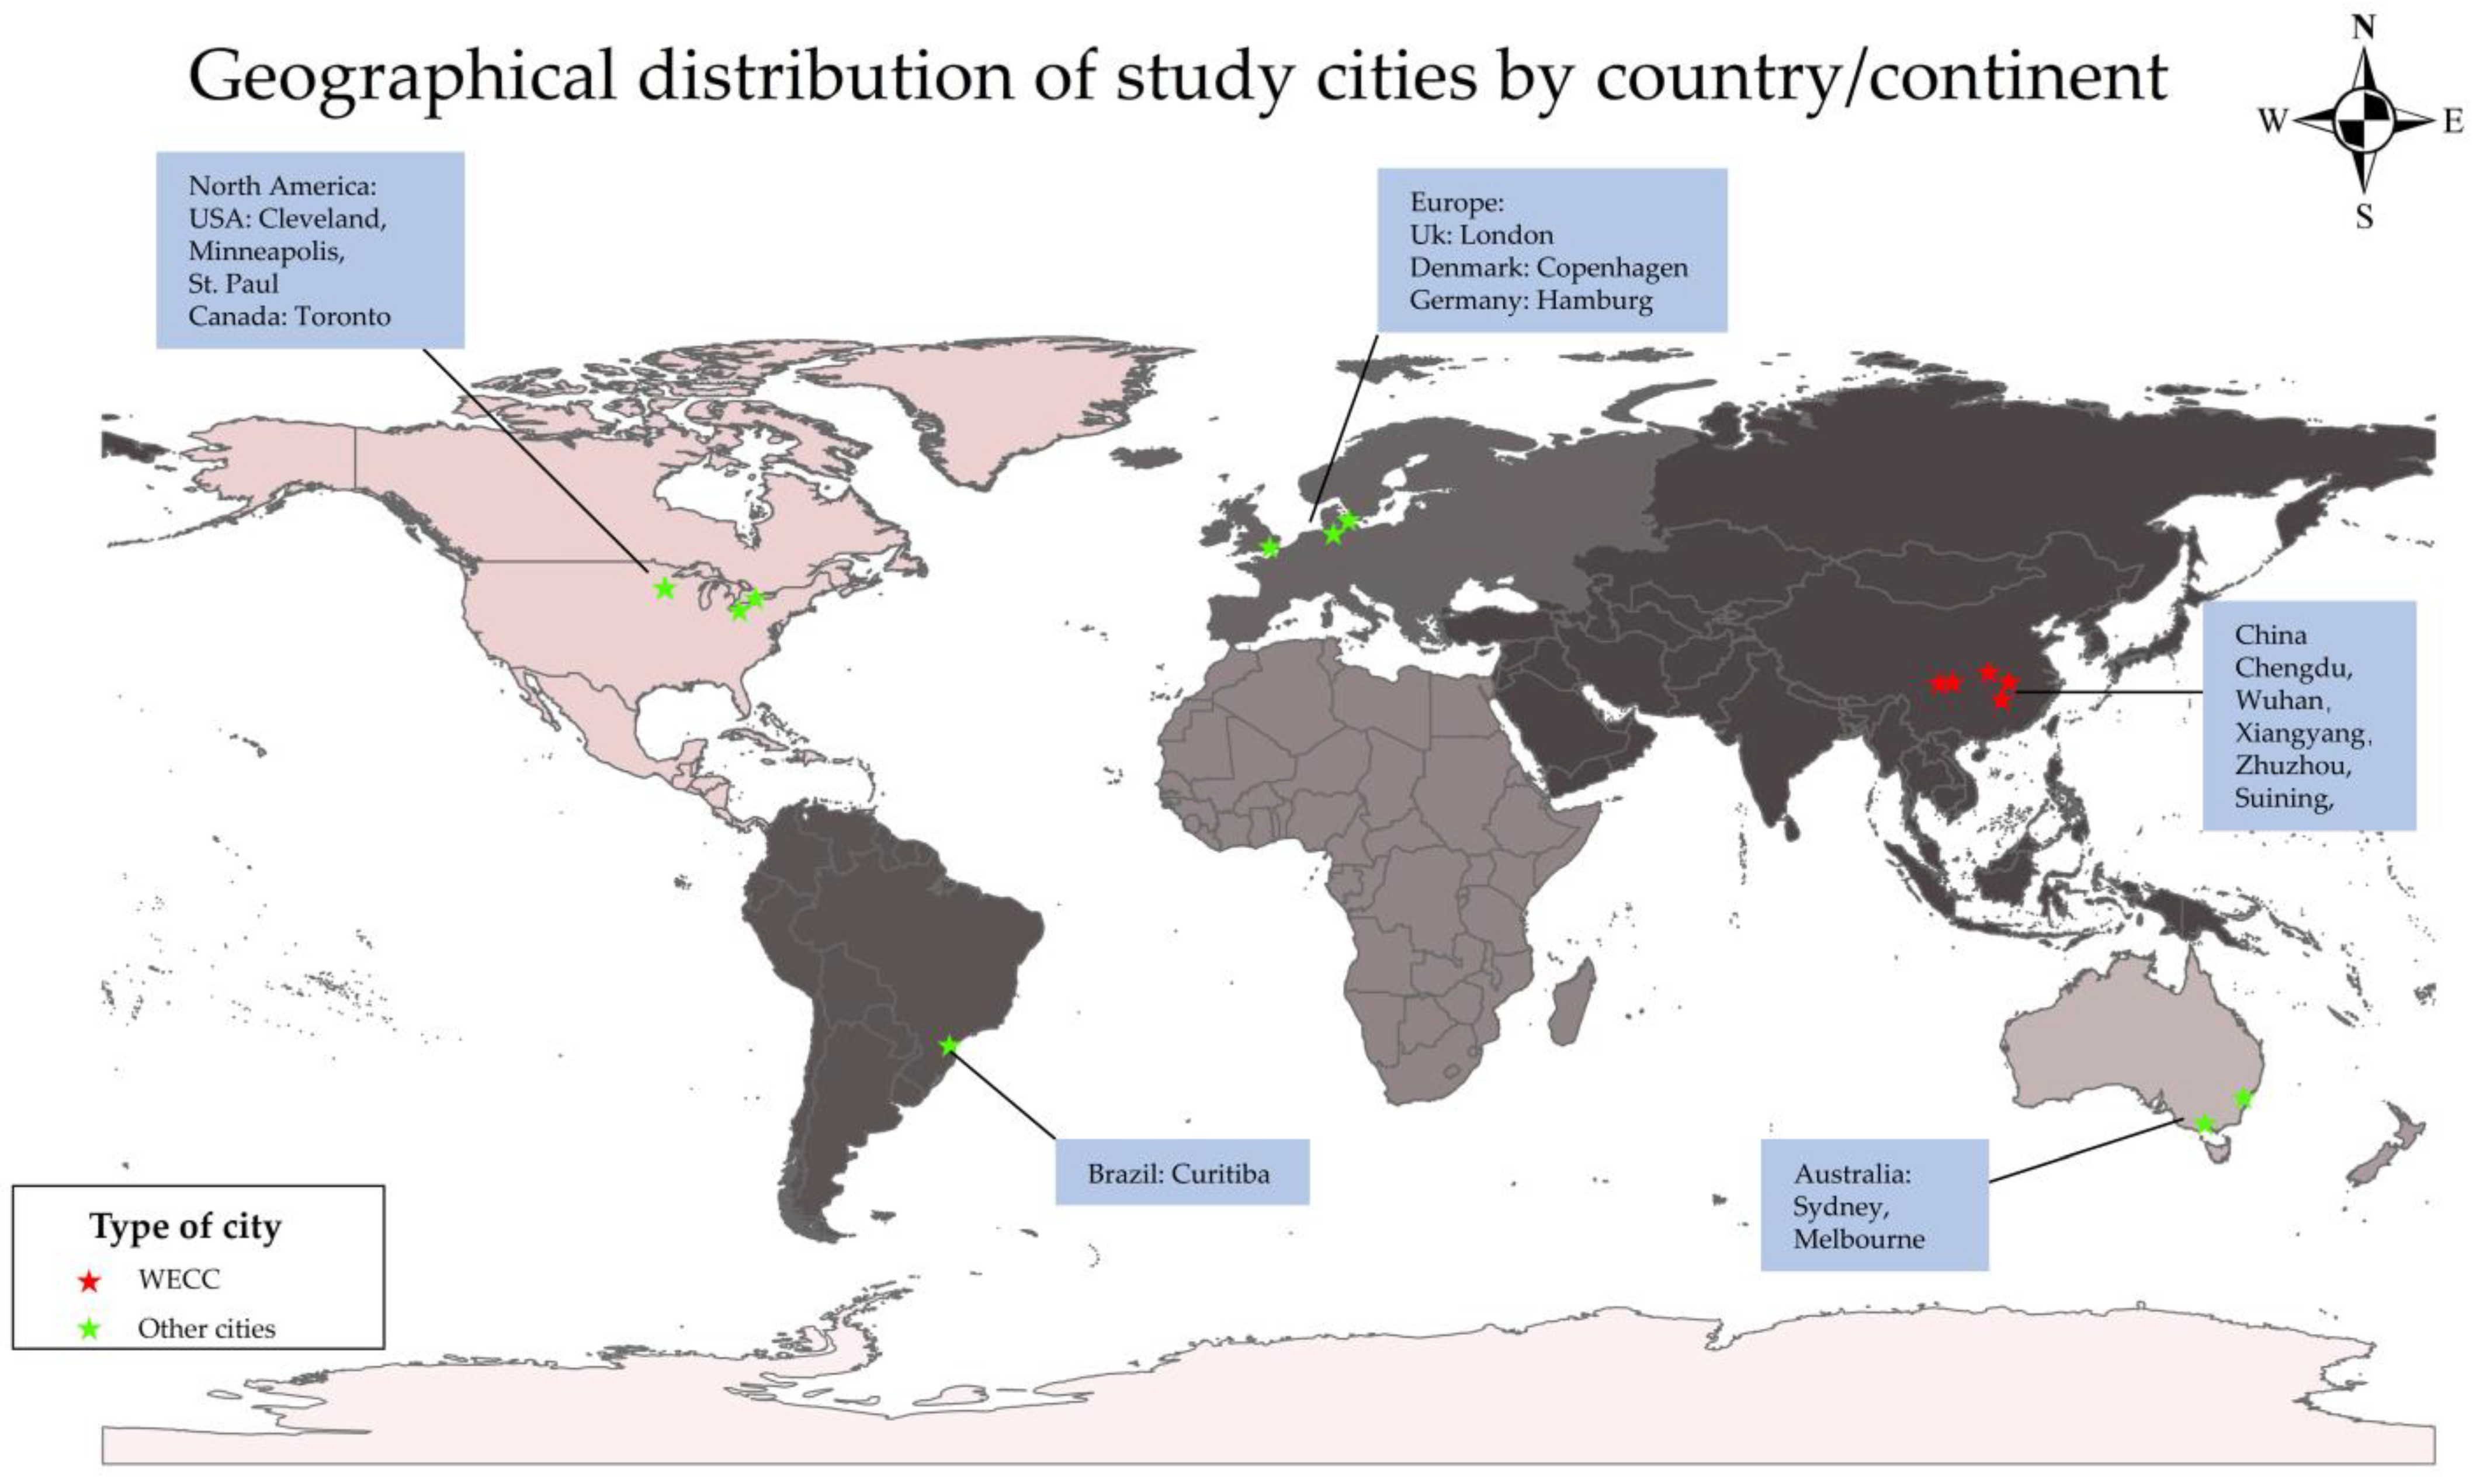
In summary, previous studies have discussed the feasibility of applying various evaluation methods to the assessment of WECC based on specific cases. However, the current quantitative analysis of WECC is limited to specific regions, provinces, and cities, and few international comparison or evaluation has been conducted. The objective of this paper is to fill the gap in the lack of international quantitative comparisons of WECC, and to establish an international general index system for evaluating urban water ecological health. This paper first selects 5 WECC cities and 10 other cities worldwide in which mainstream urban water ecological construction modes have been used (including BMPs, LID, GBI, WSUD, and SUDS); then, a universal Water-Human-Health (WHH) Assessment Model was developed to evaluate the cities from different countries in which the scores of water health for each city were reduced by principal component analysis to allow comparison. Finally, two cities with the best evaluation results and one WECC city with the highest score were selected for documentary analysis of their water ecological construction documents to try to identify the differences between WECC and other urban water ecological construction modes. The WHH assessment model in this study can provide a universal urban water health evaluation system suitable for international use. Furthermore, the results of the international comparison can help inform the subsequent development and international applicability of WECC.

2. Study Area

Cities around the world were screened based on the principles of representativeness, considering continent, country, starting time and data availability; of these, 15 cities representative of WECC, BMPs, LID, GBI, WSUD, SUDS, and eco-cities were selected for analysis (Table 1 and Figure 1).
Construction in Chengdu started in 2013 in the first batch of WECC [32], while, in Wuhan, Xiangyang, Zhuzhou, and Suining, it started in 2014 in the second batch [33]. These five cities are located in the Yangtze River Economic Belt, which is one of the most developed economic belts in China and an important waterway connecting eastern and western China [31].
Cleveland is located in western Ohio in central USA. The city is near the south shore of Lake Erie and spans the mouth of the Cuyahoga River. BMPs in Cleveland can be dated back to the Federal Water Quality Act (1987) and the Ohio Agricultural and Silvicultural Pollution Abatement Law (1991) [42]. With the release of the BMPs handbook in 2000, Cleveland began more extensive construction [34]. According to the Cleveland Office of Sustainability, the city installed three pervious pavement and paver parking lot BMPs in 2009 and 2010 and joined the Big Creek Watershed Plan, including stormwater management methods through LID and GBI [43].
Minneapolis and Saint Paul, commonly known as the Twin Cities, is a metropolitan area in the Upper Midwest USA. The Minnesota Pollution Control Agency (MPCA) was the local authority responsible for the National Pollutant Discharge Elimination System (NPDES) program in 1990 [35]. The MPCA issued the first Municipal Separate Storm Sewer System (MS4) NPDES Permit to the Twin City in 2000, including BMPs, LID, and GBI [35]. According to the 2022 NPEDS report [44,45], more than 3000 BMPs and hundreds of green stormwater infrastructure had been built in the Twin Cities by 2021.
Toronto, located on the northwest shore of Lake Ontario, is Canada’s largest city and the provincial capital of Ontario. In 1994, the Ontario Ministry of Environment and Energy issued the Stormwater Management Practice Planning and Design (SMPPD) Manual which provided detailed guidance for designing and building multi-objective stormwater management facilities to balance the impact of urbanization on the natural hydrological cycle and to address water quality issues [36]. Following this, Canada issued the world’s first “Guidelines for Urban Municipal Green Infrastructure” in 2001 [36]. Under the construction concepts of GBI and LID, Toronto’s urban stormwater management focuses on integrated water resources management, emphasizing watershed management and ecosystem protection within the entire natural hydrological cycle.
Sydney and Melbourne, the two largest cities in Australia, are also early cities to explore urban stormwater management. At the end of the 20th century, Australia proposed a water-sensitive urban design (WSUD) stormwater management system, for which the guidelines were first published in 1994. WSUD includes two aspects: developing exciting, aesthetic environments for the community through urban planning and design; and ensuring the sustainable development of the city by paying attention to the overall rainwater circulation of the site [46].
London is the capital of the United Kingdom, and is one of the largest cities (and is the largest economic center) in Europe. The UK developed a set of stormwater management systems called “sustainable urban drainage systems (SUDS) based on best management practices (BMPs) [47]. After the first manual was released in London in 2000, the city began to promote the construction of SUDS, including sustainable stormwater management and water quality restoration for all water bodies [48], source control of stormwater [48], and reduction of potential adverse impacts of flooding on human health, activities, and the environment [22].
Copenhagen is the capital of Denmark, located in northern Europe. From 2007–2012, Denmark’s national strategic research project Black, Blue, Green (2BG) explored WSUD retrofit options in Copenhagen to address the challenges posed by sewer overflows and climate change [39]. At the same time, SUDS have been piloted in the city as an optional solution for rainwater resource management [49].
Hamburg is Germany’s second-largest city and Europe’s third-busiest port, located 80 km up the Elbe Estuary from the North Sea. The construction of an eco-city in Hamburg can be traced back to the proposal of the ”Eco-City Hamburg-Harburg” project in 2009, dedicated to regenerating the old harbor as a sustainable creative-industrial environment [40]. It was named the 2011 European Green Capital for its green network, eco-city construction, and effectiveness in tackling climate change [50,51].
Curitiba, a city in the south of Brazil, is an eco-city recognized by the United Nations. In the early 1970s, municipal governments recognized that the design and systems of cities could have a serious impact on their local environment, and began to promote eco-city development [41,52,53]. Over the past 50 years, Curitiba has invested in many small sustainable urban planning developments and was called “The Greenest City on Earth” in 2014 [41].

3. Materials and Methods

In this study, a mixed-methods approach was used to adequately analyze each aspect of urban water ecosystem health. Urban water ecological construction is a systems problem involving multiple levels. The key to evaluating the current status of cities lies in the ability to build a comprehensive evaluation index system that can be applied to most cities. A universal urban water ecological health index was established to evaluate cities from different countries. The scores of water health of the study cities were measured by principal component analysis, due to its advantages of reducing the workload of index selection [54], with a higher score indicating better water ecological construction. To understand how to promote the best urban ecological development model, policy and technical guidance documents were analyzed for the three top-scoring cities to compare each city’s water ecological management construction system.

3.1. Development of the Urban Water Ecosystem Health Evaluation Index

Under the guidance of the concept of water ecological civilization, the health level of urban water ecosystems is mainly the evolution of the interaction between the water system and the human system [29,54,55]. The optimization of various water-related activities is the foundation; at the same time, there is the aim to realize the sustainable supply of aquatic ecosystem services. Therefore, a Water-Human-Health assessment model (WHH) that can reflect the health connotations of urban water ecosystems was constructed here to evaluate urban water ecosystems. Based on the WHH assessment model, this study developed an evaluation index system using indicators that met the following criteria:
(a)
System analysis. According to the regional water resources and economic and social development, regardless of special circumstances, indicators are sought that can characterize the health of the urban water ecosystem as much as possible;
(b)
Universal data availability. Indicators were selected, for which data are readily available for cities worldwide;
(c)
Theoretical analysis. Indicators were selected that were expected to be meaningful for characterizing and understanding the operation and management of urban water ecosystems;
(d)
Independence. The selected indicators should be as independent as possible to prevent overlap between indicators.
The indicators selected in this study for an urban water ecosystem health evaluation index system suitable for most cities are shown in Table 2, and are explained in more detail in Supplementary Materials S1. Data for the indicators were obtained for 2018 for each of the selected 15 cities, and the data sources are given in Supplementary Materials S2.

3.2. Principal Components Analysis

In this study, since there may be correlation between the various indicators, the independence of each indicator cannot be guaranteed, and the calculation of multiple indicators is more complicated. PCA is a statistical analysis method that reduces multiple indicators into a few comprehensive indicators. Therefore, PCA was selected to calculate the weighting of each of the 18 indicators to quantify the overall water ecological health score of each of the selected cities. SPSS v25.0 software was used for the PCA analysis, and the steps involved are described below.
First, the scores for each indicator were normalized so that the data were comparable [56]. The general approach to standardization, Z-score standardization, was used in this study, that is, the mean value is 0 and the variance is 1.
After entering the dimensionless processed data into SPSS 25.0, the first 6 principal components with a cumulative contribution rate of 87.4% were selected for the PCA (Table 3), aided by examination of the scree plot, to represent the 18 original indicators.
Next, a varimax rotation, which maximizes the sum of the variance of each factor load through coordinate transformation [57], was used to make the components easier to interpret. This study used the Kaiser-standardized orthogonal rotation method to rotate the initial factor load matrix [58], which converged after 18 iterations to obtain the final rotation factor load matrix. From the normalized data and the results of the rotation component matrix, the coefficients of each indicator in the six principal components were calculated by multiplying the eigenvector coefficients by the normalized value of the original data.
To calculate the total score of the principal components, the overall principal component-weighted value of each indicator must be determined. In this study, the weight of the principal component of each indicator was represented by Q1–Q6. The weighted principal component value of each indicator was calculated by multiplying the coefficient corresponding to each principal component in the principal component expression by its corresponding variance contribution rate, and then dividing by the sum of the variance contributions of the six principal components. Finally, the weights of the six principal components for each index were summed to obtain the total principal component weight ( Q T o t a l ):
    Q T o t a l = Q 1 + Q 2 + Q 3 + Q 4 + Q 5 + Q 6
Then, the total principal component weight was standardized to obtain the final weight Q T o t a l * of each indicator value.
Q T o t a l   i * = Q T o t a l   i i = 1 18 Q T o t a l   i
where Q T o t a l   i is the principal component weight of the index; Q T o t a l   i * is the final weight of each indicator value.
The principal component weighted values of the indicators are shown in Table 4. The weight of each indicator was calculated by Equations (1) and (2).
Therefore, by multiplying the total weight of each index by the corresponding data after Z-score standardization, the overall value of the urban water ecological health index of each of the 15 water cities was calculated as:
F Total = 0.000182 × A 1 + 0.121 × A 2 + 0.142 × A 3 + 0.110 × A 4 0.0872 × B 1 0.000480 × B 2 0.0942 × B 3 + 0.0994 × B 4 + 0.0201 × C 1 + 0.118 × C 2 + 0.144 × C 3 + 0.133 × C 4 + 0.144 × D 1 0.00721 × D 2 + 0.0337 × D 3 + 0.0819 × D 4 0.0335 × D 5 + 0.0724 × D 6
Based on the classification in Table 2, the specific score for different parts of the subsystem layer and domain level was calculated, where A1-D6 refers to the different indicators within the urban water ecological health index:
F W a t e r   e c o c y s t e m   h e a l t h = 0.000182 × A 1 + 0.121 × A 2 + 0.142 × A 3 + 0.110 × A 4 0.0872 × B 1 0.000480 × B 2 0.0942 × B 3 + 0.0994 × B 4
F H e a l t h   o f   t h e   h u m a n i t i e s   s y s t e m = 0.0201 × C 1 + 0.118 × C 2 + 0.144 × C 3 + 0.133 × C 4 + 0.144 × D 1 0.00721 × D 2 + 0.0337 × D 3 + 0.0819 × D 4 0.0335 × D 5 + 0.0724 × D 6
F W a t e r   r e s o u r c e s = 0.000182 × A 1 + 0.121 × A 2 + 0.142 × A 3 + 0.110 × A 4
F E c o l o g i c a l   e n v i r o n m e n t = 0.0872 × B 1 0.000480 × B 2 0.0942 × B 3 + 0.0994 × B 4
F E c o n o m i c   a n d   s o c i a l   d e v e l o p m e n t = 0.0201 × C 1 + 0.118 × C 2 + 0.144 × C 3 + 0.133 × C 4
F W a t e r   r e s o u r c e s   u t i l i z a t i o n = 0.144 × D 1 0.00721 × D 2 + 0.0337 × D 3 + 0.0819 × D 4 0.0335 × D 5 + 0.0724 × D 6

3.3. Documentary Analysis

Documentary analysis (DA) is a research method that collects, identifies, and sorts the relevant documents for study, and systematically, objectively, and quantitatively analyzes their content to obtain information, and then forms a scientific understanding of facts [59]. DA is mainly based on the theory and method of bibliometrics and content analysis.
In this study, the results of the PCA were used to identify three cities for documentary analysis. Relevant documents about laws and policies on water ecological management and construction were identified for these cities. The important keywords were extracted from each document according to different aspects of urban water ecosystem construction (Table 5). Through the frequency of the keywords appearing in each document, the focus of the city on different areas of urban water health can be identified.
After calculating the frequency of each keyword in a document, it was classified according to the first- and second-level indicators, so as to count the total number of keywords related to each index. Following this, this number was divided by the total number of keywords related to urban water ecological construction appearing in the document to calculate the proportion of each index in the urban water ecological construction. Finally, the average value of all the documents was calculated to obtain the construction proportion of the city in each indicator.

4. Results

4.1. Urban Water Ecological Health Scores of the 15 Study Cities

4.1.1. Overall Comparison

The total scores and rank for the urban water ecological health of the 15 study cities calculated using Equation (3) are shown in Table 6.
From Table 6, the four cities with the best urban water ecological health are Sydney, Cleveland, Hamburg, and London. It is interesting that the water ecosystem construction of these cities belonged to different modes and started earlier than other cities (see Table 1). Among them, Sydney ranked first, scoring 1.474, much higher than other cities, indicating that it has the best urban water ecological health level. It can be seen that all WECC cities, except Wuhan, have lower scores than other cities. This may be because the construction started most recently and has had the shortest duration. Most cities with moderate rankings use a mixture of urban construction models.
From a national and regional perspective, although Sydney scored the highest, Melbourne, which also built WSUD and is also in Australia, was ranked only ninth (−0.116), indicating that a city’s specific water ecological foundation and economic development level have a large influence on the urban water ecological health, even within the same construction method (WSUD) (See Table 1). The same phenomenon is also seen in North America, where the scores of second-placed Cleveland are quite different from Minneapolis and Toronto. The overall level of urban water ecological health in Europe is relatively high, and the differences are small, indicating that the integrated environmental regulations in the European Union (e.g., the Drinking Water, Urban Wastewater Treatment, and Water Framework Directives) have played a positive role in urban development. The overall scores of China’s WECC cities are low and similar, apart from a higher score for Wuhan, indicating that the level of urban economic development has a greater impact on the overall score.

4.1.2. Comparison of Subsystems within the Urban Ecological Water Health Index

The WHH model is composed of two main subsystems (see Table 2): the water ecosystem health system (directly related to the current situation of the water ecological environment) and the humanities system (connected with economy and society). The scores for the two subsystems in the 15 study cities were calculated using Equations (4) and (5) and are shown in Table 7. Cleveland has the highest score (0.542), and Suining has the lowest score (−0.783) for water ecosystem health system (Table 7), evidencing great differences between cities. It is worth noting that each of the top 6 cities uses different construction modes, indicating that each construction mode promotes the protection and restoration of water ecosystems. Among them, it is interesting that, although WECC cities are not ideal in terms of overall scores, they have a stronger performance in terms of water ecological health, especially Wuhan, ranking third, which indirectly shows that WECC construction has a positive effect in protecting the water ecosystems. According to Table 7, the biggest difference in magnitude among all the indicators was in the humanities system, with Sydney ranking the highest (0.999), and Xiangyang the lowest (−0.882). Indeed, all the WECC cities and Curitiba (Brazil) are the lowest ranked, which all occur in lesser-developed countries. In contrast, all cities in North America, Europe and Australia have higher overall scores. This shows that the humanities system largely depends on the level of economic and social development, which indirectly affects the efficiency and level of water use.

4.1.3. Comparison at Domain Level

The scores calculated for each city using Equations (6)–(9) for the different domain levels in the WHH model (see Table 2) are shown in Table 8.
It can be seen from Figure 2 and Table 8 that Cleveland (0.496), Wuhan (0.313), and Sydney (0.290) rank the top three in water resources scores, indicating that these three cities have the best natural conditions and abundant water resources, while the lowest, Suining, only scores −0.374. From this indicator, we can see that there are big differences between cities in terms of water resources endowment and the importance of water resources management.
Regarding the water ecological environment, Hamburg has the highest score of 0.214, and Suining has the lowest score of −0.408. Only Hamburg and Toronto score above 0.2, whilst the remaining cities have scores in the range of −0.3 to 0.2. This suggests there may be a correlation between water ecology health and vegetation cover. Hamburg, amongst the earliest eco-cities, started the management of natural resources and water quality comparatively early, in 2009, while Suining, as the second batch of WECC pilot cities in 2014, started later with poor water ecological and economic conditions.
In the indicator of economic and social development level, the highest score was Sydney (0.658), and Xiangyang (−0.554) was the lowest. There are greater differences between cities in water ecological environment scores, and the three WECC cities in China rank at the bottom. This probably reflects the remaining large gap between developing and developed countries in the level of economic development, which indirectly affects the level of water use efficiency and consumption, the amount of resource to spend on regulation, cleaning up pollution, and restoring the water environment.
In terms of water resources utilization, Sydney again ranks first (0.340) and Curitiba ranks the lowest (−0.396) for the first time. Scores for the other cities are similar. This suggests that the water efficiency use as the core of water resources management has been actioned in various cities. Curitiba is at the bottom of the index because of its low level of sewage treatment and water recycling.

4.2. Documentary Analysis Results

The urban water ecological health index scores were used to identify three cities for documentary analysis, due to time constraints. Based on evaluating the construction level, index data, and document availability, Wuhan, which has the highest score of the WECC, and Sydney and Cleveland, the cities with the highest total and water ecosystem health scores, were selected for documentary analysis. Relevant documents about laws and policies on water ecological management and construction were identified for these cities (See Supplementary Materials S3). After consideration of the timeliness, comprehensiveness, importance, and length of the documents, the three most relevant documents, including a technical construction guidance document for each city, were selected for analysis (Table 9). Based on the documentary evaluation system (Table 5), the keyword extraction results of each city are shown in Supplementary Materials S4.
Using data in Supplementary Materials S4 and the methods explained in Section 3.3, the values for the second- and first-level indicators were obtained and the specific proportion of WECC construction for each indicator in each city was calculated, as well as the mean value of the indicators (Tables S1–S6).
The three different documents examined for each city had different emphases, as reflected in the range of values for each second- and first-level indicator (Tables S1–S6). For Wuhan, document W1, which addresses comprehensive water resources planning, places greater emphasis on water supply and utilization and water resource endowment, showing that the document has great concern for the integrated management and utilization of water resources. As a guidance document of WECC, W2 is more evenly distributed among the second-level indicators, indicating that it is more comprehensive and instructive. This document centers on water resource management, emphasizing the protection and restoration of urban water ecological environment, and takes the development of water culture as an important part of WECC construction. W3 is an important technical guidance document for the pilot construction of sponge cities (construction of low-impact development rainwater control systems). In contrast to the other documents for Wuhan, W3 has water security as its absolute focus, highlighting the importance of flood resistance and drainage, water regulation guarantee, and water ecological status. It shows that sponge city construction pays more attention to the comprehensive management and ecological protection of urban stormwater status. From the mean values of the indicators, the overall WECC construction model in Wuhan is characterized as a development model that has water resources management as the core, while taking into account water environment and water safety, emphasizing the auxiliary role of water culture.
For Cleveland, C1 is a policy document that guides and influences the land and water management of the whole basin. It describes the current situation of water resources and water ecology in detail and emphasizes the relevant systems and methods of water management. C3 is similar to C1 in that it prioritizes water quality and water safety, water resources management, and water ecological protection. It emphasizes the importance of government and regulations in water management, requires stakeholders to pay attention to water quality, and encourages active water ecological restoration. C2, in contrast, is a practical water construction planning document which contains detailed designs for water-related projects. It introduces the local scheme of water supply and water supply in detail, and also mentions a great number of relevant regulations to ensure water construction, emphasizing the importance of water ecological restoration. In general, the construction mode of Cleveland is primarily based on the safety of water source, water quality, and water-related projects, followed by comprehensive water resources and water ecosystem management. The role of the water culture system is only minimally addressed.
For Sydney, S1 is a guidance document for the construction of WSUD in Sydney. It aims to combine urban planning and design with water supply, sewage, stormwater, groundwater, and other facilities at different spatial scales from the city to the site, so as to organically combine and optimize urban planning and urban water cycle management. All second- level indicators, except for water ecological restoration, cultural heritage, and general awareness, account for a similar proportion, which indicates that the document is comprehensive and balanced in the construction of the urban water ecosystem. S2 is a reference document for the 2016–2021 strategy and action plan which aims to solve the problems of water quality and water consumption in Sydney. The water safety guarantee and second-level indicator is therefore dominant (59.8%) in S2, while the water ecological health first-level indicator accounted for only 5%. Many designs and plans appear in the document, providing direction for future water quality management and water consumption reduction. S3 outlines comprehensive water resource planning for Sydney which mainly emphasizes investing in water conservation, preparing for drought, delivering water-smart cities, and improving river health. This is reflected in the high proportions of the second-level indicators of water supply and utilization and water regulation guarantee in the document. In general, Sydney has adopted a balanced plan for water security and water management, while there are few systems related to water ecology.
The mean values of the second- and first-level indicators from the documentary analysis for each city are compared in Table 10 and Table 11, respectively. The mean proportions of many second-level indicators are similar for all three cities, indicating the importance attached to water supply and demand, urban stormwater management, and water ecology in all cities. One exception is water recycling, which is more important for Sydney than for the other two cities. The emphasis placed on water resource endowment also differs between the three cities, with a mean value of 27.3% for Wuhan, far higher than for the other two cities. The cities also differ in terms of the water source safety index. Cleveland attaches the most importance to the role of water quality in urban water ecology. When it comes to water regulation guarantee, Cleveland and Sydney pay more attention to planning and the law, emphasizing the synergy of stakeholders, while, in Wuhan, the construction of WECC is mainly led by the government. In terms of the cultural heritage index, the importance of water culture for urban water ecological construction is greater for Wuhan than for the other two cities.
The importance attached to the different first-level indicators in the analyzed documents is very similar for Cleveland and Sydney. Water safety guarantee accounts for the highest proportion of keywords in both cities, while the water culture system constitutes the least. The only difference is that Cleveland pays more attention to water ecological health, while Sydney has a more systematic system of water resource management. The results for Wuhan are quite different from these two cities. The documents analyzed for Wuhan have a greater focus on water resource management and water culture systems, attaching more importance to integrating water culture into the process of water resource management to promote the restoration and protection of the water ecosystem. Guaranteeing water security in WECC is emphasized less compared to the other two cities.

5. Discussion

The creation of the Urban Water Ecosystem Construction Index, guided by the WHH assessment model, and the PCA analysis of the values of the 18 indices, allowed quantitative assessment of the degree of water ecological construction of 15 representative cities worldwide. Most of the existing evaluation studies of the Water Ecological Civilization City (WECC) construction mode are based on horizontal comparisons within China [27,29,31,55], and there is no international systematic comparison, which is one of the important contributions of this study. The results indicated that WECC cities rank below other cities worldwide, mainly due to the level of economic development lagging behind other cities, due to its late start. At the same time, WECC have also been hindered by problems, such as imperfect legislation [60,61], backward construction practices in water ecological engineering projects [23,62], and insufficient regional cooperation [23,63]. Nevertheless, the water ecological health subsystem is emphasized more for these cities, indicating the special role of WECC in the protection and restoration of the water ecological environment. This finding is aligned with the research of Yang [64] and Tian [31], both highlighting the positive improvement effect of WECC on the urban water ecosystem.
The documentary analysis in this study, using a keyword extraction index system, supports the international comparison and evaluation of urban water ecosystem health policies, with the aim of improving future policy development and sustainability of urban water ecosystems. By comparing the construction modes of the three cities in the documentary results, the construction of WECC has the potential to be a systematic and comprehensive mode. The basic concept of WECC involves coordinating population, resources, and environment, considering the principle of unifying economic, social, and ecological benefits [23]. Furthermore, in accordance with the construction requirements of efficient production space, livable living space, and beautiful ecological space, it focuses on spatial development layouts and urban economic development [65]. The overall goal is to focus on the construction of six aspects of water resources management: allocation and conservation, comprehensive water environment improvement, water ecosystem protection and restoration, flood control and water supply safety guarantee, water culture exploration, and ecological landscape construction [25]. The aim is the eventual formation of a unique, fully functional, and coordinated city, in which there are harmonious relationships between humans and nature [66]. The documentary analysis for Wuhan showed that the goals of WECC goals are more comprehensive and diversified than those in cities with other construction modes, serving all aspects of urban water-related affairs such as water resources, water conservation, and water environment, water supervision and water culture. Although WSUD in Sydney and the hybrid construction mode of Cleveland also take water resources, water ecology, and water environment into consideration, the main focus is different. WSUD in Sydney focuses on the urban water cycle, regarding it as an organic whole, trying to realize the integration of stormwater management, drinking water supply and sewage management. The system considers that the urban green infrastructure and building form should be consistent with the natural characteristics of the site, and the natural rainfall and urban sewage should be regarded as available resources [67]. The mixed construction method of Cleveland mainly focuses on urban stormwater management, combined drainage system, rainwater treatment technology, and infrastructure construction.
The main novelty of WECC, compared to other modes of urban water ecosystem construction, is the greater emphasis on civilization and culture. However, other studies of WECC cities have reported low scores for water culture. For example, Wang [30] evaluated transboundary river cities in China using four WECC criteria: water ecology, water safety, water management, and water culture, and found that most cities scored low in water culture. This may be because the study was carried out earlier, and the WECC construction had not been fully completed. In fact, after the WECC pilot construction was completed, the water culture and water ecological status of most cities improved. For example, Wuhan has built 81 waterfront parks, 5 wetland nature reserves, 6 national wetland parks, and 4 museums to publicize the importance of water, which have greatly increased the public awareness of the water environment and water ecology [68]. In the current study, documentary analysis showed that in W2, a guiding document for the construction of WECC in Wuhan, the water culture system accounted for 11.5% of the WECC keyword second-level indicator categories (Table S2), the highest proportion of this indicator among all documents examined for all three cities. In contrast, the documentary analysis results for Sydney and Cleveland showed that water culture is only a very small component and has not been prioritized. Nevertheless, it should be noted that the documentary analysis assessed plans and visions and their underpinning analyses and approaches for the cities, rather than implementation of urban water ecosystem construction. Follow-up studies will therefore be important to track the development of the Urban Water Ecosystem Construction Index values over time to assess to what extent urban water ecosystem improvements are delivered.
In WECC, the aim is that the water space not only provides city residents with rest, entertainment, and viewing functions, but also attracts the gathering of people by virtue of the superior water environment and water landscape, providing the city with cultural and life functions [26]. Some specific adjustments based on Chinese characteristics can be seen in WECC construction (such as the role of water culture being based on China’s long history of water use), but its construction experience remains valuable for other countries. For example, each city can improve its urban water ecosystem construction based on its own actual water culture.

6. Conclusions

This research evaluated the health of the urban water ecosystems in representative cities worldwide, with a range of construction modes. According to the evaluation results, a complete assessment framework of urban water ecological construction was put forward. The main conclusions are as follows:
(a)
Having investigated the concept of the Water Ecological Civilization City (WECC), combined with the construction mode in different countries, common and representative indicators were selected to construct a WHH assessment model which was applied to 15 cities worldwide. Based on the two subsystems of water ecosystem health and health of the humanities system, four domain levels, namely, water resources, ecological environment, economic and social development level, and water resources utilization, were used to reflect the water ecosystem health level of the city;
(b)
On the basis of the evaluation system established, the urban water health situation of 15 selected cities (5 WECC cities, 10 representative cities using other construction modes) were analyzed quantitatively, assisted by principal component analysis. The cities of Sydney, Cleveland, and Hamburg had the highest total scores, while WECC ranked poorly in the total score. Analysis of the subsystems showed that the scores of WECC were lower for the humanities system, but higher in the water ecosystem health subsystem, and Wuhan was even ranked third by this indicator;
(c)
Based on the results of PCA, considering the performance of various indicators and document availability, Wuhan, Sydney, and Cleveland were selected for documentary analysis. The center of gravity of three core documents for each city was calculated by extracting the number of WECC-related keywords, so as to compare and analyze the construction modes of different cities. Although Cleveland and Sydney use different construction modes, they have similar characteristics in the first-level indicators. Water safety guarantee accounts for the highest proportion in both cities, while the water culture system constitutes the smallest. The only difference is that Cleveland pays more attention to water ecological health, while Sydney has a more systematic system of water resources management. The documentary analysis results for Wuhan were quite different from the previous two cities. Wuhan has a higher focus on water resources management and water culture system, and attaches more importance to integrating water culture into the process of water resources management to promote the restoration and protection of the water ecosystem;
(d)
Based on the analysis results of PCA and documentary analysis, this study analyzed the advantages and disadvantages and applicability of WECC. Although WECC has problems, such as imperfect legislation, backwards construction practices in water ecological engineering projects, and insufficient regional cooperation, its emphasis on the value of water culture is a unique feature that enhances the comprehensive nature of the WECC mode.
Nevertheless, there are still limitations to this study. The evaluation index system of the WHH assessment model can be further developed and tested. Urban water ecosystem health assessment has the characteristics of sustainability and periodicity. With the evolution of the relationship between human beings and water, the development of water conservancy industry, the situation of water resources, and the key points of water resources management, the evaluation index system also needs to be constantly adjusted and recalculated to ensure the accuracy and effectiveness of urban water ecosystem health assessment results. Because of the lack of available data, it was not possible in this study to include an indicator for urban flooding in the WHH model, which limited the comprehensive nature of the index. Identifying a suitable indicator of urban flood risk that can be easily calculated for cities worldwide is an important future need.

Supplementary Materials

The following are available online at https://www.mdpi.com/article/10.3390/su15043071/s1, Table S1. The results of keyword analysis for Second-level indicators for Wuhan documents analyzed. Table S2. The results of First-level indicators for Wuhan. Table S3. The results of Second-level indicators for Cleveland. Table S4. The results of First-level indicators for Cleveland. Table S5. The results of Second-level indicators for Sydney. Table S6. The results of First-level indicators for Sydney. S1. Explanation of each evaluation index. S2. Sources of Data for the index values for the 15 study cities. S3. Relevant documents considered for documentary analysis for the selected three cities. S4. Key word extraction results.

Author Contributions

Conceptualization, Q.Y. and K.H.; methodology, software, validation and formal analysis, Q.Y.; investigation, Z.Z. and Y.Z.; resources, Q.Y. and K.H.; data curation, Y.L. and S.X.; writing—original draft preparation, Q.Y.; writing—review and editing, K.H., J.Y., Q.W., Y.Z. and X.Y.; visualization, Q.Y. and K.H.; supervision, K.H. and J.Y.; project administration, K.H. and J.Y.; funding acquisition, J.Y. All authors have read and agreed to the published version of the manuscript.

Funding

This research was funded by the National Science Foundation of China, grant number 52239003, and research and demonstration of key technologies for water safety assurance in Dawen River basin (Jinan section), Jinan Water Affairs Bureau. For the purpose of open access, the author has applied a Creative Commons Attribution (CC BY) licence to any Author Accepted Manuscript version arising from this submission.

Institutional Review Board Statement

Not applicable.

Informed Consent Statement

Not applicable.

Data Availability Statement

Not applicable.

Conflicts of Interest

The authors declare no conflict of interest.

References

  1. United Nations. Transforming Our World: The 2030 Agenda for Sustainable Development; UN Publishing: New York, NY, USA, 2015. [Google Scholar]
  2. Turok, I.; McGranahan, G. Urbanization and economic growth: The arguments and evidence for Africa and Asia. Environ. Urban. 2013, 25, 465–482. [Google Scholar] [CrossRef]
  3. Manning, W.J. Urban environment: Recognizing that pollution and social factors can create barriers to development of more healthy and liveable cities Introduction. Environ. Pollut. 2013, 183, 246. [Google Scholar] [CrossRef] [PubMed]
  4. Sharma, A.; Gardner, T.; Begbie, D. Approaches to Water Sensitive Urban Design: Potential, Design, Ecological Health, Urban Greening, Economics, Policies, and Community Perceptions; Elsevier: Duxford, UK, 2018. [Google Scholar]
  5. De Jong, M.; Joss, S.; Schraven, D.; Zhan, C.J.; Weijnen, M. Sustainable-smart-resilient-low carbon-eco-knowledge cities; making sense of a multitude of concepts promoting sustainable urbanization. J. Clean. Prod. 2015, 109, 25–38. [Google Scholar] [CrossRef]
  6. Joss, S.; Molella, A.P. The Eco-City as Urban Technology: Perspectives on Caofeidian International Eco-City (China). J. Urban Technol. 2013, 20, 115–137. [Google Scholar] [CrossRef]
  7. Caprotti, F. Critical research on eco-cities? A walk through the Sino-Singapore Tianjin Eco-City, China. Cities 2014, 36, 10–17. [Google Scholar] [CrossRef]
  8. Rodrigues, A.L.; Da Silva, D.D.; de Menezes, F.C. Methodology for Allocation of Best Management Practices Integrated with the Urban Landscape. Water Resour. Manag. 2021, 35, 1353–1371. [Google Scholar] [CrossRef]
  9. Rodrigues, M.; Antunes, C. Best Management Practices for the Transition to a Water-Sensitive City in the South of Portugal. Sustainability 2021, 13, 2983. [Google Scholar] [CrossRef]
  10. Xu, C.Q.; Jia, M.Y.; Xu, M.; Long, Y.; Jia, H.F. Progress on environmental and economic evaluation of low-impact development type of best management practices through a life cycle perspective. J. Clean. Prod. 2019, 213, 1103–1114. [Google Scholar] [CrossRef]
  11. Bahrami, M.; Bozorg-Haddad, O.; Loaiciga, H.A. Optimizing stormwater low-impact development strategies in an urban watershed considering sensitivity and uncertainty. Environ. Monit. Assess. 2019, 191, 14. [Google Scholar] [CrossRef]
  12. Leimgruber, J.; Krebs, G.; Camhy, D.; Muschalla, D. Sensitivity of Model-Based Water Balance to Low Impact Development Parameters. Water 2018, 10, 1838. [Google Scholar] [CrossRef] [Green Version]
  13. Shafique, M.; Kim, R. Retrofitting the Low Impact Development Practices into Developed Urban areas Including Barriers and Potential Solution. Open Geosci. 2017, 9, 240–254. [Google Scholar] [CrossRef]
  14. Alves, A.; Vojinovic, Z.; Kapelan, Z.; Sanchez, A.; Gersonius, B. Exploring trade-offs among the multiple benefits of green-blue-grey infrastructure for urban flood mitigation. Sci. Total Environ. 2020, 703, 134980. [Google Scholar] [CrossRef]
  15. O’Donnell, E.C.; Netusil, N.R.; Chan, F.K.; Dolman, N.J.; Gosling, S.N. International Perceptions of Urban Blue-Green Infrastructure: A Comparison across Four Cities. Water 2021, 13, 544. [Google Scholar] [CrossRef]
  16. Alves, A.; Gersonius, B.; Kapelan, Z.; Vojinovic, Z.; Sanchez, A. Assessing the Co-Benefits of green-blue-grey infrastructure for sustainable urban flood risk management. J. Environ. Manag. 2019, 239, 244–254. [Google Scholar] [CrossRef]
  17. Ahammed, F. A review of water-sensitive urban design technologies and practices for sustainable stormwater management. Sustain. Water Resour. Manag. 2017, 3, 269–282. [Google Scholar] [CrossRef]
  18. Meng, X.L. Understanding the effects of site-scale water-sensitive urban design (WSUD) in the urban water cycle: A review. Blue-Green Syst. 2022, 4, 45–57. [Google Scholar] [CrossRef]
  19. Sedrez, M.; Xie, J.; Cheshmehzangi, A. Integrating Water Sensitive Design in the Architectural Design Studio in China: Challenges and Outcomes. Sustainability 2021, 13, 4853. [Google Scholar] [CrossRef]
  20. Rentachintala, L.; Reddy, M.G.; Mohapatra, P.K. Urban stormwater management for sustainable and resilient measures and practices: A review. Water Sci. Technol. 2022, 85, 1120–1140. [Google Scholar] [CrossRef]
  21. Seyedashraf, O.; Bottacin-Busolin, A.; Harou, J.J. Many-Objective Optimization of Sustainable Drainage Systems in Urban Areas with Different Surface Slopes. Water Resour. Manag. 2021, 35, 2449–2464. [Google Scholar] [CrossRef]
  22. Jato-Espino, D.; Toro-Huertas, E.I.; Guereca, L.P. Lifecycle sustainability assessment for the comparison of traditional and sustainable drainage systems. Sci. Total Environ. 2022, 817, 152959. [Google Scholar] [CrossRef]
  23. Chao, Z.; Song, X.; Feng, X. Concept and Connotation of Water Resources Carrying Capacity in Water Ecological Civilization Construction. Int. Conf. Adv. Environ. Eng. 2018, 111, 012003. [Google Scholar] [CrossRef]
  24. Zuo, Q. Theory of adaptive utilization of water resources and its application prospect in water management practices. South-North Water Transf. Water Sci. Technol. 2017, 15, 18–24. [Google Scholar]
  25. Zhao, Z.; Zhang, Y.; Huang, H.; Tian, Y.; Yuan, Y. Concept and connotation of aquatic ecological civilization based on problem orientation. Water Resour. Prot. 2019, 35, 84–88. [Google Scholar]
  26. Yue, Q.; Wen, Q.; He, Y.; Tian, P.; Wang, Q.; Yu, J.; Zhu, Z. Influence of water ecological civilization city construction on urban water ecological carrying capacity: A case study of Wuhan City. Acta Ecol. Sin. 2021, 41, 5586–5597. [Google Scholar]
  27. Pi, J.; Shu, O.; Zhang, D.; Liu, C. Water ecological civilization evaluation based on PSR-matter element model: A case study of Nanchang City. J. Water Resour. Water Eng. 2018, 29, 55–61. [Google Scholar]
  28. Qi, Q.; Song, S. Development Level Evaluation of Water Ecological Civilization in Yangtze River Economic Belt. Discret. Dyn. Nat. Soc. 2022, 2022, 8576365. [Google Scholar] [CrossRef]
  29. Tian, M.; Teng, w.; Yu, S. Study on the Evaluation of Water Ecological Civilization-A Case of Cities in the Pearl River Delta Region of China. Int. J. Earth Sci. Eng. 2016, 9, 1689–1694. [Google Scholar]
  30. Wang, T. Study on Evaluation System for Water Ecological Civilization of Cross Border River Cities in China. Rev. Fac. Ing. 2017, 32, 251–256. [Google Scholar]
  31. Tian, P.; Wu, H.; Yang, T.; Jiang, F.; Zhang, W.; Zhu, Z.; Yue, Q.; Liu, M.; Xu, X. Evaluation of urban water ecological civilization: A case study of three urban agglomerations in the Yangtze River Economic Belt, China. Ecol. Indic. 2021, 123, 107351. [Google Scholar] [CrossRef]
  32. Chinese Ministry of Water Resources. Notice of the Ministry of Water Resources on Printing the List of the First Batch of Cities That Have Passed the Acceptance of the National Pilot Project of Water Ecological Civilisation Construction; Gazette of the Ministry of Water Resources of the People’s Republic of China; Chinese Ministry of Water Resources: Beijing, China, 2018; Volume 36.
  33. Chinese Ministry of Water Resources. Notice of the Ministry of Water Resources on Printing the List of the Second Batch of Cities That Have Passed the Acceptance of the National Pilot Project of Water Ecological Civilisation Construction; Chinese Ministry of Water Resources: Beijing, China, 2019; Volume 100.
  34. Cleveland National Forest. Land Management Plan. Available online: https://www.fs.usda.gov/detail/cleveland/landmanagement/planning/?cid=fsbdev7_016672 (accessed on 14 December 2022).
  35. Minnesota Pollution Control Agency. City of Saint Paul’s City of Saint Paul’s Stormwater Management Program; Minnesota Pollution Control Agency: Saint Paul, MN, USA, 2022.
  36. Authority Toronto and Region Conservation. Low Impact Development Stormwater Management Planning and Design Guide; TRCA: Toronto, ON, Canada, 2010. [Google Scholar]
  37. Victorian Stormwater Committe. Urban Stormwater: Best Practice Environmental Management Guidelines; CSIRO Publishing: Clayton, Australia, 1999.
  38. Martin, P.; Turner, B.; Waddington, K.; Pratt, C.; Campbell, N.; Payne, J.; Reed, B. Sustainable Urban Drainage Systems—Design Manual for Scotland and Northern Ireland; CIRIA: London, UK, 2000. [Google Scholar]
  39. Fryd, O.; Backhaus, A.; Birch, H.; Fratini, C.F.; Ingvertsen, S.T.; Jeppesen, J.; Panduro, T.E.; Roldin, M.; Jensen, M.B. Water sensitive urban design retrofits in Copenhagen-40% to the sewer, 60% to the city. Water Sci. Technol. 2013, 67, 1945–1952. [Google Scholar] [CrossRef]
  40. Joss, S. Eco-cities: A global survey 2009. WIT Trans. Ecol. Environ. 2010, 129, 239–250. [Google Scholar] [CrossRef]
  41. Gustafsson, H.-R.; Kelly, E.A. How Cities Will Save the World: Developing the Sustainable City: Curitiba, Brazil, as a Case Study; Routledge: Abingdon-on-Thames, UK, 2016; ISBN 9781315587158. [Google Scholar]
  42. Dave, C.; Dennis, C.; Pete, W.; Nathan, P.; Bill, L.; Ronnie, S.; Dan, H.; Kathy, S.; Joyce, M.; Andy, S.; et al. Bulletin 916: BMPs for Erosion Control for Logging Practices in Ohio; Ohio State University Extension: Columbus, OH, USA, 2004. [Google Scholar]
  43. Cleveland Office of Sustainability. Water Quality and Efficiency. Available online: https://www.clevelandohio.gov/CityofCleveland/Home/Government/CityAgencies/OfficeOfSustainability/WaterQualityAndEfficiency. (accessed on 14 December 2022).
  44. Minnesota Pollution Control Agency. City of Saint Paul’s City of Saint Paul’s 2021 Stormwater Permit Annual Report; Minnesota Pollution Control Agency: Saint Paul, MN, USA, 2022.
  45. City of Minneapolis and the Minneapolis Park & Recreation Board. NPDES MS4 Phase I Permit Annual Report for 2021 Acitivities; City of Minneapolis and the Minneapolis Park & Recreation Board: Minneapolis, MN, USA, 2022.
  46. Roy, A.H.; Wenger, S.J.; Fletcher, T.D.; Walsh, C.J.; Ladson, A.R.; Shuster, W.D.; Thurston, H.W.; Brown, R.R. Impediments and solutions to sustainable, watershed-scale urban stormwater management: Lessons from Australia and the United States. Environ. Manag. 2008, 42, 344–359. [Google Scholar] [CrossRef]
  47. Castro, J.E.; Kaika, M.; Swyngedouw, E. London: Structural continuities and institutional change in water management. Eur. Plan. Stud. 2003, 11, 283–298. [Google Scholar] [CrossRef]
  48. Zhou, Q.Q. A Review of Sustainable Urban Drainage Systems Considering the Climate Change and Urbanization Impacts. Water 2014, 6, 976–992. [Google Scholar] [CrossRef]
  49. Backhaus, A.; Fryd, O. Analyzing the first loop design process for large-scale sustainable urban drainage system retrofits in Copenhagen, Denmark. Environ. Plan. B-Plan. Des. 2012, 39, 820–837. [Google Scholar] [CrossRef]
  50. European Commission. Hamburg: European Green Capital 2011; European Commission: Brussels, Belgium, 2011. [Google Scholar]
  51. City of Hamburg. Hamburg—European Green Capital 2011 Final Report; City of Hamburg: Hamburg, Germany, 2012. [Google Scholar]
  52. Macedo, J. Planning a Sustainable City: The Making of Curitiba, Brazil. J. Plan. Hist. 2013, 12, 334–353. [Google Scholar] [CrossRef]
  53. Soltani, A.; Sharifi, E. A case study of sustainable urban planning principles in Curitiba (Brazil) and their applicability in Shiraz (Iran). Int. Soc. Dev. Sustain. 2012, 1, 120–134. [Google Scholar]
  54. Kan, D.; Yao, W.; Lyu, L.; Huang, W. Temporal and Spatial Difference Analysis and Impact Factors of Water Ecological Civilization Level: Evidence from Jiangxi Province, China. Land 2022, 11, 1459. [Google Scholar] [CrossRef]
  55. Chai, N.J.; Zhou, W.L.; Wan, B.T. Research on performance evaluation and obstacle diagnosis for urban water ecological civilization construction based on GFAHP-cloud-FSE model: The case of Shizuishan, China. Stoch. Environ. Res. Risk Assess. 2022, 36, 3439–3465. [Google Scholar] [CrossRef]
  56. Jensen, W.A.; Alexander, M. Statistics for Engineering and the Sciences, 6th edition. J. Qual. Technol. 2016, 48, 297–299. [Google Scholar] [CrossRef]
  57. Preedy, V.; Watson, R. Handbook of Disease Burdens and Quality of Life Measures: Varimax Rotation; Springer: New York, NY, USA, 2010. [Google Scholar]
  58. KAISER, H.F. The varimax criterion for analytic rotation in factor-analysis. Psychometrika 1958, 23, 187–200. [Google Scholar] [CrossRef]
  59. Olsen, W. Data Collection: Key Debates and Methods in Social Research; SAGE Publications: London, UK, 2012. [Google Scholar]
  60. Dong, R. Analysis on the construction of water ecological civilization and its evaluation index in China. In Proceedings of the 2017 3rd International Forum on Energy, Environment Science and Materials (IFEESM 2017), Shenzhen, China, 25–26 November 2017; Jiang, Z.Y., Ed.; Atlantis Press: Dordrecht, The Netherlands, 2017; pp. 1944–1950, ISBN 978-94-6252-453-8. [Google Scholar]
  61. Jiang, X.T.; Zhai, S.Y.; Liu, H.; Chen, J.; Zhu, Y.Y.; Wang, Z. Multi-scenario simulation of production-living-ecological space and ecological effects based on shared socioeconomic pathways in Zhengzhou, China. Ecol. Indic. 2022, 137, 108750. [Google Scholar] [CrossRef]
  62. Niu, n.; Xiao, x.; Kong, l. Evaluation of the first batch of pilot cities of water ecological civilization in the Pearl River Region. Water Resour. Dev. Res. 2018, 18, 55–58. [Google Scholar]
  63. Wang, D.; Li, Y.; Yang, X.; Zhang, Z.; Gao, S.; Zhou, Q.; Zhuo, Y.; Wen, X.; Guo, Z. Evaluating urban ecological civilization and its obstacle factors based on integrated model of PSR-EVW-TOPSIS: A case study of 13 cities in Jiangsu Province, China. Ecol. Indic. 2021, 133, 108431. [Google Scholar] [CrossRef]
  64. Yang, Q.; Gao, D.; Song, D.; Li, Y. Environmental regulation, pollution reduction and green innovation: The case of the Chinese Water Ecological Civilization City Pilot policy. Econ. Syst. 2021, 45, 100911. [Google Scholar] [CrossRef]
  65. Li, L.; Chen, W.; Li, D. Water ecological civilization construction level and spatio-temporal distribution of city group in Yangtze River Delta. Environ. Pollut. Control 2022, 44, 546–551. [Google Scholar]
  66. Hu, Y. Evaluation of Ecological Civilization Construction of Water System. Adv. Mater. Res. 2014, 933, 959–962. [Google Scholar] [CrossRef]
  67. Wong, T.H.F.; Brown, R.R. The water sensitive city: Principles for practice. Water Sci. Technol. 2009, 60, 673–682. [Google Scholar] [CrossRef] [Green Version]
  68. Wuhan City Garden and Forestry Bureau. 2019 Annual Report on Government Information Disclosure of Wuhan City Garden and Forestry Bureau; WCGFB Publication: Wuhan, China, 2019. [Google Scholar]
Figure 1. Geographical distribution of study cities by country/continent.
Sustainability 15 03071 g001
Figure 2. The total urban water ecological health index score and scores for different domain levels for the 15 study cities.
Sustainability 15 03071 g002
Table 1. Cities selected for this research with different urban water ecological construction modes.
City (Country)Construction ModeStarting Time
Chengdu, ChinaWECC2013 [32]
Wuhan, ChinaWECC2014 [33]
Xiangyang, ChinaWECC2014 [33]
Zhuzhou, ChinaWECC2014 [33]
Suining, ChinaWECC2014 [33]
Cleveland, OH, USABMPs, LID and GBI2000 [34]
Minneapolis, MN, USABMPs, LID and GBI2000 [35]
St. Paul, MN, USABMPs, LID and GBI2000 [35]
Toronto, ON, CanadaGBI and LID1994 [36]
Melbourne, AustraliaWSUD1999 [37]
Sydney, AustraliaWSUD1999 [37]
London, UKSUDS2000 [38]
Copenhagen, DenmarkSUDS and WSUD2007 [39]
Hamburg, GermanyEco-city2009 [40]
Curitiba, BrazilEco-city1970 [41]
Table 2. Components of the Urban Water Ecosystem Construction Index constructed for this study. For indicator attributes, “positive” means a positive association is expected between the indicator value and urban water ecosystem health, whilst “negative” means a negative association is expected.
Subsystem LayerDomain LevelIndicatorAbbreviationUnitIndicator Attributes
Water ecosystem healthWater resourcesAverage monthly precipitation in the wet seasonA1mmPositive
Average monthly precipitation in the dry seasonA2mmPositive
Water environment-related civic featuresA3NumberPositive
Water resources per capitaA4m3/per capitaPositive
Ecological environmentForest cover rateB1%Positive
Wetland area cover rateB2%Positive
Water function area water quality compliance rateB3%Positive
Drinking water quality compliance rateB4%Positive
Health of the humanities systemEconomic and social development levelThe population densityC1people/km2Positive
GDP per capitaC2£Positive
Secondary industry output value as a percentage of GDPC3%Negative
Tertiary industry output value as a percentage of GDPC4%Positive
Water resources utilizationWater consumption per yearD1m3/capitaNegative
Average water consumption per ha of farmland irrigationD2m3/haNegative
Water consumption per GBP 10,000 of industrial added valueD3m3Negative
Proportion of groundwater in water supplyD4%Negative
Sewage treatment compliance rateD5%Positive
Recycling rate of water used by industriesD6%Positive
Exchange rate: 1 USD = 0.8 GBP, CNY = 0.11 GBP, EUR = 0.89 GB, 3 June 2020.
Table 3. Interpretation of total variance.
Principal ComponentThe Initial Eigenvalue
TotalVariance, %Cumulative, %
16.00533.36133.361
24.28623.81157.172
31.80210.01167.183
41.5728.73575.918
51.1606.44682.365
60.9095.05087.415
LLLL
18−1.610 × 10⁻¹⁶−8.947 × 10−16100.000
Table 4. Principal component weighted values of the indicators within the urban water ecological health index.
IndicatorPrincipal Component Weightings Q T o t a l QTotal*
Q1Q2Q3Q4Q5Q6
A1−0.0840.01530.01630.02890.02110.002369.49 × 10−50.000182
A20.0151−0.00364−0.02120.061−0.008480.02030.0630.121
A3−0.01510.05460.008330.0360.0153−0.02530.07390.142
A4−0.0157−0.00959−0.00060.01120.01170.06030.0570.11
B1−0.0365−0.0356−0.009670.01410.009070.0132−0.0453−0.0872
B2−0.0147−0.0069−0.001930.04160.0116−0.0299−0.000249−0.00048
B30.0431−0.0205−0.08360.0177−0.008780.00314−0.0489−0.0942
B4−0.002830.06380.008030.00132−0.018−0.0006880.05160.0994
C1−0.0195−0.02410.0605−0.02230.01250.003340.01040.0201
C20.0651−0.00882−0.01330.0112−0.000490.007670.06130.118
C30.05570.00901−0.002680.0192−0.01360.007280.07490.144
C40.02480.013610.02940.0131−0.00207−0.009440.06950.133
D10.05570.00901−0.002680.0192−0.01360.007280.07490.144
D20.0519−0.027−0.00342−0.02640.02−0.0187−0.00374−0.00721
D30.0409−0.0398−0.0250.0008860.03820.002360.01750.0337
D4−0.0475−0.01130.02110.0002950.07030.009640.04250.0819
D50.0154−0.0527−0.01450.02710.0145−0.00728−0.0174−0.0335
D6−0.01730.046−0.01380.009150.00680.006780.03760.0724
Note:   Q T o t a l * is the value of Q total after standardization using Z-scores, so that the sum of the weights of the 18 indicators is equal to 1.
Table 5. Keywords related to urban water ecological construction searched for in analysis of documents for the selected three cities.
First-Level IndexSecond-Level IndexKeywordAbbreviation
Water resources managementWater supply and utilizationWater supply (pipe, plants, dam, storage, catchment, pumping station)X1
Drinking waterX2
Domestic use (wash, clean, laundry, toilets)X3
Agriculture (irrigation, farmland, fertilizer)X4
Industry (manufacturing, power, cooling)X5
Water consumptionX6
Water recyclingWater conservation (save water)X7
Water reuse (recycle)X8
Treatment (disposal)X9
Reclaimed waterX10
Sewage (wastewater) managementX11
Water Resource EndowmentPrecipitation (rainfall)X12
TemperatureX13
Source of water (river, pond, lake, sea, stream, groundwater)X14
Distribution (run-off, water volume, dry season, wet season)X15
Water safety guaranteeWater source safetyCompliance rateX16
Safety (secure)X17
Protection (prevention)X18
Water quality (pollution)X19
Microorganism (coliform, Escherichia coli, colonies)X20
Toxicology index (e.g., arsenic, cadmium, chromium, lead, mercury, selenium, cyanide)X21
Chemical index (Ammonia nitrogen, Sulfide, Sodium, TN, TP, TSS)X22
Flood Resilience
and Drainage
FloodX23
DrainageX24
ControlX25
StormwaterX26
Assessment (evaluation, estimation) X27
Water regulation guaranteeDesign (plan)X28
GovernanceX29
Law (regulation, ACT or directive)X30
Supervision, monitoringX31
Water ecological healthWater ecological statusWater ecosystem (ecological)X32
Soil erosionX33
Biodiversity (aquatic fauna and flora, habitat)X34
Forest, wetlandX35
Ecological embankmentX36
Water ecological restorationRestoration (Recover)X37
Construct (grow)X38
ManagementX39
ResilienceX40
Water culture systemCultural heritageWater cultureX41
Local water culture carrier (park, garden museum, landscape)X42
Recreation and tourism (e.g., walking, camping, swimming, fishing, boating, canoeing, birdwatching, running, sightseeing, driving, photography)X43
Public awarenessPublicX44
ParticipationX45
SatisfactionX46
Publicity, education, trainingX47
Table 6. Total score and rank of urban water ecological health for the 15 study cities.
City (Country)Construction ModeTotal ScoreRank
Sydney, AustraliaWSUD1.4741
Cleveland, OH, USABMPs, LID and GBI1.1722
Hamburg, GermanyEco-city1.0933
London, UKSUDS0.5424
Copenhagen, DenmarkSUDS and WSUD0.5155
Toronto, ON, CanadaGBI and LID0.1226
Minneapolis, MN, USABMPs, LID and GBI−0.009107
Wuhan, ChinaWECC−0.08318
Melbourne, AustraliaWSUD−0.1169
St. Paul, MN, USABMPs, LID and GBI−0.23110
Chengdu, ChinaWECC−0.41611
Curitiba, BrazilEco-city−0.47312
Zhuzhou, ChinaWECC−0.81913
Xiangyang, ChinaWECC−1.27014
Suining, ChinaWECC−1.49915
Table 7. Score and ranking of the water ecosystem health system within the WHH model for the 15 study cities.
CityConstruction ModeScore of Water Ecosystem Health RANKScore of Health of the Humanities SystemRANK
Cleveland, OH, USABMPs, LID and GBI0.54210.6303
Sydney, AustraliaWSUD0.47520.9991
Wuhan, ChinaWECC0.3663−0.44912
Hamburg, GermanyEco-city0.36240.7312
Toronto, ON, CanadaGBI and LID0.2045−0.08189
London, UKSUDS0.15160.3915
Copenhagen, DenmarkSUDS and WSUD0.036370.4784
Minneapolis, MN, USABMPs, LID and GBI−0.088080.07896
Chengdu, ChinaWECC−0.1329−0.28311
Zhuzhou, ChinaWECC−0.14710−0.67213
St. Paul, MN, USABMPs, LID and GBI−0.16911−0.06268
Melbourne, AustraliaWSUD−0.179120.06327
Curitiba, BrazilEco-city−0.24913−0.22310
Xiangyang, ChinaWECC−0.38814−0.88215
Suining, ChinaWECC−0.78315−0.71614
Table 8. Scores and ranks for different domain levels within the WHH model for the 15 study cities.
Water Resources ScoreRankWater Ecological Environment ScoreRankEconomic and Social Development Level ScoreRankWater Resources Utilization ScoreRank
Wuhan, China0.31320.05227−0.34711−0.10110
Chengdu, China−0.215130.08226−0.358120.07476
Zhuzhou, China0.06255−0.21013−0.50113−0.17012
Xiangyang, China−0.25514−0.13312−0.55415−0.32814
Suining, China−0.37415−0.40815−0.54114−0.17513
Cleveland, OH, USA0.49610.046480.29140.3382
Minneapolis, MN, USA−0.194120.10650.1417−0.06268
St. Paul, MN, USA−0.14410−0.0245110.023410−0.08609
Toronto, ON, Canada−0.0086380.21320.02919−0.11011
London, UK−0.015990.16640.29530.09555
Hamburg, Germany0.14740.21410.46220.2674
Copenhagen, Denmark0.024770.011690.16660.3123
Sydney, Australia0.29030.18430.65810.3401
Melbourne, Australia−0.17911−0.000200100.061880.001407
Curitiba, Brazil0.05226−0.301140.1725−0.39615
Table 9. Selected documents.
CityDocument TitleAbbreviationDate
Published
Number of Pages
WuhanWuhan Water Resources Comprehensive Plan (2010–2030)W11 October 2012375
WuhanWuhan Water Ecological Civilization City Construction Pilot Implementation Plan (2015~2017)W231 January 2015161
WuhanWuhan City Sponge City Planning and Design GuidelinesW321 August 201568
ClevelandBig creek watershed planC1December 2013308
ClevelandCLEVELAND DIVISION OF WATER DESIGN AND CONSTRUCTION MANUALC26 February 2017249
ClevelandNOACA: Water Quality Strategic PlanC3December 201751
SydneyDEVELOPER HANDBOOK for WATER SENSITIVE URBAN DESIGNS1November 2013116
SydneySydney Decentralised Water Master Plan 2012–2030S2March 201782
Sydney2017 Metropolitan Water Plan for SydneyS3March 201780
Table 10. Comparison of second-level indicators.
Second-Level IndicatorsWuhan MeanCleveland MeanSydney Mean
Water supply and utilization14.3%17.6%18.5%
Water recycling3.22%2.51%10.9%
Water resource endowment27.3%13.2%7.05%
Water source safety7.42%12.9%5.34%
Flood resilience and drainage8.98%5.58%8.81%
Water regulation guarantee13.2%25.4%30.6%
Water ecological status10.7%6.47%7.26%
Water ecological restoration7.31%11.6%6.64%
Cultural heritage5.10%1.10%3.45%
Public awareness2.23%3.32%1.28%
Table 11. Comparison of first-level indicators.
First-Level IndicatorsWuhan MeanCleveland MeanSydney Mean
Water resource management44.90%33.40%36.50%
Water safety guarantee29.60%44.00%44.80%
Water ecological health18.00%18.10%13.90%
Water culture system7.33%4.42%4.73%
Disclaimer/Publisher’s Note: The statements, opinions and data contained in all publications are solely those of the individual author(s) and contributor(s) and not of MDPI and/or the editor(s). MDPI and/or the editor(s) disclaim responsibility for any injury to people or property resulting from any ideas, methods, instructions or products referred to in the content.

