Article

The Impact of Public Policy Measures during the COVID-19 Pandemic on the Characteristics of Urban Wastewater in the Republic of Serbia

by
Vesna Pešić
,
Milena Bečelić-Tomin
,
Anita Leovac Maćerak
,
Aleksandra Kulić Mandić
,
Dragana Tomašević Pilipović
and
Djurdja Kerkez
*
Department of Chemistry, Biochemistry and Environmental Protection, Faculty of Sciences, University of Novi Sad, Trg Dositeja Obradovića 3, 21000 Novi Sad, Serbia
*
Author to whom correspondence should be addressed.
Sustainability 2023, 15(4), 3047; https://doi.org/10.3390/su15043047
Submission received: 20 December 2022 / Revised: 1 February 2023 / Accepted: 2 February 2023 / Published: 8 February 2023

Abstract

:
The change in the way of life caused by the introduction of social restriction measures (closures, the restriction of working hours, and restriction of movement) by governments and thus, the resulting changes in people’s behavior, have affected all aspects of life, i.e., social activities, business, the environment and the performance of the infrastructure of the water supply system. Social distancing policies around the world in response to the pandemic have led to spatio-temporal variations in water consumption and therefore, to changes in the flow of wastewater, creating potential problems in the infrastructure, operation and quality of services. The goal of this work was to examine how these changes and how the pandemic itself affected the characteristics of municipal wastewater. Data on the quantity and quality of municipal wastewater in four settlements of different sizes in the Republic of Serbia in the period from 2015 to 2022 were collected. The data indicated an increase in the amount of wastewater generated in 2020, which may be a consequence of excessive water use. An increase in the mean concentrations of most parameters in 2020 compared to the previous five-year average was also observed. The most significant changes were observed concerning the concentrations of organic matter (2–124%), nitrogen (6–80%), phosphorus (14–91%), suspended matter (8–308%), fats and oils (97–218%) and surfactants (12–110%). Changes in terms of increasing concentrations were also noticed after the peak of the pandemic, i.e., in the period from 2021 to 2022. In addition, an increase in the COD/BOD ratio from around 2 to around 4 in the year 2020 was also observed (COD—Chemical Oxygen Demand; BOD—Biological Oxygen Demand). This is very important and should be taken into account in wastewater treatment procedures in order to achieve high efficiency in the operation of the plant itself.

Graphical Abstract

1. Introduction

The date 11 March 2020 marks the day when the World Health Organization declared a global pandemic caused by the COVID-19 virus [1]. The COVID-19 pandemic has spread rapidly around the world, having unexpected and diverse effects on mental health, lifestyles, the stability of economies and societies. The change in our way of life caused by the introduction of social restriction measures (closures, the limitation of working hours, restriction of movement) from the government, and thus the resulting changes in people’s behavior, affected all aspects of life, i.e., social activities [2,3], business [4], the environment [5,6,7] and the performance of the infrastructure of the water supply system [8,9,10].
The closure of national borders in the first half of 2020 led to short-term improvements in the environment in Europe. The reduced intensity of all types of traffic has led to improved air quality and noise levels, with nitrogen dioxide (NO2) concentrations in some cities decreasing by up to 60% and greenhouse gas (GHG) emissions in the EU decreasing by 10% compared to the same period in 2019 [11,12].
On the other hand, the need for protective and other disposable equipment has led to an increase in the production of plastic waste [13]. This situation, at the global level, is the result of the conflicting goals of human health protection and environmental protection policies, and it requires finding sustainable ways to achieve a compromise between these goals.
The impact of human health protection measures during the pandemic on wastewater as another waste stream has been analyzed in the studies published so far. Namely, social distancing policies around the world, in response to the pandemic, have led to spatio-temporal variations in water consumption [8,14], and therefore, to changes in the flow of wastewater, creating potential problems in the infrastructure, operation and quality of services [15]. It is known that the quantity and composition of municipal waste-water show characteristic variations depending on the day, week and year [16,17] as well as on the standard of living, the level of development and of water consumption, the wastewater removal method and other factors such as the meteorological conditions [17]. Changes in the quality and quantity of wastewater can affect the operation of wastewater treatment plants, which can have an indirect negative impact on the quality of recipient water, aquatic organisms and human health. Therefore, it is important to establish an efficient wastewater management system [18] in regular and emergency situations.
After the outbreak of the pandemic, the focus of numerous studies was the detection of the presence of viruses in wastewater and sludge after the wastewater treatment process [19,20,21,22,23,24,25,26]. The main goal of these research studies is to develop an effective tool for early warning—the detection of the presence of the virus and the determination of its persistence in the population—in order to supplement clinical testing and formulate appropriate mitigation measures [27,28,29].
In other studies, the effects from the recommendations of the World Health Organization for the more frequent disinfection of hands and surfaces in order to limit the spread of the virus were determined in terms of a greater amount of water consumed and the increased use of various cleaning agents, which was reflected in the quantity and quality of the wastewater [6]. An increase in the concentration of surfactants, biocides and cationic quaternary ammonium surfactants in wastewater was observed by some testing methods [30,31]. There is a concern that the presence of such chemicals could lead to the inhibition of biological wastewater treatment as well as malfunctions and stoppages in the operation of the wastewater treatment plant itself [32].
The first case of COVID-19 in the Republic of Serbia was confirmed on 6 March 2020. About 2.4 million patients were registered by November 2022. During 2020, the largest increase in the number of infected people both globally and in the Republic of Serbia was achieved. The authorities adopted certain measures to suppress the spread of the virus, which included a state of emergency from 15 March to 6 May 2020. During that period, state borders were closed, as well as numerous institutions and gathering places. After the abolishing of the state of emergency and until the end of the year, there were still numerous restrictions and measures that had a significant impact on the way of life of the population.
About 19% of the total amount of wastewater produced in Serbia is treated, while the quantity and quality of untreated wastewater is not monitored in all the agglomerations where it is generated. During the emergency situation, in agglomerations with wastewater treatment, supervision was carried out with a significantly lower intensity and without predetermined procedures. The aim of the work was to perform a screening analysis of the potential changes in the quantity and quality of wastewater within the period of the implementation of public policy measure to prevent the spread of infection and to determine the significance of these changes. The data were collected from different water utility companies. For this purpose, agglomerations of different sizes were selected. The obtained results were used to assess the need for the development of special protocols to mitigate the impact of implementing policies in similar, extraordinary conditions on the one hand and the need to consider these changes in the design of future wastewater treatment plants on the other.

2. Materials and Methods

The results from testing the quality and quantity of the raw wastewater from four settlements in the Republic of Serbia for the period from 2015 to 2022 were processed. Data on wastewater quantity measurements were only available on an annual basis, while data on wastewater quality were available on a monthly basis. Settlements were selected based on the distribution of settlements by size (settlement 1 is about 150,000 PE (population equivalent), settlement 2 is about 100,000 PE, settlement 3 is about 15,000 PE and settlement 4 is about 5000 PE). Industrial wastewater is also present in the wastewaters of settlements 1 and 2. Settlements 2, 3 and 4 have primary wastewater treatment (sedimentation), while settlement 1 discharges wastewater into the recipient without any treatment. The settlements were chosen based on their size as representatives of the Republic of Serbia’s northern province. They differ only in size, i.e., the number of inhabitants, while their lifestyles are nearly identical. Suburban settlements, like urban settlements, have equal access to all important institutions.
The data included the following parameters: flow (measurement carried out by the utility company), pH (SRPS H.Z1.111:1987), conductivity (Cond—SRPS EN 27888:1993), settleable solids (SS—P-IV-8), total suspended matter (TSS—SM 2540 D), total dissolved solid matter (TDS—SM 2540 B), chemical oxygen demand (COD—SRPS ISO 6060:1994), biological oxygen demand (BOD—H1.002), total Kjeldahl nitrogen (TKN—H1.003), ammonia nitrogen (N-NH4+—SRPS ISO H.Z1.184:1974), nitrate nitrogen (N-NO3—SRPS ISO 7890-3:1994), nitrite nitrogen (N-NO2—SRPS EN 26777:2009), total phosphorus (P-total—SRPS EN ISO 6878:2008), ortho-phosphates (PO43− SRPS EN ISO 6878:2008), oils and fats (O&G—EPA 1664 A:1999) and surfactants (Surfactants—SRPS EN 903:2009). The analysis was performed by accredited laboratories (SRPS ISO/IEC 17025:2017).
Statistical analysis was performed using the Microsoft Excel program. Basic statistical quantities (mean value, standard deviation and coefficient of variation) were calculated based on the assumption that the data were normally distributed. In order to quantify the nature of the distribution, the skewness and kurtosis coefficients were calculated. The skewness coefficient is a measure of the symmetry of the data around the mean, and the kurtosis coefficient is a measure of whether the data are peaked or flat relative to the normal distribution [33]. For a normal distribution, the coefficient of asymmetry would be zero, while its coefficient of kurtosis would be 3 [34].

3. Results

3.1. Wastewater Quantity

The wastewater quantity values for selected settlements are expressed on an annual basis for each year in the 2015–2021 period and shown in Table 1. Data on the measured quantities of wastewater show that in all agglomerations there was an increase in the produced wastewater amount in the period between 2015 and 2021. The amount of waste water produced during the pandemic (in 2020) was higher than the previous five-year average by 5–33% (5% for a settlement of 5000 PE, 33% for a settlement of 15,000 PE, 24% for a settlement of 100,000 PE and 10% for a settlement of 150,000 PE). The increased amount of wastewater produced in all the investigated settlements is a result of the common, equal way of life between urban and suburban areas.

3.2. Wastewater Quality

Wastewater management during the pandemic is a special challenge due to the increased production of wastewater as well as due to the changed composition. Statistical processing of data on the quality of wastewater for the period from 2015 to2022 showed that the concentrations of the wastewater quality parameters did not follow a normal distribution, as indicated by the values for kurtosis and asymmetry, which largely deviated from 3 and 0, respectively (Table 2). There is a high variability in these data for most of the examined parameters, which is indicated by the variance in each parameter of the quality of wastewater.
In order to further investigate the changes in wastewater quality during the pandemic (year 2020), the mean values of the parameter concentrations from the year 2020 were compared with the mean values of the concentrations for the previous five-year period (2015–2019). Table 3 shows these values, where the calculated ratios with the sign “−” indicate a decrease in the average concentration of the given parameter in 2020 compared to the previous five-year average. Positive results indicate an increase in the average concentrations in 2020. From processing the data, we established that there were significant differences compared to the previous period in the settleable solids, organic matter, nutrients, surfactants, and fats and oils for all settlements, regardless of their size. In all settlements, an increase in the average concentration values was observed for: conductivity, COD, BOD, ammonia nitrogen, total phosphorus, orthophosphates, fats and oils, and surfactants. A higher percentage of increase in the content of organic matter was observed in the smaller settlements. The COD/BOD ratios (a measure of biodegradability) were generally around 2 in all settlements during the entire investigated period, except for the smallest settlement in 2020, where the ratio was 4. In three of the four settlements, there was a slight increase in the ratio, but it was not significant.
A decrease in the concentration of settleable solids was observed in two settlements, while an increase was observed in two (larger) settlements. For the settlement for which an increase of 120% was calculated, the range of average values was from 1.42 to 3.12. Low concentrations were measured, and any small increase is reflected significantly in the percentages. Given that the settleable solids represent suspended solids that can be removed by conventional sedimentation processes, such changes may affect the primary treatment of wastewater.
More significant changes in the concentration of suspended matter were detected in smaller settlements (39% and 307%). The increase in the concentration of suspended matter could also have been influenced by rainfall, considering that wastewater is discharged into the combined sewage system.
Nitrite and nitrate nitrogen concentrations are generally very low, so that every small change is reflected in a significant deviation, either in terms of an increase or decrease compared to the previous period. An increase in the concentration of fats and oils and detergents was observed in all four settlements, mostly in a significant percentage.
As the pandemic continued—and still continues, but with a significantly lower number of infected people and the normalization of lifestyles—changes in the quality of wastewater in the period after 2020 were also examined. For this purpose, data from the period from 2021 to 2022 were processed and their mean values compared with the mean values of the analyzed parameters from the wastewater samples from 2020 (Table 4). These results show that the usual approach to our way of life continued after 2020. Namely, the average values for most parameters in the period from 2021 to 2022 were lower compared to for 2020.
Greater deviations are observed in terms of the reduction of measured values for electrical conductivity, total dissolved salts, total suspended matter and settleable solids. From comparing all four agglomerations, we can see that these changes are most pronounced in the wastewater of the smaller settlements.
To ensure that these changes are not random annual deviations, the mean values of the concentrations of the given parameters for the entire period of the pandemic were compared with the previous five-year period (Table 5). These results indicate changes in the quality of the wastewater of the agglomerations in terms of the increasing concentrations for almost all of the parameters compared to the previous five-year average.

4. Discussion

During 2020, the number of inhabitants in the agglomerations was constant due to the implemented measures for the restriction of movement and travel bans resulting from the COVID-19 pandemic. The situation resulted in an increase in the amount of wastewater produced. The increased wastewater quantity is the consequence of a greater consumption of water in households and public areas. Such data have been recorded in the studies that have been published so far from certain countries. Namely, the data analysis showed that during the pandemic, increased water consumption led to an increase in the production of wastewater of about 20–25% in India [35] and Iran [36]. Some research indicates the increased amount of wastewater during 2020 is dependent on more frequent cleaning and disinfection [35].
It is evident that the most pronounced increase in the amount of wastewater this year was in the smaller and medium-sized settlements. Namely, most y of the residents from the smaller agglomerations were employed in towns where a significant number of trade, catering and similar facilities were closed, and the educational institutions also stopped working. Because of this, as well as the larger hotspots of infection, there was no daily emigration of the workforce to the towns. Having that in mind, the reason for the increased amount of wastewater in the smaller agglomerations may be several months’ stay at home. In larger agglomerations, the increase in the number of people compared to the number of residents might be the consequence of establishing a greater number of quarantine centers, screening centers, isolation departments and testing facilities in 2020. This is one of the most important causes for the increased amounts of urban wastewater in these agglomerations [37].
Industries that discharge wastewater into the sewage system of larger agglomerations (100,000 and 150,000 PE) belong to the following sectors: food, chemical, metal processing, traffic and transport. According to data from the pollutant register of PWMC “Vode Vojvodine”, no significant changes in their annual production capacity were recorded in the 2015–2022 period, and it is assumed that there were no significant variations in terms of the reduced production from these sources of wastewater during the state of emergency. These data indicate that the share of industrial wastewater in the total amount of generated wastewater was significantly lower compared to the share of wastewater originating from the population, and under the conditions of the applied public policy measures, its impact on the increased amount of wastewater in these agglomerations is not significant.
Atmospheric precipitation is one of the natural factors that certainly influenced the measured amount of wastewater from the combined sewage systems. From looking at the data on precipitation from the previous period, we observed no increase in the amount of precipitation for 2020. On the contrary, the average amount of precipitation in the northern part of the Republic of Serbia, where the investigated settlements were located, was 626 mm for the 2015–2019 period, while in 2020, that amount was 566 mm. The tendency of the average amount of precipitation to decrease continued in the 2021–2022 period and was observed to be 466 mm [38]. However, the fact is that in 2020, there was intense, abundant precipitation in the spring and summer months, which had an impact on the increased content of suspended matter and BOD (Table 3), as a result of the washing of particles of organic matter during these meteorological events. The concentrations of these parameters are correlated with the amount of precipitation in cases where sampling was performed during or immediately after precipitation. Considering that the quantity and quality of wastewater were not measured on a daily basis, it is not possible to do a more detailed statistical analysis of these connections at this moment.
The asymmetry and kurtosis coefficients for all wastewater quality parameters clearly showed that the data were not normally distributed, which is actually standard and common [39]. However, during the pandemic, there has been a significant variation in the quality of the wastewater compared to the previous five-year period, either in terms of a values increase or decrease.
The increase in the concentrations of organic matter and nitrogen might be a consequence of the increased usage of surfactants and biocides (disinfectants), as established by Alygizakis et al. [30]. The excessive use of disinfection chemicals could possibly be the cause of the increase in both phosphorus and TSS [40,41,42,43].
The ratio of COD to BOD was slightly increased in the smallest settlement, which is also a consequence of the excessive use of disinfectants. This ratio is certainly very important in determining the biodegradability of wastewater [39]. It is important to note that wastewater with a COD/BOD ratio greater than 2 is usually difficult to treat. The decrease in COD and BOD values in some cases may be the result of an increased water inflow that resulted in dilution [36]. The concentration of organic substances in wastewater was also influenced by various pharmaceuticals (antibiotics, antipyretics, analgesics) that are in high demand, particularly during the pandemic, along with easy access to pharmacies or hospitals. This highlights the importance of monitoring these contaminants in wastewater, particularly during a pandemic.
Dilution also affected the reduction in the concentrations of precipitable and suspended substances [36]. Atmospheric precipitation also contributed to the dilution of municipal wastewater, if water sampling was performed during or immediately after precipitation. A decrease in the concentration of precipitable substances was observed in two settlements, while an increase was observed in two (larger) settlements. In the settlement with a significant increase (120%), the range of average values indicates that even a small change in the concentration is more reflected in the percentage of change and thus, its significance is indicated.
Some authors [44] indicated that the increase in fat and oil concentrations is associated with policy measures in terms of longer stays at home and more frequent food preparation. This is very important to take into account because of the possible negative effects of fats and oils on sewage systems and on the water purification process. These substances can cause the clogging and corrosion of sewer pipes under anaerobic conditions, thus reducing their life. Additionally, fats and oils interfere with the biological treatment of wastewater, affect the clogging of filters and pumps, cause unpleasant odors and can also settle in the sludge, making it viscous and reducing the efficiency of sludge dewatering [45]. The higher concentrations of detergents are most likely the result of more frequent use, both in households and in industries, and are due to the recommendations aimed at reducing the spread of viruses. Detergents, due to their low biodegradability, foaming, toxicity and high absorption of particles, can have different effects on the water composition and on the efficiency of the biological treatment process. In addition, detergents can represent a significant source of phosphorus and organic matter in wastewater.
However, the limitations of this study in terms of the available data point to the fact that the overall annual averages cannot accurately reflect the importance of the impact of the pandemic and the implemented public policy, as stated by Ahmed et al. [46]. A clearer picture of this could be given by weighted concentrations taking into account separate monthly variations obtained on the basis of daily measurements, which could better reflect the variation of load changes than using the average concentration [46,47]. Monthly variations can be clearly linked to lifestyle changes due to policies imposed during the pandemic in order to reflect many parameters including lockdown measures [46]. A larger amount of data, primarily on the quantity and quality of the city’s wastewater itself collected on a daily basis, would be suitable for a more detailed statistical analysis, where it would be possible to discard the random extremes from the measured values and compare the results with those from the previous period, but in the same time scales. In addition, in order to draw conclusions about the possible effects of the pandemic on the characteristics of city wastewater, it is necessary to monitor the inflow of stormwater (rainfall) and in settlements with industry, the composition of industrial wastewater.
Although wastewater treatment facilities already have a certain buffering capacity for when the quantity and quality of wastewater changes [36], based on the available data presented in this paper concerning these changes, it is possible to develop a response scenario in terms of the operational changes in the facility itself. Additionally, the higher load of wastewater we observed should certainly be taken into account in the future when upgrading the plant, i.e., for the application of biological treatment and the ensuring of its optimal operation.
The research in this work identified changes in the quality of urban wastewater as a result of the changed way of life during the pandemic period. Possible causes of these changes were also identified, based on a limited amount of data and the measurements collected in the Republic of Serbia. To connect the causes and consequences of the changes with certainty, additional research is undoubtedly required, during which all of the previously mentioned data would be collected in an appropriate time and space.

5. Conclusions

It was established that the measures aimed at the control of the COVID-19 pandemic caused significant changes in the characteristics of the wastewater in the agglomerations in the Republic of Serbia during 2020.
A more comprehensive and responsible approach to measurements and data collection is necessary. However, the findings of this study may be useful to wastewater treatment plant operators when developing wastewater management protocols and implementing monitoring programs. The aim would be to perform appropriate measurements in some similar future situations, in time, with the goal of collecting a larger volume of data. This paper indicates the necessity of simultaneous and certainly more frequent measurements (compared to the existing monthly frequency) of the quantity and quality of municipal and industrial wastewater, as well as of the atmospheric precipitation. These data, obtained on a daily basis, would be suitable for a more detailed statistical analysis, which could and should serve the competent authorities in the adoption of various public policy measures (for example, those to prevent the spread of infection). More concrete conclusions can be drawn from more extensive data, which could also assist competent authorities in the process of decision-making in the field of water management, particularly in the establishment of wastewater monitoring programs.
The importance of the lessons learned from past experiences, such as the positive and negative effects of public policy during the pandemic, should certainly be taken into account when creating sustainable and coherent recovery policies from the consequences of the COVID-19 pandemic.

Author Contributions

V.P.—Conceptualization, Formal analysis, Writing—original draft; M.B.-T.—Visualization, Writing—review and editing, Supervision; A.L.M.—Visualization, Methodology, Data curation; A.K.M.—Software, Methodology, Data curation; D.T.P.—Writing—review and editing, Supervision; D.K.—Writing—review and editing, Supervision, Resources, Project administration, and Funding acquisition. All authors have read and agreed to the published version of the manuscript.

Funding

This research is funded by the Science Fund of the Republic of Serbia—Program for excellent projects of young researchers—PROMIS (WasteWaterForce Project #6066881).

Data Availability Statement

The datasets generated and/or analyzed during the current study are not publicly available due to intellectual property or confidentiality concerns but are available from the corresponding author on reasonable request.

Conflicts of Interest

The authors declare no conflict of interest. The funders had no role in the design of the study; in the collection, analyses, or interpretation of data; in the writing of the manuscript; or in the decision to publish the results.

References

  1. World Health Organization (WHO). Listings of WHO’s Response to COVID-19. 2020. Available online: https://www.who.int/news/item/29-06-2020-covidtimeline (accessed on 4 November 2022).
  2. Balanzá–Martínez, V.; Atienza–Carbonell, B.; Kapczinski, F.; De Boni, R.B. Lifestyle behaviours during the COVID-19—Time to connect. Acta Psychiatr. Scand. 2020, 141, 399–400. [Google Scholar] [CrossRef]
  3. Sheehan, M.M.; Pfoh, E.; Speaker, S.; Rothberg, M. Changes in social behavior over time during the COVID-19 pandemic. Cureus 2020, 23, e10754. [Google Scholar] [CrossRef]
  4. Nicola, M.; Alsafi, Z.; Sohrabi, C.; Kerwan, A.; Al-Jabir, A.; Iosifidis, C.; Agha, M.; Agha, R. The socio-economic implications of the coronavirus pandemic (COVID-19): A review. Int. J. Surg. 2020, 78, 185–193. [Google Scholar] [CrossRef]
  5. Aydın, S.; Nakiyingi, B.A.; Esmen, C.; Güneysu, S.; Ejjada, M. Environmental impact of coronavirus (COVID-19) from Turkish perceptive. Environ. Dev. Sustain. 2020, 23, 7573–7580. [Google Scholar] [CrossRef]
  6. Elsaid, K.; Olabi, V.; Sayed, E.; Wilberforce, T.; Abdelkareem, M. Effects of COVID-19 on the environment: An overview on air, water, wastewater, and solid waste. J. Environ. Manag. 2021, 292, 112694. [Google Scholar] [CrossRef]
  7. Paleologos, E.K.; O’Kelly, B.C.; Tang, C.-S.; Cornell, K.; Rodríguez-Chueca, J.; Abuel-Naga, H.; Koda, E.; Farid, A.; Vaverková, M.D.; Kostarelos, K.; et al. Post COVID-19 water and waste water management to protect public health and geoenvironment. Environ. Geotech. 2021, 8, 193–207. [Google Scholar] [CrossRef]
  8. Balacco, G.; Totaro, V.; Iacobellis, V.; Manni, A.; Spagnoletta, M.; Piccinni, A.F. Influence of COVID-19 spread on water drinking demand: The case of Puglia Region (Southern Italy). Sustain. Times 2020, 12, 5919. [Google Scholar] [CrossRef]
  9. Kalbusch, A.; Henning, E.; Brikalski, M.P.; Luca, F.V.; de Konrath, A.C. Impact of coronavirus (COVID-19) spread-prevention actions on urban water consumption. Resour. Conserv. Recycl. 2020, 163, 105098. [Google Scholar] [CrossRef]
  10. Spearing, L.A.; Thelemaque, N.; Kaminsky, J.A.; Katz, L.E.; Kinney, K.A.; Kirisits, M.J.; Sela, L.; Faust, K.M. Implications of social distancing policies on drinking water infrastructure: An overview of the challenges to and responses of U. S. Utilities during the COVID-19 pandemic. ACS EST Water 2020, 1, 888–899. [Google Scholar] [CrossRef]
  11. European Environment Agency. Air Pollution Goes Down as Europe Takes Hard Measures to Combat Coronavirus. 2020. Available online: https://www.eea.europa.eu/highlights/air-pollution-goes-down-as (accessed on 25 March 2020).
  12. European Environment Agency. EU Achieves 20-20-20 Climate Targets, 55% Emissions Cut by 2030 Reachable with More Efforts and Policies. 2021. Available online: https://www.eea.europa.eu/highlights/eu-achieves-20-20-20 (accessed on 4 November 2021).
  13. European Environment Agency. COVID-19 in Europe: Increased Pollution from Masks, Gloves and Other Single-Use Plastics. 2021. Available online: https://www.eea.europa.eu/highlights/covid19-in-europe-increased-pollution (accessed on 6 July 2021).
  14. Bakchan, A.; Roy, A.; Faust, K.M. Impacts of COVID-19 social distancing policies on water demand: A population dynamics perspective. J. Environ. Manag. 2022, 302, 113949. [Google Scholar] [CrossRef]
  15. Bakchan, A.; Roy, A.; Fasut, K. Leveraging water-wastewater data interdependencies to understand infrastructure systemsʹ behaviors during COVID-19 pandemic. J. Clean. Prod. 2022, 367, 132962. [Google Scholar] [CrossRef]
  16. Fernandez, F.J.; Seco, A.; Ferrer, J.; Rodrigo, M.A. Use of neurofuzzy networks to improve wastewater flow-rate fore-casting. Environ. Model. Softw. 2009, 24, 686–693. [Google Scholar] [CrossRef]
  17. Zhang, Q.; Li, Z.; Snowling, S.; Siam, A.; El-Dakhakhni, W. Predictive models for wastewater flow forecasting based on time series analysis and artificial neural network. Water Sci. Technol. 2019, 80, 243–253. [Google Scholar] [CrossRef]
  18. Venugopal, A.; Ganesan, H.; Raja, S.S.S.; Govindasamy, V.; Arunachalam, M.; Narayanasamy, A.; Sivaprakash, P.; Rahman, P.K.S.M.; Gopalakrishnan, A.V.; Siama, Z.; et al. Novel wastewater surveillance strategy for early detection of coronavirus disease 2019 hotspots. Environ. Sci. Health 2020, 17, 8–13. [Google Scholar] [CrossRef]
  19. Ahmed, W.; Angel, N.; Edson, J.; Bibby, K.; Bivins, A.; O’Brien, J.W.; Choi, P.M.; Kitajima, M.; Simpson, S.L.; Li, J.; et al. First confirmed detection of SARS-CoV-2 in untreated wastewater in Australia: A proof of concept for the wastewater surveillance of COVID-19 in the community. Sci. Total Environ. 2020, 728, 138764. [Google Scholar] [CrossRef]
  20. La Rosa, G.; Iaconelli, M.; Mancini, P.; Bonanno Ferraro, G.; Veneri, C.; Bonadonna, L.; Lucentini, L.; Suffredini, E. First detection of SARS-CoV-2 in untreated wastewaters in Italy. Sci. Total Environ. 2020, 736, 139652. [Google Scholar] [CrossRef]
  21. Wurtzer, S.; Marechal, V.; Mouchel, J.M.; Maday, Y.; Teyssou, R.; Richard, E.; Almayrac, J.L.; Moulin, L. Evaluation of lockdown effect on SARS-CoV-2 dynamics through viral genome quantification in waste water, Greater Paris, France, 5 March to 23 April 2020. Euro Surveill. 2020, 25, 2000776. [Google Scholar] [CrossRef]
  22. Rimoldi, S.G.; Stefani, F.; Gigantiello, A.; Polesello, S.; Comandatore, F.; Mileto, D.; Maresca, M.; Longobardi, C.; Mancon, A.; Romeri, F.; et al. Presence and vitality of SARS-CoV-2virus in wastewaters and rivers. Sci. Total Environ. 2020, 744, 140911. [Google Scholar] [CrossRef]
  23. Randazzo, W.; Cuevas-Ferrando, E.; Sanjuan, R.; Domingo-Calap, P.; Sanchez, G. Metropolitan wastewater analysis for COVID-19 epidemiological surveillance. Int. J. Hyg. Environ. Health 2020, 230, 113621. [Google Scholar] [CrossRef]
  24. Kumar, M.; Patel, A.K.; Shah, A.V.; Raval, J.; Rajpara, N.; Joshi, M.; Joshi, C.G. Thefirst proof of the capability of wastewater surveillance for COVID-19 in India through the detection of the genetic material of SARS-CoV-2. Sci. Total Environ. 2020, 746, 141326. [Google Scholar] [CrossRef]
  25. Kocamemi, B.A.; Kurt, H.; Hacioglu, S.; Yarali, C.; Saatci, A.M.; Pakdemirli, B. First data-set on SARS-CoV-2 detection for Istanbul wastewaters in Turkey. medRxiv 2020. [Google Scholar] [CrossRef]
  26. Haramoto, E.; Malla, B.; Thakali, O.; Kitajima, M. First environmental surveil-lance for the presence of SARS-CoV-2 RNA in wastewater and river water in Japan. Sci. Total Environ. 2020, 737, 140405. [Google Scholar] [CrossRef] [PubMed]
  27. Hellmer, M.; Paxeus, N.; Magnius, L.; Enache, L.; Arnholm, B.; Johansson, A.; Bergstrom, T.; Norder, H. Detection of pathogenic viruses in sewage provided early warnings of hepatitis A virus and norovirus outbreaks. Appl. Environ. Microbiol. 2020, 80, 6771–6781. [Google Scholar] [CrossRef]
  28. Balboa, S.; Mauricio-Iglesias, M.; Rodriguez, S.; Martínez-Lamas, L.; Vasallo, F.J.; Regueiro, B.; Lema, J.M. The fate of SARS-CoV-2 in WWTPs points out the sludge line as a suitable spot for monitoring. medRxiv 2020. [Google Scholar] [CrossRef]
  29. Lodder, W.; de Roda Husman, A.M. SARS-CoV-2 in wastewater: Potential health risk, but also data source. Lancet Gastroenterol. Hepatol. 2020, 5, 533–534. [Google Scholar] [CrossRef] [PubMed]
  30. Alygizakis, I.; Galani, A.; Rousis, N.; Aalizadeh, R.; Dimopoulos, M.; Thomaidis, N. Change in the chemical content of untreated wastewater of Athens, Greece under COVID-19 pandemic. Sci. Total Environ. 2021, 799, 149230. [Google Scholar] [CrossRef]
  31. Teymoorian, T.; Teymourian, T.; Kowsari, E.; Ramakrishna, S. Direct and indirect effects of SARS-CoV-2 on wastewater treatment. J. Water Process Eng. 2021, 42, 102193. [Google Scholar] [CrossRef]
  32. Chu, W.; Fang, C.; Deng, Y.; Xu, Z. Intensified disinfection amid COVID-19 pandemic poses potential risks to water quality and safety. Environ. Sci. Technol. 2020, 55, 4084–4086. [Google Scholar] [CrossRef]
  33. Jammalamadaka, S.R.; Taufer, E.; Terdik, G.H. On multivariate skewness and kurtosis. Sankhya A 2021, 83, 607–644. [Google Scholar] [CrossRef]
  34. Bono, R.; Arnau, J.; Alarcón, R.; Blanca, M.J. Bias, precision, and accuracy of skewness and kurtosis estimators for frequently used continuous distributions. Symmetry 2020, 12, 19. [Google Scholar] [CrossRef] [Green Version]
  35. Rohila, S.K. COVID-19 Outbreak: More Hand Washing Can Increase India’s Water Woes. Available online: https://www.downtoearth.org.in/blog/water/covid-19-outbreakmore-hand-washing-can-increase-india-s-water-woes-69900 (accessed on 7 February 2021).
  36. Yazdian, H.; Jamshidi, S. Performance evaluation of wastewater treatment plants under the sewage variations imposed by COVID-19 spread prevention actions. J. Environ. Health Sci. Eng. 2021, 19, 1613–1621. [Google Scholar] [CrossRef] [PubMed]
  37. Kataki, S.; Chatterjee, S.; Vairale, M.G.; Sharma, S.; Dwivedi, S.K. Concerns and strategies for wastewater treatment during COVID-19 pandemic to stop plausible transmission. Resour. Conserv. Recycl. 2021, 164, 105156. [Google Scholar] [CrossRef] [PubMed]
  38. SumeteoInfo. Data Is Collected with the Help of the Nexus Automatic Meteorological Station. Available online: https://sumeteo.info/wxrainseason.php (accessed on 5 December 2022).
  39. Tchobanoglous, G.; Stensel, H.; Tsuchihashi, R.; Burton, F. Wastewater Engineering, Treatment, and Resource Recovery, 5th ed.; Metcalf & Eddy Inc., McGraw-Hill Publishers: New York, NY, USA, 2014. [Google Scholar]
  40. Mousazadeh, M.; Paital, B.; Naghdali, Z.; Mortezania, Z.; Hashemi, M.; Karamati Niaragh, E.; Aghababaei, M.; Ghorbankhani, M.; Lichtfouse, E.; Sillanpää, M.; et al. Positive environmental effects of the coronavirus 2020 episode: A review. Environ. Dev. Sustain. 2021, 4, 12738–12760. [Google Scholar] [CrossRef]
  41. Pirsaheb, M.; Fazlzadehdavil, M.; Hazrati, S.; Sharafi, K.; Khodadadi, T.; Safari, Y. A survey on nitrogen and phosphorus compound variation processes in wastewater stabilisation ponds. Pol. J. Environ. Stud. 2014, 23, 831–834. [Google Scholar]
  42. Raptopoulou, C.; Palasantza, P.A.; Mitrakas, M.; Kalaitzidou, K.; Tolkou, A.; Zouboulis, A. Statistical variation of nutrient concentrations and biological removal efficiency of a wastewater treatment plant. Water Util. J. 2016, 14, 5–17. [Google Scholar]
  43. Hora, P.I.; Pati, S.G.; McNamara, P.J.; Arnold, W.A. Increased use of quaternary ammonium compounds during the SARS-CoV-2 pandemic and beyond: Consideration of environmental implications. Environ. Sci. Technol. Lett. 2020, 7, 622–631. [Google Scholar] [CrossRef]
  44. Anayah, F.; Al-Khatib, I.A.; Hejaz, B. Assessment of water and sanitation systems at Palestinian healthcare facilities: Pre-and post-COVID-19. Environ. Monit. Assess. 2021, 193, 41. [Google Scholar] [CrossRef]
  45. Alade, A.; Jameel, A.; Muyubi, S.; Abdul Karim, M.; Alam, Z. Removal of oil and grease as emerging pollutants of concern (EPC) in wastewater stream. IIUM Eng. J. 2011, 12, 161–169. [Google Scholar]
  46. Ahmed, M.E.; Al-Haddad, A.; Bualbanat, A. Possible impacts of COVID-19 pandemic on domestic wastewater characteristics in Kuwait. J. Environ. Eng. Landsc. Manag. 2022, 30, 393–411. [Google Scholar] [CrossRef]
  47. Curtis, K.; Keeling, D.; Yetka, K.; Larson, A.; Gonzalez, R. Wastewater SARS-CoV-2 concentration and loading variability from grab and 24-hour composite samples. medRxiv 2020. [Google Scholar] [CrossRef]
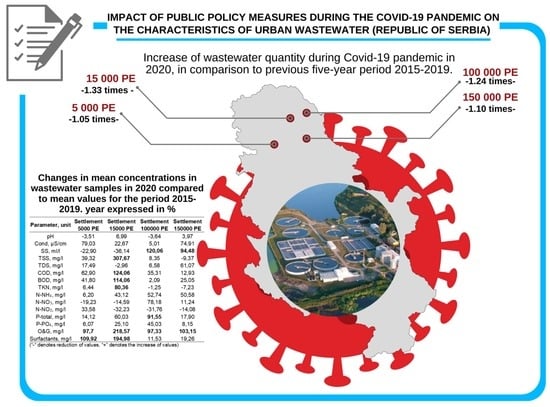
Table 1. Wastewater quantity in settlements (expressed in m3/year).
Settlement2015201620172018201920202021
150,000 PE3,300,4923,426,8203,159,4933,256,8103,358,0103,626,6403,582,630
100,000 PE1,522,1752,514,4072,602,7632,710,3802,337,5612,897,0522,842,068
15,000 PE179,655183,485238,881244,920271,904297,823322,113
5000 PE102,243106,875105,568105,568104,440109,903107,542
Table 2. Mean, variance, skewness and kurtosis of wastewater quality data (2015–2022).
Parameter, UnitMeanVarianceKurtosisSkewnessMeanVarianceKurtosisSkewness
Settlement 5000 PESettlement 15,000 PE
pH8.200.264.84−1.267.740.9516.57−3.71
Cond, µS/cm2862.3310,387,069.1239.785.931599.7164,883.75−0.33−0.12
SS, mL/L0.310.4231.555.343.86159.7527.235.11
TSS, mg/L311.26234,900.1643.286.23316.62143,401.823.641.82
TDS, mg/L2344.7712,149,832.3110.313.351085.6126,526.250.380.31
COD, mg/L585.33123,604.297.652.15432.42122,476.720.420.99
BOD, mg/L353.4138,233.85−0.700.35246.6542,746.57−0.500.82
TKN, mg/L86.991408.460.320.3939.35426.81−0.110.76
N-NH4, mg/L24.64209.411.701.0919.40303.551.921.61
N-NO3, mg/L0.240.4638.195.870.520.350.151.24
N-NO2, mg/L0.010.007.352.650.060.00−0.161.00
P-total, mg/L3.283.365.692.082.261.287.112.22
P-PO4, mg/L2.192.3114.483.101.570.461.170.82
O&G, mg/L147.337265.592.141.1698.1210,905.3715.823.59
Surfactants, mg/L8.4932.63−0.150.743.9612.441.271.30
Settlement 100,000 PESettlement 150,000 PE
pH7.910.22−1.060.237.690.31−1.000.06
Cond, µS/cm1781.39179,748.887.062.292243.331,156,129.2818.423.94
SS, mL/L1.717.366.022.428.7971.0010.182.58
TSS, mg/L238.9721,024.06−0.110.65363.6044,653.070.400.81
TDS, mg/L1020.0654,579.034.551.121793.23759,720.6111.872.90
COD, mg/L506.5491,740.1615.753.161734.651,415,631.760.180.83
BOD, mg/L301.8172,102.7226.064.32977.19625,136.042.151.39
TKN, mg/L66.44242.702.01−0.9666.451059.590.180.53
N-NH4, mg/L31.55345.181.121.0829.16391.930.160.87
N-NO3, mg/L2.7840.3923.414.561.553.895.011.96
N-NO2, mg/L0.070.0222.514.620.040.000.911.40
P-total, mg/L3.768.756.512.324.791.88−0.42−0.01
P-PO4, mg/L2.693.00−0.290.821.961.137.211.99
O&G, mg/L140.9113,560.718.012.57119.437998.202.541.43
Surfactants, mg/L3.966.280.240.735.7215.531.551.22
Table 3. Parameters’ values in wastewater samples for 2020 compared to average parameters’ values for the 2015–2019 period, expressed in %.
Parameter, UnitSettlement
5000 PE
Settlement
15,000 PE
Settlement
100,000 PE
Settlement
150,000 PE
pH−3.516.99−3.643.97
Cond, µS/cm79.0322.675.0174.91
SS, mL/L−22.90−36.14120.0694.48
TSS, mg/L39.32307.678.35−9.37
TDS, mg/L17.49−2.966.5861.07
COD, mg/L62.90124.0635.3112.93
BOD, mg/L41.80114.062.0925.05
TKN, mg/L6.4480.36−1.25−7.23
N-NH4, mg/L6.2043.1252.7450.58
N-NO3, mg/L−19.23−14.5978.1811.24
N-NO2, mg/L33.58−32.23−31.76−14.08
P-total, mg/L14.1260.0391.5517.90
P-PO4, mg/L6.0725.1045.038.15
O&G, mg/L97.7218.5797.33103.15
Surfactants, mg/L109.92194.9811.5319.26
“−“ denotes reduction of values, “+” denotes the increase of values.
Table 4. Parameters’ values for the 2021–2022 period in comparison to the parameters’ average values for 2020, expressed in %.
Parameter, UnitSettlement
5000 PE
Settlement
15,000 PE
Settlement
100,000 PE
Settlement
150,000 PE
pH3.850.11−0.15−4.17
Cond, µS/cm−107.46−13.5013.33−83.27
SS, mL/L−125.79−322.95−51.21−18.50
TSS, mg/L−100.83−297.005.45−2.17
TDS, mg/L−161.50−10.322.95−84.64
COD, mg/L−6.50−198.930.77−10.72
BOD, mg/L10.63−203.6734.10−3.70
TKN, mg/L29.76−82.499.2434.20
N-NH4, mg/L18.7612.98−24.9412.39
N-NO3, mg/L71.75−33.47−74.96−103.42
N-NO2, mg/L−130.634.89−12.79−92.43
P-total, mg/L14.94−23.10−62.73−10.87
P-PO4, mg/L16.93−8.89−50.130.53
O&G, mg/L−31.07−80.19−8.04−27.39
Surfactants, mg/L25.64−15.1123.3525.82
“−“ denotes reduction of values, “+” denotes the increase of values.
Table 5. Parameters’ average values for the 2020–2022 period, in comparison to parameters’ average values for the 2015–2019 period, expressed in %.
Parameter, UnitSettlement
5000 PE
Settlement
150,00 PE
Settlement
100,000 PE
Settlement
150,000 PE
pH−0.866.60−4.031.54
Cond, µS/cm13.2512.3416.0522.42
SS, mL/L−157.93−128.1963.8843.47
TSS, mg/L−8.2791.0035.91−11.72
TDS, mg/L−47.92−8.478.6839.05
COD, mg/L35.9224.0026.756.19
BOD, mg/L34.8119.7832.1118.34
TKN, mg/L27.2462.846.5917.14
N-NH4, mg/L18.7435.9922.0338.62
N-NO3, mg/L54.92−57.5572.81−27.40
N-NO2, mg/L−26.70−45.37−56.60−58.74
P-total, mg/L21.8130.4123.3210.08
P-PO4, mg/L17.3015.844.967.81
O&G, mg/L39.5756.1246.1943.78
Surfactants, mg/L61.7364.4427.1130.21
“−“ denotes reduction of values, “+” denotes the increase of values.
Disclaimer/Publisher’s Note: The statements, opinions and data contained in all publications are solely those of the individual author(s) and contributor(s) and not of MDPI and/or the editor(s). MDPI and/or the editor(s) disclaim responsibility for any injury to people or property resulting from any ideas, methods, instructions or products referred to in the content.

