Article

Aligning Agricultural Research and Extension for Sustainable Development Goals in India: A Case of Farmer FIRST Programme

by
Purushothaman Venkatesan
1,*,
Nilakandan Sivaramane
1,
Bharat Shankar Sontakki
1,
Ch. Srinivasa Rao
1,
Ved Prakash Chahal
2,
Ashok Kumar Singh
3,
P. Sethuraman Sivakumar
4,
Prabhukumar Seetharaman
1 and
Bommu Kalyani
1
1
ICAR-National Academy of Agricultural Research Management, Hyderabad 500030, India
2
Division of Agricultural Extension, Indian Council of Agricultural Research, KAB-1, Pusa, New Delhi 110012, India
3
Rani Lakshmi Bai Central Agricultural University, Jhansi 284003, India
4
ICAR-Central Tuber Crops Research Institute, Thiruvananthapuram 695017, India
*
Author to whom correspondence should be addressed.
Sustainability 2023, 15(3), 2463; https://doi.org/10.3390/su15032463
Submission received: 30 December 2022 / Revised: 17 January 2023 / Accepted: 17 January 2023 / Published: 30 January 2023
(This article belongs to the Topic Innovation and Solution for Sustainable Agriculture)

Abstract

:
Agricultural development and farmers’ welfare occupy a central place in the development goals of India. Various pathways which have evolved over the years have been implemented in the country to propel agricultural growth by shifting its focus from achieving food sufficiency to sustainable income and inclusive growth. The Farmer FIRST Programme (FFP), an innovative frontline extension program of the Indian Council of Agricultural Research (ICAR), was launched in 2016 to enhance the reach and effectiveness of agricultural research with a multi-stakeholder approach. This paper evaluates the outcomes of the FFP implemented in ICAR institutions for the upscaling of those promising technologies, which have resulted in a significant impact on the farming community. The criteria chosen for assessing the outcomes are farm income, cropping intensity, use of chemical fertilizers, pesticides, and organic manure, and nutritional security. The data were collected from 50 FFP-implementing institutions for the period 2016–2021 and grouped into six different zones. The results revealed that there is a significant increase in income, cropping intensity, nutritional security, and saving pesticides through this program. The nutritional security, measured using cereal equivalent quantity (CEQ), showed a considerable increase in average consumption in all the zones. Overall, FFP interventions have resulted in achieving significantly higher income and the nutritional security of the farmholds compared to the control. The recorded results are favorable for scaling up and institutionalizing the FFP approach at the national level. The study recommends a participatory mode of an interdisciplinary approach for the effective scaling-up of the FFP across the agricultural research and development landscape of India.

1. Introduction

Indian agriculture plays a significant role in catalyzing socio-economic growth for rural households, thereby addressing the national development goals. Though the share of agriculture in India’s Gross Value Added (GVA) of the country was only 18.8% in 2020–2021 [1], it employs the largest share of the national workforce (45.6% in 2019–2020), as well as the largest share of women workers (59.9%) [2]. A recent study demonstrated that urbanization has contributed to significant differences in food consumption, with consumers moving away from staples to nutritious fruits and vegetables, along with eggs and meat [3]. On the other hand, India has committed to achieve the Sustainable Development Goals (SDGs) [4] in a phased manner to achieve sustainable and equitable development.
Since independence, the national development goals were focused on fostering economic growth as an instrument of reducing poverty [5] while achieving household food and nutritional security. The Government of India (GoI) has implemented multiple development approaches to achieve these goals, from an industrial development approach post-independence to the national development goal approaches [6]. A historical view of the development efforts of various countries clearly shows the direct and indirect contributions of agriculture and allied sectors in enhancing the national income and generating employment [2].

1.1. Agricultural Development Pathways in India

India’s approach to national development has been unique and focused on the diverse goals of eliminating poverty and hunger to creating a “sustainable and inclusive society” [7,8,9,10]. The agricultural development programs are designed and implemented by the GoI to translate the pathways into specific development interventions, with adequate policy support. Three types of agricultural development programs implemented by the GoI include (i) integrated technology development programs; (ii) programs for creating an enabling environment for implementing specific pathways, implemented by development departments and a public sector extension system of state and central agencies; and (iii) the front-line extension system of ICAR/Agricultural Universities targeted towards farmers and other stakeholders for technology assessment, refinement, and application.

1.2. Frontline-Extension Programmes of ICAR

Since independence, the ICAR has implemented six major frontline extension programs, viz., the National Demonstration Project (1964–1965), the Operational Research Project (1972), the Lab-to-Land Project (1979), and the Institution Village Linkage Programme (IVLP) launched in 1995 [11]. The Krishi Vigyan Kendras (KVKs), created in 1974, are institutional mechanisms for implementing frontline extension programs at the district level.
However, the emerging challenges of the widening technology and yield gap, the inadequate reach of improved technologies, “misfit” of technologies with farmers’ needs and production systems, recognition of farmers’ technical knowledge and rights over grassroots innovations, climate change and its effects on agricultural systems and nutritional insecurity in rural and urban areas, led to the formation of an innovative frontline extension program, Farmer FIRST (Farm, Innovation, Resources, Science and Technology).

1.3. Farmer FIRST Programme (FFP)

The FFP was designed and launched in 2016 and envisages the integration and application of agricultural technologies suited to the diverse agro-climatic and unique socio-economic conditions of the farmers under the changing climatic conditions to achieve food and nutritional security. This program employs “continuous stakeholder engagement” as a strategy for the identification of location-specific problems, assessing the technological needs, and developing and implementing a package suited to the agro-ecological, bio-physical, and socio-economic situations of the farmers. This strategy is implemented through a “functional platform” of stakeholders who are engaged in a “dynamic interaction” for managing the change process during the intervention, and also for enabling the organizations institutionalizing them to sustain their benefits. The key dimensions of the Farmer FIRST approach are SDG-focused interventions, a technology assemblage approach, and dynamic stakeholder engagement [11].

1.3.1. SDG-Focused Interventions

Any technological change directed towards addressing the broad goals of sustainable development goes beyond technology transfer and requires a comprehensive approach to address the emerging challenges [12]. Such technology interventions designed for the development of small and marginal farmers in emerging economies, such as India, should focus on maximizing yield while ensuring food and nutritional security under the changing climatic conditions [13]. The FFP interventions are designed to address multiple SDGs, such as zero hunger, good health and well-being, gender equality, and climate action, through a comprehensive program.

1.3.2. Technology Assemblage Approach

The technology assemblage approach involves the identification and integration of economically viable and socially compatible technological options as adoptable models suited to different agro-ecological situations. The technology packages include the proven combination of crops, horticulture, natural resource management [14], livestock [15,16], and integrated farming system [17,18] technologies.

1.3.3. Dynamic Stakeholder Engagement

Dynamic stakeholder engagement is the process of engaging the stakeholders, including farmers, in the process of planning, implementing, and assessing the effect of technology-focused solutions to address food and nutritional security issues, and institutionalizing them for sustaining benefits. This program is currently implemented on a pilot basis in 51 centres. To enhance the efficiency of the extension system, its pathways undergo continuous change, which has culminated in this program, whereby research activities at the stakeholder level are given more importance to adjust them to suit the stakeholders’ locations and situations. To attain this, India has implemented different pathways since 2015, viz., nutrition-sensitive agriculture, sustainable entrepreneurship for grassroots development, and climate-smart agriculture.
The FFP, in its current version, is a pilot with immense scope for scaling up. For this, and to convince planners of the need for sustained resource commitment, such an assessment was the need of the hour. Hence, this study was conducted with the objective of identifying the profile change in farm households and the impact of selected technology assemblage interventions relative to outcome indicators linked to select SDGs.
Against this backdrop, this study examines whether the frontline system of the FFP, with a multi-stakeholder approach from technology development to dissemination, has yielded the desired outcomes in its implementation. The positive outcomes of this evaluation will enable the program agency to initiate efforts to scale up the FFP model and institutionalize it across the country. Finally, the results of the study are expected to justify the investment made into this program.

2. Materials and Methods

2.1. Identification of Study Area

India is classified into various zones or territories for the purposes of governance, agricultural development, and developmental planning, based on geographic and agro-climatic conditions. Since the study’s focus was on evaluating the outcomes of the FFP in addressing select SDGs, the researchers observed that the distribution of the FFP centers was skewed towards a few of these territories. Therefore, for effective comparison, the study locale was delineated into six geographic zones, as depicted in column (2) of Table 1.
Each FFP implementation institution is working with about 1000 farm families, encompassing two to four villages using a cluster approach. In each cluster, the project team has implemented the FFP process, including problem identification, prioritization, technology assessment, refinement, technology development, input production, and management and impact assessment [19]. This program is being implemented in six zones comprising 1367 demonstrations by 51 implementing institutions covering 22 states, 248 villages, and 48,291 farm families (Table 1).
An outcome-based evaluation of the FFP conducted across six zones in India, covering 22 states of India, was aimed at quantifying the impact of the “Farmers FIRST approach” on the key dimensions pertaining to select SDGs (SDGs-1,2,3&12) of farm household food and nutritional security. The study adopted a quantitative economic impact assessment approach and used the difference-in-difference (DiD) method [20] for deriving unbiased results to justify the outcomes.

2.2. The Intervention

In the FFP, the technology interventions are designed by following a farmer-focused pathway. where the scientists, along with farmers and other stakeholders, together identify the problems and develop a technology package suitable for the agro-climatic and socio-economic conditions of the farmers. In the FFP, a total of 453 interventions were identified and implemented in the 248 villages involving 48,291 farm families, as illustrated in Table 2.

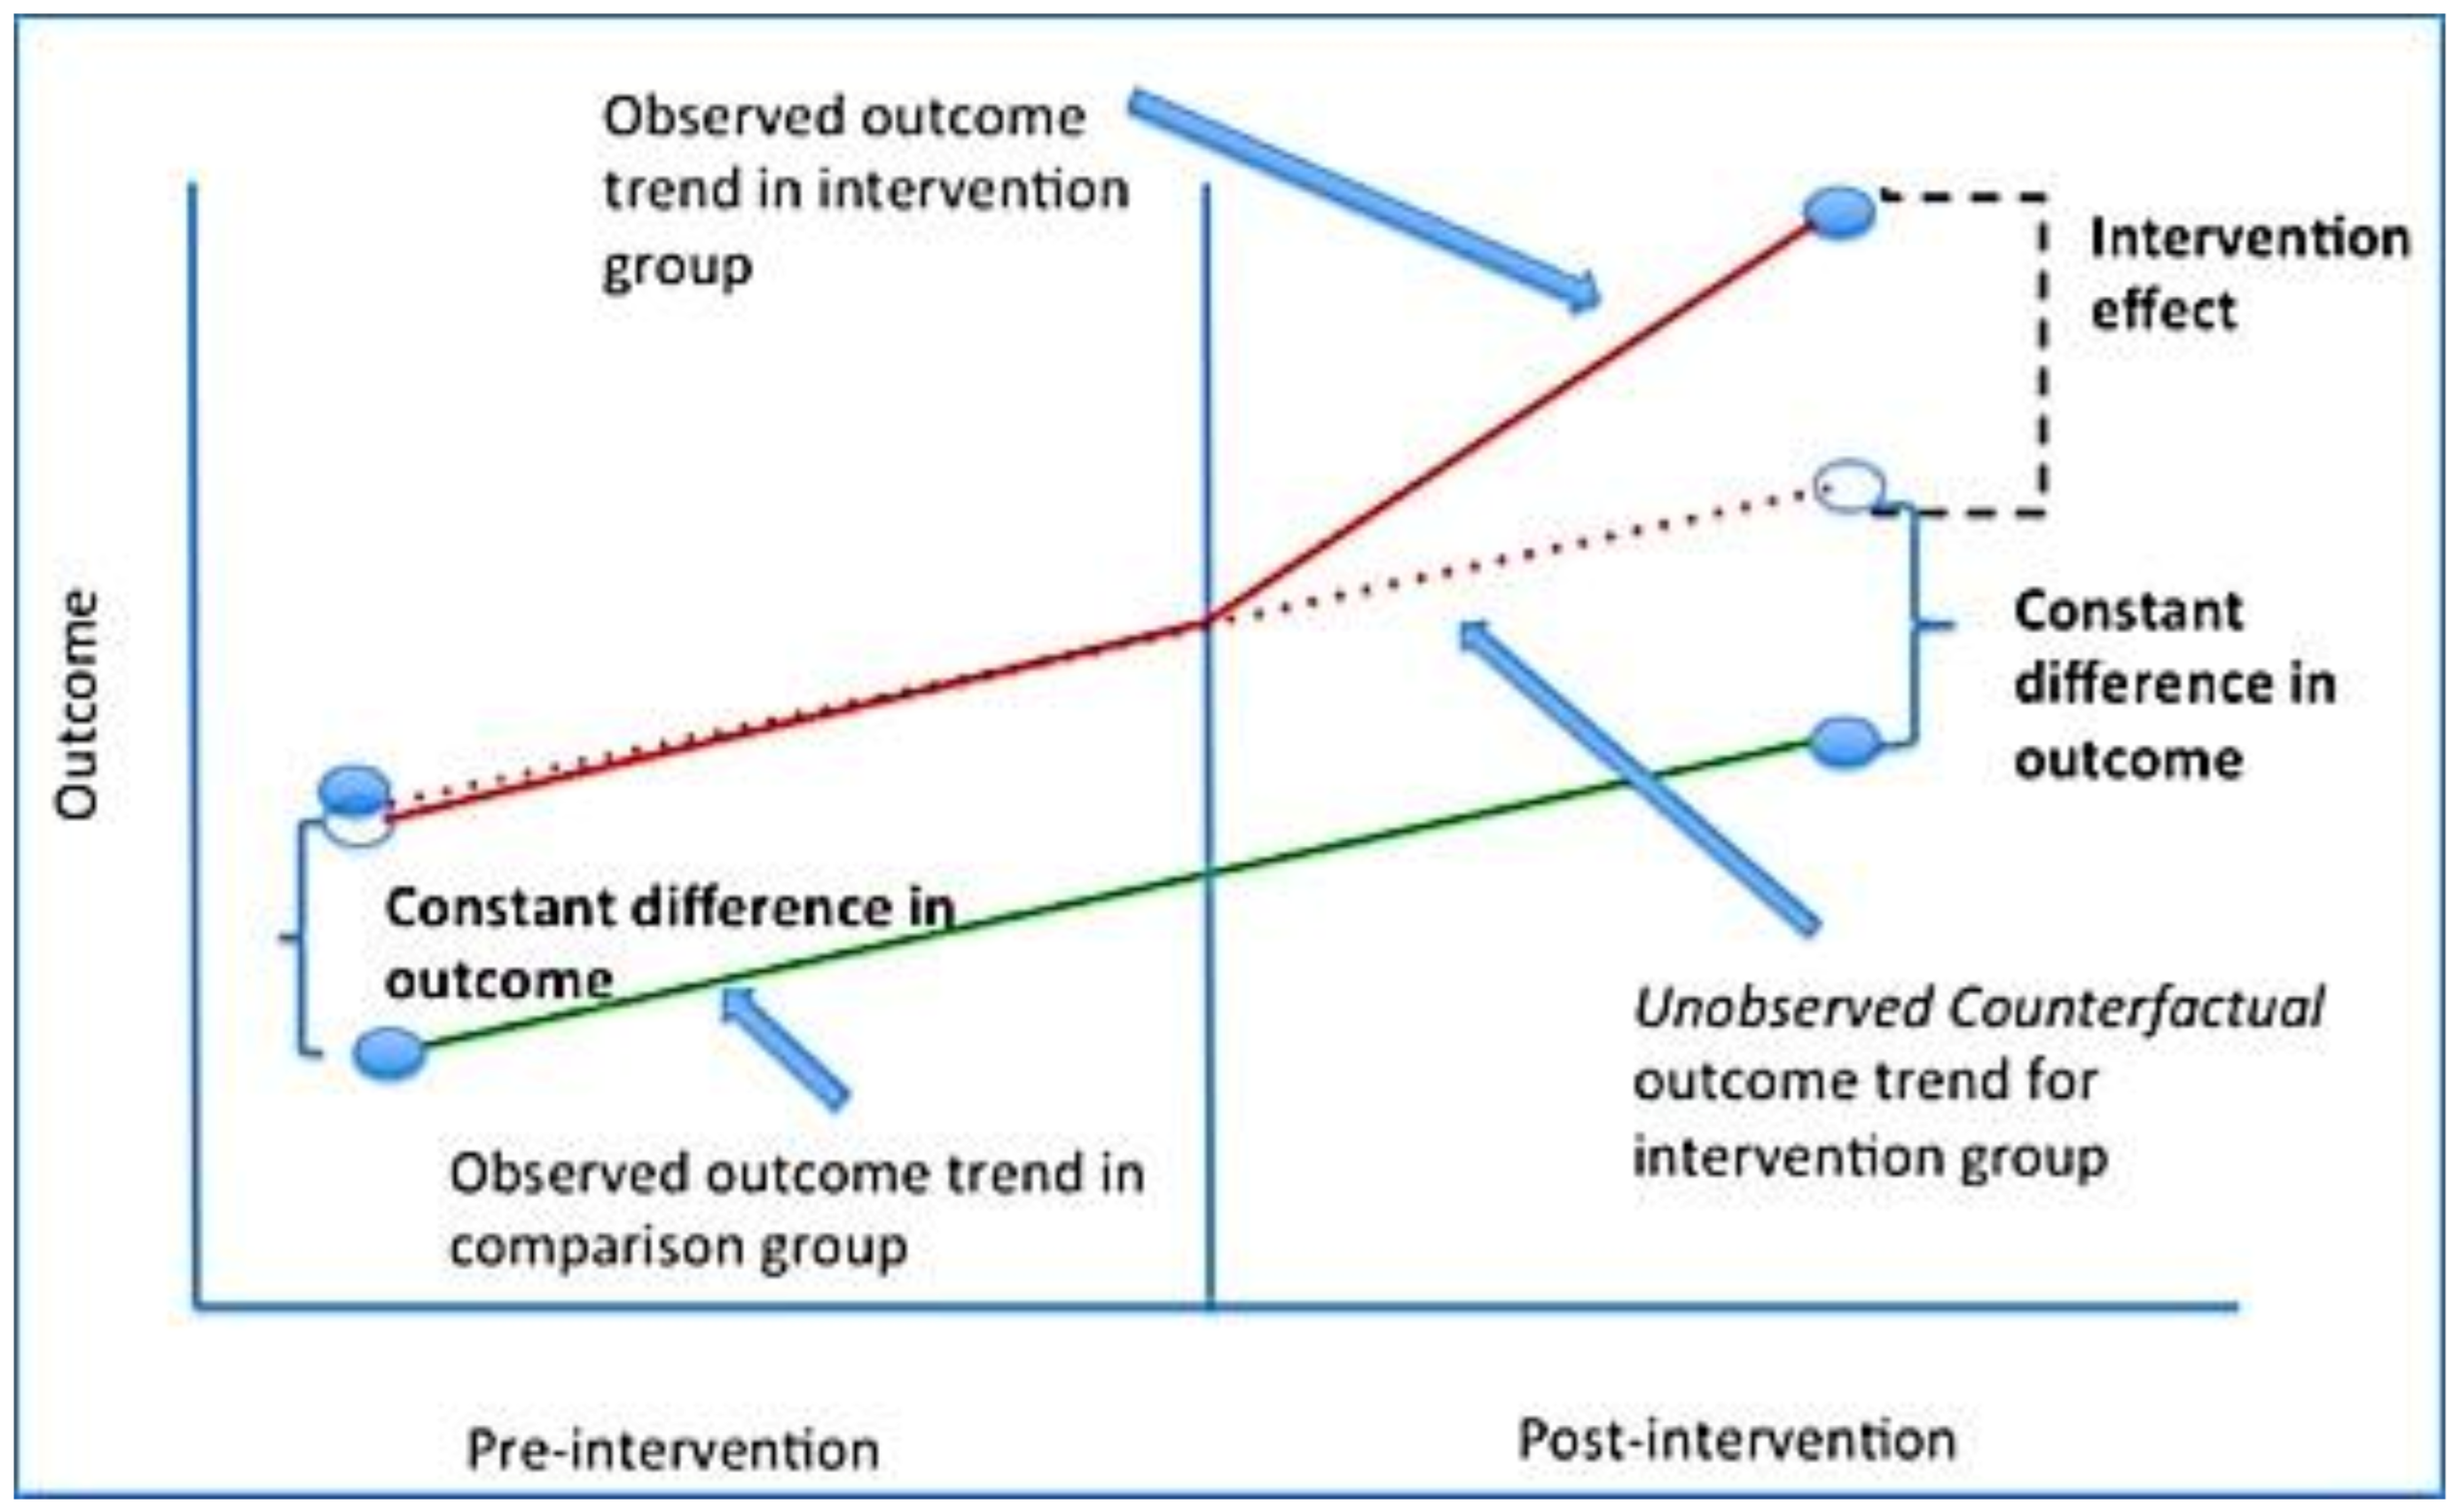
2.3. Evaluation Strategy

The evaluation of the FFP was undertaken during 2020–2021, after four years of its implementation, to capture the outcomes of the interventions. The study was conducted in all the six zones of India covering 15 agro-ecological zones of India.
Since the FFP is a project-based program assigned to specific institutions, and the interventions were decided following a stakeholder participatory approach unique to the project areas, it was not possible to select the treatment and control subjects at random. Instead, a quasi-experimental impact evaluation design was used and, using a kernel matching algorithm in the propensity score matching technique (using STATA software, version 14), the treatment and control were matched using basic information, such as demographic data, and compared.

2.4. Sampling Design and Data Description

All the 51 FFP-implementation institutions, their technological interventions, villages covered therein, and all the participating farmers formed the universe of the study. However, considering the data adequacy and completeness, one FFP-implementation institution was dropped for the purpose of sampling. The farmers were randomly selected from each of the 50 FFP-implementation institutions to elicit the primary data on the outcome-based indicators, along with their profile characteristics.
Thus, a sample of 1915 farmers from FFP-implemented villages, and 517 farmers as a control check from non-FFP villages, were chosen for the study (Table 3). The data for this study were collected before and after the FFP intervention.
The study area covered diverse agricultural production systems. The salient details of the major crops and allied enterprises unique to each study zone are presented in Table 4.
The agricultural production system of the study zones ranged from sustainable to commercial production systems involving field crops such as paddy, wheat, and pulses; horticultural crops including fruits and vegetables; commercial crops such as sugarcane and cotton; along with livestock, poultry, and fishery and farm-based businesses such as mushroom production and vermicomposting. The plantation crops and spices are grown predominantly in the southern zone, cotton in the western zone, and oil seeds such as mustard in the northern zone.

2.5. Outcome Evaluation Indicators and Their Empirical Measures

The outcome of the FFP is operationally defined as positive changes in the outcome indicators resulting from the implementation of technological interventions by the participating FFP institutions. Considering the national goal of achieving sustainable and equitable development, the SDGs were used as the basis for selecting the indicators. Accordingly, the relevant indicators were populated from a detailed review of research articles [21,22,23]. In the current study, it was decided to select only a few indicators pertaining to the SDGs of the United Nations, and also representing the diversity of interventions implemented by the FFP-implementation institutions. The initial list of indicators was scrutinized by the project management advisory committee (PMAC) along with other experts, and the final indicators are presented (Table 5.)
Household food and nutritional security is a multidimensional construct and includes several ingredients, viz., cereals, pulses, milk, fish, egg, fruits and vegetables, and other food items. Considering the diverse food culture of Indian states, these items were converted to cereal equivalents and aggregated into CEQ using weights [37]. Similar measures were used by [32] to identify food gaps in grain per household.
A structured interview schedule with closed-form questions was prepared, covering all the selected outcome-based indicators. The interview schedule was revised based on pre-tests conducted in non-sample areas. The data were collected, using personal interviews and focus group discussions, from the treatment samples before and after the interventions, while the controls identified through the propensity score matching (PSM) were interviewed after the intervention [26].

2.6. Empirical Framework

Due to the panel nature of our data, collected under non-experimental settings—before and after the self-report mode, the DiD method was used to estimate the difference between the observed mean outcomes of the treatment and control groups before and after the FFP intervention using the parameters, viz., net farm income, cropping intensity, use of chemical fertilizers, organic manure use, and CEQ. The DiD approach controls for external factors affecting both the sample and the control group between periods by using trends in the control as the baseline [20,38,39].
The PSM technique using DiD was used to compare the true effect of the changes in the treatment versus control groups. The basic DiD study contains data from the two groups (treatment and control) and two static periods, 2016 and 2020 (Figure 1), and the data are typically at the individual level, that is, at a lower level than the treatment intervention itself, as followed by [40,41,42]. The DiD was calculated using the formula:
D i D i = X i T X i C  
where X i = X i t X i 0 ,
X i t = the value of ith item at current year ‘t’ (2020),
X i 0 = the value of ith item at baseline year ‘0′ (2016),
T = treatment and C = Control.
Figure 1. Graph for Difference-in-Difference estimation.
Sustainability 15 02463 g001

3. Results and Discussions

The primary objective was to evaluate the outcome of the FFP interventions based on the selected variables. For this, an outcome evaluation framework with DiD and the PSM technique were used to eliminate the possibility of confounding variables and the mismatch of subjects in the two groups.

3.1. Profile of Selected Farm and Households

The sample household characteristics are displayed in Table 6.
The majority of the sample respondents were from the middle-age group (66.32%), had completed high school (42.68%), were earning over Indian Rupee (INR) 200,000 annually (32.89%), were marginal farmers who owned less than 1 ha land (42.93%) and had 5 to 8 members in their family (52.63%).

3.2. Selection of Interventions

The interventions under the FFP were selected following a participatory stakeholder analysis. During this exercise, the scientists, along with the farmers and extension workers, interacted in the participatory workshops, which were conducted in the respective zones to identify the field problems and technological needs. Based on these priorities, technology assemblage packages specific to the selected village clusters were identified. These technology assemblage packages are composed of technologies (field crops, horticultural crops, livestock), natural resource management technologies, entrepreneurial packages, and integrated farming system modules. The zone-wise details of the interventions are given in Table 7.
The number and type of field interventions implemented in the different zones are displayed in Table 7. A total of 459 field interventions focusing on field crops, horticulture, livestock, natural resource management, enterprise development, and an integrated farming system were implemented across six zones. The majority of the field interventions (42.97%) were implemented in the Northern zone, which was predominantly field crop and horticultural crop interventions. Over 50% of interventions were field crop and horticultural crop technologies (51.52%) (Table 7), and the weighted case chi-square analysis showed significant differences in the interventions across the zones (χ2 = 74.20; p < 0.01).
After selection, the technology assemblage packages were implemented in the identified village clusters.

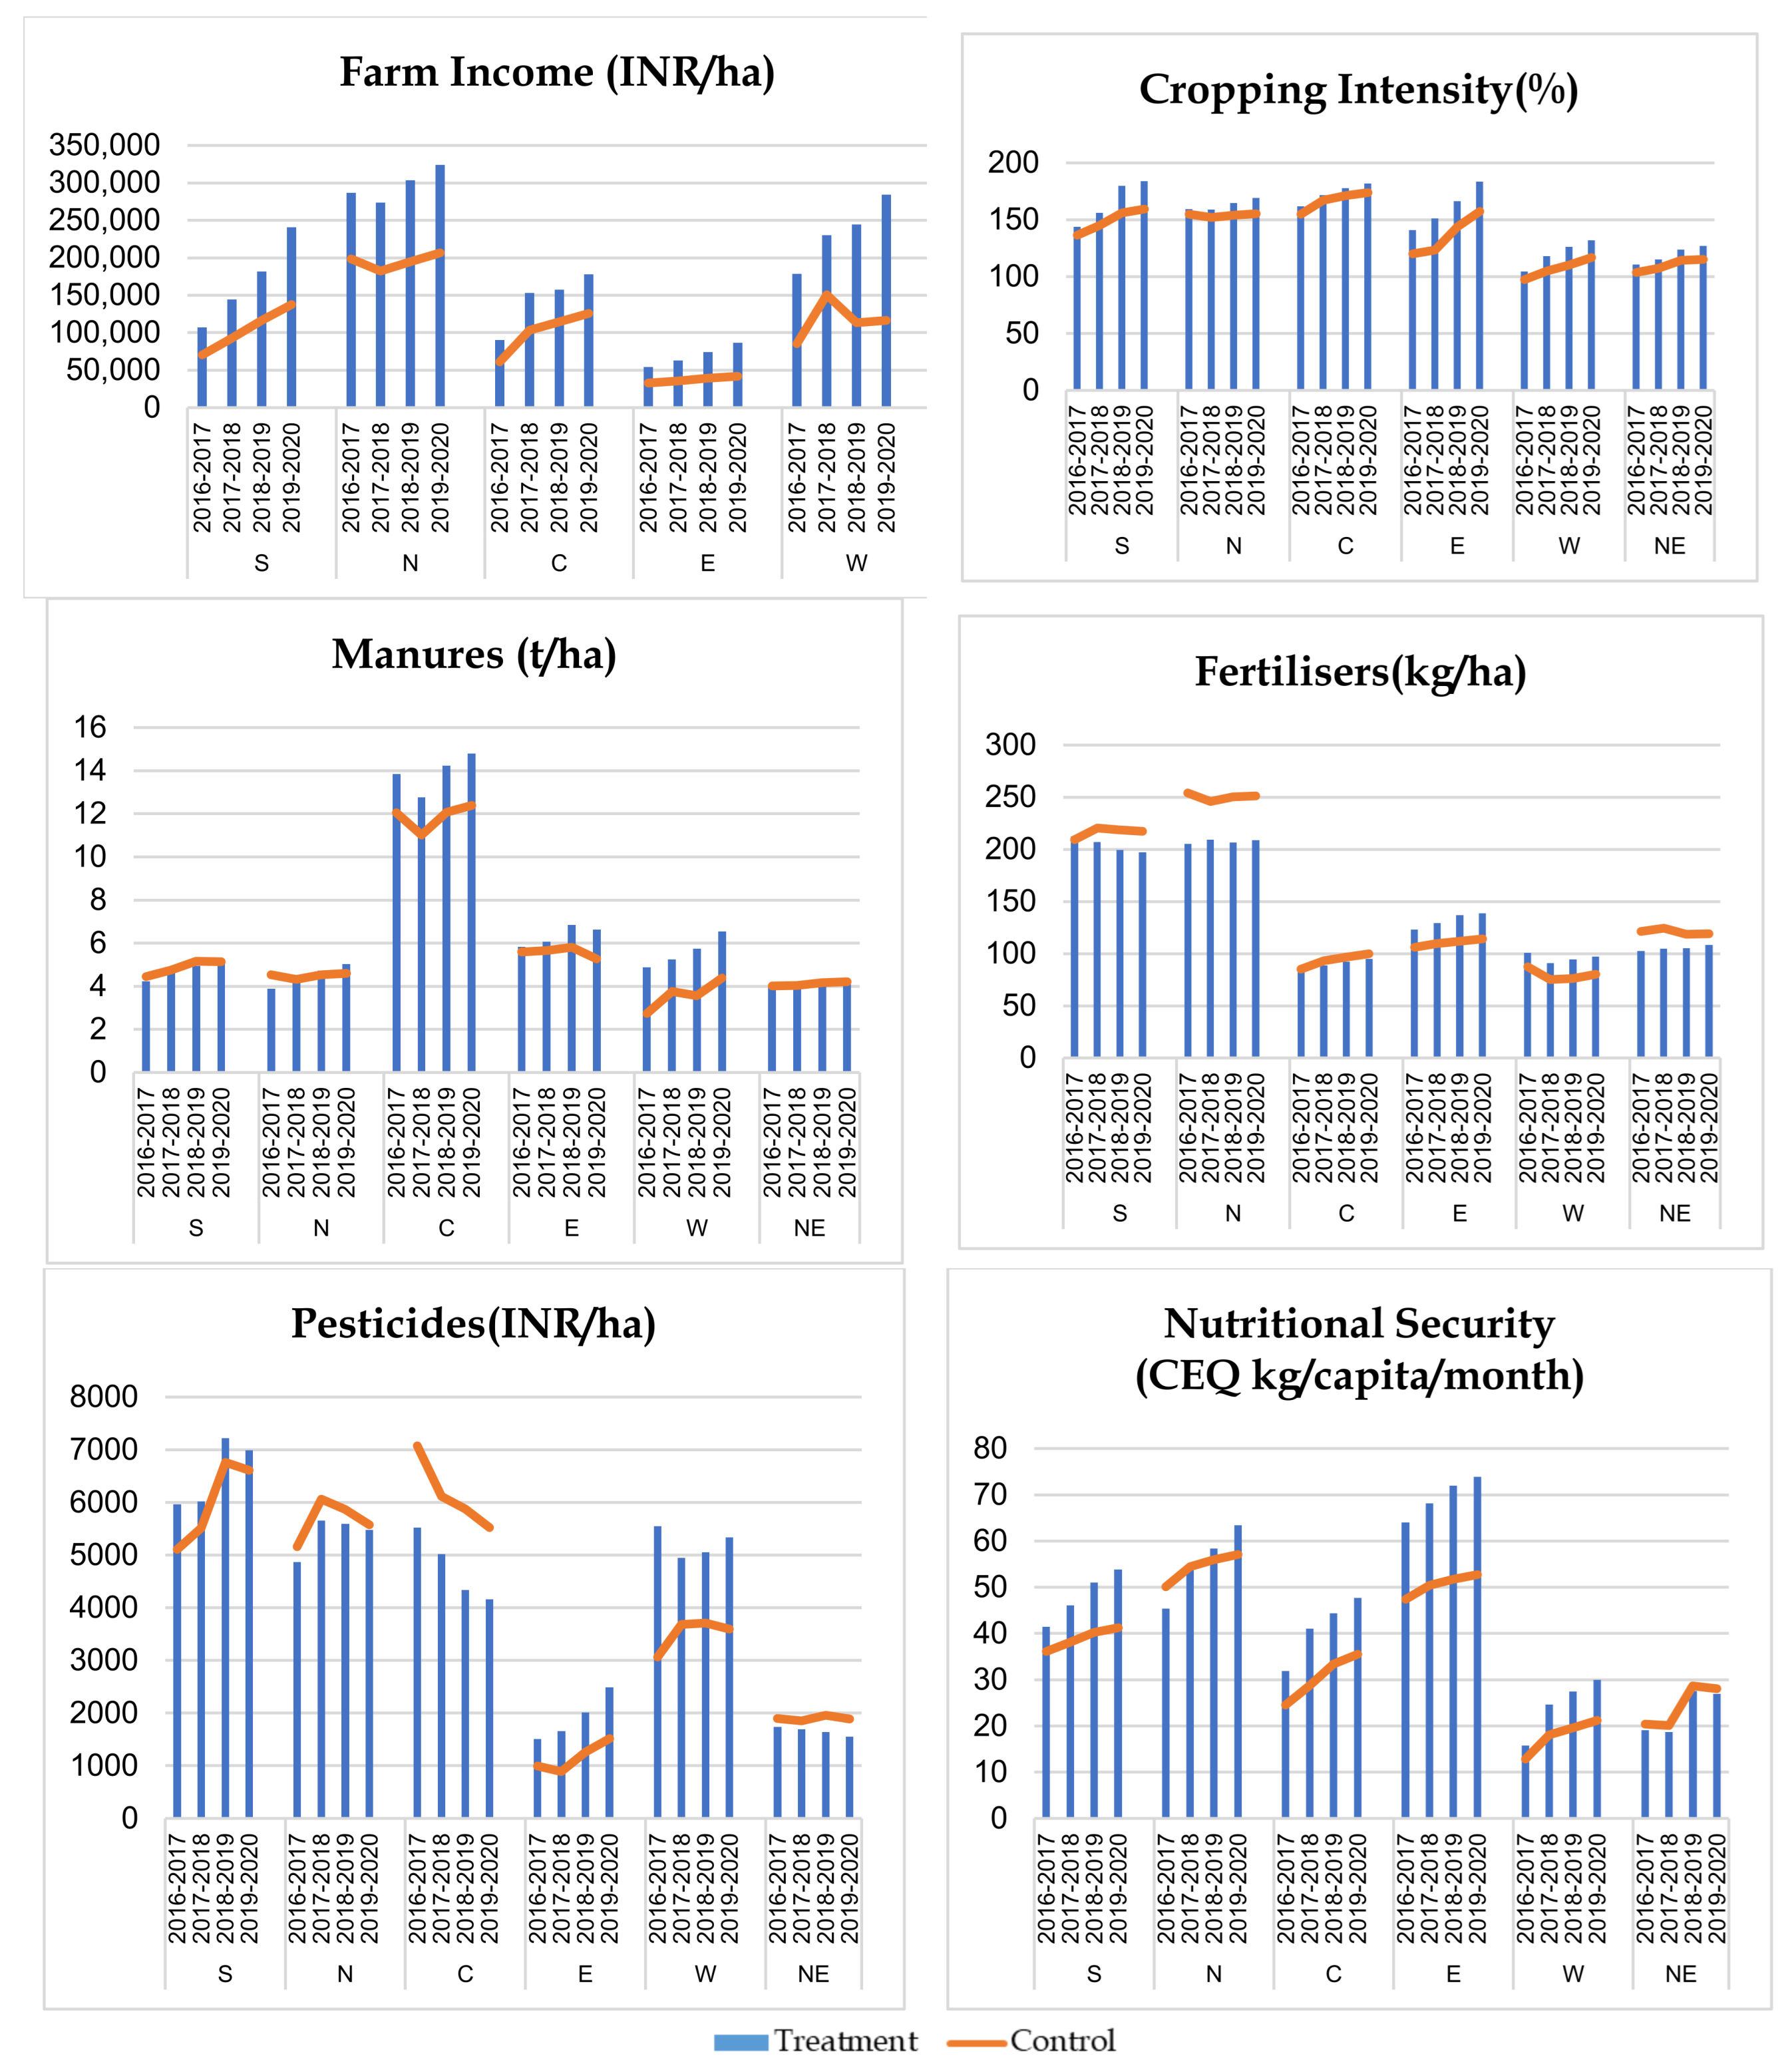
3.3. Impact of Field Interventions

The impact of the FFP, as assessed through the pre-post survey, indicates changes in the impact indicators (Figure 2). The data were subjected to DiD analysis to assess the significance of the changes in the impact indicators in the treatment group over the control. The estimates derived from the DiD estimator for the impact of the FFP interventions on farmers’ food, and nutritional and livelihood security are displayed in Table 8.
Initially, the data were examined for their suitability for analysis by checking the normality, linearity, and multi collinearity between the variables and the hetero skedasticity. The results showed a normal distribution with the required linearity, as well as no strong correlation (>0.60) between the variables. Each column of Table 8 represents different outcome measures, such as farm income, cropping intensity, manure and fertilizer application, pesticides, and nutritional security, achieved through the intervention.
The impact of the FFP interventions in select areas was clearly observed in terms of indicators such as farm income, cropping intensity, pesticides, and nutritional security (Table 8) using the DiD method, which enables comparison of the treatment with the control, eliminating the effect of other intervening variables.
Among the zones, the interventions in the southern zone resulted in substantial gains in farm income (INR 71,916/ha) and increased cropping intensity (18.5%), since the southern zone technology assemblage has a major component of livestock and horticulture (over 60%), which are primary drivers for doubling farmers household income [1]. The gains in farm income and availability of horticultural and livestock products also enabled the farmers in the southern zone to enhance their household nutritional security (6.18 kg/capita/month of CEQ) over the control farms. While a higher growth of income was observed in the southern, western, and central zones, the growth of income in the eastern and north-eastern zones was low. There was a gradual change in the cropping intensity in the southern and eastern zones, while the northern zone did not show a major change. Despite manure being an important nutrient in crop production and maintaining soil fertility, its application is stagnating in all the zones and across the farms [43,44]. In this study, the central and western zones increased manure usage marginally, owing to the introduction of commercial crops. The fertilizer usage remained constant, except for the eastern zone, where it increased marginally.
On the other hand, the southern zone, which is one of the major consumers of pesticides (per capita consumption of chemical pesticides: 2236.95 MT) [45], showed a significant decrease in its consumption as a result of the FFS intervention (Table 8). This reiterates that there is a substantial gain in terms of cost saving and sustainability. Similar results were observed for the western zone; however, the changes in the usage of fertilizer and pesticides were not significant due to large variations in usage. Except for farm income and pesticide usage, which were significant at the 10 percent level, the changes in the other indicators were insignificant. In the northern zone, there were significant gains in farm income and nutritional security. Even though the average cropping intensity increase was high (8.33%), it varies widely across farmholds in the northern zone. In the central zone, the interventions under the FFP impacted farm income, manure application, and CEQ positively and significantly. In the eastern zone, the FFP resulted in the treated farmers achieving higher incomes and nutritional security. It also increased the usage of pesticides, as farmers started switching to commercial crops such as vegetables, promoted under the FFP. The north-eastern zone is unique as its soil is highly fertile, in spite of the lower application of organic manures. There were no substantial changes in the application of organic or inorganic manures. The consumption of pesticides was reduced by about INR 161/ha, indicating that the FFP is pushing the farms towards natural farming, a goal of governments in the north-eastern zone of the country. The insignificance of the statistics indicates that the agriculture activities in the north-eastern zone are more diverse, resulting in a varied performance of the farmholds. The insignificance of the results also indicates that it may take more time to provide any conclusive evidence of the impact of the FFP. On the whole, the FFP interventions have resulted in achieving significantly higher incomes and nutritional security of the farmholds compared to the control.
The FFP has directly impacted four of the SDGs, viz., SDG-1 (no poverty), SDG-2 (zero hunger), SDG-3 (good health and well-being) and SDG-12 (responsible consumption and production), as depicted in Table 9. The substantial increase in farm income (up to 83,407 INR/ha) and cropping intensity (up to 18.5%) have paved the way for the SDG to end poverty in all six zones after the implementation of the FFP. The per capita consumption of food (up to 7.08 units of CEQ) and increased cropping intensity have led to zero hunger (SDG-2) in the FFP-implemented villages. As the FFP has provided access to nutritional health, and encouraged the enhanced usage of manures (up to 0.94 t/ha) and savings by reducing the usage of synthetic pesticides (up to 1340.89 INR/ha) and fertilizer (up to 18.39 kg/ha), it has helped in attaining the SDG-3 on good health and well-being. SDG-12 was attained in the FFP villages with responsible consumption and production of food crops, poultry, and livestock-based products, as depicted in Table 8 and Table 9.

4. Conclusions and Policy Implications

This study captures important SDG-linked outcomes of the ICAR’s flagship outreach program, the FFP, using a rigorous outcome evaluation framework and measures.
The results provide empirical evidence of how innovative, participatory, and iterative approaches can produce outcomes directly linked to select SDGs. The results clearly demonstrate a substantial increase in the adoption of improved farm practices. In turn, this has led to increased cropping intensity, farm productivity, farm income, and human nutritional intake as a consequence of FFP intervention in over 80% of farms. Further, it is also witnessed in the treated households that the FFP has led to an increased number of farm animals, including poultry, which helps in maintaining diversity and enhanced livelihoods. Thus, the study conclusively established a positive and significant impact of the program (FFP) on farmers and their households.
The recorded results show favorable implications for scaling up and institutionalizing the FFP approach and process at a pan-national level. The study recommends awareness creation, capacity building, a participatory mode of an interdisciplinary approach, and financial and governance support for the effective scaling up of the FFP across the agricultural research and development landscape of India.

Author Contributions

Conceptualization, A.K.S.; methodology, P.V. and N.S.; validation, P.S.S. and P.S.; formal analysis, C.S.R. and V.P.C.; data curation, B.K.; writing–review & editing, B.S.S. All authors have read and agreed to the published version of the manuscript.

Funding

This research was funded by ICAR grant number [F.No.8(38)/Audit/FFP/2016-17/] and The APC was funded by [ICAR and F.No.8(38)/Audit/FFP/2016-17/] from ICAR-NAARM.

Institutional Review Board Statement

The study was conducted in accordance with the declaration of Project Monitoring Cell (PME) of ICAR-NAARM and approved: PME/Publication/Journal/2022/17 on 01.12.2022.

Informed Consent Statement

Not applicable.

Data Availability Statement

Not applicable.

Acknowledgments

The authors acknowledge the valuable contribution and information provided by the farmers, all the principal investigators, and the teams associated with the ICAR-FFP of the partner institutions in developing the framework. The authors also thank all the Directors and Nodal Officers of the ATARIs for catalyzing with valuable guidance the various stages in developing this paper.

Conflicts of Interest

The authors declare no conflict of interest.

References

  1. Ministry of Finance Government of India. Economic Survey 2020–21. 2021. Available online: https://www.indiabudget.gov.in/economicsurvey/ (accessed on 29 October 2022).
  2. Chand, R.; Singh, J. Workforce Changes and Employment: Some Findings from PLFS Data Series; NITI Aayog Discussion Paper 1/2022; Government of India: New Delhi, India, 2022; p. 15. [Google Scholar]
  3. Pandey, B.; Reba, M.; Joshi, P.K.; Seto, K.C. Urbanization and food consumption in India. Sci. Rep. 2020, 10, 17241. [Google Scholar] [CrossRef] [PubMed]
  4. United Nations. Department of Economic and Social Affairs: Sustainable Development. Available online: https://sdgs.un.org/goals (accessed on 22 December 2022).
  5. Harris, D.; Orr, A. Is rainfed agriculture really a pathway from poverty? Agric. Syst. 2014, 123, 84–96. [Google Scholar] [CrossRef] [Green Version]
  6. Adhia, N. The role of ideological change in India’s economic liberalization. J. Socio-Econ. 2013, 44, 103–111. [Google Scholar] [CrossRef]
  7. Chhibber, A. Economic planning in India: Did we throw the baby out with the bathwater? Indian Public Policy Rev. 2022, 3, 1–19. [Google Scholar] [CrossRef]
  8. Tripathi, A.; Prasad, A.R. Estimation of agricultural supply response by cointegration approach. Indian Econ. J. 2009, 57, 106–131. [Google Scholar] [CrossRef]
  9. Pathak, H.; Mishra, J.P.; Mohapatra, T. Indian Agriculture after Independence; Indian Council of Agricultural Research: New Delhi, India, 2022; p. 426. ISBN 978-81-7164-256-4. [Google Scholar]
  10. Valdivia, R.; Homann-Kee Tui, S.; Antle, J.; Subash, N.; Singh, H.; Nedumaram, S.; Hathie, I.; Geethalakshmi, V.; Claessens, L.; Dickson, C. Representative agricultural pathways: A multi-scale foresight process to support transformation and resilience of farming systems. In Handbook of Climate Change and Agroecosystems: Climate Change and Farming System Planning in Africa and South Asia: AgMIP Stakeholder-Driven Research Part 2; Rosenzweig, C., Mutter, C., Contreras, E.M., Eds.; World Scientific Publishing: Singapore, 2021; Volume 5, pp. 47–102. [Google Scholar]
  11. Kokate, K.D.; Singh, A.K. Farmer FIRST: Enriching Knowledge- Integrating Technology; Indian Council of Agricultural Research: New Delhi, India, 2013; p. 37. [Google Scholar]
  12. Imaz, M.; Sheinbaum, C. Science and technology in the framework of the sustainable development goals. World J. Sci. Technol. Sustain. Dev. 2017, 14, 2–17. [Google Scholar] [CrossRef]
  13. Rao, C.S.; Gopinath, K.A.; Prasad, J.V.N.S.; Singh, A.K. Climate Resilient Villages for Sustainable Food Security in Tropical India: Concept, Process, Technologies, institutions, and Impacts. Adv. Agron. 2016, 140, 101–214. [Google Scholar]
  14. Antle, J.M.; Homann-Kee Tui, S.; Descheemaeker, K.; Masikati, P.; Valdivia, R.O. Using AgMIP regional integrated assessment methods to evaluate climate impact, adaptation, vulnerability and resilience in agricultural systems. In Climate Smart Agriculture-Building Resilience to Climate Change, Natural Resource Management and Policy; Zilberman, D., Lipper, L., McCarthy, N., Asfaw, S., Branca, G., Eds.; Springer: Rome, Italy, 2017; Volume 52, pp. 307–333. [Google Scholar] [CrossRef] [Green Version]
  15. Blümmel, M.; Homann-Kee Tui, S.; Valbuena, D.; Duncan, A.; Herrero, M. Biomass in crop-livestock systems in the context of the livestock revolution. Secheresse 2013, 24, 330–339. [Google Scholar] [CrossRef] [Green Version]
  16. Garrett, R.D.; Niles, M.T.; Gil, J.D.; Gaudin, A.; Chaplin-Kramer, R.; Assmann, A.; Assmann, T.S.; Brewer, K.; de Faccio Carvalho, P.C.; Cortner, O.; et al. Social and ecological analysis of commercial integrated crop livestock systems: Current knowledge and remaining uncertainty. Agric. Syst. 2017, 155, 136–146. [Google Scholar] [CrossRef] [Green Version]
  17. Gill, M.S.; Singh, J.P.; Gangwar, K.S. Integrated farming system and agriculture sustainability. Indian J. Agron. 2010, 54, 128–139. [Google Scholar]
  18. Solaiappan, U.; Subramanian, V.; Sankar, G.R. Selection of suitable integrated farming system model for rainfed semi-arid vertic inceptisols in Tamilnadu. Indian J. Agron. 2007, 52, 194–197. [Google Scholar]
  19. Farmer FIRST Programme. Available online: https://ffp.icar.gov.in/ (accessed on 29 December 2022).
  20. Glewwe, P.; Jacoby, H.G. Economic Growth and the Demand for Education: Is There a Wealth Effect? J. Dev. Econ. 2004, 74, 33–51. [Google Scholar] [CrossRef]
  21. Emran, S.-A.; Krupnik, T.J.; Aravindakshan, S.; Kumar, V.; Pittelkow, C.M. Factors contributing to farm-level productivity and household income generation in coastal Bangladesh’s rice-based farming systems. PLoS ONE 2021, 16, e0256694. [Google Scholar] [CrossRef]
  22. Kaini, S.; Gardner, T.; Sharma, A.K. Assessment of Socio-Economic Factors Impacting on the Cropping Intensity of an Irrigation Scheme in Developing Countries. Irrig. Drain. 2020, 69, 363–375. [Google Scholar] [CrossRef]
  23. Paria, B.; Mishra, P.; Behera, B. Climate change and transition in cropping patterns: District level evidence from West Bengal, India. Environ. Chall. 2022, 7, 100499. Available online: https://www.sciencedirect.com/science/article/pii/S2667010022000592 (accessed on 11 November 2022). [CrossRef]
  24. Iqbal, M.A.; Rizwan, M.; Abbas, A.; Makhdum, M.S.A.; Kousar, R.; Nazam, M.; Samie, A.; Nadeem, N. A Quest for Livelihood Sustainability? Patterns, Motives and Determinants of Non-Farm Income Diversification among Agricultural Households in Punjab, Pakistan. Sustainability 2021, 13, 9084. [Google Scholar] [CrossRef]
  25. Muriithi, J.G.; Waweru, K.M.; Muturi, W.M. Effect of Credit Risk on Financial Performance of Commercial Banks Kenya. J. Eco. Fin. 2016, 7, 72–83. [Google Scholar] [CrossRef]
  26. Olounlade, O.A.; Li, G.-C.; Kokoye, S.E.H.; Dossouhoui, F.V.; Akpa, K.A.A.; Anshiso, D.; Biaou, G. Impact of Participation in Contract Farming on Smallholder Farmers’ Income and Food Security in Rural Benin: PSM and LATE Parameter Combined. Sustainability 2020, 12, 901. [Google Scholar] [CrossRef] [Green Version]
  27. Weißhuhn, P.; Müller, F.; Wiggering, H. Ecosystem Vulnerability Review: Proposal of an Interdisciplinary Ecosystem Assessment Approach. Environ. Manag. 2018, 61, 904–915. [Google Scholar] [CrossRef] [Green Version]
  28. Mason-D’Croz, D.; Sulser, T.B.; Wiebe, K.; Rosegrant, M.W.; Lowder, S.K.; Nin-Pratt, A.; Willenbockel, D.; Robinson, S.; Zhu, T.; Cenacchi, N.; et al. Agricultural investments and hunger in Africa modeling potential contributions to SDG 2–Zero Hunger. World Dev. 2019, 116, 38–53. [Google Scholar] [CrossRef]
  29. Guo, Y.; Xia, H.; Pan, L.; Zhao, X.; Li, R.; Bian, X.; Wang, R.; Yu, C. Development of a New Phenology Algorithm for Fine Mapping of Cropping Intensity in Complex Planting Areas Using Sentinel-2 and Google Earth Engine. ISPRS Int. J. Geo-Inf. 2021, 10, 587. [Google Scholar] [CrossRef]
  30. Wu, W.; Yu, Q.; You, L.; Chen, K.; Tang, H.; Liu, J. Global cropping intensity gaps: Increasing food production without crop land expansion. Land Use Policy 2018, 76, 515–525. [Google Scholar] [CrossRef]
  31. Byerlee, D.; Fanzo, J. The SDG of zero hunger 75 years on: Turning full circle on agriculture and nutrition. Glob. Food Secur. 2019, 21, 52–59. [Google Scholar] [CrossRef]
  32. Fang, C.; Sanogo, I. Food Price Volatility and Natural Hazards in Pakistan: Measuring the Impacts on Hunger and Food Assistance; Food and Agriculture Organization of the United Nations: Rome, Italy, 2014; p. 141. Available online: https://www.fao.org/3/i3808e/i3808e.pdf (accessed on 29 December 2022).
  33. Tiwari, T.; Gathala, M.; Chowdhury, A.; Shrestha, R.; Kumar, S.; Kumar, U.; Islam, S.; Rashid, M.; Anwar, M.; Hossain, I. Sustainable Intensification in the Eastern Gangetic Plains: Key to Food Security and Livelihood Improvement of Smallholders. Proceedings 2019, 36, 171. [Google Scholar] [CrossRef] [Green Version]
  34. Fallahpour, F.; Aminghafouri, A.; Ghalegolab Behbahani, A.; Bannayan, M. The environmental impact assessment of wheat and barley production by using life cycle assessment (LCA) methodology. Environ. Dev. Sustain. 2012, 14, 979–992. [Google Scholar] [CrossRef]
  35. Cisilino, F.; Bodini, A.; Zanoli, A. Rural development programs’ impact on environment: An ex-post evaluation of organic farming. Land Use Policy 2019, 85, 454–462. [Google Scholar] [CrossRef]
  36. Connor, M.; de Guia, A.H.; Pustika, A.B.; Sudarmaji; Kobarsih, M.; Hellin, J. Rice Farming in Central Java, Indonesia—Adoption of Sustainable Farming Practices, Impacts and Implications. Agronomy 2021, 11, 881. [Google Scholar] [CrossRef]
  37. Rask, K.J.; Rask, N. Economic development and food production–consumption balance: A growing global challenge. Food Policy 2011, 36, 186–196. [Google Scholar] [CrossRef]
  38. Adan, H.; Fuerst, F. Do energy efficiency measures really reduce household energy consumption? A difference-in-difference analysis. Energy Effic. 2016, 9, 1207–1219. [Google Scholar] [CrossRef] [Green Version]
  39. Gertler, P.J.; Martinez, S.; Premand, P.; Rawlings, L.B.; Vermeersch, C.M. Impact Evaluation in Practice; The World Bank: Washington, DC, USA, 2011; ISBN 978-0-8213-8541-8. [Google Scholar] [CrossRef]
  40. Angrist, J.D.; Pischke, J.S. Mostly Harmless Econometrics: An Empiricist’s Companion; Princeton University Press: Princeton, NJ, USA, 2009; p. 337. ISBN 9780691120355. [Google Scholar]
  41. Lechner, M. The Estimation of Causal Effects by Difference-in-Difference Methods. Found. Trends Econom. 2011, 4, 165–224. [Google Scholar] [CrossRef] [Green Version]
  42. Wooldridge, J.M. Introductory Econometrics: A Modern Approach, 5th ed.; South-Western College Publisher: Mason, OH, USA, 2012; p. 881. ISBN 978-1-111-53104-1. [Google Scholar]
  43. Giller, K.E.; Tittonell, P.; Rufino, M.C.; Van Wijk, M.T.; Zingore, S.; Mapfumo, P.; Adjei-Nsiah, S.; Herrero, M.; Chikowo, R.; Corbeels, M.; et al. Communicating complexity: Integrated assessment of trade-offs concerning soil fertility management within African farming systems to support innovation and development. Agric. Syst. 2011, 104, 191–203. [Google Scholar] [CrossRef]
  44. Srinivasarao, C.; Venkateswarlu, B.; Lal, R.; Singh, A.K.; Kundu, S. Sustainable management of soils of dryland ecosystems of India for enhancing agronomic productivity and sequestering carbon. Adv. Agron. 2013, 121, 253–329. [Google Scholar]
  45. Directorate of Plant Protection, Quarantine & Storage, Department of Agriculture & Famers Welfare, Ministry of Agriculture & Famers Welfare, Government of India. Available online: http://ppqs.gov.in/statistical-database (accessed on 21 November 2022).
Figure 2. Indicator-based impact of zone-wise technology assemblage of FFP. S = Southern; N = Northern; C = Central; E = Eastern; W = Western; NE = North-Eastern.
Sustainability 15 02463 g002
Table 1. Details of implementation of the FFP in different zones of India.
ZonesNo. of FFP-Implementing InstitutionsNo. of VillagesNo. of DemonstrationsNo. of Farm Families Participated
South Zone834927886
North Zone136561211,723
East Zone8351227574
Central Zone168243815,477
West Zone317482966
North East Zone315552665
Total51248136748,291
Table 2. Technology interventions and farm families participating in the FFP.
Intervention ModuleNumber of InterventionsNo. of Farm Families Participated
Crop-based modules15116,597
Horticulture-based modules11313,017
Livestock-based modules10511,398
NRM-based modules454370
Enterprise-based modules281852
IFS-based modules111057
Total45348,291
Table 3. Zone-wise sampling details.
ZonesNo. of Samples
TreatmentControlTotal
South Zone27377350
North Zone485121606
East Zone29999398
Central Zone617160777
West Zone12030150
North-Eastern Zone12130151
All zones19155172432
Table 4. Characteristics of agricultural production in the study area.
ZoneMajor Crops GrownAllied Enterprises
EasternPaddy, wheat, pulses (chickpea, green gram, and black gram), lentil, betel vine, vegetables, bananaPoultry (quails, Vanaraja birds), fishery, mushroom production
NorthernOilseeds (mustard, rapeseed, and cumin), wheat, oats, maize, pearl millet, pulses (green gram, black gram, chickpea, and pigeon pea), vegetables, lemon, and sugarcaneVermicomposting, mushroom production
CentralPaddy, maize, wheat, pearl millet, sweet corn, lentil, soybean, mustard, pulses (black gram, green gram, chickpea, and pigeon pea), sugarcane, gourds (bottle gourd, sponge gourd, and, bitter gourd), vegetables (brinjal, tomato, okra, chili, cucumber, spinach, coriander, fenugreek, and radish)Mushroom production, piggery, poultry–Kadaknath bird rearing, goat farming, beekeeping, and vermicomposting
North-EasternPaddy, wheat, lentil, turmeric, and vegetablesPiggery, poultry, rabbit and quails rearing, oyster mushroom, and vermicompost production
WesternGroundnut, cotton, wheat, sweet corn, paddy, pigeon pea, chickpea, sorghum, sugarcane, banana, and pomegranateVermicomposting and poultry
SouthernPaddy, millets, oil seeds (castor, oil palm, coconut, safflower, and sesamum), pulses (green gram, pigeon pea, and chickpea), fruit and vegetable cropsPoultry, fisheries, livestock management, and vermicomposting
Table 5. Outcome indicators selected for the study.
SDG GoalCriteriaImpact IndicatorReference
SDG-1:
No poverty
Enhancing economic capacity of the farmersNet farm income[24,25,26,27]
SDG-2:
Zero hunger
Expansion of the crop areaCropping intensity[28,29,30]
SDG-3:
Good health and wellbeing
Attaining household food and nutritional securityCereal Equivalent Quantity (CEQ)[31,32,33]
SDG-12:
Responsible consumption and production
Reduction in the level of usage of harmful technologiesUse of chemical fertilizers (negative indicator)[27,34]
Substituting ecologically sustainable inputsOrganic manure use[35,36]
Table 6. Profile of selected farms and households.
Household CharacteristicsTreatment *Control *Total *
A. Age of the respondent
Young (<35 years)235 (12.27)82 (15.86)317 (13.03)
Middle (35–55 years)1282 (66.95)331 (64.02)1613 (66.32)
Old (>55 years)398 (20.78)104 (20.11)502 (20.64)
B. Educational status
Illiterate116 (6.06)34 (6.58)150 (6.17)
Primary school532 (27.78)117 (22.63)649 (26.69)
High school814 (42.51)224 (43.33)1038 (42.68)
Intermediate248 (12.95)84 (16.25)332 (13.65)
Degree180 (9.40)53 (10.25)233 (9.58)
Post-graduate25 (1.31)5 (0.97)30 (1.23)
C. Annual income in Indian Rupee (INR)
Up to 50,000265 (13.84)102 (19.73)367 (15.09)
50,000–100,000458 (23.92)172 (33.27)630 (25.90)
100,000–200,000510 (26.63)125 (24.18)635 (26.11)
More than 200,000682 (35.61)118 (22.82)800 (32.89)
D. Landholding
Marginal (<1 ha)795 (41.51)249 (48.16)1044 (42.93)
Small (1–2 ha)657 (34.31)175 (33.85)832 (34.21)
Large (>2 ha)463 (24.18)93 (17.99)556 (22.86)
E. Family size
Small family (<5 members)663 (34.62)189 (36.56)852 (35.03)
Medium family (5–8 members)1014 (52.95)266 (51.45)1280 (52.63)
Large family (>8 members)238 (12.43)62 (11.99)300 (12.34)
* Figures given in parentheses indicate percentages.
Table 7. The zone-wise field interventions implemented under the FFP.
ZoneField Crops *Horticulture *Live
Stock *
NRM *Enterprise *IFS *Module-Wise Total *
Eastern17
(31.80)
17
(31.80)
12
(22.22)
5
(9.26)
1
(1.85)
2
(3.70)
54
(11.76)
Northern56
(28.43)
60
(30.46)
49
(24.87)
26
(13.20)
3
(1.52)
3
(1.52)
197 (42.97)
Central37
(44.58)
14
(16.87)
12
(14.46)
3
(3.61)
14
(16.87)
3
(3.61)
83
(18.08)
North-Eastern8
(22.22)
8
(22.22)
8
(22.22)
6
(16.67)
6
(16.67)
2
(5.56)
38
(8.28)
Western12
(42.86)
3
(10.71)
2
(7.14)
5
(17.86)
4
(14.29)
2
(7.14)
28
(6.10)
Southern21
(38.18)
11
(20.00)
22
(40.00)
2
(3.64)
2
(3.64)
1
(1.82)
59
(12.85)
Zone-wise total151 (32.90)113 (25.62)105 (22.88)47
(10.2)
30
(6.54)
13 (2.83)459
* Figures in parentheses indicate percentages.
Table 8. DiD estimates of the impact of technology assemblage intervention through FFP.
ZoneIndicators
Farm Income (INR/ha)Cropping Intensity (%)Manures (t/ha)Fertilizers (kg/ha)Pesticides (INR/ha)Nutritional Security (CEQ kg/capita/month)
Southern Zone
DiD71,916 ***18.5 ***0.29 *−18.39 **−1340.89 *6.18 ***
p > (z)0.0060.0010.0660.0170.0990.001
Northern Zone
DiD46,709 ***8.330.1728.62149.8 *6.05 ***
p > (z)0.0010.1720.1570.1330.070.001
Central Zone
DiD16,181 ***4.140.94 ***−9.86−824.715.24 ***
p > (z)0.0080.1020.0010.2820.0070.001
Eastern Zone
DiD24,120 ***2.040.86 ***8.89681.97 ***5.06 **
p > (z)0.0010.7730.0020.2410.0030.047
Western Zone
DiD83,407 ***7.41 **2.26 ***0.46−434.727.08 ***
p > (z)0.0010.0430.0010.9660.4330.001
North-Eastern Zone
DiD20,377 *4.14−0.024.19−161.01 *5.67
p > (z)0.0650.3210.8030.6740.0680.24
***, ** & * significance at 1%, 5% & 10%.
Table 9. Contribution of FFP towards SDGs.
IndicatorsNo PovertyZero HungerGood Health and Well-BeingResponsible Consumption
and Production
SDG:1SDG:2SDG: 3SDG:12
Farm Income
Cropping Intensity
Manures
Fertiliser usage
Pesticides
Nutritional Security
Background colour is to highlight the difference.
Disclaimer/Publisher’s Note: The statements, opinions and data contained in all publications are solely those of the individual author(s) and contributor(s) and not of MDPI and/or the editor(s). MDPI and/or the editor(s) disclaim responsibility for any injury to people or property resulting from any ideas, methods, instructions or products referred to in the content.

