
A Framework for Evidence-Based Landscape Architecture: Cooling a Hot Urban Climate through Design

Department of Landscape Architecture and Urban Planning, Texas A&M University, College Station, TX 77843, USA
*
Author to whom correspondence should be addressed.
Sustainability 2023, 15(3), 2301; https://doi.org/10.3390/su15032301
Submission received: 7 December 2022
/
Revised: 21 January 2023
/
Accepted: 23 January 2023
/
Published: 26 January 2023
(This article belongs to the Special Issue Evidence-Based Design Promoting Human Well-Being in Urban Areas)
Abstract
:The rapidly advancing knowledge of the interactions between people and their environment provides opportunities for designers to practice evidence-based landscape architecture (EBLA) in designing outdoor spaces. Recent studies have proposed some characteristics of successful EBLA projects, including the following: amicable skepticism; the questioning of assumptions; the verification of information; the application of evidence to the problem at hand; and data that is openly reported and replicable. These five steps were the basis for a framework that was developed and tested through the redesign of a downtown area in a hot-climate city, El Paso, Texas. The process started with the collection of base information, including local climate conditions and evidence on heat-related illness. Case studies and a search of the literature led to the questioning of some assumptions, including the expectation that the air temperature on the site could be substantially modified through design. On-site microclimate measurements were used to confirm this insight, and were used to validate computer models. The validated models were used to assess the thermal comfort conditions across the site. A human energy budget model was used to identify the key atmospheric elements that both strongly affect a person’s heat health, and that can also be readily modified through landscape architectural design. These led to the development of guidelines, which were developed as a ‘tool kit’ and applied to the design. Amicable skepticism was practiced throughout the process to confirm that the decisions were made based on evidence, not opinions or preconceived notions. The resulting design was tested using computer models to check whether the goal of thermally comfortable conditions was met. The quantitative results illustrated the amount of improvement to the thermal comfort of site visitors. This process is universal and can be applied to any landscape.
1. Introduction
More than half the people in the world now live in cities, and in North America, more than 80% of the population is urban [1]. Urbanization has displaced green, natural landscapes with largely artificial spaces of concrete and other hard, non-transpiring surfaces. This has resulted in cities developing their own climates, including the well-known urban heat islands (UHI) [2]. This warming trend in cities, in conjunction with Global Climate Change (GCC), is putting the health and well-being of urban residents increasingly at risk of heat-related illnesses.
The cause of the UHI is well-known; hard, dry surfaces do not transpire, so little of the energy received from solar radiation can transform into evaporation [3]. This means that almost all of the energy is channeled into either sensible heat or emitted radiation, both of which serve to increase the amount of energy received by a person in the landscape. This over-heating can lead to heat stress and heat stroke, particularly in vulnerable populations, such as the elderly and the young.
However, simply increasing the amount of green space in a city does not resolve the problem. There are many places where green can be introduced that will have little to no effect on the health and well-being of urban residents. The interventions need to be designed, and the design needs to be based on evidence.
Evidence-based practices have long been part of professions such as medicine [4], but only recently have been applied to landscape architecture. The concept was introduced in 2011, and the number of papers that have suggested processes by which it can be used in practice has grown, albeit rather slowly [5].
The idea of evidence-based practice (EBP) was introduced by Gordon Guyatt and his team, using the term “evidence-based medicine” in 1991 [6]. Following this, healthcare system design, one of the closest disciplines to medicine, started using evidence-based design (EBD) and gained prominence in the early 2000s with the publication of the Institute of Medicine's report ‘Crossing the Quality Chasm’ [7].
A relatively new discipline, EBD has its roots in environmental psychology, architecture, medicine, and other sciences. It is based on the premise that the design of the built environment fundamentally impacts patient, provider, and organizational outcomes [7].
Landscape architecture has been relatively slow in adopting EBD. It was not until 2011 that the concept of evidence-based landscape architecture (EBLA) was first introduced, when Brown and Corry [5] argued that landscape architecture should become a more scholarly profession by embracing scholarly information, methodical record keeping, monitoring, and reporting. Meanwhile, more and more scholars pointed out the risk of ignoring the trend of evidence as a basis for practice. For example, Ndubisi [8] asked the question “How can designers, planners, allied professionals, decision makers, and the general public know, ascertain or validate that a high-performing landscape has been created that will provide the same benefits or even more for future generations?” To answer this question, traditional approaches that focus on aesthetic descriptions and the designer’s personal experience are insufficient.
Moreover, traditional design approaches fail to solve inter-disciplinary problems. An increasing number of people realize that the physical environment, shaped by landscape architecture, could have an effect on psychological health [9] and human thermal comfort [10,11]. The traditional design approach tends to deploy a descriptive narrative while avoiding the quantitative method. This raises suspicion about its effectiveness [12]. Today, landscape architects face various challenges, such as climate change, extreme weather, environmental health, urban degradation, ecological restoration, and urban heat islands. It is essential that the profession conveys the environmental, economic, and social values of excellent design, while using quantitative research to justify the design proposals [13].
There is no fixed model to define every step of the evidence-based design process. Conversely, the characteristics of specific projects bring diversity to the process. In 2003, Milburn and Brown [14] argued that the relationship between research and design could be identified as multiple models and differentiated by several characteristics, such as the source of ideas or concepts, the inclusion of the pre-design research phase, the inclusion of the post-construction evaluation phase, and a holistic approach to problem-solving [14]. Just like the relationship between design and research, evidence-based design models can be different according to project characteristics. Hamilton [15] points out that the evidence-based approach cannot be interpreted as one single model, and it may vary according to specialties or diverse practices.
Previous research has explained the evidence-based design approach in different ways, focusing on specific steps, and with various degrees of detail. Halawa et al. [16] focused on layout typologies and strategy optimization; Milburn and Brown [14] focused on multiple discrete models by which research is integrated into design; Hamilton [15] emphasized the flexible combination of real-life practice context and EBD theory in the area of architecture design; and Zimring et al. [7] gave a very general description of the multistep process, from framing, incorporation to design, and operations. Despite the different emphases and degrees of detail, the overall logical order tends to be the same, and the evidence-based methodology can be summarized as follows:
- (1)
- Identify the goals and key issue (often accompanied by preliminary information gathering or a client meeting);
- (2)
- Gather relevant information, and convert design issues into research questions;
- (3)
- Critically interpret the evidence, and create the fundamental knowledge evidence-based design;
- (4)
- Deploy the design strategy;
- (5)
- Optimization: Iterate between step (3) and (4), to improve design;
- (6)
- Measure the outcome.
The goal of this paper was to design and apply a framework through which evidence can be used to design urban areas so that they will be cooler and more heat-safe during extremely hot weather. The framework is based on advice from Brown and Corry [5,12], which has been modified and expanded to address urban design in an extremely hot urban area.
2. Materials and Methods
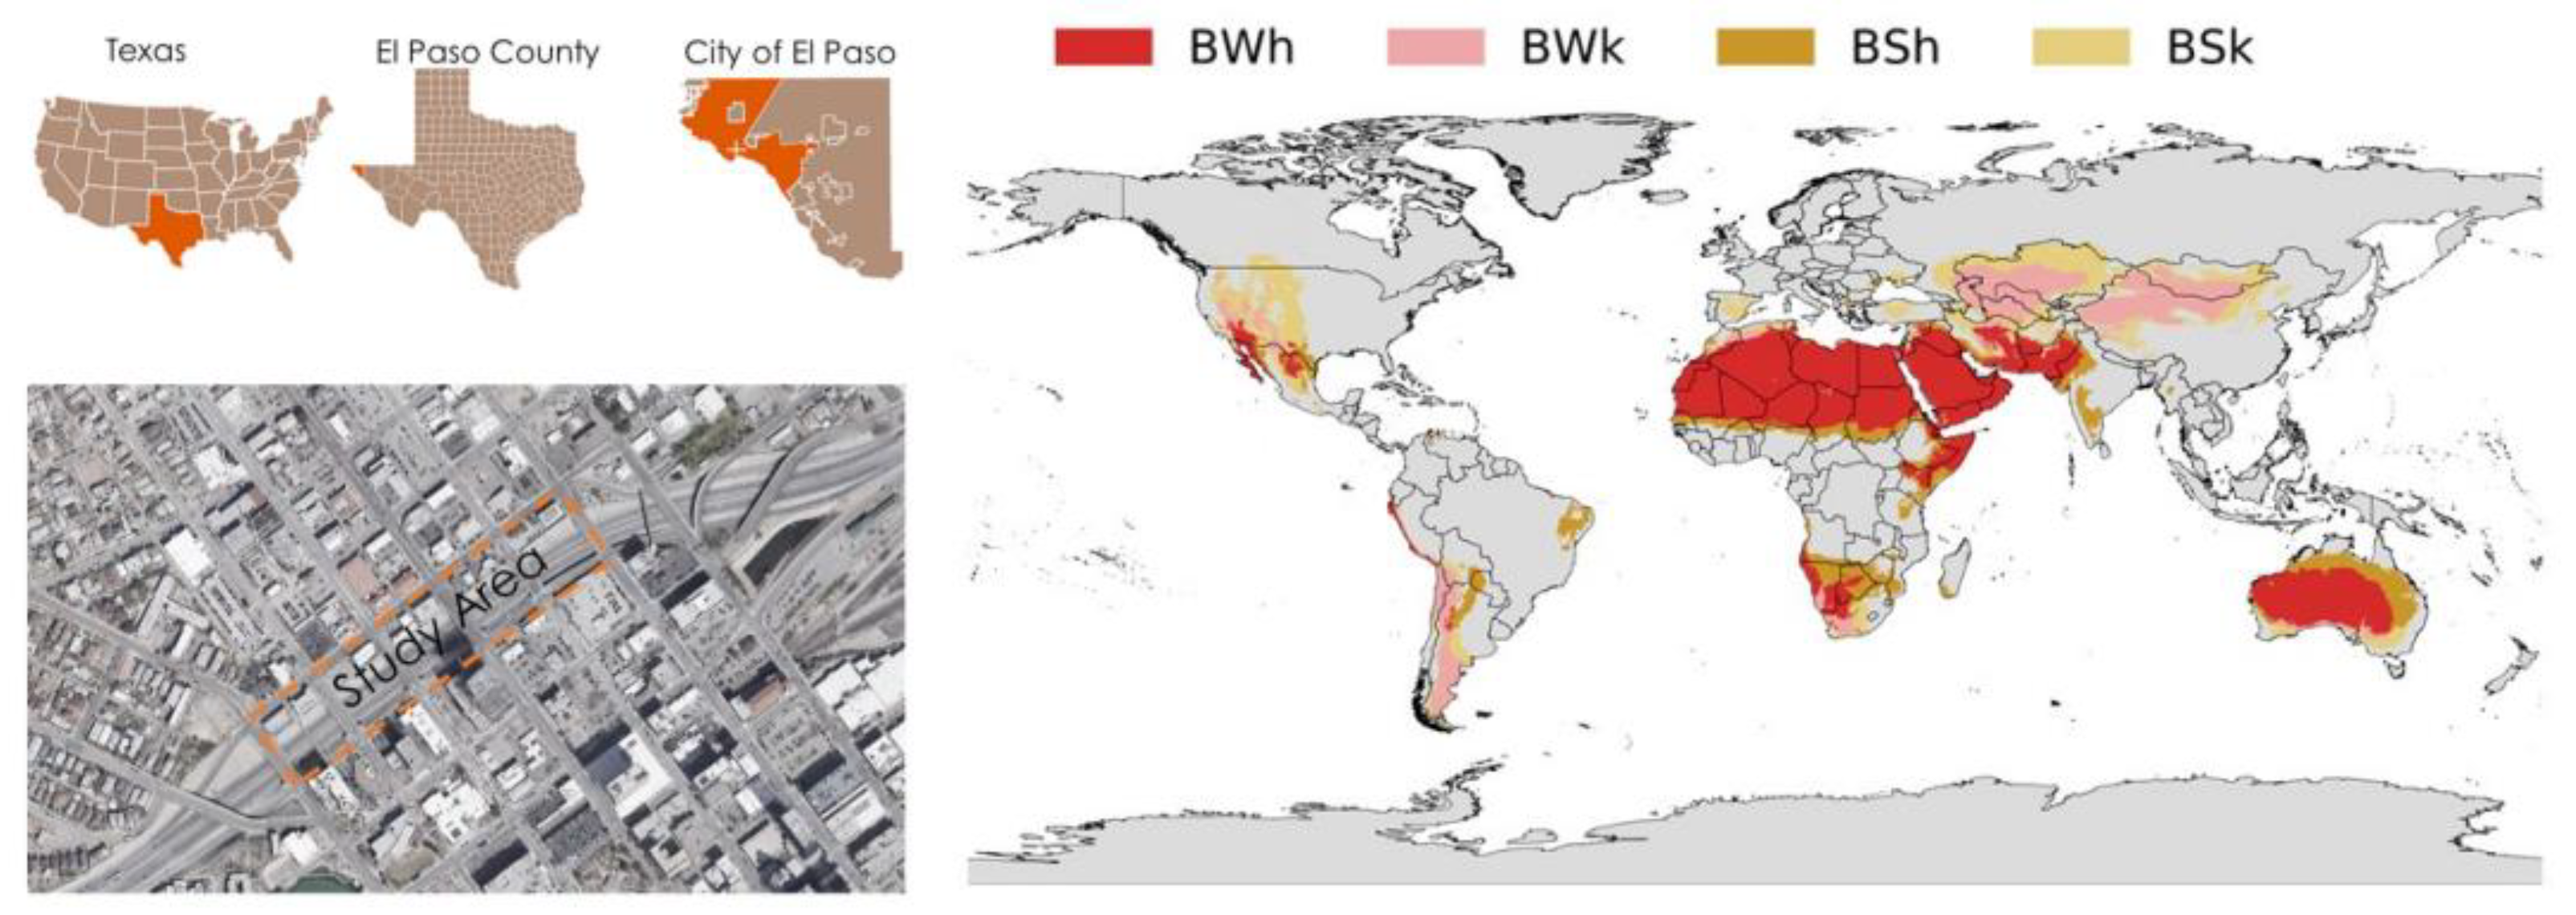
To illustrate how the EBLA Framework can be applied to solve important and difficult problems in the landscape, it was applied to the design of a Freeway Deck Park in El Paso, Texas (Figure 1). El Paso is located 1140 meters above sea level, and is defined as a mixed desert climate (Köppen climate classification: Hot desert climate, BWh and Cold desert climate, BWk). The city is surrounded by the Chihuahuan desert, with temperatures of 35–40° Celsius in the summer and an average of 220 mm rainfall per year. With 83% of daylight hours, the total sunshine time is 302 days per year.
The El Paso deck park project is based on the Reimagine I-10 freeway proposal (Downtown project, Segment 2), which advocates the widening of the I-10 freeway and the building of a concrete cover on the top side of the I-10 freeway as the site of a new interstate deck park.
The existing site has an area of 31700 m2. Similar to other highway interstates in Texas, the site is an urban grey space that separates the city into two sides. The traffic lane and sidewalk are covered with concrete and asphalt, and the sidewalk is narrow with no canopy trees and no shade structures. The summer climate of El Paso is extremely hot and sunny, and much of the outdoor urban space is essentially unusable for much of the year [17]. The design intent was to provide thermally comfortable outdoor spaces during the hottest part of the summer.
Figure 1.
Study area, 31.761942, −106.491952 (left), Köppen Climate Classification (right) [18], where BWh: Hot desert climate, BWk: Cold desert climate; BSh: Hot semi-arid climate; BSk: Cold semi-arid climate.
Figure 1.
Study area, 31.761942, −106.491952 (left), Köppen Climate Classification (right) [18], where BWh: Hot desert climate, BWk: Cold desert climate; BSh: Hot semi-arid climate; BSk: Cold semi-arid climate.

The conceptual diagram provided by Brown and Corry [12] was operationalized into a design framework (Figure 2), with details provided by Milburn and Brown [14].
The Amicable skepticism starts at the beginning of any project and should be considered throughout the whole process. This allows the designer to continuously gain project-related information. This generates and tests preliminary assumptions, and provides a constant reflection of the potential problems and issues, and the potential strategy to deal with them.
The Preliminary assumption is based on general information collection. The general information could be in any format, such as media, blogs, interviews, encyclopedias, etc. Through this step, a wide range of information should be collected and related, and it helps to produce a context for the project. Based on this general project context, the preliminary assumption is generated.
The questioning of assumptions includes case studies and a literature review, where we narrow down the topic, and the more relevant information is collected. This produces the research question, which is also the questioning of the preliminary assumption.
The verification of information identifies and interprets the simulated human-level micrometeorological information, creating some fundamental knowledge of the evidence-based design.
The application of evidence synthesizes the evidence, producing a set of design intervention tools, which are then applied to the site. The iteration process between the verification of information and the application of evidence works to optimize the design and continuously improve the overall design outcome.
The openly reported and replicable step measures the outcome. The outcome of the design intervention will be objectively measured and described, and will be archived into the knowledge pool. It works as a piece of existing knowledge, ready to be critically applied to the future landscape design project.
The empirical evidence is the categorized knowledge pool that is trusted by the public because it is documentable, replicable, and evaluable. Future design projects should take the openly reported data as the design basis, and also produce their own replicable results. In other words, the design process is transferred into a systematic framework, where the effectiveness is documented and ready to be repeatedly used and evaluated by future projects.
3. Results: Application of EBLA Framework to a Freeway Deck Park in El Paso, Texas
3.1. Amicable Skepticism
Amicable skepticism resulted in a deeper understanding of which microclimate elements have the greatest effect on human thermal comfort and heat-safety. The first question was how much the extremely high air temperatures could be modified through site design.
3.1.1. General Information Collection: Heat-Related Risk
General information collection was conducted to identify the heat-related risk in El Paso. Information from articles and media reported the high morbidity of heat-related illnesses, high mortality, and the continuous urbanization process; therefore, we identified heat risk as a critical issue in El Paso [19].
3.1.2. General Information Collection: Meteorology Backgrounds
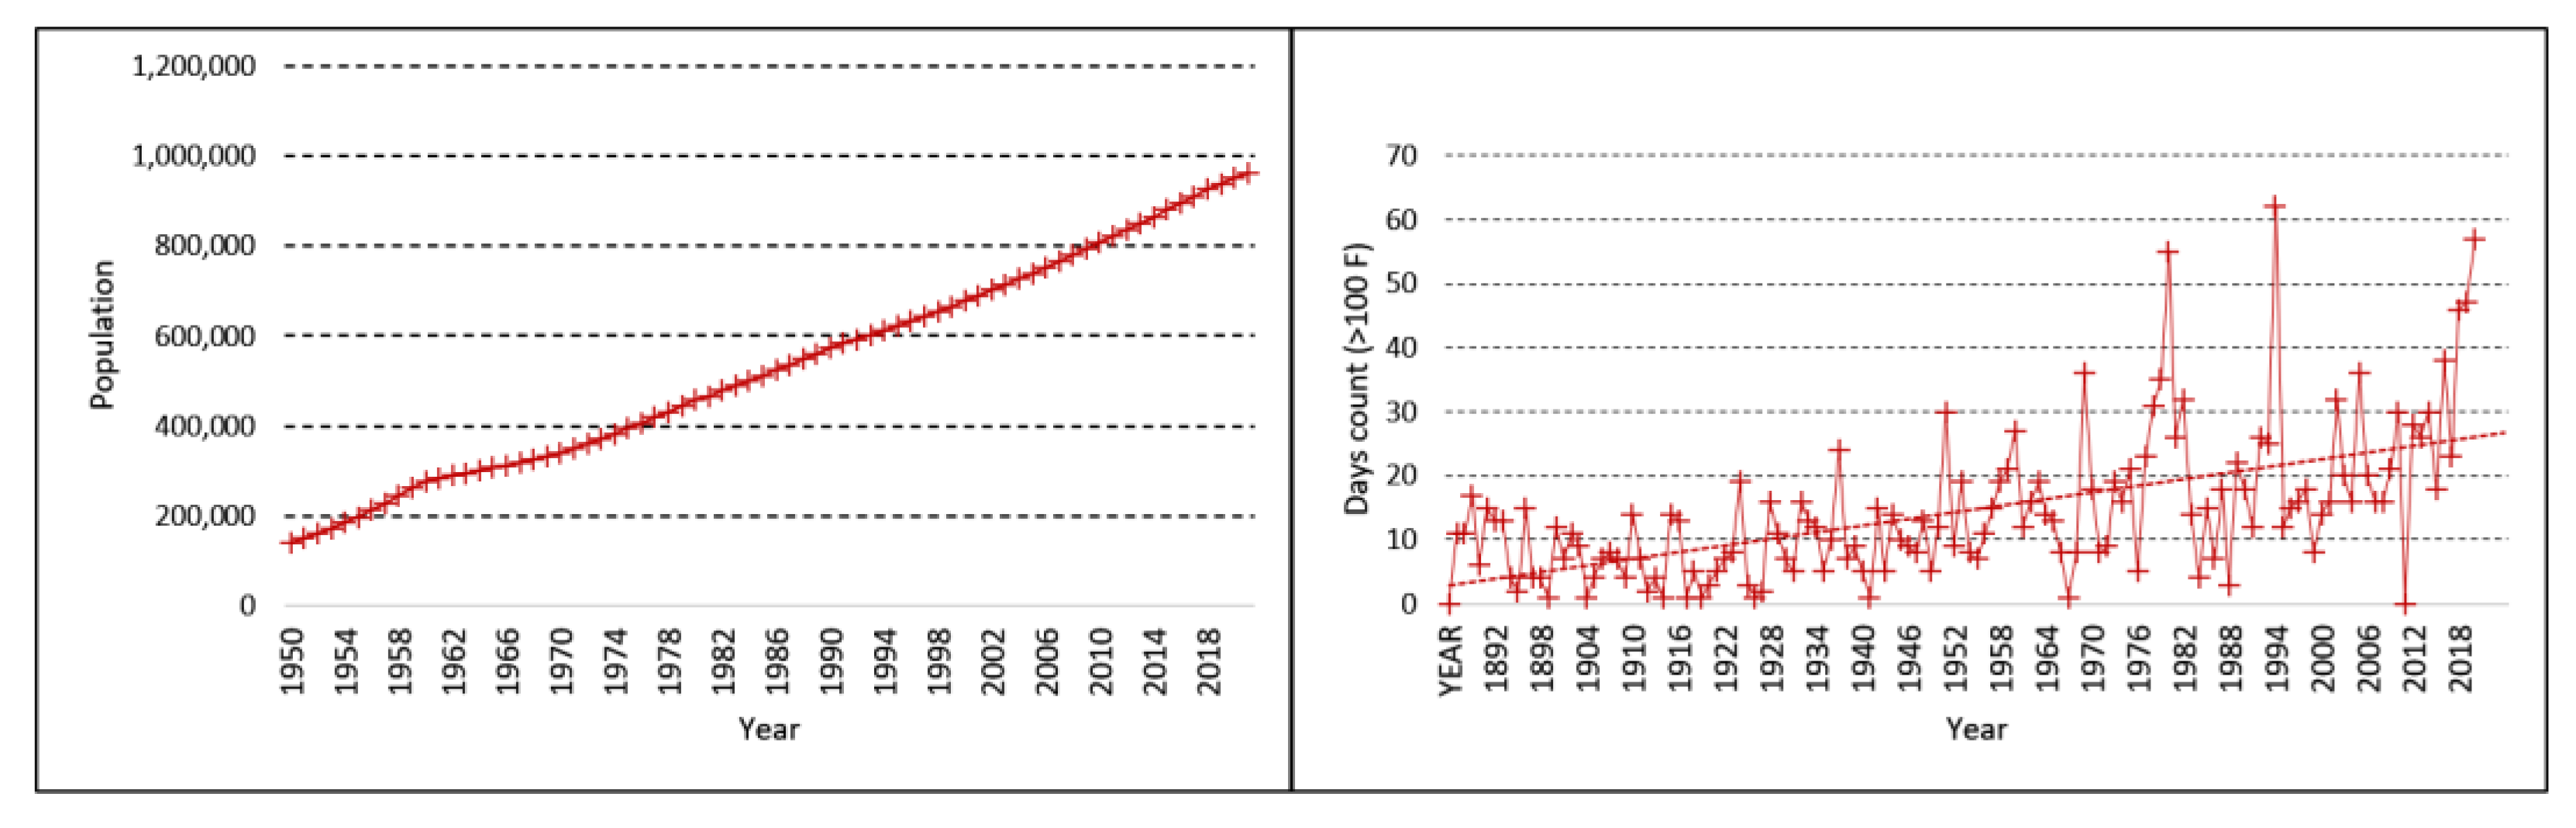
The general information collection identified the climatic issue in El Paso. A search of historical climate data (1886–2021) was conducted, which showed (1) a continuously increasing trend in the air temperature, (2) more than 300 days of exposure to shortwave solar radiation per year, and (3) an increasing number of extremely hot days per year (Figure 3).
3.1.3. A Preliminary Assumption
Based on these results from the general information collection, a preliminary assumption that most of the environmental parameters could be modified by landscape design was made, with the air temperature and solar radiation playing the most important role in adjusting the human energy budget.
3.2. Questioning of Assumptions
To avoid the impact of pre-conceived positions [12], a search for deeper understanding was conducted to question the preliminary assumption. This step focused on a comprehensive and scientific knowledge gathering, with the motivation to challenge the preliminary assumption. Based on the literature review [11,20,21] and three case studies with a similar context (Klyde Warren Park, TX; Jim Ellis Freeway Park, WA; Margaret T. Hance Deck Park, AZ), the assumption that landscape design can modify both the air temperature and humidity were questioned; this resulted in an understanding that the landscape has little effect on modifying them, while the landscape can substantially modify the amount of wind, and solar and terrestrial radiation, that a person might experience [22].
3.2.1. Case Study of Urban Interstate Deck Park
Several case studies were investigated to identify the frequently used landscape design interventions and their potential impacts, (1) the shade structures and tree canopy as measures to control solar radiation, thus impacting on the terrestrial and direct solar heat gain, (2) water body and water mist as components that control air temperature and humidity, thus impacting the evaporative and convective heat loss and, (3) a vertical structure that disturbs the wind, thus impacting the convective heat loss.
3.2.2. Literature Search
The literature search was conducted to collect empirical evidence about the degree of change that landscape intervention could bring. Peer-reviewed journal articles were selected from Landscape and Urban Planning, Building Environmental, Sustainability, The International Journal of Biometeorology, etc. Finally, a summarized overview of the previous evidence was used to question the preliminary assumptions that landscape components could change every microclimate parameter, thus impacting the human-level thermal comfort.
3.2.3. Questioning of Assumptions Based on Case Study and Literature Search
The case study and literature review led to the questioning of the assumptions: landscape design could be able to impact thermal comfort but might have a limited effect in modifying climate air temperature (Ta) and relative humidity [21,23]. Even if some measures could impact the local Ta, the ignorable change of local Ta only causes a limited effect on thermal comfort.
To sum up, we conducted a comprehensive case study and literature search, and then questioned the assumption that landscape design could effectively impact the relative humidity and air temperature at the human level.
3.3. Verification of Information
To address the assumption that “landscape design could effectively impact the relative humidity and air temperature at the human level”, the macro-scale weather document was considered to be too general and failed to cover the human-level thermal environment. A more accurate evaluation of the human-level microclimate was deemed to be necessary.
The computational fluid dynamic (CFD) has been widely applied to simulate the interaction of gases and liquids, and is currently welcomed as the tool to evaluate the microscale climate and thermal comfort; there has been a series of software packages developed based on CFD, such as FLUENT, OpenFOAM, SOLIDWORKS, ENVI-met, etc. ENVI-met is one of the representative simulation software packages, which has been widely applied in simulating urban microclimate conditions, such as radiation environment, heat flux from vegetation, and heat exchange inside water and soil. As the ENVI-met model provides an acceptable temporal (1 hour) and spatial (1 meter) resolution, and it has been widely applied in urban microclimate studies [11,20], it is selected as the software package to evaluate the site’s microclimate. This step included the human-level ENVI-met model validation, and the model simulation output. On-site micrometeorological data were collected and used to verify ENVI-met models (https://www.envi-met.com/ (accessed on 20 August 2022)). Then, the ENVI-met model output, known as the microclimate indicators (air temperature, wind speed, relative humidity and direct solar radiation), were measured at a 1.5 m level, which will be used to evaluate the human-level thermal comfort.
3.3.1. In-Situ Measurement to Acquire Real-World Data
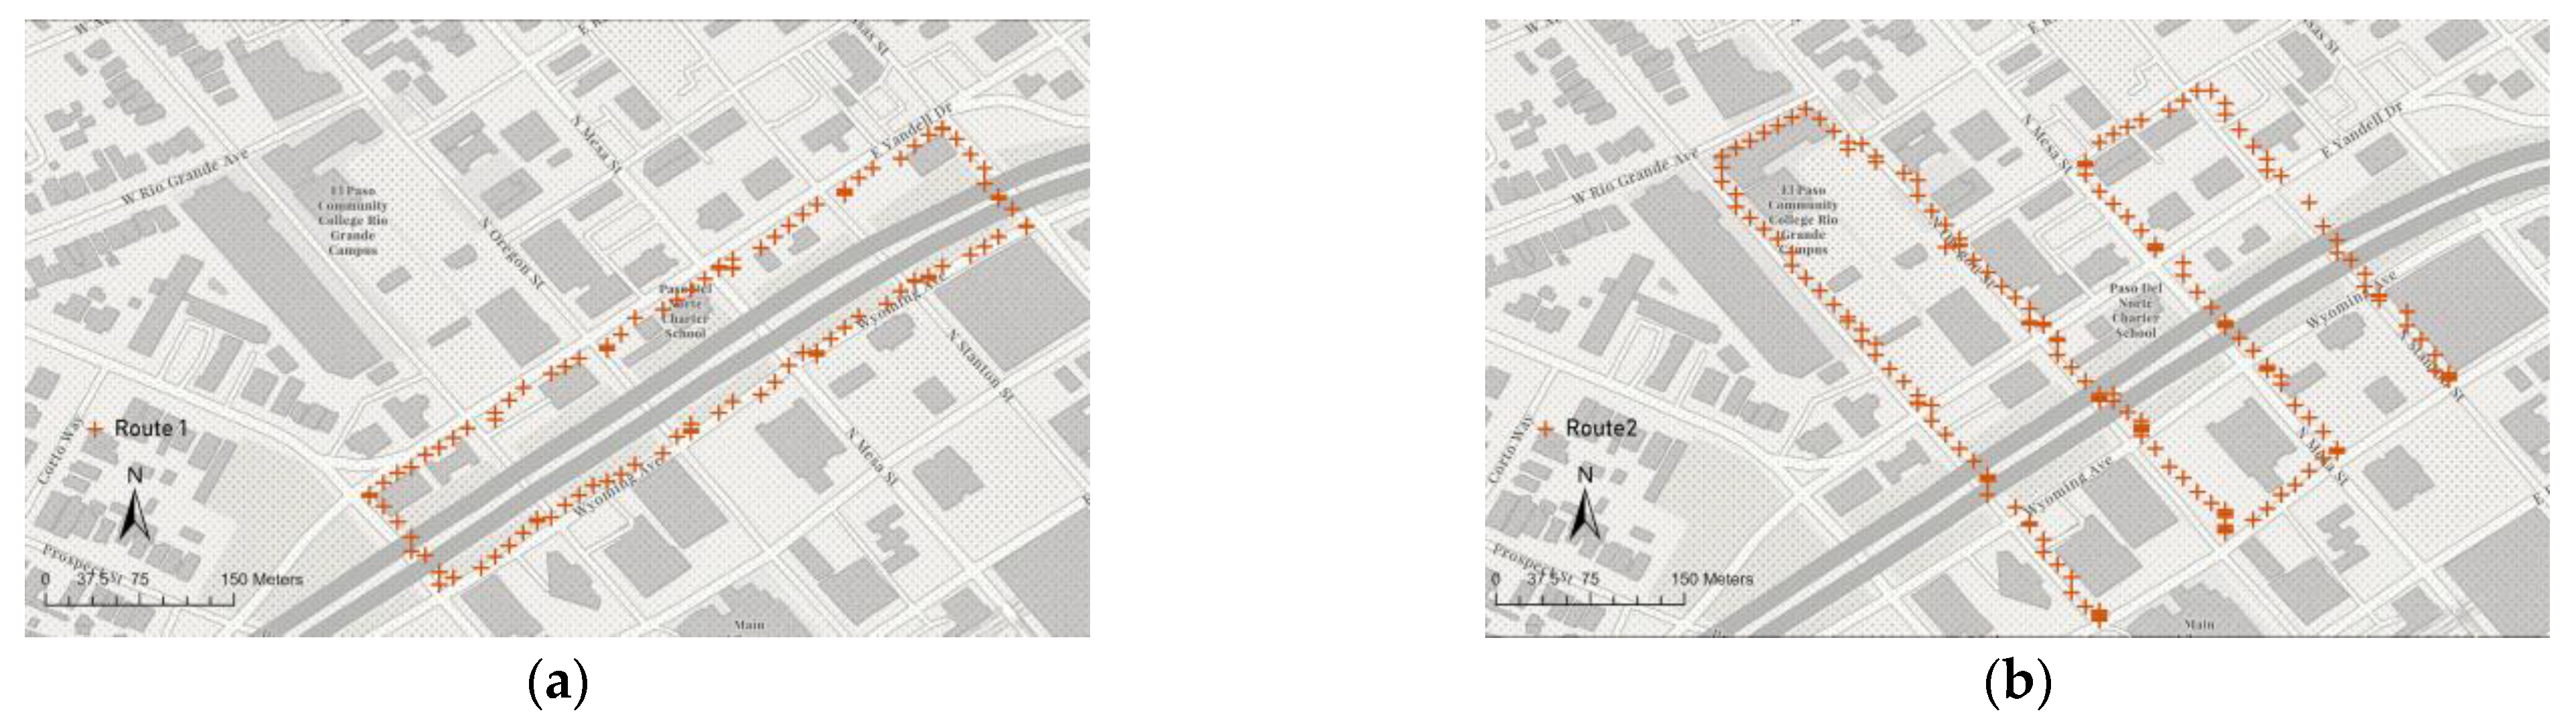
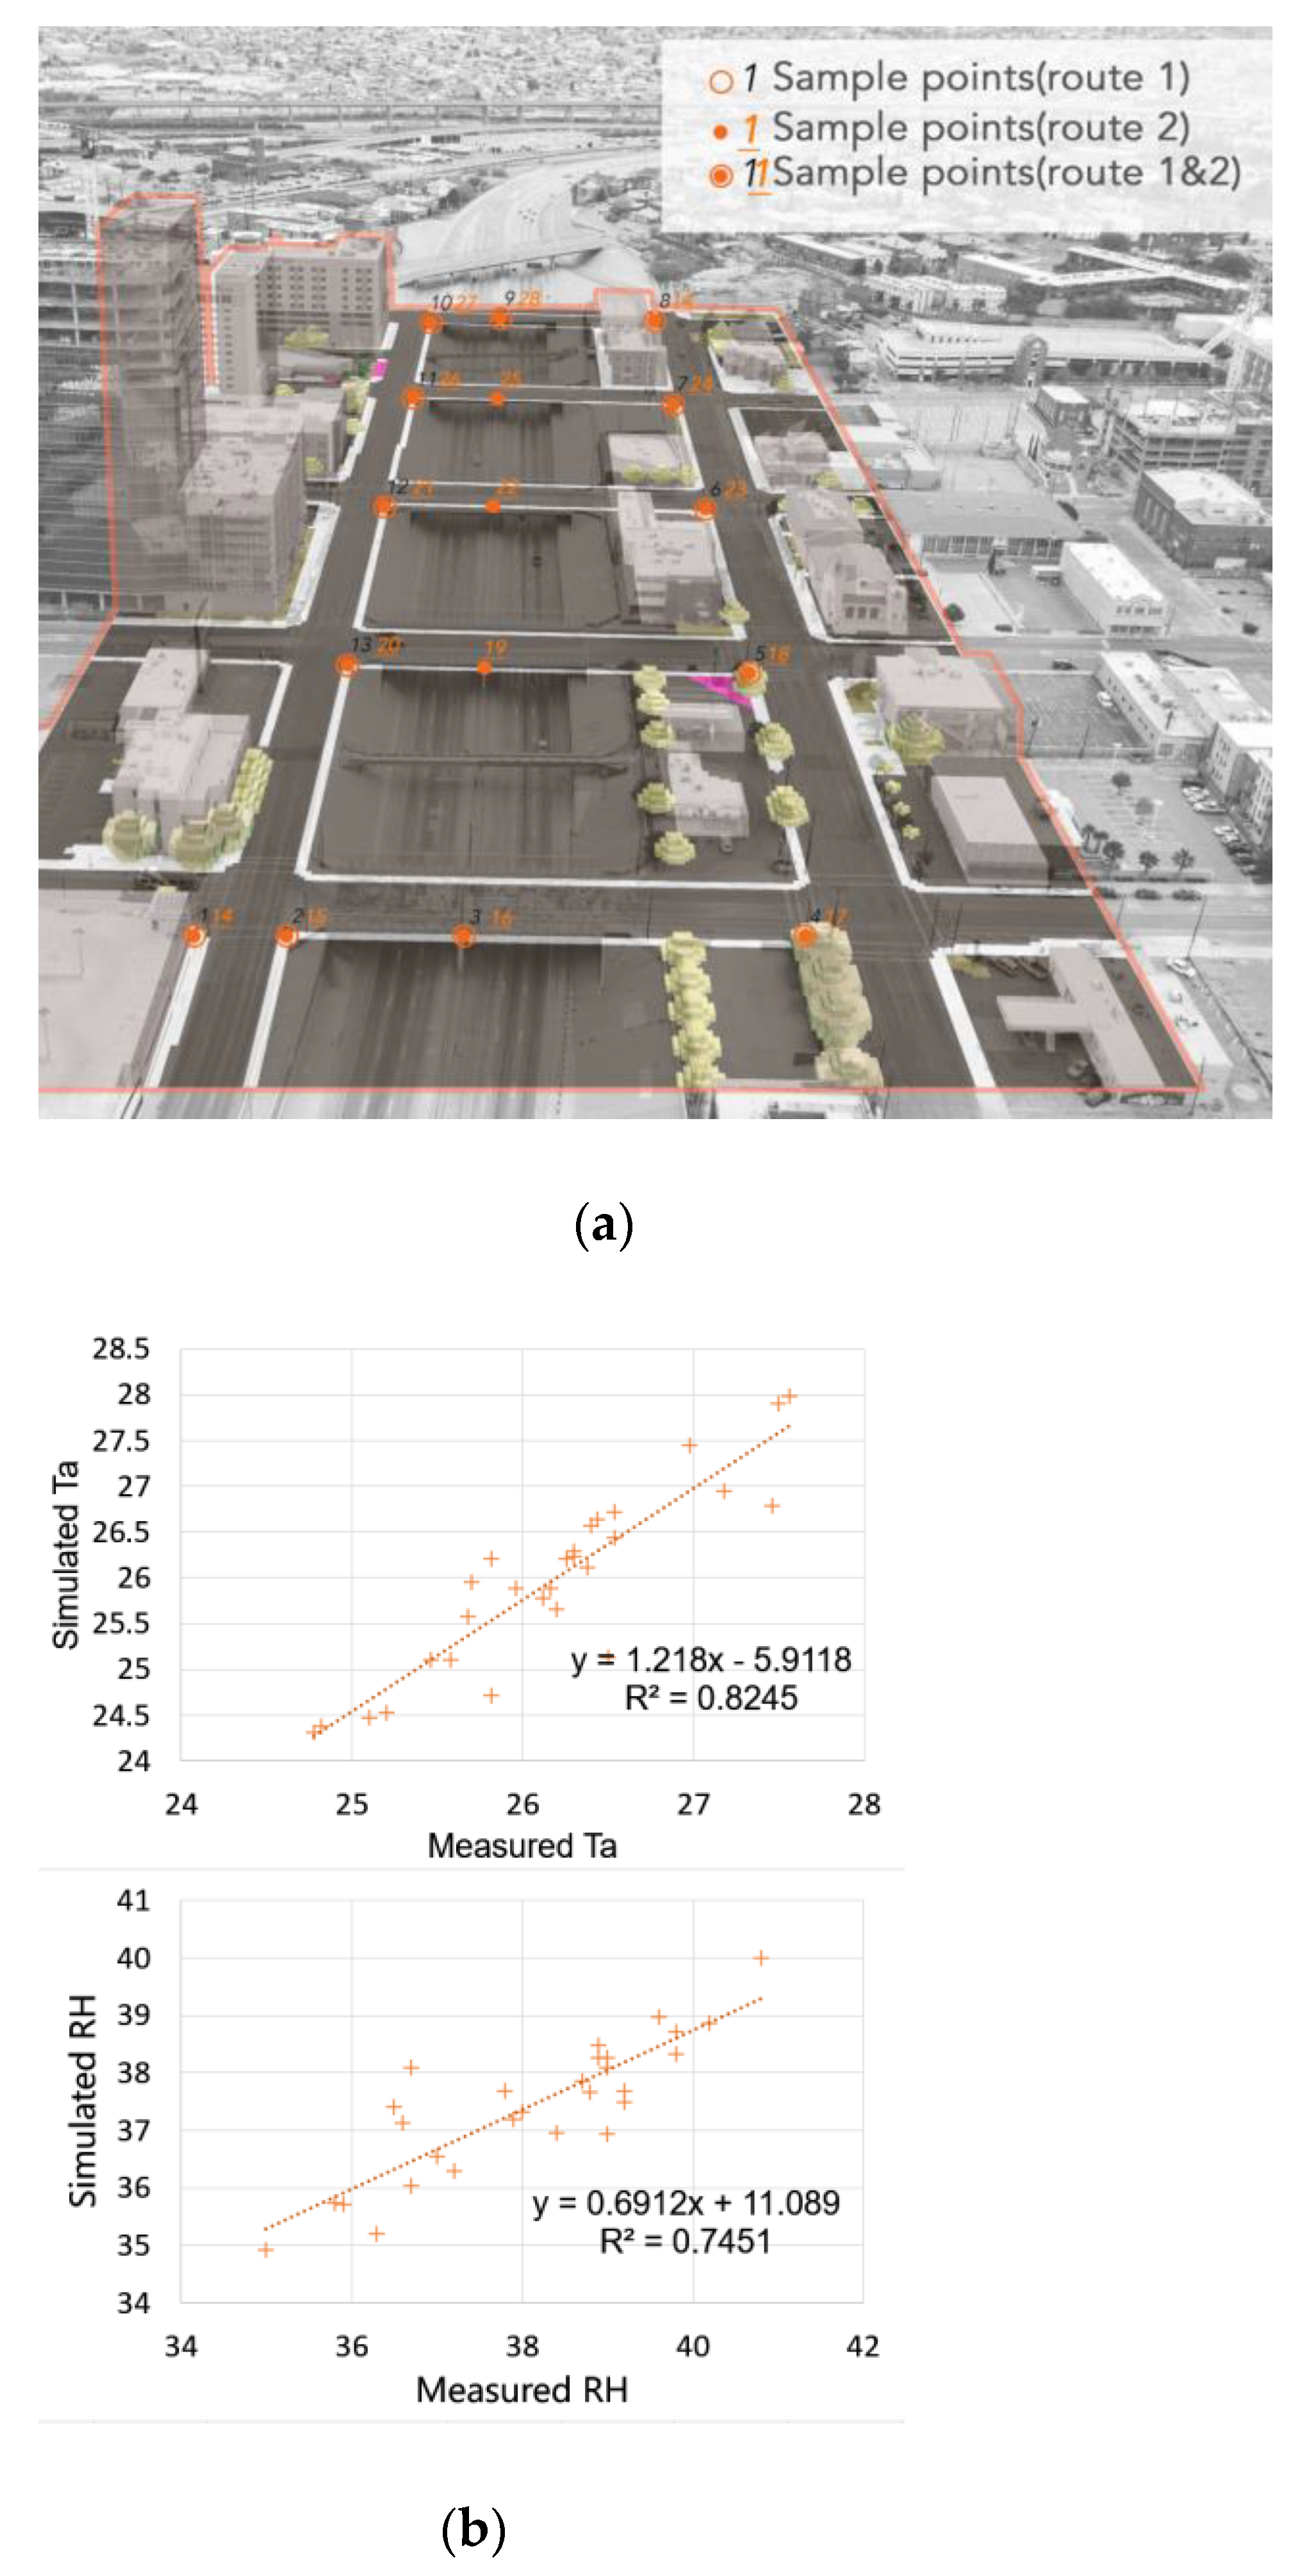
In-situ measurement was conducted to acquire real-world data. By comparing the measured data with the CFD model output, the accuracy of the CFD simulation was validated. The in situ measurement was conducted on 26 September 2021 (a typical summer day in El Paso) using the compact weather station MaxiMET GMX501 (Figure 4 and Figure 5).
3.3.2. CFD/ENVI-Met Model Validation
The in situ measurement and ENVI-met simulation results were taken, in order to evaluate the accuracy of the numerical simulation. The regression analysis was conducted to examine the error between the measured microclimate data and the simulated microclimate data [24]. The model parameters were adjusted repeatedly until the simulation results were within the acceptable range. Finally, the ENVI-met output and the in situ measured data reached a good fit (air temperature, R2 = 0.8245, RMSE = 0.49; for relative humidity, R2 = 0.7451, RMSE = 1.08), indicating that the numerical simulation conducted by ENVI-met is trustworthy and could provide a reliable assessment of the microclimate condition (Figure 6).
3.3.3. Extreme Hot Day Condition Predicted by Validated Computational Model
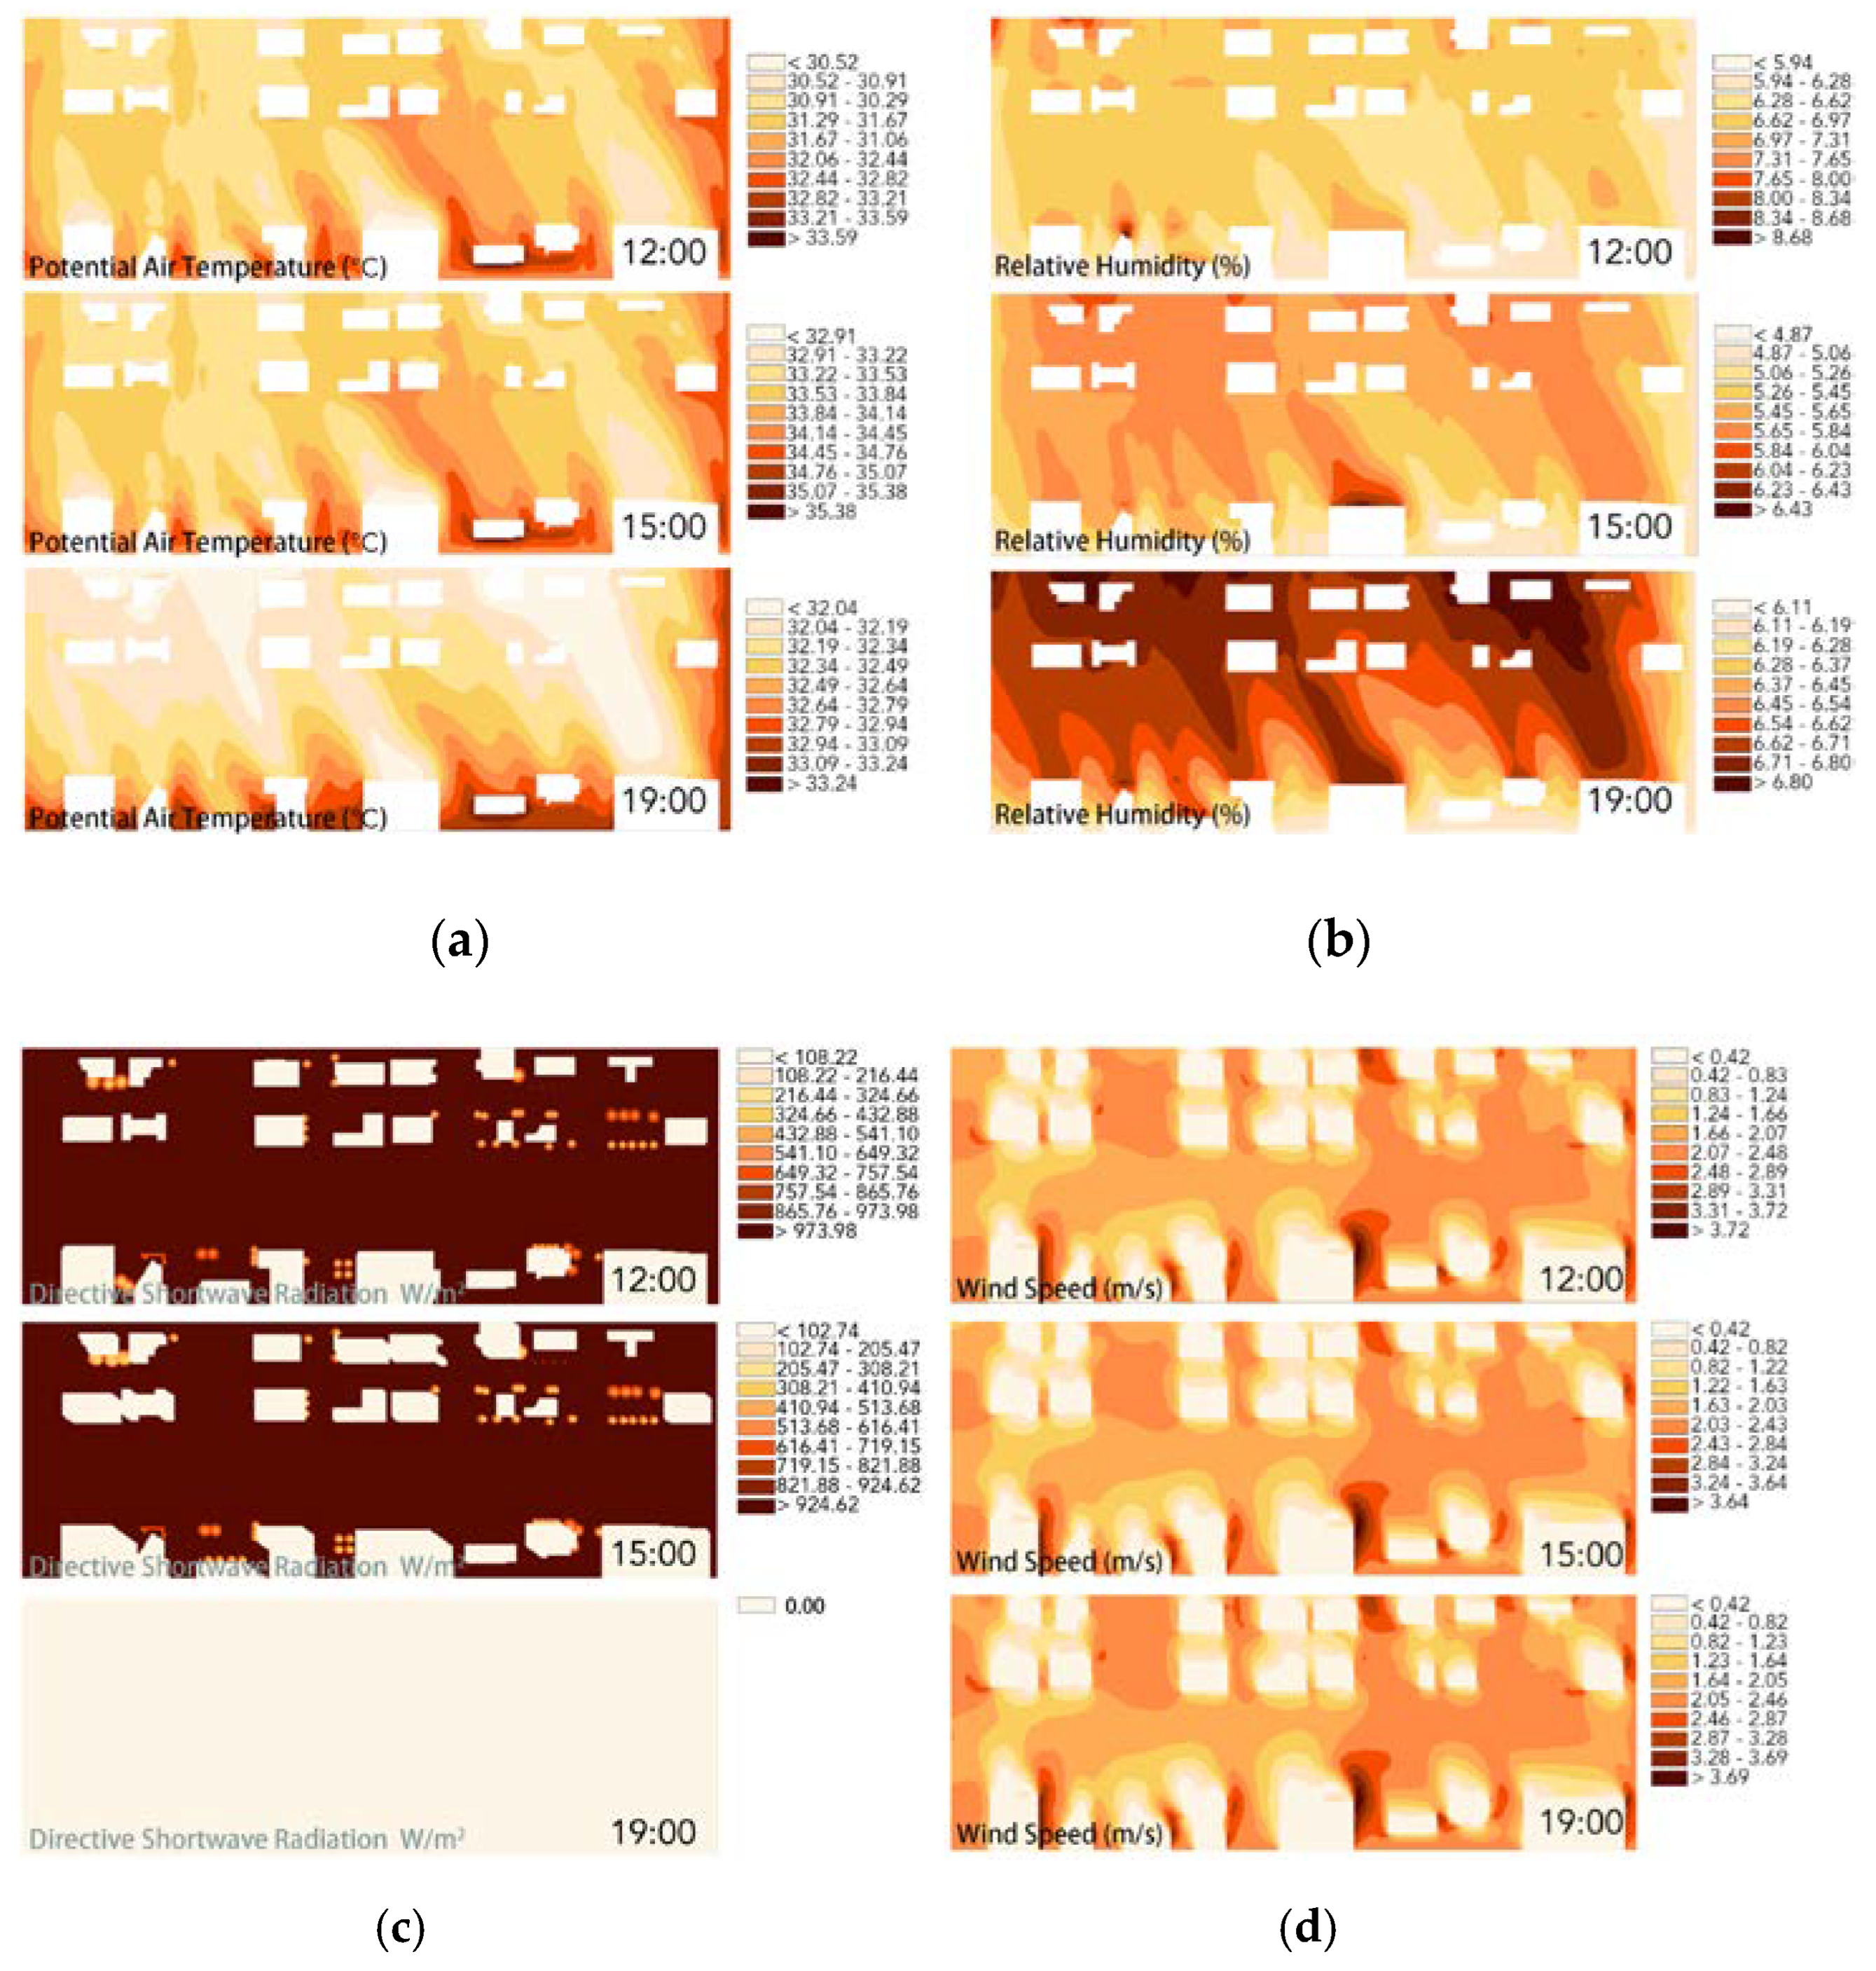
The validated model was used to predict the environmental parameters of extreme hot day conditions: To reconstruct the conditions on extreme hot and cold days, the simulation was conducted again via the validated ENVI-met (or CFD) models, which reconstruct the three-dimensional environment and calculate the environmental parameters mathematically. The output of 10 June 2020 was selected as the microclimate indicator of the typical extreme hot day (Figure 7). Three time points were selected for analysis, based on visitor frequency, as illustrated by the API of Google Maps. These include 12:00, when people begin to use outdoor park space; 15:00, at the hottest time point of the typical hot day; and 19:00, when a considerable amount of outdoor activity happens after sunset.
3.4. Application of the Evidence to the Problem at Hand
This step aims to develop a set of thermal comfort landscape strategies (or toolkits), based on the thermal comfort evaluation result from the above step. These validated models were then used to identify the streams of energy that most affected the human energy budgets, and the site was designed (according to those energy budgets) to accommodate various activities. This is where the design optimization was achieved through repeated iterations and testing. The designer needs to continue editing the toolkits to make them flexible to accommodate the various functions of the outdoor space. The outdoor space will also need to be continuously adjusted to embrace the thermal comfort toolkits.
3.4.1. Energy Budget Calculation Based on Extreme Hot Day Microclimatic Condition
Microclimate indicators, including air temperature, wind speed, relative humidity, and direct solar radiation, were extracted from the validated simulation model and used as the input of the COMFA energy budget model. The COMFA energy budget model not only reports a net overall energy flux matched with thermal sensation (Table 1), but also reports five sub-components of the net energy budget, which enables us to determine which energy flux mostly impacts the site [25].
3.4.2. Design Solutions Based on COMFA Energy Budget
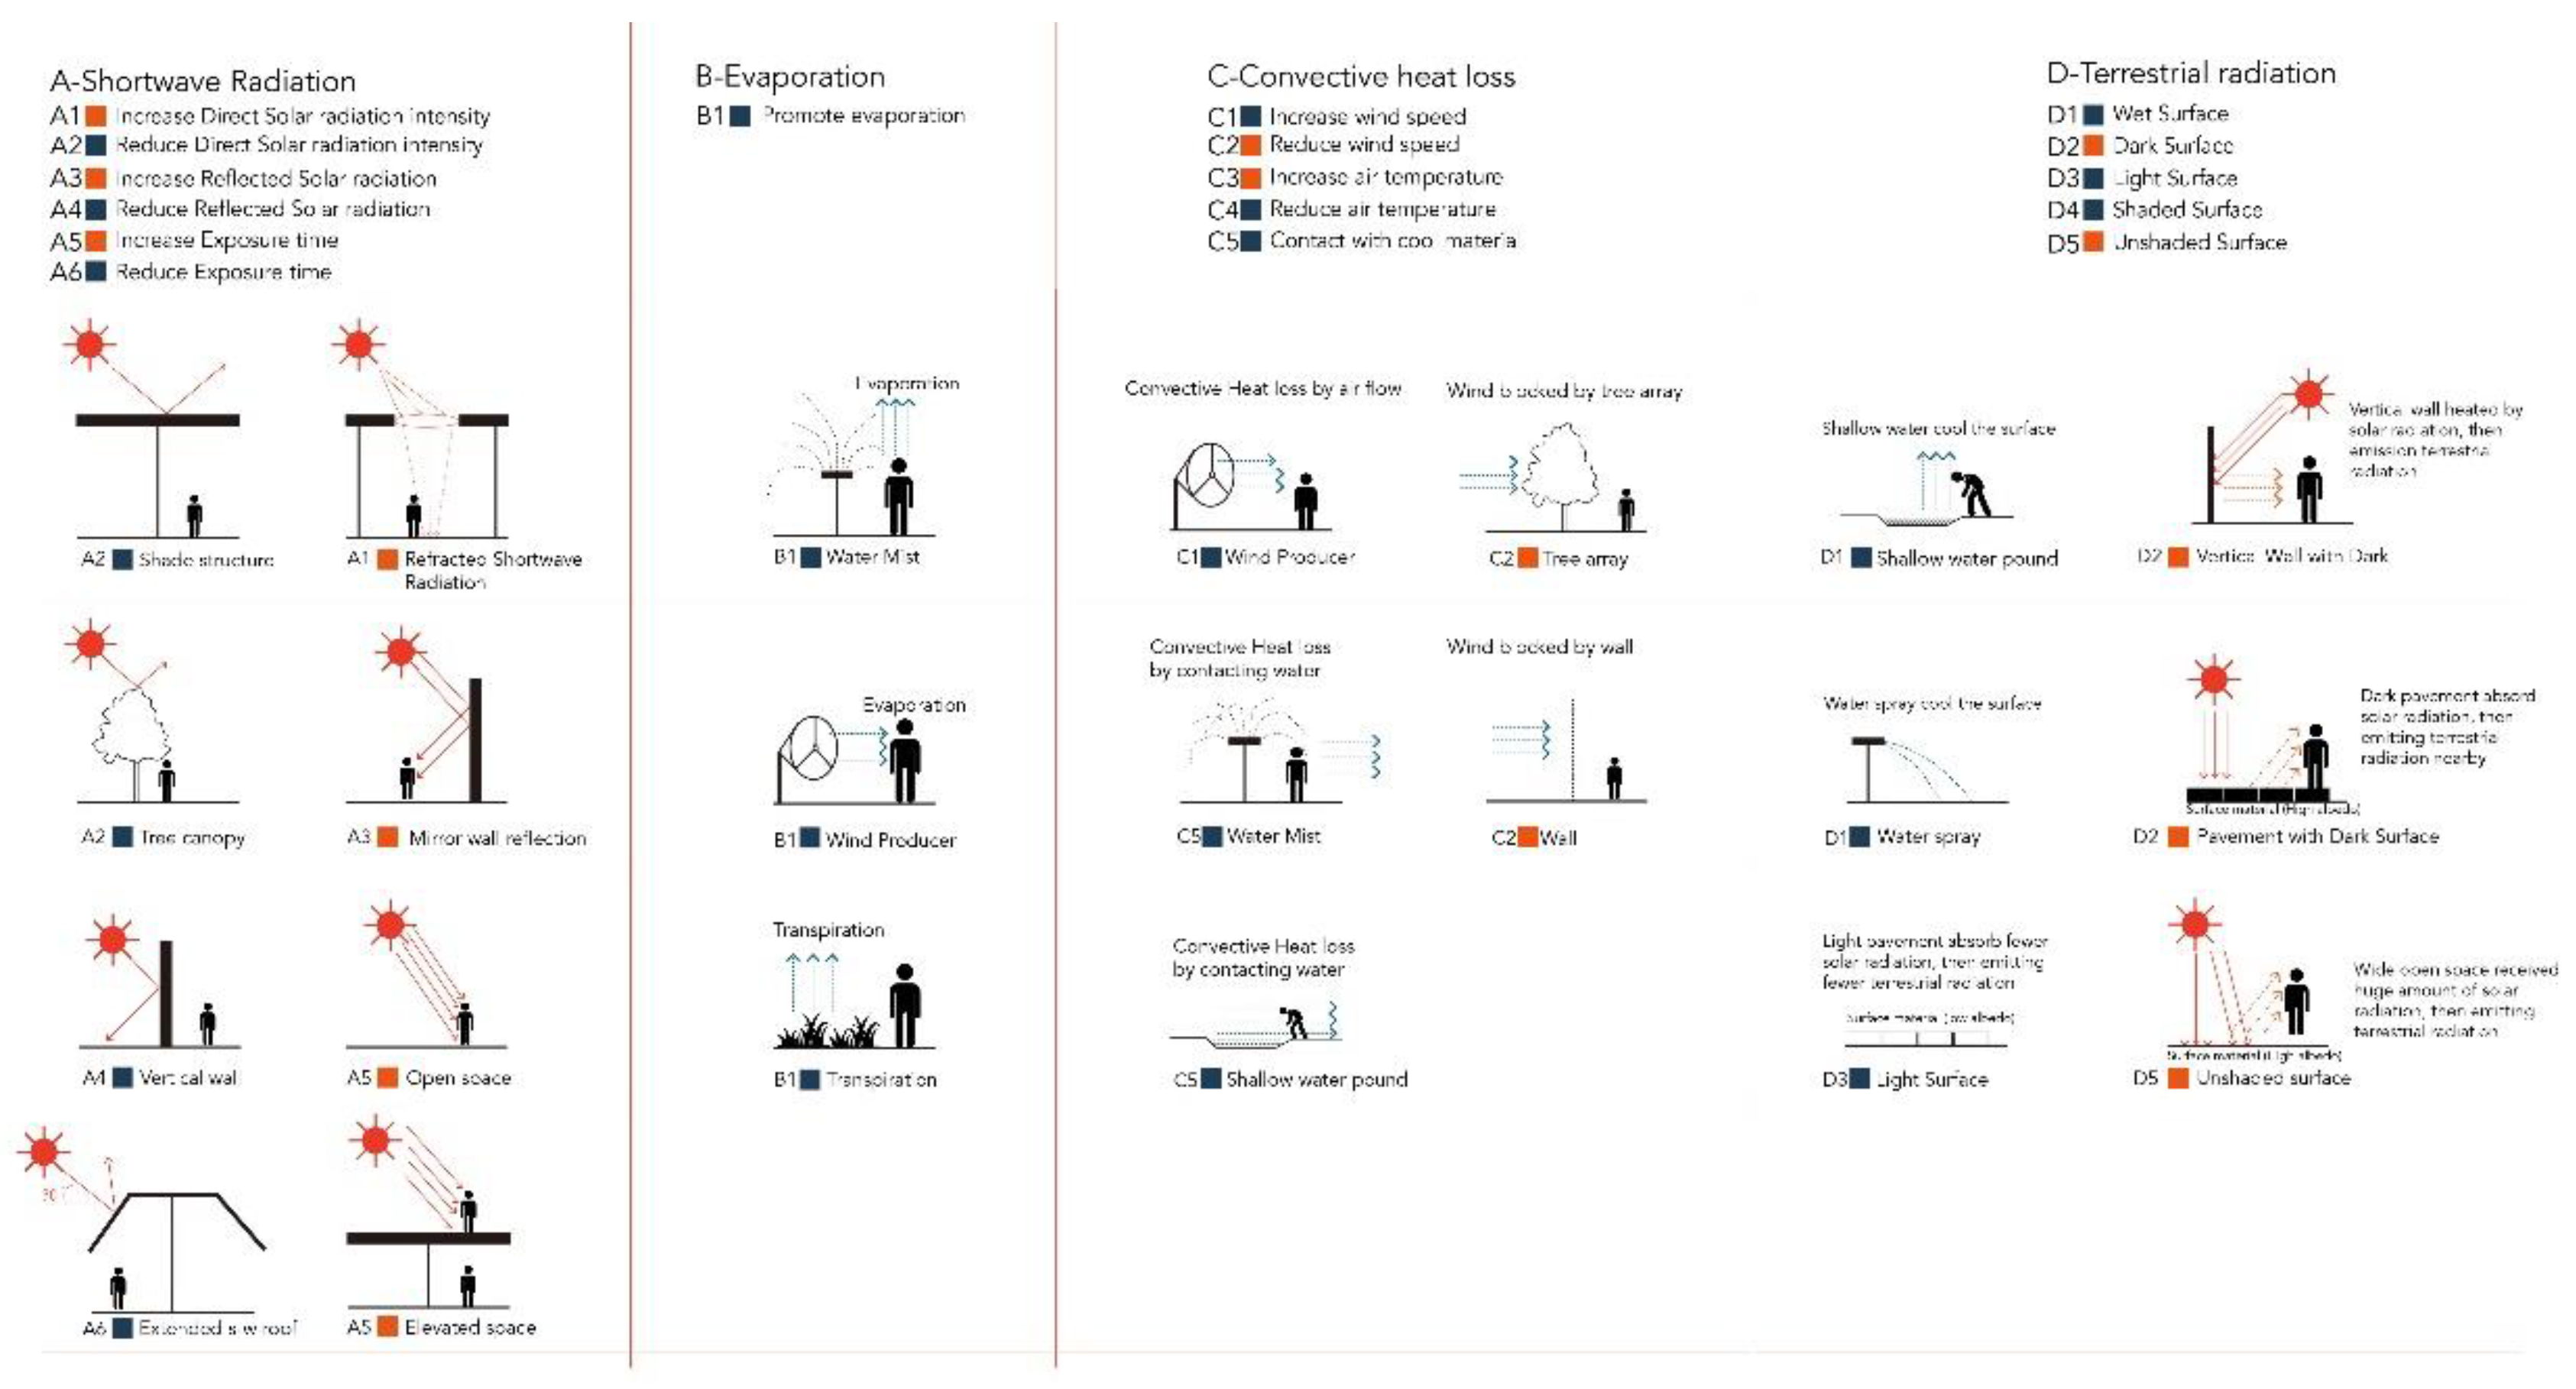
The COMFA energy budget identified that the major contributors to the extreme heat were radiation and wind. Therefore, a series of design strategies (Figure 8) were developed to illustrate how those key environmental parameters impact five energy fluxes of the COMFA budget (Equation (1)):
where M is the metabolic energy for heating the body (W/m2), Rabs is the absorbed solar and terrestrial radiation (W/m2), Conv is the sensible convective heat exchange (W/m2), Evap is the evaporative heat loss (W/m2), and Tremitted is the emitted terrestrial radiation (W/m2).
COMFA = M + Rabs – Conv – Evap − Tremitted
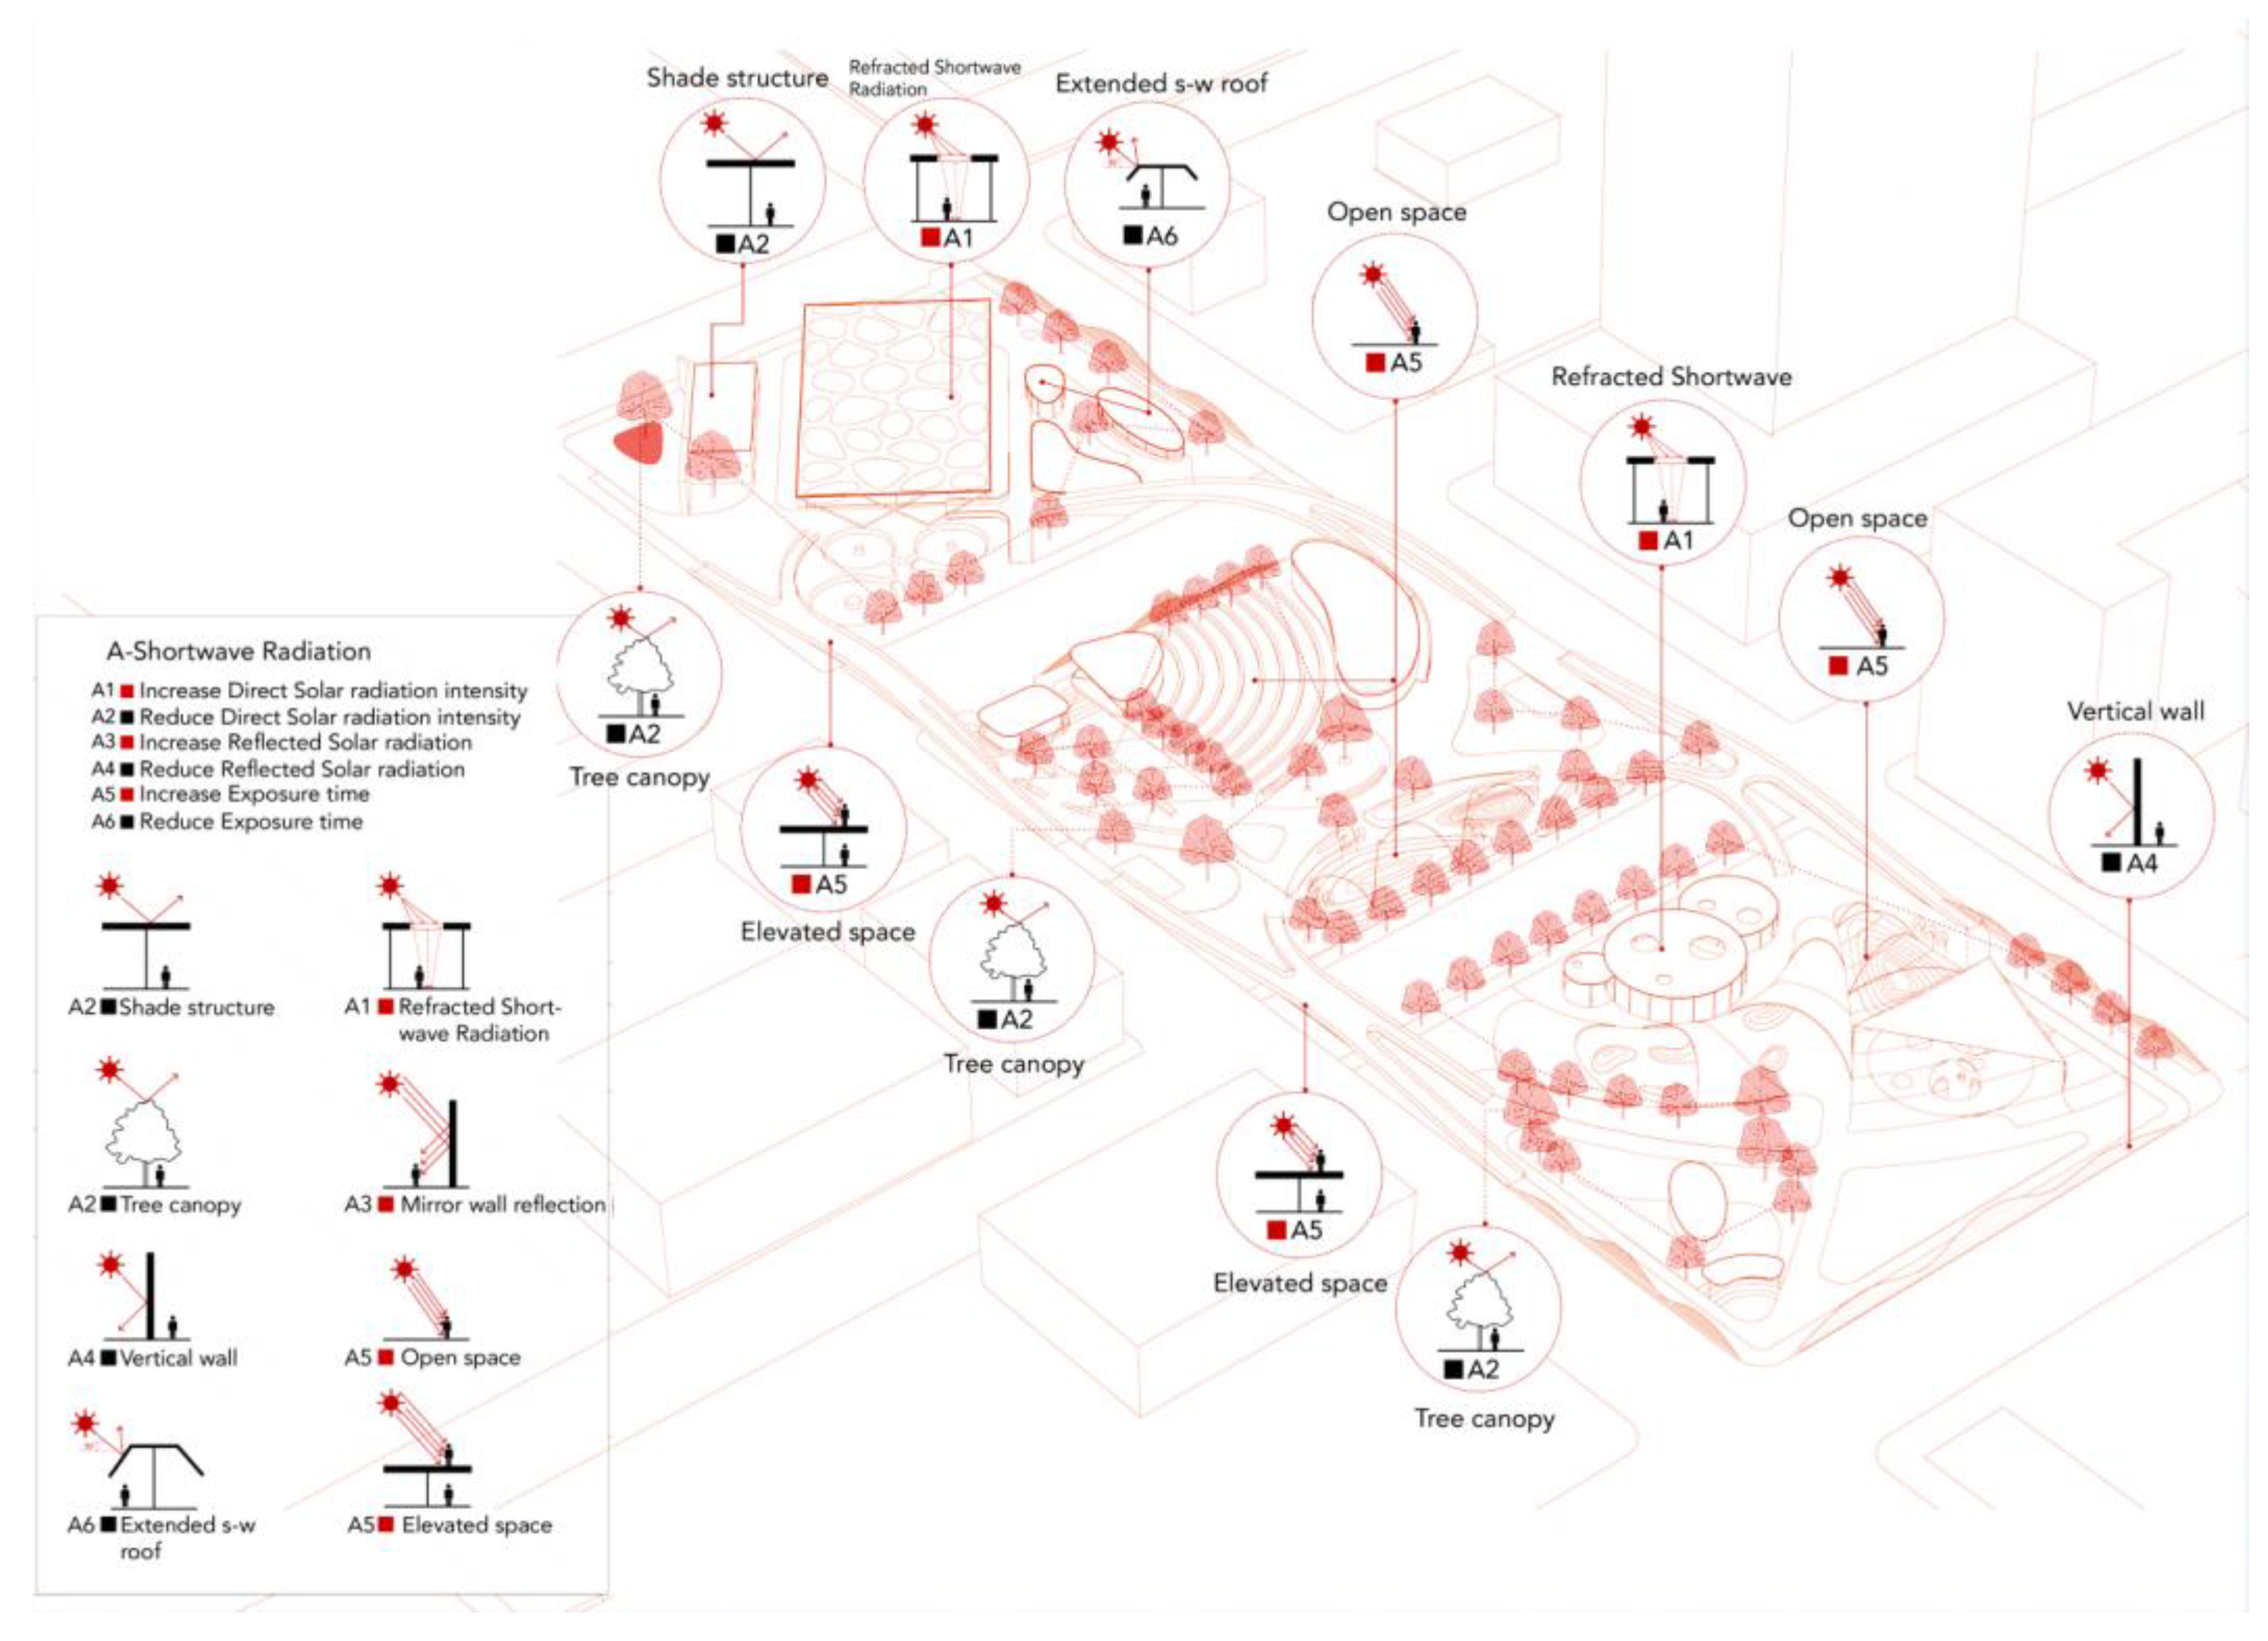
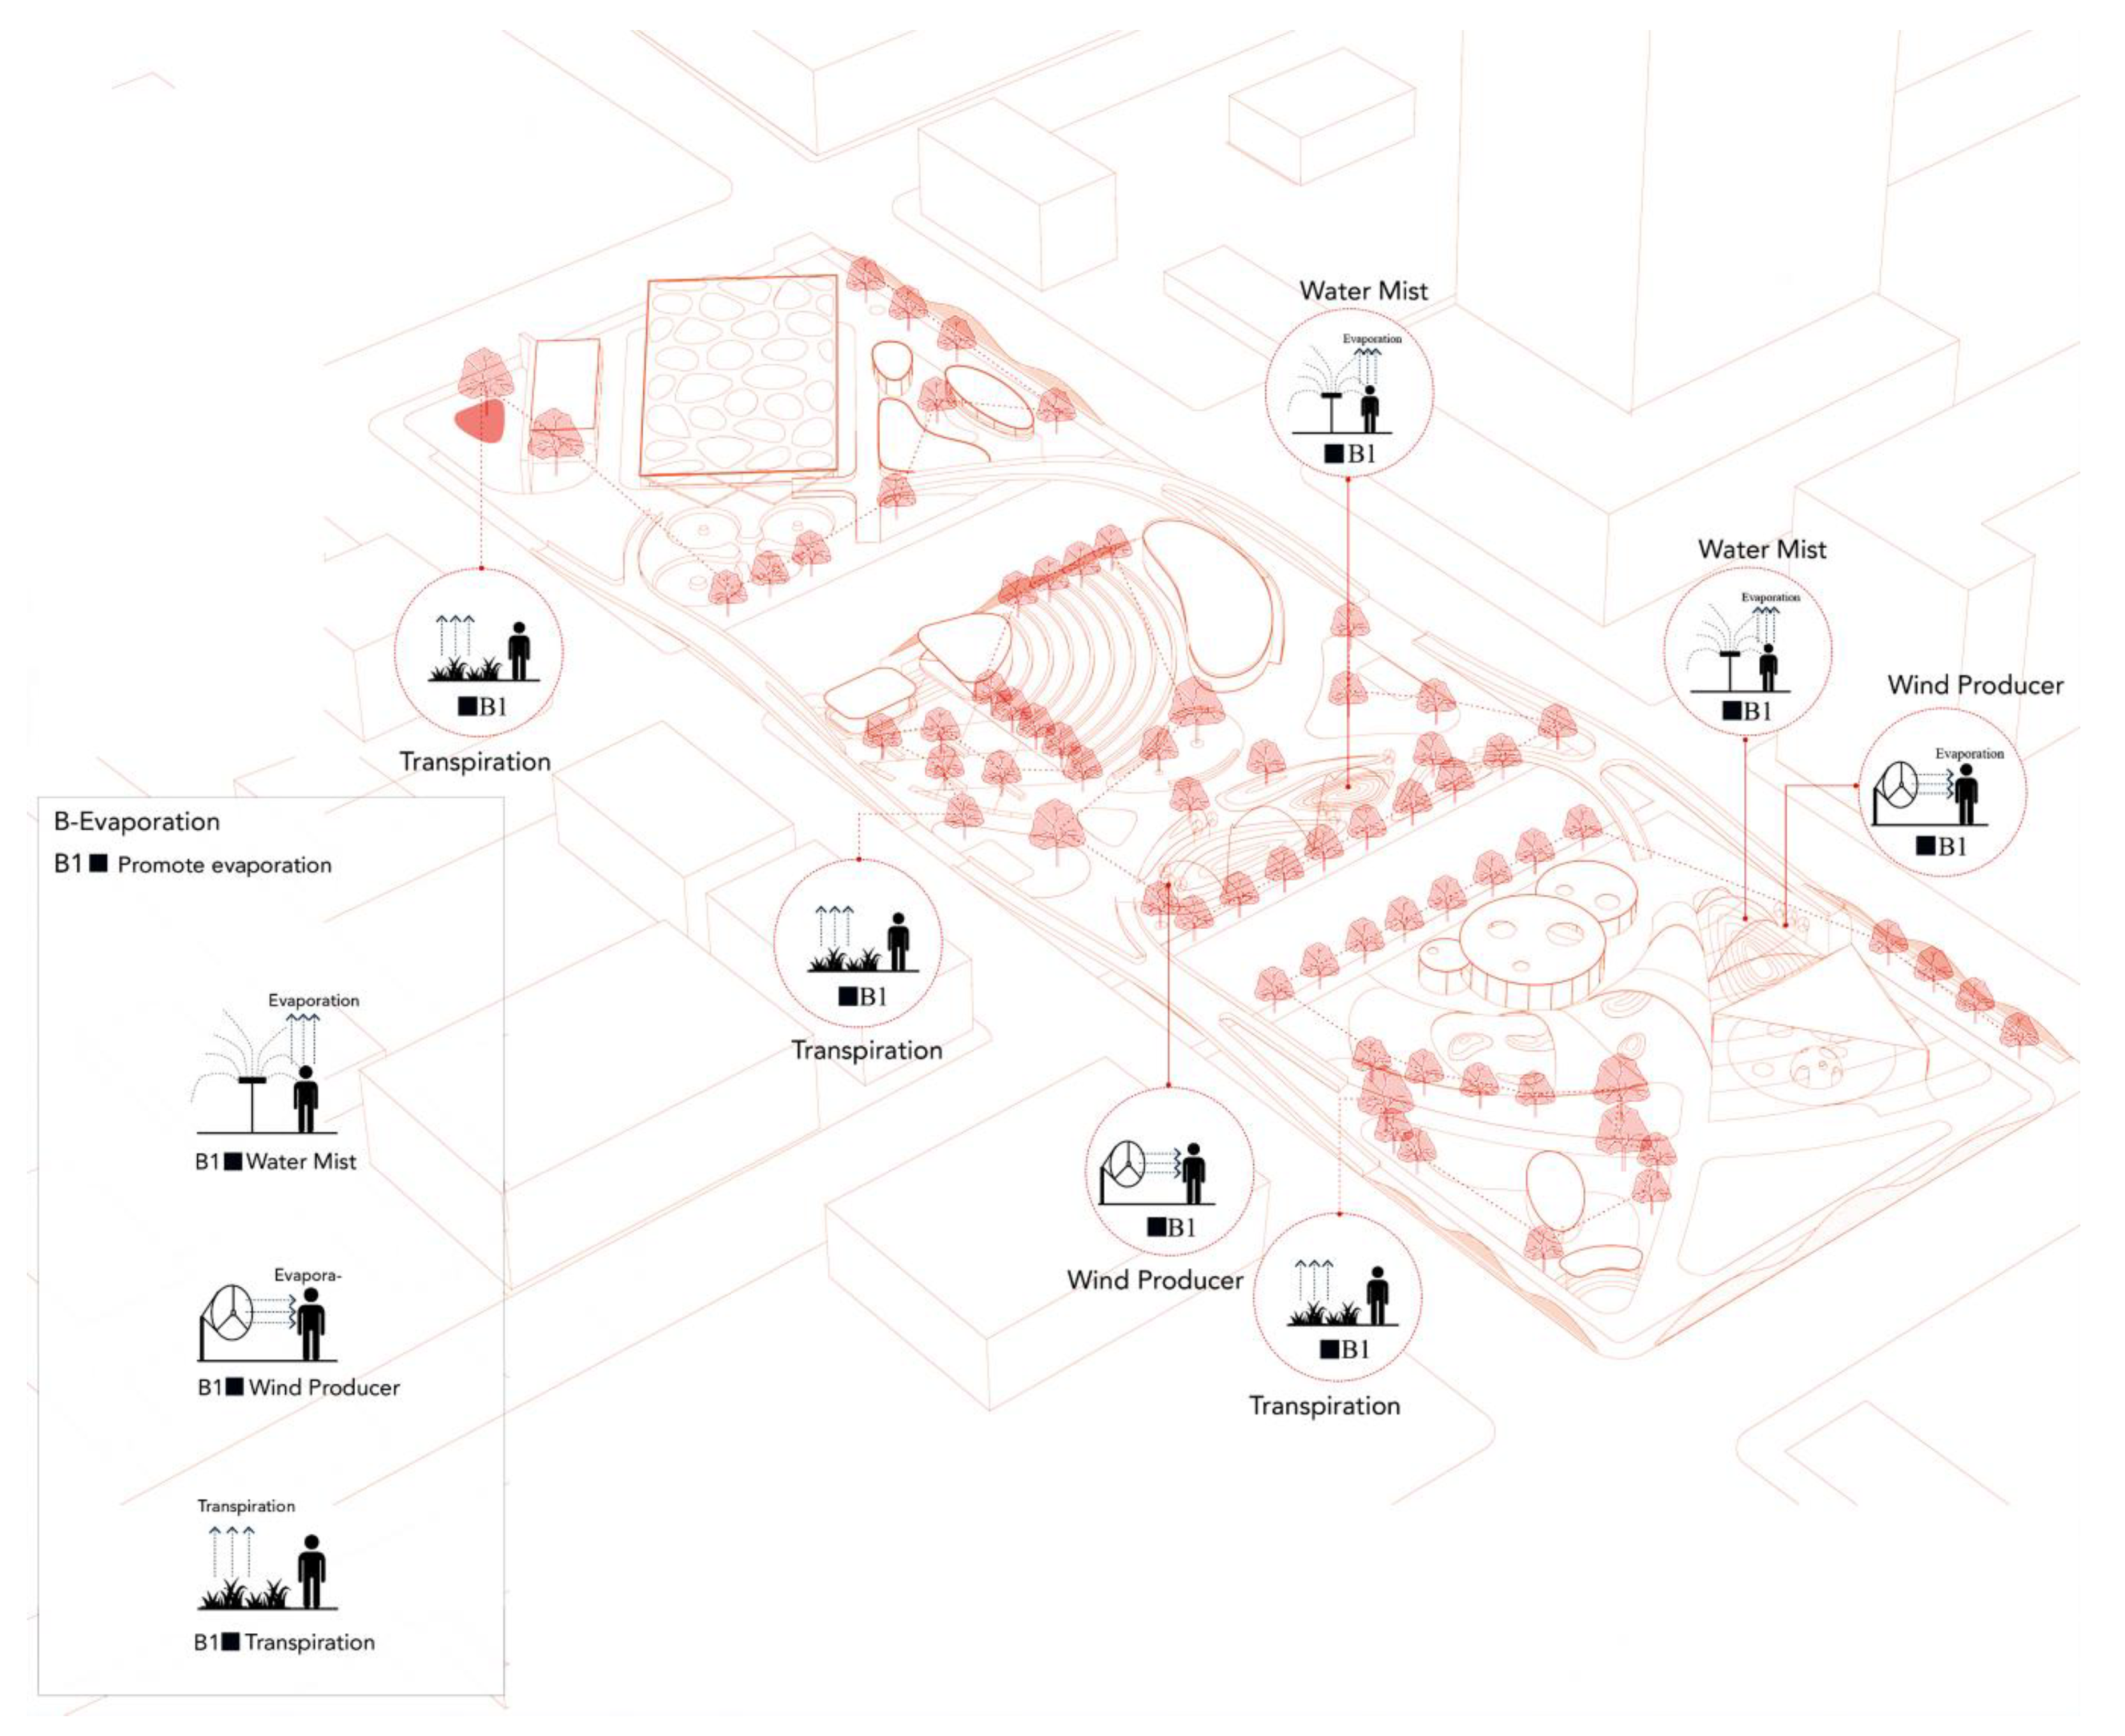
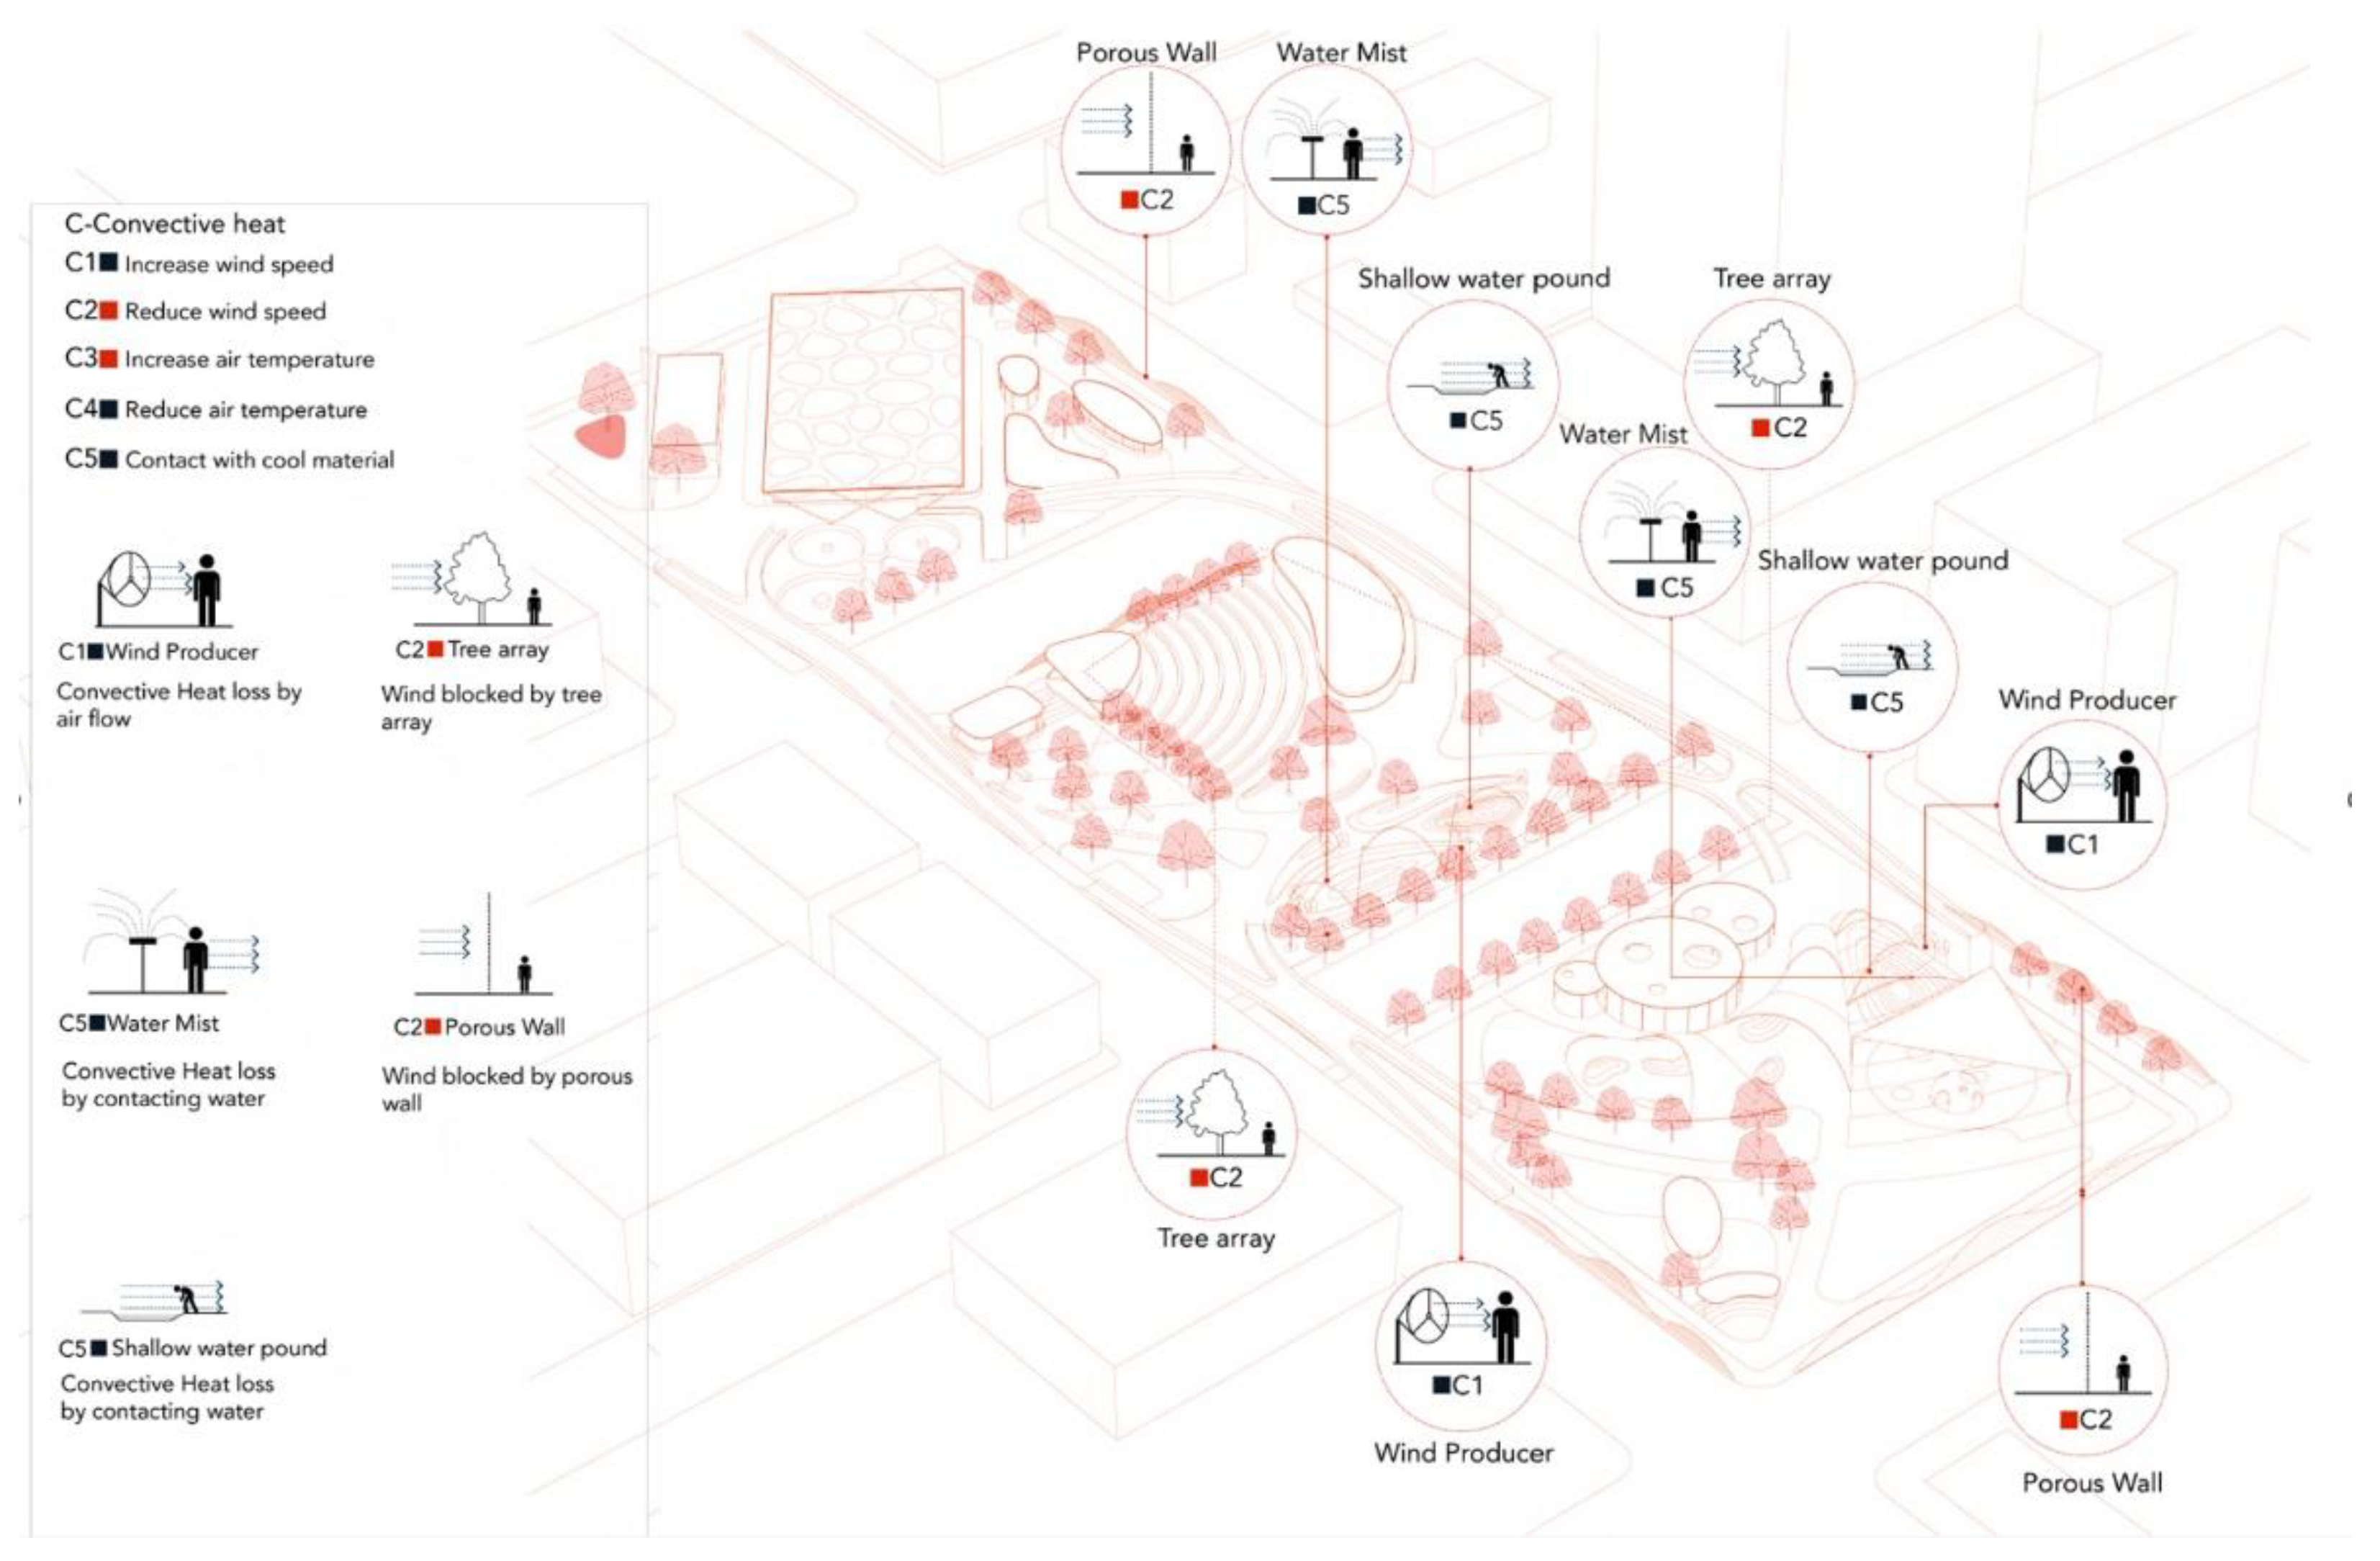
A site assessment revealed that solar radiation, air temperature, and wind speed are the most critical risk factors that impact the COMFA budget. While air temperature plays an important role in thermal comfort, it tends to be stable and evenly distributed, which is insensitive to micro-scale landscape design intervention (except water mist); conversely, microscale design can effectively impact solar radiation and wind speed. Therefore, a series of landscape elements that focus on the dynamic adjustments of wind and solar radiation were integrated into the design solutions according to their impact on the energy budget, and the current low humidity was used as a catalyzer for evaporation. These toolkits were categorized into four groups, based on the energy fluxes they impact (Equation (1)), namely, shortwave radiation, evaporation, convective heat transfer, and terrestrial radiation. In each category, the toolkit recommends the design approach to reduce or increase the energy absorbed by the human body. Guided by those toolkits, the I-10 freeway deck park design’s features include a deciduous tree canopy, a wind producer (user-interactive installation), a water element, a multiple surface material, a sun-path-based shade structure (extended roof along south-west), and a windbreak, comprised of a porous wall and arrayed plants. Under extreme heat conditions, the sun-path-based shade structure efficiently blocks the intense solar radiation in the afternoon. Meanwhile, wind producers allow the cool wind breeze to promote evaporation and convective heat transfer. The selected surface material includes shallow ponds, turfgrass, and low albedo pavers, which combine the high specific heat capacity and plant transpiration, to create a cool surface that reduces the terrestrial radiation. During winter seasons, the elevated bridge allows users to receive more solar radiation. The porous planting wall located on the edge of the site blocks the urban canyon wind, and the multi-direction vertical wall further disturbs the wind field, in order to reduce the convective heat loss after sunset.
3.4.3. Deployment of Design Strategy
These design strategies were deployed in the site according to their specific entertainment function, and worked as landscape intervention to adjust the microclimate (Figure A1, Figure A2, Figure A3 and Figure A4). Sometimes, entertainment use might conflict with the thermal comfort strategy. For example, functional areas, such as the square and the amphitheater, are often designed as wide-open areas, which are vulnerable to solar radiation. To address these conflicts, EBLAF (Figure 1) indicates the design strategy development and the deployment of strategy work as an iteration circle that happens repeatedly. The thermal comfort strategy will be edited according to the specific site function, whereas site function will also be adjusted according to the thermal comfort strategy. As a result, the design strategy and its composed functional area are modified several times to fit each other.
3.5. Openly Reported/Replicable
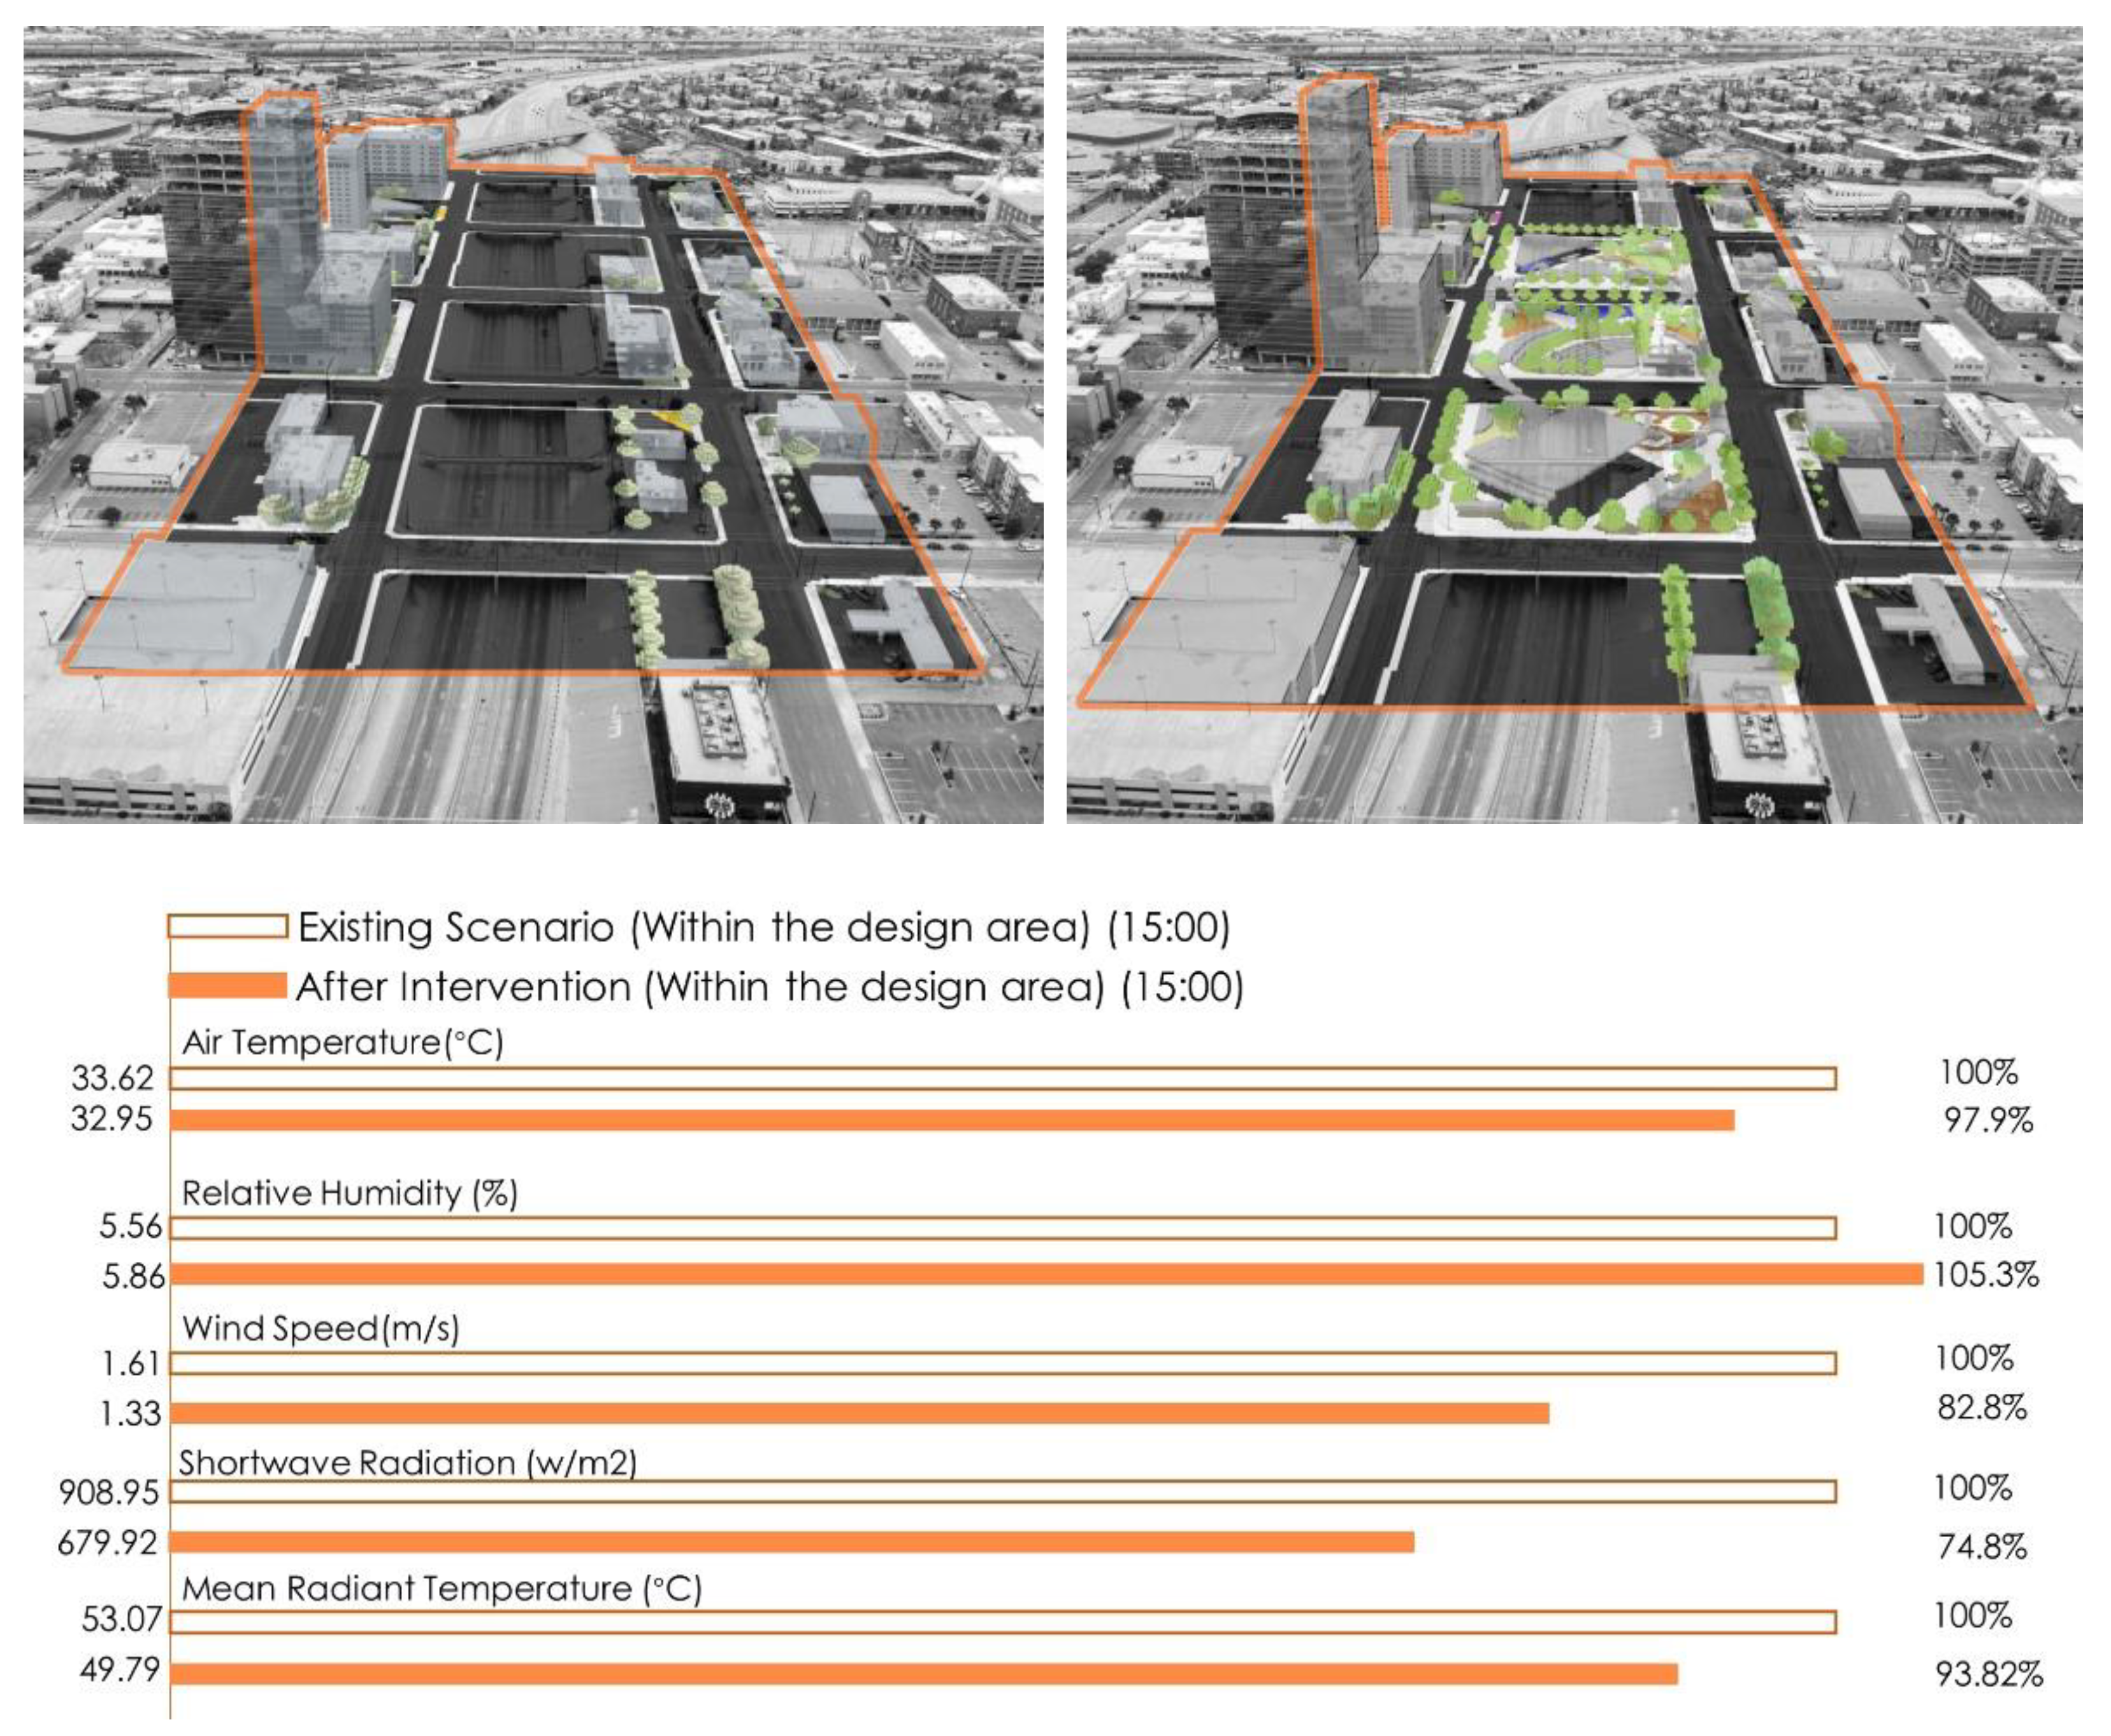
The resulting designs were tested to determine the ameliorative effect provided by the landscape on the local climate. After the landscape design intervention, the ENVI-met simulation was conducted again to report the change in the microclimate parameter. Here, an experimental study was developed, where the existing scenario and the scenario after the design intervention are both simulated through the Computational Fluid Dynamics (CFD) model, which is considered as the control group and experimental group, respectively. The intervention result works as empirical evidence, contributing to the quantitative understanding of how efficiently that landscape design impacts the built environment (Figure 9).
3.5.1. Intervention Result: Limited Effect in Air Temperature and Relative Humidity
Result shows the limited impact on Ta and relative humidity: After the intervention, the air temperature across the site was reduced by 0.67 °C, and the relative humidity increased by 0.30% (Figure 9).
3.5.2. Intervention Result: Effective Impact on Wind Speed and Solar Radiation
The result indicates that the solar radiation and wind are the more sensitive elements: The solar radiation and wind are more sensitive to landscape elements, which showed significant changes post microclimate landscape design. After the intervention, the average wind speed was reduced by 17.2% (22.8–30.2% in the focused area), and the average solar radiation was reduced by 25.2% (Figure 9).
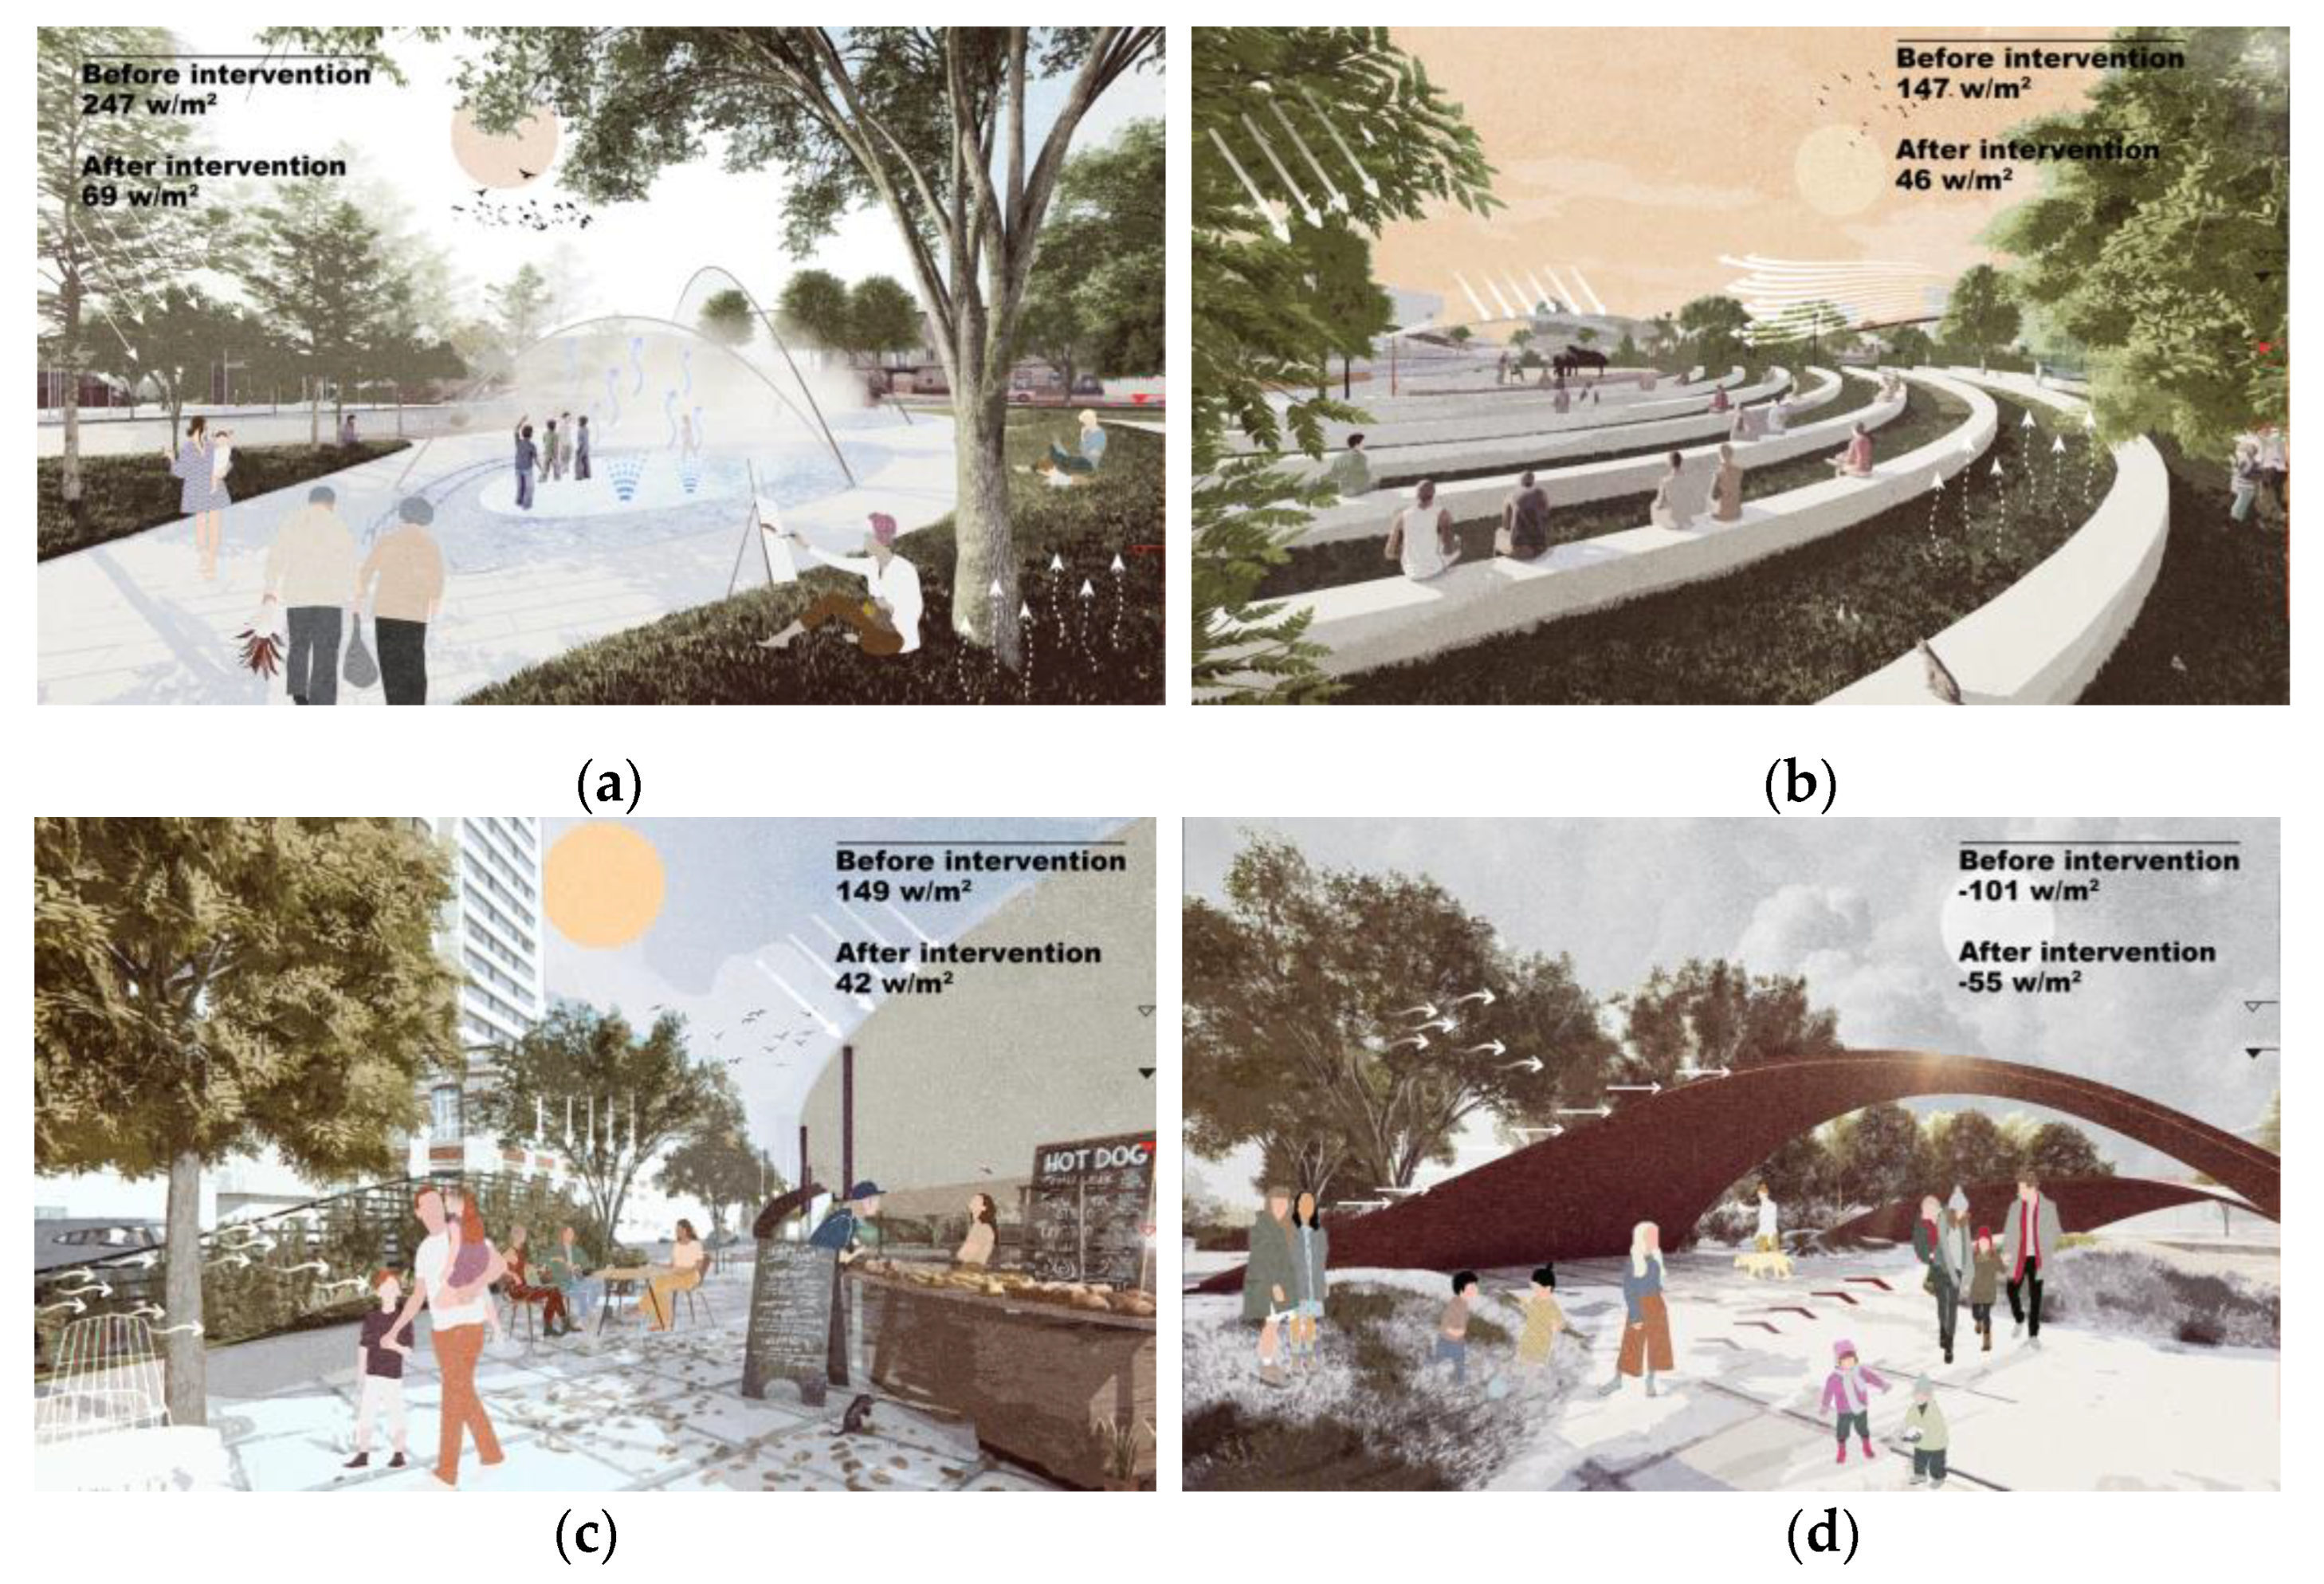
3.5.3. Intervention Result: Effective Impact on Human-Level Thermal Comfort
The result indicates that the landscape intervention is effective in ameliorating heat stress and cold stress at the human level (1.5m).
In the water plaza (Figure 10a), COMFA values were reduced from 247 to 69 W/m2. Water mist contributed to a 79 W/m2 energy budget reduction by facilitating convective and evaporative heat loss, and the tree canopy contributed to a 99 W/m2 energy budget reduction by blocking solar radiation.
In the amphitheater (Figure 10b), COMFA values were reduced from 147 to 46 W/m2 during summer, where the tree canopy blocks the solar radiation, and cool grass surface helps to reduce terrestrial radiation. During the winter, the tree row and planting wall block the wind, which helps to increase the energy budget by 22 W/m2.
In the pedestrian street (Figure 10c), during summer, COMFA values were reduced from 149 to 42 W/m2, where the south-east rooftop and tree shade contribute to a 107 W/m2 energy budget reduction by blocking solar radiation and cooling the ground surface.
In the "green patch with the vertical wall" (Figure 10d), the vertical structure disturbs the canyon wind field, and aligns with the tree row to reduce the wind speed. As a result, COMFA increased from −101 to −55 W/m2 during winter, indicating that the thermal comfort level rose from "cold" to "near neutral".
4. Discussion
In this study, we aimed to propose a revised evidence-based landscape architecture design framework by building on the previous literature and applying it to a case study in El Paso, Texas. A six-step EBLA methodology was summarized and combined with the EBLA diagram proposed by Brown and Corry (Figure 1), in order to generate a revised EBLA framework. The analysis identified that solar radiation and wind are the most sensitive microclimate elements that respond to design strategy. The air temperature and relative humidity were determined to be the least sensitive. Based on the microclimate condition, we developed a series of toolkits to adjust the site's ambient environment. The ENVI-met simulation was deployed again after the design intervention, working as the tool to quantitatively evaluate the landscape performance. In summary, the application of EBLAF in the El Paso deck park design demonstrates the detailed steps of the methodology. The design strategy is not restricted to the aesthetic value, but focuses on the relationship between human biometeorology outcomes and the built environment, and produces quantitative data to objectively measure the landscape performance. In the paragraphs that follow, we will discuss the findings and implications, the limitations, and the questions for the future.
4.1. Findings and Implications
This study revised the previous EBLA methodology and considered the design optimization process as the inherent process in the EBLAF [15]. In design practice, the collection of detailed information is often a step-by-step process, and when a design strategy is applied, it must respond to the newly collected information, and vice versa. In other words, with increasingly detailed information being collected, the design strategy is optimized, and the optimized design strategy unavoidably raises more questions, which require the need to collect more information to answer. We propose this iterative optimization process as the necessary step in the EBLAF.
The EBLAF considers the quantitative evaluation of landscape performance as a necessary step, which is consistent with the suggestion by Brown and Corry [5]. The outcome of the design intervention should be objectively measured, described, and archived in the knowledge pool [16]. It works as a piece of existing knowledge, ready to be critically applied to the future landscape design project.
For the site in El Paso, our study demonstrated that solar radiation and wind speed are more sensitive to landscape design intervention, compared to air temperature and relative humidity. This finding is consistent with previous studies [11,20]. Although water mist and fountains could effectively reduce the air temperature and increase the relative humidity, they only function effectively in a small area. We suggest that the designers and policymakers focus on adjusting the solar radiation and wind speed to control the overall ambient environment. Water features should target key areas, such as the functional area designed for vulnerable groups.
Extreme heat threats exist in El Paso during the daytime. With more than 300 annual sunshine days, the lack of tree canopy and shade structures are bound to cause heat threat. This heat threat is particularly severe in those areas paved with asphalt and concrete. Considering that the local impervious ratio is increasing, policymakers and designers should be aware of the potential heat risk that could be amplified by impervious pavers, and consider alternative ways to reduce the heat risk, such as increasing the shade structure or reducing the impervious pavers.
Those regions under extreme heat threat could also have cold stress issues. This can be especially true in desert areas, where the air temperature drops drastically after sunset, and the urban canyon effect can increase the wind speed. This combination can increase the convective heat loss, and intensify the cold stress. Landscape architects and urban planners should be aware of the potential cold risk and design the urban environment accordingly.
The study demonstrated the effectiveness of EBLAF, which succeeded in adjusting the ambient environment in the desert climate region. After the intervention of the design toolkits, the heat threat during the daytime was reduced from extremely hot to neutral or nearly neutral. In addition, the cold threat during the night time was reduced from “cold” to “near neutral”.
4.2. Limitations
The only way that the effect of a design can be truly tested is to construct the new landscape and then measure the effects on the microclimate. This was not feasible in this study, so the only on-site measurements were taken before design and the result was tested through validated models.
4.3. Future Research
The framework should be applied to other problems in the landscape, and when possible, should be tested through measurements taken before and after development. As the study only includes the desert climate zone, future studies could apply the method into various climate zones to test the reliability, and furthermore compose a set of landscape solutions dealing with various problems in specific regions. Although CFD simulation has the potential to test the landscape performance, the lack of plants and material parameter databases (especially in the U.S. and some European countries) could prevent practitioners from using the simulation tool. Future studies could aim to conduct surveys in terms of representative plants and material, to enrich the database of the basic material parameters.
5. Summary
The EBLA Framework considers a solid analysis of landscape performance as the core content. The framework is also applicable when facing different types of problems in the landscape. For example, a modified framework could be used in green infrastructure planning to control the pollution based on the L-THIA model [29], and landscape planning to reduce coastal hazard [30].
Through the computer model simulation and energy budget calculation, the EBLA methodology enables the designer to have a preview of the design result. The design process provides a wide range of solutions and scenarios, accompanied by solid performance prediction. In the design practice, it could test multiple choices and predict the result at a very low cost.
CFD simulation could be able to report very detailed microclimate data at both spatial and temporal levels. Unlike the traditional monitor, which often costs a lot of time and money to document the physical condition of the site, the CFD simulation is not limited by time and location.
The hot area can also be at the risk of cold: With the mixed desert climate, the air temperature is very low after sunset, which could be amplified by the strong canyon wind and thus cause the huge convective heat loss.
The EBLA framework is universal and can be applied to any problem in any landscape. It will help to make landscape architecture a more scholarly profession and will lead to improved environments.
Author Contributions
Conceptualization, R.D.B., X.L., D.L. and J.P.; methodology, R.D.B. and X.L.; software, X.L.; validation, X.L.; formal analysis, X.L.; investigation, X.L. and J.P.; data curation, X.L.; writing—original draft preparation, R.D.B., X.L. and J.P.; writing—review and editing, X.L., R.D.B. and D.L.; visualization, X.L.; supervision, R.D.B. and D.L.; project administration, R.D.B. and D.L. All authors have read and agreed to the published version of the manuscript.
Funding
This research received no external funding.
Institutional Review Board Statement
Not applicable.
Informed Consent Statement
Not applicable.
Data Availability Statement
The data that support the findings of this study are available from the corresponding author upon reasonable request.
Acknowledgments
We would like to express our appreciation to Kirk Hamilton, who provided advice on evidence-based design.
Conflicts of Interest
The authors declare no conflict of interest.
Nomenclature
| UHI | Urban Heat Island |
| GCC | Global Climate Change |
| EBP | Evidence-Based Practice |
| EBD | Evidence-Based Design |
| EBLA | Evidence-Based Landscape Architecture |
| EBLAF | Evidence-Based Landscape Architecture Framework |
| CFD | Computational Fluid Dynamics |
| RMSE | Root Mean Square Error |
| COMFA | COMfort FormulA (COMFA) energy budget model |
| M | Metabolic energy for heating the body (W/m2) |
| Rabs | Absorbed solar and terrestrial radiation (W/m2) |
| Conv | Sensible convective heat exchange (W/m2) |
| Evap | Evaporative heat loss (W/m2) |
| TRemitted | Emitted terrestrial radiation (W/m2) |
| L-THIA | Long Term Hydrologic Impact Analysis |
Appendix A
Figure A1.
Deployment of Design Strategy for Modifying Shortwave Radiation.

Figure A2.
Deployment of Design Strategy for Modifying Evaporative Heat Loss.

Figure A3.
Deployment of Design Strategy for Modifying Convective Heat Loss.

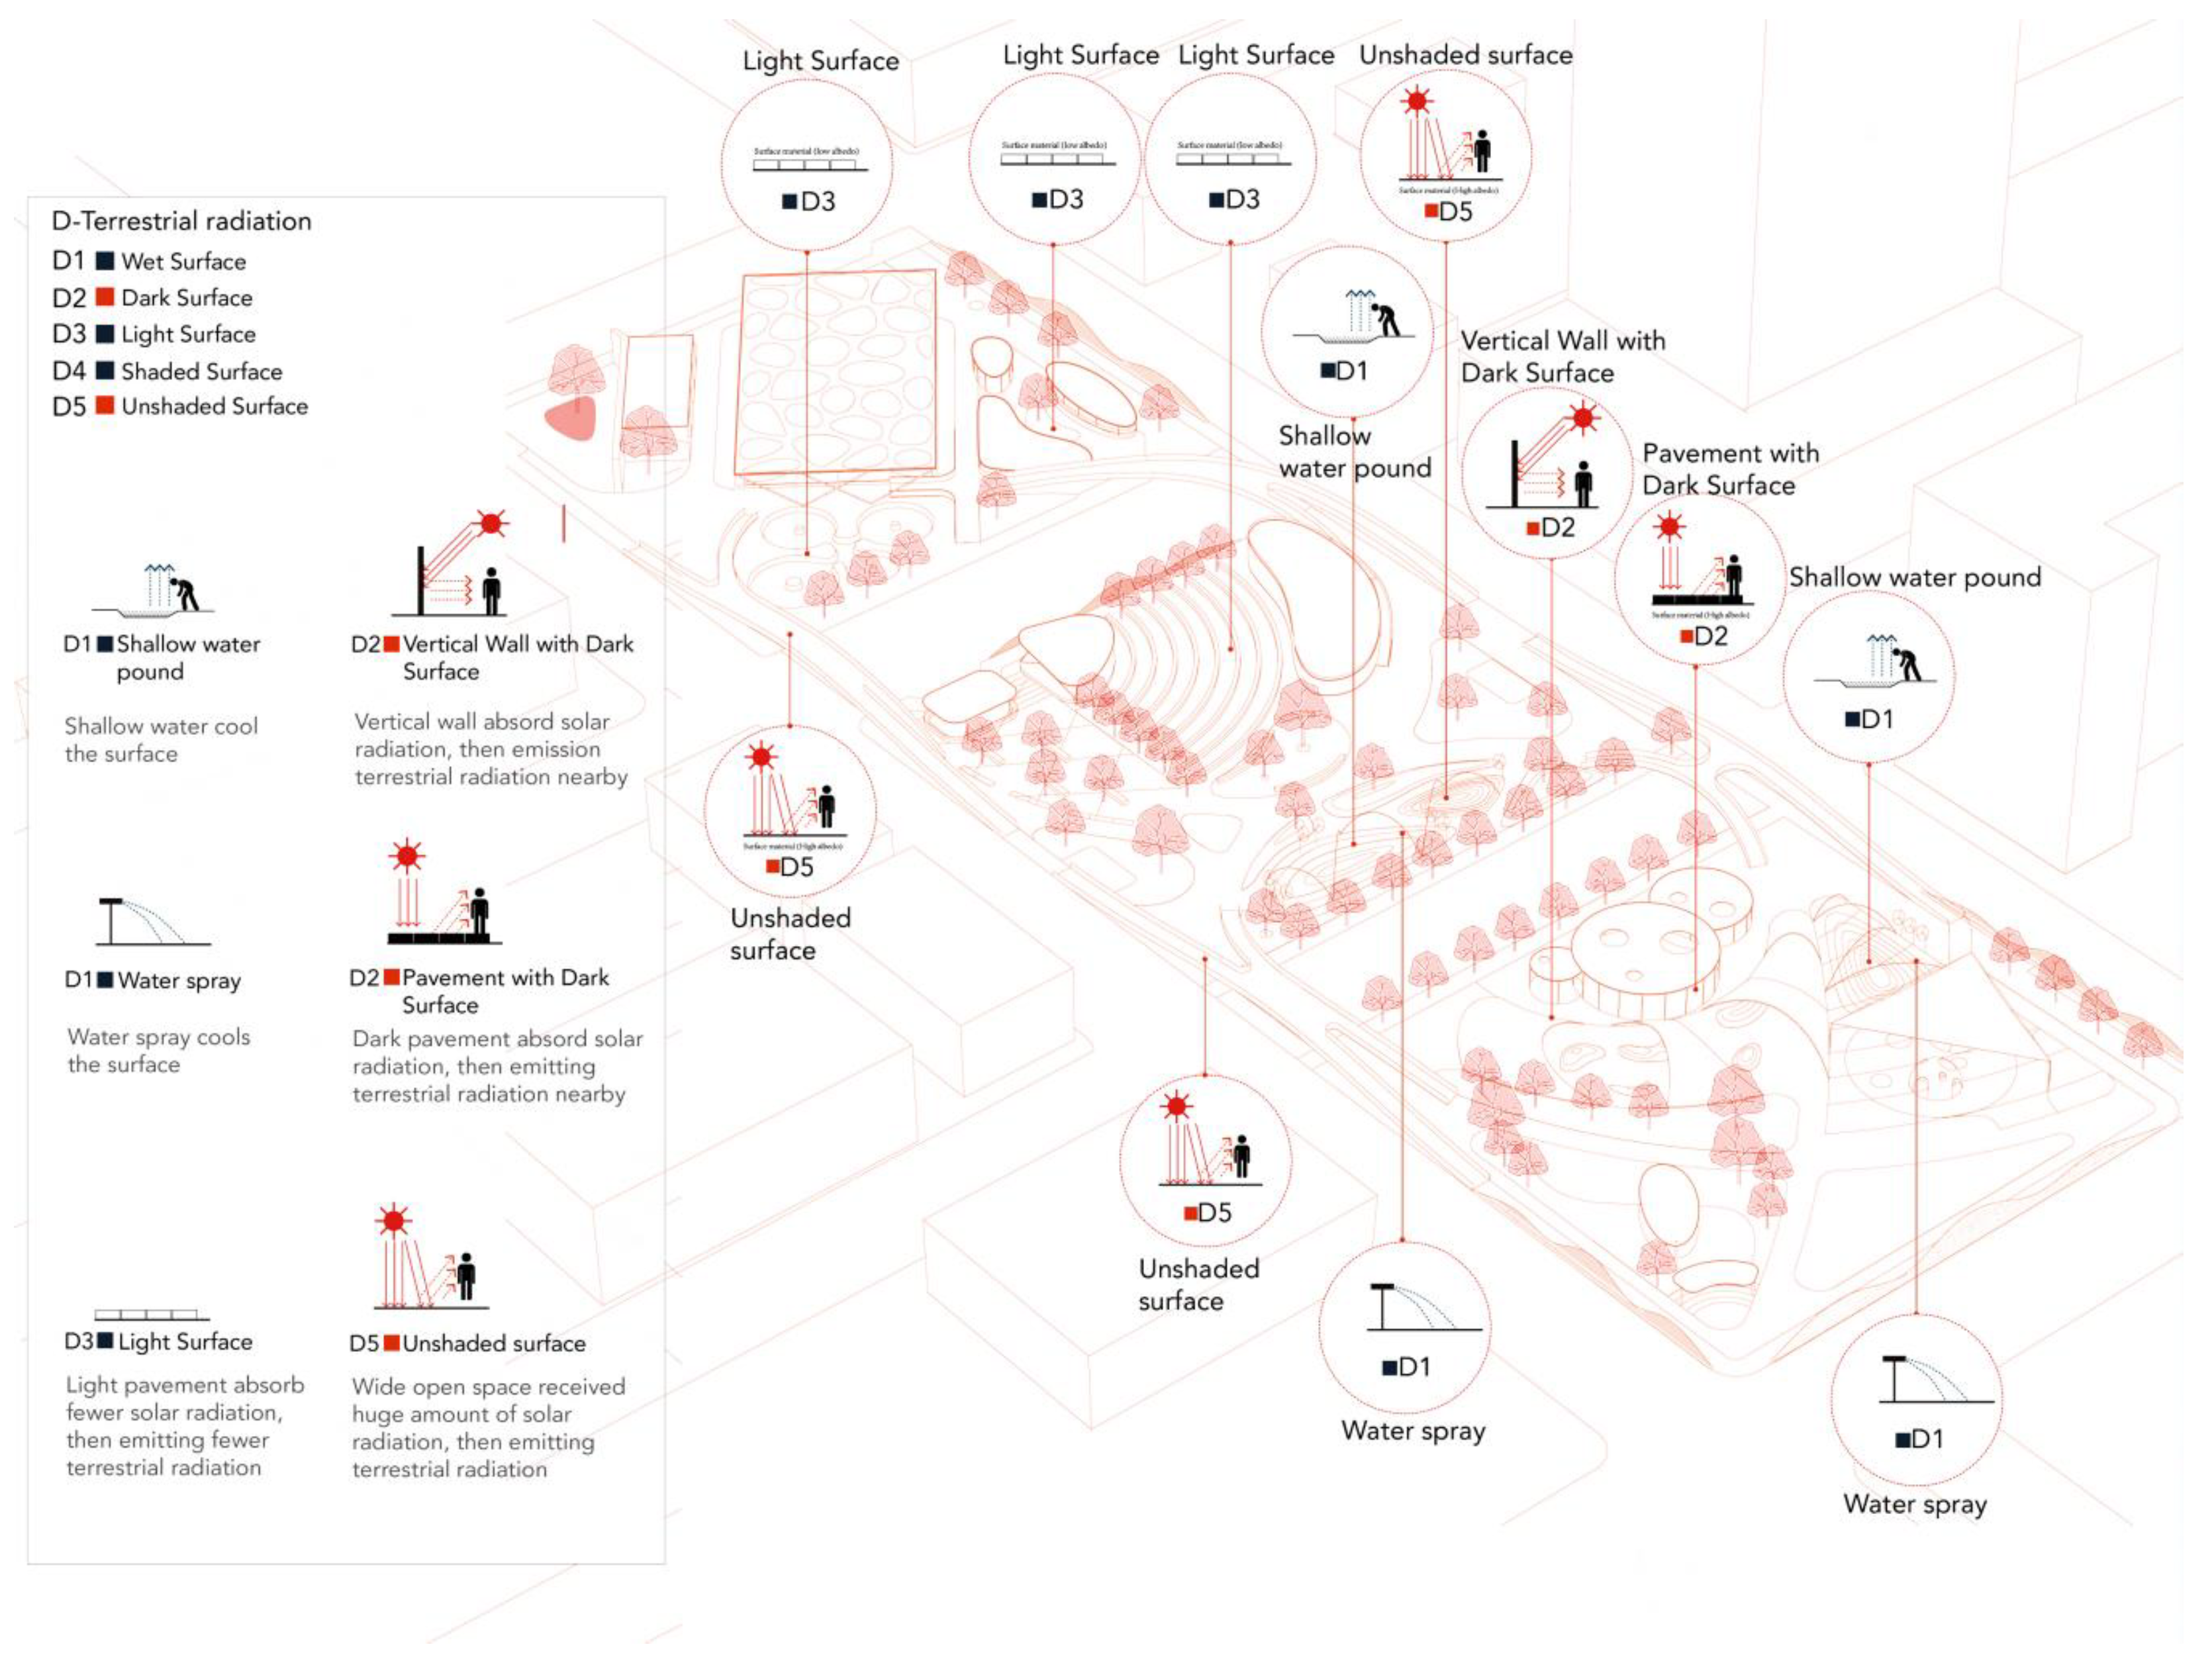
Figure A4.
Deployment of Design Strategy for Modifying Terrestrial Radiation Exchange.

References
- Berg, N. Us Urban Population Is up… but What Does ‘Urban’ Really Mean; The Atlantic: Boston, MA, USA, 2012. [Google Scholar]
- Kim, S.W.; Brown, R.D. Urban heat island (UHI) intensity and magnitude estimations: A systematic literature review. Sci. Total Environ. 2021, 779, 146389. [Google Scholar] [CrossRef]
- Rizwan, A.M.; Dennis, L.Y.; Chunho, L. A review on the generation, determination and mitigation of Urban Heat Island. J. Environ. Sci. 2008, 20, 120–128. [Google Scholar] [CrossRef]
- Rosenberg, W.; Donald, A. Evidence based medicine: An approach to clinical problem-solving. BMJ 1995, 310, 1122–1126. [Google Scholar] [CrossRef] [Green Version]
- Brown, R.D.; Corry, R.C. Evidence-based landscape architecture: The maturing of a profession. Landsc. Urban Plan. 2011, 100, 327–329. [Google Scholar] [CrossRef] [Green Version]
- Guyatt, G.; Cairns, J.; Churchill, D.; Cook, D.; Haynes, B.; Hirsh, J.; Irvine, J.; Levine, M.; Levine, M.; Nishikawa, J.; et al. Evidence-based medicine: A new approach to teaching the practice of medicine. JAMA 1992, 268, 2420–2425. [Google Scholar] [CrossRef]
- Zimring, C.; Denham, M.E.; Jacob, J.T.; Cowan, D.Z.; Do, E.Y.-L.; Hall, K.; Kamerow, D.; Kasali, A.; Steinberg, J.P. Evidence-Based Design of Healthcare Facilities: Opportunities for Research and Practice in Infection Prevention. Infect. Control Hosp. Epidemiol. 2013, 34, 514–516. [Google Scholar] [CrossRef]
- Ndubisi, F.; Li, M. Quantifying the Benefits of High-Performing Landscapes: Prospects and Challenges; Department of Landscape Architecture and Urban Planning, Texas A&M University: College Station, TX, USA, 2013; Volume 5, p. 2013. [Google Scholar]
- Chiang, Y.-C.; Li, D.; Jane, H.-A. Wild or tended nature? The effects of landscape location and vegetation density on physiological and psychological responses. Landsc. Urban Plan. 2017, 167, 72–83. [Google Scholar] [CrossRef]
- Brown, R.D.; Gillespie, T.J. Microclimatic Landscape Design: Creating Thermal Comfort and Energy Efficiency; Wiley: New York, NY, USA, 1995; Volume 1. [Google Scholar]
- Li, X.; Zhang, Y.; Li, D.; Xu, Y.; Brown, R.D. Ameliorating cold stress in a hot climate: Effect of Winter Storm Uri on residents of subsidized housing neighborhoods. Build. Environ. 2022, 209, 108646. [Google Scholar] [CrossRef]
- Brown, R.D.; Corry, R.C. Evidence-Based Landscape Architecture for Human Health and Well-Being. Sustainability 2020, 12, 1360. [Google Scholar] [CrossRef] [Green Version]
- Jorgensen, A. Looking Backwards, Looking Forwards; Taylor & Francis: Abingdon, UK, 2014; pp. 1–6. [Google Scholar]
- Milburn, L.-A.S.; Brown, R.D. The relationship between research and design in landscape architecture. Landsc. Urban Plan. 2003, 64, 47–66. [Google Scholar] [CrossRef] [Green Version]
- Hamilton, D.K. Incorporating Credible Evidence Into the Design Process. HERD Health Environ. Res. Des. J. 2018, 11, 11–16. [Google Scholar] [CrossRef]
- Halawa, F.; Madathil, S.C.; Gittler, A.; Khasawneh, M.T. Advancing evidence-based healthcare facility design: A systematic literature review. Health Care Manag. Sci. 2020, 23, 453–480. [Google Scholar] [CrossRef]
- Wilson, S.M.; Richard, R.; Joseph, L.; Williams, E. Climate Change, Environmental Justice, and Vulnerability: An Exploratory Spatial Analysis. Environ. Justice 2010, 3, 13–19. [Google Scholar] [CrossRef] [Green Version]
- Peel, M.C.; Finlayson, B.L.; McMahon, T.A. Updated world map of the Köppen-Geiger climate classification. Hydrol. Earth Syst. Sci. 2007, 11, 1633–1644. [Google Scholar] [CrossRef] [Green Version]
- Chien, L.-C.; Guo, Y.; Zhang, K. Spatiotemporal analysis of heat and heat wave effects on elderly mortality in Texas, 2006–2011. Sci. Total. Environ. 2016, 562, 845–851. [Google Scholar] [CrossRef] [PubMed]
- Teshnehdel, S.; Gatto, E.; Li, D.; Brown, R.D. Improving Outdoor Thermal Comfort in a Steppe Climate: Effect of Water and Trees in an Urban Park. Land 2022, 11, 431. [Google Scholar] [CrossRef]
- Bowler, D.E.; Buyung-Ali, L.; Knight, T.M.; Pullin, A.S. Urban greening to cool towns and cities: A systematic review of the empirical evidence. Landsc. Urban Plan. 2010, 97, 147–155. [Google Scholar] [CrossRef]
- Brown, R.D. Ameliorating the effects of climate change: Modifying microclimates through design. Landsc. Urban Plan. 2011, 100, 372–374. [Google Scholar] [CrossRef]
- Lai, D.; Liu, W.; Gan, T.; Liu, K.; Chen, Q. A review of mitigating strategies to improve the thermal environment and thermal comfort in urban outdoor spaces. Sci. Total Environ. 2019, 661, 337–353. [Google Scholar] [CrossRef]
- Liu, Z.; Cheng, W.; Jim, C.; Morakinyo, T.E.; Shi, Y.; Ng, E. Heat mitigation benefits of urban green and blue infrastructures: A systematic review of modeling techniques, validation and scenario simulation in ENVI-met V4. Build. Environ. 2021, 200, 107939. [Google Scholar] [CrossRef]
- Vanos, J.K.; Warland, J.S.; Gillespie, T.J.; Kenny, N.A. Improved predictive ability of climate–human–behaviour interactions with modifications to the COMFA outdoor energy budget model. Int. J. Biometeorol. 2012, 56, 1065–1074. [Google Scholar] [CrossRef] [PubMed]
- Kenny, N.A.; Warland, J.S.; Brown, R.; Gillespie, T.G. Part B: Revisions to the COMFA outdoor thermal comfort model for application to subjects performing physical activity. Int. J. Biometeorol. 2009, 53, 429–441. [Google Scholar] [CrossRef] [PubMed]
- Brown, R.; Gillespie, T.J. Estimating outdoor thermal comfort using a cylindrical radiation thermometer and an energy budget model. Int. J. Biometeorol. 1986, 30, 43–52. [Google Scholar] [CrossRef] [PubMed]
- Cheng, W.; Brown, R.D. An energy budget model for estimating the thermal comfort of children. Int. J. Biometeorol. 2020, 64, 1355–1366. [Google Scholar] [CrossRef] [PubMed]
- Newman, G.; Sansom, G.T.; Yu, S.; Kirsch, K.R.; Li, D.; Kim, Y.; Horney, J.A.; Kim, G.; Musharrat, S. A Framework for Evaluating the Effects of Green Infrastructure in Mitigating Pollutant Transferal and Flood Events in Sunnyside, Houston, TX. Sustainability 2022, 14, 4247. [Google Scholar] [CrossRef]
- Baskaya, F.A.T. Disaster sensitive landscape planning for the coastal megacity of Istanbul. J. Coast. Conserv. 2015, 19, 729–742. [Google Scholar] [CrossRef]
Figure 2.
Proposed Evidence Based Landscape Architecture Framework (EBLAF).

Figure 3.
Population by year 1886–2021 (Left); Yearly counts of extreme hot day (Ta > 100 °F) (Right).
Figure 3.
Population by year 1886–2021 (Left); Yearly counts of extreme hot day (Ta > 100 °F) (Right).

Figure 4.
In situ measurement (a) route 1, along the site; and (b) route 2, across the site.

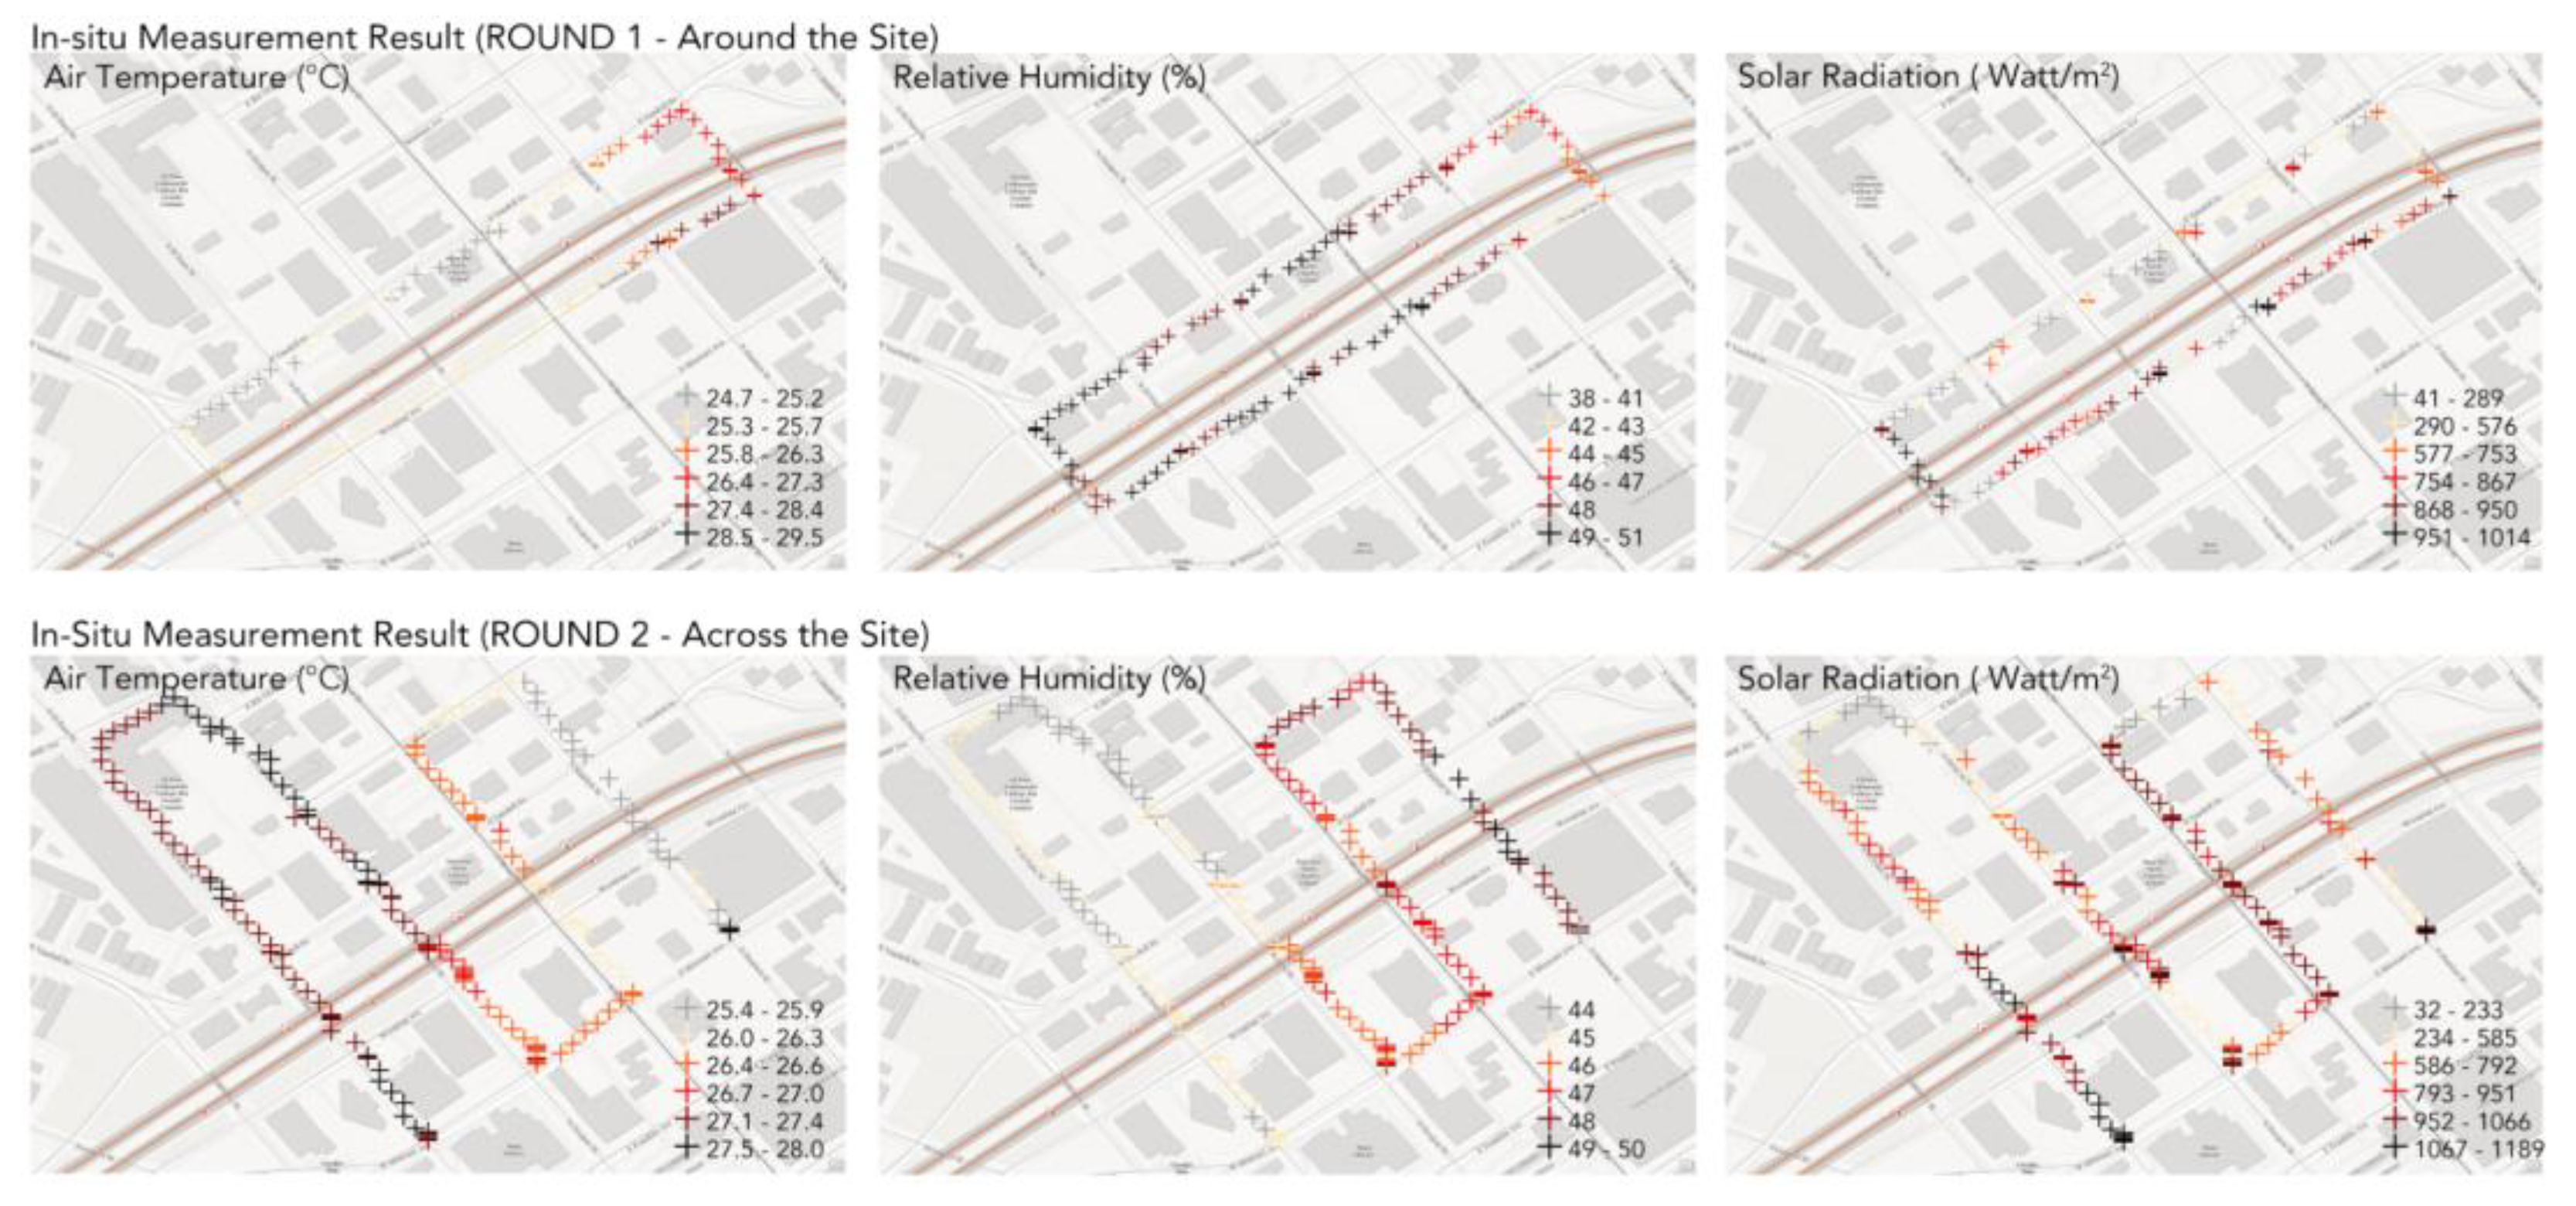
Figure 5.
In situ measurement result, route 1 (top) and route 2 (bottom).

Figure 6.
(a) ENVI-met model domain; (b) Validation of the ENVI-met model.

Figure 7.
Microclimate output from the validated ENVI-met Model at 12:00, 15:00 and 19:00. (a) Potential air temperature, °C; (b) Relative humidity, %; (c) Directive shortwave radiation, W/m2. No solar radiation reported at 19:00 after sunset; (d) Wind speed, m/s.
Figure 7.
Microclimate output from the validated ENVI-met Model at 12:00, 15:00 and 19:00. (a) Potential air temperature, °C; (b) Relative humidity, %; (c) Directive shortwave radiation, W/m2. No solar radiation reported at 19:00 after sunset; (d) Wind speed, m/s.

Figure 8.
A series of intervention strategies according to the comfort formula energy budget model (COMFA).
Figure 8.
A series of intervention strategies according to the comfort formula energy budget model (COMFA).

Figure 9.
Microclimate and Comfort Formula (COMFA) energy budget before and after design interventions.
Figure 9.
Microclimate and Comfort Formula (COMFA) energy budget before and after design interventions.

Figure 10.
(a) Scenario 1, Plaza with Water Mist; (b) Scenario 2, Amphitheater; (c) Scenario 3, Pedestrian Street; (d) Scenario 4, Green Patch with Vertical Wall.
Figure 10.
(a) Scenario 1, Plaza with Water Mist; (b) Scenario 2, Amphitheater; (c) Scenario 3, Pedestrian Street; (d) Scenario 4, Green Patch with Vertical Wall.


Table 1.
Thermal Sensation by Comfort Formula energy Budget Model (COMFA) (W/m2).
| Thermal Sensation | Kenny et al. [26] | Brown and Gillespie [27] | Cheng and Brown (For Children) [28] |
|---|---|---|---|
| Cold | <−150 | <−150 | / |
| Cool | −150 to −20 | −150 to −50 | −140 to −110 |
| Neutral | −20 to 150 | −50 to 50 | −110 to 40 |
| Warm | 151 to 250 | 50 to 150 | 40 to 80 |
| Hot | >250 | >150 | >80 |
Disclaimer/Publisher’s Note: The statements, opinions and data contained in all publications are solely those of the individual author(s) and contributor(s) and not of MDPI and/or the editor(s). MDPI and/or the editor(s) disclaim responsibility for any injury to people or property resulting from any ideas, methods, instructions or products referred to in the content. |
© 2023 by the authors. Licensee MDPI, Basel, Switzerland. This article is an open access article distributed under the terms and conditions of the Creative Commons Attribution (CC BY) license (https://creativecommons.org/licenses/by/4.0/).
Share and Cite
MDPI and ACS Style
Li, X.; Peng, J.; Li, D.; Brown, R.D. A Framework for Evidence-Based Landscape Architecture: Cooling a Hot Urban Climate through Design. Sustainability 2023, 15, 2301. https://doi.org/10.3390/su15032301
AMA Style
Li X, Peng J, Li D, Brown RD. A Framework for Evidence-Based Landscape Architecture: Cooling a Hot Urban Climate through Design. Sustainability. 2023; 15(3):2301. https://doi.org/10.3390/su15032301
Chicago/Turabian StyleLi, Xiaoyu, Jingxi Peng, Dongying Li, and Robert D. Brown. 2023. "A Framework for Evidence-Based Landscape Architecture: Cooling a Hot Urban Climate through Design" Sustainability 15, no. 3: 2301. https://doi.org/10.3390/su15032301
Note that from the first issue of 2016, this journal uses article numbers instead of page numbers. See further details here.