
Improved Recovery of Overloaded Anaerobic Batch Reactors by Graphene Oxide


1
Catalan Institute for Water Research (ICRA), University of Girona, 17003 Girona, Spain
2
Chair of Urban Water Systems Engineering, Technical University of Munich, Am Coulombwall 3, 85748 Garching, Germany
*
Author to whom correspondence should be addressed.
Sustainability 2023, 15(3), 2224; https://doi.org/10.3390/su15032224
Submission received: 20 December 2022
/
Revised: 18 January 2023
/
Accepted: 20 January 2023
/
Published: 25 January 2023
(This article belongs to the Special Issue Wastewater Treatment and Sustainability of Development)
Abstract
:Anaerobic digestion reactors may suffer from acidification when overloading occurs. Carbon-based materials are amended to mitigate the souring effects of excessive loading. This study aims to test if graphene oxide (GO) helps overloaded anaerobic reactors recover faster. Batch tests were conducted following a fed-batch strategy at different GO levels (0, 10, and 20 mg GO per g of volatile solid (VS)) and different inoculum substrate ratios (ISRs) of 2, 1, and 0.75 based on VS. While an ISR of 2 was initially applied, the ISR was decreased to 1 and 0.75 in two parallel sets of experiments to simulate overloading conditions at the fourth feeding cycle. Lastly, an ISR of 2 was restored in all assays. First-order model kinetic constants confirmed a significant (p < 0.05) effect by GO from the third feed on. Although the GO-amended assays did not alleviate the acidification effects, during the final phase the kinetic constants reached values similar to or even above the controls (without GO). Moreover, a GO concentration up to 20 mgGO/gVS had no impact on FOS/TAC. Overall, this study broadens the understanding of the design and operation of anaerobic reactors amended with GO.
1. Introduction
Towards the road to defossilization and the increased use of sustainable sources in the energy sector, renewable gas represents a key cornerstone in this transition [1]. Renewable gas and nutrient-rich digestate to be applied as fertilizer are the main outputs of the anaerobic digestion (AD) process, where organic matter is stabilized and resources are recovered. Digesters are among the most reliable and affordable technologies to deal with feedstocks characterized by high organic content, such as municipal organic waste or sewage sludge [2]. However, AD comprises different sequential steps to degrade the organic matter and produce biogas, which requires long retention times (ca. 20–30 days). These steps can generally be classified as hydrolysis, acidogenesis, acetogenesis, and methanogenesis. All of them are performed by different microorganisms (bacteria, archaea, but also fungi) with different kinetics. The overall cooperation and synergy of such microbial communities are based on a delicate syntropic balance that, if altered, can lead to reactor failure, often recognized as acidification [3]. An imbalance in the AD operation can occur when the organic loading rate (OLR) is too high for the microorganisms to handle cooperatively. Fermentative bacteria are known to be much faster than methanogens [4]. Thus, they convert organic material into volatile fatty acids (VFAs), among others, at a rate higher than methanogens convert those into methane (CH4). In cases of excessive loading, VFAs accumulate within the reactor, and environmental conditions turn acidic as methanogens cannot keep up with their conversion [4]. Furthermore, pH values lower than 6.8 are detrimental for methanogens, inhibiting their activity and ultimately leading to the failure of the process [5].
Thanks to their electric properties, carbon-based materials, such as biochar, granular or powder-activated carbon (AC), are recently being applied to enhance the electron transferability among the different microbial strains by direct interspecies electron transfer (DIET), leading to shorter retention times and avoiding acidification [6,7,8,9]. Similarly, graphene oxide (GO) is also recently being investigated as it resembles graphene, the material with the highest conductivity known, except for the presence of oxygen functional groups [10,11]. However, GO possesses oxygen functional groups in its hexagonal honeycomb carbon plan, making it less conductive than pristine graphene. Conversely, GO is less costly than graphene and can restore its layer composition through physical, chemical, or biological reduction [12,13]. Furthermore, compared to AC or biochar, the necessary dosage is reported to be much smaller [10,14].
Compared with other mitigation strategies, GO will be added at the beginning of the experiment rather than at the moment of acidification due to overloading [15]. It is hypothesized that GO can act as a mitigator against overloading conditions only when GO is in its biologically reduced form. One of the main advantages of using GO in an anaerobic batch reactor is its ability to increase the rate of substrate conversion and act as a support for immobilizing microorganisms [16,17]. The research gap here investigated is the lack of understanding of the impact of GO addition in overloaded anaerobic batch reactors.
This study aims to determine the ability of GO-amended anaerobic reactors to recover from the effects of excessive loading. The ability will be assessed by comparing model-derived kinetic constants and stability parameters to a control and among different GO concentrations and inoculum substrate ratios (ISRs) applied. Given the quasi-continuous operation in fed-batch mode, the highly sophisticated and automated systems, and the factorial design of the experiment employed, this systematic study offers robust insights into the impact of GO in overloaded anaerobic assays.
2. Materials and Methods
2.1. Materials and Chemicals
A 4 g/L aqueous dispersion of GO with flake sizes < 10 μm and pH 2.2–2.5 was supplied by Graphenea (San Sebastián, Spain). D-glucose powder (CAS 50-99-7) (VWR International GmbH, Ismaning, Germany) was used as the test substrate.
2.2. Experimental Setup and Operation
Biochemical methane potential (BMP) experiments were performed using three Automatic Methane Potential Test System II systems (AMPTS II, Bioprocess Control, Lund, Sweden) using glucose as substrate. The inoculum used in the experiments was collected from the anaerobic digester of the Garching wastewater treatment plant (Garching, Germany). The digester is fed with a mixture of primary and secondary sludge and operated at a mesophilic temperature of around 38 °C. The inoculum was characterized by total solids (TS) and volatile solids (VS) contents of 24.5 ± 0.1 gTS/kg and 15.9 ± 0.1 gVS/kg (mean ± standard deviation, n = 3). For glucose, the TS content was 998.7 ± 0.1 g/kg, and the VS/TS ratio was 100%. AMPTS operating conditions are described elsewhere [16,18].
The experiments were designed according to a factorial design with three factors (feed, GO concentration, and ISR) and multiple levels. As shown in Table 1, a total of nine conditions were tested, each carried out in five replicates (n = 5). GO was added only at the beginning of the experiment, and the concentrations of 0, 10, and 20 mgGO/gVS were chosen according to literature values [16,19]. Roman numbers were adopted to indicate the five subsequent feeding cycles.
The three ISRs were chosen according to comparable literature studies that simulated overloading conditions [19,20,21]. However, it is important to highlight that the ISR of 1 and 0.75 (representing the overloading conditions) were applied to the target assays only during feed IV (failure phase). Instead, feeds I, II, III, and V (recovery phase) were performed at an ISR of 2, as recommended for normal operating conditions [22].
Since the objective of this investigation was for comparison purposes among the tested conditions rather than for the determination of the BMP of a given substrate, the guidelines for BMP tests were slightly adapted [23]. The BMP termination criteria of daily methane production lower than 1% for three consecutive days was replaced with less than 0.3 mLCH4/d for two days. Cumulative methane production is expressed as gross instead of the net since blanks (assays containing only inoculum) were not carried out. In fact, the scope of the study was not to assess the exact BMP yield from each tested condition but to gain insights from their comparisons.
2.3. Analytical Methods
The TS and VS of inoculum and glucose were analyzed according to standard methods [24]. For each of the nine conditions, one of the five replicates was used to grab samples for FOS/TAC measurement at two specific times. The first was at day 2 of feed IV (i.e., at the beginning of the failure cycle), and the second was at the end of feed V (when the digestion process reached the plateau phase). While FOS (“Flüchtige Organische Säuren”) represents the volatile fatty acids content expressed as mgCH3COOH/L, TAC (“Totales Anorganisches Carbonat”) indicates the alkaline buffer capacity expressed as mgCaCO3/L [25]. Their ratio is generally considered an operational indicator of anaerobic digester status. A FOS/TAC ratio below 0.3–0.4 suggests a stable process, while above 0.8, the process can be considered unstable [2,26,27]. The FOS/TAC ratio was determined with the Titralab AT1000&KF100 Series (Hach, Germany) following the Nordmann method [28]. Of course, the assays, from which the liquid samples were taken, were not considered for the average methane production calculations.
2.4. Kinetic Model
Designers and operators widely employ kinetic models to forecast and evaluate the potentiality of anaerobic digesters in full-scale scenarios [29,30]. The selection of a model depends on the substrate’s degradation behavior. The methane production of glucose degradation is reported to start immediately (no initial lag-phase), which is typical for more complex substrates that involve hydrolysis processes (e.g., microcrystalline cellulose or sewage sludge) [16,31,32]. Thus, to assess the impact of GO and ISR ratios on the kinetics constants, a first-order model was applied [33].
where,
B(t) = B∞ (1 − e−kt)
- B(t) = methane yield at time t (mLCH4/gVS);
- B∞ = ultimate methane yield (mLCH4/gVS);
- k = first-order rate constant (d−1); and
- t = time (d).
Iterations were performed using the MS Excel solver function, where the objective function was the minimization of the relative standard square error (RSS). Besides, as lower limits, the k and ultimate methane yield (B∞) variables were constrained to positive values, and initial values were set following the recommendation of Brulé et al. [34]. Moreover, B∞ was upwardly limited to the maximum theoretical BMP of glucose (C6H12O6), i.e., 372 mLCH4/gVS.
2.5. Statistical Parameters and Analysis
To understand the efficiency and the fitness level of the proposed kinetic models with the experimental data, the relative root means square error (rRMSE) and the coefficient of determination R2 were respectively used [35].
Furthermore, given the factorial design of the experiments conducted, three-way analyses of variance (ANOVA) were carried out using Origin 2021 software (OriginLab Corporation, Northampton, MA, USA) to estimate statistical differences among the different experimental conditions. A p-value < 0.05 was used as the significance level, and the Bonferroni test was adopted to compare the means and control the overall Type I error.
3. Results
3.1. Model Accuracy
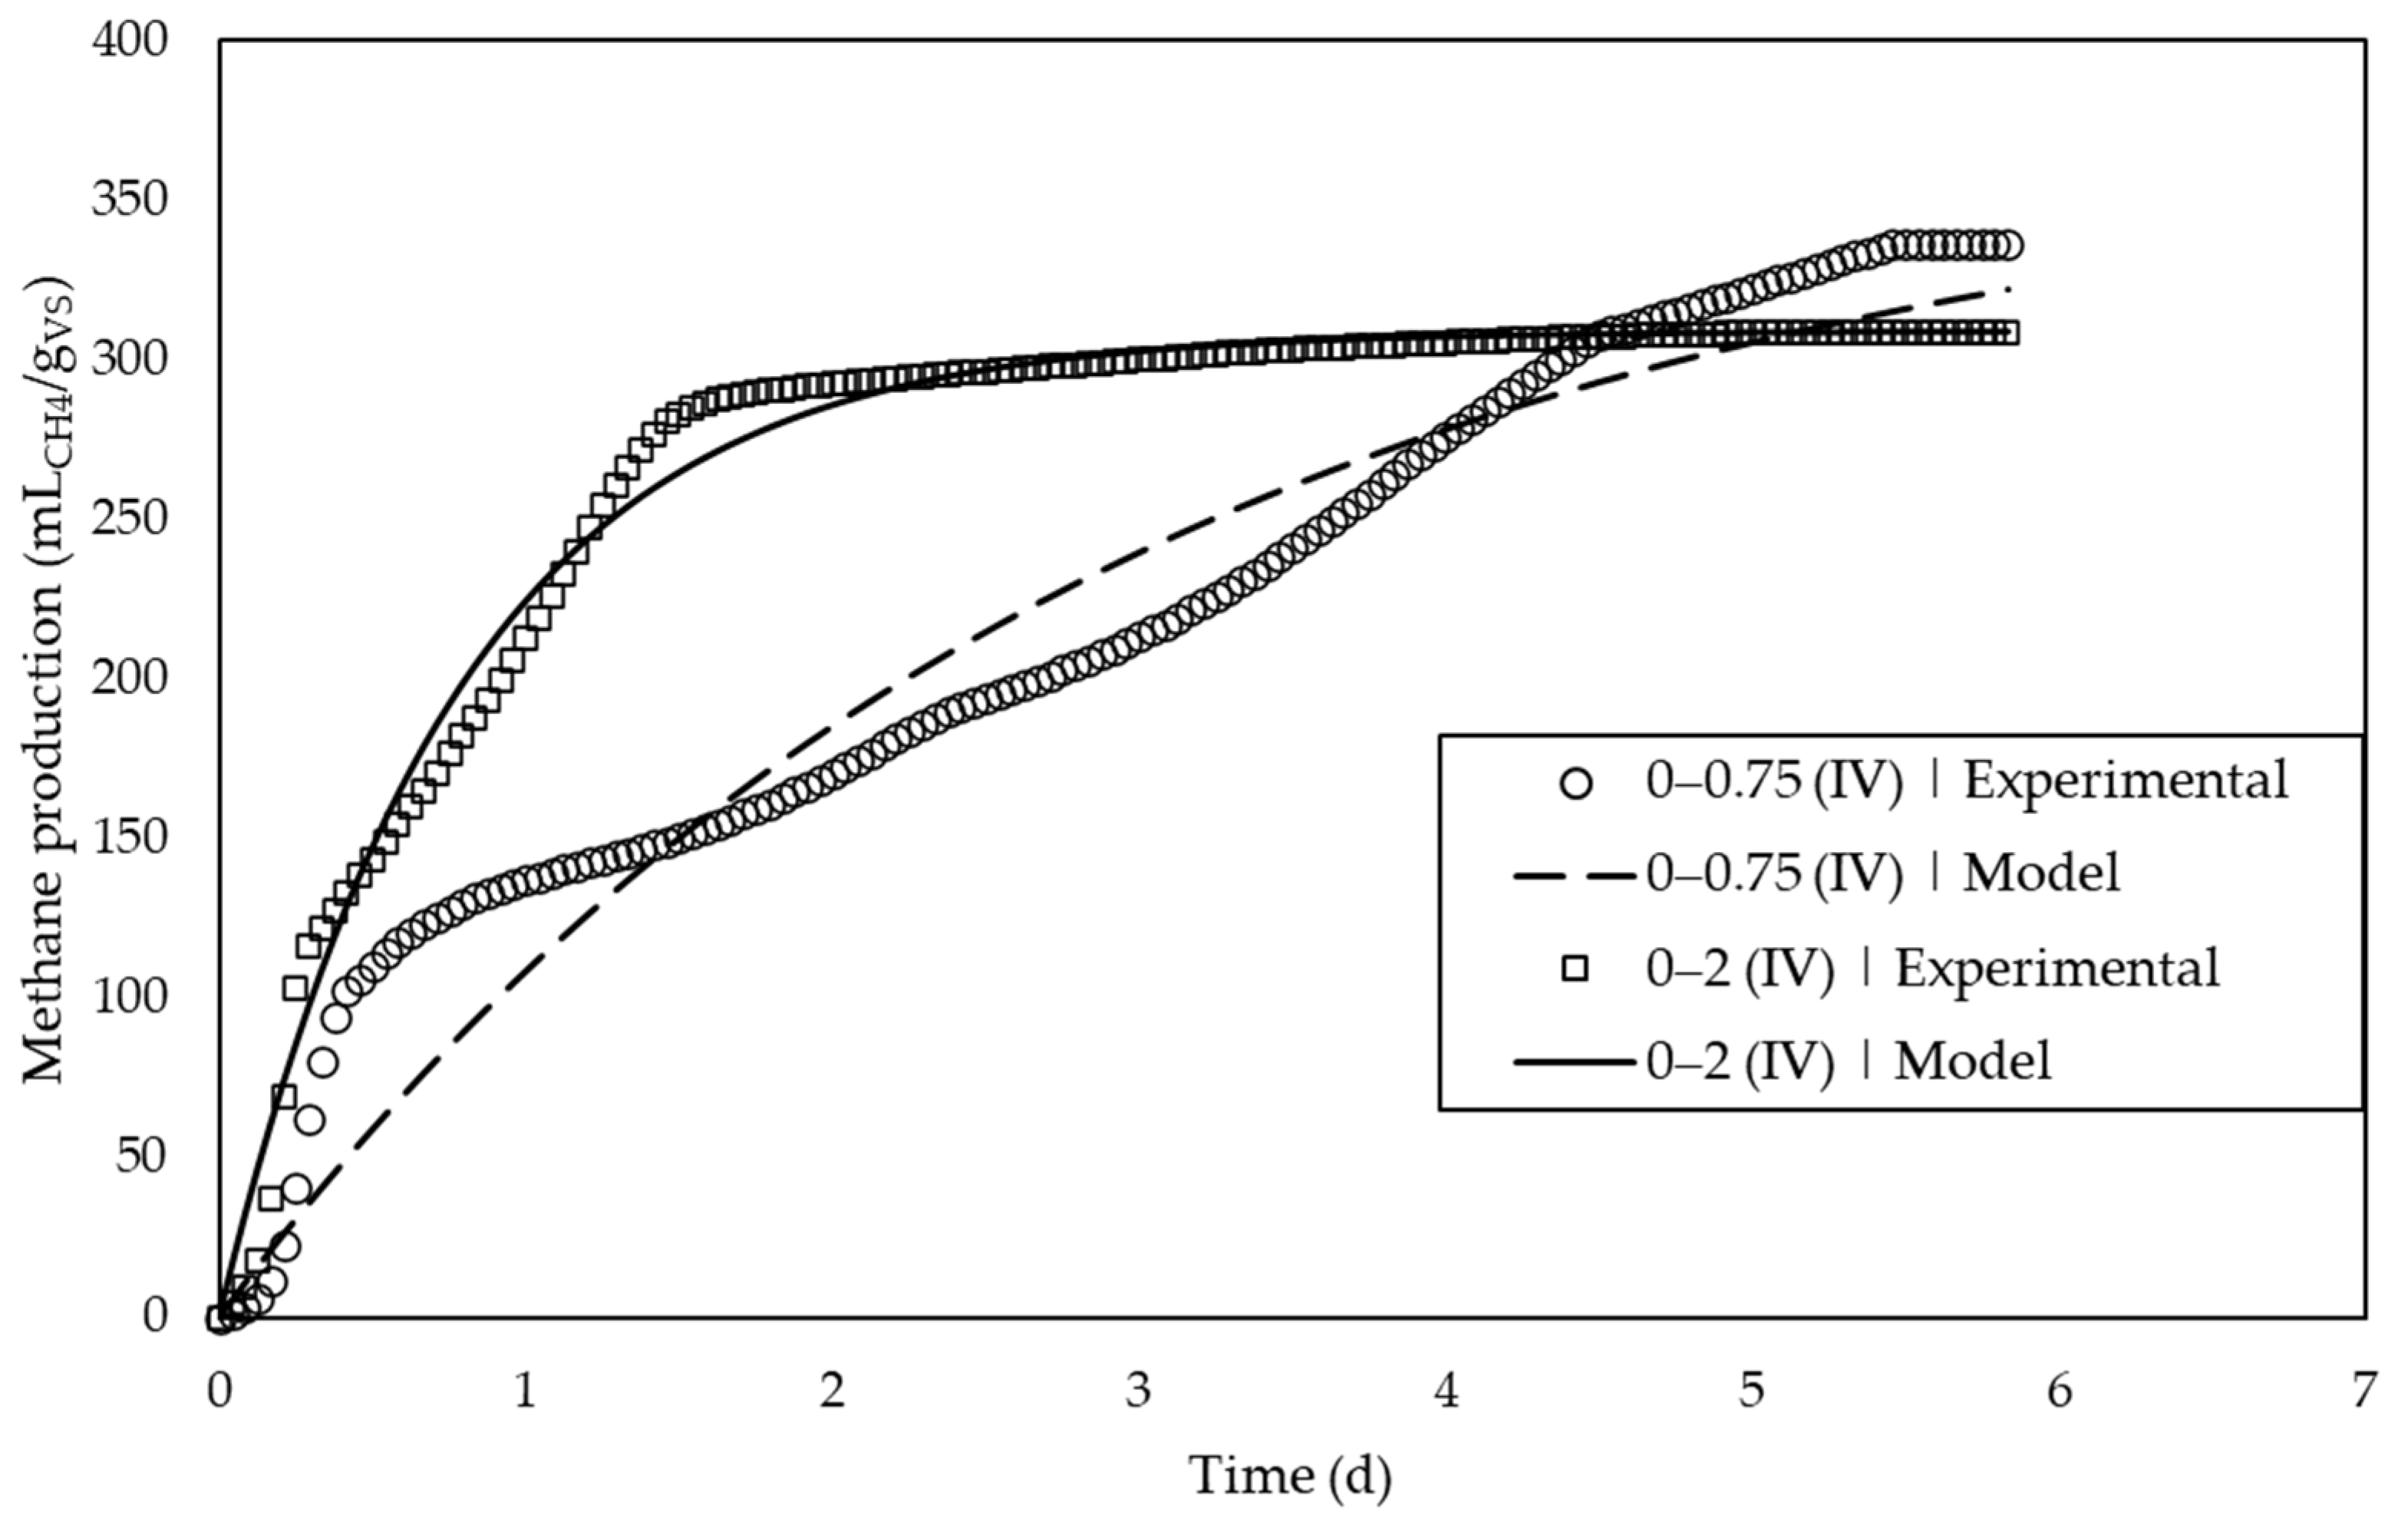
To assess the ability of GO to attenuate the effects of low ISRs (i.e., high substrate dosage) during the degradation of glucose, the first-order model was applied. The suitability of the model was evaluated through the R2 and rRMSE values. Except for conditions with the lowest ISR of 0.75 during feed IV (failure phase), R2 and rRMSE were greater than 0.97 and lower than 7%, respectively, for all conditions tested, confirming the overall suitability of the model (A1). The relatively lower model performance for ISR 0.75 can be explained by the overloading effect, which caused an anomalous methane production behavior. In Figure 1, the experimental and model values of the methane production of ISR 0.75 and 2 are compared for feed IV. While for assay 0–2, the model aligns very well with the experimental data (R2 of 0.99 ± 0.00 and rRMSE of 3.1 ± 0.4), this is not the case for 0–0.75, confirmed by the low R2 of 0.91 ± 0.06 and the high rRMSE of 11.6 ± 2.4% achieved.
3.2. Impact of GO and ISRs on the Kinetic Parameters
3.2.1. Ultimate Methane Yield B∞
The kinetic parameters obtained from the first-order model, namely B∞ and k, were used to evaluate the impact of GO concentration on the anaerobic reactor’s capabilities to counteract stress conditions. After an initial feeding strategy at an ISR of 2 for all assays until feed III, feed IV was conceived as a failure phase where higher substrate dosages were applied.
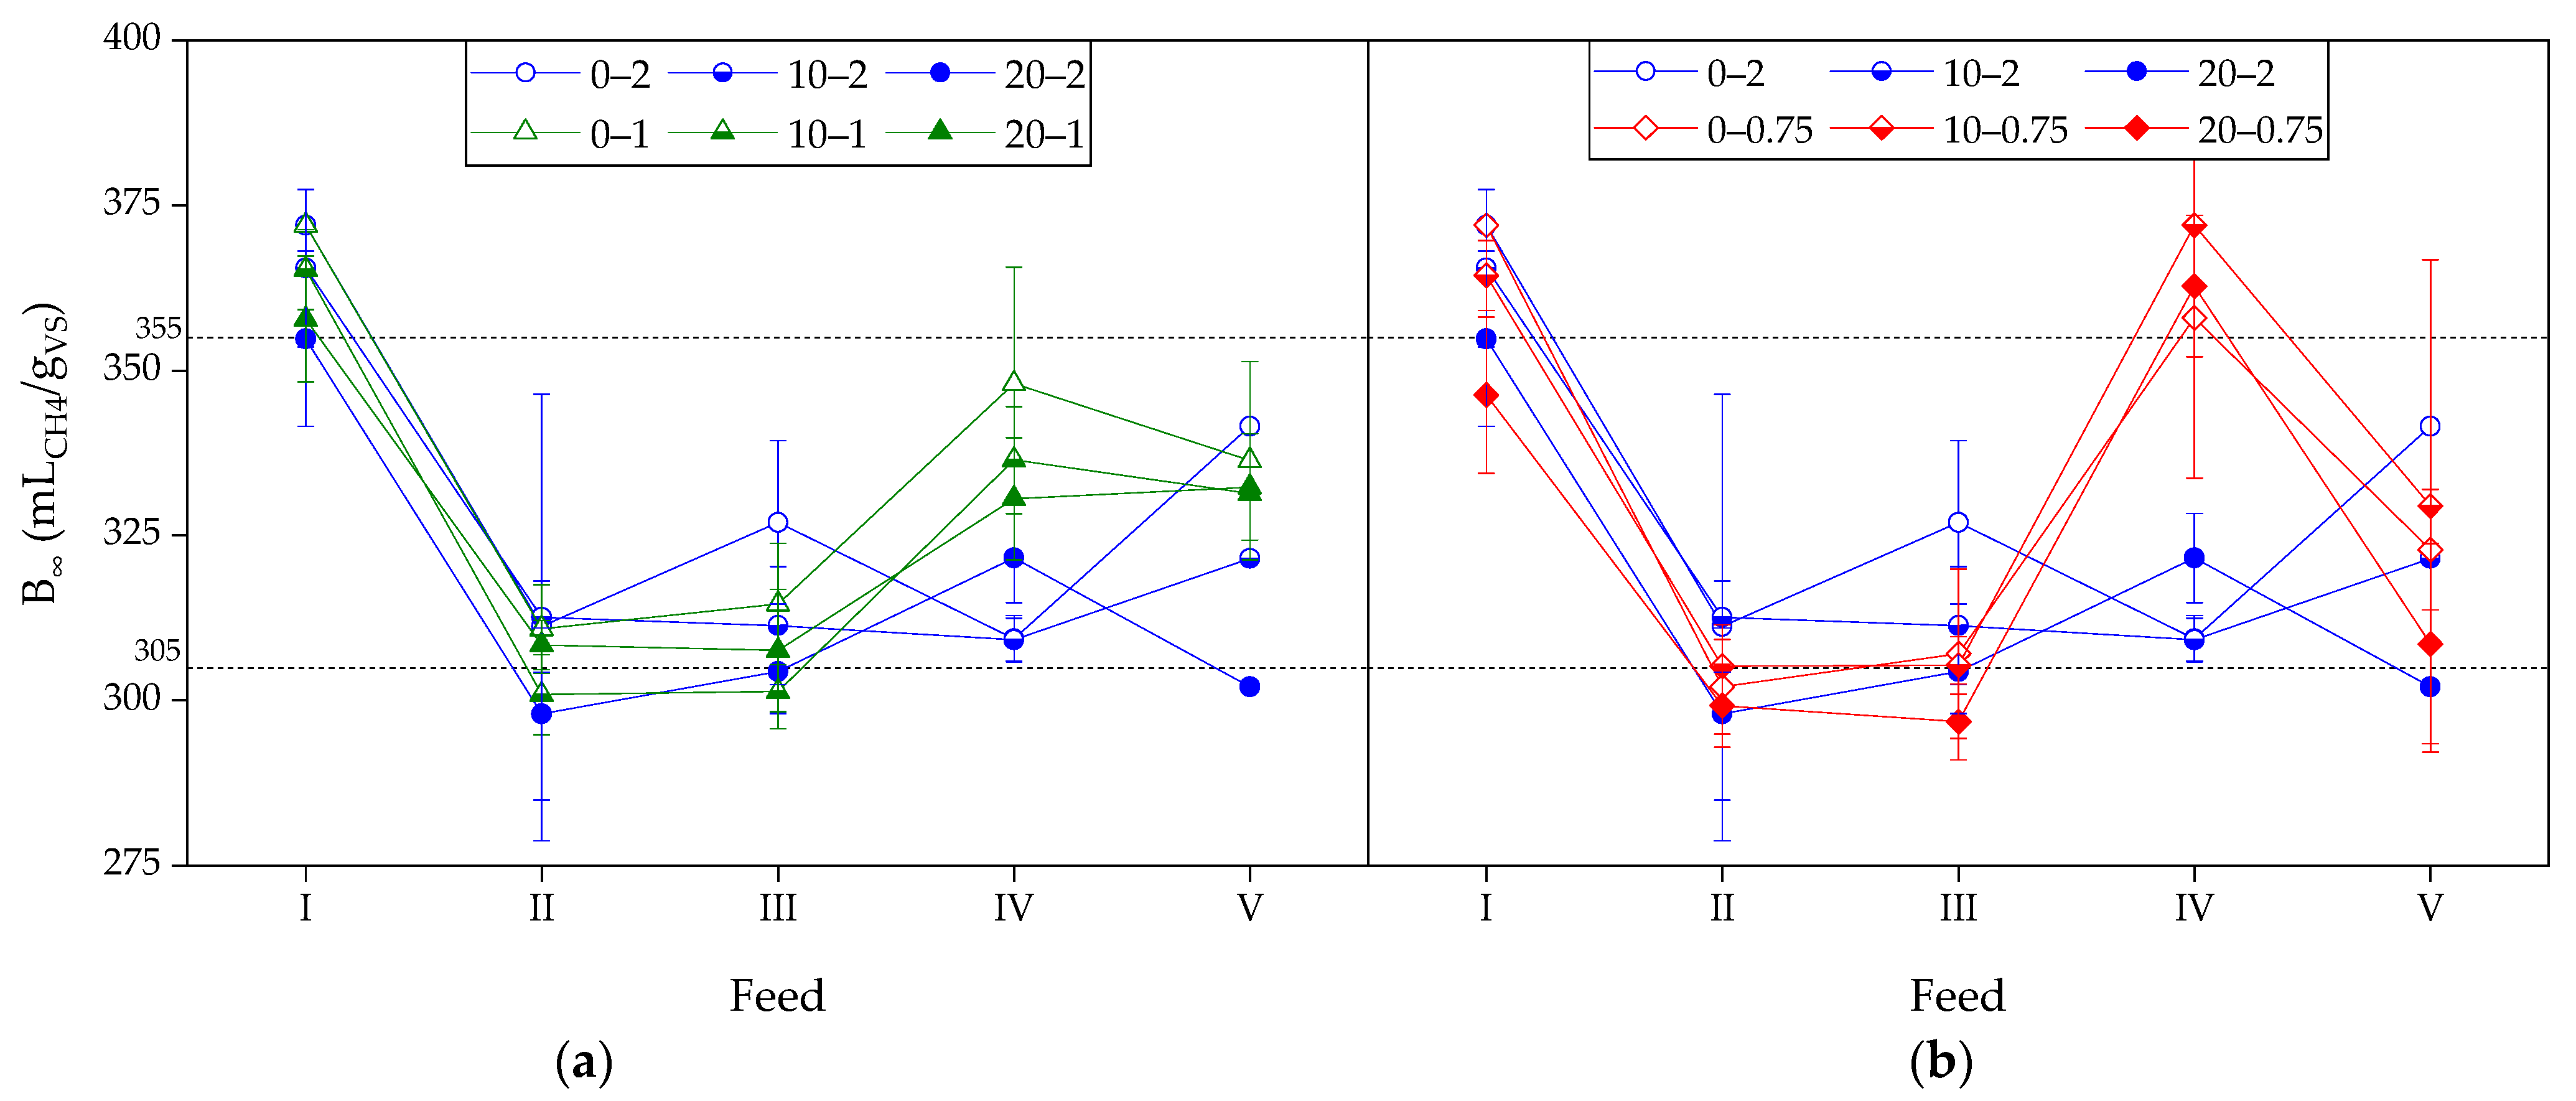
Figure 2 illustrates that at feed I, high B∞ values were observed across all conditions because no blanks were included; hence, the reported values are the gross gas productions of both substrate and inoculum. Moreover, significantly lower B∞ values were observed when GO was present. Both aspects have already been reported in a similar previous study [16]. From feed II on, the B∞ values dropped to around 305 mLCH4/gVS and were kept stable and maintained within the range of 305–355 mLCH4/gVS, representing the refined validation criteria [23]. It is noteworthy that it can be expected that the background production from the inoculum itself, usually measured in blanks, is getting smaller in fed-batch systems with each new feed. Although increases can be observed at feed IV for the conditions with lower ISRs, the B∞ values were still within the proposed range.
Finally, regardless of the GO concentrations applied, at feed V (recovery phase at an ISR of 2), all conditions yielded similar B∞ values (no significant differences from three-way ANOVA) (Table A2). Thus, both conditions with ISRs of 0.75 and 1 recovered comparably.
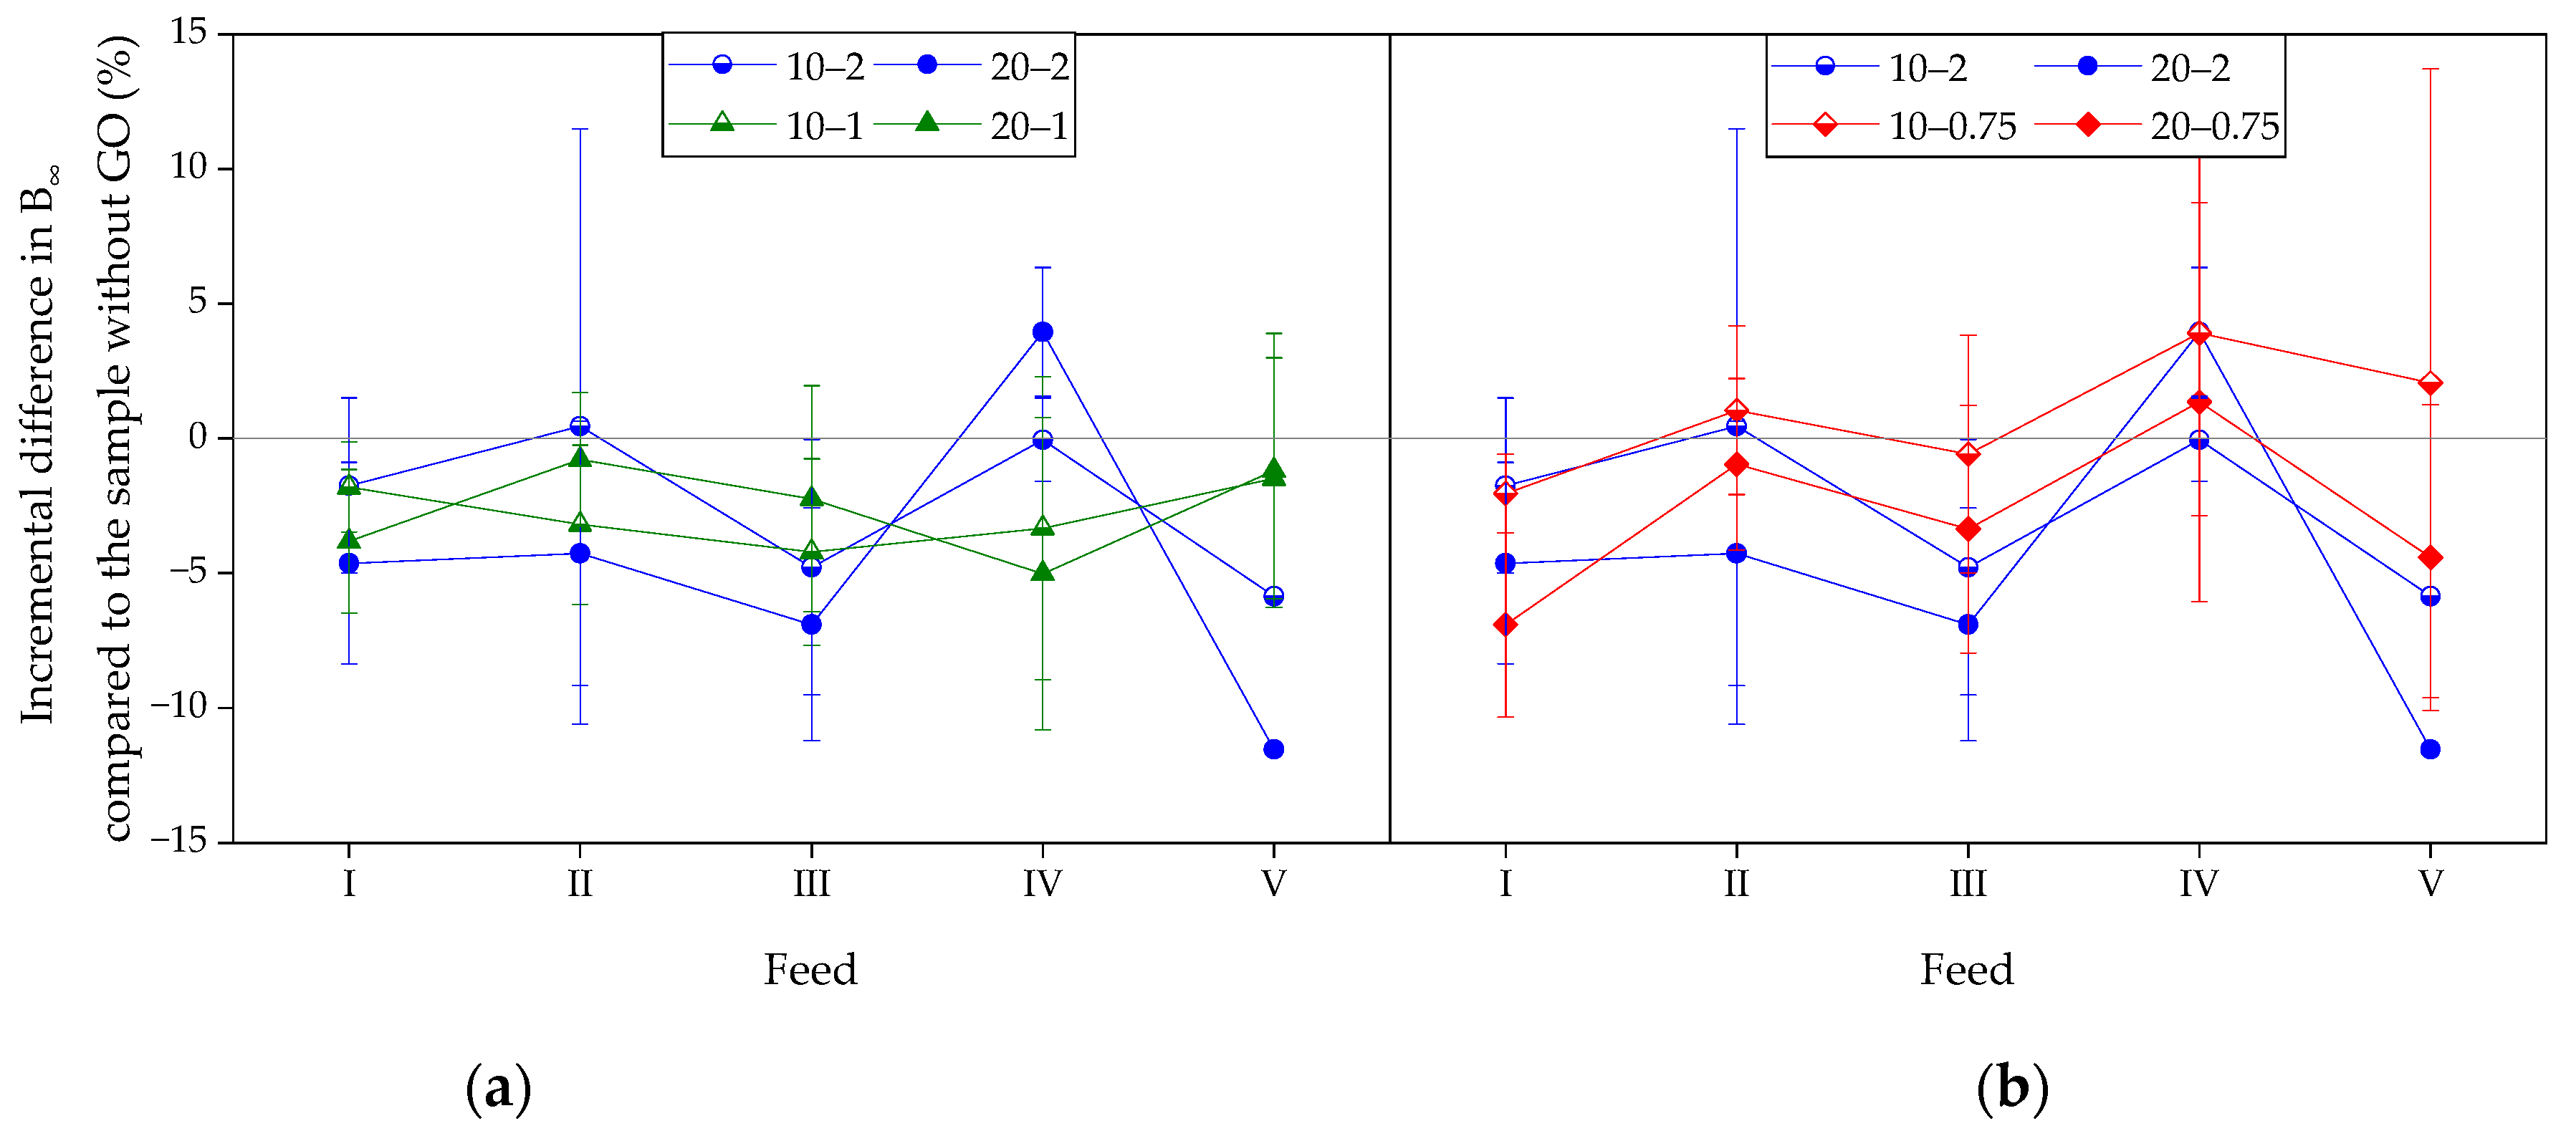
The absence of significant differences (p < 0.05) among the conditions for B∞ is evident in Figure 3 (and in Table A3). It shows the incremental differences in the B∞ values for the GO-amended condition compared to the control (no GO) for each considered ISR. The B∞ values were generally close to or below 0%, indicating a slightly lower B∞ for GO-amended assays compared to their respective conditions without GO (for each considered feed).
Figure 4 provides further details on the impact of GO and the high ISR of feed IV on the methane production behavior for 20–0.75. Initially (20–0.75 (I)), it can be seen how the methane production curve has a low steepness and a longer time needed to reach the plateau. Such limited methane production was assumed to be related to lower electron availability, used for the biological reduction of GO, happening during the first day [36,37,38]. However, during the recovery phase (20–0.75 (V)), the methane production curve perfectly overlaps the previous feeding cycles II and III curves, where an ISR of 2 was applied. As already seen in Figure 2 and Figure 3, the capacity of GO to fasten methane production is kept even after an intense loading stress.
3.2.2. First-Order Rate Constant k
Another model-derived kinetic parameter extracted to evaluate the impact of GO on overloaded anaerobic assays is the kinetic constant k.
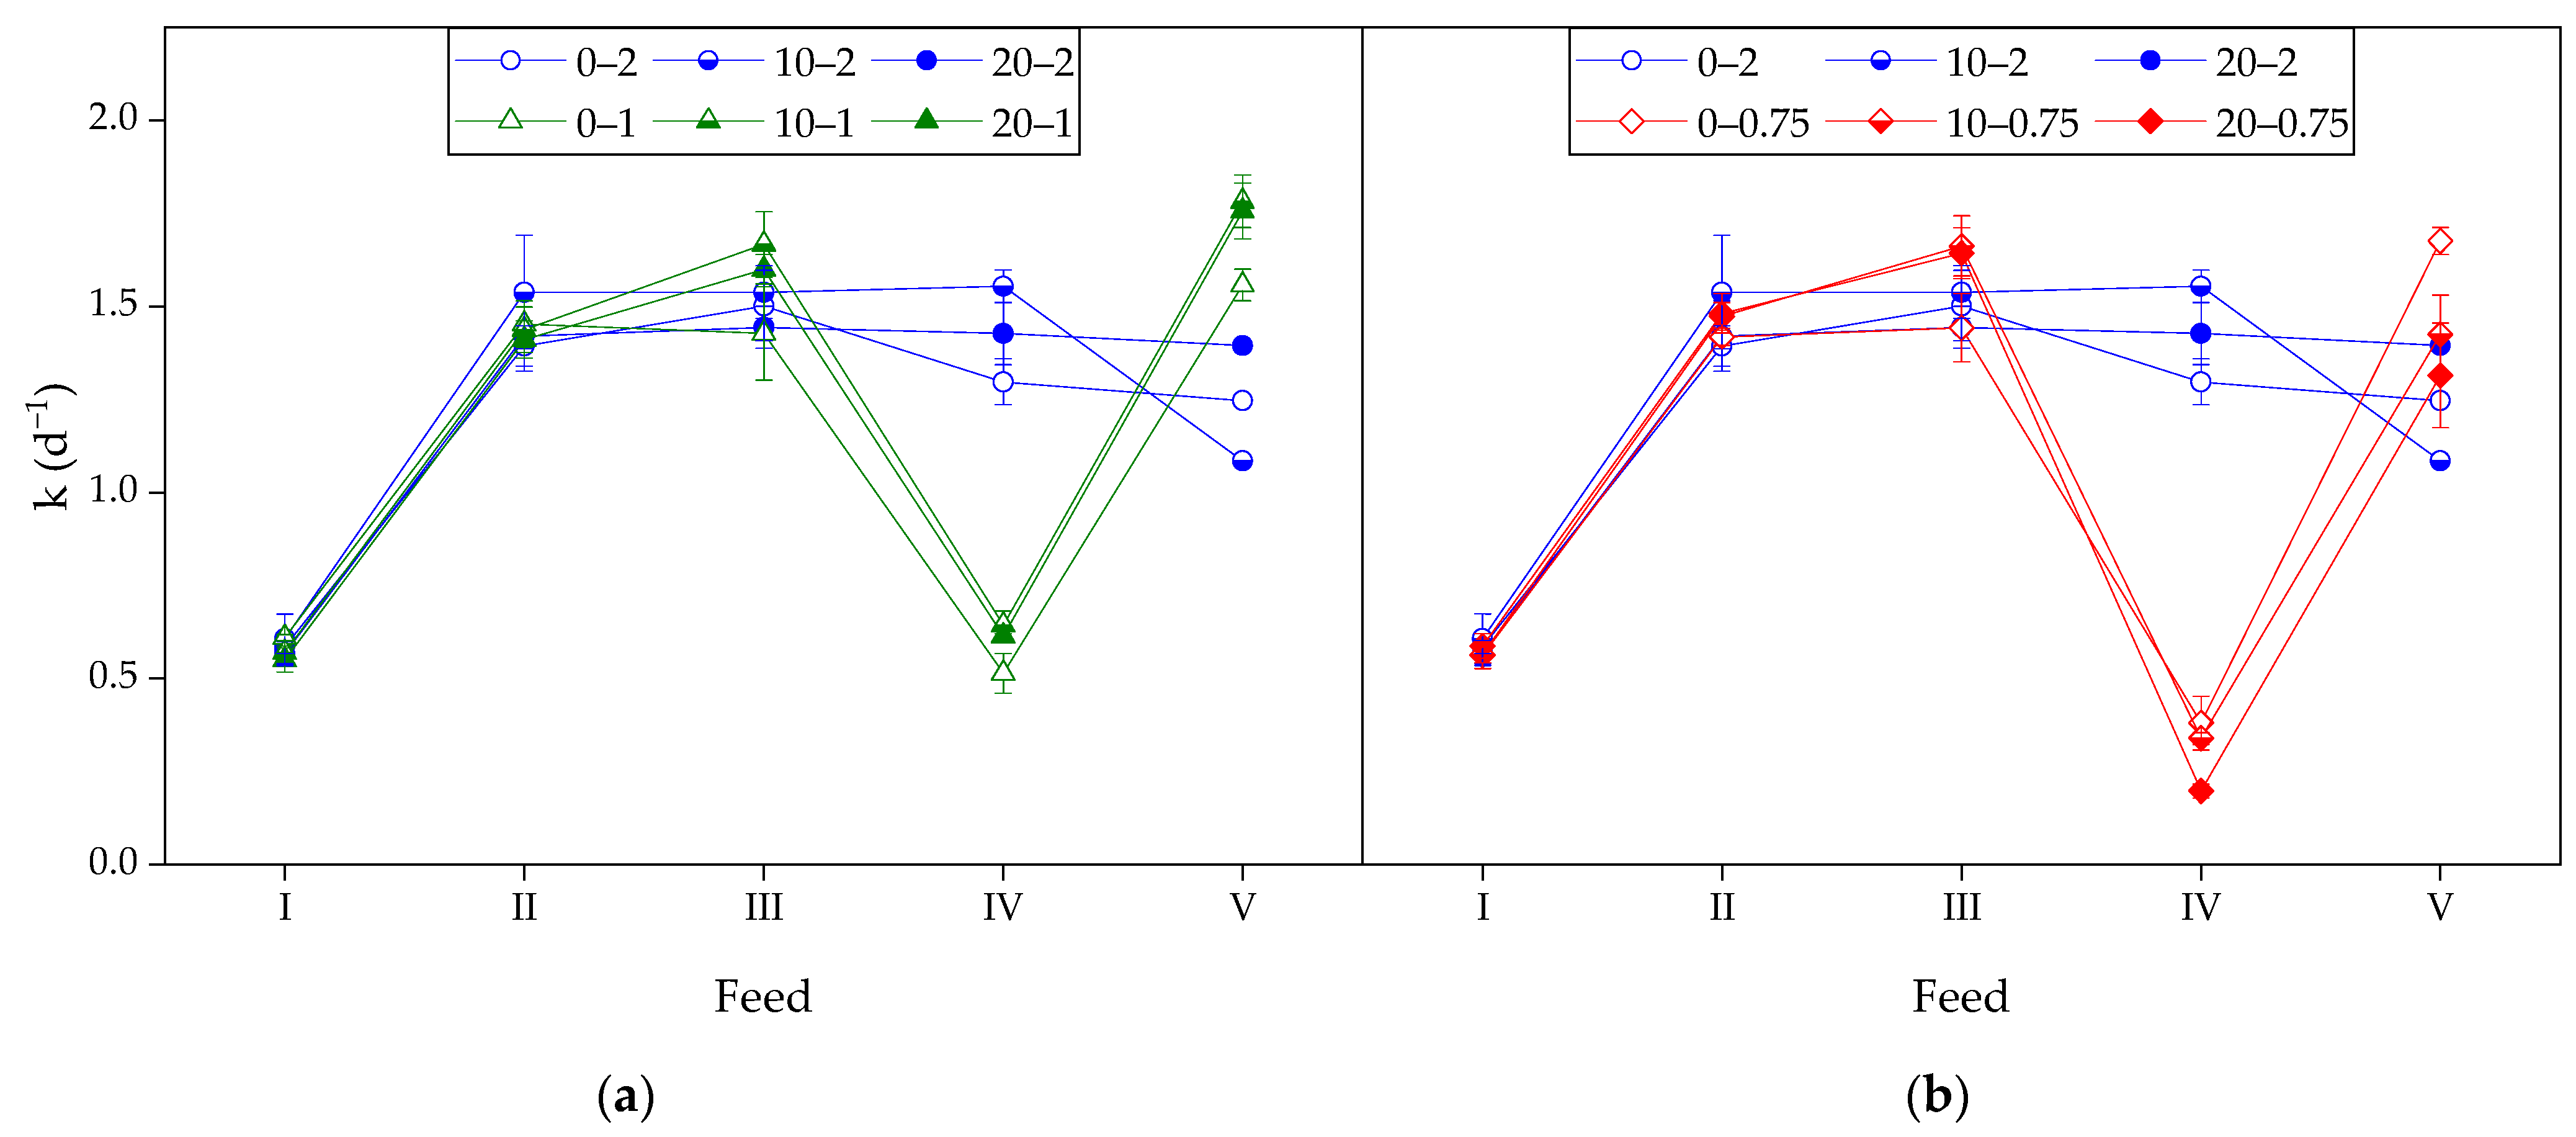
Regardless of the GO level considered during feed I, the kinetic constant was only around 0.55 d−1, two times smaller than in feed II (ca. 1.5 d−1) (Figure 5). A potential explanation of such low k values in the first batch test might be a potential ammonia inhibition and the necessary adaptation to the easily degradable substrate [39]. However, for each tested ISR, GO presence significantly improved k from feed III on (Table A4), confirming findings from a similar previous study [16]. At feed IV, the dosage of a higher amount of substrate caused the kinetic constants to drop to 0.51–0.61 d−1 for an ISR of 1 and 0.20–0.34 d−1 for an ISR of 0.75. Meanwhile, k values for ISR of 2 kept similar to feed III with values ranging from 1.30–1.55 d−1. Remarkably, the enhanced kinetics due to GO addition were preserved even after the loading shock (feed IV) for assays with an ISR of 1. Conditions 10–1 and 20–1 during feed V achieved values of 1.78 d−1 and 1.76 d−1, significantly higher than 0–1 (1.56 d−1). However, the same behavior was not observed for the ISR of 0.75. The assay 0–0.75 achieved a k value of 1.67 d−1, significantly higher than 1.43 d−1 and 1.31 d−1 of conditions 10–0.75 and 20–0.75, respectively (Table A5).
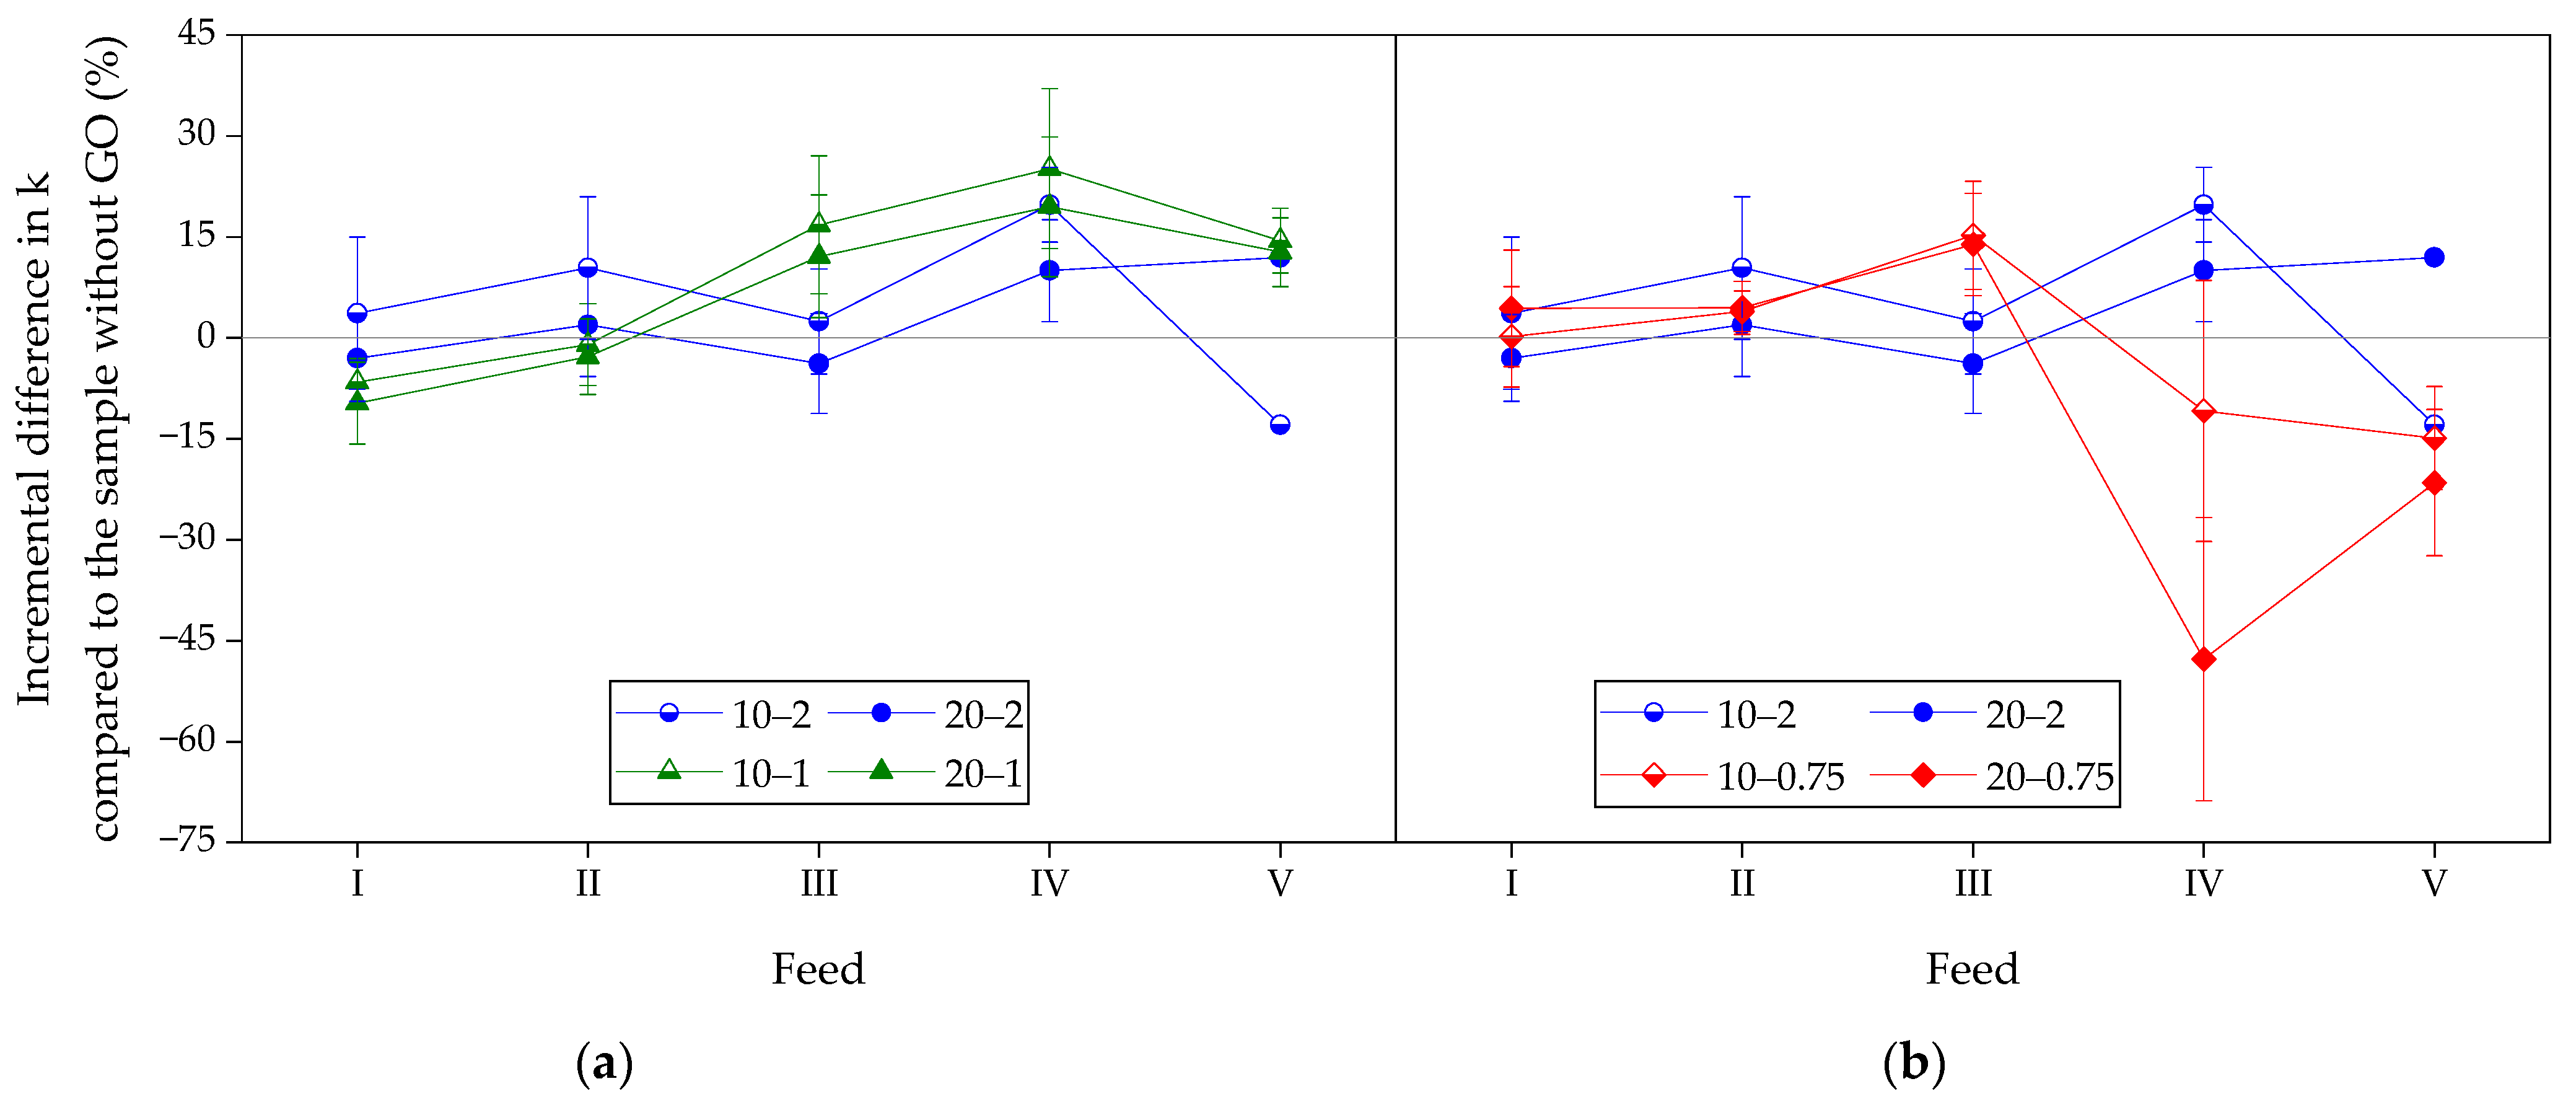
In Figure 6, a relative increase in the kinetic constant k for GO-amended conditions compared to controls can be seen from feed III. During feed IV, where ISRs of 1 and 0.75 were applied, the impact of the increased substrate availability differed for the two ratios. For ISR 1 (Figure 6a), the faster kinetics for conditions 10–1 and 20–1 were preserved both during the failure phase (feed IV) with k values of 25% and 20% higher than 0–1, respectively, and during the recovery phase (feed V) with k values of 14% and 13% higher than 0–1, respectively. On the other hand, for an ISR of 0.75, the first-order rate constants were consistently smaller than the control without GO (0–0.75) during both feeds IV and V. Conditions 10–0.75 and 20–0.75 achieved −11% and −48%, respectively, during feed IV, and −14% and −22%, respectively, during feed V.
3.3. Impact of GO and ISRs on the pH and FOS/TAC
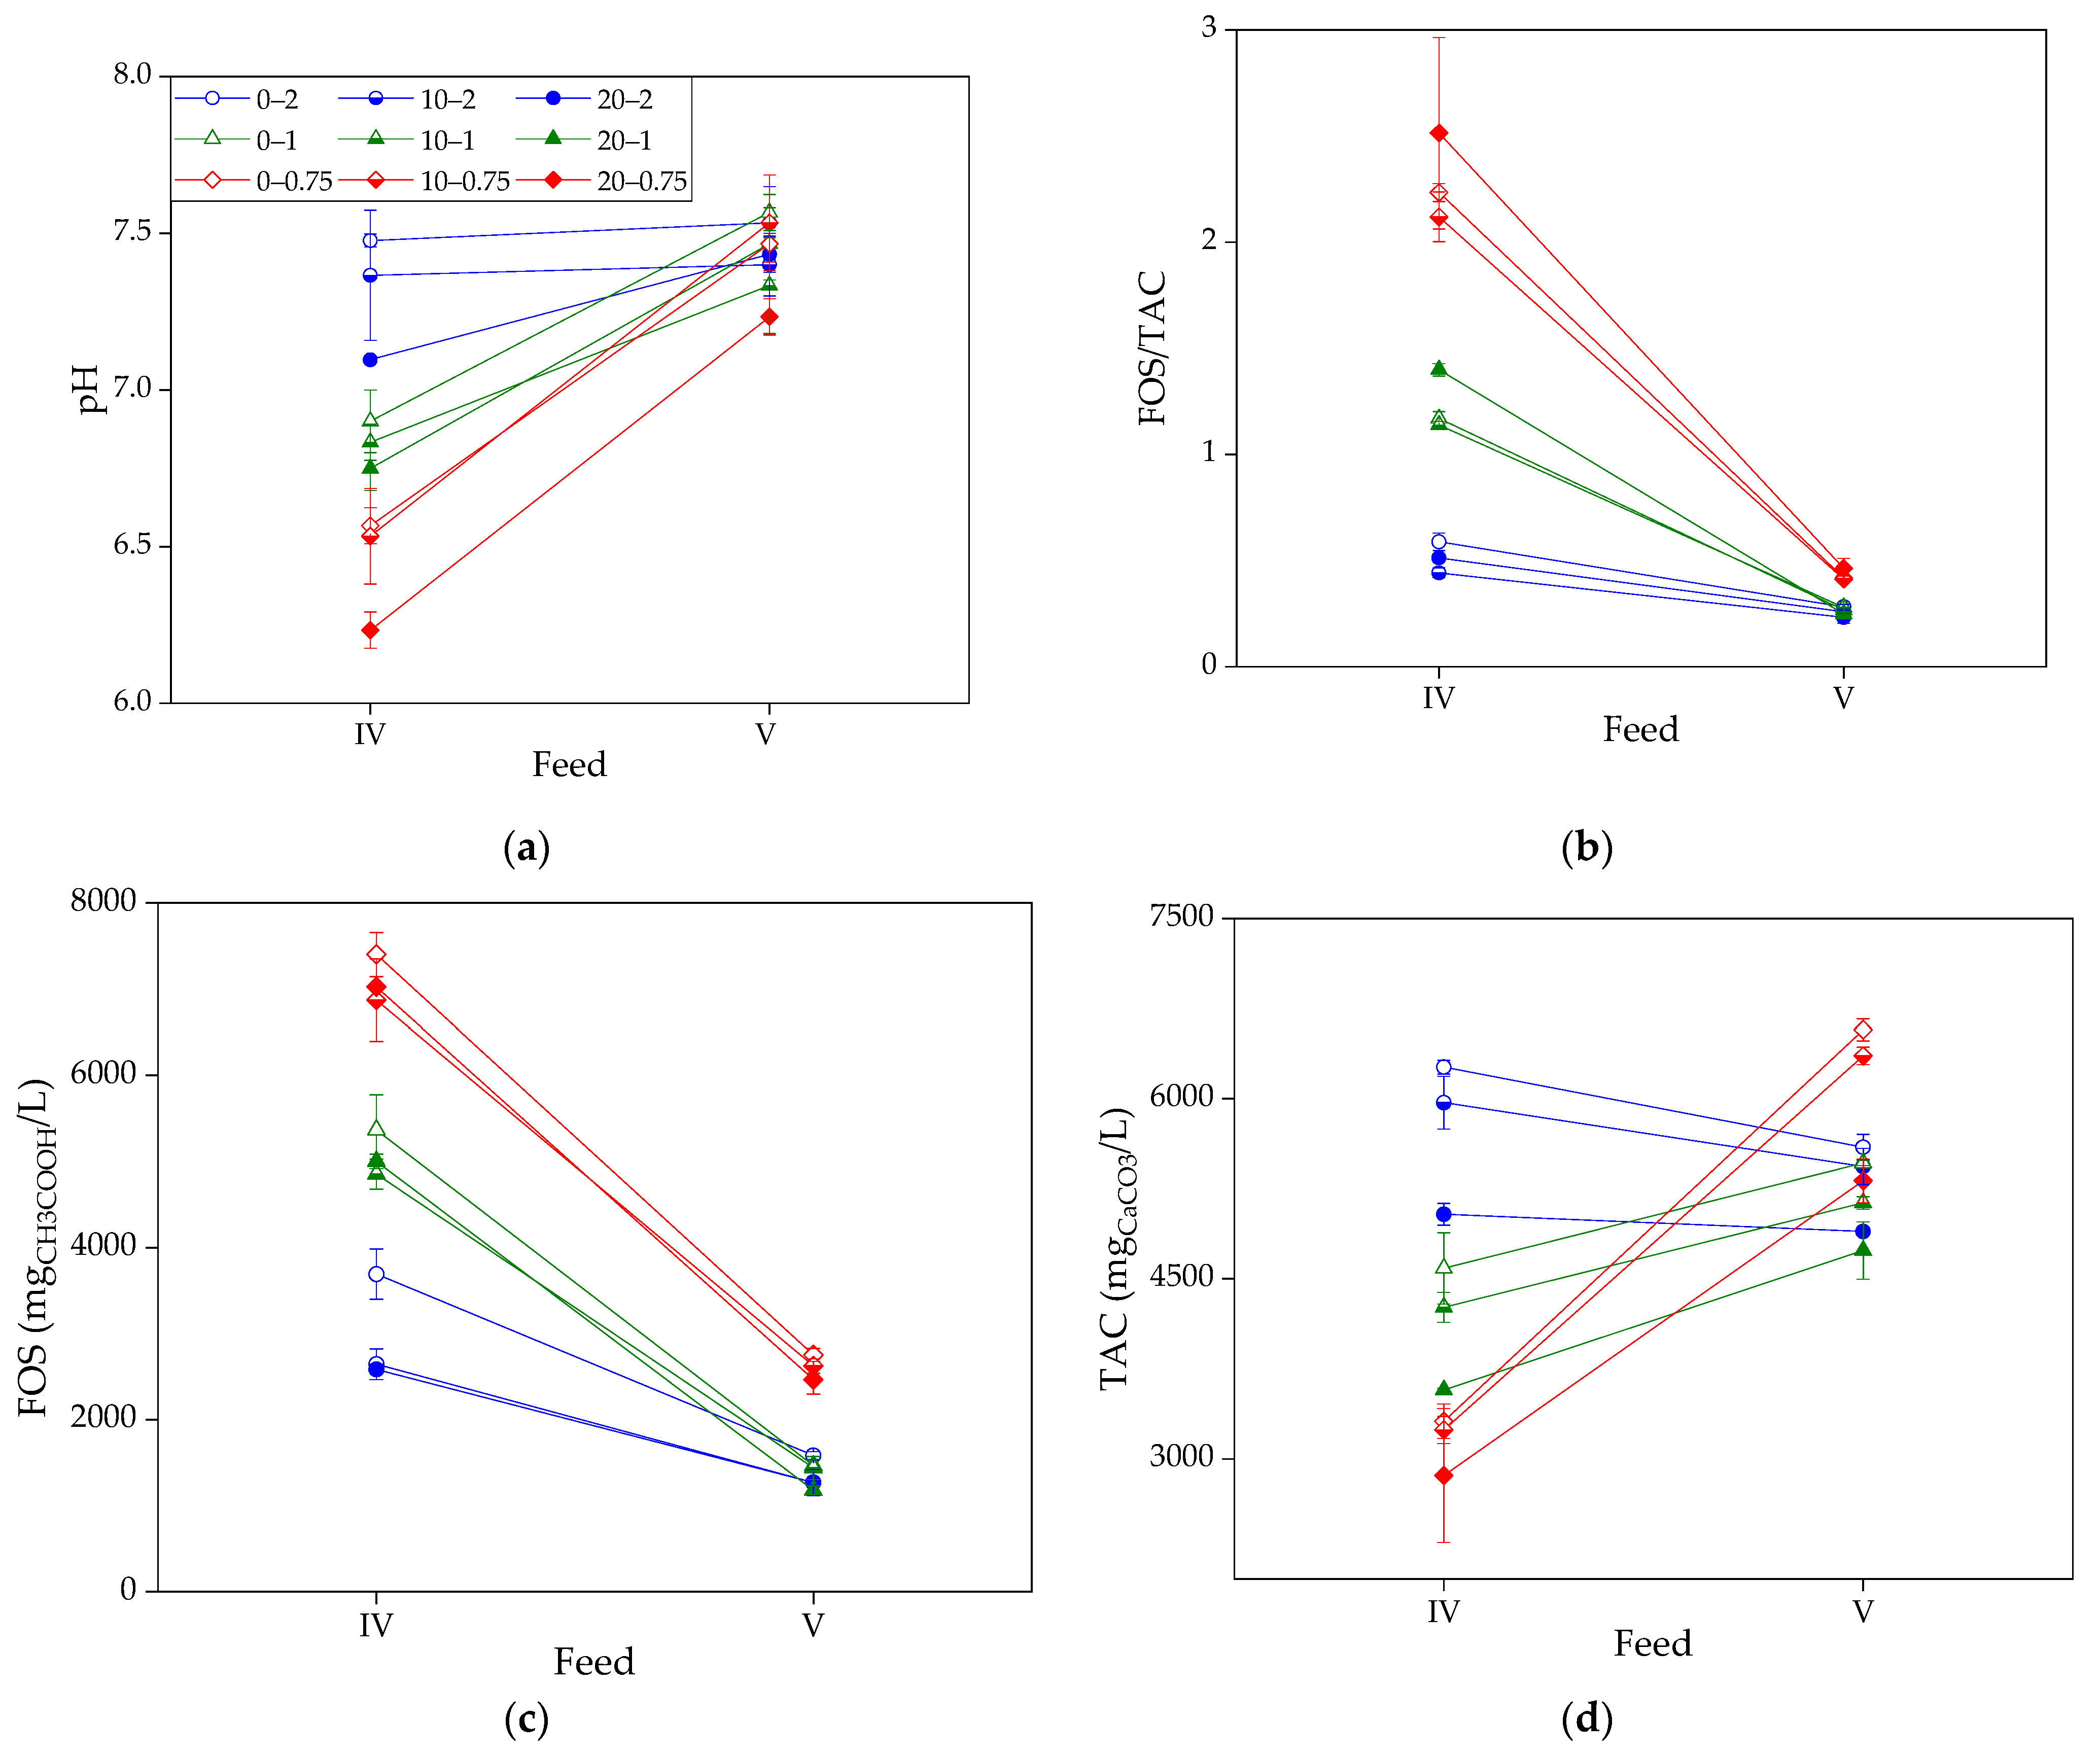
pH and FOS/TAC measurements were also carried out in this study to gain further insight into the reactor stability during (and after) the overloading phase. As described in Figure 7a, at day 2 of the failure phase (feed IV), the lower the ISR applied, the lower the pH values due to the higher VFA concentration present. Interestingly, GO presence affected the pH values, too.
The addition of GO (pH of ca. 2.2) caused a long-term impact on the pH, resulting in significantly lower values than in control assays (i.e., without GO) (Table A6). In fact, pH values remained lower for GO-amended assays even after four feeds. Nonetheless, at the end of feed V, all conditions, except 20–0.75 (pH of 7.2), exhibited no significant difference in their pH values, ranging from 7.3–7.5 (Table A7).
Moreover, a GO concentration of up to 20 mgGO/gVS had no impact on the FOS/TAC, as the three-way ANOVA revealed no significant differences (Table A8). However, it should be highlighted that the FOS/TAC is an indirect estimation of the alkalinity ratio carried out through titration. Since the GO-amended assays had a lower pH, a lower starting pH meant a lower TAC value (Figure 7d) and a higher FOS for the control (no GO) (Figure 7c). The GO addition might consequently help in the VFA degradation, which often becomes the rate-limiting step in AD after applying a high organic loading (low ISR) with an easily degradable substrate [40]. This would finally also link back to the observed higher k values, which—in this case with glucose as substrate—were not reflecting the hydrolysis as the rate-limiting step but rather the VFA degradation.
4. Discussion
Previous studies have already reported the more efficient conversion of VFA and the faster kinetics owing to the presence of carbon-based materials in overloaded batch assays. For example, Wang et al. [8] used biochar at 20 g/L to recover a severely acidified AD system. They observed that biochar addition was helpful for a more rapid methanogenesis recovery due to DIET. Similarly, the GO added in this investigation may allow the same DIET capabilities as the faster VFA degradation could be observed indirectly through the FOS/TAC measurements. However, compared to Wang et al., who used 1.53 gbiochar/gVS, in this study, only 10 to 20 mgGO/gVS were used. Therefore, GO addition may bring the beneficial effects of carbon-based material in DIET establishment already at significantly smaller concentrations.
Gökçek et al. [19] adopted similar concentrations of 0, 10, 20, and 30 mg/L (i.e., 0, 1, 2, and 3 mg/gVS), but of already reduced GO (RGO). Adding RGO had a beneficial effect, leading to higher and faster methane production in overloaded anaerobic digesters. Still, the use of GO (and its consequent biologically reduced form), as in the present study, seems to be preferred over RGO in terms of its production effort [41]. In contrast to the biological reduction of GO, the reduction of GO to RGO entails the use of physical (thermal energy), chemical (strong oxidant), or their combination (photochemical) methods [42].
One aspect that requires attention is the long-lasting acidifying effect due to the GO addition observed. Although no significant differences were noticed among the average pH values of each condition at the end of feed V (except for 20–0.75), during the AD process (day 2 of feed IV), those differences were amplified and became significant (even for an ISR of 2, Figure 7a). Low pH values can severely inhibit the process. However, the lower pH may even represent a silver lining in adopting GO as an additive. A lower pH (caused by the GO presence) shifts the equilibrium from inhibiting ammonia to ammonium (NH4+). In fact, the high ammonia concentrations found in typical anaerobic digesters were reported to cause a prolonged inhibition role in the AD process [43,44]. This condition is generally referred to in the literature as “inhibited steady state conditions” [45]. Thus, the system may benefit from the presence of GO due to the lowered pH. Future investigations should, therefore, also focus on the impact of GO on the ammonia concentration in the AD system.
Similarly, a closer inspection is needed to understand the VFA distribution. Previous studies suggested the critical role of propionate acid in anaerobic reactors supplemented with nanomaterial (i.e., nano-zero valent iron-modified biochar) [46]. The analysis of AD intermediates combined with 16sRNA gene sequencing could be decisive in clearly assessing the contribution of GO (or bioRGO) toward DIET in engineered nanosystems.
5. Conclusions
The impact of GO addition (0, 10, and 20 mgGO/gVS) in overloaded anaerobic reactors (ISRs of 2, 1, and 0.75 based on VSinoculum) was studied. The results showed that the addition of low GO amounts contributed to the acceleration of degradation kinetics obtained from the first-order model under standard operation conditions (i.e., an ISR of 2). Moreover, during and after an overloading situation (lower ISR), the kinetic constant k ended up at similar values as the control (no GO) or even above. Overall, this study contributed to the area of recovering acidified AD processes using novel carbon-based nanomaterials as additives.
Author Contributions
Conceptualization, M.P. and K.K.; methodology, M.P.; validation, M.P.; formal analysis, M.P.; investigation, H.N.; resources, K.K. and J.E.D.; data curation, M.P. and H.N.; writing—original draft preparation, M.P.; writing—review and editing, K.K. and J.E.D.; visualization, M.P.; supervision, K.K. and J.E.D.; funding acquisition, J.E.D. All authors have read and agreed to the published version of the manuscript.
Funding
This research was funded by the European Union’s Horizon 2020 research and innovation programme under the Marie Skłodowska-Curie grant agreement—MSCA-ITN-2018 (EJD Nowelties, grant number 812880).
Institutional Review Board Statement
Not applicable.
Informed Consent Statement
Not applicable.
Data Availability Statement
The data presented in this study are available on request from the corresponding author.
Conflicts of Interest
The authors declare no conflict of interest.
Appendix A

Table A1.
Experimental and first-order model methane production and kinetic constants. The relative root mean square error (rRSME) and the coefficient of determination (R2) are also reported. Five replicates (n = 5) were used to determine the standard deviations, if not indicated differently (†: n = 4, ‡: n = 3, ″: n = 2, *: n = 1).
| Experimental | Model | |||||
|---|---|---|---|---|---|---|
| Feed | BMP (mLCH4/gVS) | B∞ (mLCH4/gVS) | k (d−1) | rRSME (%) | R2 | |
| I | 357 ± 8 | 372 ± 0.0 | 0.59 ± 0.02 | 6.8 ± 0.5 | 0.97 ± 0.00 | |
| II † | 310 ± 7 | 311 ± 7 | 1.39 ± 0.05 | 3.1 ± 0.4 | 0.99 ± 0.00 | |
| 0–2 | III ‡ | 328 ± 12 | 327 ± 12 | 1.50 ± 0.09 | 2.2 ± 0.1 | 0.99 ± 0.00 |
| IV † | 309 ± 5 | 309 ± 3 | 1.30 ± 0.06 | 3.1 ± 0.4 | 0.99 ± 0.00 | |
| V * | 341 | 342 | 1.25 | 2.8 | 0.99 | |
| I | 343 ± 20 | 365 ± 12 | 0.61 ± 0.07 | 6.9 ± 0.8 | 0.97 ± 0.01 | |
| II | 312 ± 37 | 313 ± 34 | 1.54 ± 0.15 | 3.5 ± 0.5 | 0.98 ± 0.00 | |
| 10–2 | III | 314 ± 10 | 311 ± 9 | 1.54 ± 0.07 | 2.3 ± 0.1 | 0.99 ± 0.00 |
| IV † | 309 ± 4 | 309 ± 3 | 1.55 ± 0.04 | 2.7 ± 0.2 | 0.99 ± 0.00 | |
| V * | 332 | 322 | 1.09 | 4.6 | 0.96 | |
| I | 326 ± 15 | 355 ± 13 | 0.57 ± 0.03 | 6.4 ± 0.2 | 0.98 ± 0.00 | |
| II | 296 ± 13 | 298 ± 13 | 1.42 ± 0.09 | 3.4 ± 0.2 | 0.98 ± 0.00 | |
| 20–2 | III ‡ | 309 ± 6 | 304 ± 6 | 1.44 ± 0.06 | 2.4 ± 0.3 | 0.99 ± 0.00 |
| IV † | 322 ± 7 | 322 ± 7 | 1.43 ± 0.08 | 2.7 ± 0.2 | 0.99 ± 0.00 | |
| V * | 305 | 302 | 1.39 | 1.9 | 0.99 | |
| I † | 358 ± 6 | 372 ± 0 | 0.61 ± 0.01 | 7.0 ± 0.4 | 0.97 ± 0.00 | |
| II | 310 ± 7 | 311 ± 7 | 1.45 ± 0.06 | 3.3 ± 0.1 | 0.98 ± 0.00 | |
| 0–1 | III | 313 ± 11 | 315 ± 9 | 1.43 ± 0.13 | 3.4 ± 0.4 | 0.98 ± 0.00 |
| IV ‡ | 312 ± 9 | 348 ± 18 | 0.51 ± 0.05 | 7.0 ± 0.5 | 0.97 ± 0.01 | |
| V ‡ | 343 ± 14 | 336 ± 15 | 1.56 ± 0.04 | 2.7 ± 0.4 | 0.98 ± 0.01 | |
| I † | 335 ± 4 | 365 ± 6 | 0.57 ± 0.02 | 6.5 ± 0.2 | 0.97 ± 0.00 | |
| II | 298 ± 7 | 301 ± 6 | 1.44 ± 0.06 | 3.7 ± 0.1 | 0.98 ± 0.00 | |
| 10–1 | III | 301 ± 6 | 301 ± 6 | 1.67 ± 0.09 | 2.5 ± 0.2 | 0.99 ± 0.00 |
| IV † | 316 ± 7 | 336 ± 8 | 0.64 ± 0.04 | 6.2 ± 0.2 | 0.97 ± 0.00 | |
| V ″ | 332 ± 0 | 331 ± 1 | 1.78 ± 0.07 | 1.7 ± 0.0 | 0.99 ± 0.00 | |
| I | 326 ± 12 | 358 ± 9 | 0.55 ± 0.03 | 6.5 ± 0.1 | 0.97 ± 0.00 | |
| II † | 307 ± 3 | 308 ± 4 | 1.41 ± 0.05 | 3.7 ± 0.0 | 0.98 ± 0.00 | |
| 20–1 | III † | 310 ± 10 | 308 ± 9 | 1.60 ± 0.04 | 2.3 ± 0.1 | 0.99 ± 0.00 |
| IV † | 307 ± 8 | 331 ± 9 | 0.61 ± 0.01 | 6.8 ± 0.1 | 0.96 ± 0.00 | |
| V † | 335 ± 9 | 332 ± 8 | 1.76 ± 0.08 | 1.8 ± 0.2 | 0.99 ± 0.00 | |
| I | 350 ± 8 | 372 ± 0 | 0.56 ± 0.04 | 6.5 ± 0.5 | 0.98 ± 0.00 | |
| II † | 300 ± 9 | 302 ± 7 | 1.42 ± 0.02 | 3.4 ± 0.2 | 0.98 ± 0.00 | |
| 0–0.75 | III | 307 ± 15 | 307 ± 13 | 1.44 ± 0.09 | 3.2 ± 0.3 | 0.98 ± 0.00 |
| IV ‡ | 337 ± 13 | 358 ± 24 | 0.38 ± 0.07 | 11.6 ± 2.4 | 0.91 ± 0.06 | |
| V ″ | 339 ± 5 | 323 ± 9 | 1.68 ± 0.04 | 3.5 ± 0.4 | 0.97 ± 0.01 | |
| I † | 332 ± 4 | 364 ± 5 | 0.56 ± 0.02 | 6.4 ± 0.2 | 0.98 ± 0.00 | |
| II | 303 ± 6 | 305 ± 6 | 1.47 ± 0.04 | 3.5 ± 0.1 | 0.98 ± 0.00 | |
| 10–0.75 | III ‡ | 305 ± 5 | 305 ± 4 | 1.66 ± 0.08 | 2.5 ± 0.2 | 0.99 ± 0.00 |
| IV ‡ | 325 ± 19 | 372 ± 0 | 0.34 ± 0.02 | 10.7 ± 2.5 | 0.93 ± 0.04 | |
| V ″ | 338 ± 43 | 329 ± 37 | 1.43 ± 0.10 | 4.1 ± 0.5 | 0.97 ± 0.01 | |
| I | 318 ± 11 | 346 ± 12 | 0.59 ± 0.03 | 6.5 ± 0.1 | 0.97 ± 0.00 | |
| II | 297 ± 7 | 299 ± 6 | 1.48 ± 0.05 | 3.9 ± 0.3 | 0.98 ± 0.00 | |
| 20–0.75 | III † | 296 ± 5 | 297 ± 6 | 1.64 ± 0.07 | 2.5 ± 0.2 | 0.99 ± 0.00 |
| IV † | 322 ± 13 | 363 ± 11 | 0.20 ± 0.02 | 8.2 ± 1.2 | 0.96 ± 0.01 | |
| V ‡ | 304 ± 14 | 309 ± 15 | 1.31 ± 0.14 | 3.8 ± 0.4 | 0.98 ± 0.00 | |
Table A2.
Overall three-way ANOVA for the ultimate methane yield B∞ from Origin 2021.
| Degree of Freedom | Sum of Squares | Mean Square | F-Value | P-Value | |
|---|---|---|---|---|---|
| GO | 2 | 3322.94952 | 1661.47476 | 13.52386 | 4.50341 × 10⁻⁶ |
| ISR | 2 | 1064.13914 | 532.06957 | 4.33087 | 0.01506 |
| Feed | 4 | 91,174.36975 | 22,793.59244 | 185.53243 | 0 |
| GO × ISR | 4 | 1178.02982 | 294.50745 | 2.39719 | 0.05341 |
| GO × ISR | 8 | 1716.566 | 214.57075 | 1.74654 | 0.09335 |
| ISR × Feed | 8 | 16,079.85973 | 2009.98247 | 16.3606 | 1.11022 × 10⁻¹⁶ |
| GO × ISR × Feed | 16 | 2459.69914 | 153.7312 | 1.25132 | 0.23831 |
| Model | 44 | 117,776.90507 | 2676.74784 | 21.78786 | 0 |
| Error | 133 | 16,339.71885 | 122.85503 | 0 | 0 |
| Corrected Total | 177 | 134,116.62393 | 0 | 0 | 0 |
Table A3.
Interactions among the different means of the ultimate methane yield B∞ for each tested condition using the Bonferroni Test in Origin 2021.
Table A3.
Interactions among the different means of the ultimate methane yield B∞ for each tested condition using the Bonferroni Test in Origin 2021.
| GO | ISR | Feed | Mean | Groups 1 | |||||||||||||
|---|---|---|---|---|---|---|---|---|---|---|---|---|---|---|---|---|---|
| 0 | 2 | I | 372 | A | |||||||||||||
| 10 | 0.75 | IV | 372 | A | B | ||||||||||||
| 0 | 1 | I | 372 | A | B | ||||||||||||
| 0 | 0.75 | I | 372 | A | |||||||||||||
| 10 | 2 | I | 365.49403 | A | B | C | |||||||||||
| 10 | 1 | I | 365.2831 | A | B | C | D | ||||||||||
| 10 | 0.75 | I | 364.38624 | A | B | C | D | ||||||||||
| 20 | 0.75 | IV | 362.80431 | A | B | C | D | E | |||||||||
| 0 | 0.75 | IV | 357.98037 | A | B | C | D | E | F | G | |||||||
| 20 | 1 | I | 357.80345 | A | B | C | D | E | F | ||||||||
| 20 | 2 | I | 354.78967 | A | B | C | D | E | F | G | |||||||
| 0 | 1 | IV | 348.03364 | A | B | C | D | E | F | G | H | I | |||||
| 20 | 0.75 | I | 346.30224 | B | C | D | E | F | G | H | |||||||
| 0 | 2 | V | 341.52374 | A | B | C | D | E | F | G | H | I | J | K | L | M | |
| 10 | 1 | IV | 336.44378 | E | F | G | H | I | J | ||||||||
| 0 | 1 | V | 336.35243 | C | D | E | F | G | H | I | J | K | |||||
| 20 | 1 | V | 332.35585 | F | G | H | I | J | K | L | |||||||
| 10 | 1 | V | 331.35573 | D | E | F | G | H | I | J | K | L | M | ||||
| 20 | 1 | IV | 330.59132 | G | H | I | J | K | L | M | |||||||
| 10 | 0.75 | V | 329.48386 | E | F | G | H | I | J | K | L | M | |||||
| 0 | 2 | III | 327.01213 | G | H | I | J | K | L | M | |||||||
| 0 | 0.75 | V | 322.86852 | G | H | I | J | K | L | M | |||||||
| 20 | 2 | IV | 321.60454 | H | I | J | K | L | M | ||||||||
| 10 | 2 | V | 321.51135 | D | E | F | G | H | I | J | K | L | M | ||||
| 0 | 1 | III | 314.63418 | J | K | L | M | ||||||||||
| 10 | 2 | II | 312.60576 | J | K | L | M | ||||||||||
| 10 | 2 | III | 311.38966 | J | K | L | M | ||||||||||
| 0 | 2 | II | 311.22019 | J | K | L | M | ||||||||||
| 0 | 1 | II | 310.8593 | K | L | M | |||||||||||
| 0 | 2 | IV | 309.38486 | K | L | M | |||||||||||
| 10 | 2 | IV | 309.24517 | K | L | M | |||||||||||
| 20 | 0.75 | V | 308.61859 | J | K | L | M | ||||||||||
| 20 | 1 | II | 308.43098 | K | L | M | |||||||||||
| 20 | 1 | III | 307.59806 | K | L | M | N | ||||||||||
| 0 | 0.75 | III | 307.12533 | K | L | M | N | ||||||||||
| 10 | 0.75 | III | 305.35254 | L | M | N | |||||||||||
| 10 | 0.75 | II | 305.2529 | M | N | ||||||||||||
| 20 | 2 | III | 304.43436 | K | L | M | N | ||||||||||
| 0 | 0.75 | II | 302.11482 | N | |||||||||||||
| 20 | 2 | V | 302.09481 | I | J | K | L | M | N | ||||||||
| 10 | 1 | III | 301.37282 | N | |||||||||||||
| 10 | 1 | II | 300.9247 | N | |||||||||||||
| 20 | 0.75 | II | 299.23791 | N | |||||||||||||
| 20 | 2 | II | 297.96662 | N | |||||||||||||
| 20 | 0.75 | III | 296.77677 | N | |||||||||||||
1 Means that do not share a letter are significantly different (p < 0.05).
Table A4.
Overall three-way ANOVA for first-order rate constant k from Origin 2021.
| Degree of Freedom | Sum of Squares | Mean Square | F-Value | P-Value | |
|---|---|---|---|---|---|
| GO | 2 | 0.0731 | 0.03655 | 8.26117 | 4.15125 × 10⁻⁴ |
| ISR | 2 | 0.6221 | 0.31105 | 70.30133 | 0 |
| Feed | 4 | 29.3895 | 7.34737 | 1660.59201 | 0 |
| GO × ISR | 4 | 0.0922 | 0.02305 | 5.20979 | 6.25952 × 10⁻⁴ |
| GO × ISR | 8 | 0.17166 | 0.02146 | 4.84958 | 2.92017 × 10⁻⁵ |
| ISR × Feed | 8 | 7.62922 | 0.95365 | 215.53665 | 0 |
| GO × ISR × Feed | 16 | 0.52437 | 0.03277 | 7.40709 | 3.95861 × 10⁻¹² |
| Model | 44 | 40.45992 | 0.91954 | 207.82758 | 0 |
| Error | 133 | 0.58847 | 0.00442 | 0 | 0 |
| Corrected Total | 177 | 41.04839 | 0 | 0 | 0 |
Table A5.
Interactions among the different means of the first-order rate constant k for each tested condition using the Bonferroni Test in Origin 2021.
Table A5.
Interactions among the different means of the first-order rate constant k for each tested condition using the Bonferroni Test in Origin 2021.
| GO | ISR | Feed | Mean | Groups 1 | ||||||||||||
|---|---|---|---|---|---|---|---|---|---|---|---|---|---|---|---|---|
| 10 | 1 | V | 1.78214 | A | ||||||||||||
| 20 | 1 | V | 1.75578 | A | ||||||||||||
| 0 | 0.75 | V | 1.67514 | A | B | C | D | |||||||||
| 10 | 1 | III | 1.66651 | A | B | |||||||||||
| 10 | 0.75 | III | 1.66212 | A | B | C | ||||||||||
| 20 | 0.75 | III | 1.64238 | A | B | C | ||||||||||
| 20 | 1 | III | 1.59969 | A | B | C | D | E | ||||||||
| 0 | 1 | V | 1.55734 | B | C | D | E | F | ||||||||
| 10 | 2 | IV | 1.55423 | B | C | D | E | F | ||||||||
| 10 | 2 | II | 1.53805 | B | C | D | E | F | ||||||||
| 10 | 2 | III | 1.53783 | B | C | D | E | F | ||||||||
| 0 | 2 | III | 1.5013 | B | C | D | E | F | G | |||||||
| 20 | 0.75 | II | 1.48066 | D | E | F | G | |||||||||
| 10 | 0.75 | II | 1.4734 | E | F | G | ||||||||||
| 0 | 1 | II | 1.4519 | E | F | G | ||||||||||
| 20 | 2 | III | 1.44388 | E | F | G | H | |||||||||
| 0 | 0.75 | III | 1.44227 | E | F | G | H | |||||||||
| 10 | 1 | II | 1.43713 | F | G | H | ||||||||||
| 20 | 2 | IV | 1.42697 | F | G | H | ||||||||||
| 0 | 1 | III | 1.42685 | F | G | H | ||||||||||
| 10 | 0.75 | V | 1.42535 | E | F | G | H | |||||||||
| 20 | 2 | II | 1.42017 | F | G | H | ||||||||||
| 0 | 0.75 | II | 1.41745 | F | G | H | ||||||||||
| 20 | 1 | II | 1.41093 | F | G | H | ||||||||||
| 20 | 2 | V | 1.39474 | C | D | E | F | G | H | I | ||||||
| 0 | 2 | II | 1.39305 | F | G | H | ||||||||||
| 20 | 0.75 | V | 1.3145 | G | H | I | ||||||||||
| 0 | 2 | IV | 1.29726 | H | I | |||||||||||
| 0 | 2 | V | 1.2461 | G | H | I | ||||||||||
| 10 | 2 | V | 1.08528 | I | ||||||||||||
| 10 | 1 | IV | 0.6439 | J | ||||||||||||
| 20 | 1 | IV | 0.61478 | J | ||||||||||||
| 0 | 1 | I | 0.61027 | J | ||||||||||||
| 10 | 2 | I | 0.60686 | J | ||||||||||||
| 20 | 0.75 | I | 0.58751 | J | ||||||||||||
| 0 | 2 | I | 0.58549 | J | ||||||||||||
| 10 | 1 | I | 0.57035 | J | ||||||||||||
| 20 | 2 | I | 0.56792 | J | ||||||||||||
| 10 | 0.75 | I | 0.56385 | J | K | |||||||||||
| 0 | 0.75 | I | 0.56294 | J | ||||||||||||
| 20 | 1 | I | 0.55091 | J | K | |||||||||||
| 0 | 1 | IV | 0.51446 | J | K | L | ||||||||||
| 0 | 0.75 | IV | 0.38066 | K | L | M | ||||||||||
| 10 | 0.75 | IV | 0.33926 | L | M | |||||||||||
| 20 | 0.75 | IV | 0.19877 | M | ||||||||||||
1 Means that do not share a letter are significantly different (p < 0.05).
Table A6.
Overall three-way ANOVA for pH values for the two measures carried out at feed IV (day 2) and feed V (end of experiment) from Origin 2021.
Table A6.
Overall three-way ANOVA for pH values for the two measures carried out at feed IV (day 2) and feed V (end of experiment) from Origin 2021.
| Degree of Freedom | Sum of Squares | Mean Square | F-Value | P-Value | |
|---|---|---|---|---|---|
| GO | 2 | 0.40782 | 0.20391 | 19.18411 | 2.37029 × 10⁻⁶ |
| ISR | 2 | 1.87881 | 0.9394 | 88.37931 | 2.08722 × 10⁻¹⁴ |
| Feed | 1 | 4.40231 | 4.40231 | 414.17052 | 0 |
| GO × ISR | 4 | 0.15565 | 0.03891 | 3.66091 | 0.01359 |
| GO × ISR | 2 | 0.07318 | 0.03659 | 3.44241 | 0.04317 |
| ISR × Feed | 2 | 1.54419 | 0.7721 | 72.63908 | 3.48499 × 10⁻¹³ |
| GO × ISR × Feed | 4 | 0.05673 | 0.01418 | 1.33425 | 0.27664 |
| Model | 17 | 8.51014 | 0.5006 | 47.09625 | 0 |
| Error | 35 | 0.37202 | 0.01063 | 0 | 0 |
| Corrected Total | 52 | 8.88216 | 0 | 0 | 0 |
Table A7.
Interactions among the different means of pH for each tested condition at day 2 of feed IV and end of feed V using the Bonferroni Test in Origin 2021.
Table A7.
Interactions among the different means of pH for each tested condition at day 2 of feed IV and end of feed V using the Bonferroni Test in Origin 2021.
| GO | ISR | Feed | Mean | Groups 1 | |||||||
|---|---|---|---|---|---|---|---|---|---|---|---|
| 0 | 1 | V | 7.56667 | A | |||||||
| 0 | 2 | V | 7.53333 | A | |||||||
| 10 | 0.75 | V | 7.53333 | A | |||||||
| 0 | 2 | IV | 7.477 | A | B | ||||||
| 20 | 1 | V | 7.46667 | A | B | ||||||
| 0 | 0.75 | V | 7.46667 | A | B | ||||||
| 20 | 2 | V | 7.43333 | A | B | ||||||
| 10 | 2 | V | 7.4 | A | B | ||||||
| 10 | 2 | IV | 7.366 | A | B | C | |||||
| 10 | 1 | V | 7.33333 | A | B | C | |||||
| 20 | 0.75 | V | 7.23333 | B | C | ||||||
| 20 | 2 | IV | 7.09667 | C | D | ||||||
| 0 | 1 | IV | 6.9 | D | E | ||||||
| 10 | 1 | IV | 6.83333 | D | E | F | |||||
| 20 | 1 | IV | 6.75 | E | F | G | |||||
| 0 | 0.75 | IV | 6.56667 | F | G | ||||||
| 10 | 0.75 | IV | 6.53333 | G | |||||||
| 20 | 0.75 | IV | 6.23333 | H | |||||||
1 Means that do not share a letter are significantly different (p < 0.05).
Table A8.
Overall three-way ANOVA for FOS/TAC values for the two measures carried out at feed IV (day 2) and feed V (end of experiment) from Origin 2021.
Table A8.
Overall three-way ANOVA for FOS/TAC values for the two measures carried out at feed IV (day 2) and feed V (end of experiment) from Origin 2021.
| Degree of Freedom | Sum of Squares | Mean Square | F-Value | P-Value | |
|---|---|---|---|---|---|
| GO | 2 | 0.06733 | 0.03367 | 1.2821 | 0.30296 |
| ISR | 2 | 4.36054 | 2.18027 | 83.03204 | 1.68535 × 10⁻⁹ |
| Feed | 1 | 7.04736 | 7.04736 | 268.38742 | 7.58316 × 10⁻¹² |
| GO × ISR | 4 | 0.04201 | 0.0105 | 0.39999 | 0.80594 |
| GO × ISR | 2 | 0.06296 | 0.03148 | 1.19881 | 0.3258 |
| ISR × Feed | 2 | 2.88591 | 1.44296 | 54.95272 | 3.79519 × 10⁻⁸ |
| GO × ISR × Feed | 4 | 0.02813 | 0.00703 | 0.26778 | 0.89462 |
| Model | 17 | 21.83052 | 1.28415 | 48.90475 | 4.0153 × 10⁻¹¹ |
| Error | 17 | 0.44639 | 0.02626 | 0 | 0 |
| Corrected Total | 34 | 22.27691 | 0 | 0 | 0 |
Table A9.
Interactions among the different means of FOS/TAC for each tested condition at day 2 of feed IV and end of feed V using the Bonferroni Test in Origin 2021.
Table A9.
Interactions among the different means of FOS/TAC for each tested condition at day 2 of feed IV and end of feed V using the Bonferroni Test in Origin 2021.
| GO | ISR | Feed | Mean | Groups 1 | ||
|---|---|---|---|---|---|---|
| 20 | 0.75 | IV | 2.51326 | A | ||
| 0 | 0.75 | IV | 2.23356 | A | ||
| 10 | 0.75 | IV | 2.11869 | A | ||
| 20 | 1 | IV | 1.39861 | B | ||
| 0 | 1 | IV | 1.1696 | B | ||
| 10 | 1 | IV | 1.13837 | B | ||
| 0 | 2 | IV | 0.58873 | C | ||
| 20 | 2 | IV | 0.51284 | C | ||
| 20 | 0.75 | V | 0.45336 | C | ||
| 10 | 2 | IV | 0.44283 | C | ||
| 10 | 0.75 | V | 0.42239 | C | ||
| 0 | 0.75 | V | 0.41849 | C | ||
| 0 | 2 | V | 0.28229 | C | ||
| 10 | 1 | V | 0.27758 | C | ||
| 0 | 1 | V | 0.26984 | C | ||
| 20 | 2 | V | 0.25132 | C | ||
| 20 | 1 | V | 0.24618 | C | ||
| 10 | 2 | V | 0.23531 | C | ||
1 Means that do not share a letter are significantly different (p < 0.05).
References
- Liebetrau, J.; Rensberg, N.; Maguire, D.; Archer, D.; Wall, D. Renewable Gas–discussion on the state of the industry and its future in a decarbonised world. In IEA Bioenergy Task; Murphy, J.D., Ed.; IEA Bioenergy: Paris, France, 2021; Volume 37, ISBN 9781910154922. [Google Scholar]
- Appels, L.; Baeyens, J.; Degrève, J.; Dewil, R. Principles and Potential of the Anaerobic Digestion of Waste-Activated Sludge. Prog. Energy Combust. Sci. 2008, 34, 755–781. [Google Scholar] [CrossRef]
- Baek, G.; Kim, J.; Kim, J.; Lee, C. Role and Potential of Direct Interspecies Electron Transfer in Anaerobic Digestion. Energies 2018, 11, 107. [Google Scholar] [CrossRef] [Green Version]
- Leng, L.; Yang, P.; Singh, S.; Zhuang, H.; Xu, L.; Chen, W.H.; Dolfing, J.; Li, D.; Zhang, Y.; Zeng, H.; et al. A Review on the Bioenergetics of Anaerobic Microbial Metabolism Close to the Thermodynamic Limits and Its Implications for Digestion Applications. Bioresour. Technol. 2018, 247, 1095–1106. [Google Scholar] [CrossRef]
- Mao, C.; Feng, Y.; Wang, X.; Ren, G. Review on Research Achievements of Biogas from Anaerobic Digestion. Renew. Sustain. Energy Rev. 2015, 45, 540–555. [Google Scholar] [CrossRef]
- Tsui, T.-H.; Zhang, L.; Lim, E.Y.; Lee, J.T.E.; Tong, Y.W. Timing of Biochar Dosage for Anaerobic Digestion Treating Municipal Leachate: Altered Conversion Pathways of Volatile Fatty Acids. Bioresour. Technol. 2021, 335, 125283. [Google Scholar] [CrossRef]
- Zhao, Z.; Li, Y.; Quan, X.; Zhang, Y. Towards Engineering Application: Potential Mechanism for Enhancing Anaerobic Digestion of Complex Organic Waste with Different Types of Conductive Materials. Water Res. 2017, 115, 266–277. [Google Scholar] [CrossRef]
- Wang, G.; Li, Q.; Yuwen, C.; Gong, K.; Sheng, L.; Li, Y.; Xing, Y.; Chen, R. Biochar Triggers Methanogenesis Recovery of a Severely Acidified Anaerobic Digestion System via Hydrogen-Based Syntrophic Pathway Inhibition. Int. J. Hydrogen Energy 2021, 46, 9666–9677. [Google Scholar] [CrossRef]
- Aramrueang, N.; Zhang, R.; Liu, X. Application of Biochar and Alkalis for Recovery of Sour Anaerobic Digesters. J. Environ. Manag. 2022, 307, 114538. [Google Scholar] [CrossRef]
- Zhang, J.; Zhao, W.; Zhang, H.; Wang, Z.; Fan, C.; Zang, L. Recent Achievements in Enhancing Anaerobic Digestion with Carbon- Based Functional Materials. Bioresour. Technol. 2018, 266, 555–567. [Google Scholar] [CrossRef]
- Wang, H.; Yuan, X.; Wu, Y.; Huang, H.; Peng, X.; Zeng, G.; Zhong, H.; Liang, J.; Ren, M.M. Graphene-Based Materials: Fabrication, Characterization and Application for the Decontamination of Wastewater and Wastegas and Hydrogen Storage/Generation. Adv. Colloid Interface Sci. 2013, 195–196, 19–40. [Google Scholar] [CrossRef]
- Pei, S.; Cheng, H.M. The Reduction of Graphene Oxide. Carbon 2012, 50, 3210–3228. [Google Scholar] [CrossRef]
- Salas, E.C.; Sun, Z.; Lüttge, A.; Tour, J.M. Reduction of Graphene Oxide via Bacterial Respiration. ACS Nano 2010, 4, 4852–4856. [Google Scholar] [CrossRef] [PubMed]
- Song, B.; Tang, J.; Zhen, M.; Liu, X. Influence of Graphene Oxide and Biochar on Anaerobic Degradation of Petroleum Hydrocarbons. J. Biosci. Bioeng. 2019, 128, 72–79. [Google Scholar] [CrossRef] [PubMed]
- Basak, B.; Patil, S.M.; Saha, S.; Kurade, M.B.; Ha, G.-S.; Govindwar, S.P.; Lee, S.S.; Chang, S.W.; Chung, W.J.; Jeon, B.-H. Rapid Recovery of Methane Yield in Organic Overloaded-Failed Anaerobic Digesters through Bioaugmentation with Acclimatized Microbial Consortium. Sci. Total Environ. 2021, 764, 144219. [Google Scholar] [CrossRef]
- Ponzelli, M.; Radjenovic, J.; Drewes, J.E.; Koch, K. Enhanced Methane Production Kinetics by Graphene Oxide in Fed-Batch Tests. Bioresour. Technol. 2022, 360, 127642. [Google Scholar] [CrossRef]
- Virdis, B.; Dennis, P.G. The Nanostructure of Microbially-Reduced Graphene Oxide Fosters Thick and Highly-Performing Electrochemically-Active Biofilms. J. Power Sources 2017, 356, 556–565. [Google Scholar] [CrossRef]
- Koch, K.; Hafner, S.; Astals, S.; Weinrich, S. Evaluation of Common Supermarket Products as Positive Controls in Biochemical Methane Potential (BMP) Tests. Water 2020, 12, 1223. [Google Scholar] [CrossRef]
- Gökçek, Ö.B.; Muratçobanoğlu, F.; Muratçobanoğlu, H.; Uçar, D.; Mert, R.A.; Yıldırım, B.; Zan, R.; Demirel, S. The Effect of Reduced Graphene Oxide Addition on Methane Production from Municipal Organic Solid Waste. J. Chem. Technol. Biotechnol. 2021, 96, 2845–2851. [Google Scholar] [CrossRef]
- Rodriguez-Chiang, L.M.; Dahl, O.P. Effect of Inoculum to Substrate Ratio on the Methane Potential of Microcrystalline Cellulose Production Wastewater. BioResources 2015, 10, 898–911. [Google Scholar] [CrossRef]
- Khadka, A.; Parajuli, A.; Dangol, S.; Thapa, B.; Sapkota, L.; Carmona-Martínez, A.A.; Ghimire, A. Effect of the Substrate to Inoculum Ratios on the Kinetics of Biogas Production during the Mesophilic Anaerobic Digestion of Food Waste. Energies 2022, 15, 834. [Google Scholar] [CrossRef]
- Holliger, C.; Alves, M.; Andrade, D.; Angelidaki, I.; Astals, S.; Baier, U.; Bougrier, C.; Buffière, P.; Carballa, M.; De Wilde, V.; et al. Towards a Standardization of Biomethane Potential Tests. Water Sci. Technol. 2016, 74, 2515–2522. [Google Scholar] [CrossRef]
- Holliger, C.; Astals, S.; de Laclos, H.F.; Hafner, S.D.; Koch, K.; Weinrich, S. Towards a Standardization of Biomethane Potential Tests: A Commentary. Water Sci. Technol. 2021, 83, 247–250. [Google Scholar] [CrossRef]
- Baird, R.B.; Eaton, A.D.; Rice, E.W. Standard Methods for the Examination of Water and Wastewater, 23rd ed.; American Public Health Association: Washington, DC, USA, 2017. [Google Scholar]
- Liu, X.; André, L.; Mercier-Huat, M.; Grosmaître, J.M.; Pauss, A.; Ribeiro, T. Accurate Estimation of Bicarbonate and Acetic Acid Concentrations with Wider Ranges in Anaerobic Media Using Classical Fos/Tac Titration Method. Appl. Sci. 2021, 11, 11843. [Google Scholar] [CrossRef]
- Basset, N.; Santos, E.; Dosta, J.; Mata-Álvarez, J. Start-up and Operation of an AnMBR for Winery Wastewater Treatment. Ecol. Eng. 2016, 86, 279–289. [Google Scholar] [CrossRef]
- Drosg, B. Process Monitoring in Biogas Plants Technical Brochure; IEA Bioenergy: Paris, France, 2013; ISBN 978-1-910154-03-8. [Google Scholar]
- Nordmann, W. Die Überwachung der Schlammfaulung. KA-Informationen für das Betriebspersonal. Beil. Zur Korresp. Abwasser 1977, 3, 77. [Google Scholar]
- Linke, B. Kinetic Study of Thermophilic Anaerobic Digestion of Solid Wastes from Potato Processing. Biomass. Bioenerg. 2006, 30, 892–896. [Google Scholar] [CrossRef]
- Veeken, A.; Hamelers, B. Effect of Temperature on Hydrolysis Rates of Selected Biowaste Components. Bioresour. Technol. 1999, 69, 249–254. [Google Scholar] [CrossRef]
- Astals, S.; Batstone, D.J.; Mata-alvarez, J.; Jensen, P.D. Identification of Synergistic Impacts during Anaerobic Co-Digestion of Organic Wastes. Bioresour. Technol. 2014, 169, 421–427. [Google Scholar] [CrossRef] [Green Version]
- Egwu, U.; Oko, E.; Chinenye, M.; Sallis, P. Novel Low-Cost Pre-Treatment Material for Enhancing the Methane Yield during Anaerobic Digestion of Lignocellulosic Biomass Feedstocks: Experimental and Kinetic Study. Renew. Energy 2021, 179, 584–592. [Google Scholar] [CrossRef]
- Angelidaki, I.; Alves, M.; Bolzonella, D.; Borzacconi, L.; Campos, J.L.; Guwy, A.J.; Kalyuzhnyi, S.; Jenicek, P.; Van Lier, J.B. Defining the Biomethane Potential (BMP) of Solid Organic Wastes and Energy Crops: A Proposed Protocol for Batch Assays. Water Sci. Technol. 2009, 59, 927–934. [Google Scholar] [CrossRef] [Green Version]
- Brulé, M.; Oechsner, H.; Jungbluth, T. Exponential Model Describing Methane Production Kinetics in Batch Anaerobic Digestion: A Tool for Evaluation of Biochemical Methane Potential Assays. Bioprocess Biosyst. Eng. 2014, 37, 1759–1770. [Google Scholar] [CrossRef]
- Weinrich, S.; Nelles, M. Basics of Anaerobic Digestion—Biochemical Conversion and Process Modelling; DBFR Deutches Biomasseforschungszentrum gemeinnützige GmbH: Leipzig, Germany, 2021; Volume 40, ISBN 9783946629726. [Google Scholar]
- Ponzelli, M.; Zahedi, S.; Koch, K.; Drewes, J.E.; Radjenovic, J. Rapid Biological Reduction of Graphene Oxide: Impact on Methane Production and Micropollutant Transformation. J. Environ. Chem. Eng. 2022, 10, 108373. [Google Scholar] [CrossRef]
- Bueno-López, J.I.; Nguyen, C.H.; Rangel-Mendez, J.R.; Sierra-Alvarez, R.; Field, J.A.; Cervantes, F.J. Effects of Graphene Oxide and Reduced Graphene Oxide on Acetoclastic, Hydrogenotrophic and Methylotrophic Methanogenesis. Biodegradation 2020, 31, 35–45. [Google Scholar] [CrossRef]
- Yoshida, N.; Miyata, Y.; Doi, K.; Goto, Y.; Nagao, Y.; Tero, R.; Hiraishi, A. Graphene Oxide-Dependent Growth and Self-Aggregation into a Hydrogel Complex of Exoelectrogenic Bacteria. Sci. Rep. 2016, 6, 21867. [Google Scholar] [CrossRef] [PubMed]
- Wang, X.; Lu, X.; Li, F.; Yang, G. Effects of Temperature and Carbon-Nitrogen (C/N) Ratio on the Performance of Anaerobic Co-Digestion of Dairy Manure, Chicken Manure and Rice Straw: Focusing on Ammonia Inhibition. PLoS ONE 2014, 9, e97265. [Google Scholar] [CrossRef] [PubMed] [Green Version]
- Tsigkou, K.; Zagklis, D.; Parasoglou, M.; Zafiri, C.; Kornaros, M. Proposed Protocol for Rate-Limiting Step Determination during Anaerobic Digestion of Complex Substrates. Bioresour. Technol. 2022, 361, 127660. [Google Scholar] [CrossRef]
- De Silva, K.K.H.; Huang, H.H.; Joshi, R.K.; Yoshimura, M. Chemical Reduction of Graphene Oxide Using Green Reductants. Carbon 2017, 119, 190–199. [Google Scholar] [CrossRef]
- Agarwal, V.; Zetterlund, P.B. Strategies for Reduction of Graphene Oxide—A Comprehensive Review. Chem. Eng. J. 2021, 405, 127018. [Google Scholar] [CrossRef]
- Agyeman, F.O.; Han, Y.; Tao, W. Elucidating the Kinetics of Ammonia Inhibition to Anaerobic Digestion through Extended Batch Experiments and Stimulation-Inhibition Modeling. Bioresour. Technol. 2021, 340, 125744. [Google Scholar] [CrossRef]
- Peng, X.; Zhang, S.Y.; Li, L.; Zhao, X.; Ma, Y.; Shi, D. Long-Term High-Solids Anaerobic Digestion of Food Waste: Effects of Ammonia on Process Performance and Microbial Community. Bioresour. Technol. 2018, 262, 148–158. [Google Scholar] [CrossRef]
- Shi, X.; Lin, J.; Zuo, J.; Li, P.; Li, X.; Guo, X. Effects of Free Ammonia on Volatile Fatty Acid Accumulation and Process Performance in the Anaerobic Digestion of Two Typical Bio-Wastes. J. Environ. Sci. 2017, 55, 49–57. [Google Scholar] [CrossRef] [PubMed]
- Lim, E.Y.; Lee, J.T.E.; Zhang, L.; Tian, H.; Ong, K.C.; Tio, Z.K.; Zhang, J.; Tong, Y.W. Abrogating the Inhibitory Effects of Volatile Fatty Acids and Ammonia in Overloaded Food Waste Anaerobic Digesters via the Supplementation of Nano-Zero Valent Iron Modified Biochar. Sci. Total Environ. 2022, 817, 152968. [Google Scholar] [CrossRef] [PubMed]
Figure 1.
Comparison of experimental cumulative methane yield of conditions 0–0.75 (empty dots) and 0–2 (empty squares) during feed IV and their corresponding model-derived values (dashed and solid line, respectively).
Figure 1.
Comparison of experimental cumulative methane yield of conditions 0–0.75 (empty dots) and 0–2 (empty squares) during feed IV and their corresponding model-derived values (dashed and solid line, respectively).

Figure 2.
Average of the ultimate methane yield B∞ obtained from first-order model corresponding to three GO levels (0, 10, and 20 mgGO/gVS), and: (a) conditions with ISRs of 2 and 1; (b) conditions with ISRs of 2 and 0.75. Horizontal dotted lines show the refined validation criterion of 82.1% and 95.4% of the theoretical BMP of glucose (i.e., 372 mLCH4/gVS) according to the validation criteria proposed by Holliger et al. [23]. Error bars represent the standard deviations of replicates (n = 5, where applicable).

Figure 3.
Average incremental difference in the ultimate methane yield B∞ compared to the respective (same ISR) condition without GO for each feed. (a) 10 and 20 mgGO/gVS of ISR 2 and 1 conditions compared with their respective control (0–2 and 0–1); (b) 10 and 20 mgGO/gVS of ISR 2 and 0.75 conditions compared with their respective control (0–2 and 0–0.75). Error bars represent the standard deviations of replicates (n = 5, where applicable).

Figure 4.
Average cumulative methane yield over time for the condition of 20 mgGO/gVS and ISR of 0.75 (applied only at feed IV). Roman numbers indicate the feeding cycle. Error bars represent the standard deviations of replicates (n = 5, where applicable).
Figure 4.
Average cumulative methane yield over time for the condition of 20 mgGO/gVS and ISR of 0.75 (applied only at feed IV). Roman numbers indicate the feeding cycle. Error bars represent the standard deviations of replicates (n = 5, where applicable).

Figure 5.
Average first-order rate constants k obtained from first-order model corresponding to three GO levels (0, 10, and 20 mgGO/gVS), and: (a) conditions with ISRs of 2 and 1; (b) conditions with ISRs of 2 and 0.75. Error bars represent the standard deviations of replicates (n = 5, where applicable).

Figure 6.
Average incremental difference in the first-order rate constant k compared to the respective (same ISR) condition without GO for each feed. Schemes follow another format. (a) 10 and 20 mgGO/gVS of ISR 2 and 1 conditions compared with their respective control (0–2 and 0–1); (b) 10 and 20 mgGO/gVS of ISR 2 and 0.75 conditions compared with their respective control (0–2 and 0–0.75). Error bars represent the standard deviation of replicates (n = 5, where applicable).

Figure 7.
Average values of (a) pH value, (b) FOS/TAC, (c) FOS, and (d) TAC at day 2 of feed IV and the end of feed V. Error bars represent the standard deviations of replicates (n = 3).
Figure 7.
Average values of (a) pH value, (b) FOS/TAC, (c) FOS, and (d) TAC at day 2 of feed IV and the end of feed V. Error bars represent the standard deviations of replicates (n = 3).

Table 1.
Experimental conditions according to the combination of GO and ISR levels.
| ISR | |||
|---|---|---|---|
| GO Concentration (mgGO/gVS) | 2 | 1 | 0.75 |
| 0 | 0–2 | 0–1 | 0–0.75 |
| 10 | 10–2 | 10–1 | 10–0.75 |
| 20 | 20–2 | 20–1 | 20–0.75 |
Disclaimer/Publisher’s Note: The statements, opinions and data contained in all publications are solely those of the individual author(s) and contributor(s) and not of MDPI and/or the editor(s). MDPI and/or the editor(s) disclaim responsibility for any injury to people or property resulting from any ideas, methods, instructions or products referred to in the content. |
© 2023 by the authors. Licensee MDPI, Basel, Switzerland. This article is an open access article distributed under the terms and conditions of the Creative Commons Attribution (CC BY) license (https://creativecommons.org/licenses/by/4.0/).
Share and Cite
MDPI and ACS Style
Ponzelli, M.; Nguyen, H.; Drewes, J.E.; Koch, K. Improved Recovery of Overloaded Anaerobic Batch Reactors by Graphene Oxide. Sustainability 2023, 15, 2224. https://doi.org/10.3390/su15032224
AMA Style
Ponzelli M, Nguyen H, Drewes JE, Koch K. Improved Recovery of Overloaded Anaerobic Batch Reactors by Graphene Oxide. Sustainability. 2023; 15(3):2224. https://doi.org/10.3390/su15032224
Chicago/Turabian StylePonzelli, Michele, Hiep Nguyen, Jörg E. Drewes, and Konrad Koch. 2023. "Improved Recovery of Overloaded Anaerobic Batch Reactors by Graphene Oxide" Sustainability 15, no. 3: 2224. https://doi.org/10.3390/su15032224
Note that from the first issue of 2016, this journal uses article numbers instead of page numbers. See further details here.