

Spatial Inequalities in Access to Micromobility Services: An Analysis of Moped-Style Scooter Sharing Systems in Barcelona


1
Barcelona Institute for Regional and Metropolitan Studies, Autonomous University of Barcelona (UAB), 08193 Bellaterra, Spain
2
Research Group on Mobility, Transportation and Territory (GEMOTT), Department of Geography, Autonomous University of Barcelona (UAB), 08193 Bellaterra, Spain
3
Institute of Environmental Science and Technology (ICTA), Autonomous University of Barcelona (UAB), 08193 Bellaterra, Spain
*
Author to whom correspondence should be addressed.
Sustainability 2023, 15(3), 2096; https://doi.org/10.3390/su15032096
Submission received: 28 November 2022
/
Revised: 12 January 2023
/
Accepted: 20 January 2023
/
Published: 22 January 2023
(This article belongs to the Topic Emerging Technologies, Law and Policies)
Abstract
:Micromobility services hold substantial potential in terms of promoting shared and electric-powered mobility modes, however, little is known about their accessibility and what shapes their spatial coverage. These two issues are important to understand how socially equitable these modes can really be and how public policies should manage their implementation in urban areas. Hence, this study examines the determinants of the spatial coverage of four moped-style scooter sharing services (MSS) in Barcelona. The article examines the socio-territorial characteristics of the coverage areas of each MSS, as defined in 2019, together with the minimum area that operators had to provide service in 2020 according to the local regulation. For each MSS, a binomial generalized linear mixed model is employed to predict the odds of each cadastral parcel being covered by the service and analyzed the main spatial determinants associated with it. The results suggest that territorial coverage is defined by centrality, household disposable income, and topography, with low-accessibility areas consistently omitted from services. The conclusions underline the need for the public sector to participate in the design of spatial coverage areas of MSS to guarantee spatial equity and transportation justice and avoid private sector designs that systematically exclude less attractive areas.
1. Introduction
Shared micromobility has emerged as a new term to describe the shared use of a bicycle, scooter, or other low-speed urban transport mode [1]. Shared micromobility modes belong to the shared mobility group, which goes beyond access by ownership and understands vehicle access as a service [2]. They go further than bus public transport systems, which have traditionally been the most extended way of shared mobility [3]. The success of these new forms of transport is in creating a new urban mobility paradigm with the potential to contribute to the reduction in the vehicle fleet and the acceleration of the energy transition towards cleaner and electric-powered vehicles [4], to give equivalent environmental benefits as electric or full hybrid vehicles [5,6].
Only a few papers are devoted to analyzing these new transport modes, defined by the Society of Automotive Engineers (SAE, USA), such as wheeled vehicles that must be fully or partially powered, have a curb weight less than 500 Ib (227 kg), and top speed less than 40 mph (48 km/h) [7]. This definition includes e-bikes, electric scooters, and mopeds, but excludes mechanical bicycles, which are not electrically powered. However, the previous shared micromobility literature has mainly focused on shared bicycles [8], in systems either based on docked stations (3rd bikesharing generation) [9,10,11,12], or free-floating systems (4th bikesharing generation) [13,14,15,16,17], without distinguishing whether the propulsion was mechanical or electric. This is mainly explained by the state of maturity of these services, as bike-sharing systems (BSS) were the first to be implemented. While scooters started to be deployed in urban areas much later than BSS, the popularity of BSS has commanded a vast amount of literature mainly focused on accidentality [18,19,20,21,22], its environmental impact [23], its Life Cycle Assessment [24,25], or its spatio-temporal dimension [26,27,28,29]. In contrast, and due mainly to their novelty and uneven geographical implementation, there is very little literature addressing moped-style scooter sharing services [30,31,32,33,34,35], despite the growth of these modes since their inception in 2012 [36].
Moped-style scooter sharing services (MSS) offer the promise of a swift and convenient door-to-door trip, with few parking issues and traffic congestion dodging capability. Private developers have often alleged that moped micromobility can be a true alternative to public transport [37], while for transport managers, MSS offer potential pathways towards a reduction in the number of cars, developing electric mobility and advancing towards a pay-per-use scheme in transportation, as opposed to a private ownership-based scheme.
The main features of MSS are very similar to those of 4th generation free-floating BSS: they depend largely on a smartphone application, an embedded GPS on every vehicle, and Internet to locate and unlock the vehicle, and the fact that there are no fixed vehicle parking stations or docks [13]. MSS can be more popular than BSS in some European cities with a decades-long culture of moped use and a consolidated docked BSS. That is the case in Barcelona, where the number of shared moped licenses is almost double the number of free-floating shared bikes (6958 licenses vs. 3975, respectively) [38]. This fact is not rare given that the city has the highest two-wheeled motorization rate of all European cities [39] and is already the world’s third city with the most shared mopeds, after Bangalore and Taipei [36].
Despite the fact that MSS have a high potential in cities where private moped use is already established, and their use has increased after the COVID-19 pandemic, large knowledge gaps still exist regarding the spatial dimension of MSS. To date, very little is known about how MSS can grant accessibility or what shapes their spatial coverage. Notable gaps also exist regarding the social and access inequalities that these modes can bring. As a result, regulators and policy makers also do not know how their use can promote or hinder spatial equity, which may be why the city’s regulations have not yet effectively incorporated them within the overall transportation network [40].
Aimed at this gap, the purpose of this study is to explore the socio-territorial characteristics that best explain the differences in coverage of MSS across two research areas—Barcelona and l’Hospitalet de Llobregat, (a municipality immediately southwest of Barcelona). A multi-level statistical model is employed to predict whether a cadastral parcel is included in the operation areas of each of the present MSS providers. The extension and distribution of operation areas are then described, revealing differences between the city center and the peripheries. The analysis also gauges how regulations can help sort out territorial service inequities.
2. Background
Research on shared micromobility services is growing fast. The first articles in the literature were related to docked BSS [41]. These systems, also known as 3rd generation BSS [42], were implemented by the public sector in several cities around the world during the 2000s, starting in Europe and rapidly expanding to North America [43]. The 4th generation of bikesharing, free-floating systems, started in 2016 in major Chinese cities [13] and by the end of the 2010s, new shared devices were rapidly being implemented in cities across North America, Western Europe, and Australasia [44]. E-scooters, moped, and e-bikes were all among the newly deployed micromobility devices [45]. Although studies to date have focused on issues, such as user behavior, vehicle technology, planning, policy, health and safety [46], or on endogenous issues (trip patterns, modal share, user profiling, regulation, and driving and parking behavior) and exogenous issues (crashes severity, conflicts with pedestrians, safe driving, road safety, and environmental impact) [47], the following sub-sections will summarize the literature of the three key issues most related to this article: spatial coverage of micromobility services, social and spatial equity issues, and assessing the main determinants explaining micromobility modal choice and modal shift.
2.1. Spatial Coverage of Micromobility Services
Density and the geographic coverage area of a shared micromobility service play important roles for its success [48]. Their territorial components of the service areas covered by micromobility businesses have been previously studied by combining travel patterns (via trip data or currently available vehicles), supply (via geofencing or docking station locations), and neighborhood characteristics (via sociodemographic data and land use data).
Travel patterns have been described from the distribution of BSS trip distance and trip duration, disaggregating between commuting or touristic purposes [49], describing the spatial and temporal differences between different BSS and scooter-sharing companies and also ride-hailing services [50], and even comparing BSS trips with bus travel patterns [51].
Several articles focus on the spatial distribution of supply. In a Shanghai BSS case study [17], an optimal number of geofences and suitable locations to serve the estimated parking demand is defined, while in a Vienna BSS case study [28], the spatial variance in the scooter geofence over time is explained.
2.2. Social and Spatial Equity
Due to the novelty of this new way of moving, issues related to social and spatial equity have not been as thoroughly examined as other forms of transport, such as public transport. Research on the topic, however, is key, given the claim made by some authors that because micromobility is cheap and relatively easy to use, it can contribute to transportation equity and justice [52,53].
Several studies aimed to identify differences in the use of these modes of transport, depending on the sociodemographic profile of the user. Hosford and Winters [54], for instance, focused on different Canadian cities and found users of public BSS to be predominantly Caucasian, employed, and with higher incomes and education levels, compared to the general population. Similarly, the first ever analysis of the spatial equity of a dockless bike share system, based in Seattle, United States, found modest inequities between different sociodemographic groups [16]. A third study [55], set in Minneapolis-Saint Paul, USA, found that the average daily trip frequency was higher in neighborhoods with a high concentration of minorities and lower socioeconomic status than in the most advantaged neighborhoods. The majority of these studies, however, have focused on the USA and compared urban areas with access to micromobility services, without accounting for areas that might have been left out of the service area, and other worldwide cities where these services have been implemented [13].
2.3. Modal Choice and Modal Shift
One of the topics that guides the future of a city is the transition of its modal split, from private car to sustainable modes of transport. To have a clean, sustainable, healthy, or equitable city depends on the way the city’s people move. Far from considering that shared micromobility services are the panacea to empty the city of cars, some of their advantages have been considered in the previous body of literature. Much like in the ride-hailing debate [56], some authors have suggested that micromobility can reinforce and complement public transport. Early empirical data, however, seem to indicate the bulk of new users come from public transport [57]. On the positive side, studies have found that shared micromobility services have significant positive effects on reducing congestion [58], improving transport flexibility, as they offer the user the freedom to easily make a one-way cycling trip while selecting another mode of transport for another trip [44], helping to reduce overcrowding in saturated public transport networks [59], and increasing the resilience of the transportation systems in times of disruptive events [60]. To date, shared micromobility is frequently treated as part of the “mobility as a service” package that can help to provide transport options without being encumbered with vehicle ownership [44].
2.4. Moped-Style Scooter Sharing Services Literature
Research specifically focusing on MSS, a micromobility modality that is already present in more than 100 cities in 22 countries [36], has been lagging, with only a few notable exceptions. One of the first articles focused on identifying the key drivers in determining the adoption and frequency of use of MSS in Madrid (Spain) [30]. Their study found that the use of MSS was associated with sociodemographic and travel-related variables, such as age or level of education. The same authors described the usage and opinions towards this new mobility alternative [31]. Eccarius and Lu [33], for their part, put the focus on the factors that influence university students’ intentions to use MSS in Taiwan and found that those from the study sample with more awareness of the environmental issues tended to use MSS more. The topic is also partially tackled by Eccarius and Lu [34], in their study on the consumer adoption of electric motorcycles. Pérez-Fernández and García-Palomares [35] described the location of parking spaces for MSS in the center of Madrid and found differences according to the time slot. Finally, Arias-Molinares et al. [32] explored MSS spatio-temporal dynamics in seven Spanish urban areas and found prominent levels of demand concentration in city centers.
3. Methodology
3.1. Context
The study area of this research focuses on Barcelona and l’Hospitalet de Llobregat (Figure 1), two adjacent municipalities located in Catalunya, Spain. Gathering a total population of 2.0 million individuals [61] and covering an extension of 113.75 km2, their combined urban area is one of the areas with the most motorized two-wheeled vehicles in Europe, with a motorization rate of 175 motorized two-wheeled vehicles per 1000 inhabitants. In terms of modal choice, Barcelona benefits from a compact and diverse built environment that favors travel in sustainable modes of transport [62,63]. In one working day, 50.0% of the trips of their residents are on foot, while 28.3% are on public transport, 2.5% on a bicycle, and 0.7% on e-scooters. Motorized two-wheeled vehicle trips represent 6.0% of the journeys and the private car represents 12.5% (EMEF—Working Day Mobility Survey, 2019).
While the use of shared mopeds in Barcelona is increasing, the micromobility local market is clearly dominated by the public BSS service, a service implemented in 2007 under the name of Bicing that offers a docked bike sharing system based on annual subscription. The use of Bicing has consolidated over the years, reaching 126,545 subscribers and 5.7 daily uses per bike in 2020, the year the COVID-19 pandemic started (Bicing, 2020). The longstanding tradition of Bicing as the main micromobility option in the city explains why 17.8% of all bike rides in the city are conducted using Bicing (EMEF, 2020), while shared moped rides represent only 2.3% of all two-wheel motorized rides (EMEF, 2020). Moped sharing systems, however, are much younger and are clearly increasing in recent years, and their growth potential is higher than for Bicing.
In 2016, Cooltra and Yego were the first moped-shared companies to start operating in Barcelona. They did so without a municipal license, as it took more than three years for the municipality to regulate the licensing market. In the first stage, Barcelona City Council took a laissez faire approach with these services and did not impose restrictions beyond keeping within minimum road safety and parking regulations. Most importantly, Barcelona City Council did not impose a minimum service area; hence, companies started offering the service in the central area of the city and modified this based on its convenience. In 2018, Barcelona City Council started to write a new regulation for the sector, based on the use that these vehicles make of the public space, making the payment of a tax for a license compulsory, and establishing a minimum coverage area, in which all operators granted a license would have to provide a service. In 2019, just months before the approval of the regulation, two new companies—Acciona and Movo—started operating in the city. In May 2020, the official licenses were given to 12 moped-shared companies.
3.2. Socio-Territorial Variables and Data Sources
The previous literature found an association between socio-territorial factors and the use of shared micromobility services. Following that, six of the variables more often found to be significant were selected, so as to predict their association with the spatial coverage of MSS (Table 1).
The service areas (also called geofences) and the no-parking zones (areas where trips cannot end) of the four MSS operators (Yego, Cooltra, Acciona, and Movo) operating in Barcelona in July 2019 (Figure 1) were gathered from, together with the City Council’s drawn map of Barcelona’s viable coverage area (Figure 2), which is the regulated minimum area to operate in Barcelona since May 2020. The 4 service areas and no-parking zones were manually vectorized from the operator’s mobile applications [68] in July 2019, just before the regulation was imposed.
All socio-territorial variables were gathered from publicly available sources at the census section or cadastral parcel level and for the latest year available, and then transformed into the cadastral parcel territorial unit. The values of the census section were replicated at the cadastral parcels that contained them. The cadastral parcel territorial unit of this study has a median size of 244 m2. It is the smallest territorial unit in which statistical data are available, and is defined as a single area of land, under homogeneous real property rights and unique ownership [69]. There are 86,868 cadastral parcels in the city, and for each and every unit, the value of the six socio-territorial variables were calculated and logged if they are included in any of the five MSS service areas (Yego, Cooltra, Acciona, Movo, or the minimum service area that was established by Barcelona City Council).
In addition, a new neighborhood variable was created from having clustered the cadastral parcels of the same neighborhood (there are 73 neighborhoods in Barcelona and 13 in l’Hospitalet), since there is notable variability in the distribution of cadastral parcels in the city.
3.2.1. Population Density—21–49 Years of Age
The population density with ages of 21–49 years (Figure 1d) is a variable that could explain the use of MSS because it is correlated with the use of shared e-scooter services [64]. The minimum age chosen is 21 years, an age where in Spain, all people with a car driver’s license can also ride a motorcycle without a specific motorcycle driver’s license. Inversely, previous research has found that people in Madrid older than 49 years rarely use MSS [30].
3.2.2. Household Disposable Income
Household disposable income (Figure 1c) is the macromagnitude measuring annual income available to residents of a territory for consumption or saving [70]. This income depends on the revenue of the families directly linked to remuneration for their contribution to productive activity but is also influenced by the activity of the Public Administration through taxes and social benefits. Aguilera-García et al. [30] used this variable to determine the user profile of MSS, and found that high levels of income seem to discourage the use of MSS because they might prefer to use the private vehicle for their daily trips. The new users of New York BSS were lower household-income people [12].
3.2.3. Public Transport Accessibility
The methodology used to calculate public accessibility (Figure 1a) follows that of Poelman and Dijkstra [71] and is based on the estimated travel time needed to reach a public transport station on foot. Bus or tram stops are nearer than five minutes of time on foot (with a standard walking speed of 5 km/h), and metro or railway stations are nearer than ten minutes of time on foot, indicating higher values of accessibility. More public transport departure frequencies also indicate higher values of accessibility. Three open data sources were used to estimate public transport accessibility. The estimated population in a cadastral parcel [61] was used to estimate where people live. The street network (ICGC, scale 1:25,000) was used to estimate the average time to walk from a cadastral parcel to the nearest public transport stop or station. General transit feed specification (GTFS) data from public operators, private operators, and competent administrations allow us to estimate the geographic location of public transport stops and the frequency of the service on a working day. Structured as a relational database, one GTFS feed is composed of several files that are interconnected via common variables [72], and has already been used in the literature for public transport accessibility approaches [73,74]. Previous literature suggests a significant connection between bus trips and bike use at stations [51] and a positive association between transport public accessibility and higher e-scooter ridership [65].
3.2.4. Slope
Slope has been repeatedly found as one of the main determinants of bike and bike sharing use [66,67]. Studies have found that slopes exceeding 4% really make it difficult to cycle as an everyday transportation option. While moped riders should not have to worry about slope in terms of physical exercise, the relationship between moped use and slope has not been properly assessed in the literature to date. The Barcelona area is not homogenously flat (Figure 1b) but has a considerable number of inhabited hills to the north, and a median slope of 4%.
3.2.5. Distance to the City Center
Distance to the city center takes Plaça Catalunya (Figure 2) as a central reference point. The plaça, which is located in the center of the Municipality of Barcelona, is the place where more public transport lines converge (metro and commuter train lines). The distance from each cadastral parcel to the city center has been calculated following the streets network and is expressed in meters (ICGC, scale 1:25,000). Proximity to the city center has been positively associated with higher use of dockless e-scooter services [64,65].
3.2.6. Metropolitan and Supramunicipal Facilities
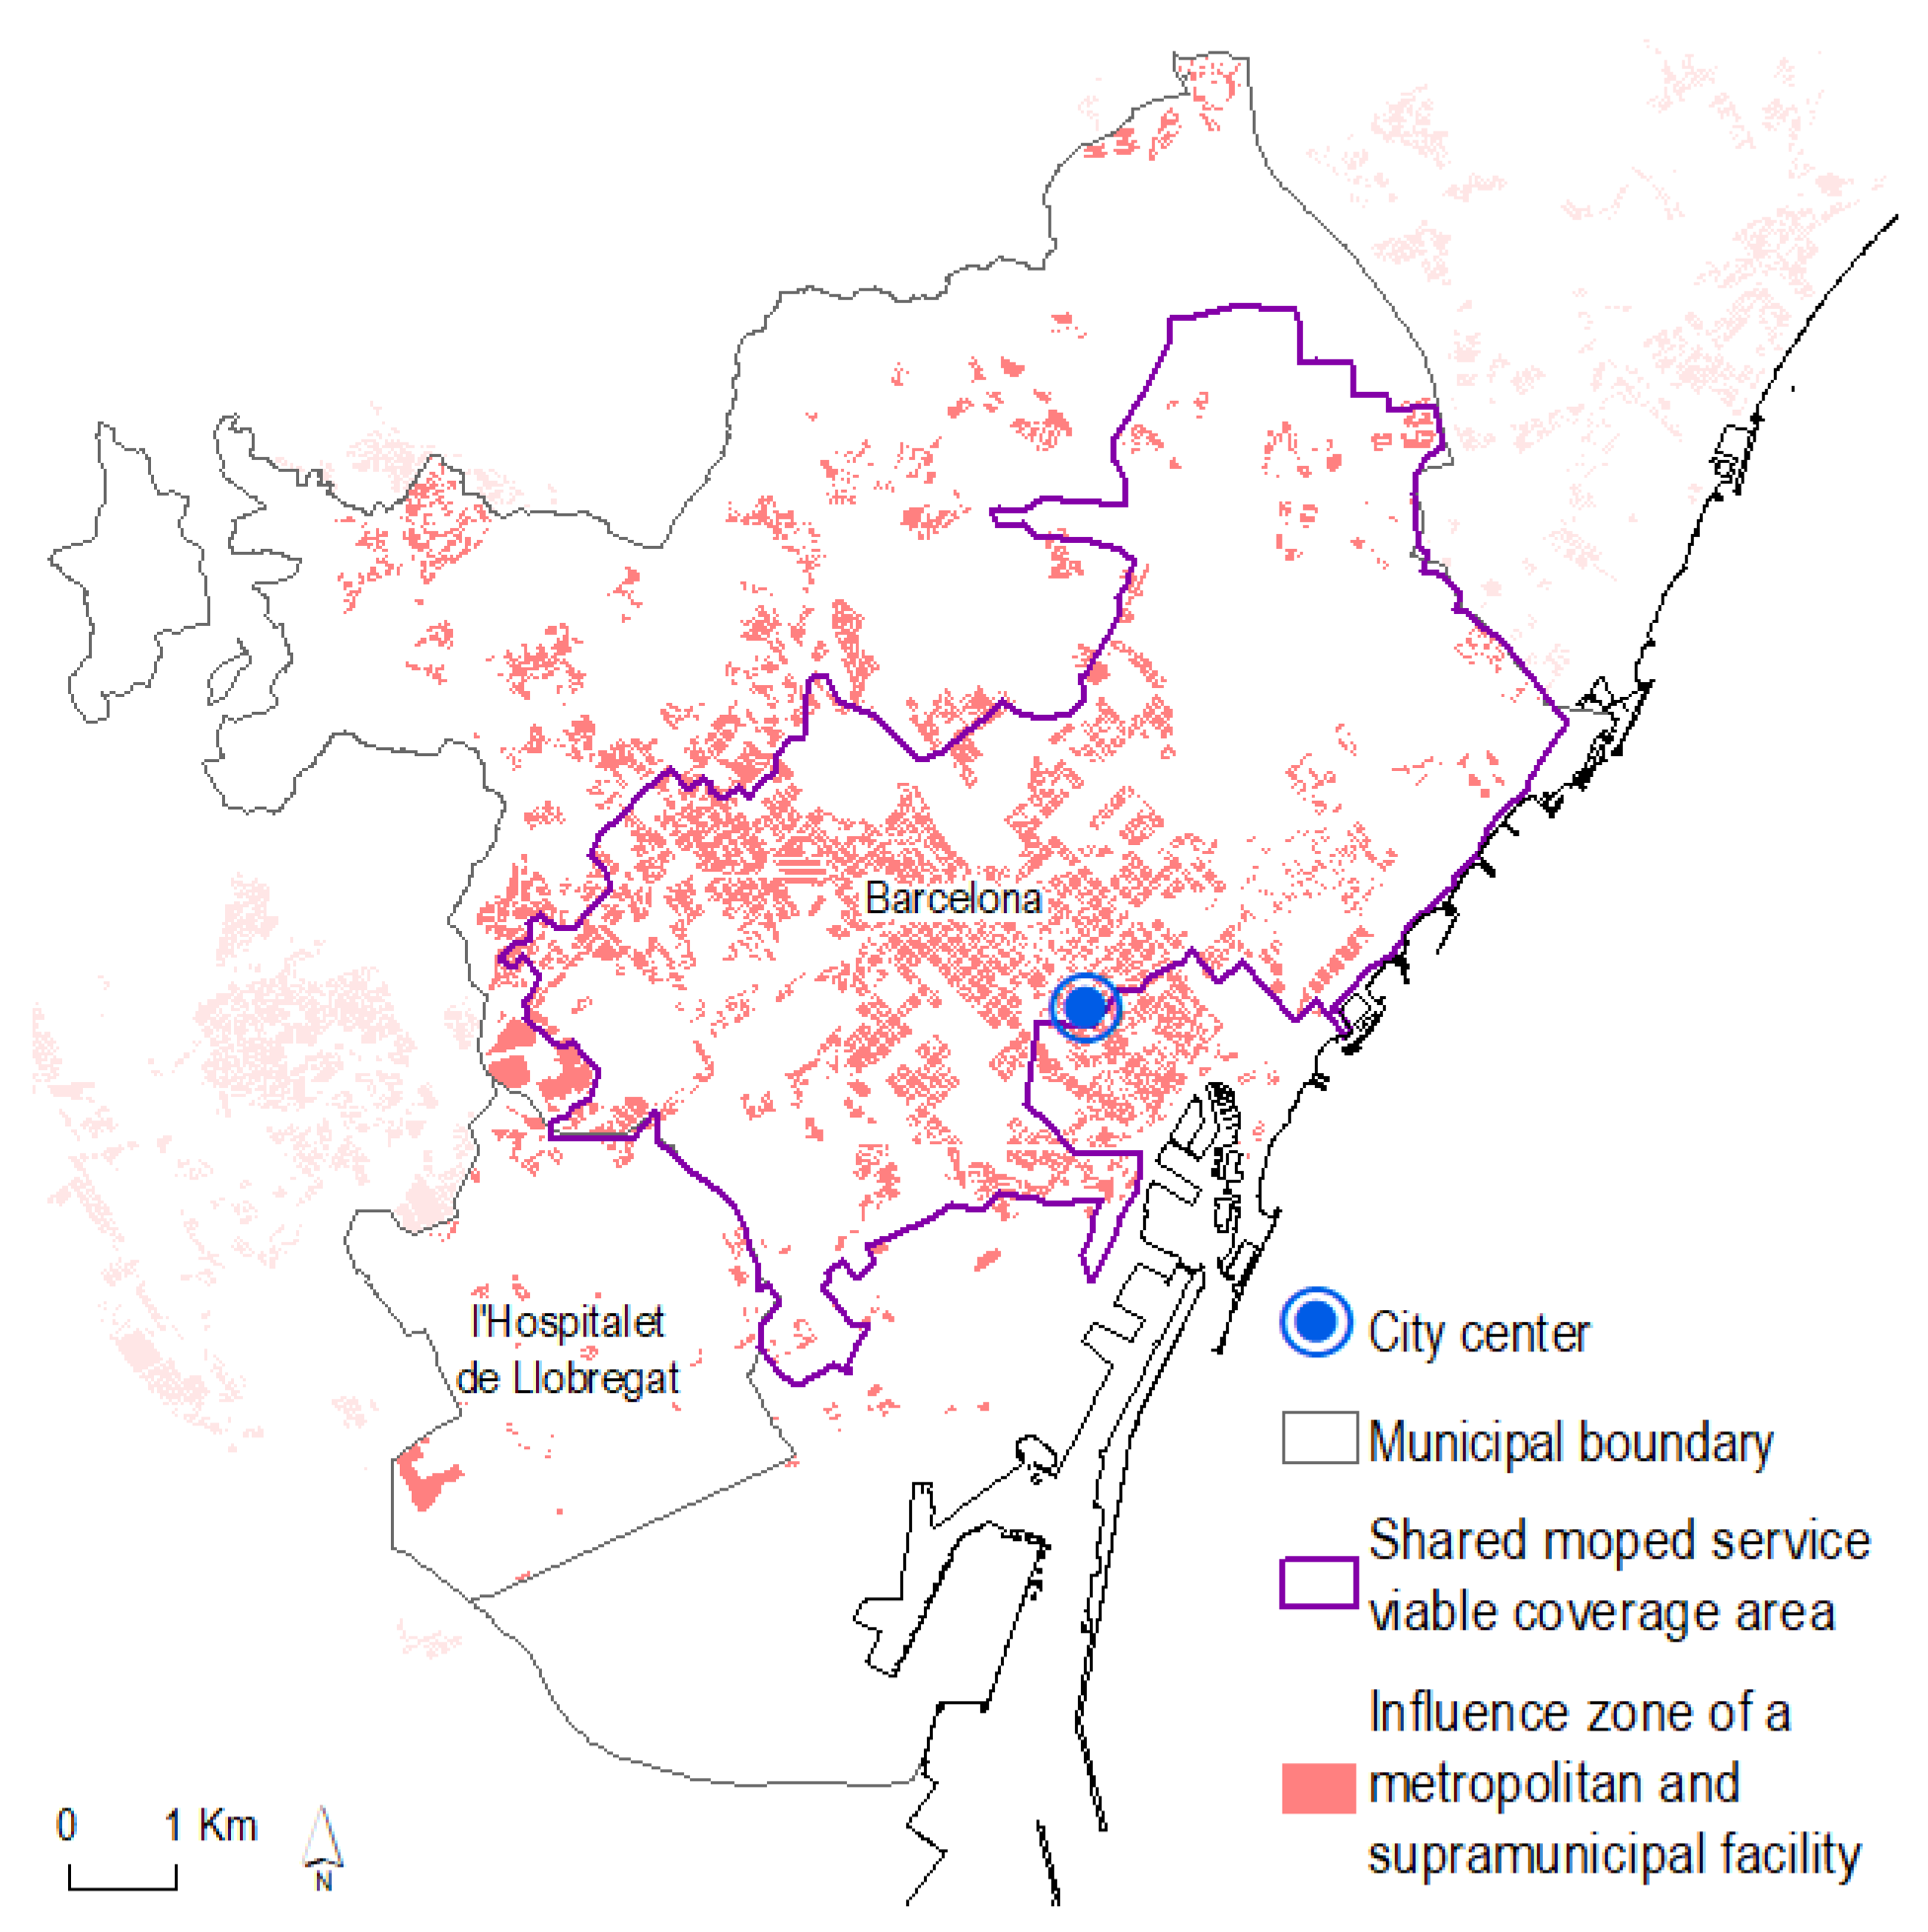
Finally, the Metropolitan Area of Barcelona (AMB) is facilitated by a database of the buildings or open spaces which provide a service (administrative, cultural, educative, health, funeral, or sportive) to people. Each facility has a specific territorial level of influence, whereby, only those facilities with an influence beyond the municipality were considered: the 61 facilities with supramunicipal influence and the 776 facilities with metropolitan influence (Figure 2). These facilities, such as hospitals, courts, fire stations, universities, exhibition and conference centers, or huge sportive centers, could encourage moped trips, as has already occurred with bicycles or scooters [10,29].
3.3. Methods
In order to assess the association between the socio-territorial values in each cadastral parcel (N = 86,868) and the odds of that cadastral parcel being included in one of the five selected service areas, descriptive statistics were used followed by a binomial generalized linear mixed model. One model for each moped-style scooter sharing company operating in the city (Model 1 for Movo, Model 2 for Acciona, Model 3 for Cooltra, and Model 4 for Yego) was made, and a fifth (Model 5) for Barcelona’s resulting mandated coverage area after regulation (Figure 3).
To interpret the results better, the variables were rescaled by z-score to have a mean of zero and a standard deviation of one. No multicollinearity issues were detected after applying the Variance Inflation Factor (VIF) test. Analyses were conducted using R version 4.0.0 and ArcGIS. The dependent variable of each model is a binary variable and represents whether or not each cadastral parcel is included in the service area (1 = included; 0 = not included). The variable neighborhood was included as a random effect and the remaining socio-territorial variables were included as fixed effects (Table 2).
4. Results
In order to visualize the spatial distribution of the main explanatory variables, Figure 1 and Figure 2 display the spatial representation of the variables that are described in the methodology section. The main visual differences are the limits and the surface of each MSS area, which are 58.96 km2 (Cooltra), 56.00 km2 (Acciona), 50.14 km2 (Yego), and 38.17 km2 (Movo). The surface of Barcelona’s viable coverage area, with 70.33 km2, is even larger than the others, but it does not cover any area of the Municipality of l’Hospitalet de Llobregat. The no-parking zones are another characteristic seen in the services areas of Movo, Acciona, and Cooltra. They can be viewed as holes in the service area where it is forbidden to start or end a trip using MSS, but where it is possible to cross with the moped vehicles. These no-parking zones are mainly in Ciutat Vella and Gràcia neighborhoods, which are characterized by their narrow streets and a shortage of parking spaces for motorized two-wheeled vehicles. Additionally noteworthy is the corridor in the direction of L’Hospitalet de Llobregat which is present in all services. In fact, this artificial lengthening of the perimeter is due to the presence of the Fira Barcelona, which is the Trade Fair Institution that hosts more than 150 events annually, with the Mobile World Congress being the most important. It is noteworthy that in Yego’s service area, the legs on the north correspond to suburban avenues and Vall d’Hebron University Hospital, which is the hospital complex with the highest volume of interventions in Catalunya.
In terms of percentage of cadastral parcels covered by a MSS, Table 2 displays all MSS except Movo, covering at least half of all available cadastral parcels (56.7% Cooltra, 53.4% Acciona, 51.4% Yego, and 37.5% Movo). Barcelona’s viable coverage area also covers most of the cadastral parcels (56.7%).
In terms of the spatial distribution of the analyzed socio-territorial indicators, public transport accessibility (Figure 1a) is high or very high in the vast majority of the cadastral parcels (94.3%), with the exception of some areas in the northwest of the city, which have, at the same time, more slope (>10%) and less population density. The median slope of the cadastral parcels is 8% (Table 2), which means that Barcelona and l’Hospitalet de Llobregat, as with many cities in southern Europe, are not entirely flat [75]. Slope is also very unequally distributed in the city (Figure 1b). The hilliest areas are located in the northwest, and there are also hills in the south (Montjuïc) and north (Parc dels Tres Turons) of Barcelona. Household disposable income (Figure 1c) and population density of the age group 21–49 years (Figure 1d) are the two variables that are almost inversely proportional. Finally, only 6.9% of the cadastral parcels contains a metropolitan or supramunicipal facility (Table 2), which are concentrated mainly on an axis that traverses the city from east to west (Figure 2).
When using the binomial generalized linear mixed model to help understand the association between the socio-territorial variables and the spatial extent of MSS (Table 3), the factor appearing to have a higher association with the spatial extent of the MSS is the distance to the city center (0.000 Yego, 0.002 Movo, 0.025 Acciona, and 0.046 Cooltra). This indicates that the farthest cadastral parcels from the city center are less likely to be covered by MSS services. In that sense, Yego differs from the other operators because it also offers services in the city center historical neighborhood of Ciutat Vella, and thus the model finds a much stronger significant association with Yego’s MSS and distance to the city center.
Models 1–4 also show significant negative associations between low public transport accessibility and the odds ratio of the cadastral parcel being included in the service area of MSS (0.113 Movo, 0.214 Yego and Cooltra, and 0.360 Acciona). In practical terms, this means that the areas with less public transport accessibility are also those more frequently left out of the coverage of MSS, even though some of these low public transport accessibility areas are probably also the areas located mostly in the periphery. Cadastral parcels with medium public transport accessibility are also associated with less coverage of MSS (0.292 Movo, 0.672 Cooltra, 0.679 Acciona, and 0.707 Yego).
Slope, for its part, is negatively associated with being included in service areas in MSS, and this association is very similar across the different operators (0.247 Movo, 0.292 Acciona, 0.255 Cooltra, and 0.275 Yego).
Regarding household disposable income, coefficients seem to indicate a positive relationship between income of the cadastral parcel and the odds of being included in service areas of MSS. Again, this relationship holds across all operators in similar association (1.703 Movo, 1.718 Acciona, 1.588 Cooltra, and 1.540 Yego).
Coverage of MSS does not seem to follow the distribution of any metropolitan and supramunicipal facilities as the models fail to find any significant association between the presence of such facilities and the odds of being covered by service areas of MSS. The results in Table 3 show slightly positive association for all operators (1.157 Movo, 1.504 Acciona, 1.244 Cooltra, and 1.476 Yego), which means that the presence of a metropolitan facility is marginally associated with chances of being included within service areas of MSS. However, a handful of specific big metropolitan facilities such as Fira Barcelona or Vall d’Hebron University Hospital seem to generate a big interest among operators to include them (Figure 1 and Figure 2).
Finally, the population density for the age group 21–49 years is a variable that almost does not explain why operators decide to implement their services (odds ratio of 1.009 Movo, 1.078 Acciona, 1.188 Cooltra, and 1.078 Yego). It seems that for operators, it might be more important to locate their services in places where people visit for productive activities (work, leisure, shopping) rather than being in places where people actually live. Furthermore, two of the areas of Barcelona (Gràcia and Raval) with the densest population are not included in any of the MSS service maps (except Yego). These neighborhoods have a lack of public space, their streets are narrow, and the population densities are high; hence, they may present challenges regarding vehicle parking.
Finally, Model 5 (Barcelona) is analyzed separately from other models because it is not a surface area of a moped-style scooter sharing operator, but rather it is the minimum viable coverage area of the MSS, as defined by the city. The limits of the viable coverage area (Figure 2) are defined mainly by natural geographical features (Mediterranean Sea and Montjuïc hill in the south) or administrative borders (by the Municipality of l’Hospitalet de Llobregat to the west and by the Municipality of Sant Adrià de Besòs to the east). Further, it includes a no-parking zone in Ciutat Vella, but not in Gràcia (unlike the original service area maps for MSS, as designed by Movo, Acciona, or Cooltra).
The distance to the city center is the variable with a larger negative association (0.001) with the cadastral parcels that belong to the viable coverage area. This value is influenced because none of the cadastral parcels from l’Hospitalet de Llobregat are included. The slope is also negatively associated with being included in the viable coverage area (0.238). The low and medium public transport accessibility odds ratio in the viable coverage areas (0.583 for low and 1.072 for medium) are less significant than in the original operator’s service area. On the contrary, population density is more associated with the Barcelona coverage area (1.395) than with the original service of the micromobility operators (1.078 Acciona, 1.188 Cooltra, and 1.078 Yego). In addition, the results show how Barcelona’s regulation was apparently made to maintain more socio-economic equity and to not favor only areas with facilities, since in the results of the model, the socio-territorial variables of household disposable income and facilities appear insignificant (1.016 and 0.914).
5. Discussion
This paper is aimed at understanding the socio-territorial variables influencing the size, shape, and composition of the spatial area coverage of MSS. Considering that one of the new challenges facing cities is how to regulate these new modes of transport, this paper aims to help urban and mobility planners and policy makers in their effort to draw and design service area maps. The reflections presented can be transferred to other modes of transport and, in particular, shared electric scooters, which are currently in the process of regulation in Barcelona.
5.1. The Spatial Access Inequality of MSS
The results seem to indicate that MSS are not yet well implemented in the peripheries of the city, as these two-wheel shared services only serve the population from selected areas of Barcelona and l’Hospitalet de Llobregat and offer no service whatsoever to the rest of the metropolitan region. The electric propulsion of MSS and the ability to park almost anywhere have the potential to boost their expansion in neighborhoods with higher slopes and less access to public transport, but this has not been the case. However, the case of Barcelona is not an anomaly, as MSS demand in seven other Spanish cities is also concentrated in the city center and makes lower use of the periphery [32]. While the role of the public sector as a safeguard of spatial equity is not properly clarified, operators might be deliberately avoiding not only neighboring metropolitan municipalities, but also the outskirt areas within the Barcelona core city. In that case, operators would continue to strive to include wealthier areas of the city while excluding some metropolitan facilities, and rather going out of their way to include only several large facilities (such as Vall d’Hebron University Hospital or Fira de Barcelona), driven by their great visitor attraction and trip generation capacity.
This manuscript did not evaluate the temporal change in the MSS geofence shape, but as Moran et al. [28] observed, micromobility operators tend to substantially change the spatial coverage of their services over time. This could be an indicator that operators may not have a clear idea of which are the most suitable areas for their service. Some of the spatial inconsistencies of service coverage can often be attributed to other political or regulatory factors, i.e., not being able to cross municipal boundaries.
5.2. The Role of Barcelona’s Regulation
As the results point out, the minimum coverage area defined in Barcelona’s regulation has led to better spatial equity levels. High-income neighborhoods are not privileged with more spatial coverage and low public transport accessibility areas are not so much correlated to fewer MSS services, which occurred with MSS operators’ geofences.
However, with Barcelona’s regulation, MSS are still providing better access in the central areas than in the peripheries, and areas with very high levels of spatial coverage tend to be also the areas with a higher provision of public transport accessibility. Therefore, it seems that regulation has not eased the intermodality sufficiently between MSS and public transport. These services do not finally function as a first or last-mile mode of transport, as many micromobility operators might suggest [37], but are rather present where more public transport is offered. Notwithstanding, there are still neighborhoods without public transport coverage where MSS operators are not obliged to serve.
The regulation also purposefully encourages the MSS operators to avoid the historical areas of the city (Ciutat Vella and Gràcia neighborhoods), characterized by narrow streets and a general lack of public space for parking. While these neighborhoods include some of the denser areas of the city, Barcelona City Council has expressed its concern regarding how MSS could aggravate existing public space problems if allowed to operate in these historical areas. It is possible that some of the operators might have willingly left out these areas of their service area maps to remain on good terms with the City Council, even before a legal framework was established. Operators aiming to start a service in a new city should consider that historical areas are not always the best places to settle.
The key question derived from these findings relates to transport justice and equity. Should these private services be allowed to operate in some privileged areas of the city, or should the municipality mandate an even service level within the municipal limits? The minimum coverage area defined by the Municipality of Barcelona was designed after many meetings with private operators previously installed in the city, and an aim to implement the result of a public–private discussion and consensus. In practical terms, the resulting map was a trade-off between operators’ desires to access the more profitable areas of the city, and the City Council wanting to grant access to the maximum population numbers possible in extending coverage ranges. Enlarging the current minimum coverage area might imply financial incentives that the public sector may not yet agree to pay.
On the one hand, to make the service profitable, operators argued that each moped deployed in the city must be used for a minimum of three trips per day, and potential zones not achieving these characteristics would never be covered by private operators. On the other hand, the aim of the City Council is sustainable mobility for all citizens, and an offer of equal transportation options among those citizens. The conclusion is that, based on their current configuration—with peripheral areas excluded from service—MSS cannot always be counted on as part of a choice of mobility, and people still have to find less sustainable alternative ways to move. They are also far from being part of those modes of transport that help to achieve the goal of guaranteeing universal access to the city, in terms used by Gallez and Motte-Baumvol [76]: “potential of opportunities for interaction”. With many citizens living outside the operator’s services areas, the MSS do not revert to spatial access inequalities. These services, however, can offer a good solution to the more than 20 million tourists received by the city in any year (excluding the COVID-19 pandemic era). With Barcelona being one of the most visited cities in the world [77], MSS might offer a valuable service to tourists who either cannot access the local bike sharing system or find the public transport too expensive for them to use.
5.3. Public Policy Recommendations
Beyond that, however, the question remains as to how these private services should be treated by public administrations. Should public officials incentivize the implementation of more services to increase the service area? Should they force the private services to operate everywhere within the city limits, with the risk of them making no profit and thus deciding to abandon the city? Should the administration allow them to operate only in those areas that they deem to be economically viable? Cohen and Shaheen [78] suggest three policy approaches that can be used by local governments and public transit operators as models for developing their shared mobility policies. The main one is called “Shared Mobility as a Social and Environmental Benefit” and implies maximum governmental support from public agencies, with the condition that shared mobility operators provide social and environmental impact data. This policy framework might be suitable to change the current spatial inequity of MSS. Shaheen and Cohen [79] outlined other policies and practices for cities to solve these inequities. They gave the example of the electric scooter sharing pilot program in Portland, Oregon, where the city required a fixed percentage of an operator’s fleet to provide service in the city’s most disadvantaged neighborhoods.
A potential benefit from the city council intervening and regulating the MSS operator market would be the ability to integrate MSS vehicles within mobility digital applications and services provided by the city. These services are designed to promote intermodality between modes and could now incorporate MSS data in order to make public transport-MSS connections easier and faster. That would include fare integration and even allow for the possibility of people booking the desired vehicle in advance or deferring a payment. Until now, the municipality’s main digital app (SMOU) only fully integrates BSS (Bicing) and other mobility services (off-road parking, private car sharing, electric vehicle charging points, etc.). In terms of MSS, there is only provision of real-time information on the location and availability of vehicles, with no further integration with each of the private MSS operators.
6. Conclusions
In general, the spatial extent of the service areas proposed by the private MSS in Barcelona and l’Hospitalet de Llobregat is clearly determined by socio-territorial variables. The results demonstrate that areas with high accessibility to public transport, closer to the city center, and with higher income populations are more likely to be included in one or more of these service areas. In contrast, areas with low or medium accessibility to public transport, high slope, and a lack of public space are less likely to be included. When considering the revised minimal spatial extent that is mandated by Barcelona City Council, the models still find a significant association between distance to the city center and slope, which decreases their likelihood of being included. In terms of percentage of cadastral parcels covered by MSS, 40% are still not covered. This clearly indicates that these micromobility services are still far from being a net contributor to transportation justice and spatial equity, and they still have to make progress to be considered in their current iteration as part of the solution towards sustainable, equitable, and universal mobility.
The results of this study offer insight into how the private- and administration-led design of service areas both overlap and differ, and the conclusions may help transport managers and decision makers to make informed decisions on the future of ways to manage the arrival and deployment of these micromobility services. Based on the experiences in Barcelona and l’Hospitalet de Llobregat, the results highlight the need for public intervention when designing spatial coverage areas, to ensure a minimum of spatial equity. That intervention, however, might entail further compromise from the public sector on the future and viability of these services which could most often lead to some sort of financial incentive towards operators that can compensate for them including peripheral or less profitable areas.
7. Limitations and Directions for Future Research
This study is not without limitations, because binomial generalized linear mixed results were slightly influenced by the size variability of cadastral parcels. More homogeneous territorial parcels would have given more robust results. For future research, it would be interesting to have real demand data, and assess whether the relation with demand and socio-territorial variables is the same as with supply (as stated in this paper). The realization of this fact might be possible after Barcelona City Council regulations are imposed, which would likely force operators to transfer real-time data. This information may demonstrate the real spatial dimension of these services and describe their use on the peripheral areas of Barcelona and l’Hospitalet de Llobregat. In the medium term, within which the service is expected to be extended to other metropolitan municipalities, it will be of the utmost interest to monitor the growth process of the area of operation, notwithstanding the impact of an analysis of the demand for these services in these new metropolitan municipalities. In the future, it should also be important to analyze some key sustainable parameters of MSS, such as those defined by Carrara et al. [80], but in a geographical approach, to inform of the excellences and criticalities of MSS.
Author Contributions
Conceptualization, X.B., C.M.-G. and O.M.; methodology, X.B.; validation, O.M.; formal analysis, X.B.; investigation, X.B.; resources, X.B.; data curation, X.B.; writing—original draft preparation, X.B.; writing—review and editing, C.M.-G. and O.M.; visualization, X.B.; supervision, C.M.-G. and O.M.; project administration, O.M.; funding acquisition, X.B., C.M.-G. and O.M. All authors have read and agreed to the published version of the manuscript.
Funding
This research was funded by the Departament d’Empresa i Treball, Government of Catalonia under the Industrial Doctoral grant [ref. BDNS 443065], from Institut d’Estudis Regionals i Metropolitans de Barcelona, from Ministerio de Ciencia e Innovación, Government of Spain [grant number PID2019-104344RB-I00] and from Institut de Cultura, Barcelona City Council [grant number 19S01360-006]. Oriol Marquet is funded by a Ramón y Cajal fellowship (RYC-2020-029441-I) awarded by the Spanish Ministry of Science and Innovation.
Institutional Review Board Statement
Not applicable.
Informed Consent Statement
Not applicable.
Data Availability Statement
Not applicable.
Acknowledgments
The authors would like to thank Francesc Coll and Marta Andreu from IERMB for their help in the cartography process.
Conflicts of Interest
The authors declare no conflict of interest.
References
- Shaheen, S.; Cohen, A.; Chan, N.; Bansal, A. Chapter 13—Sharing Strategies: Carsharing, Shared Micromobility (Bikesharing and Scooter Sharing), Transportation Network Companies, Microtransit, and Other Innovative Mobility Modes. In Transportation, Land Use, and Environmental Planning; Deakin, E., Ed.; Elsevier: Amsterdam, The Netherlands, 2020; pp. 237–262. ISBN 978-0-12-815167-9. [Google Scholar]
- Kim, H.; Choi, K.H.; Kim, K.J.; Park, E. From Owning to Sharing: Understanding the Emergence of Social Sharing Services. Program 2017, 51, 102–115. [Google Scholar] [CrossRef]
- Jaworski, A.; Mądziel, M.; Kuszewski, H. Sustainable Public Transport Strategies—Decomposition of the Bus Fleet and Its Influence on the Decrease in Greenhouse Gas Emissions. Energies 2022, 15, 2238. [Google Scholar] [CrossRef]
- Friedel, A. Free Floating Micro Mobility Map Europe. Available online: https://maphub.net/Augustin/micro (accessed on 16 February 2022).
- Campisi, T.; Mądziel, M.; Nikiforiadis, A.; Basbas, S.; Tesoriere, G. An Estimation of Emission Patterns from Vehicle Traffic Highlighting Decarbonisation Effects from Increased E-Fleet in Areas Surrounding the City of Rzeszow (Poland). In Proceedings of the Computational Science and Its Applications—ICCSA 2021, Cagliari, Italy, 13–16 September 2021; Gervasi, O., Murgante, B., Misra, S., Garau, C., Blečić, I., Taniar, D., Apduhan, B.O., Rocha, A.M.A.C., Tarantino, E., Torre, C.M., Eds.; Springer International Publishing: Cham, Switzerland, 2021; pp. 683–698. [Google Scholar]
- Mądziel, M.; Jaworski, A.; Kuszewski, H.; Woś, P.; Campisi, T.; Lew, K. The Development of CO2 Instantaneous Emission Model of Full Hybrid Vehicle with the Use of Machine Learning Techniques. Energies 2022, 15, 142. [Google Scholar] [CrossRef]
- SAE International. SAE J3194-Taxonomy & Classification of Powered Micromobility Vehicles Powered Micromobility Vehicle; SAE International: Warrendale, PA, USA, 2019. [Google Scholar]
- Fishman, E. Bikeshare: A Review of Recent Literature. Transp. Rev. 2016, 36, 92–113. [Google Scholar] [CrossRef]
- Hu, S.; Xiong, C.; Liu, Z.; Zhang, L. Examining Spatiotemporal Changing Patterns of Bike-Sharing Usage during COVID-19 Pandemic. J. Transp. Geogr. 2021, 91, 102997. [Google Scholar] [CrossRef] [PubMed]
- Liu, H.-C.; Lin, J.-J. Associations of Built Environments with Spatiotemporal Patterns of Public Bicycle Use. J. Transp. Geogr. 2019, 74, 299–312. [Google Scholar] [CrossRef]
- Loidl, M.; Witzmann-Müller, U.; Zagel, B. A Spatial Framework for Planning Station-Based Bike Sharing Systems. Eur. Transp. Res. Rev. 2019, 11, 9. [Google Scholar] [CrossRef]
- Reilly, K.H.; Noyes, P.; Crossa, A. From Non-Cyclists to Frequent Cyclists: Factors Associated with Frequent Bike Share Use in New York City. J. Transp. Health 2020, 16, 100790. [Google Scholar] [CrossRef]
- Chen, Z.; van Lierop, D.; Ettema, D. Dockless Bike-Sharing Systems: What Are the Implications? Transp. Rev. 2020, 40, 333–353. [Google Scholar] [CrossRef]
- Du, Y.; Deng, F.; Liao, F. A Model Framework for Discovering the Spatio-Temporal Usage Patterns of Public Free-Floating Bike-Sharing System. Transp. Res. Part C Emerg. Technol. 2019, 103, 39–55. [Google Scholar] [CrossRef]
- Hua, M.; Chen, X.; Zheng, S.; Cheng, L.; Chen, J. Estimating the Parking Demand of Free-Floating Bike Sharing: A Journey-Data-Based Study of Nanjing, China. J. Clean. Prod. 2020, 244, 118764. [Google Scholar] [CrossRef]
- Mooney, S.J.; Hosford, K.; Howe, B.; Yan, A.; Winters, M.; Bassok, A.; Hirsch, J.A. Freedom from the Station: Spatial Equity in Access to Dockless Bike Share. J. Transp. Geogr. 2019, 74, 91–96. [Google Scholar] [CrossRef] [PubMed]
- Zhang, Y.; Lin, D.; Mi, Z. Electric Fence Planning for Dockless Bike-Sharing Services. J. Clean. Prod. 2019, 206, 383–393. [Google Scholar] [CrossRef]
- Aizpuru, M.; Farley, K.X.; Rojas, J.C.; Crawford, R.S.; Moore, T.J.; Wagner, E.R. Motorized Scooter Injuries in the Era of Scooter-Shares: A Review of the National Electronic Surveillance System. Am. J. Emerg. Med. 2019, 37, 1133–1138. [Google Scholar] [CrossRef]
- Beck, S.; Barker, L.; Chan, A.; Stanbridge, S. Emergency Department Impact Following the Introduction of an Electric Scooter Sharing Service. Emerg. Med. Australas. 2020, 32, 409–415. [Google Scholar] [CrossRef] [Green Version]
- Kobayashi, L.M.; Williams, E.; Brown, C.V.; Emigh, B.J.; Bansal, V.; Badiee, J.; Checchi, K.D.; Castillo, E.M.; Doucet, J. The E-Merging e-Pidemic of e-Scooters. Trauma Surg. Acute Care Open 2019, 4, e000337. [Google Scholar] [CrossRef] [Green Version]
- Mitchell, G.; Tsao, H.; Randell, T.; Marks, J.; Mackay, P. Impact of Electric Scooters to a Tertiary Emergency Department: 8-Week Review after Implementation of a Scooter Share Scheme. Emerg. Med. Australas. 2019, 31, 930–934. [Google Scholar] [CrossRef]
- Störmann, P.; Klug, A.; Nau, C.; Verboket, R.D.; Leiblein, M.; Müller, D.; Schweigkofler, U.; Hoffmann, R.; Marzi, I.; Lustenberger, T. Characteristics and Injury Patterns in Electric-Scooter Related Accidents-A Prospective Two-Center Report from Germany. J. Clin. Med. 2020, 9, 1569. [Google Scholar] [CrossRef]
- Hollingsworth, J.; Copeland, B.; Johnson, J.X. Are E-Scooters Polluters? The Environmental Impacts of Shared Dockless Electric Scooters. Environ. Res. Lett. 2019, 14, 084031. [Google Scholar] [CrossRef]
- De Bortoli, A.; Christoforou, Z. Consequential LCA for Territorial and Multimodal Transportation Policies: Method and Application to the Free-Floating e-Scooter Disruption in Paris. J. Clean. Prod. 2020, 273, 122898. [Google Scholar] [CrossRef]
- Moreau, H.; de Meux, L.d.J.; Zeller, V.; D’Ans, P.; Ruwet, C.; Achten, W.M.J. Dockless E-Scooter: A Green Solution for Mobility? Comparative Case Study between Dockless E-Scooters, Displaced Transport, and Personal E-Scooters. Sustainability 2020, 12, 1803. [Google Scholar] [CrossRef] [Green Version]
- Hosseinzadeh, A.; Algomaiah, M.; Kluger, R.; Li, Z. Spatial Analysis of Shared E-Scooter Trips. J. Transp. Geogr. 2021, 92, 103016. [Google Scholar] [CrossRef]
- McKenzie, G. Spatiotemporal Comparative Analysis of Scooter-Share and Bike-Share Usage Patterns in Washington, D.C. J. Transp. Geogr. 2019, 78, 19–28. [Google Scholar] [CrossRef]
- Moran, M.E.; Laa, B.; Emberger, G. Six Scooter Operators, Six Maps: Spatial Coverage and Regulation of Micromobility in Vienna, Austria. Case Stud. Transp. Policy 2020, 8, 658–671. [Google Scholar] [CrossRef]
- Zhu, R.; Zhang, X.; Kondor, D.; Santi, P.; Ratti, C. Understanding Spatio-Temporal Heterogeneity of Bike-Sharing and Scooter-Sharing Mobility. Comput. Environ. Urban Syst. 2020, 81, 101483. [Google Scholar] [CrossRef]
- Aguilera-García, Á.; Gomez, J.; Sobrino, N. Exploring the Adoption of Moped Scooter-Sharing Systems in Spanish Urban Areas. Cities 2020, 96, 102424. [Google Scholar] [CrossRef]
- Aguilera-García, Á.; Gomez, J.; Sobrino, N.; Díaz, J.J.V. Moped Scooter Sharing: Citizens’ Perceptions, Users’ Behavior, and Implications for Urban Mobility. Sustainability 2021, 13, 6886. [Google Scholar] [CrossRef]
- Arias-Molinares, D.; Romanillos, G.; García-Palomares, J.C.; Gutiérrez, J. Exploring the Spatio-Temporal Dynamics of Moped-Style Scooter Sharing Services in Urban Areas. J. Transp. Geogr. 2021, 96, 103193. [Google Scholar] [CrossRef]
- Eccarius, T.; Lu, C.-C. Adoption Intentions for Micro-Mobility—Insights from Electric Scooter Sharing in Taiwan. Transp. Res. Part D Transp. Environ. 2020, 84, 102327. [Google Scholar] [CrossRef]
- Eccarius, T.; Lu, C.-C. Powered Two-Wheelers for Sustainable Mobility: A Review of Consumer Adoption of Electric Motorcycles. Int. J. Sustain. Transp. 2020, 14, 215–231. [Google Scholar] [CrossRef]
- Pérez-Fernández, O.; García-Palomares, J.C. Parking Places to Moped-Style Scooter Sharing Services Using GIS Location-Allocation Models and GPS Data. ISPRS Int. J. Geo-Inf. 2021, 10, 230. [Google Scholar] [CrossRef]
- Howe, E.; Jakobsen, F.J. Global Moped Sharing Market Report 2020; UNU: Berlin, Germany, 2020. [Google Scholar]
- Pep, G. Redondea: Repensando la Movilidad Urbana de Una Forma Sostenible; Profit Editorial: Barcelona, Spain, 2020; ISBN 978-84-17942-76-2. [Google Scholar]
- Barcelona City Council S1/D/2019-1407. Regulació del Nombre i les Condicions D’atorgament de les Llicències Temporals d’ús Comú Especial del Domini Públic per a L’estacionament de Bicicletes, Ciclomotors i Motocicles d’ús Compartit; Barcelona City Council: Barcelona, Spain, 2019. [Google Scholar]
- Marquet, O.; Miralles-Guasch, C. City of Motorcycles. On How Objective and Subjective Factors Are behind the Rise of Two-Wheeled Mobility in Barcelona. Transp. Policy 2016, 52, 37–45. [Google Scholar] [CrossRef]
- Bach, X.; Marquet, O.; Miralles-Guasch, C. Assessing Social and Spatial Access Equity in Regulatory Frameworks for Moped-Style Scooter Sharing Services. Transp. Policy 2023, 132, 154–162. [Google Scholar] [CrossRef]
- Fishman, E.; Washington, S.; Haworth, N. Bike Share: A Synthesis of the Literature. Transp. Rev. 2013, 33, 148–165. [Google Scholar] [CrossRef] [Green Version]
- Shaheen, S.A.; Guzman, S.; Zhang, H. Bikesharing in Europe, the Americas, and Asia: Past, Present, and Future. Transp. Res. Rec. 2010, 2143, 159–167. [Google Scholar] [CrossRef] [Green Version]
- Parkes, S.D.; Marsden, G.; Shaheen, S.A.; Cohen, A.P. Understanding the Diffusion of Public Bikesharing Systems: Evidence from Europe and North America. J. Transp. Geogr. 2013, 31, 94–103. [Google Scholar] [CrossRef]
- Fishman, E.; Allan, V. Chapter Six—Bike Share. In Advances in Transport Policy and Planning; Fishman, E., Ed.; The Sharing Economy and The Relevance for Transport; Academic Press: Cambridge, MA, USA, 2019; Volume 4, pp. 121–152. [Google Scholar]
- Galatoulas, N.-F.; Genikomsakis, K.N.; Ioakimidis, C.S. Spatio-Temporal Trends of E-Bike Sharing System Deployment: A Review in Europe, North America and Asia. Sustainability 2020, 12, 4611. [Google Scholar] [CrossRef]
- O’Hern, S.; Estgfaeller, N. A Scientometric Review of Powered Micromobility. Sustainability 2020, 12, 9505. [Google Scholar] [CrossRef]
- Boglietti, S.; Barabino, B.; Maternini, G. Survey on E-Powered Micro Personal Mobility Vehicles: Exploring Current Issues towards Future Developments. Sustainability 2021, 13, 3692. [Google Scholar] [CrossRef]
- Peters, L.; MacKenzie, D. The Death and Rebirth of Bikesharing in Seattle: Implications for Policy and System Design. Transp. Res. Part A Policy Pract. 2019, 130, 208–226. [Google Scholar] [CrossRef]
- Kou, Z.; Cai, H. Understanding Bike Sharing Travel Patterns: An Analysis of Trip Data from Eight Cities. Phys. A Stat. Mech. Its Appl. 2019, 515, 785–797. [Google Scholar] [CrossRef]
- McKenzie, G. Urban Mobility in the Sharing Economy: A Spatiotemporal Comparison of Shared Mobility Services. Comput. Environ. Urban Syst. 2020, 79, 101418. [Google Scholar] [CrossRef]
- Levy, N.; Golani, C.; Ben-Elia, E. An Exploratory Study of Spatial Patterns of Cycling in Tel Aviv Using Passively Generated Bike-Sharing Data. J. Transp. Geogr. 2019, 76, 325–334. [Google Scholar] [CrossRef]
- Abduljabbar, R.L.; Liyanage, S.; Dia, H. The Role of Micro-Mobility in Shaping Sustainable Cities: A Systematic Literature Review. Transp. Res. Part D Transp. Environ. 2021, 92, 102734. [Google Scholar] [CrossRef]
- Sanders, R.L.; Branion-Calles, M.; Nelson, T.A. To Scoot or Not to Scoot: Findings from a Recent Survey about the Benefits and Barriers of Using E-Scooters for Riders and Non-Riders. Transp. Res. Part A Policy Pract. 2020, 139, 217–227. [Google Scholar] [CrossRef]
- Hosford, K.; Winters, M. Who Are Public Bicycle Share Programs Serving? An Evaluation of the Equity of Spatial Access to Bicycle Share Service Areas in Canadian Cities. Transp. Res. Rec. 2018, 2672, 42–50. [Google Scholar] [CrossRef]
- Wang, J.; Lindsey, G. Neighborhood Socio-Demographic Characteristics and Bike Share Member Patterns of Use. J. Transp. Geogr. 2019, 79, 102475. [Google Scholar] [CrossRef]
- Marquet, O. Spatial Distribution of Ride-Hailing Trip Demand and Its Association with Walkability and Neighborhood Characteristics. Cities 2020, 106, 102926. [Google Scholar] [CrossRef]
- McQueen, M.; Abou-Zeid, G.; MacArthur, J.; Clifton, K. Transportation Transformation: Is Micromobility Making a Macro Impact on Sustainability? J. Plan. Lit. 2021, 36, 46–61. [Google Scholar] [CrossRef]
- Wang, M.; Zhou, X. Bike-Sharing Systems and Congestion: Evidence from US Cities. J. Transp. Geogr. 2017, 65, 147–154. [Google Scholar] [CrossRef]
- Teixeira, J.F.; Silva, C.; e Sá, F.M. Empirical Evidence on the Impacts of Bikesharing: A Literature Review. Transp. Rev. 2021, 41, 329–351. [Google Scholar] [CrossRef]
- Saberi, M.; Ghamami, M.; Gu, Y.; Shojaei, M.H.; Fishman, E. Understanding the Impacts of a Public Transit Disruption on Bicycle Sharing Mobility Patterns: A Case of Tube Strike in London. J. Transp. Geogr. 2018, 66, 154–166. [Google Scholar] [CrossRef]
- IDESCAT Institut d’estadística de Catalunya (Statistics Institute of Catalonia). Available online: www.idescat.cat (accessed on 22 February 2020).
- Marquet, O.; Miralles-Guasch, C. Walking Short Distances. The Socioeconomic Drivers for the Use of Proximity in Everyday Mobility in Barcelona. Transp. Res. Part A Policy Pract. 2014, 70, 210–222. [Google Scholar] [CrossRef]
- Marquet, O.; Miralles-Guasch, C. The Walkable City and the Importance of the Proximity Environments for Barcelona’s Everyday Mobility. Cities 2015, 42, 258–266. [Google Scholar] [CrossRef]
- Jiao, J.; Bai, S. Understanding the Shared E-Scooter Travels in Austin, TX. ISPRS Int. J. Geo-Inf. 2020, 9, 135. [Google Scholar] [CrossRef] [Green Version]
- Bai, S.; Jiao, J. Dockless E-Scooter Usage Patterns and Urban Built Environments: A Comparison Study of Austin, TX, and Minneapolis, MN. Travel Behav. Soc. 2020, 20, 264–272. [Google Scholar] [CrossRef]
- Eren, E.; Uz, V.E. A Review on Bike-Sharing: The Factors Affecting Bike-Sharing Demand. Sustain. Cities Soc. 2020, 54, 101882. [Google Scholar] [CrossRef]
- Lu, W.; Scott, D.M.; Dalumpines, R. Understanding Bike Share Cyclist Route Choice Using GPS Data: Comparing Dominant Routes and Shortest Paths. J. Transp. Geogr. 2018, 71, 172–181. [Google Scholar] [CrossRef]
- Štraub, D.; Gajda, A. E-Scooter Sharing Schemes Operational Zones in Poland: Dataset on Voivodeship Capital Cities. Data Brief 2020, 33, 106560. [Google Scholar] [CrossRef]
- United Nations. United Nations Guidelines on Real Property Units; United Nations: New York, NY, USA, 2004. [Google Scholar]
- INE Atlas de Distribución de Renta de Los Hogares. Available online: https://www.ine.es/experimental/atlas/experimental_atlas.htm (accessed on 15 February 2020).
- Hugo, P.; Lewis, D. Measuring Access to Public Transport in European Cities; DG Regional and Urban Policy; European Commission: Bruxelles, Belgium, 2015. [Google Scholar]
- Google GTFS Static Overview. Available online: https://developers.google.com/transit/gtfs/ (accessed on 15 February 2020).
- Fransen, K.; Neutens, T.; Farber, S.; De Maeyer, P.; Deruyter, G.; Witlox, F. Identifying Public Transport Gaps Using Time-Dependent Accessibility Levels. J. Transp. Geogr. 2015, 48, 176–187. [Google Scholar] [CrossRef]
- Luo, D.; Cats, O.; van Lint, H.; Currie, G. Integrating Network Science and Public Transport Accessibility Analysis for Comparative Assessment. J. Transp. Geogr. 2019, 80, 102505. [Google Scholar] [CrossRef] [Green Version]
- De Solà-Morales i Rubió, M. Miradas Sobre La Ciudad, 1st ed.; Acantilado: Barcelona, Spain, 2021; ISBN 978-84-18370-18-2. [Google Scholar]
- Gallez, C.; Motte-Baumvol, B. Inclusive Mobility or Inclusive Accessibility? A European Perspective. CED 2017, 56, 79–104. [Google Scholar] [CrossRef] [Green Version]
- Mastercard Global Destination Cities Index. 2019. Available online: https://www.mastercard.com/news/insights/2019/global-destination-cities-index-2019/ (accessed on 15 February 2020).
- Cohen, A.P.; Shaheen, S.A. Planning for Shared Mobility; PAS Report; American Planning Association: Chicago, IL, USA, 2016; ISBN 978-1-61190-186-3. [Google Scholar]
- Shaheen, S.; Cohen, A. Shared Micromoblity Policy Toolkit: Docked and Dockless Bike and Scooter Sharing; UC Berkeley: Transportation Sustainability Research Center: Berkeley, CA, USA, 2019. [Google Scholar] [CrossRef]
- Carrara, E.; Ciavarella, R.; Boglietti, S.; Carra, M.; Maternini, G.; Barabino, B. Identifying and Selecting Key Sustainable Parameters for the Monitoring of E-Powered Micro Personal Mobility Vehicles. Evidence from Italy. Sustainability 2021, 13, 9226. [Google Scholar] [CrossRef]
Figure 1.
Socio-territorial variables and operator service areas in July 2019. (a) Public transport accessibility and Movo’s service area; (b) Slope and Acciona’s service area; (c) Household disposable income and Cooltra’s service area; (d) Population density of age group 21–49 years and Yego’s service area.

Figure 2.
MSS viable coverage area, metropolitan facilities, and city center.

Figure 3.
A simplified sketch of the methodology. Source: own production.


Table 1.
Territorial unit, year, and source of the explanatory socio-territorial variables.
| Socio-Territorial Variable | Year | Territorial Unit 1 | Data Source | References |
|---|---|---|---|---|
| Population density age group: 21–49 years | 2018 | Census section | Register of inhabitants (INE) | [30,64] |
| Household disposable income | 2017 | Census section | INE | [12,30] |
| Public transport accessibility | 2020 | Cadastral parcel | GTFS (public transport operators), ICGC and IDESCAT | [51,65] |
| Slope | 2020 | Cadastral parcel | ICGC | [66,67] |
| Distance to the city center | 2020 | - | Google Maps | [64,65] |
| Metropolitan and Supramunicipal facilities | 2019 | - | Facilities database (AMB) | [10,29] |
1 The territorial unit reported is the one that was initially collected, but socio-territorial variables have then been transformed into cadastral parcel territorial units to have homogeneity among all of them.
Table 2.
Descriptive statistics of cadastral parcels for Barcelona and l’Hospitalet de Llobregat (N = 86,868).
Table 2.
Descriptive statistics of cadastral parcels for Barcelona and l’Hospitalet de Llobregat (N = 86,868).
| Socio-Territorial Variable | N | % | Median | IQR |
|---|---|---|---|---|
| Cadastral parcels with Movo service (dependent variable for Model 1) | 32,593 | 37.5% | - | - |
| Cadastral parcels with Acciona service (dependent variable for Model 2) | 46,375 | 53.4% | - | - |
| Cadastral parcels with Cooltra service (dependent variable for Model 3) | 49,287 | 56.7% | - | - |
| Cadastral parcels with Yego service (dependent variable for Model 4) | 44,672 | 51.4% | - | - |
| Cadastral parcels with Barcelona’s viable coverage area (dependent variable for Model 5) | 49,278 | 56.7% | - | - |
| Public transport accessibility | ||||
| Very High | 50,127 | 57.7% | - | - |
| High | 31,803 | 36.6% | - | - |
| Medium | 1950 | 2.2% | - | - |
| Low | 2988 | 3.4% | - | - |
| Cadastral parcels with a metropolitan facility | 5995 | 6.9% | - | - |
| Population density—21–49 years of age (people per hectare) | - | - | 226 | 403 |
| Household disposable income (€) | - | - | 33,609 | 11,588 |
| Distance to the city center (m) | - | - | 4502 | 3160 |
| Slope (%) | - | - | 8 | 6 |
Table 3.
Binomial generalized linear mixed outcome for the five models (N = 86,868). The binary dependent variable of each model represents whether or not each cadastral parcel is in the service area (1 = included; 0 = not included).
Table 3.
Binomial generalized linear mixed outcome for the five models (N = 86,868). The binary dependent variable of each model represents whether or not each cadastral parcel is in the service area (1 = included; 0 = not included).
| Model 1. Movo | Model 2. Acciona | Model 3. Cooltra | Model 4. Yego | Model 5. Barcelona | |||||||||||
|---|---|---|---|---|---|---|---|---|---|---|---|---|---|---|---|
| Odds Ratio | p | 95% CI | Odds Ratio | p | 95% CI | Odds Ratio | p | 95% CI | Odds Ratio | p | 95% CI | Odds Ratio | p | 95% CI | |
| (Intercept) | 0.040 | <0.001 **1 | (0.008, 0.212) | 3.103 | 0.123 ‡ | (0.736, 13.078) | 4.664 | 0.019 † | (1.287, 16.907) | 1.952 | 0.337 ‡ | (0.498, 7.650) | 1.990 | 0.443 ‡ | (0.343, 11.154) |
| Pop. density of age group 21–49 years | 1.009 | 0.588 ‡ | (0.977, 1.042) | 1.078 | <0.001 ** | (1.042, 1.115) | 1.188 | <0.001 ** | (1.149, 1.226) | 1.078 | 0.002 * | (1.028, 1.130) | 1.395 | <0.001 ** | (1.302, 1.495) |
| Household disposable income | 1.703 | <0.001 ** | (1.592, 1.821) | 1.718 | <0.001 ** | (1.594, 1.851) | 1.588 | <0.001 ** | (1.473, 1.712) | 1.540 | <0.001 ** | (1.403, 1.692) | 1.016 | 0.771 ‡ | (0.914, 1.130) |
| Distance to the city center | 0.002 | <0.001 ** | (0.001, 0.002) | 0.025 | <0.001 ** | (0.021, 0.031) | 0.046 | <0.001 ** | (0.038, 0.055) | 0.000 | <0.001 ** | (0.000, 0.000) | 0.001 | <0.001 ** | (0.000, 0.001) |
| Slope | 0.247 | <0.001 ** | (0.225, 0.270) | 0.292 | <0.001 ** | (0.272, 0.314) | 0.255 | <0.001 ** | (0.238, 0.274) | 0.275 | <0.001 ** | (0.247, 0.305) | 0.238 | <0.001 ** | (0.214, 0.261) |
| Public transport accessibility | |||||||||||||||
| Low | 0.113 | <0.001 ** | (0.067, 0.191) | 0.360 | <0.001 ** | (0.282, 0.460) | 0.214 | <0.001 ** | (0.167, 0.274) | 0.214 | <0.001 ** | (0.127, 0.359) | 0.583 | 0.003 * | (0.407, 0.835) |
| Medium | 0.292 | <0.001 ** | (0.228, 0.374) | 0.679 | <0.001 ** | (0.546, 0.844) | 0.672 | <0.001 ** | (0.544, 0.830) | 0.707 | 0.027 † | (0.520, 0.961) | 1.072 | 0.575 ‡ | (0.841, 1.365) |
| High (ref.) | - | - | - | - | - | - | - | - | - | - | - | - | - | - | - |
| Very High | 0.970 | 0.373 ‡ | (0.906, 1.038) | 0.751 | <0.001 ** | (0.693, 0.813) | 0.814 | <0.001 ** | (0.758, 0.875) | 1.832 | <0.001 ** | (1.641, 2.046) | 2.118 | <0.001 ** | (1.868, 2.401) |
| With a metropolitan or supramunicipal facility | 1.157 | 0.011 † | (1.035, 1.294) | 1.504 | <0.001 ** | (1.304, 1.735) | 1.244 | 0.001 * | (1.091, 1.419) | 1.476 | <0.001 ** | (1.185, 1.838) | 0.914 | 0.355 ‡ | (0.754, 1.106) |
Note: Level of significance = ‘**’ p < 0.001, ‘*’ p < 0.01, ‘†’ p < 0.1, ‘‡’ p < 1. 1 Movo is the only operator serving less than half of the cadastral parcels of the city (Table 2). This explains why in the intercept results, the Movo model is the only one with a statistically significant intercept.
Disclaimer/Publisher’s Note: The statements, opinions and data contained in all publications are solely those of the individual author(s) and contributor(s) and not of MDPI and/or the editor(s). MDPI and/or the editor(s) disclaim responsibility for any injury to people or property resulting from any ideas, methods, instructions or products referred to in the content. |
© 2023 by the authors. Licensee MDPI, Basel, Switzerland. This article is an open access article distributed under the terms and conditions of the Creative Commons Attribution (CC BY) license (https://creativecommons.org/licenses/by/4.0/).
Share and Cite
MDPI and ACS Style
Bach, X.; Miralles-Guasch, C.; Marquet, O. Spatial Inequalities in Access to Micromobility Services: An Analysis of Moped-Style Scooter Sharing Systems in Barcelona. Sustainability 2023, 15, 2096. https://doi.org/10.3390/su15032096
AMA Style
Bach X, Miralles-Guasch C, Marquet O. Spatial Inequalities in Access to Micromobility Services: An Analysis of Moped-Style Scooter Sharing Systems in Barcelona. Sustainability. 2023; 15(3):2096. https://doi.org/10.3390/su15032096
Chicago/Turabian StyleBach, Xavier, Carme Miralles-Guasch, and Oriol Marquet. 2023. "Spatial Inequalities in Access to Micromobility Services: An Analysis of Moped-Style Scooter Sharing Systems in Barcelona" Sustainability 15, no. 3: 2096. https://doi.org/10.3390/su15032096
Note that from the first issue of 2016, this journal uses article numbers instead of page numbers. See further details here.