Article

Experimental Analysis of the Thermal Performance of Wood Fiber Insulating Panels

1
Department of Industrial, Electronic and Mechanical Engineering, Roma TRE University, Via Vito Volterra 62, 00146 Rome, Italy
2
Department of Philosophy, Communication and Performing Arts, Roma TRE University, Via Ostiense 234, 00146 Rome, Italy
3
Department of Engineering, University of Palermo, Viale delle Scienze, 90128 Palermo, Italy
*
Author to whom correspondence should be addressed.
Sustainability 2023, 15(3), 1963; https://doi.org/10.3390/su15031963
Submission received: 19 December 2022 / Revised: 13 January 2023 / Accepted: 16 January 2023 / Published: 19 January 2023
(This article belongs to the Topic Building Energy Efficiency)

Abstract

:
During the last decades, attention to energy and environmental problems has significantly grown, along with the development of international and national policies addressing sustainability issues. In the construction sector, one of the most widespread energy efficiency strategies consists of thermal insulation of buildings thanks to external insulating panels. Among these, wood fiber is an insulating material characterized by a natural, eco-sustainable and biodegradable structure, coming from the recycling of waste wood from sawmills. The present study aimed to characterize small test building insulated with wood fiber panels from the thermal point of view, comparing the results with those of an identical, non-insulated reference test building. The experimental campaign highlighted several advantages and an excellent thermal performance provided by the eco-sustainable solution of wood fiber insulating panels: Lower values of the thermal transmittance (−57%), thus ensuring greater stability of the internal air temperature and better values in terms of attenuation (−60% in summer and −74 % in winter) and phase shift (+2 h in summer and +2.28 h in winter) compared to those obtained from the reference building. The material is also equipped with an Environmental Performance Declaration (EPD) that certifies its environmental benefits.

1. Introduction

Anthropogenic Greenhouse Gases emissions (GHG) are considered to be mainly responsible for global warming and climate change [1].
In this context, buildings play a fundamental role, being responsible for a significant percentage of total energy consumption worldwide, producing about 40% of CO2 emissions and 38% of waste. Even at the European level, data are worrying, in fact buildings are responsible for about 40% of energy consumption and about 36% of greenhouse gas emissions, mainly due to buildings heating and cooling needs and to the production of materials for their construction and use [2,3,4].
Improving energy efficiency and energy consumption of the construction sector, increasing the employment of renewable energy sources, and making production and transport processes of building materials more sustainable are urgent and crucial measures that need to be applied in order to achieve the ambitious purpose of carbon neutrality by 2050, as defined in the European Green Deal [5,6,7,8,9,10,11,12,13].
In fact, current trends in residential construction require a significant adjustment towards the increasingly stringent requirements of structural quality, thermal and energy performance and internal comfort, as well as the growing awareness towards the use of materials with lower economic and environmental impact.
In this context, the European Commission in March 2020 adopted the new “Action Plan on the circular economy for a cleaner and more competitive Europe” [14]. Indeed, the European Parliament has requested to bind targets for 2030 to make consumer products more sustainable starting from their design. Therefore, rules have been defined in the Plan to design products with a greater use of recycled raw materials, longer lasting products, easier to reuse, repair and recycle.
Furthermore, the definition of the “Investment Plan for a Sustainable Europe” [15] was central to the EU strategies, aimed at promoting and facilitating the transition towards a climate-friendly, competitive and inclusive economy. Indeed, the Plan combined legislative and non-legislative initiatives to achieve three objectives: (i) Mobilize funding worth at least EUR 1 trillion from the EU budget and other public and private sources over the next decade; (ii) placing sustainability at the heart of investment decisions in all sectors; and (iii) provide support to public administrations and project promoters to build a strong pipeline of sustainable projects.
The close links between environmental sustainability objectives and the application of the circular economy and solid waste recovery model have led numerous companies to actively pursue alternative approaches to the linear “take-make-waste” model. In fact, the report “Achieving a Circular Economy: How the Private Sector is Reimagining the Future of Business” [16] presents companies that are contributing business solutions to societal challenges, illustrating a collection of best practices and strategies on how these companies are exploiting the environmental, economic and social opportunities offered by the circular economy in a profitable way.
With regard to the building sector, the most ambitious goal of a modern and sustainable building is to drastically reduce energy and environmental consumption.
To ensure energy efficient building behavior, the implementation of an adequate thermal insulation system is undoubtedly an excellent strategy in order to obtain the reduction of heat loss, the increase in thermal lag, as well as an adequate level of indoor comfort guaranteed throughout the year.
From this perspective, the use of natural and sustainable insulating materials could be a viable solution, since the thermal insulation properties of buildings are often entrusted to petrochemical (often polystyrene) or mineral (glass or rock) artificial materials [17,18,19,20].
Asdrubali et al. [20] reported a state of the art product for the insulation of buildings made with unconventional materials, highlighting their thermal, acoustic and environmental performances.
These unconventional products can be manufactured using natural sources such as residues from agricultural production and processing industries. Other sources are represented by recycled products or by-products of industrial plants. The study showed that some of the materials investigated are characterized by performance similar to commercial ones. As far as thermal issues are concerned, an example is given by a recycled cotton insulation having a density and thermal conductivity comparable to EPS, XPS and sheep’s wool. Focusing instead on acoustic performance, high values of sound absorption and insulation were measured in materials made from recycled denim. Products made from PET and recycled fabric are also characterized by better environmental performance than those made from rock wool and kenaf fiber.
Cetiner et al. [21], in a study, highlighted how wood waste could be used as insulation material applied to wood frame wall construction by manual filling or mechanical blowing of the bulk filling material between the frame uprights and without the addition of any binder, obtaining a slightly higher thermal conductivity than inorganic materials and close to that of some natural insulating materials.
Kristak et al. [22] demonstrated that wooden materials, i.e., larch bark composites with densities between 350 and 700 kg/m3, could be successfully used for thermal insulation in buildings, obtaining insulating bark panels with a density of about 350–400 kg/m3, with a thermal conductivity in the range of 0.065–0.070 W/mK, thermal diffusivity in the range of 0.13–0.17 mm2/s and a specific heat capacity of about 1300 J/kgK, therefore comparable to other insulating panels.
Several studies have also been conducted on the use of alternative feedstocks such as agricultural biomass and recycled wood waste and by-products in the production of a particle board may prove to be a viable approach to address the increasing global demand for wood-based materials [23].
However, a relevant problem with particle board and other engineered wood products manufactured from agricultural waste biomass and/or recycled wood waste is the lack of sufficient information on their fire characteristics and reaction to fire; in fact, their combustion remains an aspect to be taken into consideration due to the recent stringent fire regulations.
Nevertheless, the promising carbon footprint of wood, in addition to their insulating capabilities, make insulating panels based on wood fibers a valid solution for an increasingly sustainable design.
In particular, wood fiber is a completely recyclable and biocompatible product of vegetable origin and is generally not subjected to chemical treatments, with substances such as formaldehyde.
Wood fiber panels are characterized by excellent thermal insulation qualities, sound insulation properties, biodegradability, light weight and low environmental impact and durability.
In fact, it is a completely recyclable and biocompatible product of plant origin and it is generally not subjected to chemical treatments, with substances such as formaldehyde. The wood fiber panels are characterized by excellent thermal insulation qualities, acoustic insulation properties, biodegradability, lightness and low environmental impact and durability. The material is commercially available in the form of panels, which can differ in thickness, porosity and hardness depending on the context of use. There are commercial products containing wood fibers from certified forests and with environmental labels such as the Environmental Product Declaration (EPD) [24,25,26,27,28,29].
Wood fiber materials require less energy during production and can contribute to reduce emissions compared to mineral or petrochemical based insulation materials [30,31,32,33], but still maintaining good insulating properties [34,35,36].
At the same time materials environmental effects and their sustainable aspects in buildings applications need to be assessed. Wood-based insulation materials are characterized by remarkable hygroscopic qualities, due to the moisture capacity that is higher compared to the traditional products, such as mineral wool insulation [36,37,38,39]. Due to this characteristic, using natural and highly hygroscopic insulation may have a positive effect on the moisture conditions in wood-frame constructions [40,41,42,43,44]. It is also worth noticing that the wood fiber resists humidity very well and tends to keep its characteristics unchanged even if the percentage of humidity is very high.
Furthermore, technological changes have also recently been noted regarding the adhesive systems and additives used in European industries for particle board, medium density fibreboard (MDF) and oriented strand board (OSB) dictated by the obligation to achieve emissions even lower formaldehyde levels and the need to reduce production costs due to strong competition in the wood-based panel market sector [45].
Several studies analyzed the hygrothermal performance of wall panels by employing wood fiber, mineral wool application on masonry walls, concrete and brick wall panels, hemp fiber and mineral wool insulation [46,47,48]. Additionally, in-situ experimental studies were carried out to assess the hygric, thermal or hygrothermal performance of wall panels or insulation materials and wall panels incorporating wood fibre, mineral wool and hemp-lime [49,50,51,52,53,54,55,56,57].
Among the different possible ways to potentially improve panel properties, in particular the surface quality, there is the possibility of adding wood fibers to face layers. In [58], the properties of structure modified by adding different typologies and quantities of wood fibers were studied. It is also possible to modify the quality of wood-based panel produced by working on parameters or on the surface structure. Moreover, it is worth noticing that the materials mechanical and physical properties can be modified by the fiber’s degree of defibration [59].
Wooden houses ensure significant energy savings, with a significant reduction in consumption and environmental impact [60,61,62,63].
Finally, wood fiber perfectly meets the principles of environmental sustainability and energy efficiency and can be included in a virtuous circle of recycling and circular economy [50,51,52,64,65,66]. Thus, in the past years, the employment of green materials has also grown worldwide as the green building concept [53,54,55,67,68,69].
There are a few references in the literature regarding the effects of adding different fibers to the panels structure. The fibers’ morphological characteristic is fundamental when specific fiberboards, such as Medium Density Fiberboard (MDF), are employed and analyzed [70,71,72,73].
The present study was conducted through a long-term experimental campaign, which was carried out on two identical masonry small building prototypes, one of which insulated with a layer of wood fiber insulation, with the aim of comparing and quantifying the different thermal behaviors of the walls and analyzing the benefits deriving from the installation of natural, eco-sustainable and biodegradable insulating material.
This paper has the following structure: Section 2 describes the materials and method of the research, providing information about the studied buildings and illustrating the applied methodology; Section 3 shows the results and discussion about data post-processing; finally, the conclusions are drawn in Section 4.

2. Materials and Methods
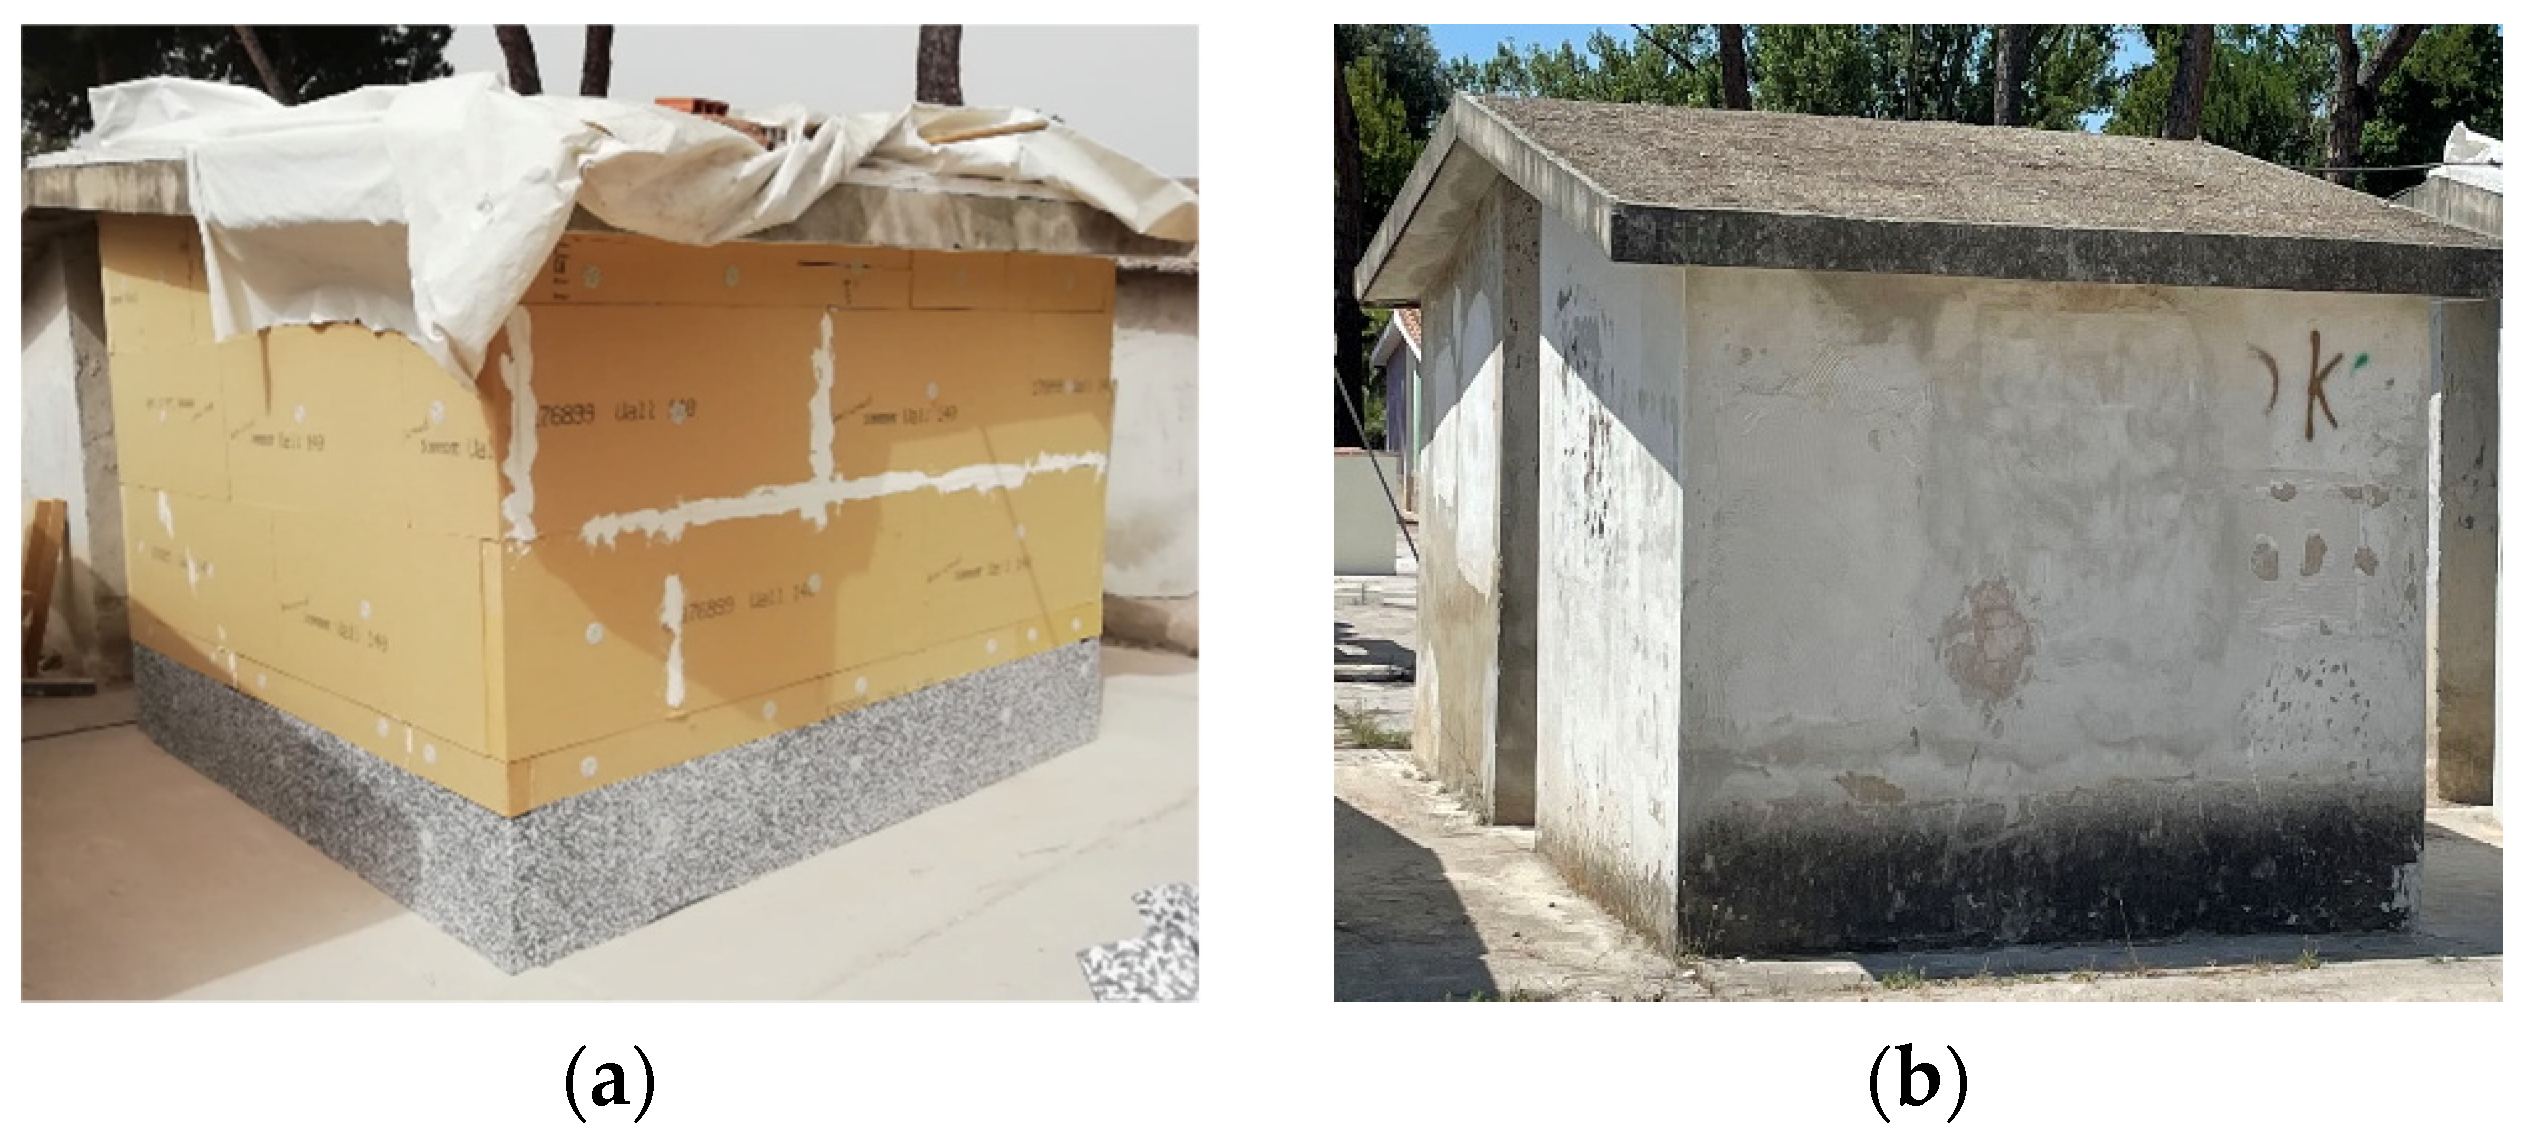
This study was conducted through an experimental campaign on a real case study in order to evaluate the in-situ performance of wood fiber-based panels. The thickness of the panels is the one typical for the retrofit of buildings in regions characterized by mild climate conditions.
The experimental measurements campaign was carried out in both summer and winter conditions near Rome, Italy, at the CEFMECTP school, on a small building entirely insulated with wood fiber panels. The thermal behavior of the insulated building was compared with a reference building with the same constructive characteristics but without wood fiber panels.

2.1. The Case Study

This experimental measurement campaigns took place at the CEFMECTP school located in Pomezia (Rome, climatic zone D) (Figure 1). CEFMECTP is a joint body for training and safety in construction managed by the Association of Building Constructors of Rome.
The buildings, used for the practical training of the students of the school, are characterized by their small size and by the same masonry construction method in reinforced concrete slab and tuff blocks with internal and external cladding with cement plaster (Figure 2).
The buildings used for the experimental campaign are identical and differ only due to the presence, in one of the two buildings, of an external insulation: a 80 mm thick wood fiber insulating panel applied to the perimeter walls.
In particular, a thickness of 80 mm was chosen for the wood fiber panels in order to guarantee an adequate level of thermal insulation of the study building.
In addition, it is one of the most used thicknesses for this type of insulation; the thickness present on the market for the selected panels is in fact between 60 mm and 160 mm.
Even the volumetric density (140 kg/m3) present in the selected panels respects the average values present on the market for the type treated.
The test building without insulation was instead used as a reference and comparison structure (Figure 3). Table 1 reports the buildings components stratigraphy.
The single-layer, homogeneous, rigid and water-repellent wood fiber panels selected for the experimentation are produced in Germany by the manufacturer 3THERM [74] with a composition of recycled silver and red fir fibers from the forests of Baden-Württemberg. Specifically, the “S WALL 140” semi-rigid, dry and plasterable panels used for thermal insulation have dimensions of 1250 mm × 600 mm with a thickness of 80 mm and are characterized by a volumetric density of 140 kg/m3, by a thermal conductivity equal to 0.040 W/mK and by a specific heat equal to 2100 J/kgK.
Furthermore, these panels stand out on the market for the certifications obtained, including the green building brand NaturePlus [75], the high mechanical resistance that gives the facade a stability guaranteed over time and compliance with the so-called Minimum Environmental Criteria, according to Italian Legislation [76], including: “Low emissions of materials” (art. 2.3.5.5); “Recovered and recycled material” (art. 2.4.1.2); “Absence of dangerous substances” (art. 2.4.1.3); “Sustainability and legality of wood” (art. 2.4.2.4); “Criteria for thermal and acoustic insulation” (art. 2.4.2.9) and “Use of renewable raw materials” (art. 2.6.4).
The wood fiber panels used in this study, in addition to being sustainable and with low environmental impact, are also equipped with the Environmental Product Declaration (EPD)—of the Institut Bauen und Umwelt e.V. [77], in accordance with ISO 14025: 2006 [78] and ISO 21930:2007 [79]. The panels are characterized by good values of Global Warming Potential (GWP) equal to −1.1346 kgCO2 eq/kg, total consumption of non-renewable energy resources (PENRT—Primary Energy Non-Renewable, Total-), equal to 9.76 MJ/kg, and renewable energy resources (PERT—Primary Energy Renewable, Total-), equal to 29.83 MJ/kg.
Furthermore, the values of the environmental impact indicators of the wood fiber panels selected for this study are perfectly aligned with those found in other EPDs of similar products on the market. As a matter of fact, different EPDs of wood fiber panels were analyzed [80,81,82,83,84,85] from various Program Operators, such as the “Institut Bauen und Umwelt e.V.” (IBU) [77] and the “Epd-Norge” [86], and characterized by a density between 50 and 170 kg/m3, a thermal conductivity between 0.036 and 0.047 W/mK and a specific thermal capacity of 2100 J/(kgK).
By comparing these EPDs, an average GWP value of −1.05 kgCO2eq/kg was determined, very close to the EPD value of the panels used (−1.13 kgCO2eq/kg), with values between −0.57 and −1.25 kgCO2eq/kg. Furthermore, the negative value of the GWP confirms the effectiveness of wood, and in this specific case, of wood fiber panels, which show a good absorption of CO2.
When it comes to the PENRT, an average value of 11.88 MJ/kg was recorded, very close to the reference 9.76 MJ/kg, with maximum and minimum values of 21.31 and 6.47 MJ/kg respectively. Finally, the average value recorded for the PERT is equal to 23.65 MJ/kg, in line with the 29.83 MJ/kg of the study panels, with values ranging between a minimum of 18.99 MJ/kg and a maximum of 30.58 MJ/kg.
All the available EPDs confirm the good properties of wood fiber insulating panels in terms of environmental performance and sustainability.

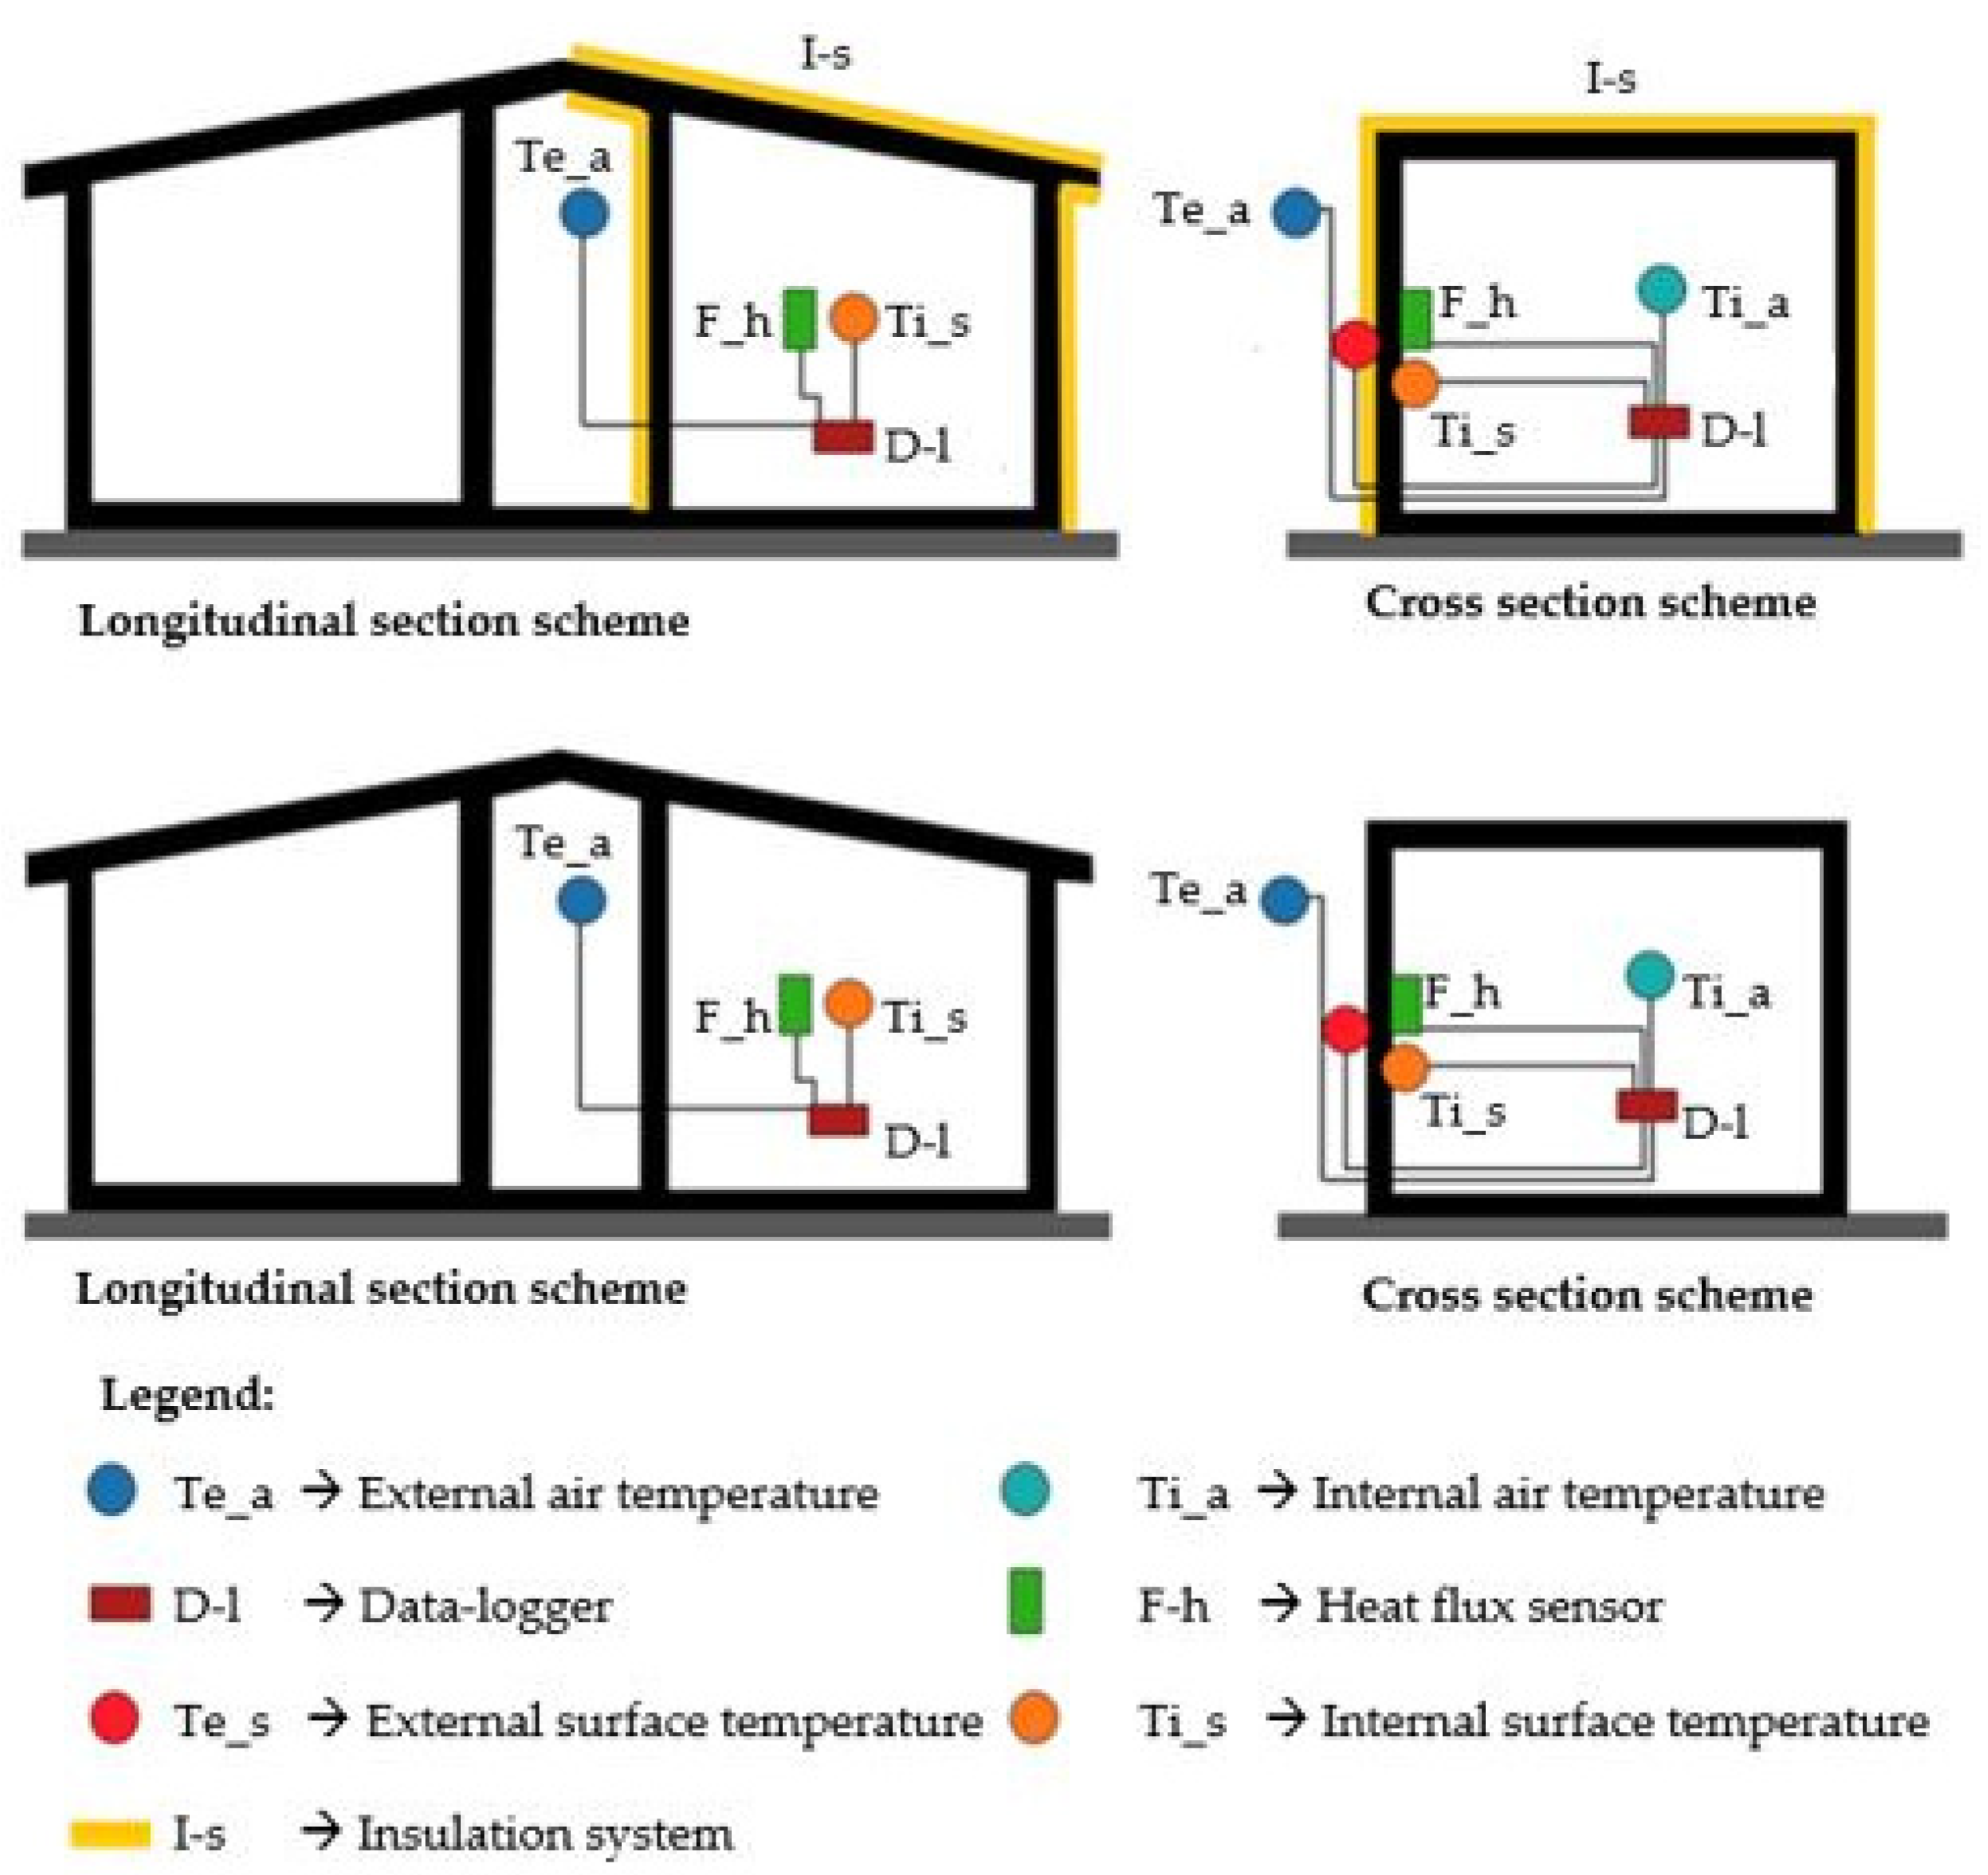
2.2. The Experimental Setup

To characterize the two buildings from a thermal point of view, measurements of the heat-flow density (q), and therefore, of thermal transmittance (U) were carried out, in addition to the evaluation of the external and internal temperatures of the two structures and internal and external surface temperatures of the walls exposed to the North-West for the calculation of the Decrement Factors (DF) and Phase Shift (PS).
The instrumentation installed in situ and represented in Figure 4 is inclusive of air temperature probes arranged inside and outside the two buildings while on the two walls facing North-West of the surface temperature probes and heat-flow meters were installed (on both internal and external sides). All sensors were connected to the respective data-logger for data recording. Table 2 shows the technical specifications of the measuring instruments.
The experimental campaign was conducted in both summer, in the period between July 2021 and October 2021, and in the winter, between November 2021 and February 2022.
In wintertime, measurements were carried out considering different scenarios in terms of switching on and off times of the heating system, represented by electric fan heaters, adequately shielded to avoid disturbing effects on the sensors. The experimentation took place with heating systems switched on (scenario called “On”), by evaluating, at the end of the heating phase, the subsequent phase of the two structures (phase of “Transition”), and by keeping the heating systems off within the two buildings (scenario defined as “Free-floating”).
In summertime, on the contrary, measurements were carried out only in free floating conditions.
During the processing of the acquired data, the phase shift of the thermal waves (PS -Phase Shift-) was determined as the time difference between the recording time of the maximum external surface temperature (h_Ts max_e) compared to the time with the maximum internal surface temperature recorded (h_Ts max_i) (1).
PS = h _ Ts   max e h _ Ts   max i
Instead, the attenuation of the thermal waves (DF—Decrement Factor) was calculated as the ratio among the difference between the maximum internal surface temperature ( T s max i ) and the average one ( T s avg i ), and the difference between the maximum external surface temperature ( T s max e ) and the average one ( T s avg e ) as defined in the following expression (2):
DF = [ T s max i   T s avg i T s max e   T s avg e ]
Finally, the measurement of the thermal transmittances U of the walls took place in accordance with the ISO 9869-1 standard [87]. The acquired data were processed using the progressive averages method, applying the following relationship (3):
U = j = 1 n q j j = 1 n ( T ai   T ae ) j
where Tai and Tae are, respectively, the indoor and outdoor air temperatures of the building analyzed and qj is the specific thermal flux.

3. Results and Discussion

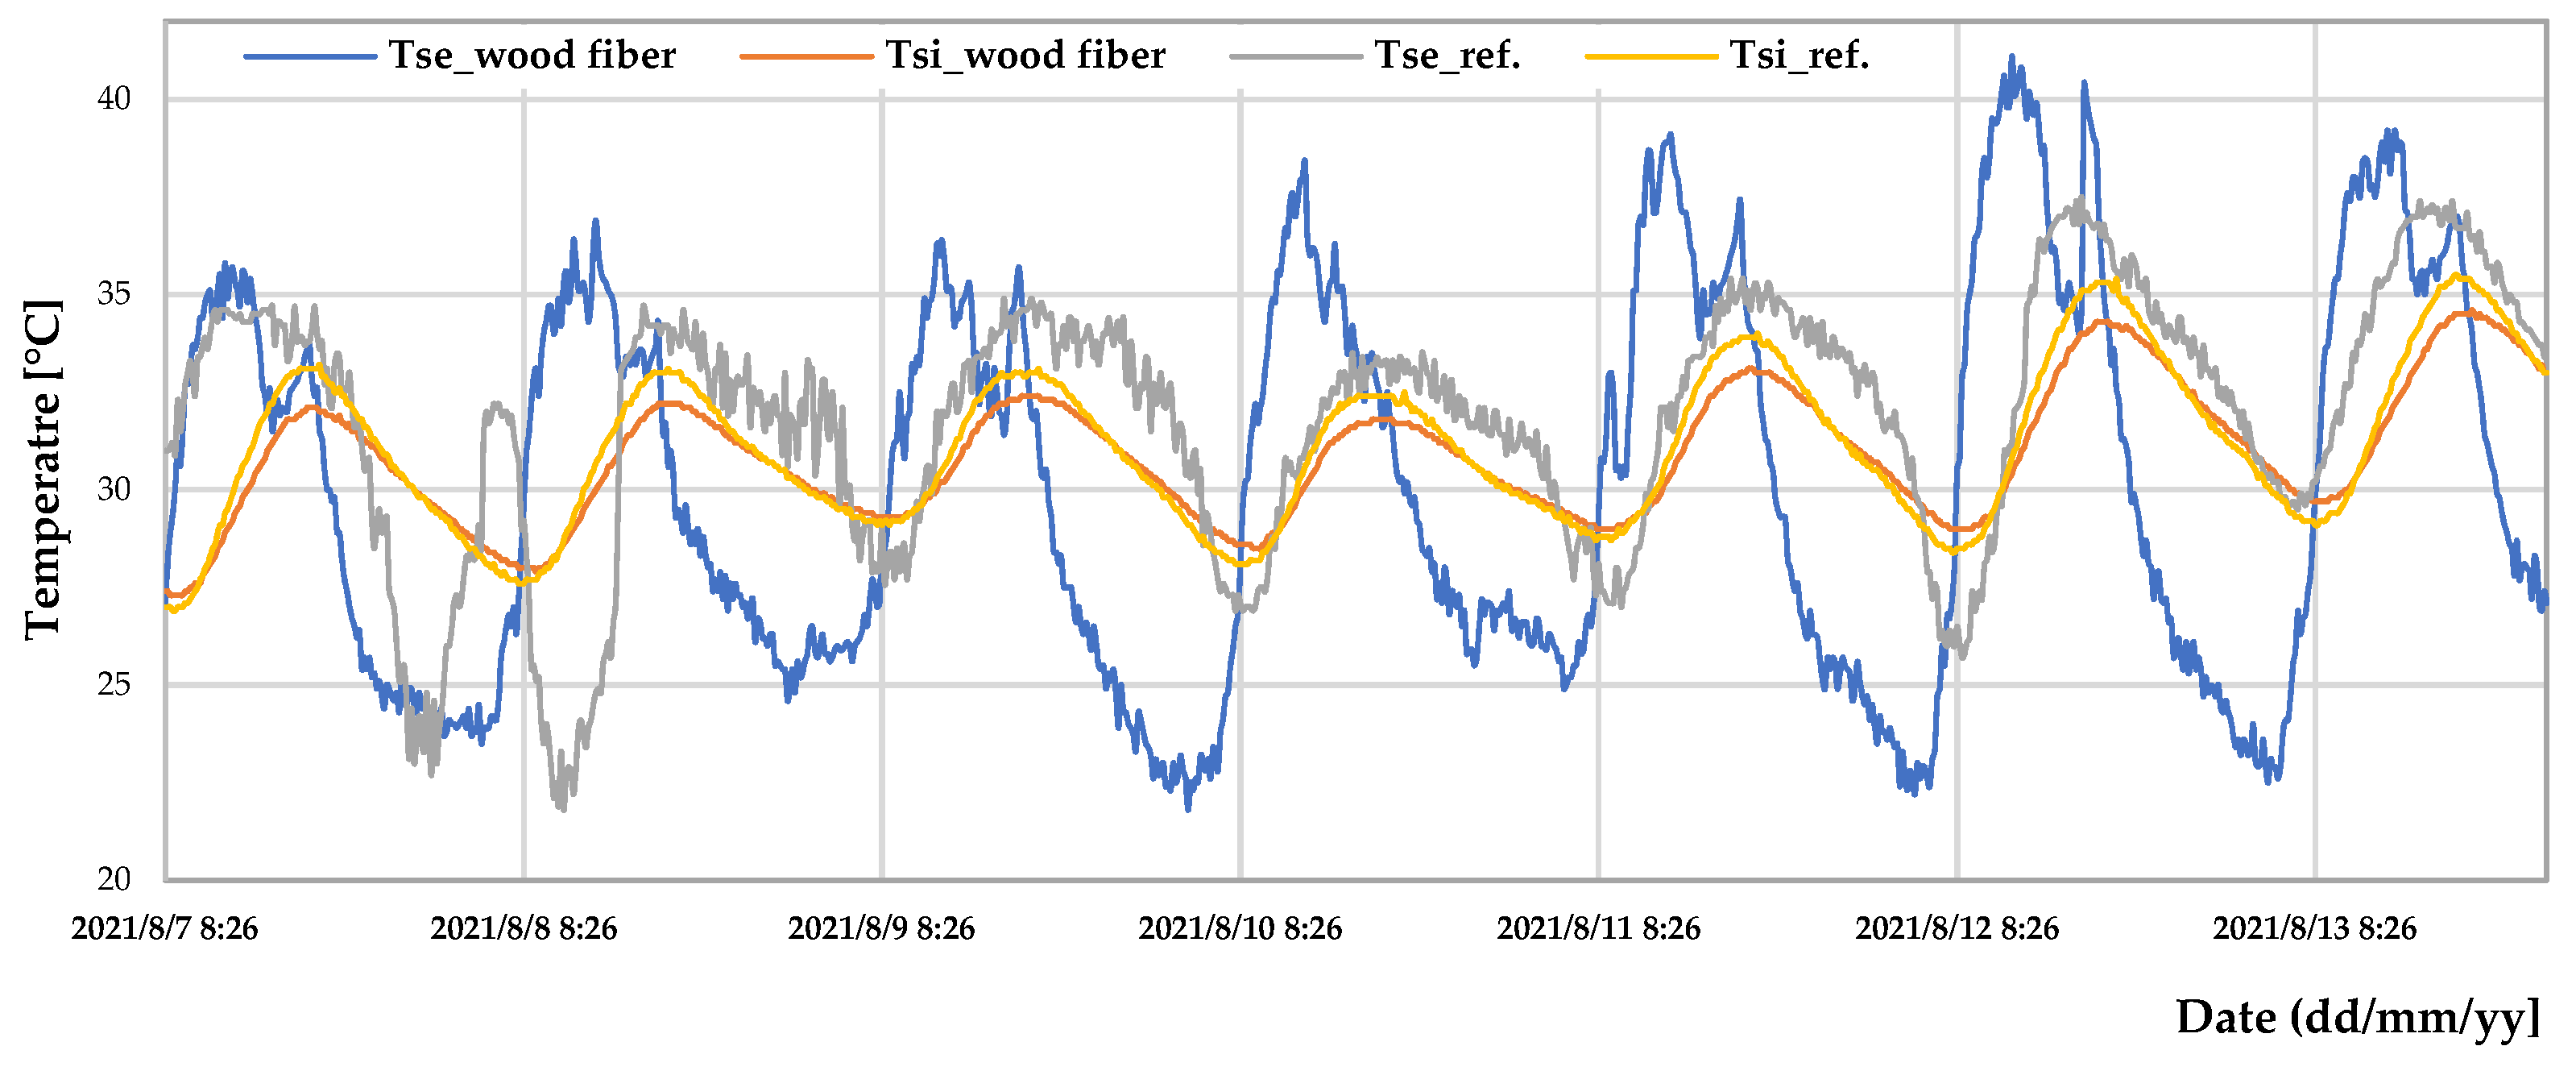
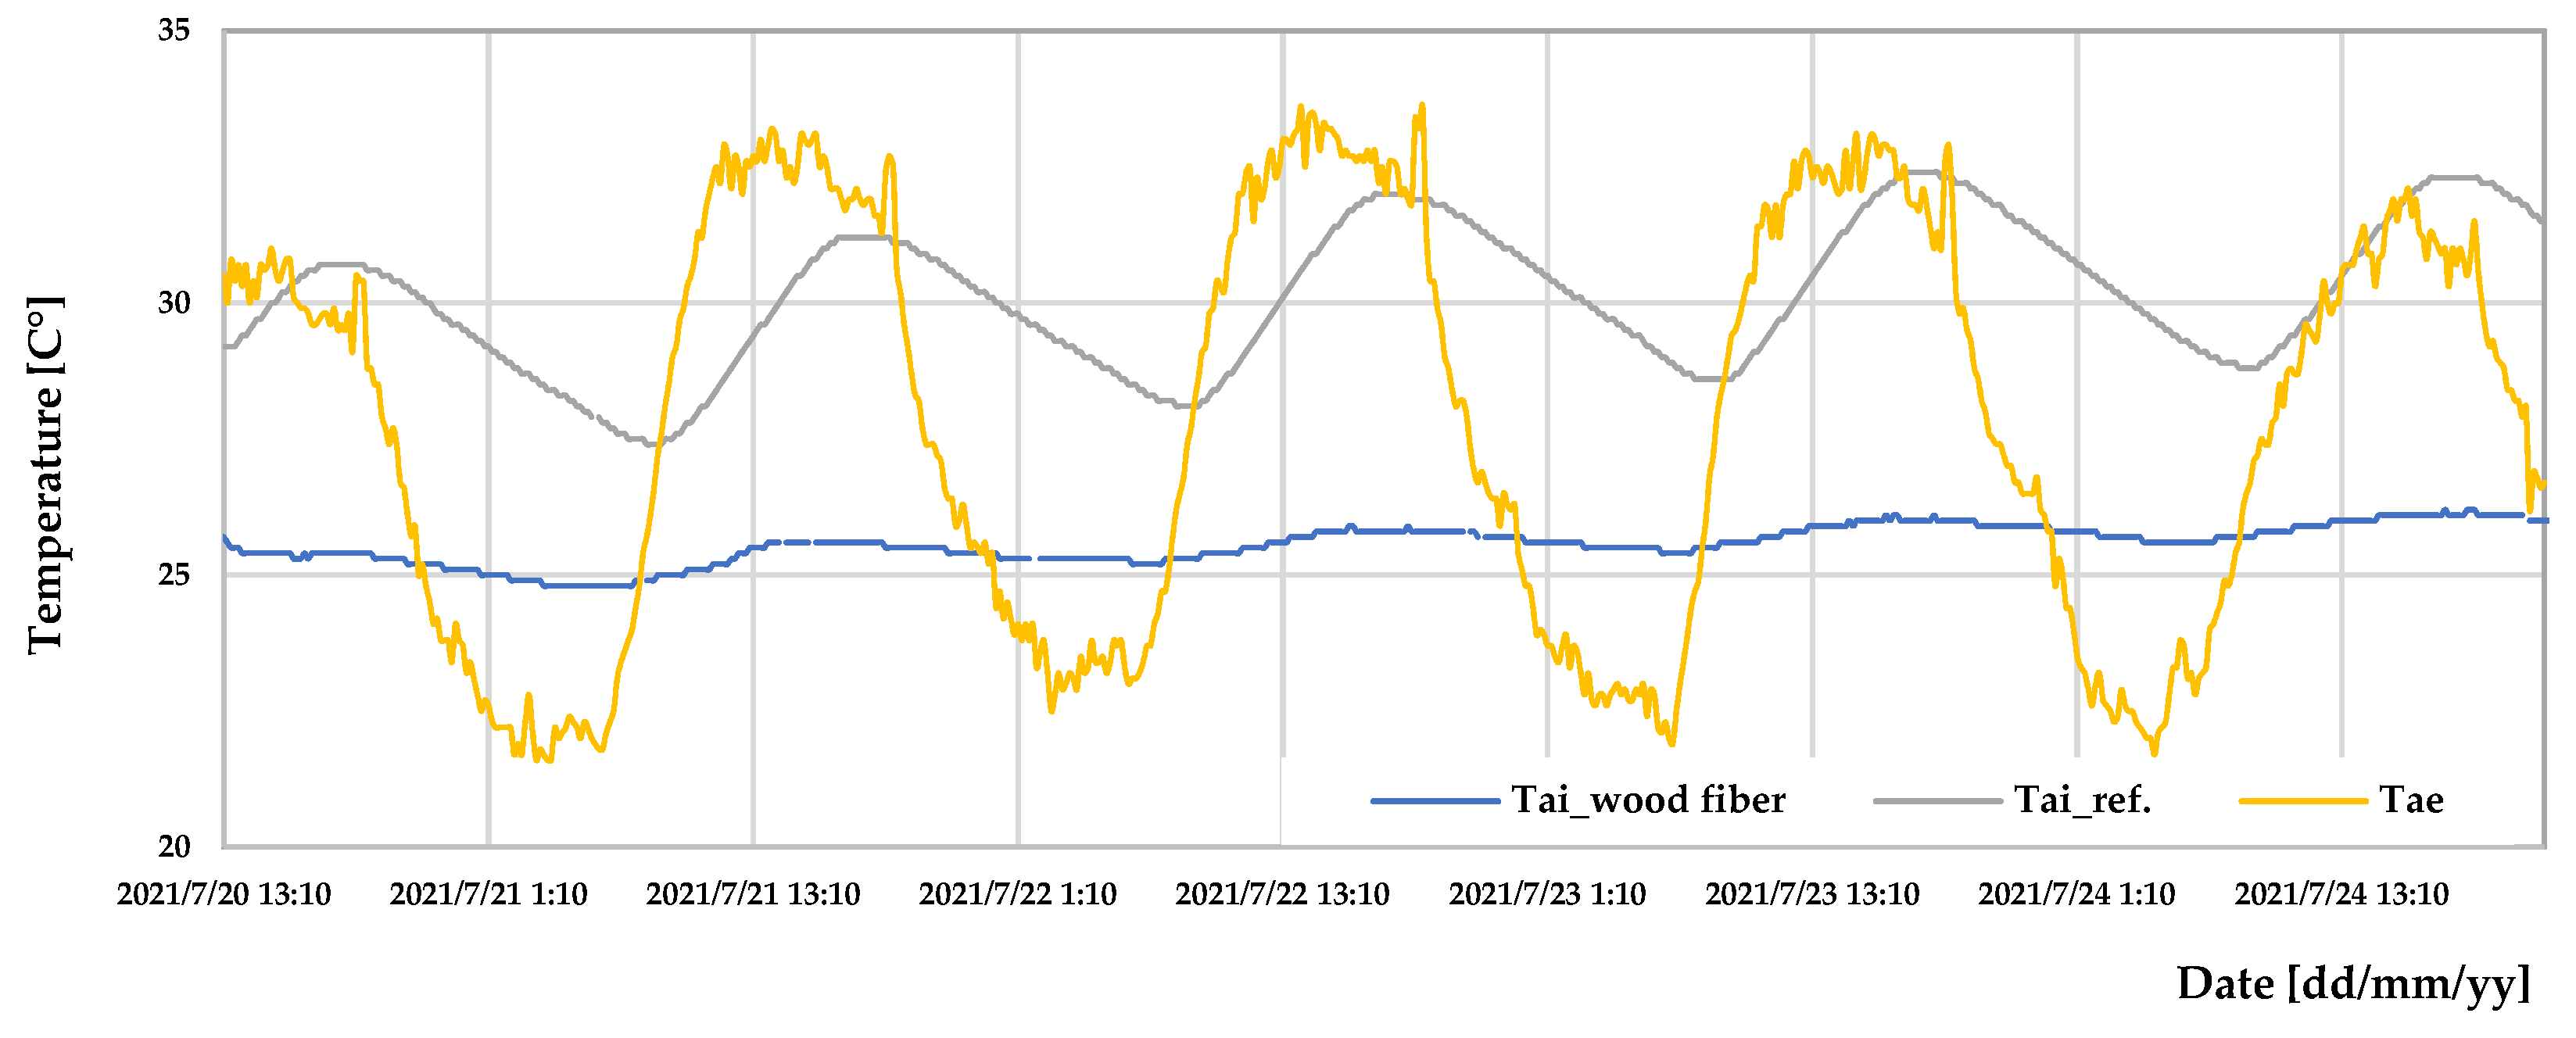
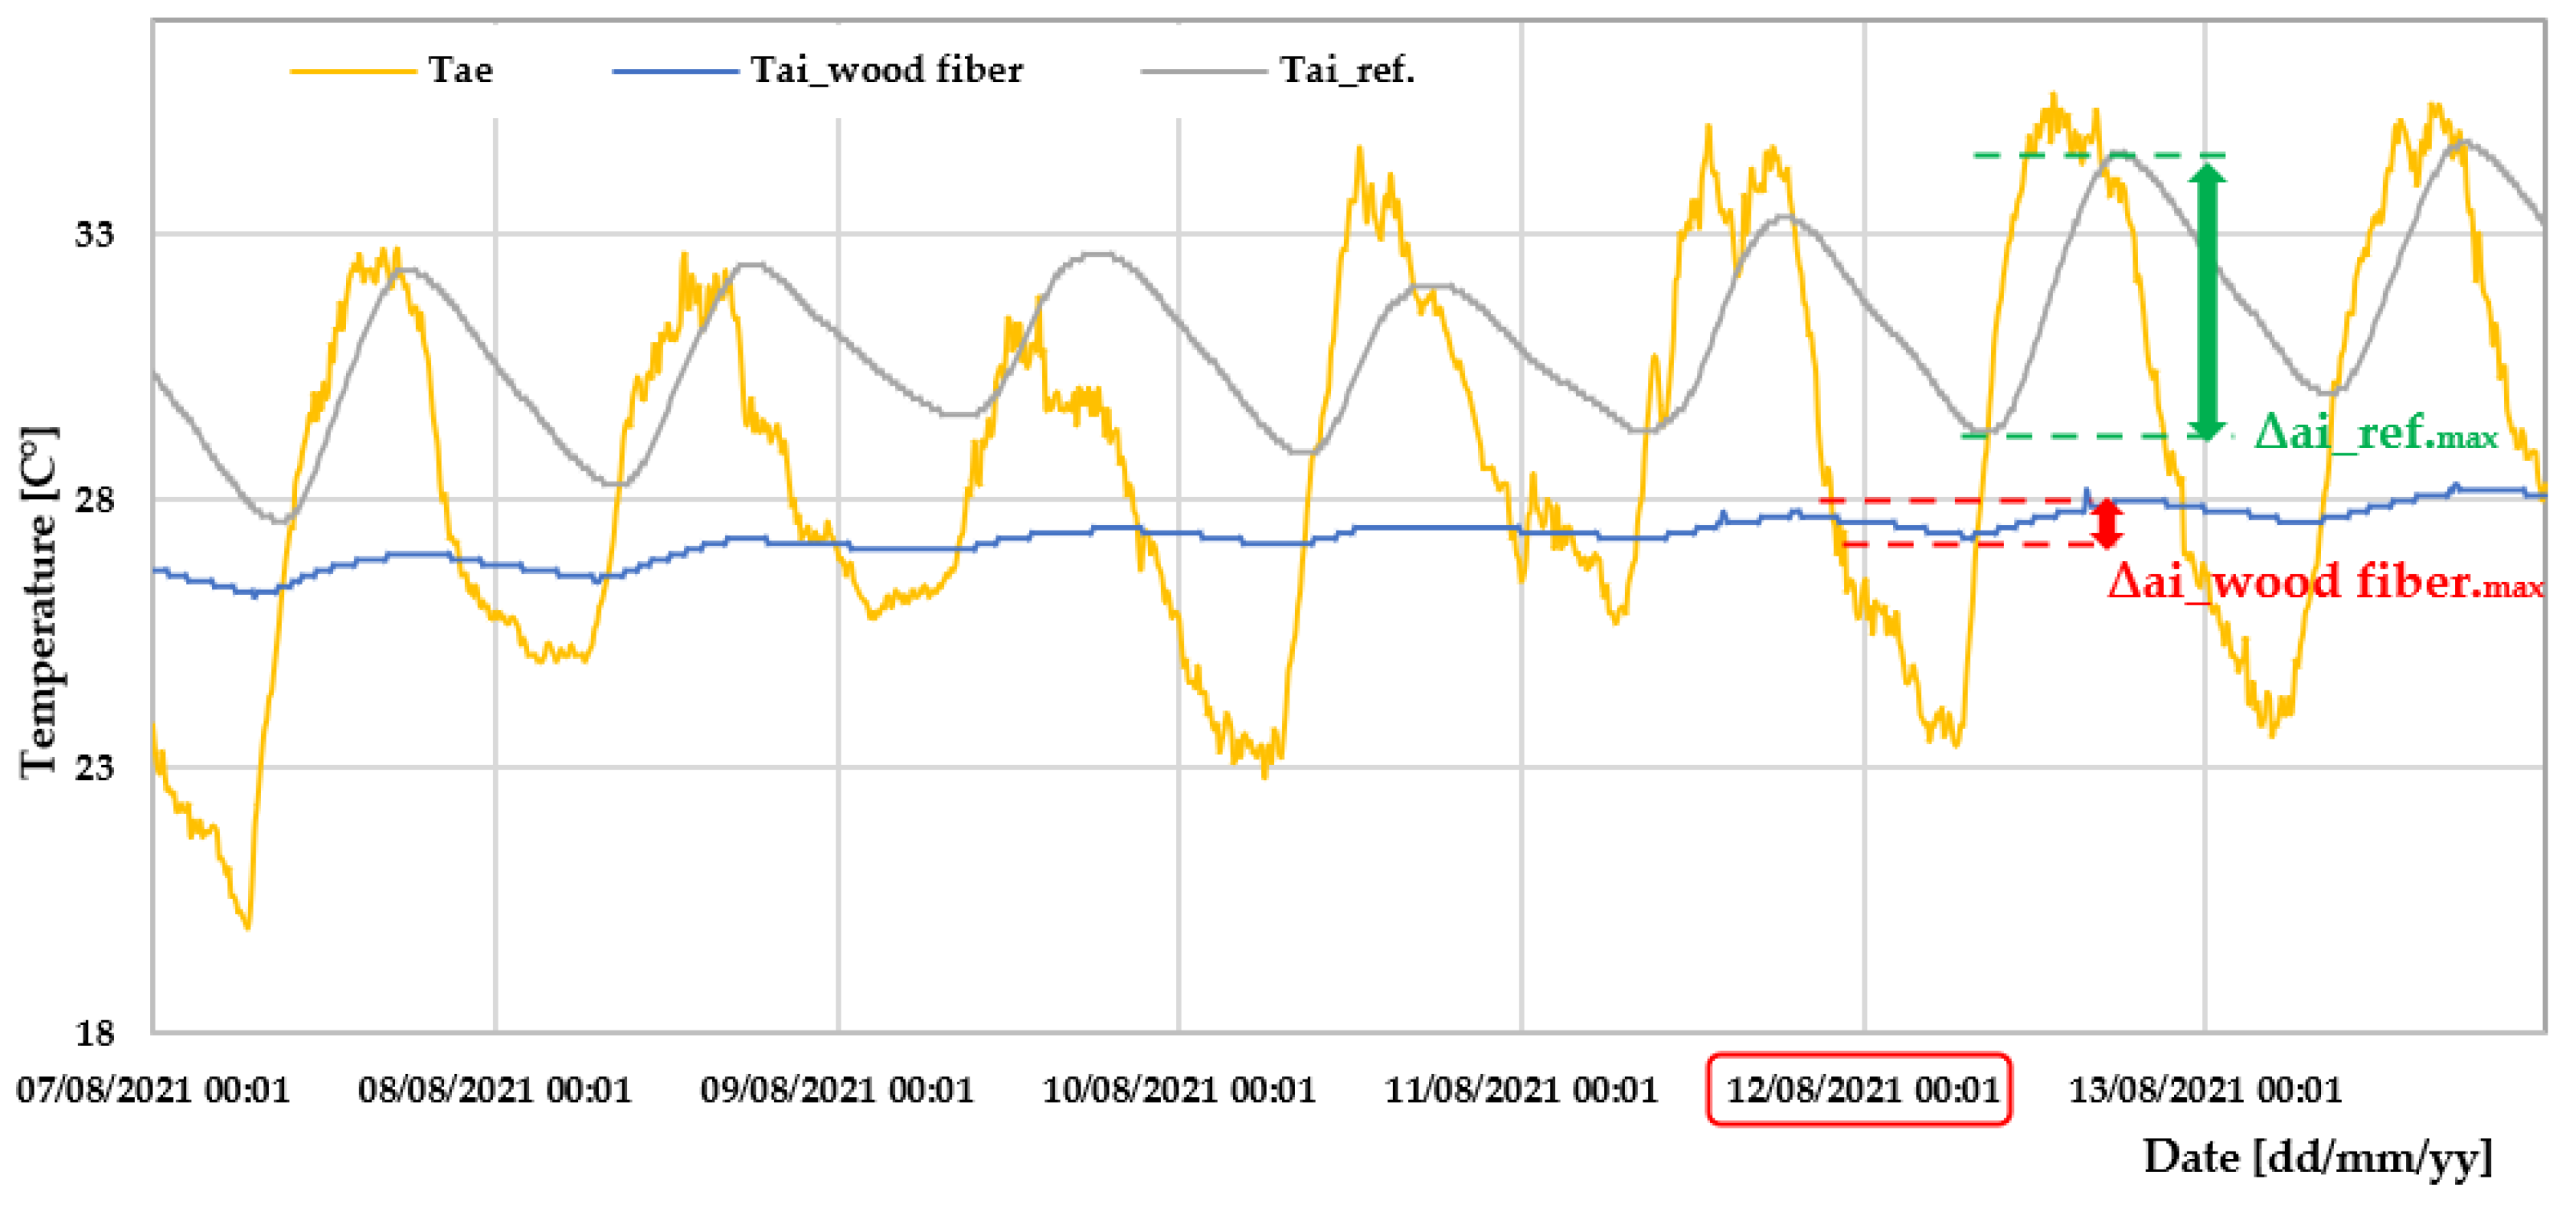
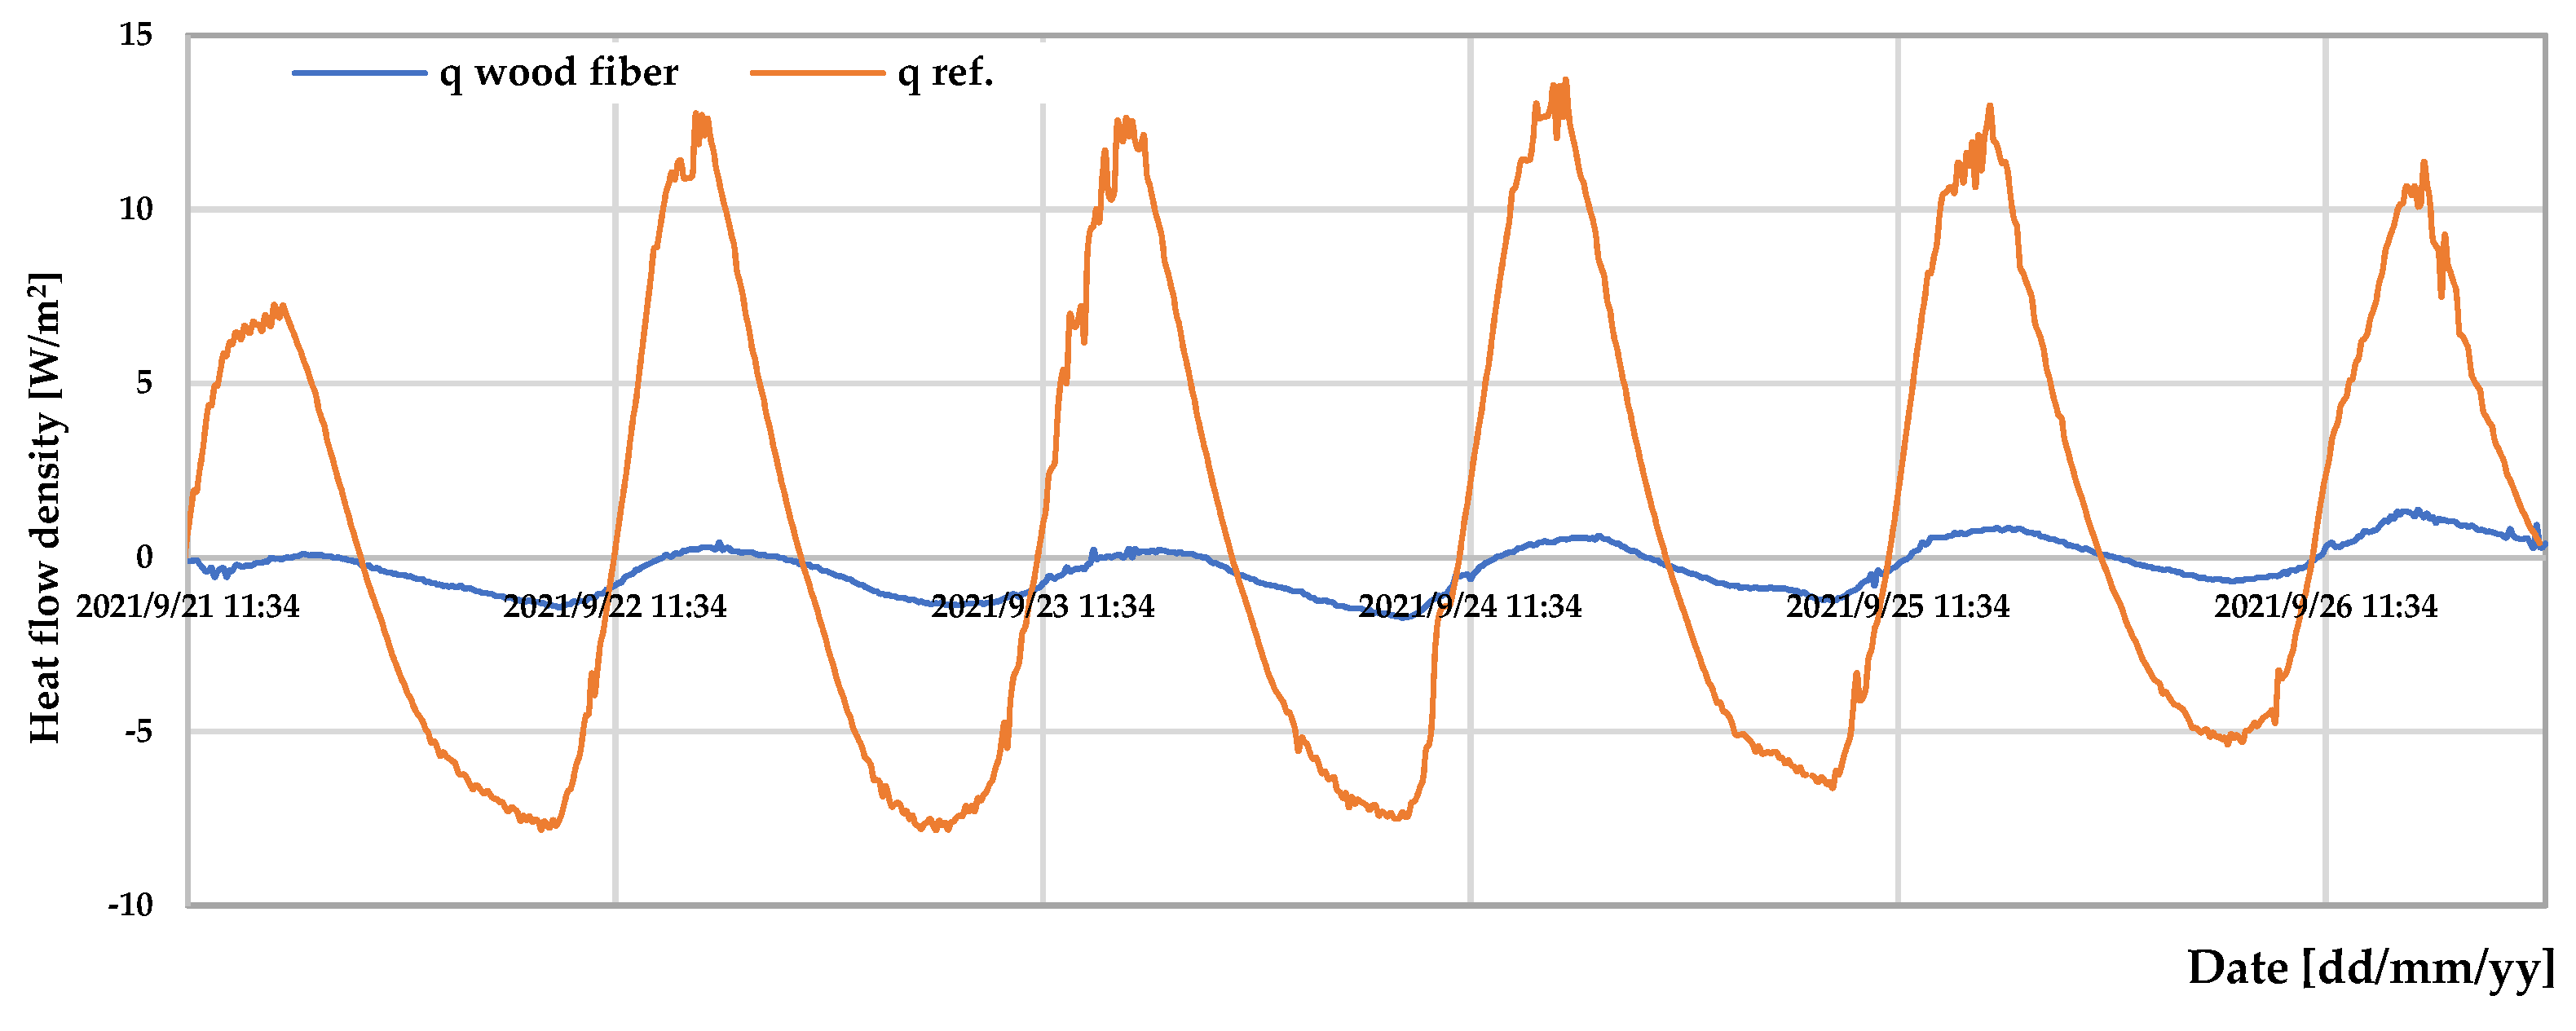
3.1. Summer Experimental Campaign

The first part of the experimental campaign took place in the summer period between July and October 2021 in a pure “free-floating” regime, i.e., in the absence of cooling systems in the two study buildings. In this phase, the processing of the acquired data was mainly focused on identifying the attenuations and average phase shifts during the measurements. In particular, Figure 5 shows the trends in the internal and external surface temperatures of the two test buildings recorded in a week characterized by particularly high temperatures (7–13 August 2021).
Figure 5 shows how the internal surface temperatures have a more stabilized trend in the recording period and more contained fluctuations than the ones recorded for the external surface temperatures of the two study buildings.
Table 3 reports the monthly mean values of the attenuation (DF) and phase shift (PS) factors. Both the attenuations and the phase shifts were calculated with respect to a daily interval, while the final average value was determined as the average of the attenuations and the daily phase shifts.
The analysis revealed a reduction of the attenuation factor of 60% in the insulated structure compared to the reference one, thus demonstrating a consequent greater stability of the internal air temperature. Instead, in regards to the phase shift factor, mean values of the isolated test structure were recorded, which were about 2 h higher than those of the reference structure. It can be noted that the improvement of the dynamic behavior of the structure following the installation of a layer of wood fiber also has a significant impact on internal comfort.
Subsequently, the trends in the temperatures of the air inside and outside the two buildings were analyzed. Figure 6 shows an example of the period between 20 and 24 July 2021: it is possible to observe the greater stability of the internal air of the building insulated with wood fiber panels as well as the presence of lower temperature values, differently from what happens in the reference building, where temperature oscillations are very high and close to the peak values of the external air temperature.
Furthermore, considering two particularly hot days in July (22 July 2021) and August (12 August 2021), the difference between the maximum external and internal temperatures of the two isolated buildings was analyzed (Table 4).
As can be seen from Table 4, an average temperature difference of 7.3 °C was recorded between the external air temperature and that of the insulated building, while that recorded for the reference building has a much lower difference, equal to 0.7 °C, confirming the good insulating capacity and thermal inertia obtained with the aid of selected wood fiber panels.
Furthermore, with the aim of analyzing the thermal stability recorded on the i-th day, the internal temperature difference recorded in the two test buildings was also calculated.
Figure 7 shows the trend of the internal and external air temperature of the insulated and reference building in the period between 7 and 13 August 2021, highlighting the differences in the internal air temperature of the reference (in green) and of the isolated structure (in red), characterized by values of 5 °C and 0.3 °C respectively.
The lines shown in Figure 7 indicate the maximum difference between the internal temperature of the reference building (lines of extremes and arrow shown in green) and of the isolated building (lines of extremes and arrow shown in red) recorded on 12 August 2021.
Instead, Table 5 shows the indoor temperature variations in the two buildings on a few typical days of each month of the summer period.
In this case, variations in the internal temperature equal to 0.5 °C for the insulated building and 4 °C for the reference one were recorded, highlighting, even in the absence of any cooling system, the achievement of acceptable conditions of air stability and comfort inside the insulated building.
Finally, Figure 8 shows the trend of the heat flow through the north–west facing wall, both in the insulated building and in the reference one in the period between 21 September and 27 September 2021.
The wood fiber panels allow for a reduction of the heat flow of about 90% and a lower oscillation in the selected time frame, ensuring greater temperature stability over time, consequently, better levels of indoor comfort.
The analysis and comparison of the data obtained from the experimental campaign in the summer period allow to draw the following conclusions:
an overall improvement in the dynamic behavior of the insulated structure, due to the increase in the average thermal phase shift of about 2 h, and the reduction of the average attenuation of 60% compared to the reference building;
average air temperatures values were close to those typical of thermal comfort in the insulated building. This condition was reached in the absence of a cooling system;
the insulated building showed a significant stability of the indoor air temperature with an average fluctuation of 0.5 °C compared to the value of 4 °C of the reference building;
an average reduction of about 90% of the heat flow through the wall of the insulated building compared to the reference one was achieved.

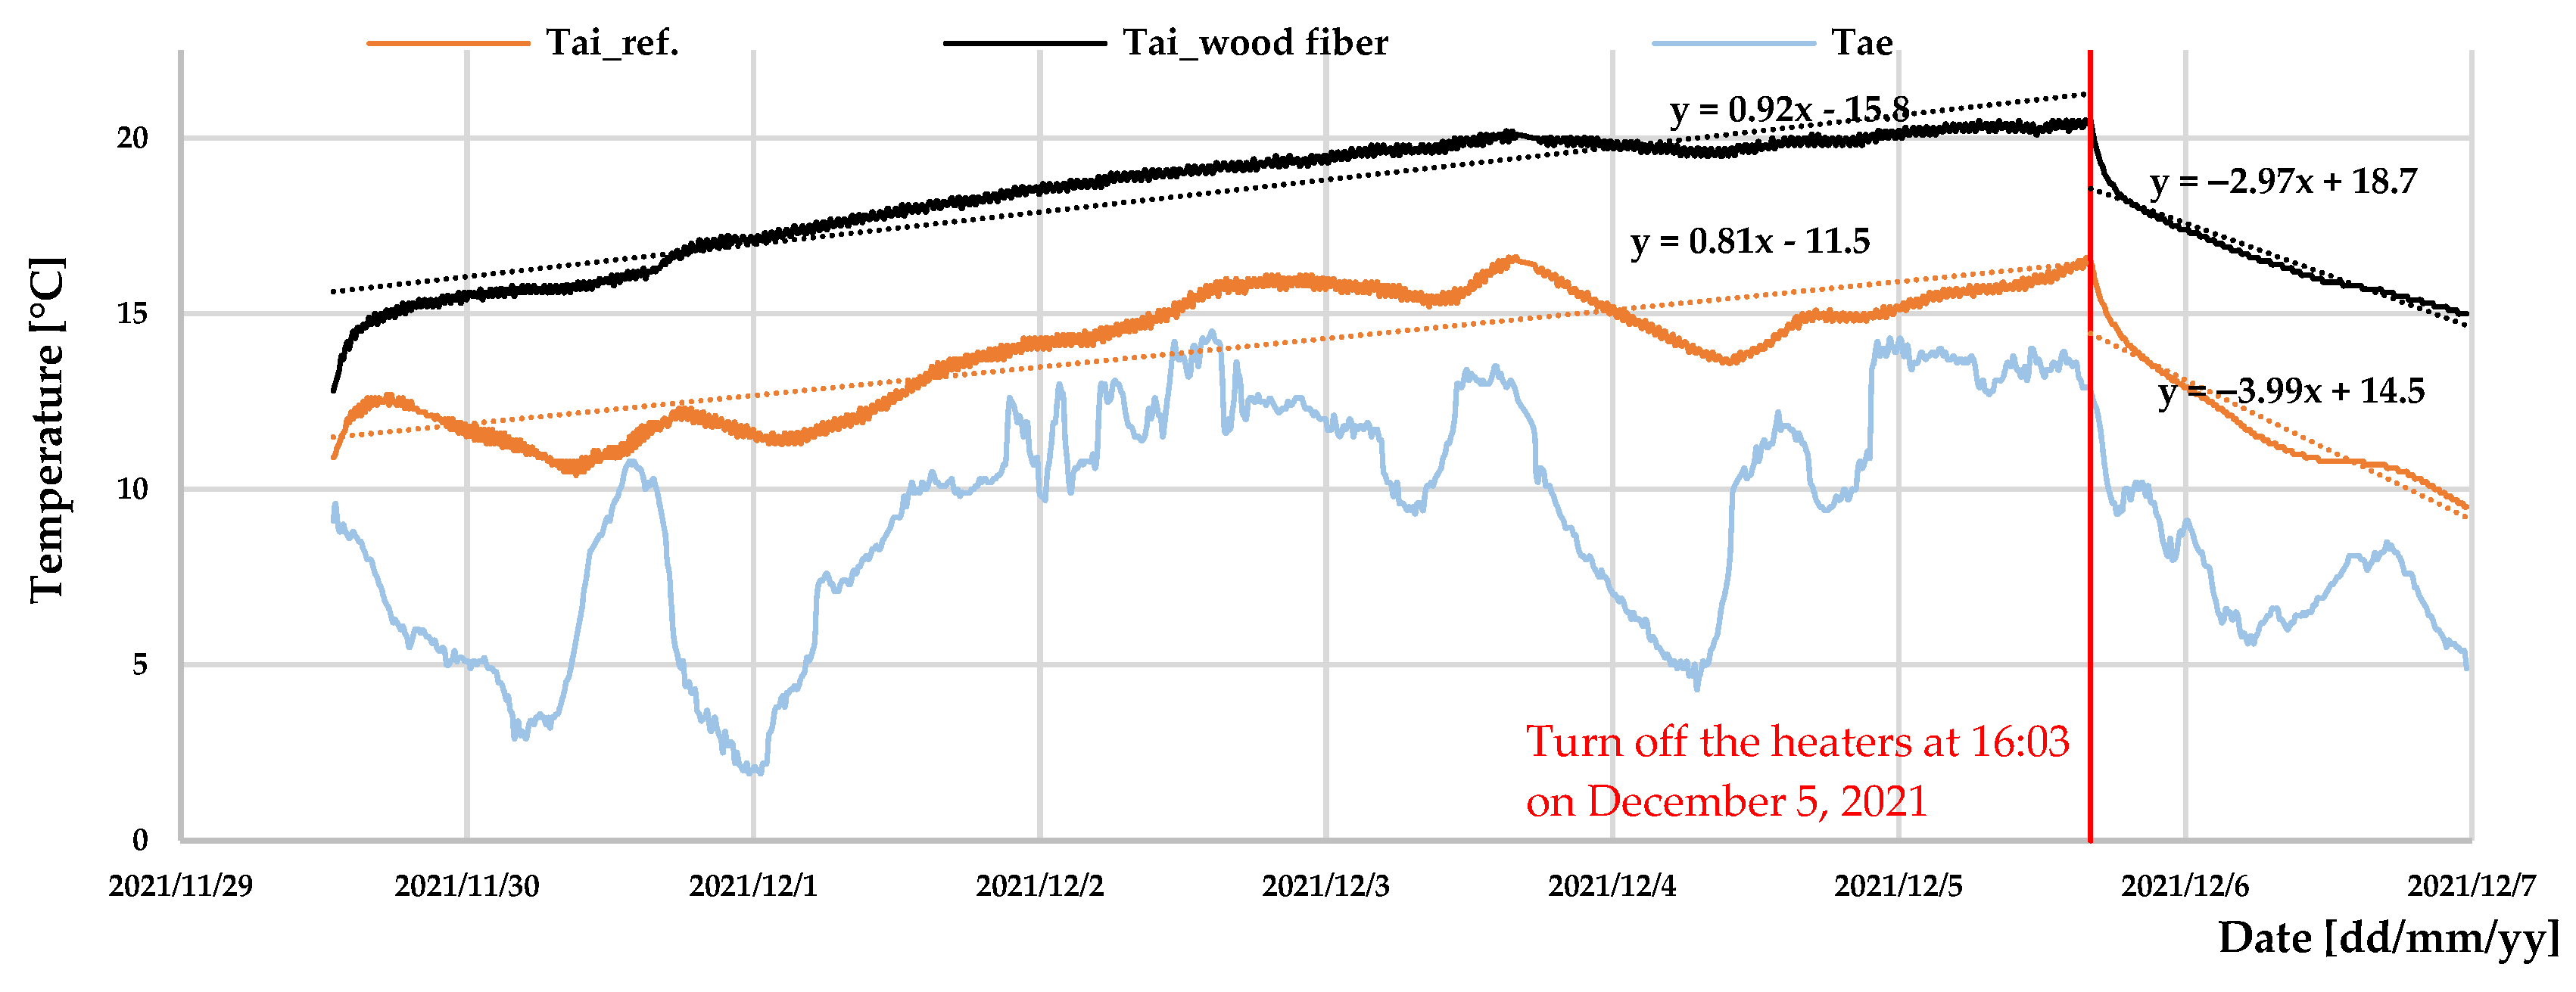
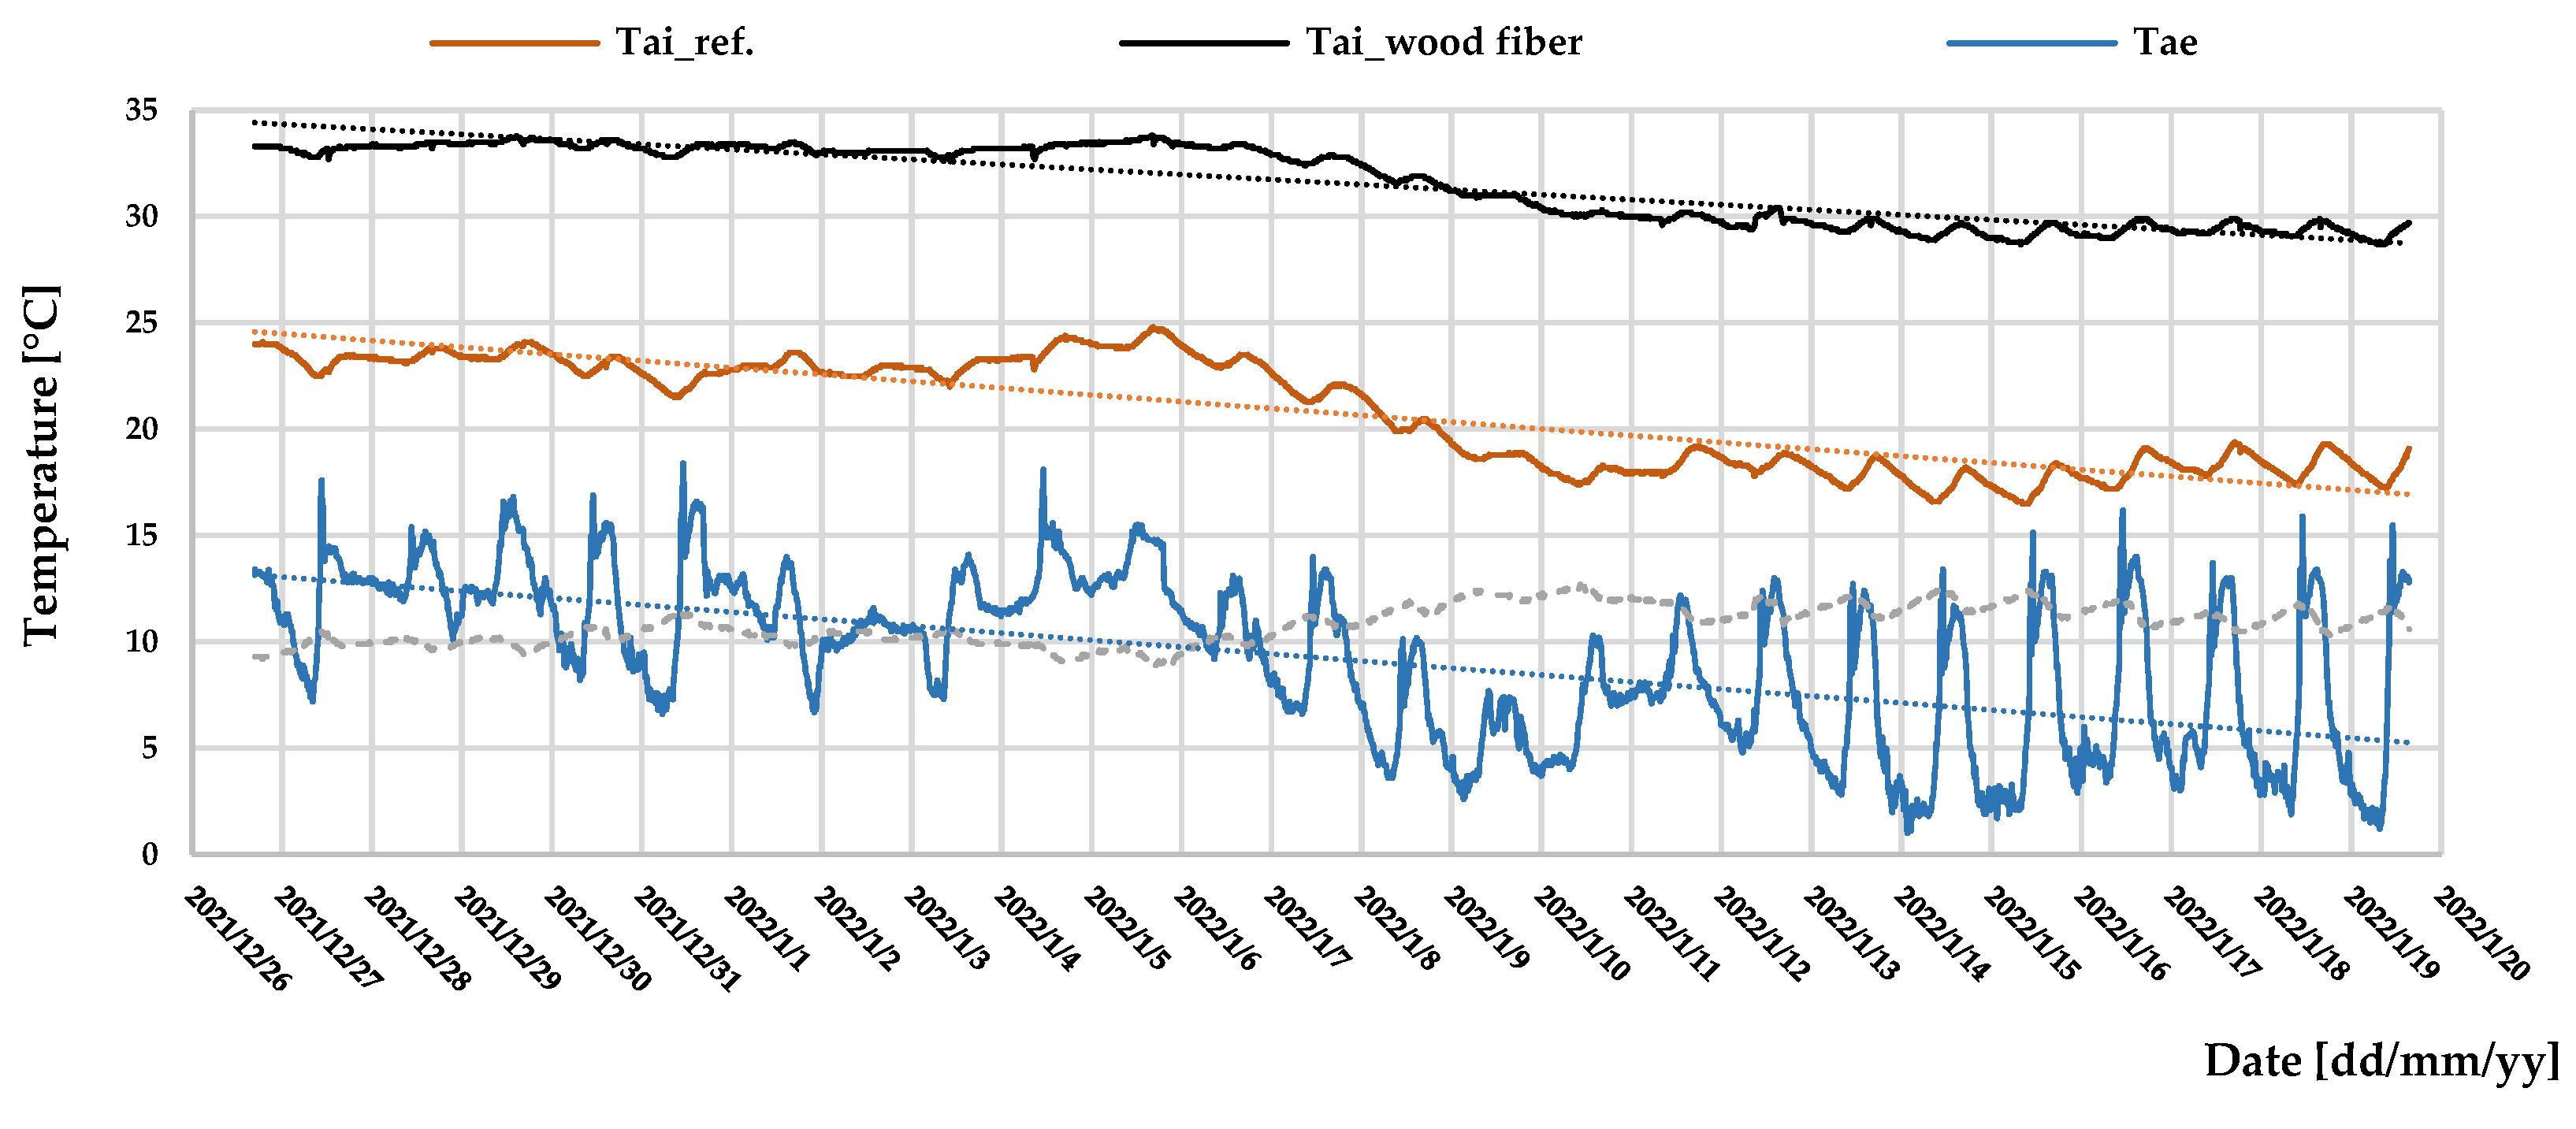
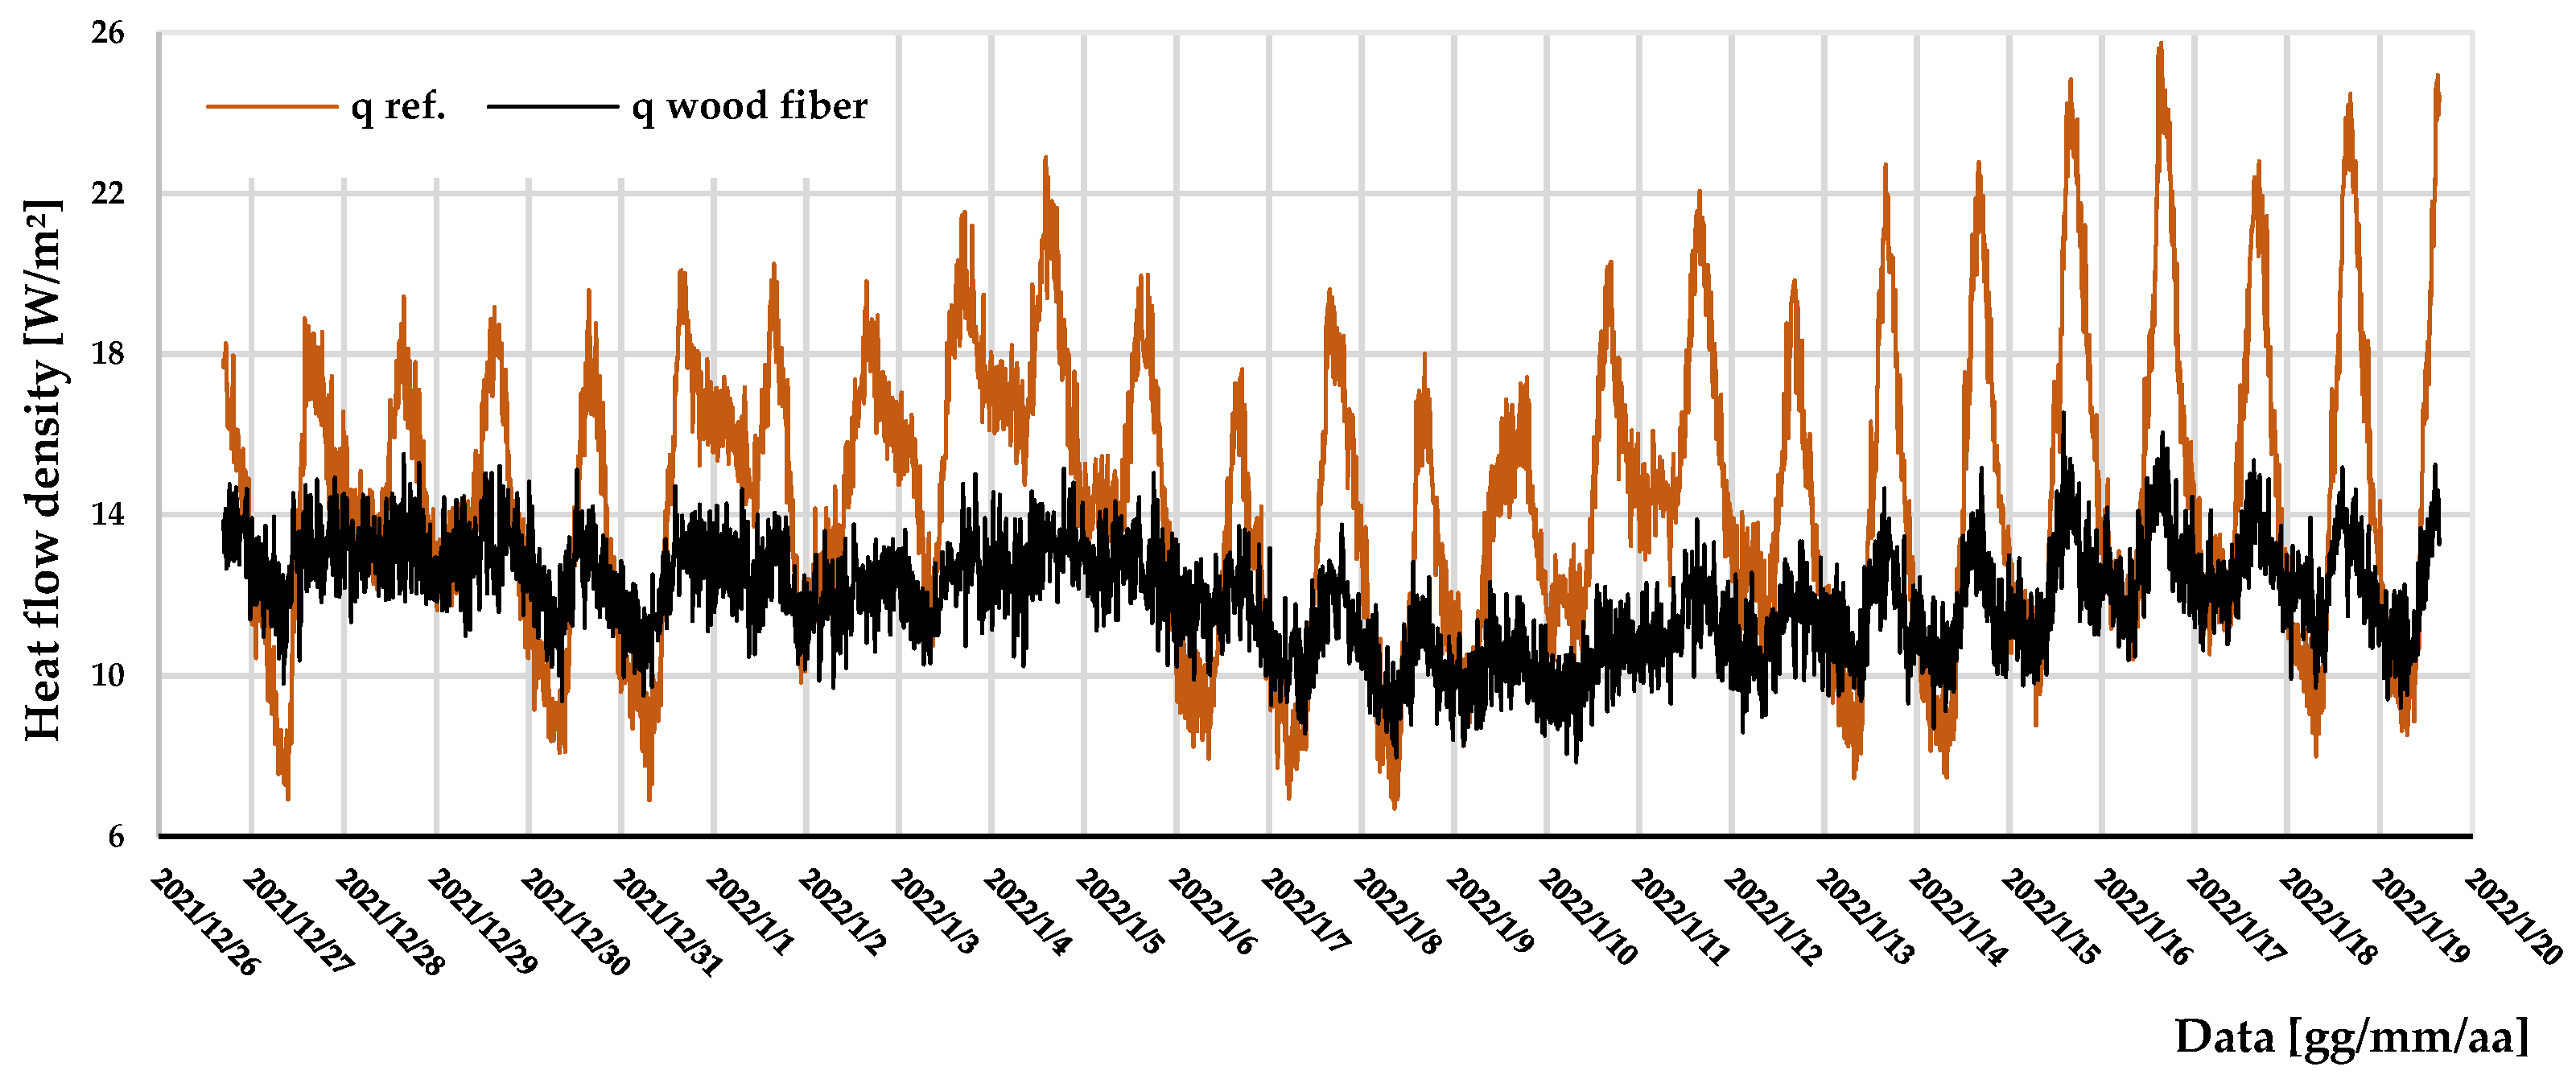
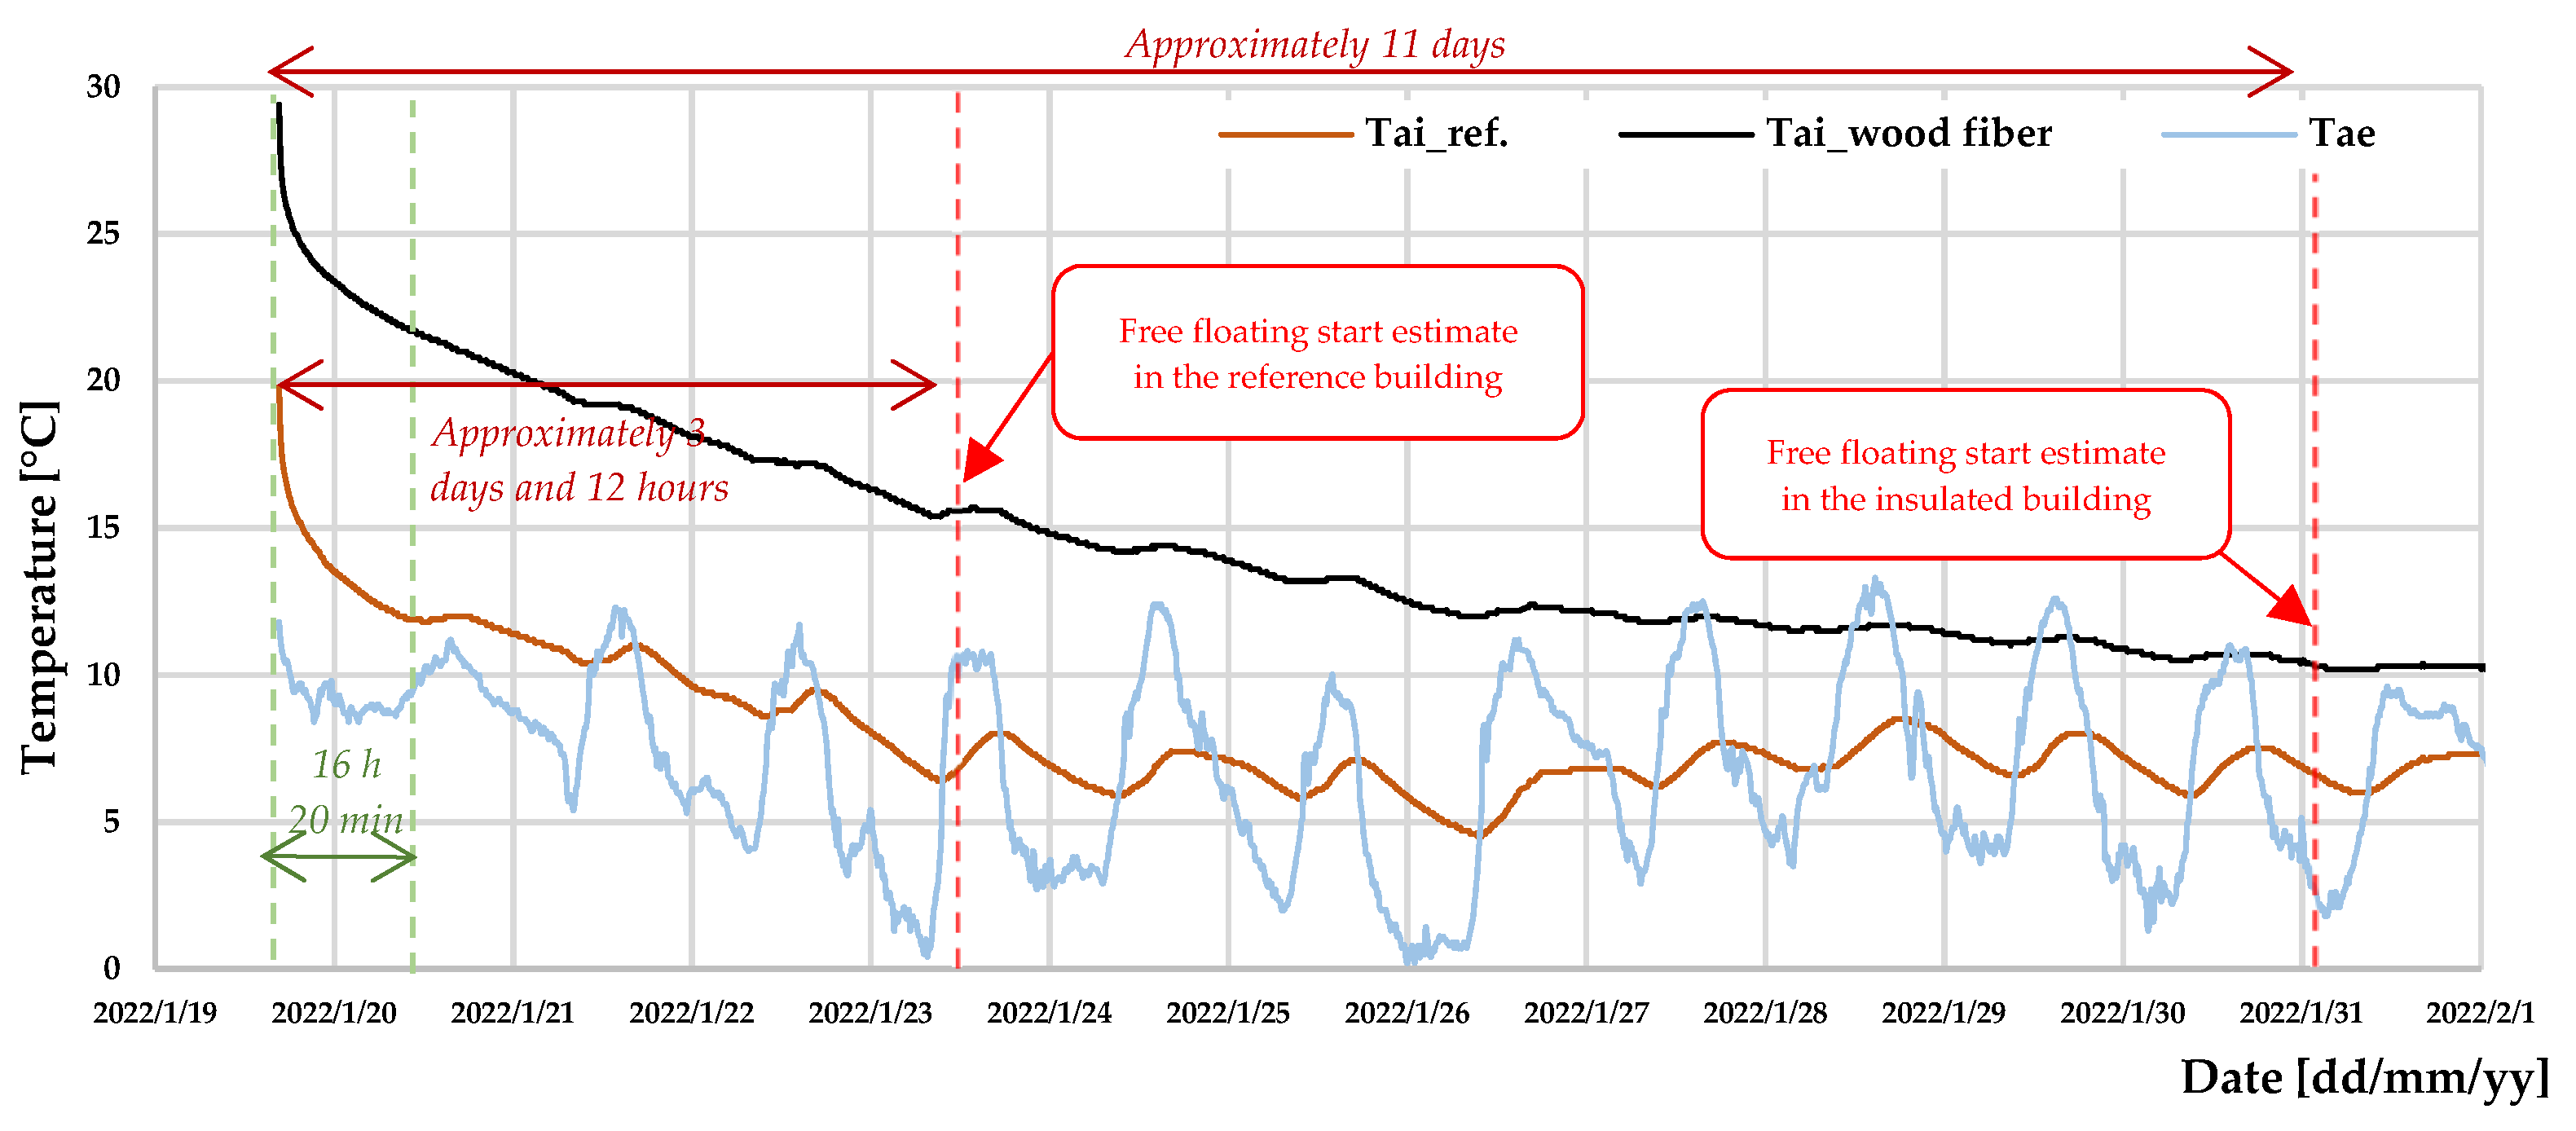
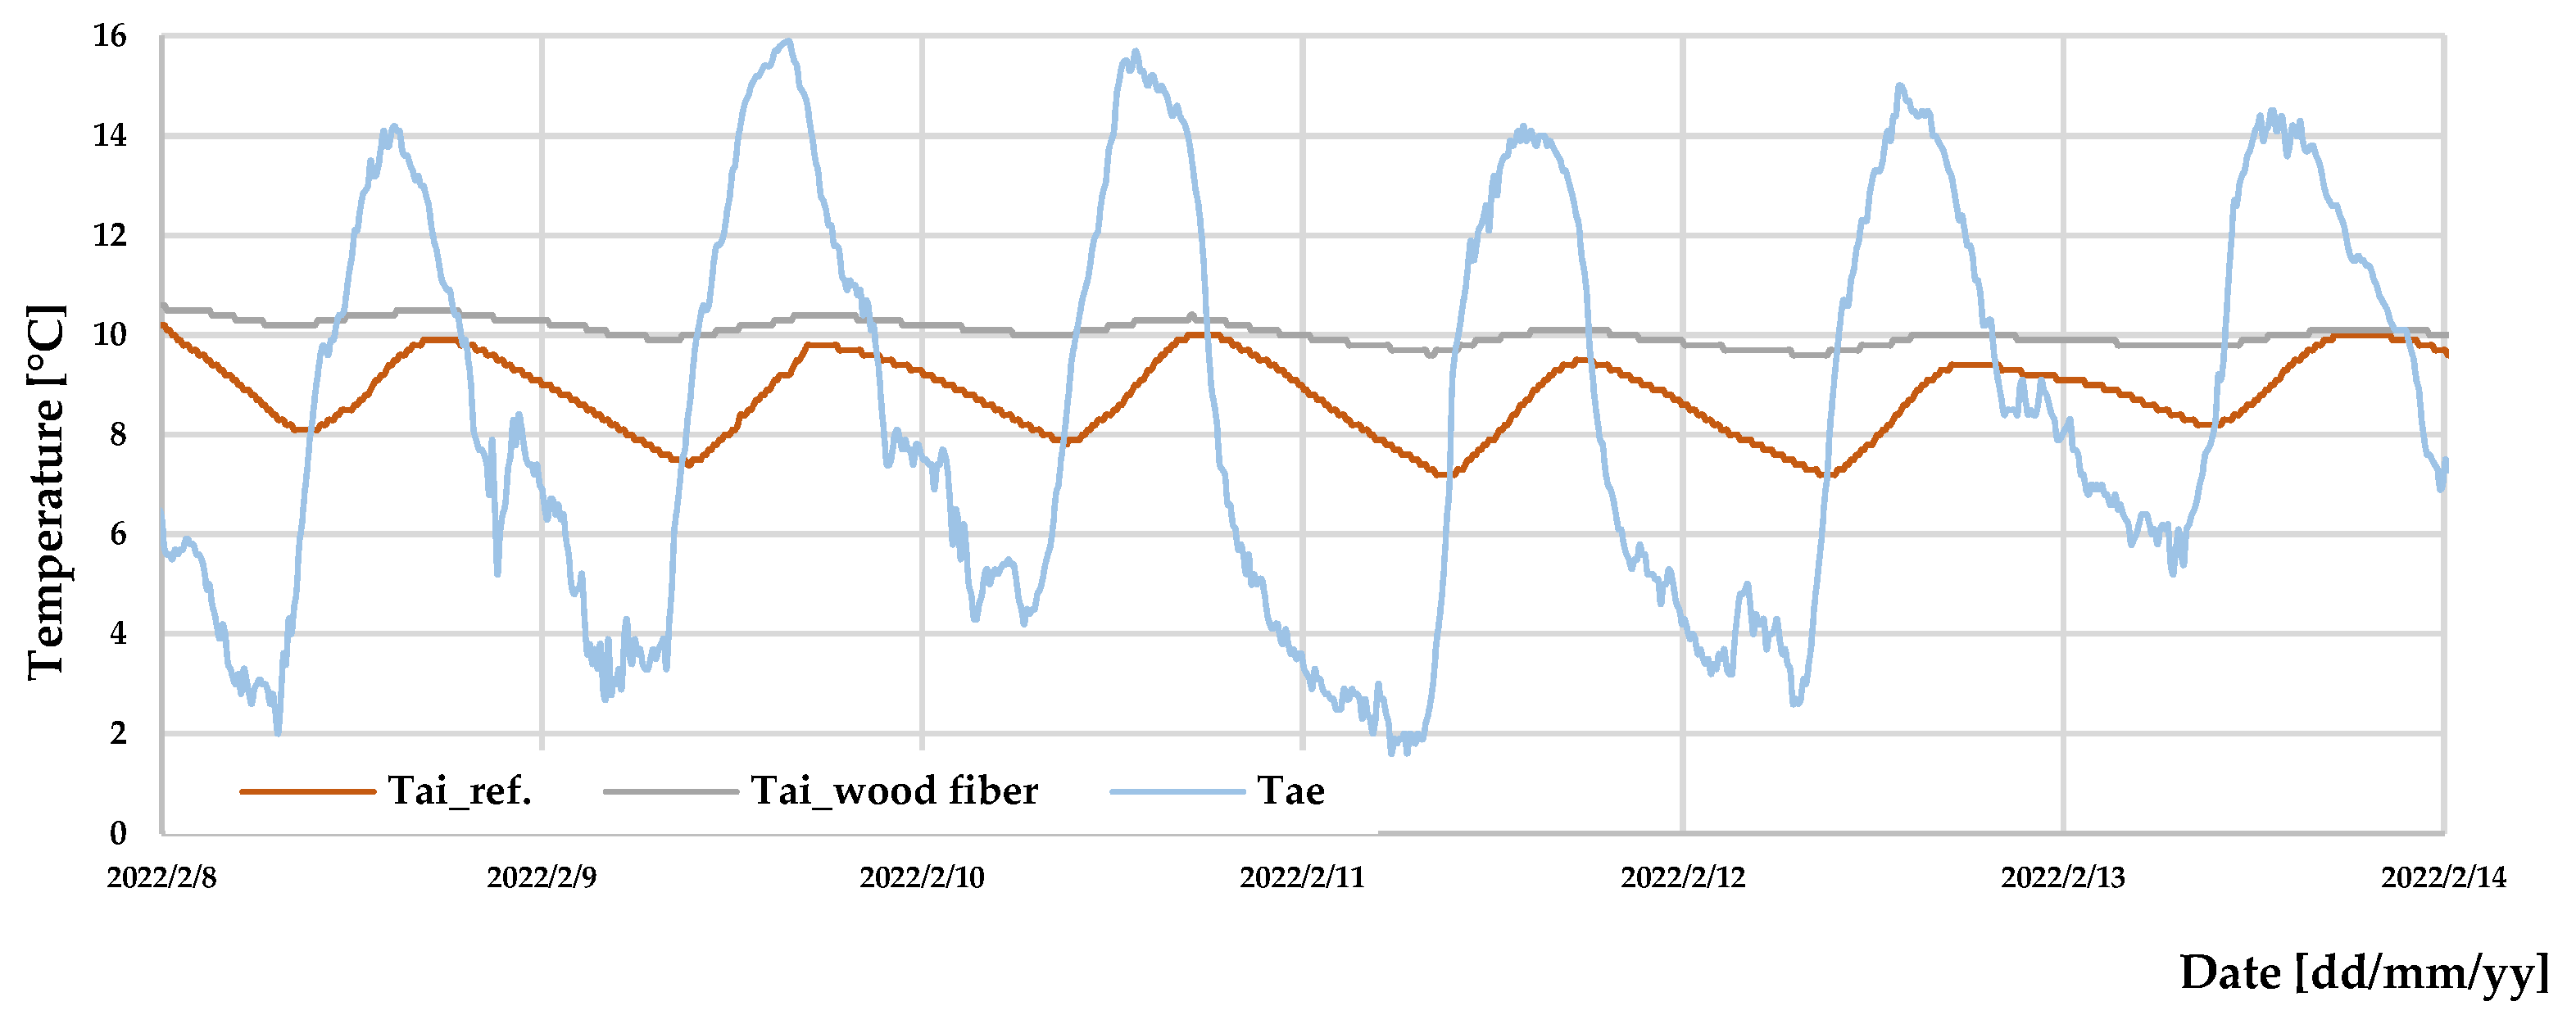
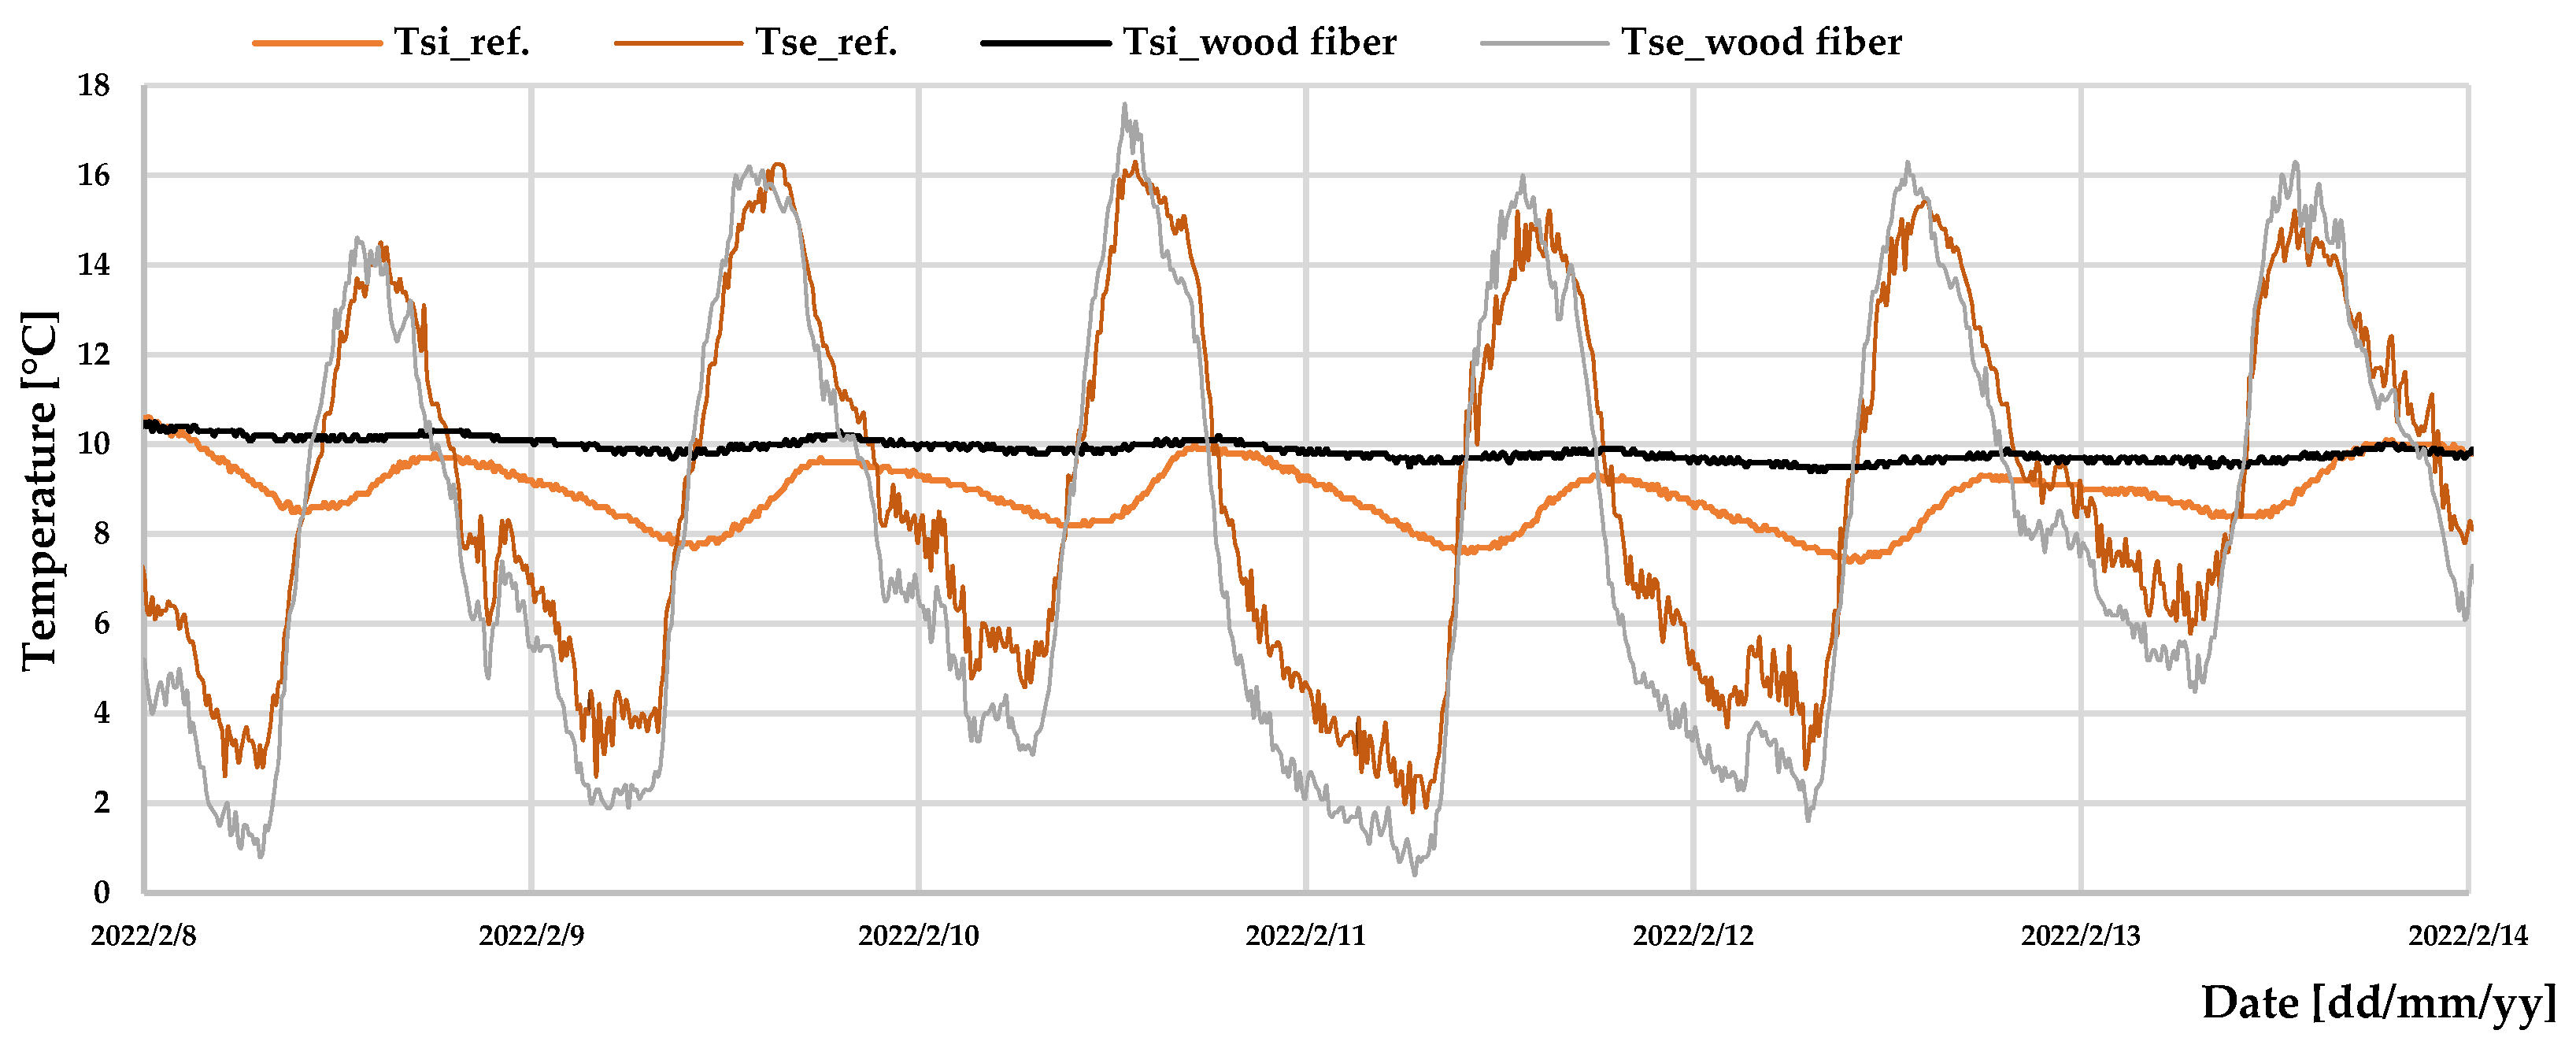
3.2. Winter Experimental Campaign

The second part of the experimental campaign took place in the winter period between November 2021 and February 2022 both in the pure “free-floating” regime and in the presence of the heating systems in the two study buildings.
Figure 9 shows the air temperature trend in the insulated building and in the reference building. Specifically, in the considered period, the data acquisition began on 29 November 2021 at 12:43 with the electric fan heaters set to 600 Watts and kept continuously on until they were switched off (represented with a vertical line in red), which took place at 16:03 on 5 December 2021.
Figure 9 also shows the linear regression lines relating to the two internal temperature trends with the aim of evaluating, through their angular coefficients, the different heating and cooling rates of the two structures.
In fact, it can be observed how the insulated building, due to its thermal inertia, is able to retain the heat more effectively inside the building, and in the presence of a heat source, increases its temperature more rapidly. Similarly, once the heating systems are turned off, in the insulated structure the decay of the internal temperature occurs more slowly.
Table 6 shows the values of the internal air temperatures of the insulated building and of the reference one at initial time (switch on of the heating system; “initial T”), when the heating system is switched off (“T switching off”) and finally at the end of the analyzed period (“final T”). The table shows a significant difference between the two buildings, especially at the shutdown of the heating system and in the final phase, characterized respectively by an internal temperature variation equal to 4 °C (“T shutdown”) and to 5.5 °C (“final T”).
The thermal behavior of the two test buildings was also analyzed by increasing to 800 W the power of the electric fan heaters.
Figure 10 shows the temperature trends of the external and internal air of the two buildings in the time interval between 26 December 2021 and 20 January 2022, while Table 7 summarizes the maximum, minimum and average values of the temperatures.
From Table 7, significant differences emerge between the internal and external temperature variations recorded in the presence and absence of the external insulation system; specifically, the average temperature variation recorded in the reference building is equal to 11.6 °C, while in the insulated one the recorded value is approximately double, equal to 22.4 °C.
In the same time interval, measurements of thermal flows and thermal transmittances were also carried out; with reference to the former, the results are reported in Figure 11 and Table 8.
As can be seen from the graph in Figure 11, the trend of the thermal flow of the reference building shows larger oscillations and higher values, while the difference between the average values (Table 6), although lower than in the summer regime, is equal to −17%.
The last analysis carried out in this time interval was aimed at evaluating and comparing the thermal transmittances of the two study buildings.
Figure 12 shows the trend of thermal transmittances resulting from data processing thanks to the progressive averages method (par. 2, Equation (3)) while Table 9 reports the stabilized transmittance values and the percentage difference between the calculated values.
The thermal insulation system using wood fiber panels allows us to obtain a thermal transmittance equal to 0.53 W/m2K with a percentage reduction of about 37% compared to the reference building (1.24 W/m2K).
The second phase of the winter experimental campaign focused on the study of the thermal behavior of the two structures buildings after switching off the heating systems in the period between 19 and 31 January 2022.
Figure 13 shows the trend of the external air temperature and of the internal air temperature of both buildings, in the transition and free-floating periods, while Table 10 reports the values in the proximity of each regime variation.
As can be seen from the graph (Figure 13), there is a time lag between the estimate of the start of the free-floating condition of the insulated building compared to the reference one, confirming the greater stability of the indoor air temperature and the thermal inertia of the former.
In particular, in the free-floating regime, in addition to evaluating the internal and external temperature trends of the two buildings, the dynamic parameters of attenuation (DF) and phase shift (PS) were also evaluated (page 2, Equations (1) and (2)).
Figure 14 and Table 11 respectively show the trends and values of the external and internal air temperatures of the insulated building and of the reference one in the free-floating regime.
An average difference of 14.2% occurs between the curves of the air temperature inside the two buildings, while a percentage difference of 66.7% is reached between the peaks of the maximum and minimum temperature.
The trends and values of the surface temperatures inside and outside the two buildings, in the free-floating regime, are shown in Figure 15 and in Table 12.
From Table 12, it can be seen that the difference in the average internal and external surface temperature of the insulated building reaches almost 2 °C, which is different from the reference one.
Finally, the values of the dynamic attenuation (DF) and phase shift (PS) parameters of the two buildings in the free-floating regime are reported in Table 13.
The analysis revealed a 74% reduction in the attenuation factor and an increase in the phase shift of the insulated building by 75% compared to the reference one, confirming the achievement of greater stability of the indoor air temperature and the achievement of better comfort conditions.
The analysis and comparison of the data obtained from the experimental campaign in the winter period allow us to draw the following conclusions:
a greater stability of internal temperatures was achieved, as welle as significantly higher internal temperatures;
a lower influence from external temperature fluctuations, thanks to lower dispersions and greater thermal inertia guaranteed by the insulation system, was found;
a higher internal heating speed in the presence of heating and lower decrease at the shutdown of the heating system was found;
a significant reduction in thermal transmittance, equal to 57%, and in the attenuation factor (equal to approximately 74%), in addition to an increase in the phase shift of the thermal wave of 75% were recorded.

4. Conclusions

The present study was aimed to characterize a small test building insulated with wood fiber panels from the thermal point of view, comparing the results with those of an identical, non-insulated reference test building.
The study confirmed the effectiveness of this solution, able to return, even with a reduced thickness, excellent thermal insulation performance and better thermal comfort for users in both summer and winter conditions. In the insulated building, lower values of the thermal transmittance were found, as well as higher values of the phase shift and lower values of the attenuation.
In particular, the analysis and comparison of the data obtained from the experimental campaign in the summer period highlighted an overall improvement in the dynamic behavior of the insulated structure, due to the increase in the average phase shift of about 2 h and the reduction of the average attenuation of 60% compared to the reference building.
Furthermore, the insulated building showed a significant stability of the internal air temperature with an average fluctuation of 0.5 °C compared to the value of 4°C of the reference building. Finally, an average reduction of about 90% of the heat flux through the wall of the insulated building was obtained compared to the reference one.
Instead, with regard to the winter regime, the analysis showed a 74% reduction in the attenuation factor and a 75% increase in the phase shift of the insulated building compared to the reference one, confirming the achievement of greater stability of the indoor air temperature and the achievement of better comfort conditions.
In addition, a greater stability of the internal temperatures was achieved, as well as significantly higher internal temperatures. The experimentation showed a lower influence from external temperature fluctuations, thanks to the lower dispersions and the greater thermal inertia guaranteed by the insulating system. Finally, there was a significant reduction in thermal transmittance, equal to 57%, and in the attenuation factor (equal to approximately 74%), as well as an increase in the phase shift of the thermal wave by 75%.
Wood fiber panels also have advantages in terms of sustainability, as they are produced with reduced emissions and impact on the environment; some commercial products available on the market are equipped with Environmental Product Declarations and other certifications such as Nature Plus.
Therefore, greater awareness is needed for the large-scale use of eco-sustainable materials, such as natural or recycled ones, with the aim of decarbonising the construction sector, also using materials with reduced incorporated carbon.
Hence, the results of the annual measurement campaign made it possible to estimate the level of optimization of the thermal performance of the structure under study following the installation of panels made with an insulating material with a natural, eco-sustainable and biodegradable structure such as wood fiber.
The data illustrated can be used as a comparison with other innovative and sustainable insulating materials, also enriching the scientific sources based on still limited experimental studies.
Future developments are planned to quantify the annual energy needs for heating and cooling of a real building characterized by the same stratigraphies and construction methods of the test building in order to evaluate the energy, environmental (through Life Cycle Assessment -LCA- analysis) and economic savings related to the use of this solution.

Author Contributions

Conceptualization, F.A.; methodology, F.A. and D.M.; software, C.G. and L.E.; validation, C.G. and L.E.; formal analysis, D.M. and L.E.; investigation, M.R.; data curation, M.R.; writing—original draft preparation, M.R. and C.G.; writing—review and editing, F.A. and D.M.; supervision, F.A. All authors have read and agreed to the published version of the manuscript.

Funding

This research received no external funding.

Institutional Review Board Statement

Not applicable.

Informed Consent Statement

Not applicable.

Data Availability Statement

Data available on request due to restrictions. The data presented in this study are available on request from the corresponding author. The data are not publicly available due to privacy reasons.

Acknowledgments

The authors would like to thank Alfredo Simonetti and all the staff at CEFME CTP for the valuable collaboration.

Conflicts of Interest

The authors declare no conflict of interest.

Glossary

GHGGreenhouse Gases
EPDsEnvironmental Product Declarations
LCALife Cycle Analysis
FUFunctional Unit
PENRTNon-Renewable Primary Energy, Total(MJ/FU)
PERTTotal Renewable Primary Energy, Total (MJ/FU)
GWPGlobal Warming Potential (kgCO2eq/FU)
DFDecrement Factors
PSPhase Shift (h, min)
ISOInternational Organization for Standardization
Min.Minimum value
Max.Maximum value
Ave.Average value
Int.Internal
Ext.External
Ref.Reference building
Ins.Insulated building
TTemperature (K, °C)
Δdifference between the analyzed values
Initial Tinternal air temperatures of the analyzed building at initial time when the heating system is switch on (K, °C)
T switching offinternal air temperatures of the analyzed building when the heating system is switched off (K, °C)
T shutdowninternal air temperatures of the analyzed building at the at the shutdown of the heating system (K, °C)
final Tinternal air temperatures of the analyzed building at the end of the analyzed period (final phase) (K, °C)
h Ts   max e Time of maximum external surface temperature (h, min)
h Ts   max i Time of maximum internal surface temperature (h, min)
T s max e Maximum external surface temperature (K, °C)
T s max i Maximum internal surface temperature (K, °C)
T s avg e Average external surface temperature (K, °C)
T s avg i Average internal surface temperature (K, °C)
T ae External air temperature (K, °C)
T ai Internal air temperature (K, °C)
q j Specific thermal flux (W/m2)
q wood   fiber Specific thermal flux of the insulated building (W/m2)
q ref . Specific thermal flux of the refence building (W/m2)
UThermal transmittance (W/(m2K))
U wood   fiber Thermal transmittance of the insulated building (W/(m2K))
U ref . Thermal transmittance of the reference building (W/(m2K))
T se _ wood   wiber External surface temperature of the insulated building (K, °C)
T si _ wood   wiber Internal surface temperature of the insulated building (K, °C)
T ai _ wood   wiber Internal air temperature of the insulated building (K, °C)
T se _ ref . External surface temperature of the refence building (K, °C)
T si _ ref . Internal surface temperature of the reference building (K, °C)
T ai _ ref . Internal air temperature of the reference building (K, °C)
T max _ external Maximum external air temperature (K, °C)
T max _ internal Maximum internal air temperature (K, °C)
GHGGreenhouse Gases

References

  1. Intergovernmental Panel on Climate Change (IPCC). IPCC REPORT 2018; Intergovernmental Panel on Climate Change (IPCC): Geneva, Switzerland, 2018. [Google Scholar]
  2. United Nations (UN). UNSD Environmental Indicators. 2018. Available online: https://unstats.un.org/unsd/envstats/qindicators.cshtml (accessed on 14 November 2018).
  3. European Commission (EC). Accordo di Parigi. 2015. Available online: https://ec.europa.eu/clima/policies/international/negotiations/paris_it (accessed on 14 November 2018).
  4. United Nations Environment Programme (UNEP). The Emissions Gap Report 2018; United Nations Environment Programme (UNEP): Nairobi, Kenya, 2018. [Google Scholar]
  5. Evangelisti, L.; Guattari, C.; Asdrubali, F.; de Lieto Vollaro, R. In situ thermal characterization of existing buildings aiming at NZEB standard: A methodological approach. Dev. Built Environ. 2020, 2, 100008. [Google Scholar] [CrossRef]
  6. Pomponi, F.; Moncaster, A. Circular economy for the built environment: A research framework. J. Clean. Prod. 2017, 143, 710–718. [Google Scholar] [CrossRef] [Green Version]
  7. Geissdoerfer, M.; Savaget, P.; Bocken, N.M.; Hultink, E.J. The Circular Economy—A new sustainability paradigm? J. Clean. Prod. 2017, 143, 757–768. [Google Scholar] [CrossRef] [Green Version]
  8. De los Rios, I.C.; Charnley, F.J.S. Skills and capabilities for a sustainable and circular economy: The changing role of design. J. Clean. Prod. 2017, 160, 109–122. [Google Scholar] [CrossRef]
  9. Winans, K.; Kendall, A.; Deng, H. The history and current applications of the circular economy concept. Renew. Sustain. Energy Rev. 2017, 68, 825–833. [Google Scholar] [CrossRef]
  10. Orsini, F.; Marrone, P. Approaches for a low-carbon production of building materials: A review. J. Clean. Prod. 2019, 241, 118380. [Google Scholar] [CrossRef]
  11. Orsini, F.; Marrone, P.; Asdrubali, F.; Roncone, M.; Grazieschi, G. Aerogel insulation in building energy retrofit. Performance testing and cost analysis on a case study in Rome. Energy Rep. 2020, 6, 56–61. [Google Scholar] [CrossRef]
  12. Marrone, P.; Orsini, F.; Asdrubali, F.; Guattari, C. Environmental performance of universities: Proposal for implementing campus urban morphology as an evaluation parameter in Green Metric. Sustain. Cities Soc. 2018, 42, 226–239. [Google Scholar] [CrossRef]
  13. Wiik, M.K.; Fufa, S.M.; Kristjansdottir, T.; Andresen, I. Lessons learnt from embodied GHG emission calculations in zero emission buildings (ZEBs) from the Norwegian ZEB research centre. Energy Build. 2018, 165, 25–34. [Google Scholar] [CrossRef]
  14. European Commission (EC). Circular Economy Action Plan. For a Cleaner and More Competitive Europe; European Commission: Brussels, Belgium, 2020. [Google Scholar]
  15. European Commission (EC). Communication from the Commission to the European Parliament, the Council, the European Economic and Social Committee and the Committee of the Regions. Sustainable Europe Investment Plan. European Green Deal Investment Plan; European Commission: Brussels, Belgium, 2020. [Google Scholar]
  16. U.S. Chamber of Commerce Foundation. Achieving a Circular Economy: How the Private Sector is Reimaging the Future of Business; U.S. Chamber of Commerce Foundation: Washington, DC, USA, 2015; p. 76. [Google Scholar]
  17. Bansal, D.; Singh, R.; Sawhney, R.L. Effect of construction materials on embodied energy and cost of buildings—A case study of residential houses in India up to 60 m2 of plinth area. Energy Build. 2014, 69, 260–266. [Google Scholar] [CrossRef]
  18. Cabeza, L.F.; Barreneche, C.; Miró, L.; Morera, J.M.; Bartolí, E.; Fernández, A.I. Low carbon and low embodied energy materials in buildings: A review. Renew. Sustain. Energy Rev. 2013, 23, 536–542. [Google Scholar] [CrossRef]
  19. Resch, E.; Andresen, I.; Cherubini, F.; Brattebø, H. Estimating dynamic climate change effects of material use in buildings—Timing, uncertainty, and emission sources. Build. Environ. 2021, 187, 107399. [Google Scholar] [CrossRef]
  20. Asdrubali, F.; D’Alessandro, F.; Schiavoni, S. A review of unconventional sustainable building insulation materials. Sustain. Mater. Technol. 2015, 4, 1–17. [Google Scholar] [CrossRef]
  21. Cetiner, I.; Shea, A.D. Wood waste as an alternative thermal insulation for buildings. Energy Build. 2018, 168, 374–384. [Google Scholar] [CrossRef]
  22. Kristak, L.; Ruziak, I.; Tudor, E.M.; Barbu, M.C.; Kain, G.; Reh, R. Thermophysical Properties of Larch Bark Composite Panels. Polymers 2021, 13, 2287. [Google Scholar] [CrossRef]
  23. Hua, L.S.; Chen, L.W.; Geng, B.J.; Kristak, L.; Antov, P.; Pędzik, M.; Rogoziński, T.; Taghiyari, H.R.; Lubis, M.A.R.; Fatriasari, W.; et al. Particleboard from agricultural biomass and recycled wood waste: A review. J. Mater. Sci. Technol. 2022, 20, 4630–4658. [Google Scholar]
  24. International Energy Agency (IEA). Energy and CO2 Emissions in the OECD; International Energy Agency (IEA): Paris, France, 2018. [Google Scholar]
  25. United Nations (UN). United Nations Framework on Climate Change (UNFCCC); United Nations (UN): Kyoto, Japan, 1998. [Google Scholar]
  26. McKinsey Sustainability. Pathways to a Low-Carbon Economy: Version 2 of the Global Greenhouse Gas Abatement Cost Curve; McKinsey and Company: Paris, France, 2009. [Google Scholar]
  27. Janda, K.B.; Busch, J.F. Worldwide status of energy standards for buildings. Energy 1994, 19, 27–44. [Google Scholar] [CrossRef]
  28. Papadopoulos, A.M. State of the art in thermal insulation materials and aims for future developments. Energy Build. 2005, 37, 77–86. [Google Scholar] [CrossRef]
  29. Cuce, E.; Riffat, S.B. A state-of-the-art review on innovative glazing technologies. Renew. Sustain. Energy Rev. 2015, 41, 695–714. [Google Scholar] [CrossRef]
  30. Zabalza Bribián, I.; Valero Capilla, A.; Aranda Usón, A. Life cycle assessment of building materials: Comparative analysis of energy and environmental impacts and evaluation of the eco-efficiency improvement potential. Build. Environ. 2011, 46, 1133–1140. [Google Scholar] [CrossRef]
  31. Densley Tingley, D.; Hathway, A.; Davison, B. An environmental impact comparison of external wall insulation types. Build. Environ. 2015, 85, 182–189. [Google Scholar] [CrossRef]
  32. Hill, C.; Norton, A.; Dibdiakova, J. A comparison of the environmental impacts of different categories of insulation materials. Energy Build. 2018, 162, 12–20. [Google Scholar] [CrossRef]
  33. Takano, A.; Pal, S.K.; Kuittinen, M.; Alanne, K.; Hughes, M.; Winter, S. The effect of material selection on life cycle energy balance: A case study on a hypothetical building model in Finland. Build. Environ. 2015, 89, 192–202. [Google Scholar] [CrossRef]
  34. Schiavoni, S.; Bianchi, F.; Asdrubali, F. Insulation materials for the building sector: A review and comparative analysis. Renew. Sustain. Energy Rev. 2016, 62, 988–1011. [Google Scholar] [CrossRef]
  35. Lopez Hurtado, P.; Rouilly, A.; Vandenbossche, V.; Raynaud, C. A review on the properties of cellulose fibre insulation. Build. Environ. 2016, 96, 170–177. [Google Scholar] [CrossRef] [Green Version]
  36. Jerman, M.; Palomar, I.; Kočí, V.; Černý, R. Thermal and hygric properties of biomaterials suitable for interior thermal insulation systems in historical and traditional buildings. Build. Environ. 2019, 154, 81–88. [Google Scholar] [CrossRef]
  37. Latif, E.; Tucker, S.; Ciupala, M.A.; Wijeyesekera, D.C.; Newport, D.J.; Pruteanu, M. Quasi steady state and dynamic hygrothermal performance of fibrous Hemp and Stone Wool insulations: Two innovative laboratory-based investigations. Build. Environ. 2016, 95, 391–404. [Google Scholar] [CrossRef] [Green Version]
  38. Volf, M.; Diviš, J.; Havlík, F. Thermal; moisture and biological behaviour of natural insulating materials. Energy Procedia 2015, 78, 1599–1604. [Google Scholar] [CrossRef] [Green Version]
  39. Slimani, Z.; Trabelsi, A.; Virgone, J.; Zanetti Freire, R. Study of the hygrothermal behavior of wood fiber insulation subjected to non-isothermal loading. Appl. Sci. 2019, 9, 2359. [Google Scholar] [CrossRef] [Green Version]
  40. Vinha, J. Analysis method to determine sufficient water vapour retarder for timber-framed walls. In Proceedings of the 8th Symposium on Building Physics in the Nordic Countries (NSB2008), Copenhagen, Denmark, 16–18 June 2008. [Google Scholar]
  41. Peuhkuri, R.; Carsten, R.; Hansen, T.; Kielsgaard, K.; Lone, H. Fugtfordeling i Absorberende Isoleringsmaterialer: Moisture Distribution in Absorbent Insulation; BYG Sagsrapport Nr (2003). SR 03-11; Technical University of Denmark: Lyngby, Denmark, 2003. [Google Scholar]
  42. Simonson, C.J.; Ojanen, T.; Salonvaara, M. Moisture performance of an airtight; vapor-permeable building envelope in a cold climate. J. Therm. Envelope Build. Sci. 2005, 28, 205–226. [Google Scholar] [CrossRef]
  43. Mlakar, J.; Štrancar, J. Temperature and humidity profiles in passive-house building blocks. Build. Environ. 2013, 60, 185–193. [Google Scholar] [CrossRef]
  44. Janssens, A.; Hens, H. Interstitial condensation due to air leakage: A sensitivity analysis. J. Build. Phys. 2003, 27, 15–29. [Google Scholar] [CrossRef]
  45. Mantanis, G.I.; Athanassiadou, E.T.; Barbu, M.C.; Wijnendaele, K. Adhesive systems used in the European particleboard, MDF and OSB industries. Wood Mater. Sci. Eng. 2018, 13, 104–116. [Google Scholar] [CrossRef]
  46. Goto, Y.; Wakili, K.G.; Ostermeyer, Y.; Frank, T.; Ando, N.; Wallbaum, H. Preliminary investigation of a vapor-open envelope tailored for subtropical climate. Build. Environ. 2011, 46, 719–728. [Google Scholar] [CrossRef]
  47. Pavlík, Z.; Žumár, J.; Medved, I.; Cerný, R. Water vapor adsorption in porous building materials: Experimental measurement and theoretical analysis. Transp. Porous Media 2011, 91, 939–954. [Google Scholar] [CrossRef]
  48. Arnaud, L. Comparative study of hygrothermal Performances of building materials. In Proceedings of the NOCMAT 2009 11th International Conference on Non-conventional Materials and Technologies, Bath, UK, 6–9 September 2009. [Google Scholar]
  49. Latif, E.; Lawrence, R.M.H.; Shea, A.D.; Walker, P. An experimental investigation into the comparative hygrothermal performance of wall panels incorporating wood fibre, mineral wool and hemp-lime. Energy Build. 2018, 165, 76–91. [Google Scholar] [CrossRef]
  50. Latif, E.; Ciupala, M.A.; Wijeyesekerac, D.C. The comparative in situ hygrothermal performance of Hemp and Stone Wool insulations in vapour open timber frame wall panels. Constr. Build. Mater. 2014, 73, 205–213. [Google Scholar] [CrossRef] [Green Version]
  51. Nicolajsen, A. Thermal transmittance of a cellulose loose-fill insulation material. Build. Environ. 2005, 40, 907–914. [Google Scholar] [CrossRef]
  52. Southern, J.R. Summer condensation within dry lined solid walls. Build. Serv. Eng. Res. Technol. 1986, 7, 101–106. [Google Scholar] [CrossRef]
  53. Walker, R.; Pavía, S. Thermal performance of a selection of insulation materials suitable for historic buildings. Build. Environ. 2015, 94, 155–165. [Google Scholar] [CrossRef]
  54. Shea, A.; Lawrence, M.; Walker, P. Hygrothermal performance of an experimental hemp–lime building. Constr. Build. Mater. 2012, 36, 270–275. [Google Scholar] [CrossRef]
  55. McClung, R.; Ge, H.; Straube, J.; Wang, J. Hygrothermal performance of cross-laminated timber wall assemblies with built-in moisture: Field measurements and simulations. Build. Environ. 2014, 71, 95–110. [Google Scholar] [CrossRef]
  56. Tucker, S.; Latif, E.; Wijeyesekera, D.C.; Ahadzie, D. An experimental study of moisture buffering of bio-insulations in lofts. Struct. Surv. 2014, 32, 434–448. [Google Scholar] [CrossRef]
  57. Toman, J.; Vimmrová, A.; Cerný, R. Long-term on-site assessment of hygrothermal performance of interior thermal insulation system without water vapour barrier. Energy Build. 2009, 41, 51–55. [Google Scholar] [CrossRef]
  58. Wronka, A.; Beer, P.; Kowaluk, G. Selected Properties of Single and Multi-Layered Particleboards with the Structure Modified by Fibers Implication. Materials 2022, 15, 8530. [Google Scholar] [CrossRef]
  59. Pałubicki, B.; Hlásková, L.; Froömel-Frybort, S.; Rogoziński, T. Feed force and sawdust geometry in particleboard sawing. Materials 2021, 14, 945. [Google Scholar] [CrossRef]
  60. Bruno, R.; Bevilacqua, P.; Cuconati, T.; Arcuri, N. Energy evaluations of an innovative multi-storey wooden near Zero Energy Building designed for Mediterranean areas. Appl. Energy 2019, 238, 929–941. [Google Scholar] [CrossRef]
  61. Quintana-Gallardo, A.; Schau, E.M.; Niemelä, E.P.; Burnard, M.D. Comparing the environmental impacts of wooden buildings in Spain, Slovenia; and Germany. J. Clean. Prod. 2021, 329, 129587. [Google Scholar] [CrossRef]
  62. Vilčeková, S.; Čuláková, M.; Krídlová Burdová, E.; Katunská, J. Energy and Environmental Evaluation of Non-Transparent Constructions of Building Envelope for Wooden Houses. Energies 2015, 8, 11047–11075. [Google Scholar] [CrossRef] [Green Version]
  63. Grygierek, K.; Ferdyn-Grygierek, J.; Guminska, A.; Baran, L.; Barwa, M.; Czerw, K.; Gowik, P.; Makselan, K.; Potyka, K.; Psikuta, A. Energy and Environmental Analysis of Single-Family Houses Located in Poland. Energies 2020, 13, 2740. [Google Scholar] [CrossRef]
  64. Huyen Do, T.T.; Tram Ly, T.B.; Hoang, N.T.; Tran, V.T. A new integrated circular economy index and a combined method for optimization of wood production chain considering carbon neutrality. Chemosphere 2022, 311, 137029. [Google Scholar]
  65. Bazzocchi, F.; Ciacci, C.; Di Naso, V. Evaluation of Environmental and Economic Sustainability for the Building Envelope of Low-Carbon Schools. Sustainability 2021, 13, 1702. [Google Scholar] [CrossRef]
  66. Petrovic, B.; Myhren, J.A.; Zhang, X.; Wallhagen, M.; Eriksson, O. Life cycle assessment of a wooden single-family house in Sweden. Appl. Energy 2019, 251, 113253. [Google Scholar] [CrossRef]
  67. Zhang, D.; He, Y. The Roles and Synergies of Actors in the Green Building Transition: Lessons from Singapore. Sustainability 2022, 14, 13264. [Google Scholar] [CrossRef]
  68. Wang, Y.; Chen, D.; Tian, P. Research on the Impact Path of the Sustainable Development of Green Buildings: Evidence from China. Sustainability 2022, 14, 13628. [Google Scholar] [CrossRef]
  69. Li, Y.; Sun, Y.; Zeng, C.; Li, J.; Gao, Y.; Li, H. Research on the Influencing Factors for the Use of Green Building Materials through the Number Growth of Construction Enterprises Based on Agent-Based Modeling. Sustainability 2022, 14, 12774. [Google Scholar] [CrossRef]
  70. Eroğlu, H.; İstek, A.; Usta, M. Medium density fiberboard (MDF) manufacturing from wheat straw (Triticumaestivum L.) and straw wood mixture. J. Eng. Sci. 2001, 7, 305–311. [Google Scholar]
  71. Zyryanov, M.; Medvedev, S.; Mokhirev, A. Study of the possibility of using logging residue for the production of wood processing enterprises. J. Appl. Eng. Sci. 2020, 18, 15–18. [Google Scholar] [CrossRef] [Green Version]
  72. Vititnev, A.; Christova, N.; Alashkevich, Y.; Matygulina, V.; Marchenko, R. Optimization of wood fibre refining process in fibreboard production with new refiner disc working surface geometry. Bioresources 2021, 16, 7751–7766. [Google Scholar] [CrossRef]
  73. Mishurov, N.P.; Voytyuk, M.M.; Vinogradov, P.N.; Machneva, O.P.; Voytyuk, V.A. Application of waste products of crop processing in the production of building materials for agricultural facilities. IOP Conf. Ser. Earth Environ. Sci. 2021, 723, 032053. [Google Scholar] [CrossRef]
  74. 3therm. Wall 140 Preintonacato. Available online: https://www.3therm.it/wall-140/ (accessed on 10 July 2022).
  75. Nature Plus. Certification Criteria. Available online: https://www.natureplus.org/index.php?id=43&L=2 (accessed on 10 July 2022).
  76. Gazzetta Ufficiale della Repubblica Italiana. Ministero dell’Ambiente e della Tutela del Territorio e del Mare. Decreto 11 Gennaio 2017. Available online: https://www.gazzettaufficiale.it/eli/id/2017/01/28/17A00506/sg (accessed on 8 May 2022).
  77. Institut Bauen und Umwelt IBU Data. Available online: https://ibu-epd.com/en/ibu-data-start/ (accessed on 14 September 2022).
  78. ISO 14025:2006; Environmental Labels and Declarations—Type III Environmental Declarations—Principles and Procedures. International Organization for Standardization (ISO): Geneva, Switzerland, 2020. Available online: https://www.iso.org/standard/38131.html (accessed on 8 May 2022).
  79. ISO 21930:2007; Sustainability in Building Construction—Environmental Declaration of Building Products. International Organization for Standardization (ISO): Geneva, Switzerland, 2007.
  80. GUTEX Holzfaserplattenwerk, H. Henselmann GmbH + Co KG. Wood Fibre Insulating Boards. Available online: https://gutex.de/fileadmin/uploads/Downloads/Zulassungen_und_Zertifikate/GUTEX-Zertifikat-EPD_wood_fibre_insulating_boards_en.pdf (accessed on 14 September 2022).
  81. Fibertherm Flex. Available online: https://www.woodfiber.it/pdf/cam-environment-product-declaration-wood-fiber-flex.pdf (accessed on 14 September 2022).
  82. Fibertherm SD. Available online: https://www.woodfiber.it/pdf/cam-environment-product-declaration-wood-fiber-therm-sd.pdf (accessed on 14 September 2022).
  83. Fibertherm. Available online: https://www.woodfiber.it/pdf/cam-environment-product-declaration-wood-fiber-therm.pdf (accessed on 14 September 2022).
  84. STEICO SE. STEICOflex Flexible Wood Fibre Cavity Insulation. Available online: https://www.steico.com/fileadmin/user_upload/importer/downloads/umwelt-produktdeklaration_epd/STEICOflex_flexible_wood_fibre_cavity_insulation.pdf (accessed on 14 September 2022).
  85. Hunton Fiber AS. Hunton Wood Fibre Insulation Board™. Næringslivets Stiftelse for Miljødeklarasjoner. Available online: http://zulakwood.lv/wp-content/uploads/2022/05/NEPD-Nativo-English_verifisert-AB.pdf (accessed on 22 September 2022).
  86. The Norwegian EPD Foundation EPD-Norge. Available online: https://www.epd-norge.no/ (accessed on 22 September 2022).
  87. ISO 9869-1:2014(EN); Thermal Insulation—Building Elements—In-Situ Measurement of Thermal Resistance and Thermal Transmittance—Part 1: Heat Flow Meter Method. International Organization for Standardization (ISO): Geneva, Switzerland, 2014.
Figure 1. View of the site of the experimental campaign and of the test buildings.
Sustainability 15 01963 g001
Figure 2. Characteristics of the test buildings used in the study.
Sustainability 15 01963 g002
Figure 3. Test building insulated with wood fiber panels (a) and reference building (b).
Sustainability 15 01963 g003
Figure 4. Measurement scheme used in the study.
Sustainability 15 01963 g004
Figure 5. Trend of the internal and external surface temperature of the insulated and reference building (period between 7 and 13 August 2021).
Sustainability 15 01963 g005
Figure 6. Trend of the internal and external air temperature of the insulated and reference building (period between 20 and 24 July 2021).
Sustainability 15 01963 g006
Figure 7. Trend of the internal and external air temperature of the insulated and reference building (period between 7 and 13 August 2021).
Sustainability 15 01963 g007
Figure 8. Trend of the thermal flow of the insulated and reference building.
Sustainability 15 01963 g008
Figure 9. Trend of the air temperature of the insulated and reference building with electric fan heaters set at 600 Watts.
Sustainability 15 01963 g009
Figure 10. Trend of the air temperature of the insulated and reference building with electric fan heaters set at 800 Watts.
Sustainability 15 01963 g010
Figure 11. Trend of the thermal flow of the insulated and reference building with electric fan heaters set at 800 Watts.
Sustainability 15 01963 g011
Figure 12. Trend of thermal transmittances of the insulated building and of the reference with electric fan heaters set at 800 Watts.
Sustainability 15 01963 g012
Figure 13. Trend of the internal air temperature of the insulated building and of the reference one in the transition phase from the heating regime to the free-floating one.
Sustainability 15 01963 g013
Figure 14. Internal air temperature trend in the two buildings in the free-floating regime.
Sustainability 15 01963 g014
Figure 15. Trend of the internal air temperature of the insulated building and of the reference one in the free-floating regime.
Sustainability 15 01963 g015
Table 1. Building components stratigraphy.
ComponentMaterialThickness [m]
DoorOak wood0.04
RoofReinforced concrete flab0.14
Ground floorReinforced concrete flab0.12
External wallExternal cement plaster0.04
Tuff blocks0.26
Internal cement plaster0.04
Table 2. Technical specifications of the measuring instruments.
Measuring InstrumentManufacturerModelMeasuring RangeResolutionAccuracy
Heat-flow meterHuksefluxHFP01−2000 ÷ 2000 W/m20.01 W/m25% on 12 h
ThermometerLSIPt100−40 ÷ 80 °C0.01 °C0.10 °C (0 °C)
Surface temperature probeLSIEST124−40 ÷ 80 °C0.01 °C0.15 °C (0 °C)
Table 3. Average values of the Decremental factors (DF) and Phase Shift (PS) obtained from the monitoring in the passive regime.
MonthBuildingDFPS
July 2021Insulated0.35 h 32 m
Reference0.73 h 13 m
Difference52%2 h 20 m
August 2021Insulated0.25 h 06 m
Reference0.93 h 23 m
Difference75%2 h 01 m
September 2021Insulated0.35 h 10 m
Reference0.63 h 27 m
Difference48%1 h 43 m
October 2021Insulated0.35 h 11 m
Reference0.72 h 54 m
Difference58%2 h 17 m
Average values of differences60%2 h
Table 4. Comparison between the maximum temperature values outside and inside the two test buildings.
DayTemperature [°C]Insulated BuildingReference Building
22 July 2021Tmax_external32.9
Tmax_internal26.032.4
delta T [°C]6.90.5
12 August 2021Tmax_external35.2
Tmax_internal27.634.3
delta T [°C]7.60.9
Average values7.30.7
Table 5. Comparison between the internal air temperature variations in the two test buildings.
Delta T [°C]
DayInsulated BuildingReference Building
22 July 20210.63.8
12 August 20210.35.0
24 September 20210.73.7
3 October 20210.43.0
Average value0.54.0
Table 6. Comparison between the internal air temperature variations in the two test buildings.
Air Temperature (Heat Heaters Set to 600 Watts)
BuildingInitial TT Switching OffFinal T
[C°][C°][C°]
Reference10.916.59.5
Insulated12.820.515.0
ΔT [C°]1.94.05.5
%ΔT [-]17.424.257.9
Table 7. Comparison between the internal and external air temperature variations in the two test buildings with electric fan heaters set at 800 Watts.
Air Temperature
BuildingMin.
[C°]
Max.
[C°]
Ave.
[C°]
ΔT Max. − Min. [C°]%ΔT Max. − Min.
(Ref. − Ins.) [-]
Reference16.524.820.88.3−38.6
Insulated28.733.831.65.1
External1.018.49.217.4-
ΔT ref. − ins. [C°]−12.2−9.0−10.8
%ΔT ref. − ins. [-]73.936.352.1
ΔT ref. − ext. [C°]15.56.411.6
ΔT ins. − ext. [C°]27.715.422.4
Table 8. Comparison of the heat flow densities recorded in the two test buildings.
Heat Flow [W/m2]
Buildingq Ave [W/m2]
Reference14.350
Insulated11.930
Δq. ref. − ins.2.420
%Δq. ref. − ins.−16.9
Table 9. Comparison between thermal transmittances (U-value) recorded in the two test buildings.
Thermal Transmittance
BuildingU [W/m2K]
Reference1.24
Insulated0.53
ΔU ref. − ins. [W/m2K]0.71
%ΔU ref. − ins. [-]−57.0
Table 10. Comparison between the variations of the temperature in the two test buildings in the transition phase from the heating regime to the free-floating one.
BuildingT Air
(Initial)
[°C]
T Air
(16 h 20 min)
[°C]
T Air
(3.5 Days)
[°C]
T Air
(11 Days)
[°C]
Reference19.812.06.46.9
Insulated29.421.915.510.5
External11.88.97.44.8
ΔT air ref. − ins. [°C]−9.6−9.9−9.1−3.6
ΔT% air ref. − ins. [-]48.582.5142.252.2
Table 11. Comparison between the indoor and outdoor air temperatures in the two test buildings in the free-floating regime.
Air Temperature
BuildingMin.
[C°]
Max.
[C°]
Ave.
[C°]
ΔT Max. − Min.
[C°]
%ΔT Max. − Min.
(Ref. − Ins.) [-]
Reference7.210.28.83.0−66.7
Insulated9.610.610.11.0
External1.615.98.514.3-
ΔT ref. − ins. [C°]−2.4−0.4−1.3
%ΔT ref. − ins. [-]33.33.914.2
Table 12. Comparison between the surface temperatures of the internal and external air in the two buildings in the free-floating regime.
Surface Temperature
BuildingMin.
[C°]
Max.
[C°]
Ave.
[C°]
ΔT Max. − Min.
[C°]
%ΔT Max. − Min.
(Ref. − Ins.) [-]
Reference (int.)7.410.68.93.2−65.6
Reference (ext.)1.816.38.914.5
Insulated (int.)9.410.59.91.1
Insulated (ext.)0.417.68.117.2
ΔT int. − ext. ref. [C°]5.6−5.70.0
%ΔT int. − ext. ins. [-]9.0−7.11.8
Table 13. Comparison between the dynamic parameters of attenuation (DF) and phase shift (PS) of the two structures in the free-floating regime.
BuildingDFPS [h:min]
Reference0.12903:16
Insulated0.03305:44
Δ0.09502:28
Δ%7475
Disclaimer/Publisher’s Note: The statements, opinions and data contained in all publications are solely those of the individual author(s) and contributor(s) and not of MDPI and/or the editor(s). MDPI and/or the editor(s) disclaim responsibility for any injury to people or property resulting from any ideas, methods, instructions or products referred to in the content.

