Article

Study on the Dynamic Stability of an Underground Engineering Rock Mass with a Fault-Slip Seismic Source: Case Study of a URL Exploration Tunnel

School of Resource Environment and Safety Engineering, University of South China, Hengyang 421000, China
*
Author to whom correspondence should be addressed.
Sustainability 2023, 15(2), 1711; https://doi.org/10.3390/su15021711
Submission received: 18 November 2022 / Revised: 23 December 2022 / Accepted: 26 December 2022 / Published: 16 January 2023

Abstract

:
The application of fault-slip seismic sources is critical to the success of ground motion dynamic response analysis. Previous research established a finite seismic source to analyze stability in underground engineering. In this paper, a sophisticated numerical method based on the distinct element method (3DEC) is proposed to simulate the fault-slip seismic sources of an underground research laboratory (URL) exploration tunnel. Two indices, i.e., the peak ground velocity (PGV) and the strain energy density (SED), are used to analyze the sensitivity of the seismic source types, the seismic source radius, and the rupture velocities of the rock mass dynamic response. The simulation results indicate that a circular seismic source can be used so that the boundary produces a small singularity, with the seismic source having a remarkable influence on the PGV and SED. In addition, we consider that the rupture velocity is more suitable for engineering practices. A simulation method has been developed that allows the rock mass stability of a URL to be further explored.

1. Introduction

With advancements in science and technology, nuclear energy has continued to develop over the course of recent decades. While nuclear waste provides clean energy to human beings, nuclear waste disposal is a significant problem in today’s world. The nuclear waste disposal issue in Fukushima, Japan, is a good example. If a large amount of nuclear waste was dumped into the Pacific Ocean, it would undoubtedly cause a fatal blow to the human–marine ecological environment [1,2,3]. It is well known that safe nuclear waste disposal is crucial for humans to avoid radioactive radiation [4,5,6]. To fill the gap in underground research and development platforms and equipment for high-level radioactive waste disposal technology, there are plans in China to construct an underground research laboratory (URL) for high-level radioactive waste disposal in Beishan, Gansu province [7,8,9]. The URL will play a vital role in long-term research into radioactive waste disposal in the future [10,11]. Based on the site selection, using research that has been conducted for more than 30 years, the URL in Beishan adopts a spiral slope, combining three shafts and a second-floor lane as parts of the main structure. Construction tests were carried out on 280 and 560 m underground platforms, which constituted field experiments.
Rock mass stability and dynamic disturbances in URLs have been the focus in geotechnical engineering research for a long time [12,13]. On one hand, the stability of URLs is affected by the mechanical properties of the rock mass and the stress state of the surrounding rock. On the other hand, radon is a radionuclide that is harmful to human bodies and can be found in URLs, and the development of cracks in the failure of surrounding rock provides favorable conditions for the abnormal release of radon gas [14,15,16]. Therefore, studying the stability of the surrounding rock under dynamic disturbance in underground laboratories is of great significance.
In discussing the rock mechanics of the geological disposal repository of radioactive waste, the relevant scholars at home and abroad have also conducted corresponding research on the rock mechanics of URLs. Khayrutdinov et al. [17] proposed a mathematical modeling method to solve the problem of reusing man-made waste from the mining and processing of ores, which has been successfully applied. Rybak et al. [18] used FLAC3D to analyze the conditions of change in the state of an underworked rock mass, revealing the deformation mechanism of salt deposits with stowing. Litvinenko [19] focused on the topical geomechanical and geodynamic problems of mining, proposing a methodology for geomechanically safe underground space mining. Kongar-Syuryun et al. [20] presented a method to solve the problem of choosing a technology for developing a mineral deposit and selecting a rational filling mixture composition for given filling parameters. Jing conducted a comprehensive analysis and elaborated on the numerical methods, laboratory tests, and work conducted in China on the geological disposal of nuclear waste [21]. Niu [22] carried out in situ stress measurement and numerical simulation research on the stress state of the surrounding rock affecting a nuclear waste geological disposal repository. Yang [23] studied the coupling effect of rock mass excavation blasting and transient unloading under the high in situ stress state of a nuclear waste geological disposal repository. Kown et al. [24] conducted a numerical simulation of the fracture penetration rate based on factors such as rock mass excavation damage, thermal load, and glaciation. They analyzed the variation in the fracture penetration rate under stress redistribution. In addition to the geo-stress, blasting load, and thermal coupling factors, the seismic waves caused by fault dislocation and slips are significant disturbances affecting the stability of surrounding rock in underground engineering. The moment tensor theory is a standard method for analyzing the microseismic events caused by fault slips. The failure characteristics of the rock mass can be described effectively by studying the focal mechanism. It is well known that a fault in three-dimensional space has different orientations, angles, sizes, and so on. Through the use of numerical simulation, many scholars have reproduced fault slips to analyze the response characteristics in the rock mass and assess the rock mass damage risk. For example, Lei et al. [25] simulated a geological repository of nuclear waste in Sweden under a large earthquake. They performed a detailed analysis of the expansion of the fracture network under different slips. Chen et al. [26,27] simplified the seismic source into a rectangular fault plane and simulated the fault-slip process with a simple sinusoidal function velocity load. On this basis, Lan et al. [28] optimized the velocity mode of a fault slip using the Yoffe function velocity load, which is similar to that occurring in engineering practice, and studied the dynamic behavior of rock mass under different radiation modes. The above research methods for studying the fault ruptures and sliding rock masses caused by dynamic responses are research achievements. However, there are still some deficiencies in this field of research; for example: adopting the point source method, a failure to consider fault parameters such as shape and orientation, and some numerical simulation factors in the process of creating slippage fault from breakdown have not been examined. As a result, it is necessary to construct a seismic source using the shape of the fault section and the rupture effect, and to then analyze the dynamic response characteristics of the rock mass.
In analyzing the previously mentioned research, it can be noted that systematic research on the microseismic aspects of the geological disposal of high-level radioactive waste has not been carried out, and few scholars have used the discrete element method to study the rock mass behavior caused by microseismic activities in high-level radioactive waste disposal. Consequently, the purpose of this study is to examine the rock mass behavior caused by microseismic activities in high-level radioactive waste disposal. To achieve this, the following tasks are proposed: (1) simulating the seismic source considering rupture behavior using 3DEC; (2) exploring the effect of different seismic source parameters on the dynamic response mechanism of rock masses; and (3) providing guidance for the dynamic instability and risk assessment of a URL exploration tunnel.

2. Finite Seismic Source Model of Fault Slip

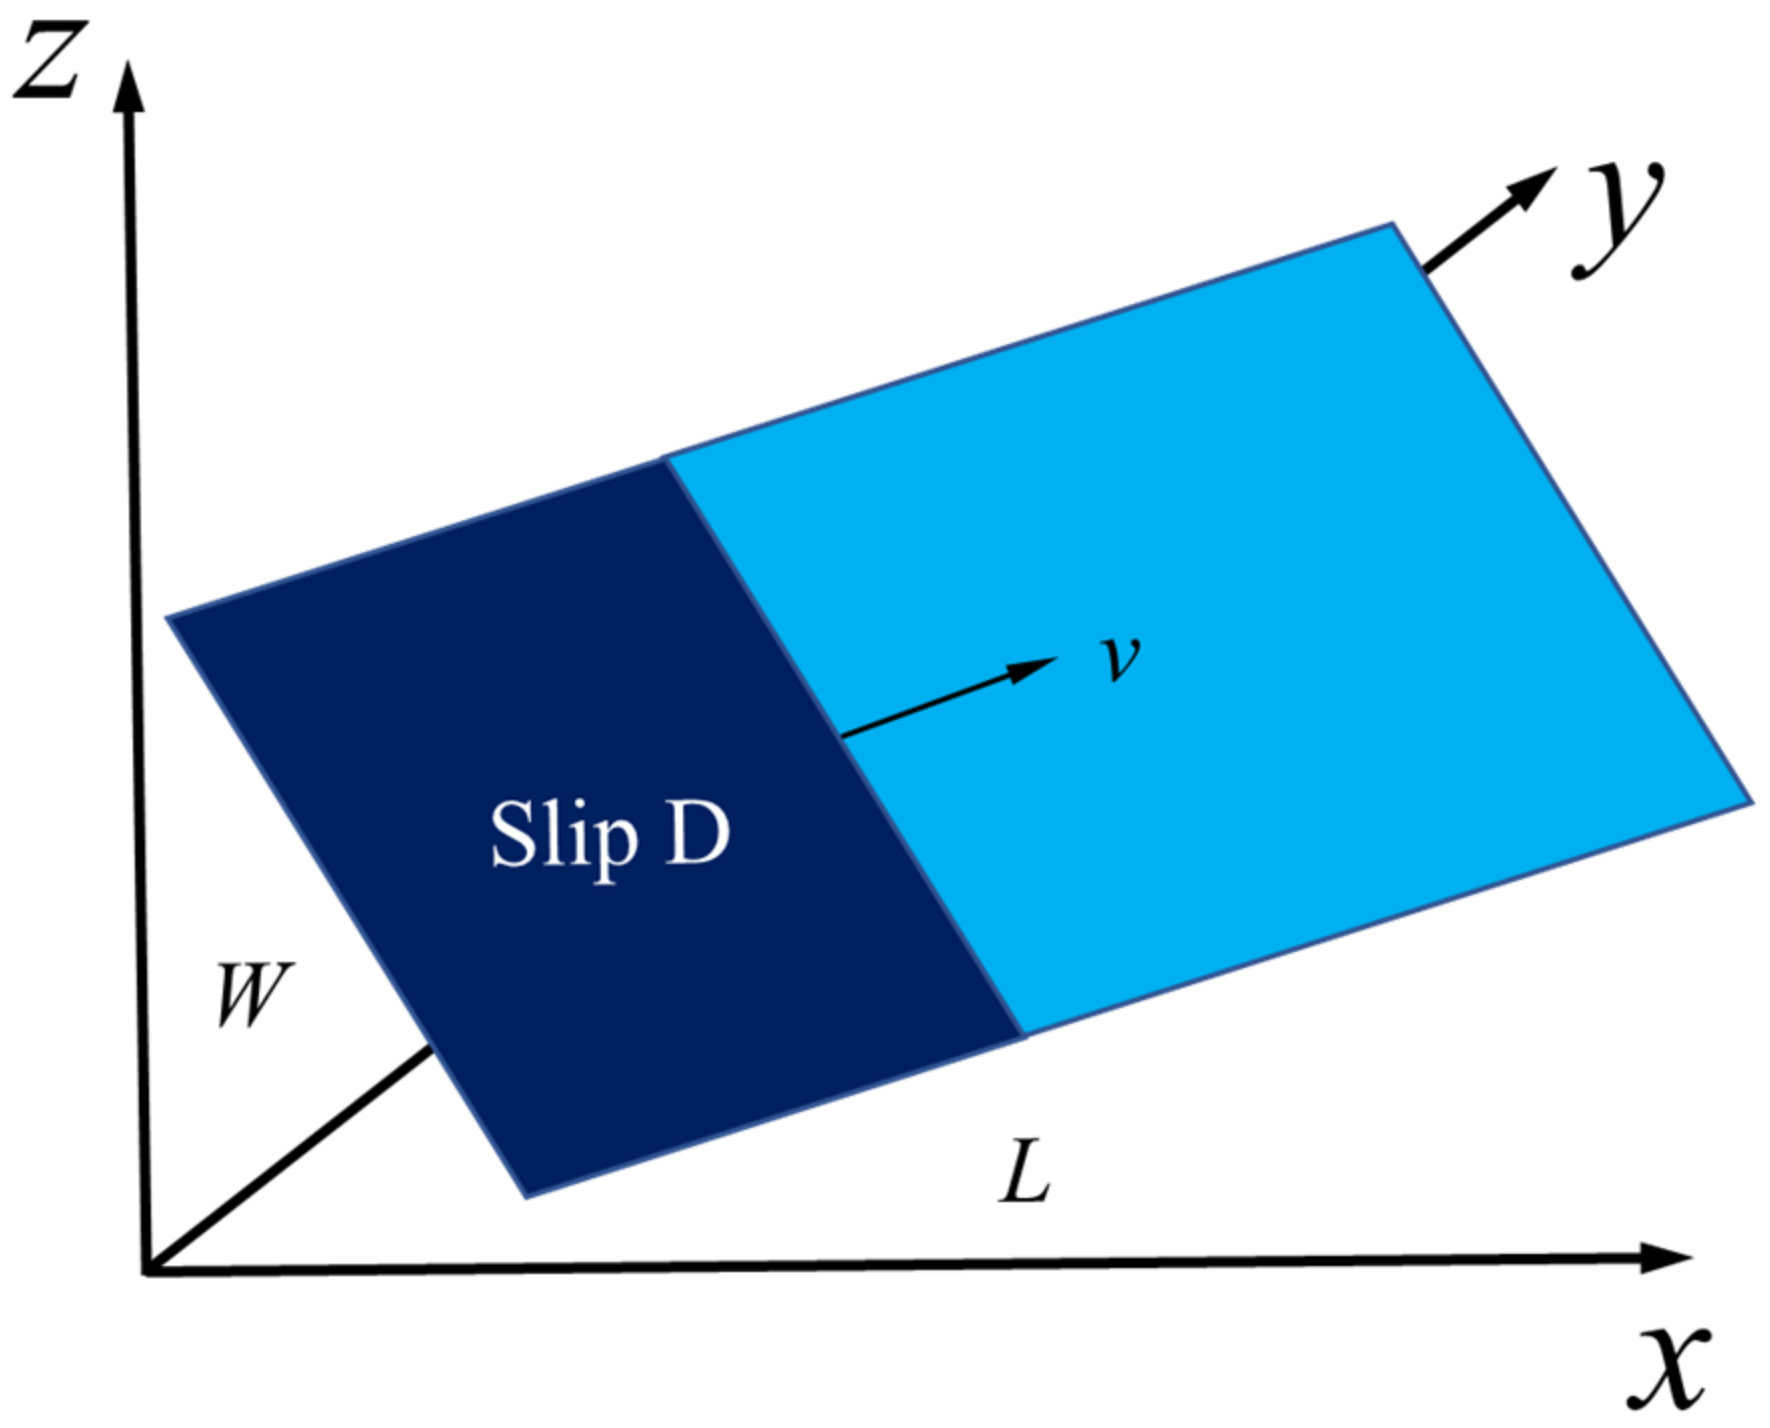
2.1. Rectangular Seismic Source

Regarding microseismology, fault-slip-type seismic sources are generally regarded as point sources. However, if a seismic source is regarded as a point source, it must satisfy the far-field condition. Nevertheless, a point source model adopted in the near field cannot describe fault properties such as size, location, or radiation patterns. Therefore, in engineering practice, when dynamic disturbance analysis of a rock mass near a seismic source is carried out, fault planning and regularizing are necessary [29]. Currently, the slippage behavior of faults is described by the dislocation model of faults, as shown in Figure 1 and Figure 2, in which: v is the fault-slip velocity (m/s); D represents the slip amount in the fault rupture zone (m); and L and W are the length and width of the two-dimensional fault surface [26,27].
In practice, fault parameters should include orientation, size and glide direction, dip angle, fault size, and slippage direction for faults located in a three-dimensional space. In 3DEC, the occurrence and location of fault planes can be determined through built-in commands. Based on the principle of equivalence, a circular fault of an area S = L W = π R 0 2 can be equivalent to a rectangular source, where S is the fault area and R0 represents the equivalent source radius.

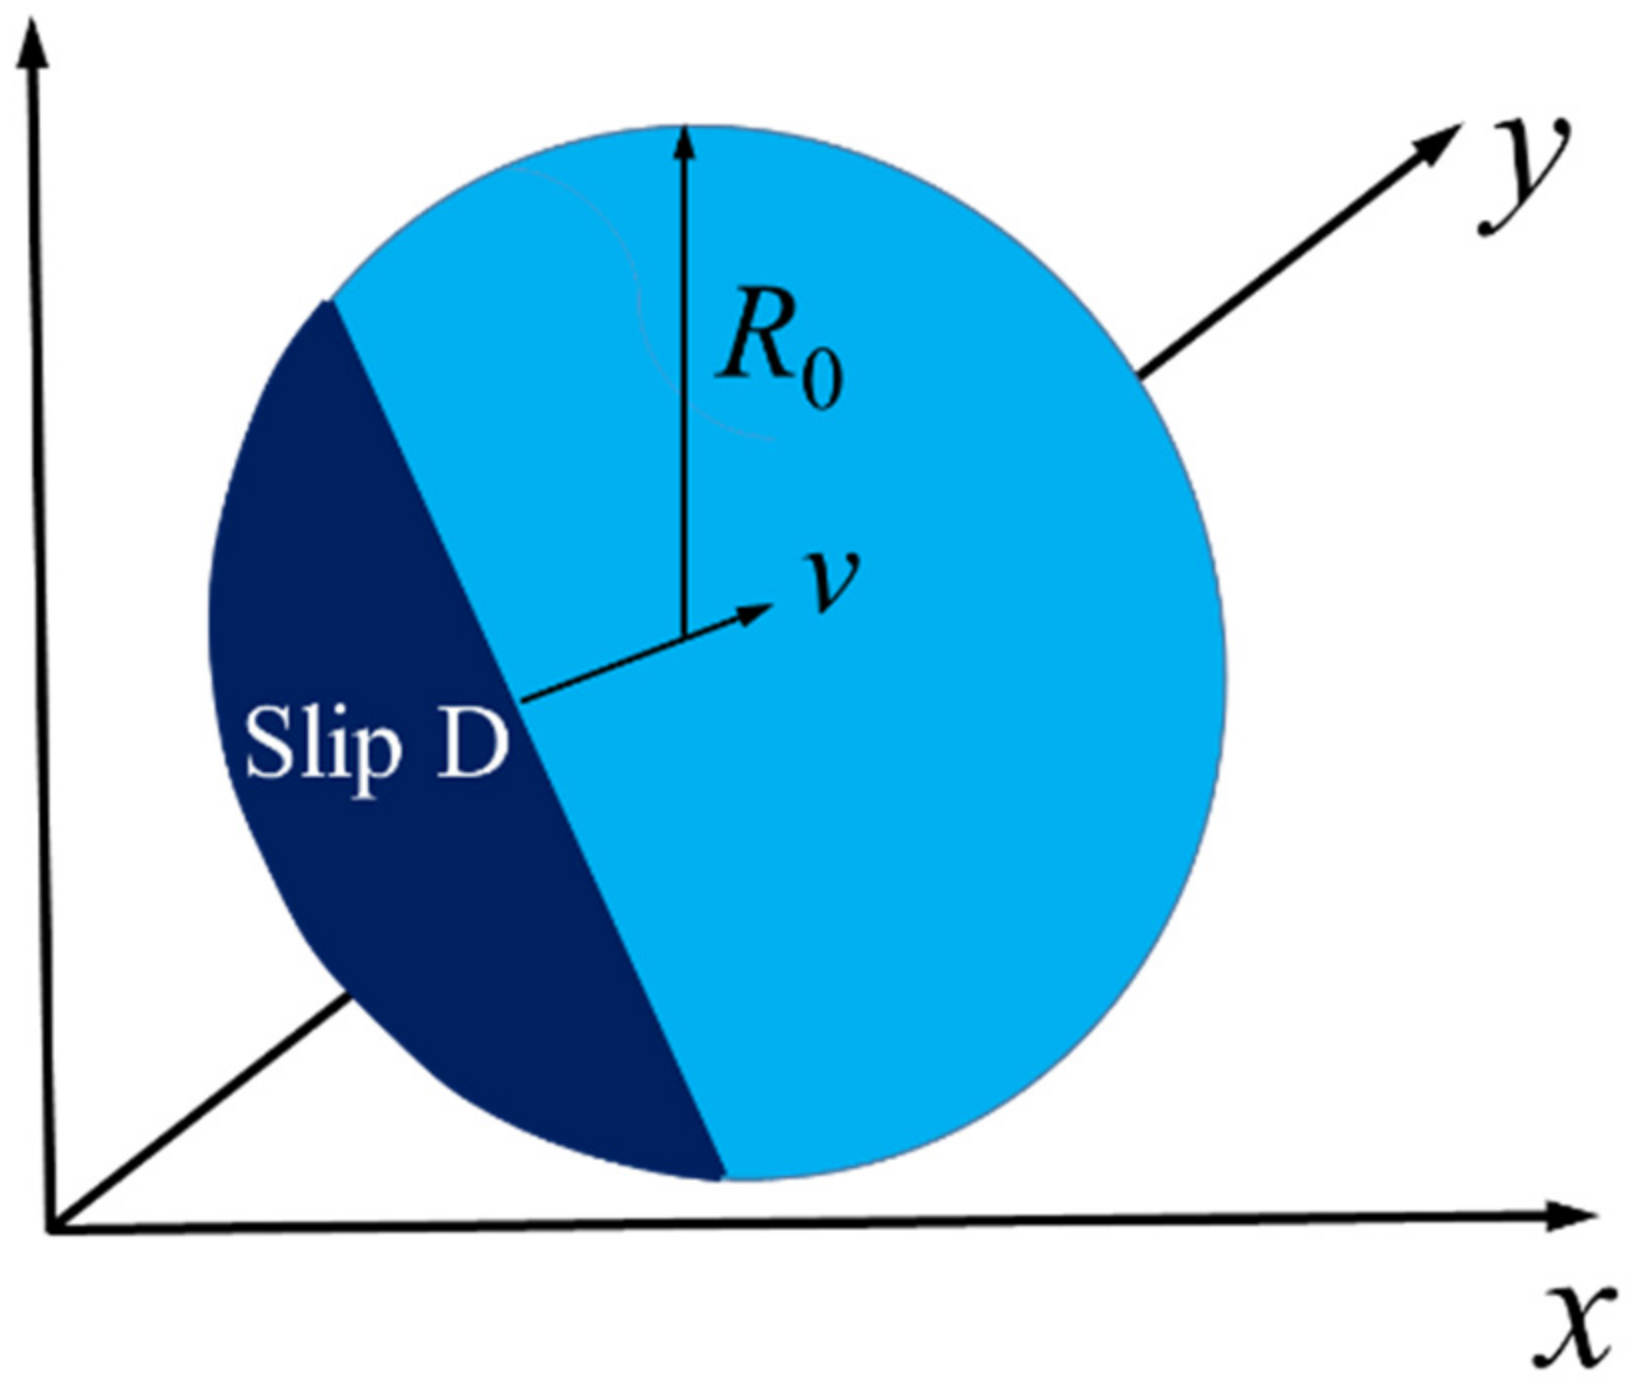
2.2. Circular Seismic Source

In seismology, the widely used circular seismic source was proposed by Savage, Brune, and Keyless-Borok [30]. The advantage of using the circular seismic source is that it avoids the non-singularity of the fault slippage boundary, and it is a smooth transition between the fault slip and stress changes. In the circular seismic source, the rupture starts from the center of the source and constantly breaks and slips at a constant rate, following the principle of self-similarity. The simple solution to this type of problem is given by Equation (1):
Δ u x ( r , t ) = C ( v r ) Δ σ μ v r 2 t 2 r 2
where C ( v r ) is the function of the rupture rate and, generally, C ( v r ) = 1; r represents the initial radius of the seismic source in the cylindrical coordinate system; a = vrt is the instantaneous rupture radius at times; Δσ denotes the stress reduction of the rupture zone; and µ stands for the elastic stiffness.
Later, Sato and Hirasawa proposed an analytical solution for the radiation field of the revised circular seismic source as follows:
Ω S H ( t , θ ) = C ( v r ) 2 π 1 v r / c sin θ 1 v r 2 t 2 a 2 ( 1 + v r / c sin θ ) 2 Δ σ a 2 v r
where θ is the polar angle of the observation point.
In the numerical simulation of the fault slippage, since the time from rupture to slip is very short, the rupture time can be negligible and considered 0. Like the Haskell rectangular seismic source model, Figure 2 shows a simple circular fault slippage model with an area of S = π R 0 2 .

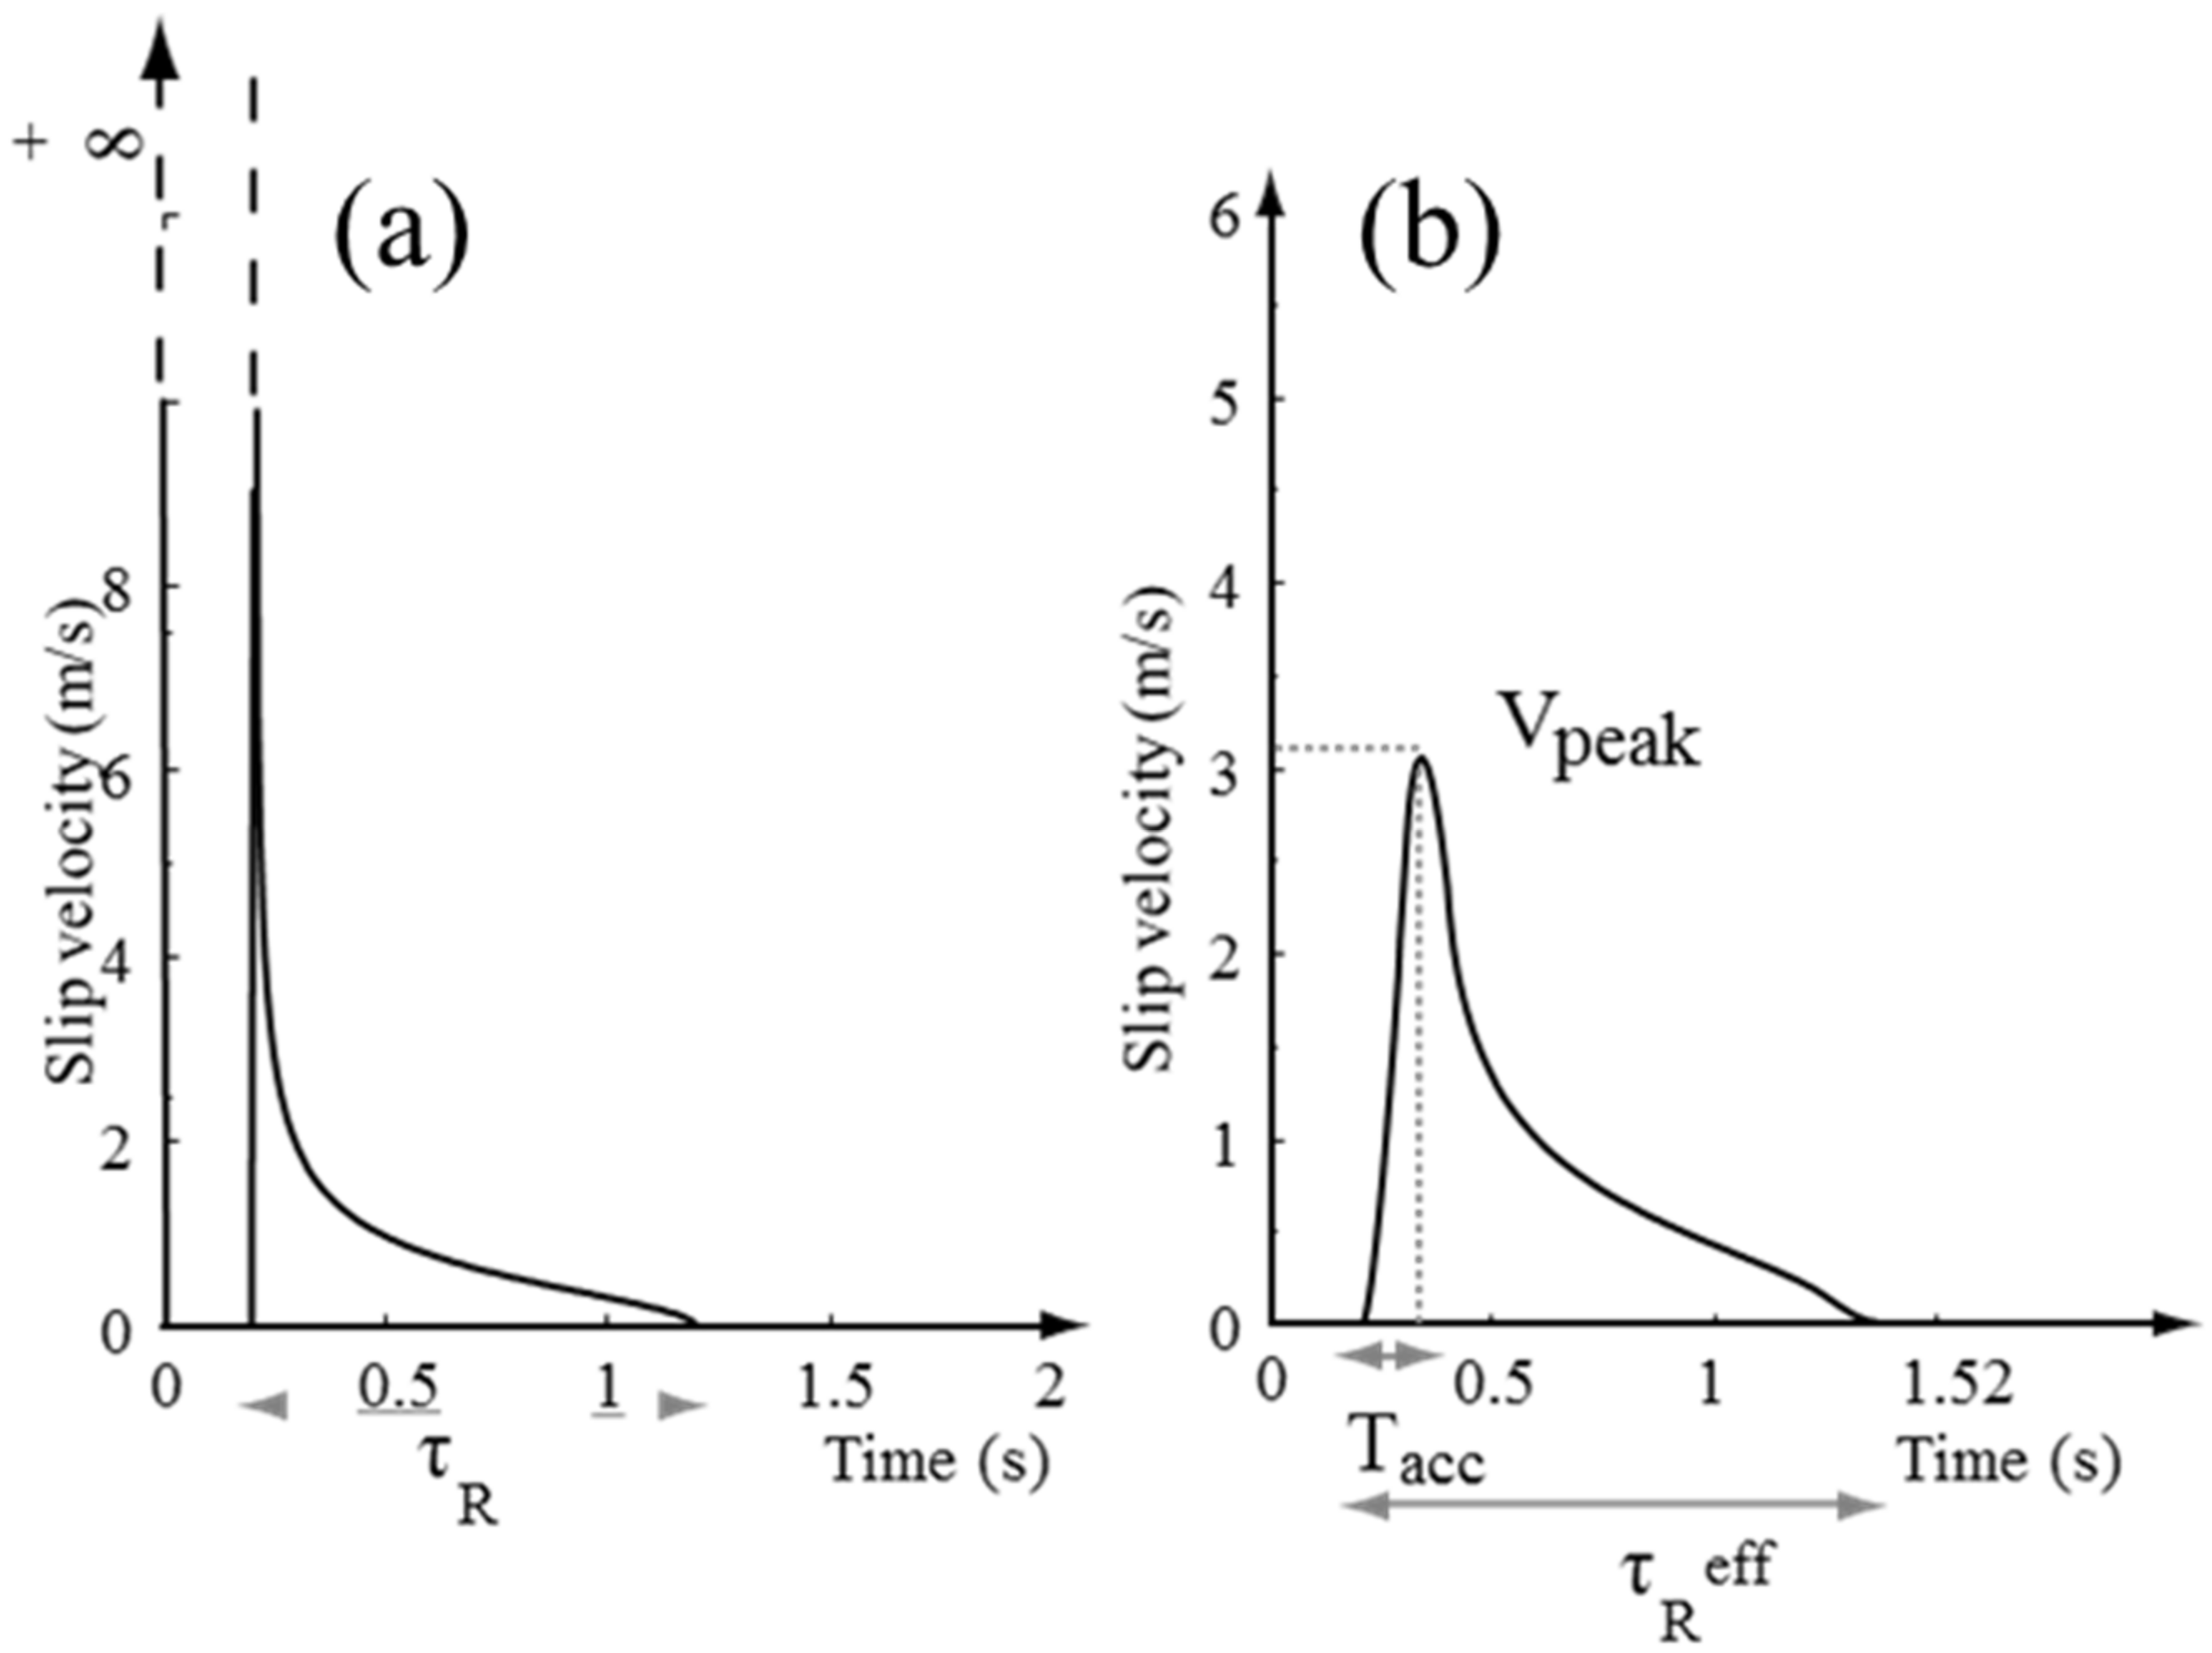
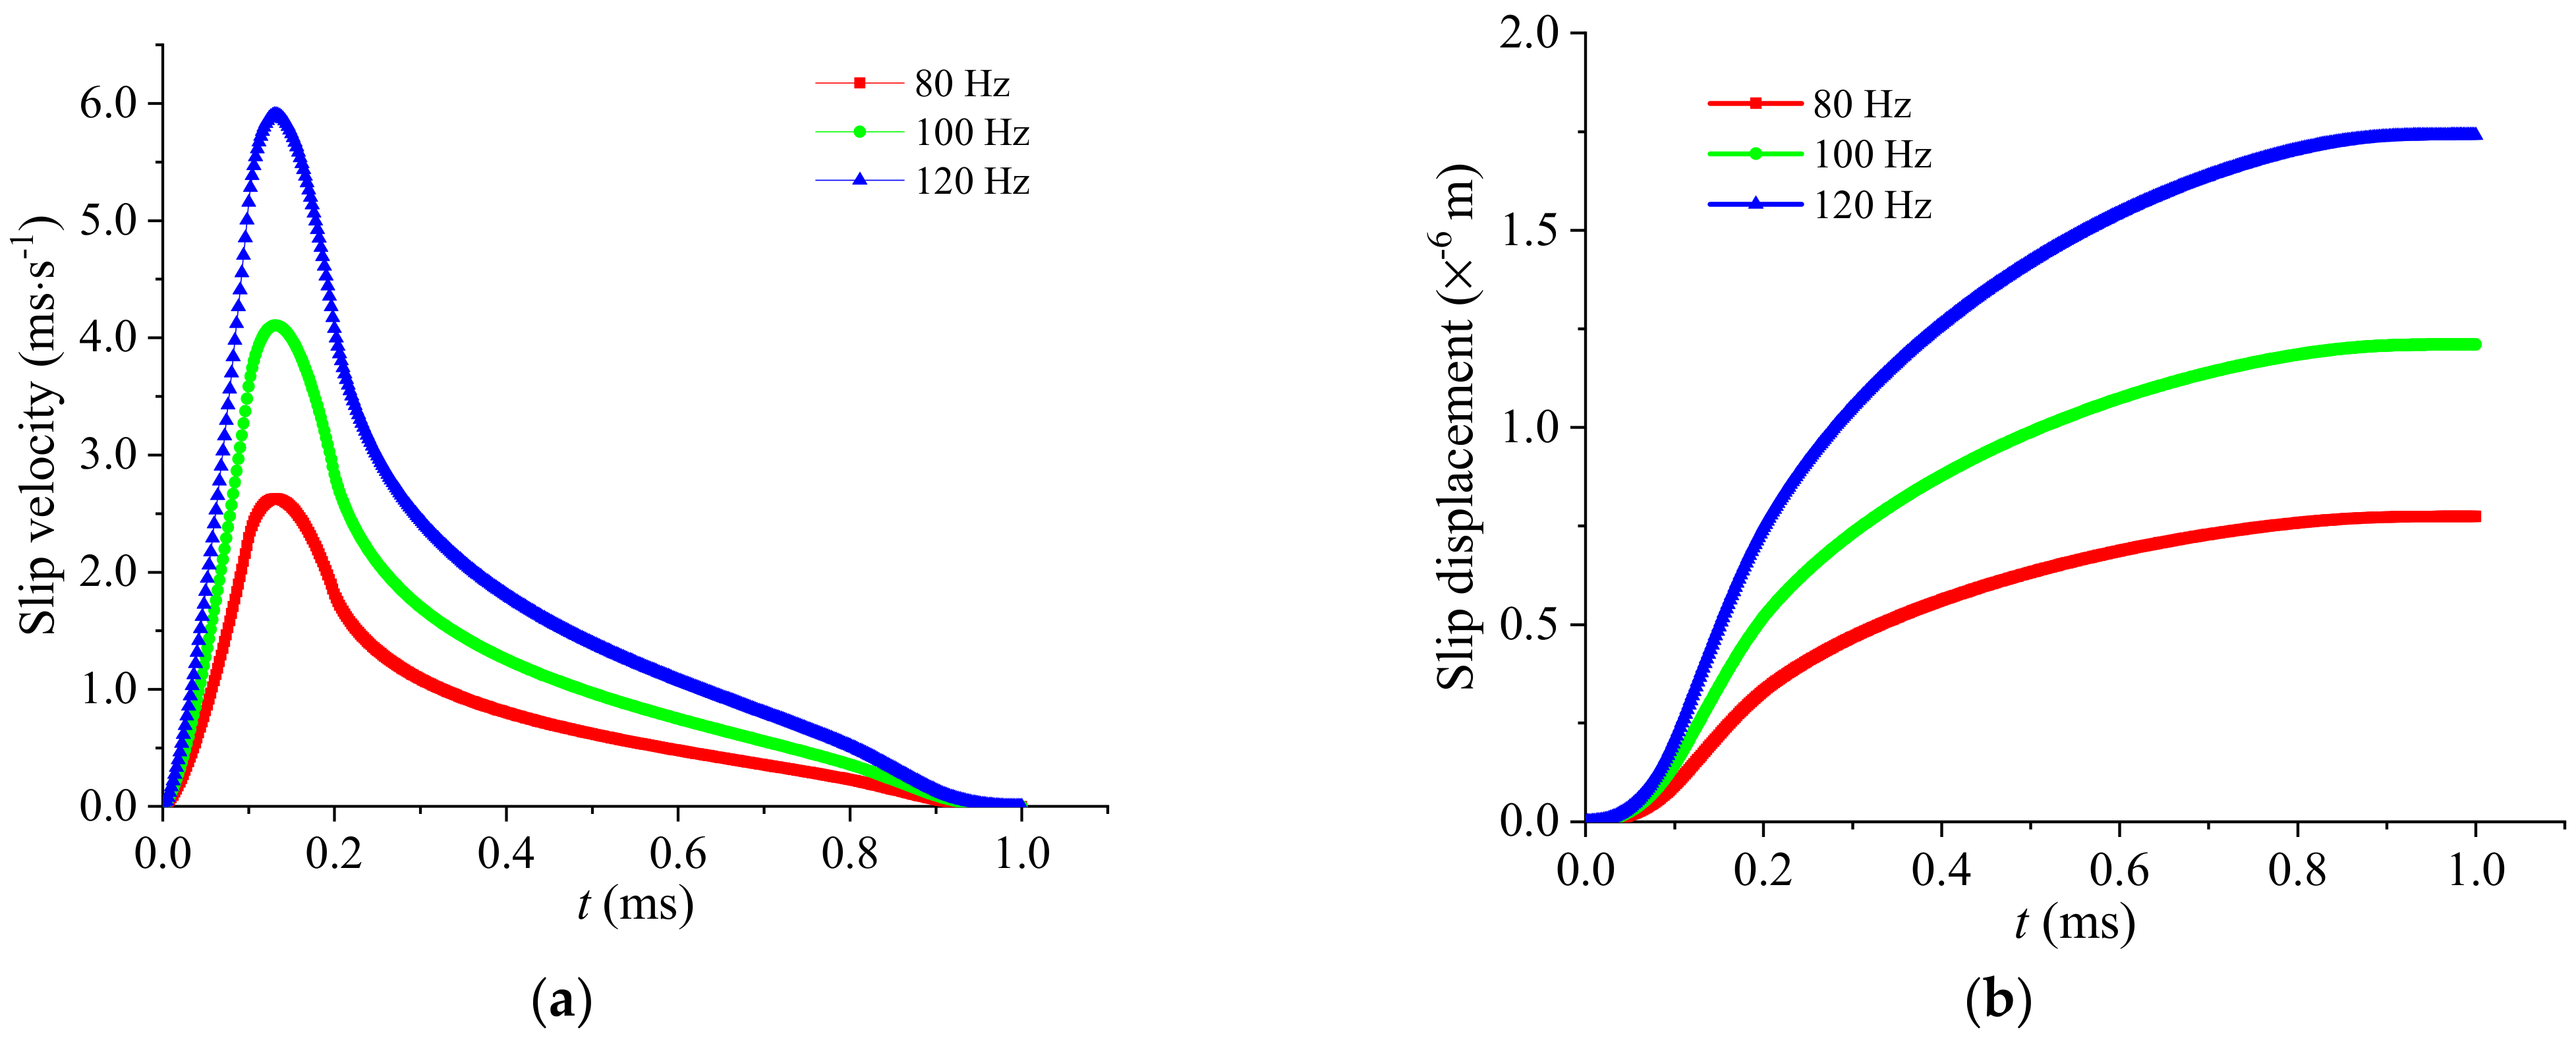
2.3. Time Function of Seismic Source

The seismic moment is used to measure the overall strength of the fault slippage microseismic event, which is defined as the product of shear stiffness μ , slippage area D, and displacement of the fault S, and the expression is:
M 0 = μ D S
where μ and D are constants while S is the function of the slip velocity v over time. Generally, slippage velocity can be treated as pulse, trigonometric, trapezoidal, or half-cycle sine functions. Nielsen and Madariaga proposed a new time function—a modified Yoffe model [31]—which was applied to study the radiation characteristics of fault slippage microseismic events. Related studies have proved that the modified Yoffe function describes the fault-slip velocity rising rapidly to peak velocity and falling. Numerous studies have shown that the physical behavior of this function is closer to seismic mechanics. The mathematical expression substituted for the modified Yoffe velocity function is:
V ( t ) = D max + W ( t T ) Y ( T ) d T
where V(t) consists of a trigonometric function W(t) and the fundamental offer function Y(t); the mathematical expressions for W(t) and Y(t) are as follows:
Y ( t ) = 2 π τ R H ( t ) H ( τ R t ) τ R t t
W ( t ) = 1 τ S 2 [ t H ( t ) H ( τ S t ) + ( 2 τ S t ) H ( t τ S ) H ( 2 τ S t ) ]
where H(t) represents the Heaviside step function; t is a particular moment of slip; and τs and τR are the time control parameters, with the slip velocity curve varying with the change in τs and τR. For typical microseismic events, the value of τs/τR is is generally restricted between 10% and 30%, and the relationship between the two parameters and the effective τ R e f f time is:
τ R e f f = τ R + 2 τ S
Therefore, the modified Yoffe time function is determined by three parameters: τR, τs, and Dmax. Figure 3 compares the classical Yoffe time function and the modified Yoffe time function. It can be seen from Figure 3 that singularities exist at the beginning of the classical Yoffe function, while the modified Yoffe function overcomes this defect.
The source radius is formulated by Sato et al. [32] as follows:
R 0 = S π = 1.45 β 2 π f 0
where β = μ / ρ represents the shear-wave velocity; ρ is the rock density; and f0 denotes the corner frequency.

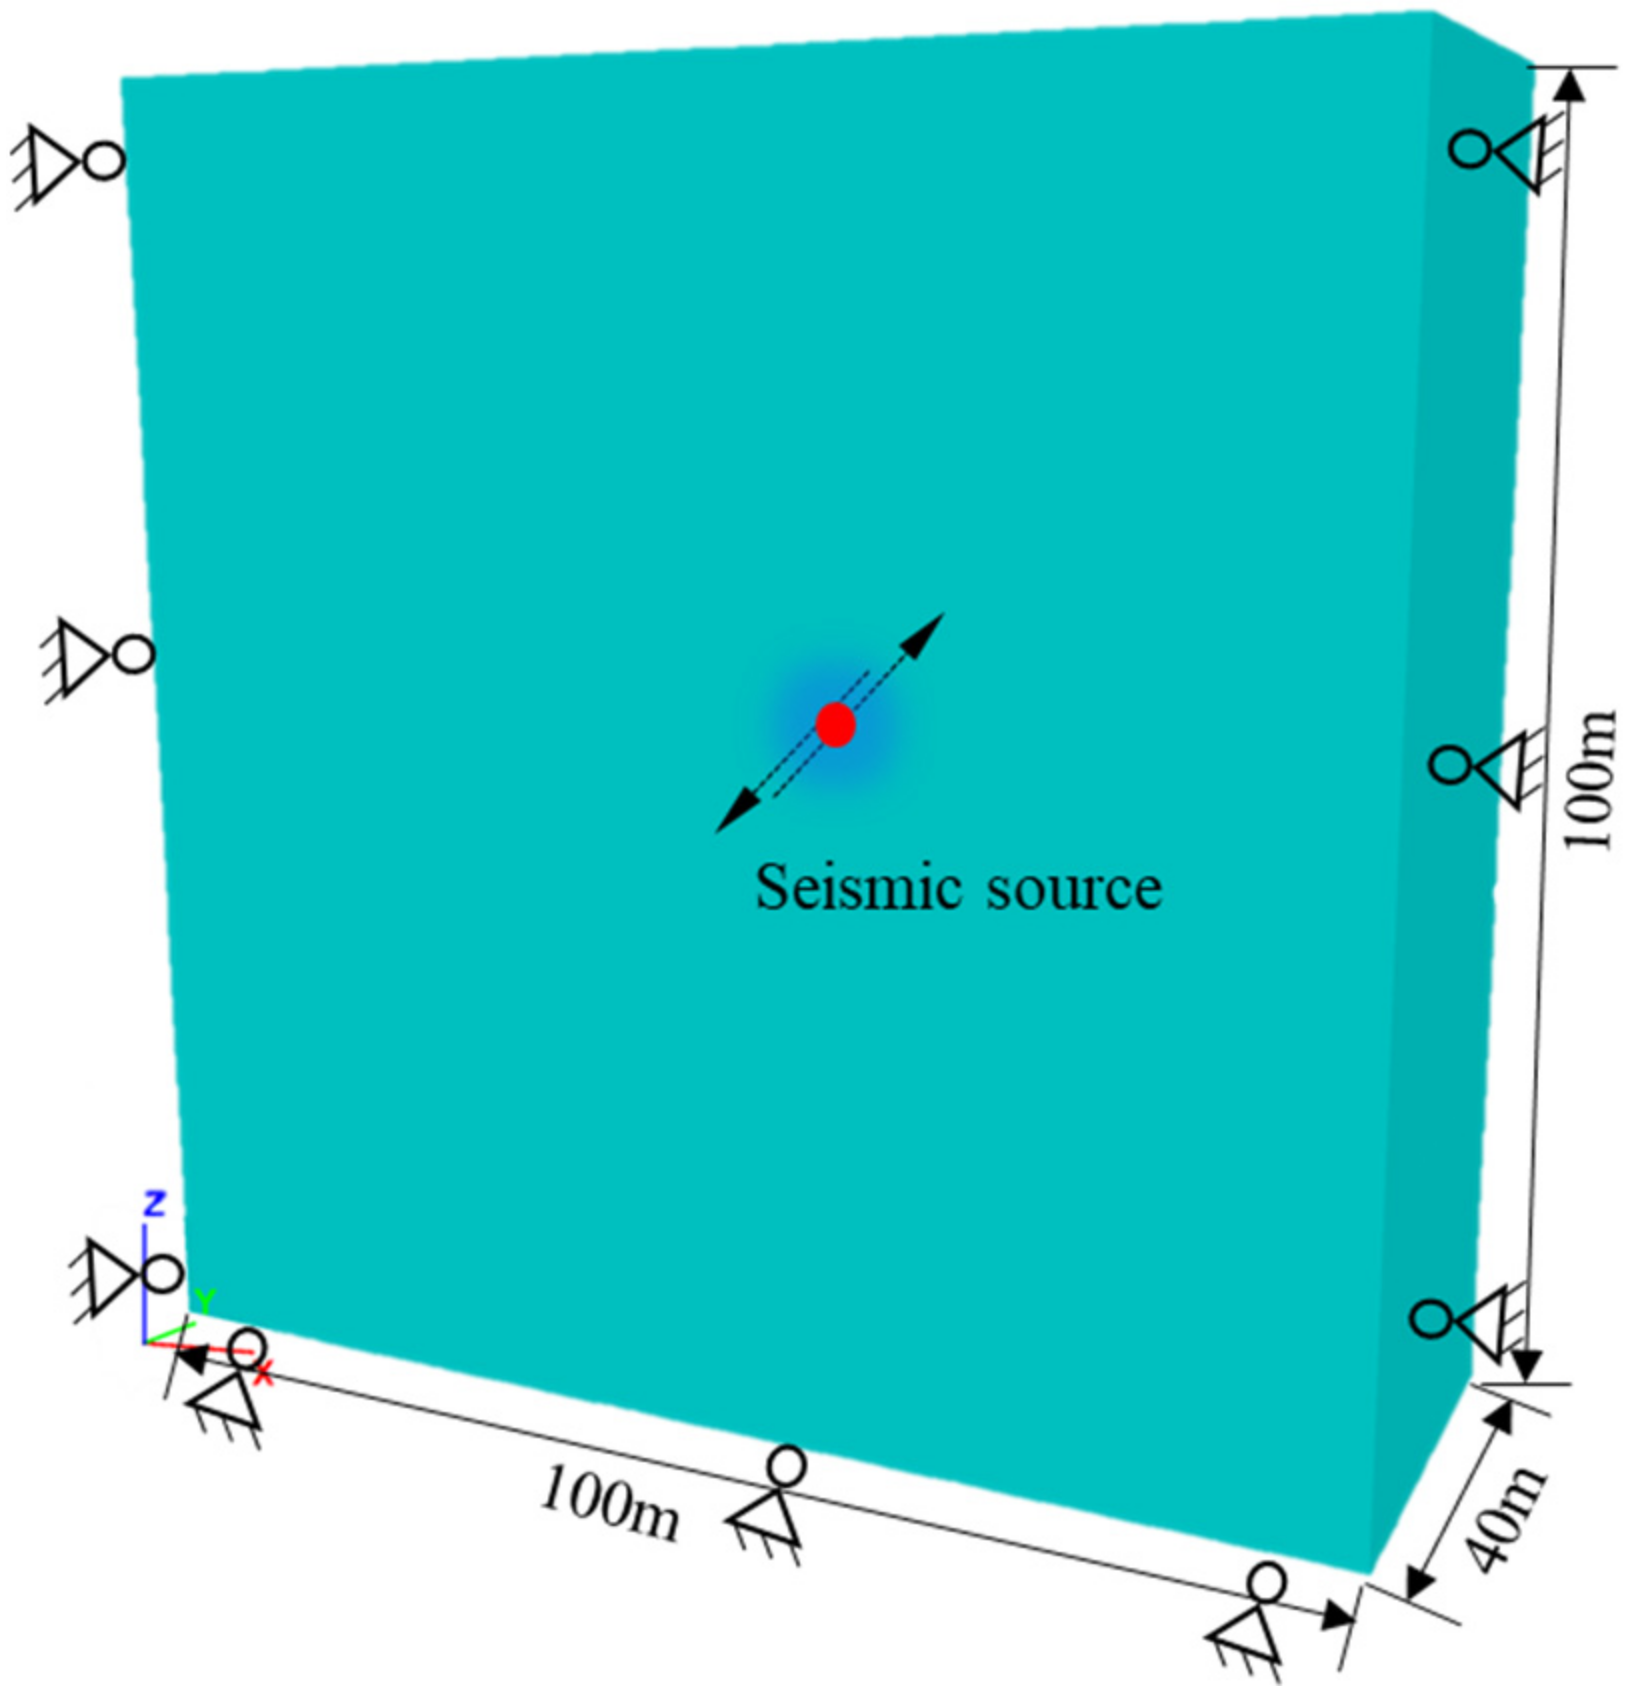
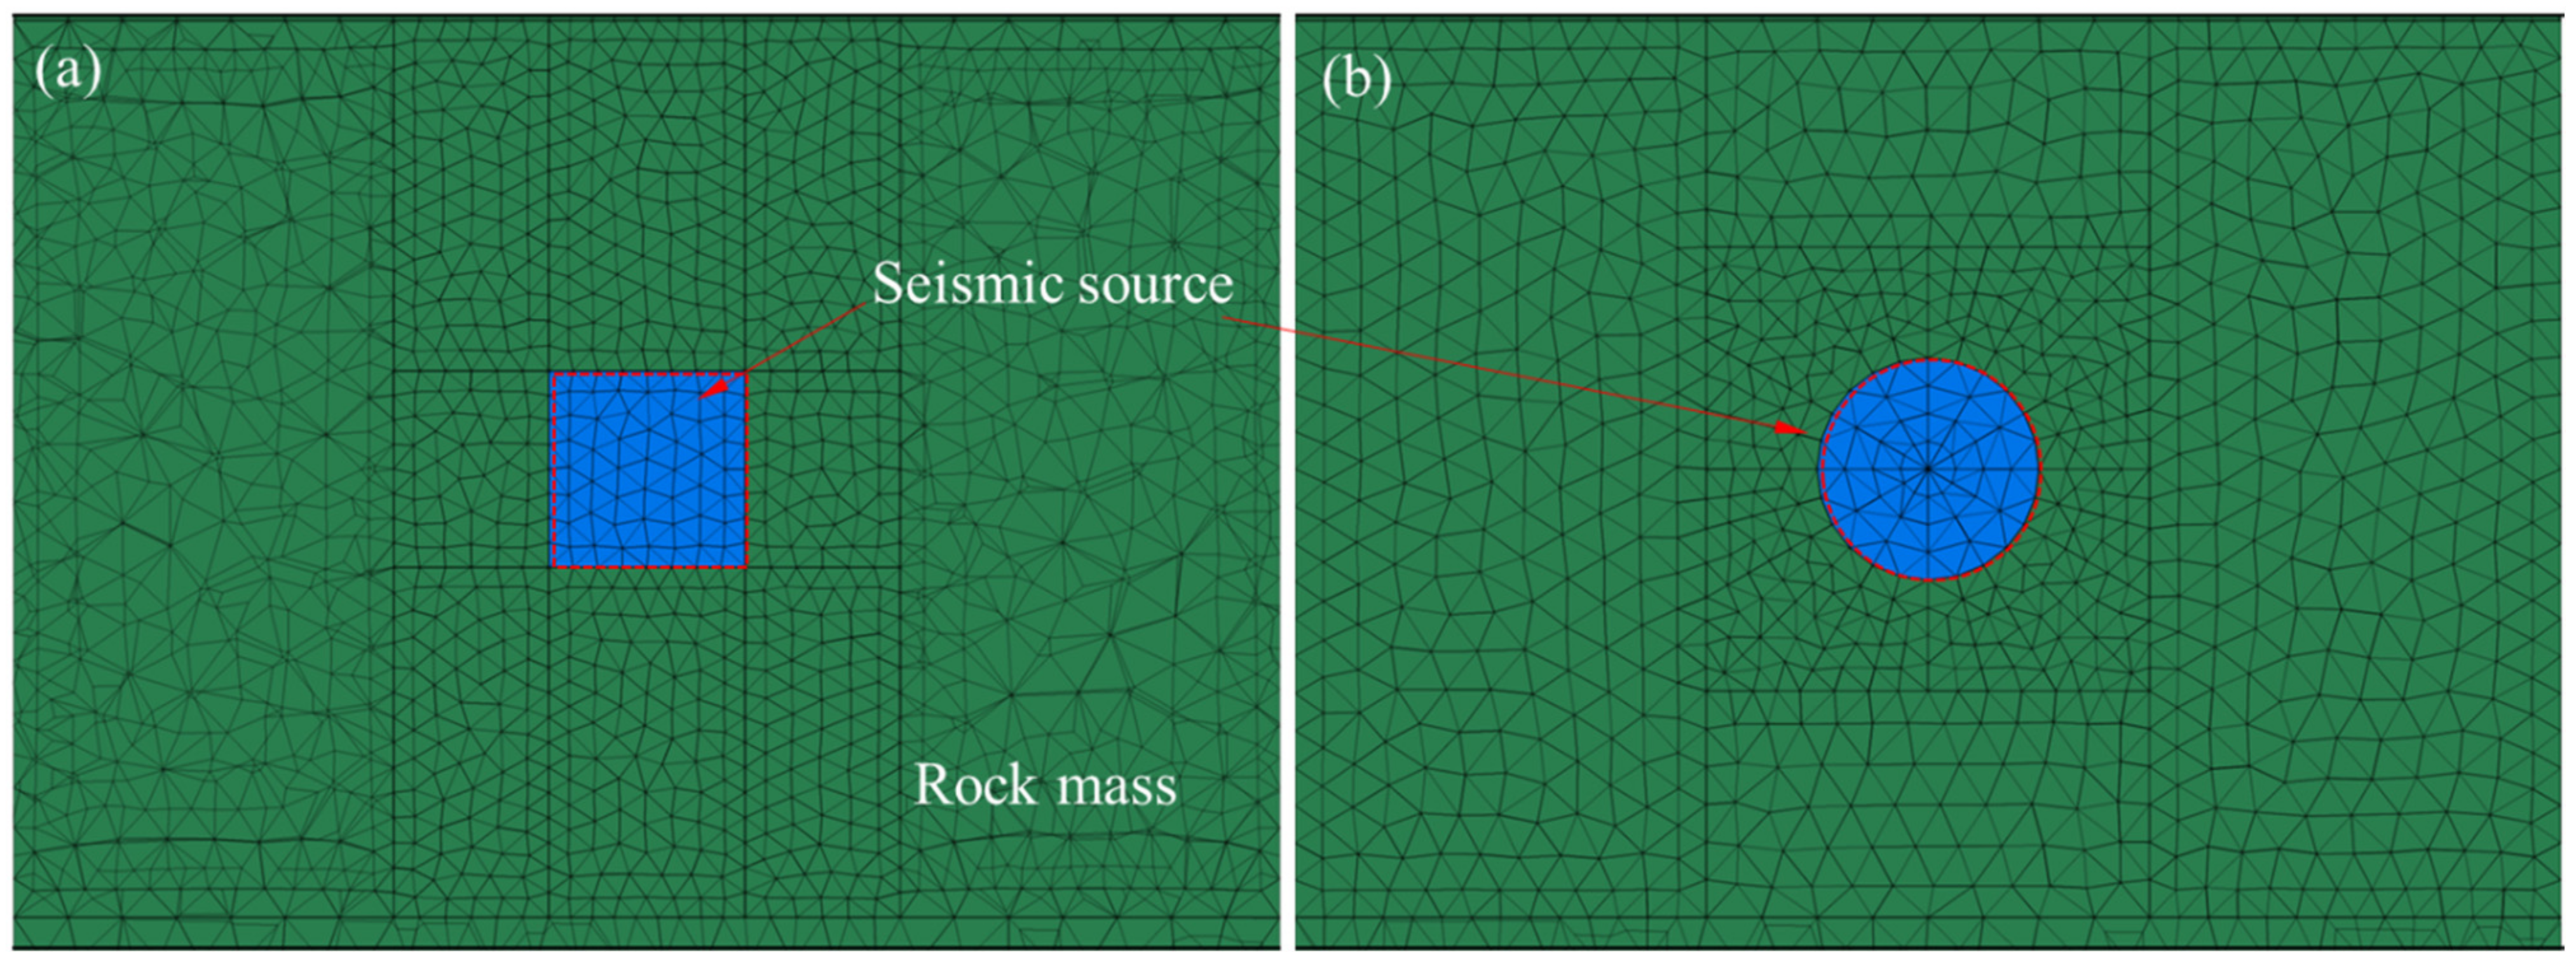
3. Numerical Modeling

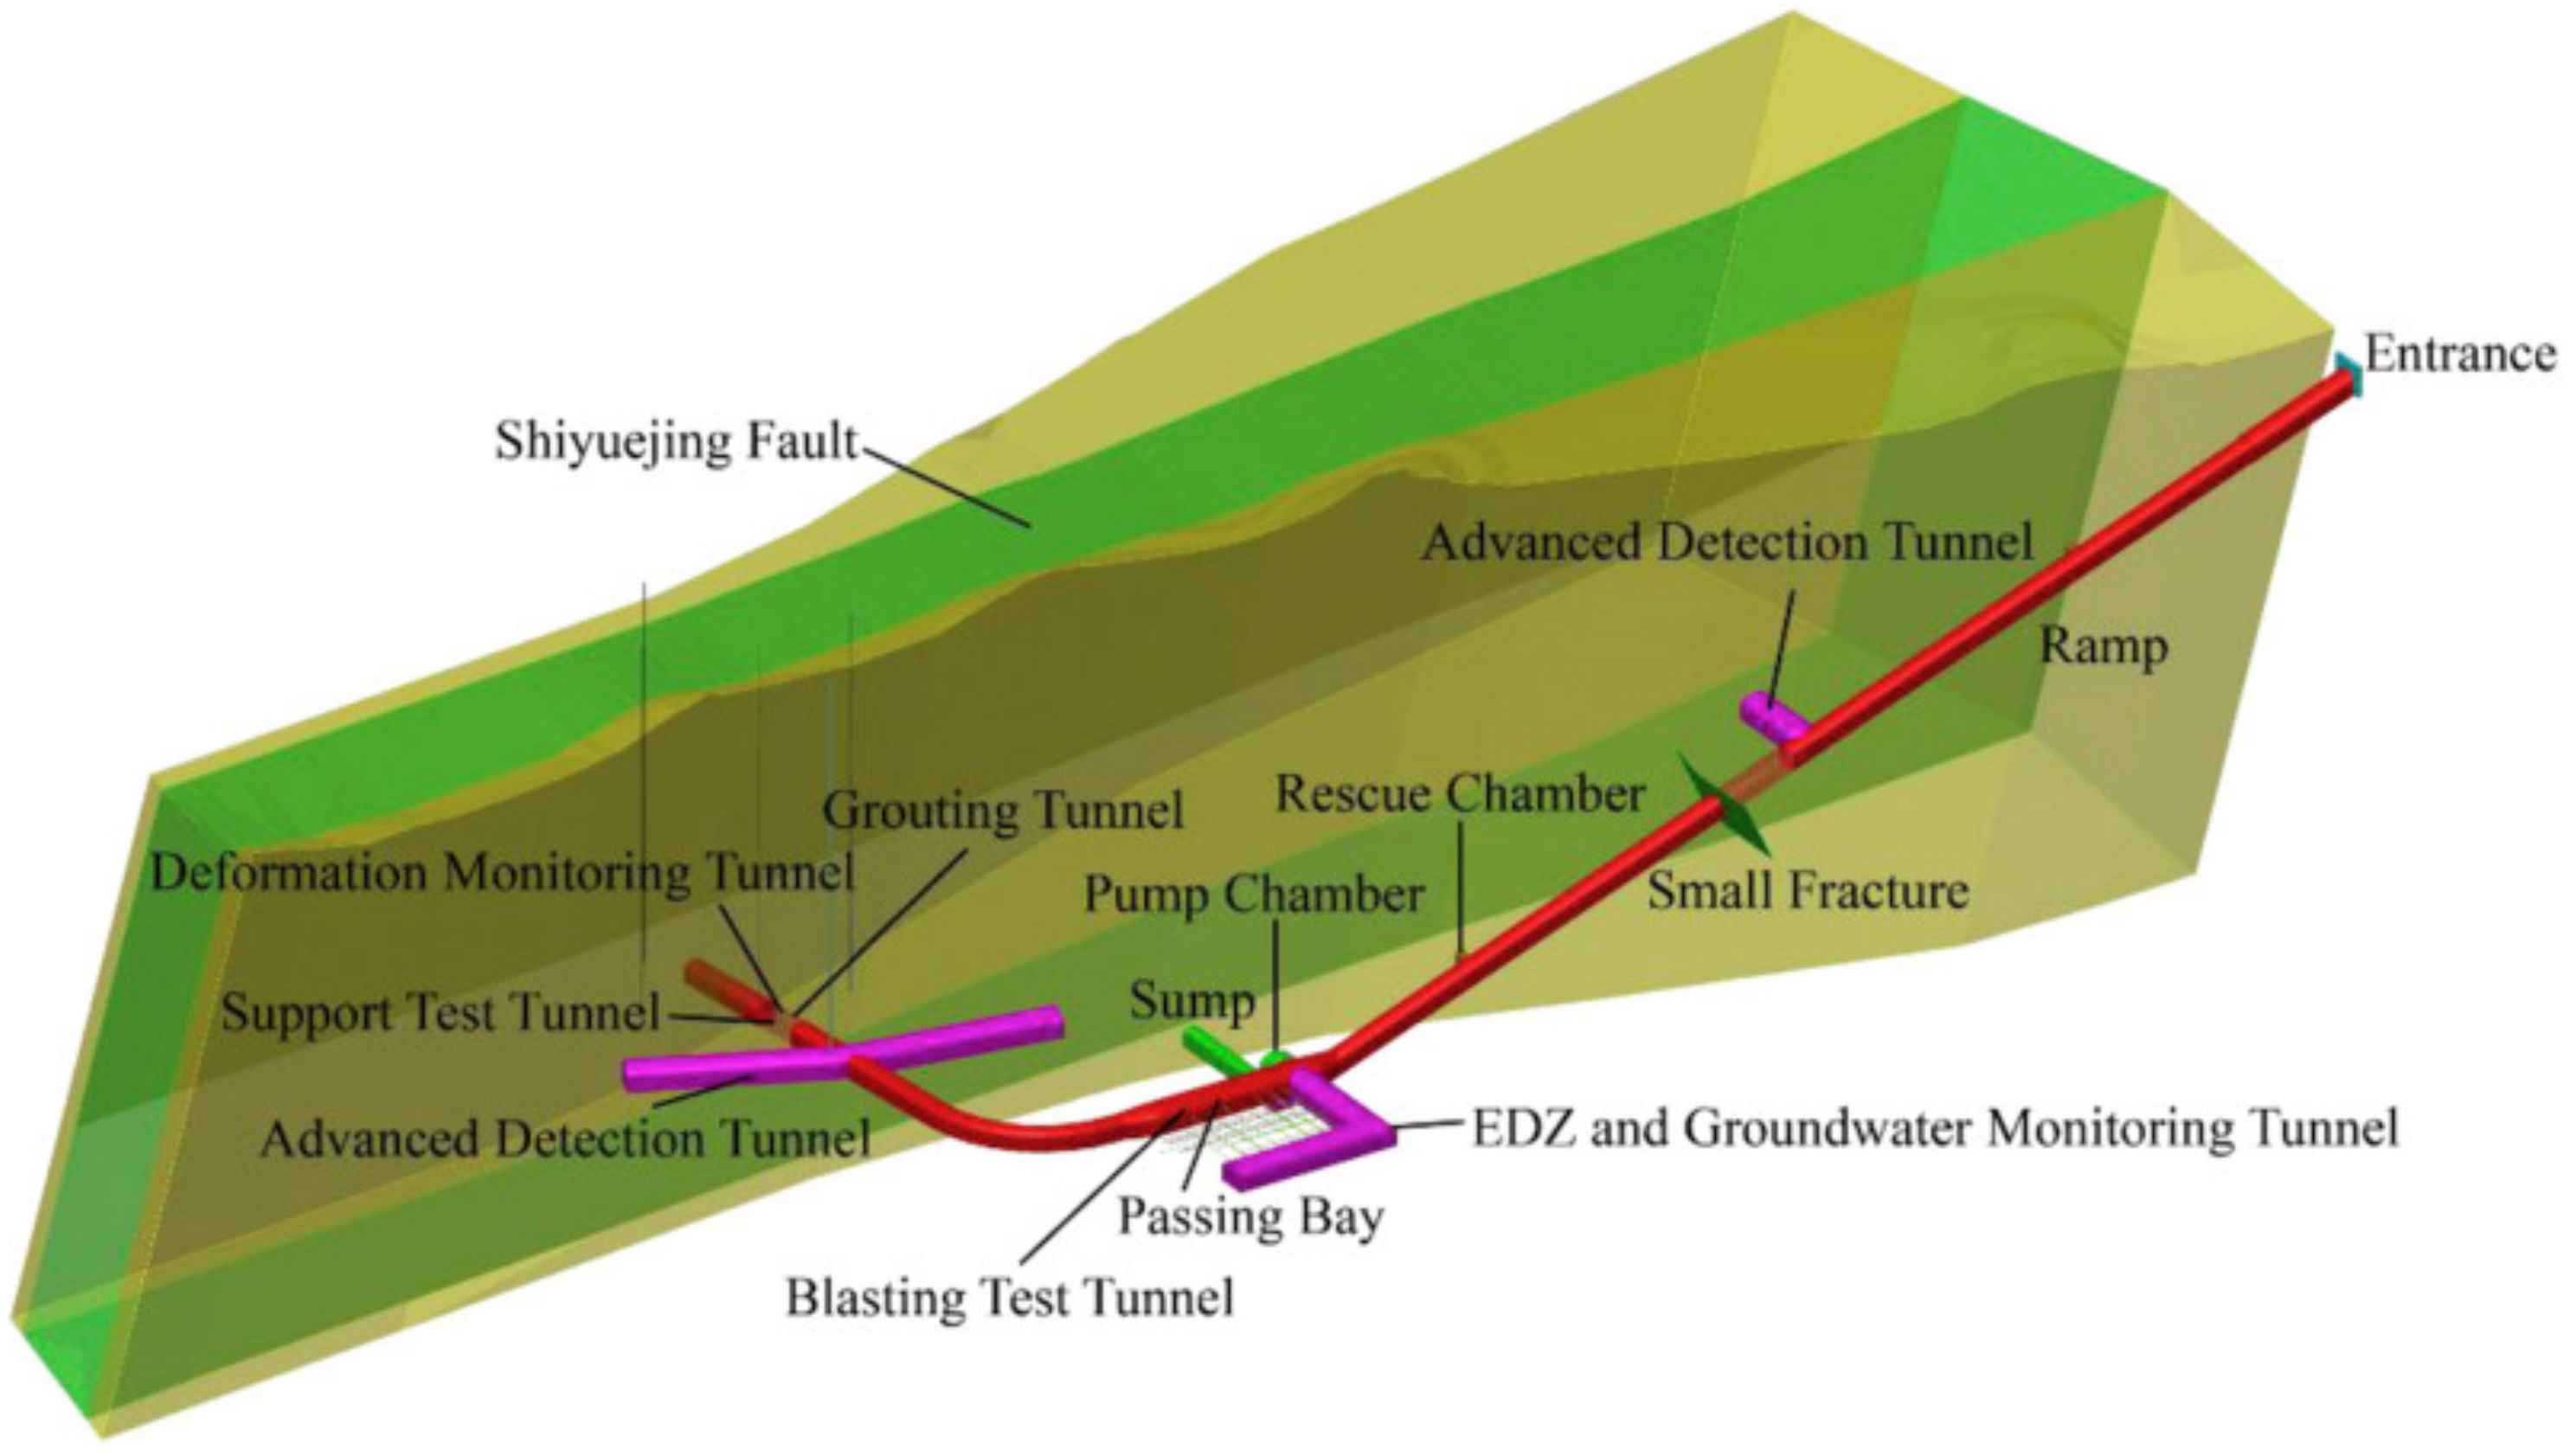
3.1. Engineering Background

The Beishan exploration tunnel with a maximum buried depth of 50 m is located in an old well area of Beishan, Gansu Province. The engineering includes an inclined shaft, test drift, water storage, and tunnel engineering. The Shiyuejing fault has a tilt angle of 20° and a total length of 146.19 m. The water tank is at the bottom of the inclined shaft, perpendicular to the drift, at a distance of 20 m. In addition, there are four extraordinary test chambers, respectively, located in the middle of the inclined shaft. The inclined shaft levels out, and the left and right sides of the curved shaft section extend outward, with a total length of 90 m. As an essential part of the URL’s safety technology research project, the exploitation tunnel provides a test platform for the excavation, support, advance detection, and evaluation technology of the excavation damage zone, as shown in Figure 4.
The exploration tunnel is located among large fault zones, where on-site microseismic monitoring displayed frequent microseismic activities around it. However, more intense fault rupture behavior was not detected.

3.2. Rock Mechanical Parameters and In Situ Stress in Beishan

The rock masses in the Beishan exploration tunnel are dominated by porphyritic monzogranite and dolomitic diorite, mixed with a small amount of pegmatite formed in the process of magmatic differentiation or later intrusive. Ma et al. [33] detailed a study on the Beishan exploration tunnel’s rock mechanical parameters. In this paper, the medium and fine-grained granodiorite with a hole depth of approximately 50 m was taken as the primary research object, and its basic rock mechanical parameters are shown in Table 1.
The maximum horizontal stress direction of the Beishan in situ stress is NNE~NEE, which is basically the same as the direction of the regional tectonic stress field, concentrated between N54° E and N63° E. In the underground engineering design, the focus of the roadway is generally along the direction of the maximum principal stress. The arrangement is conducive to the concentration of surrounding rock stress. Through linear regression, the variation law of in situ stress with depth in the Beishan exploratory pit is obtained as follows:
σ H = 0.022 H + 4.142 σ h = 0.016 H + 2.574 σ V = 0.0268 H
where σH is the maximum principal stress in the horizontal direction; σh represents the middle principal stress in the horizontal direction; σV stands for the minimum principal stress in the vertical direction; and H denotes the depth of the rock mass.
According to the statistical analysis by He [34], the average seismic moment of the Beishan exploratory tunnel is lgM0 = 6.68, which is converted into M0 = 4.79 × 10⁶ N∙m.
The elastic constitutive relationship is used in this model, and the Mohr–Coulomb constitutive relationship is used for the fault. The upper boundary of the model is the free boundary, and the other five surfaces are the normal displacement constraint boundaries, as shown in Figure 5.

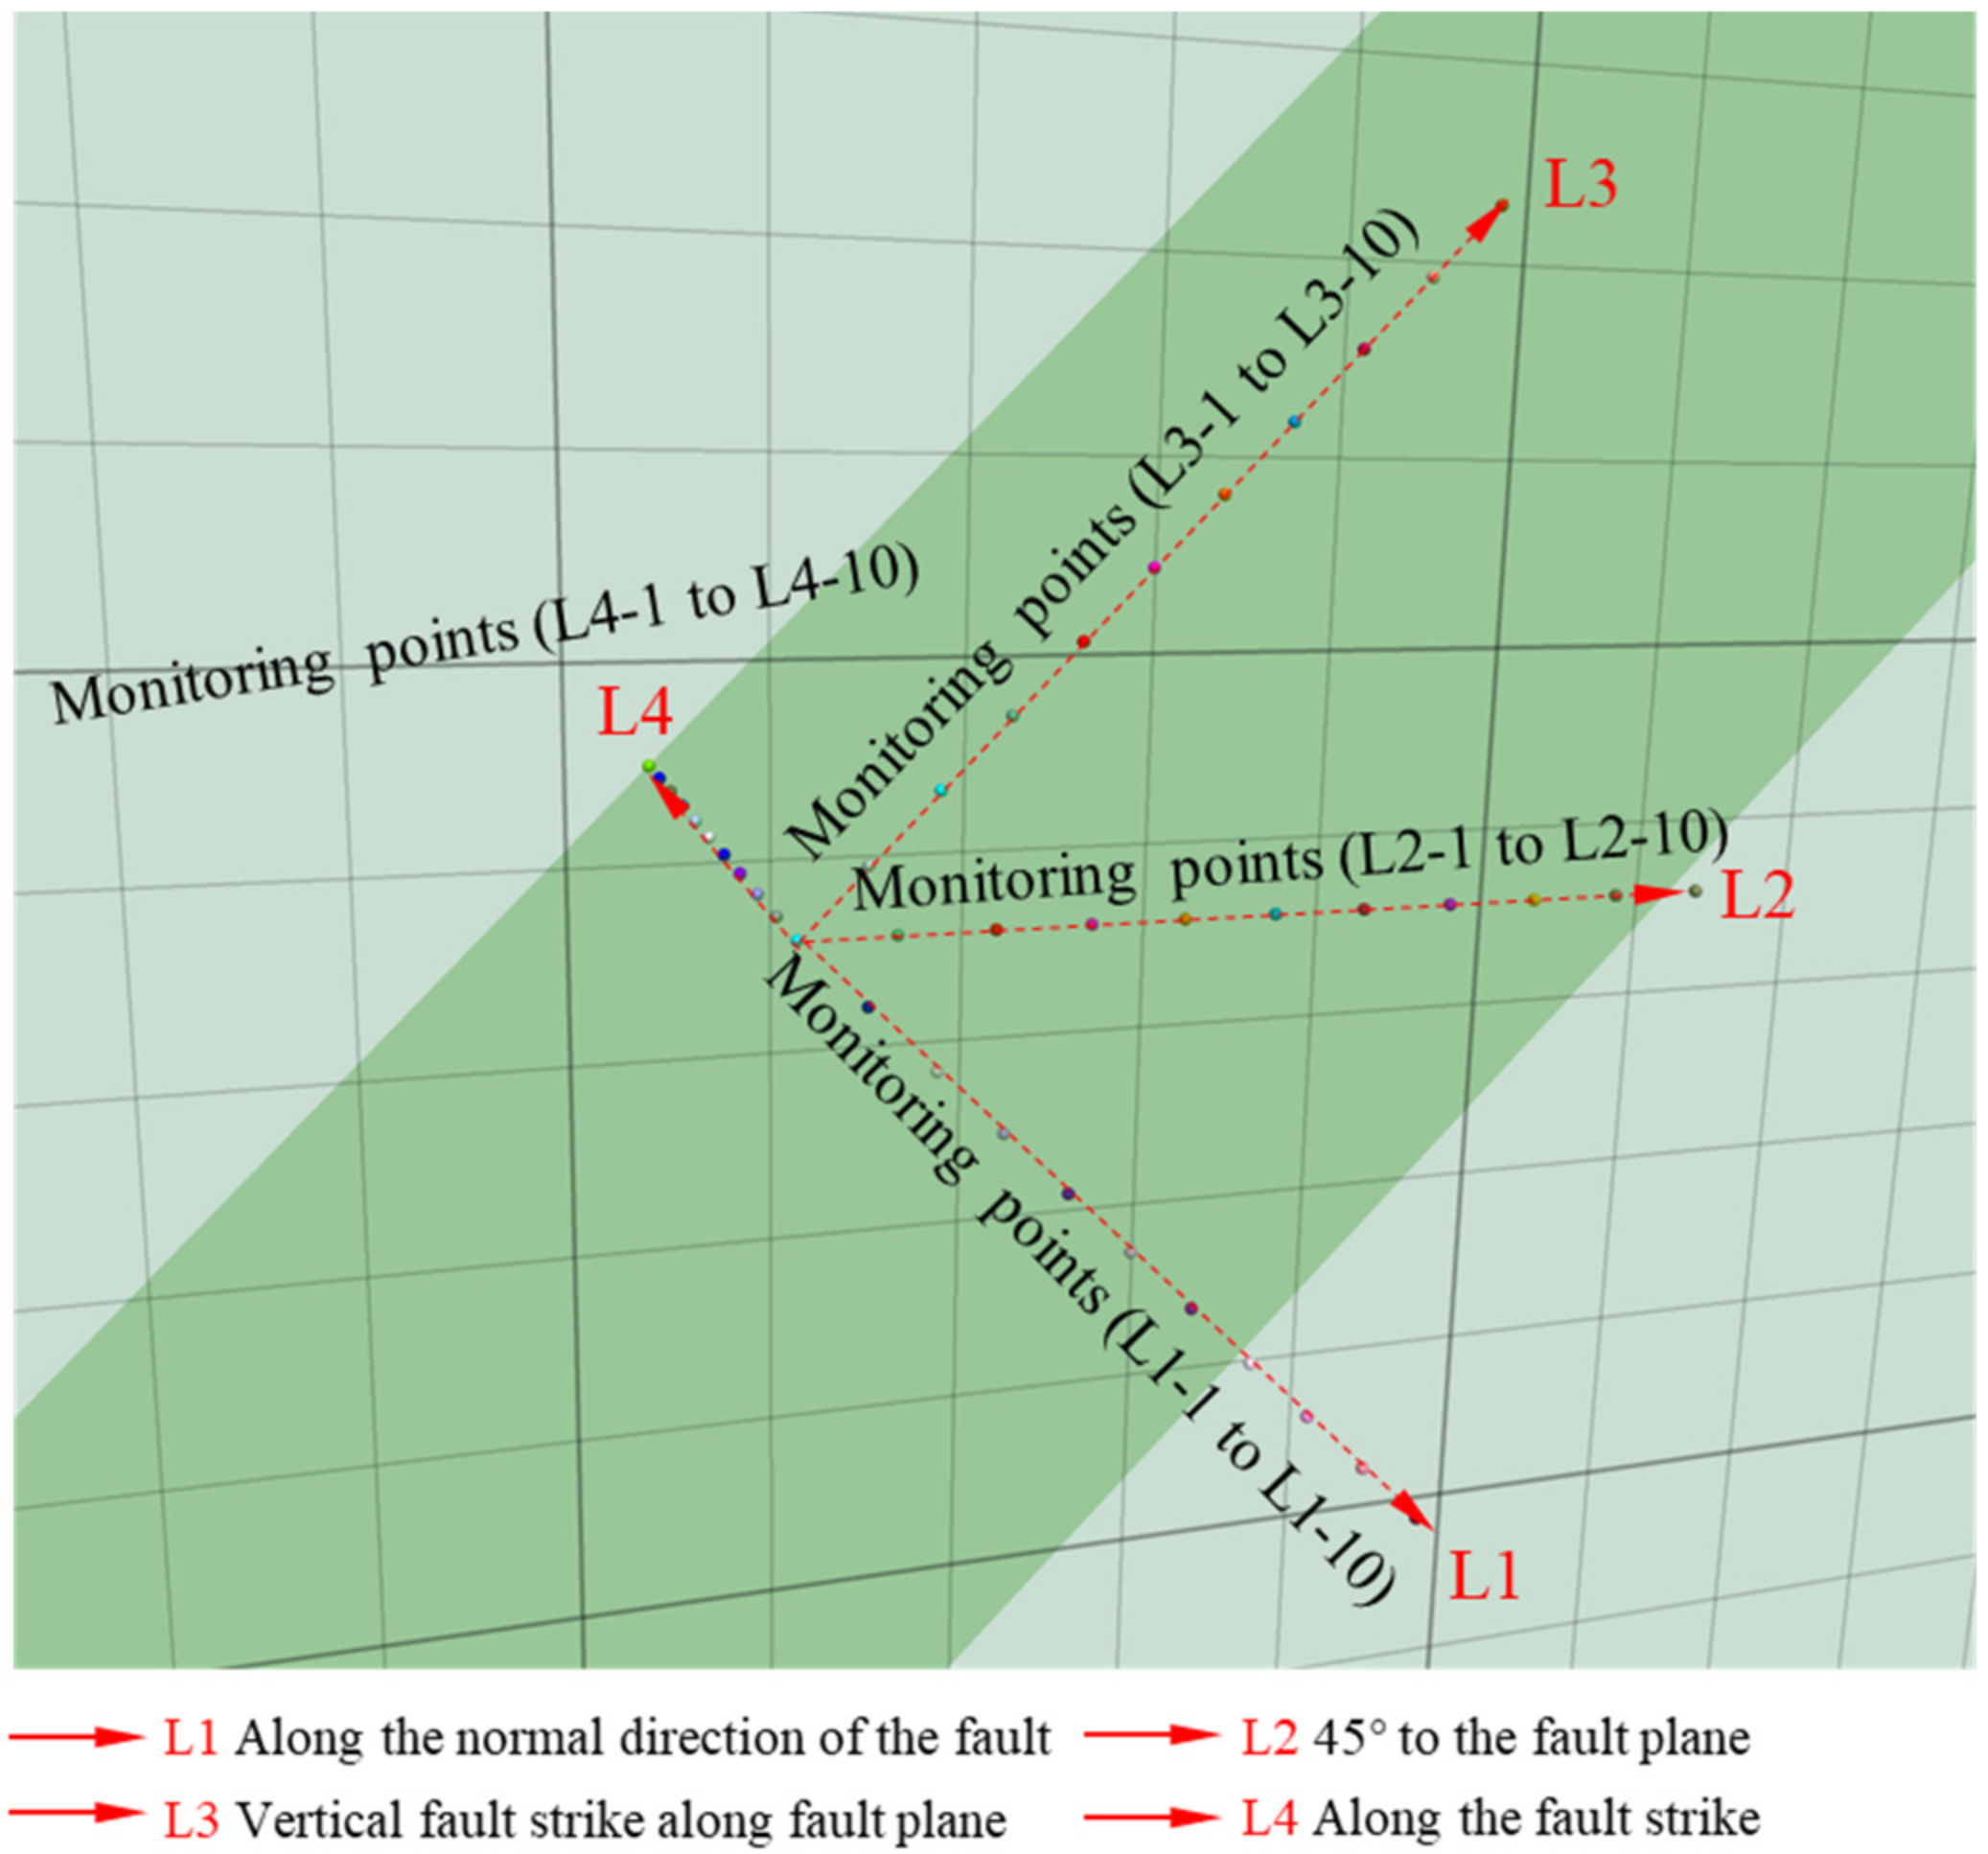
3.3. Establishment of the Seismic Source Model

Lei et al. [25] used the method of reducing the shear strength of the fault to 0 at the beginning of the UDEC dynamic calculation process to simulate the process of fault slip. However, the calculation results of the main frequency of the monitoring points in the literature [35] differ from the actual engineering. Related information in the literature shows that the central frequency of microseismic monitoring points is between 50 and 200 Hz. Therefore, reducing the shear strength to 0 during dynamic calculation is debatable. The slip process is simulated by applying velocity loads on the fault plane.
The bulk modulus K and shear modulus G are determined according to Equation (10):
K = E 3 ( 1 2 v ) G = E 2 ( 1 + v )
Seismic source parameters can be obtained according to Equations (3), (8) and (10). Once the seismic moment is determined, the fault radius, fault area, and slippage displacement are all related to the corner frequency f0. In this paper, the corner frequencies of 80 Hz, 100 Hz, and 120 Hz are used to determine the rupture area, respectively, as shown in Table 2. According to the previous simulation results [28], the modified Yoffe function selects τs = 0.1 ms and τR = 0.8 ms; the slippage velocities are shown in Figure 6a, and the corresponding displacements are shown in Figure 6b.
To analyze the influence of the rupture speed of the fault on the dynamic response of the rock mass, 0.6×, 0.8×, 1.0×, and 1.2× shear-wave velocities are used to simulate the fault rupture process [36]. In 3DEC, fish function and table command are used to simulate the rupture of the fault and the subsequent slippage process.
Figure 7 shows the circular and rectangular fault models’ equivalent slip area, where the two faults correspond to the radius of 8.75 m in Table 2. The models with a radius of 7.0 m and 5.83 m are similar to those in Figure 6.

4. Results and Discussions

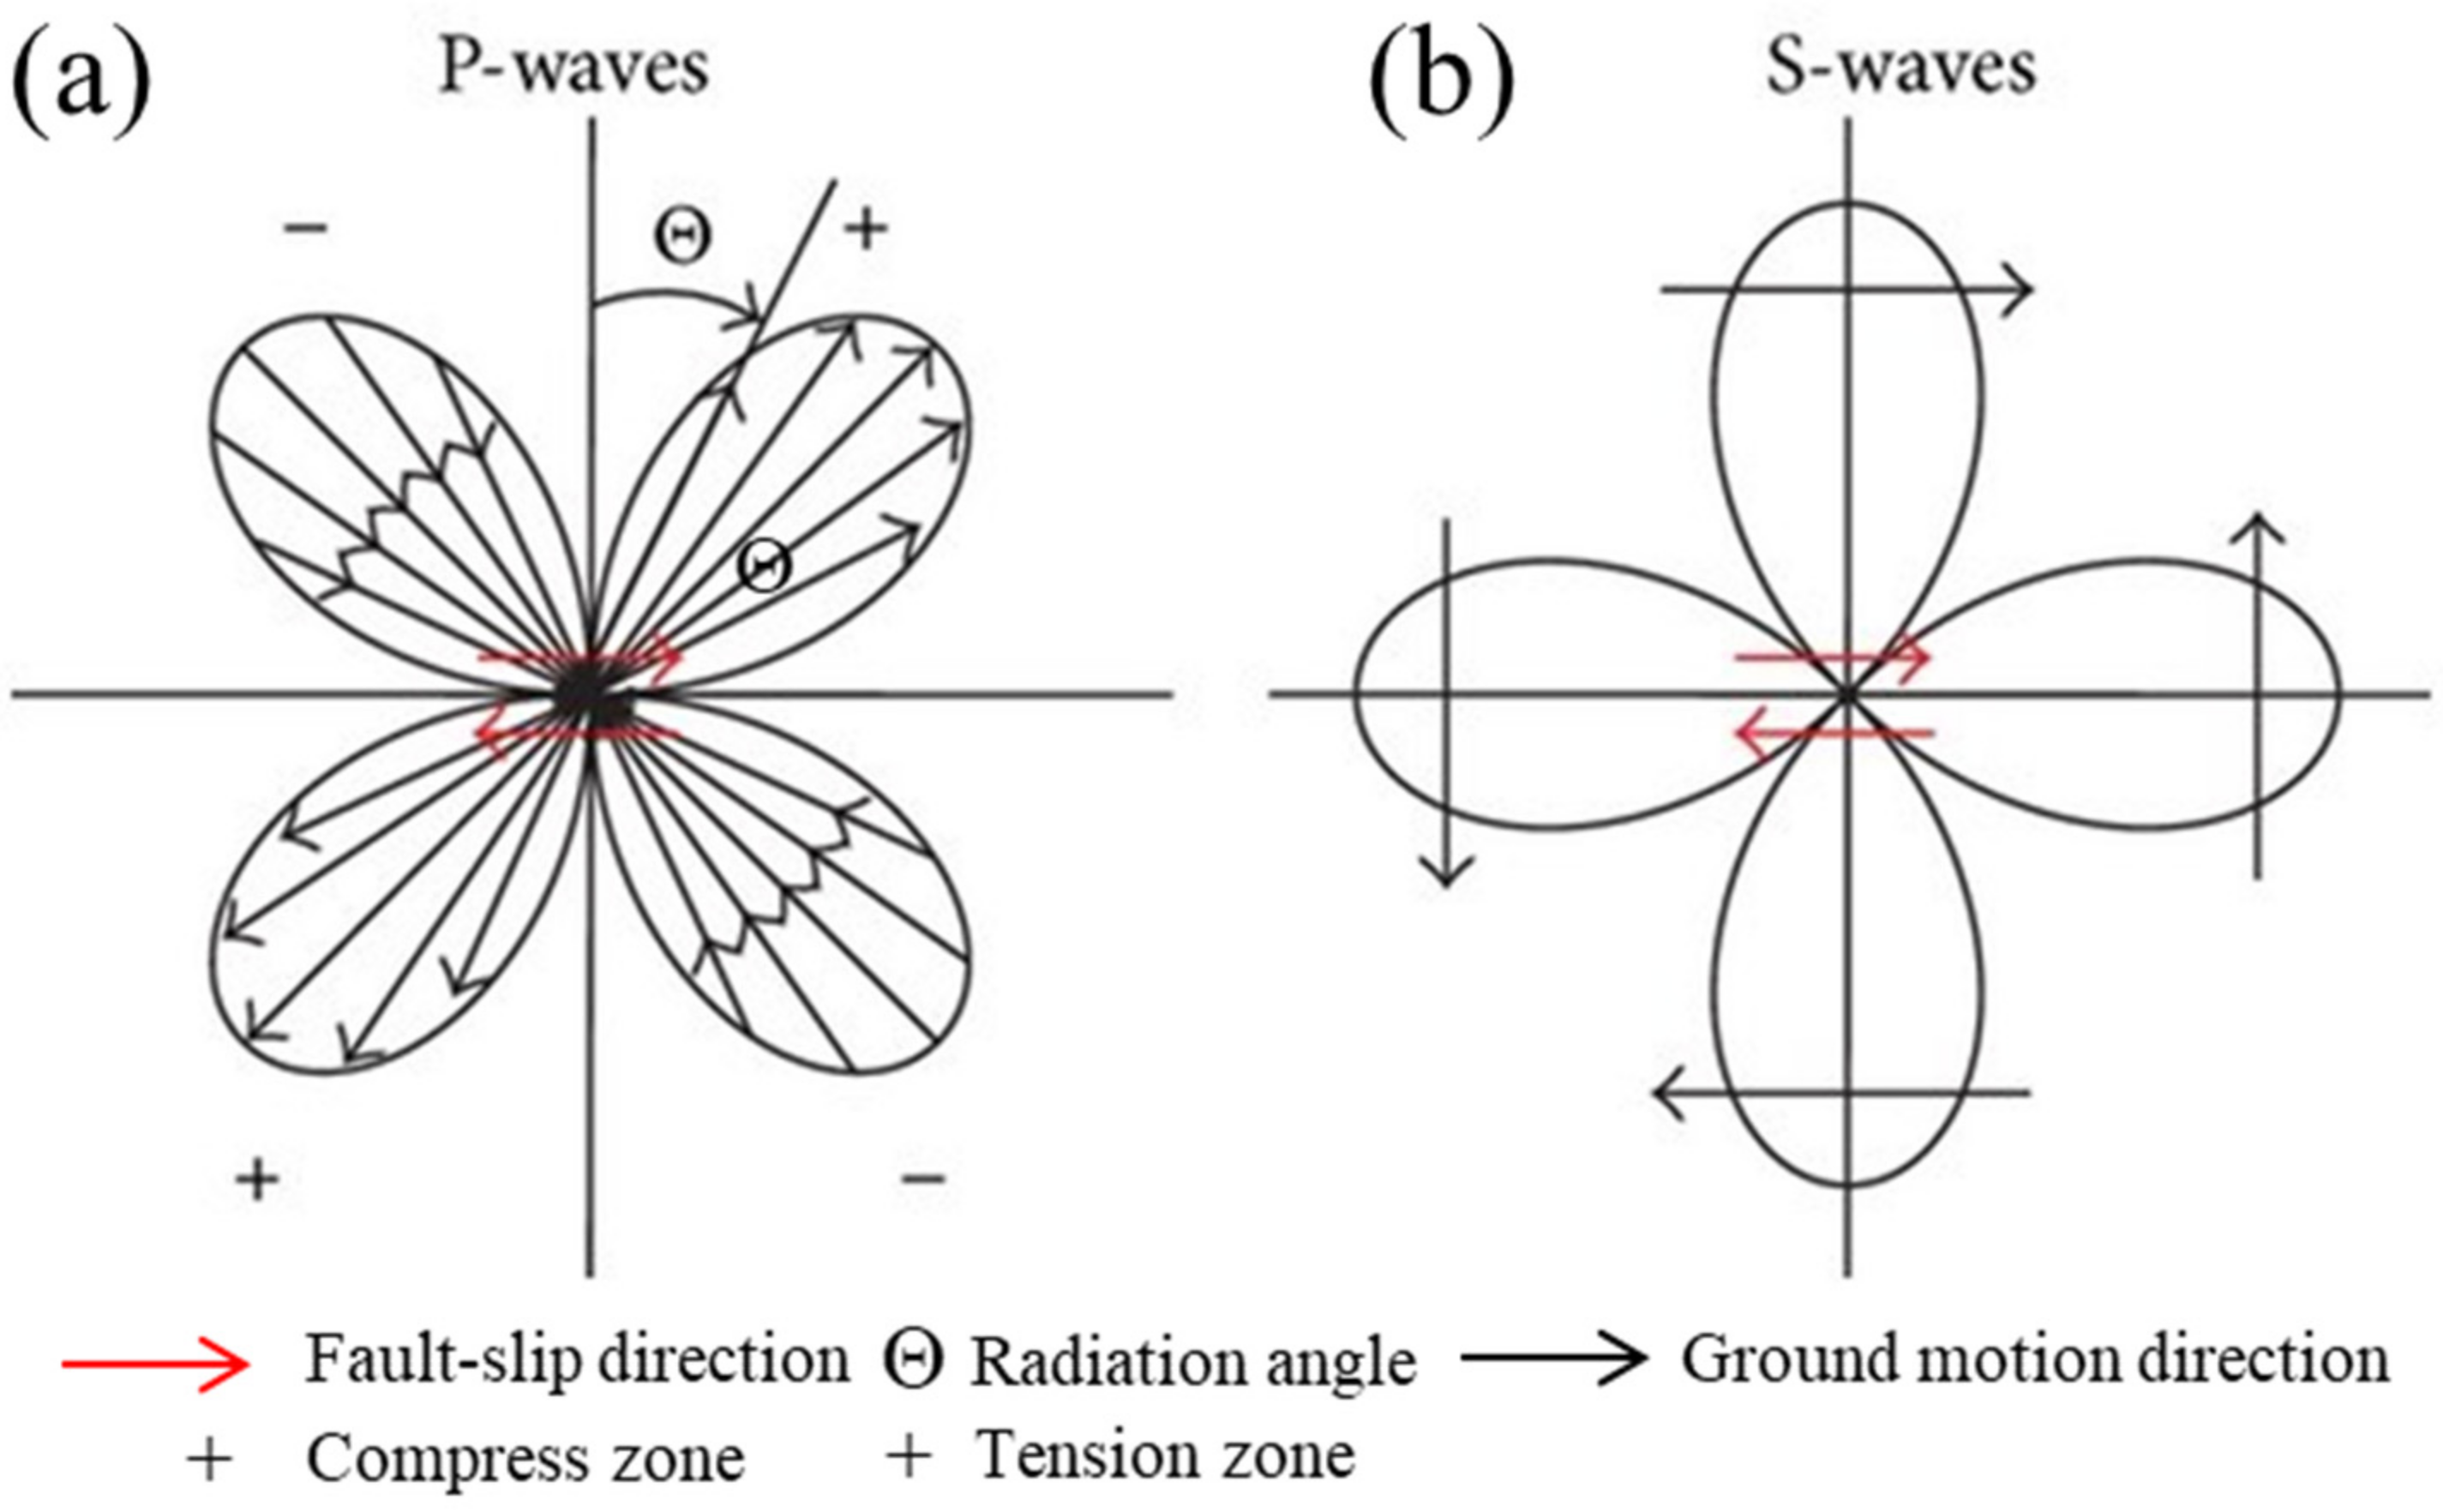
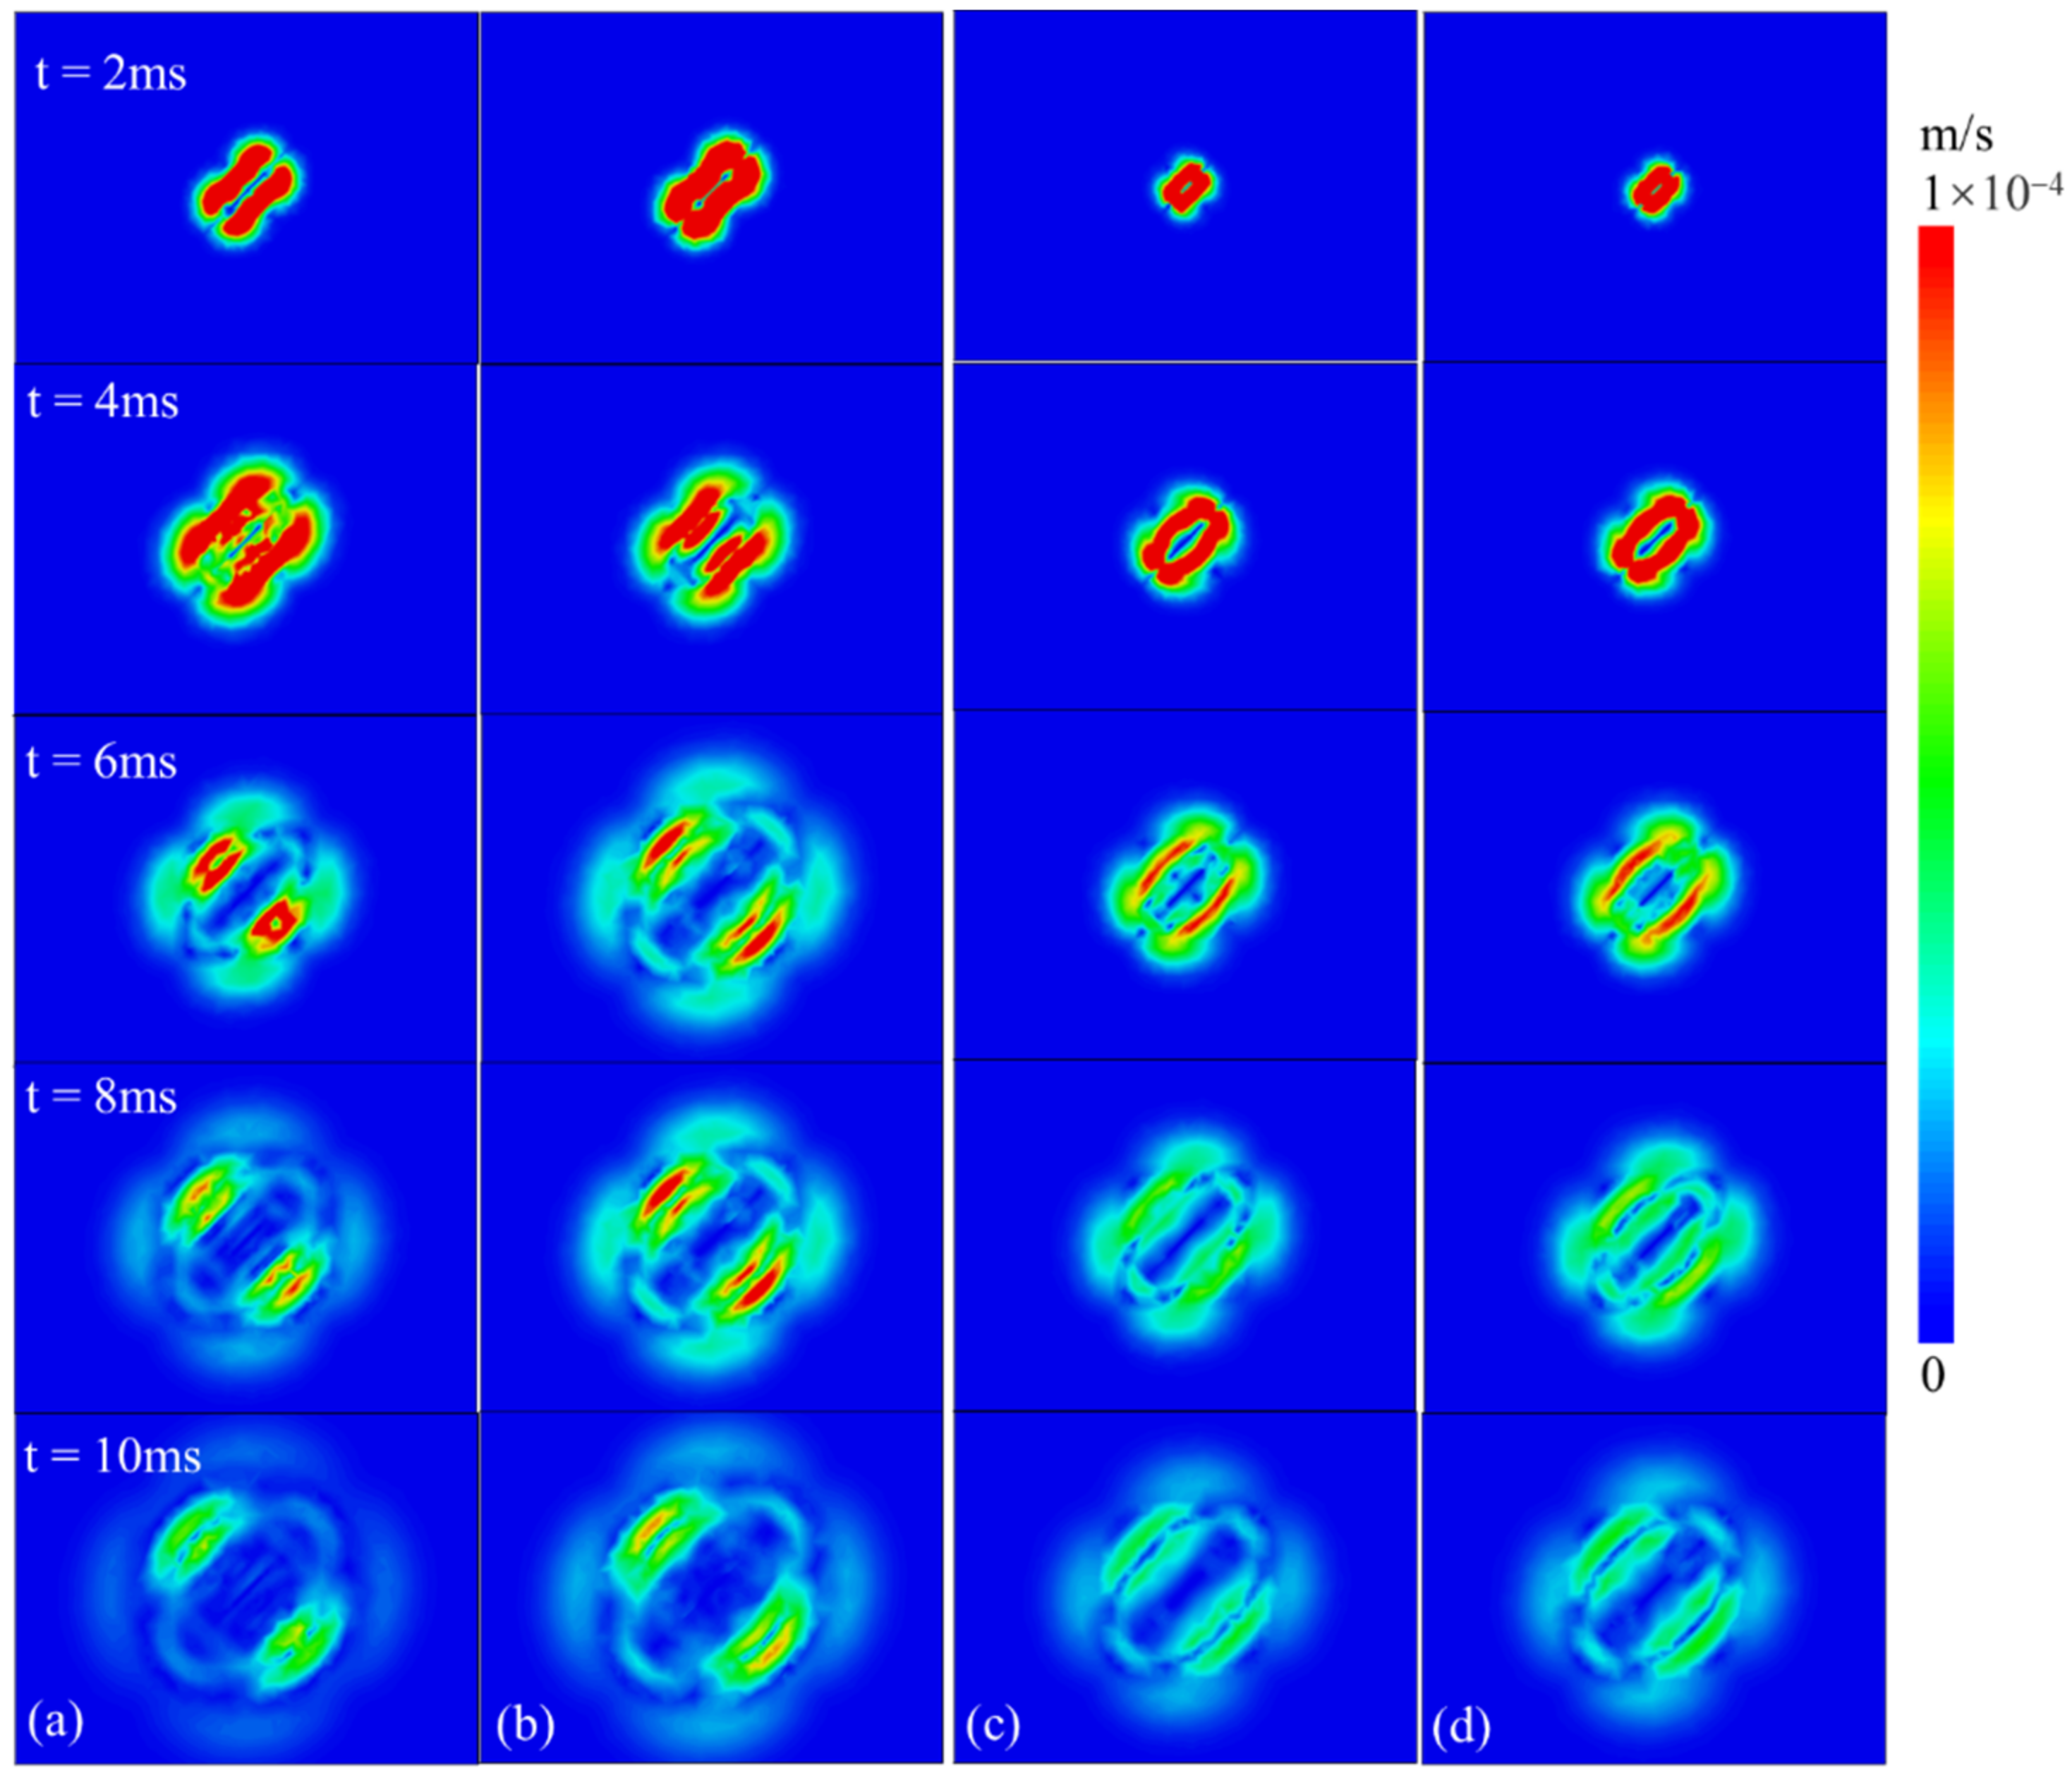
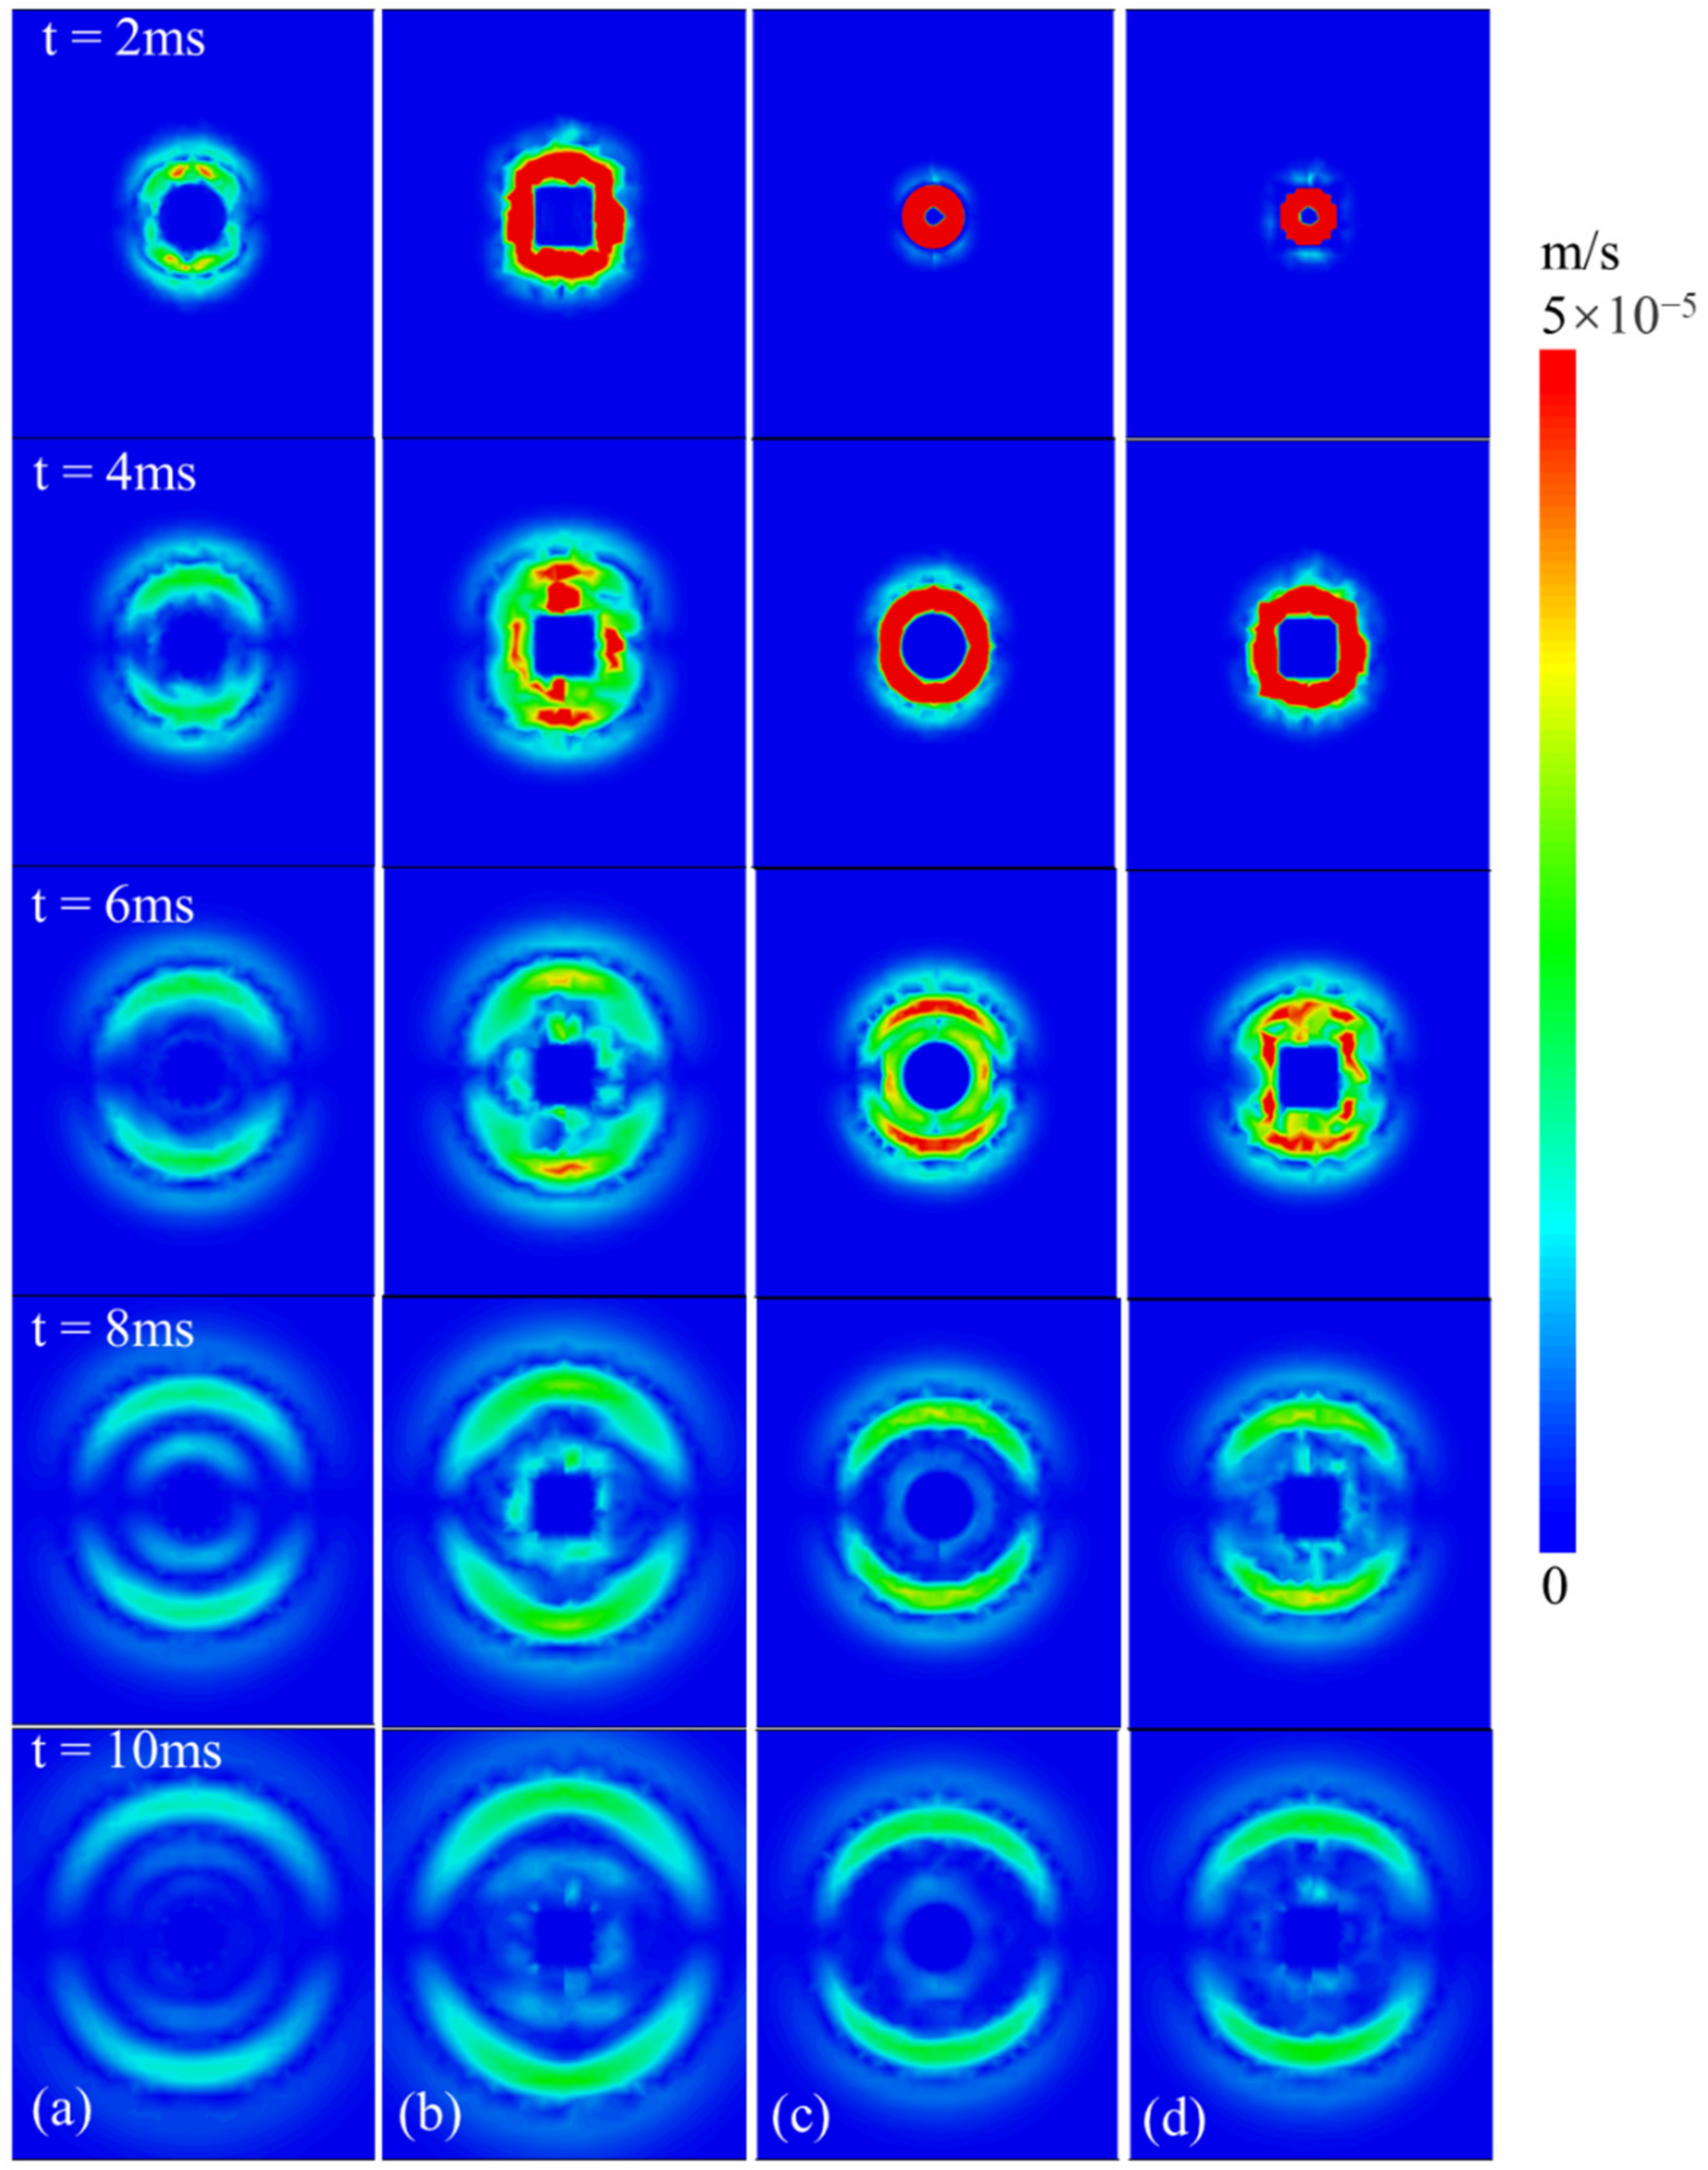
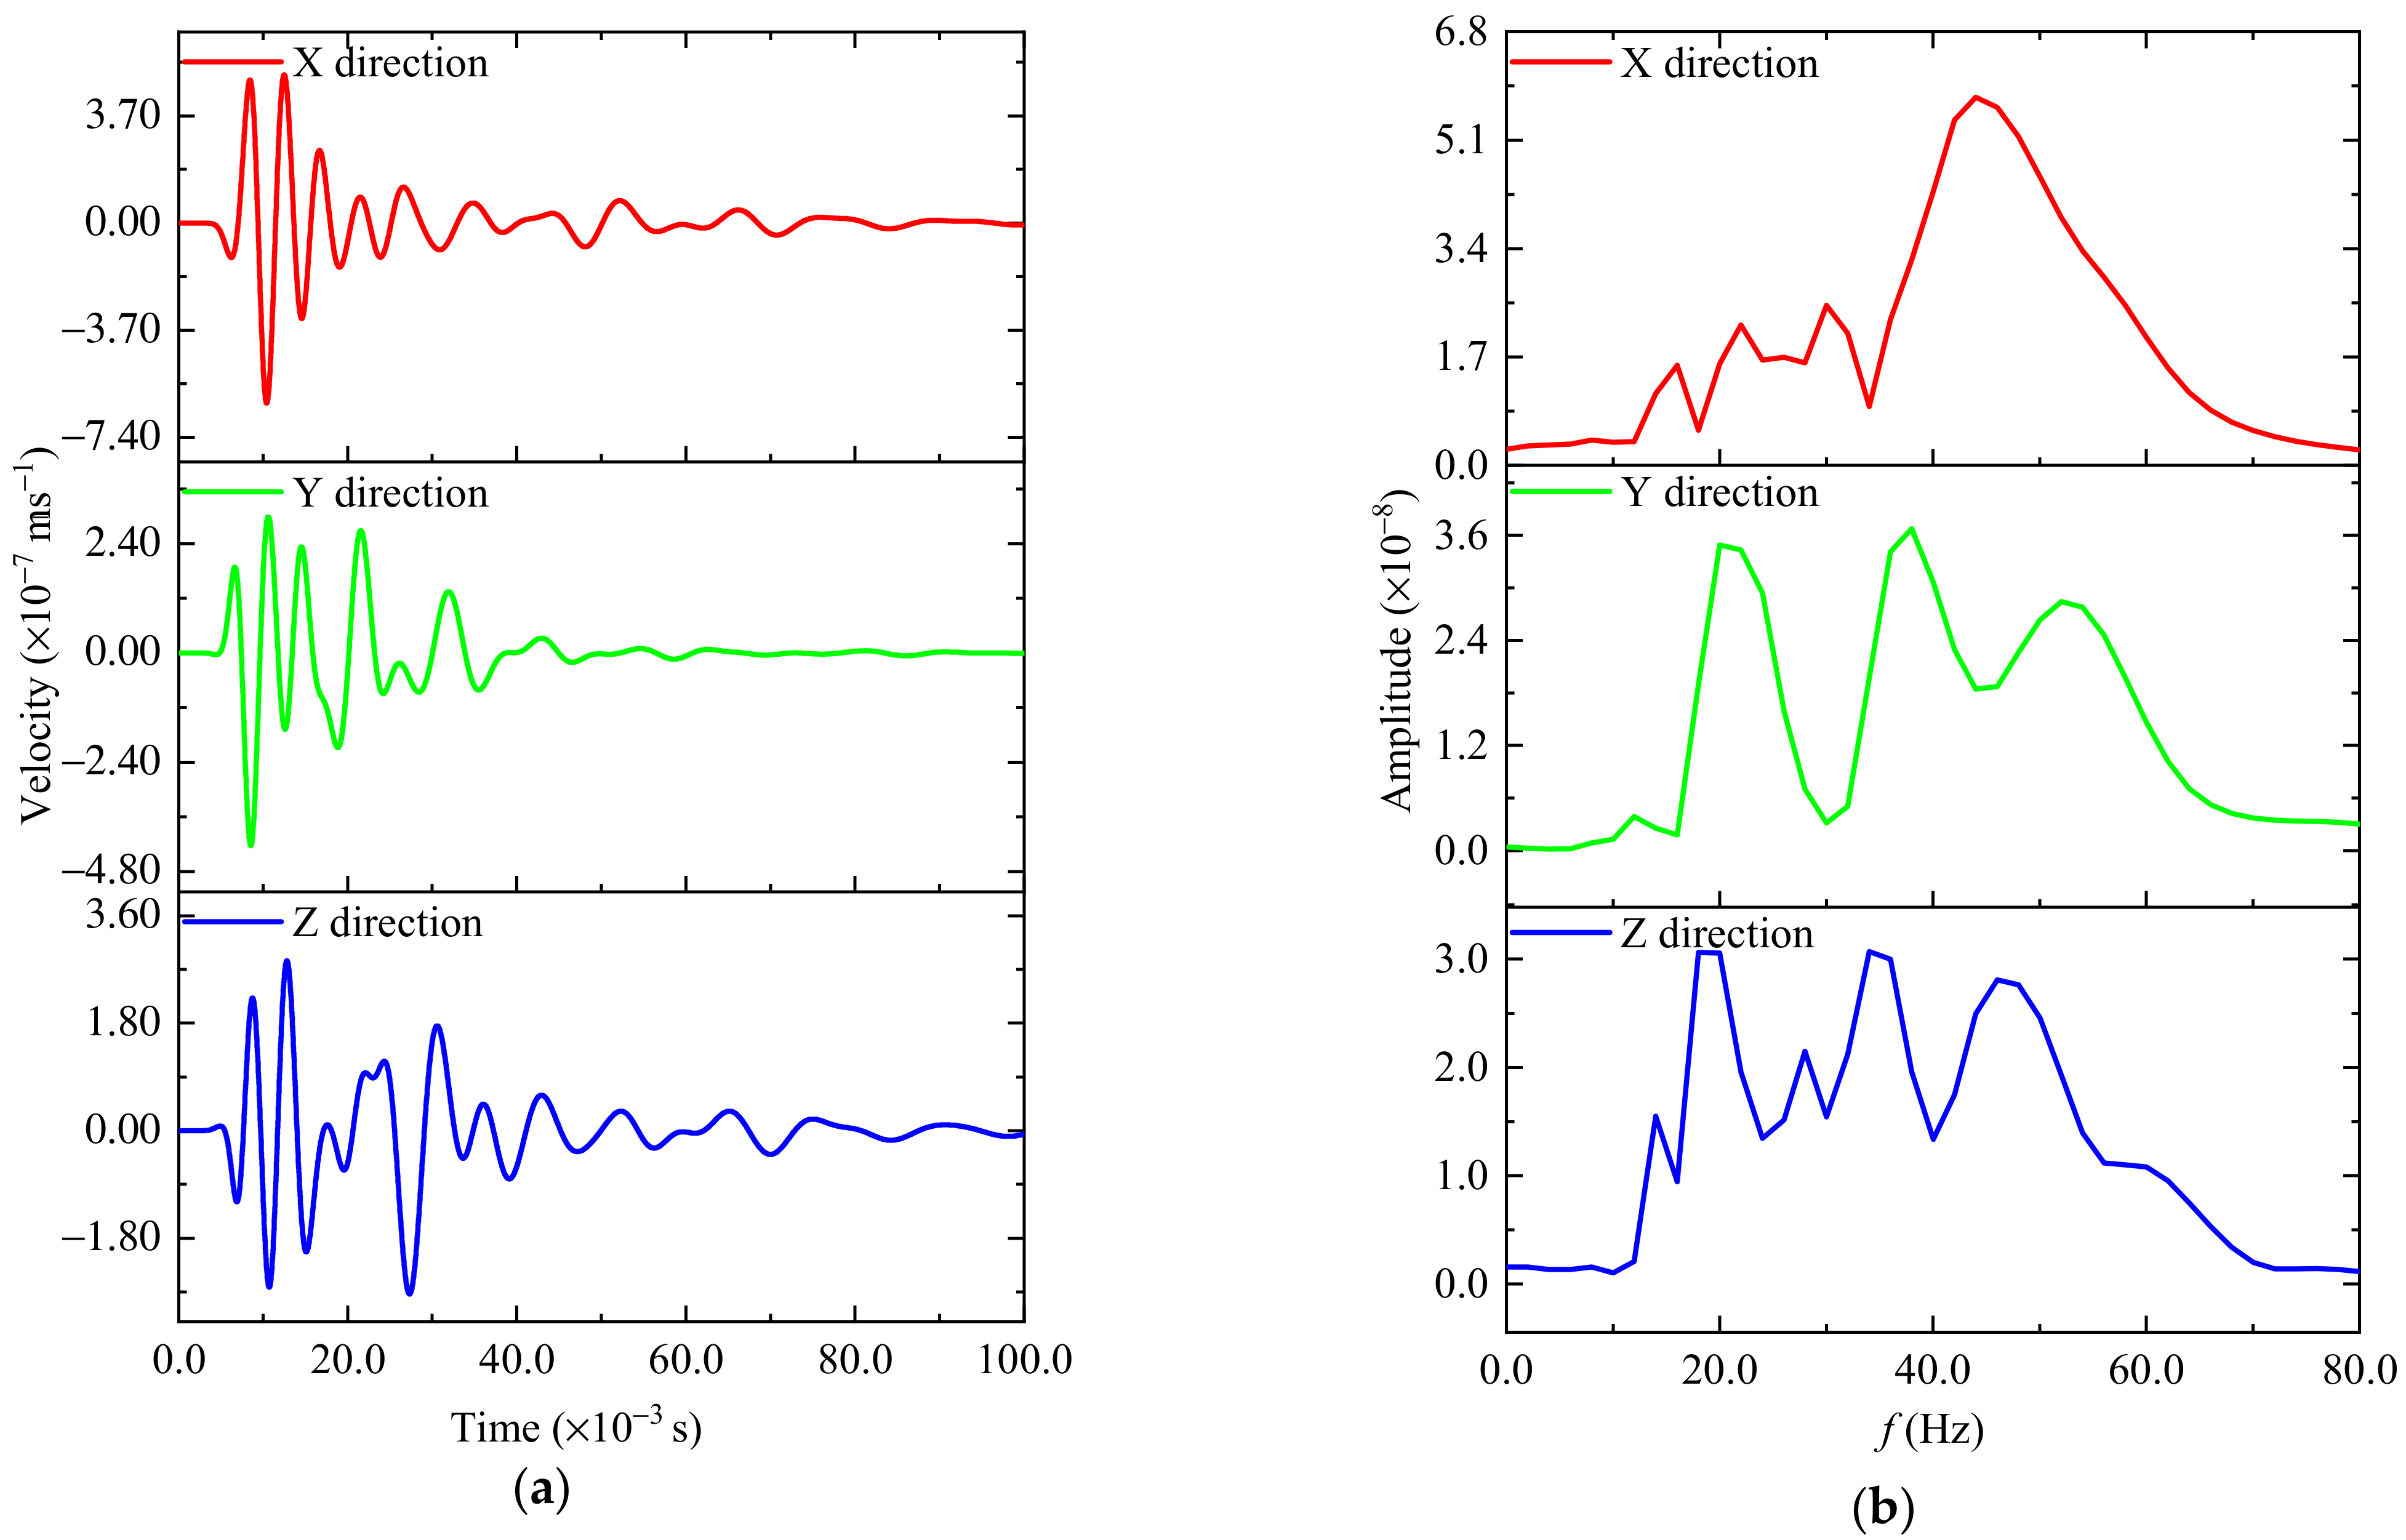
4.1. Stress Wave Radiation Patterns

Due to the double-couple effect during fault slipping, the stress wave radiates outward from the epicenter center with spatial differences. The typical stress wave radiation patterns shown in Figure 8 are the patterns of the stress wave radiation during the slip process of the double-couple fault. An inverse fault slip with an inclination angle of 45° is simulated, and four monitoring lines are arranged around the fault, as Figure 9 shows.
Four seismic source models are studied in this paper; we simplify the circular, rectangular, and circular and rectangular hypocenters considering the rupturing effect as Cir, Rec, Cir(CR), and Rec(CR) seismic sources, respectively, with the simulated cases listed in Table 3. On the vertical fault section and along the fault plane, the radiation patterns generated by different sources are explained by taking the equivalent fault radius of 8.75 m as an example. Figure 10 shows the stress wave radiation pattern on the vertical fault section. In the early propagation stage, the shape of the stress waves generated by different sources is similar to a two-lobed symmetrical “peanut shell”. Supposing the seismic source considers the rupturing effect, the propagation velocity of stress waves without the rupturing impact is faster than that with the rupturing impact. In addition, the S-wave radiation area of the circular source is more widely distributed than that of the rectangular source at approximately 4 ms (red zone in the velocity contour) under the same fault radius. After 6 ms, the radiation area of the rectangular seismic source is more extensive, and the influence range of the radiation intensity level is more extensive than that of the circular seismic source, which is the difference between the two in the vertical fault section. Comparing the two seismic sources, Cir(CR) and Rec(CR), the stress wave radiation patterns of the two on the vertical fault section are relatively close, and the radiation intensity and range of the two are not significantly different in different periods. At approximately 10 ms, the boundary of the P-wave and S-wave radiation area is more pronounced, and in the radiation area of the S-wave, the stress waves caused by the four sources will form relatively obvious Mach waves.
On the fault plane, comparing the two sources without considering the rupturing effect, the stress wave propagation of the rectangular source is faster than that of the Cir seismic source, as Figure 11 shows. At the beginning of the radiation, the radial radiation intensity of the stress wave is significantly higher than that of the Cir seismic source. In the stress wave outward radiation process, the continuity and uniformity of the circular source are better than those of the rectangular source. As time goes on, the stress wave radiated outward by the circular source easily forms a Mach wave, while the rectangular source produces radiation disorder around the source. However, away from the source, the radiation of the stress waves tends to be stable. We also find that the radiation intensity and range of stress waves in the rectangular source are more prominent than in the Cir seismic source. In the initial stage of stress wave propagation, the intensity of the stress wave caused by the rectangular source is higher than that of the Cir seismic source. Later, the stress wave in the fault-slip direction plays a dominant role in radiation. When the rupturing effect of the source is considered, the stress wave radiates around the source at the beginning, gradually radiating along the slip direction. When we focus on the Cir seismic source along the fault plane, the stress wave around the source is more uniform and continuous. However, for the rectangular source, stress wave radiation disorder appears easily around the source, with the stress wave confusion gradually weakening and disappearing far away from the source. It can be inferred that the rectangular source superficially generates wave propagation distortion around the source, and the circular source easily forms apparent Mach waves along the fault plane.

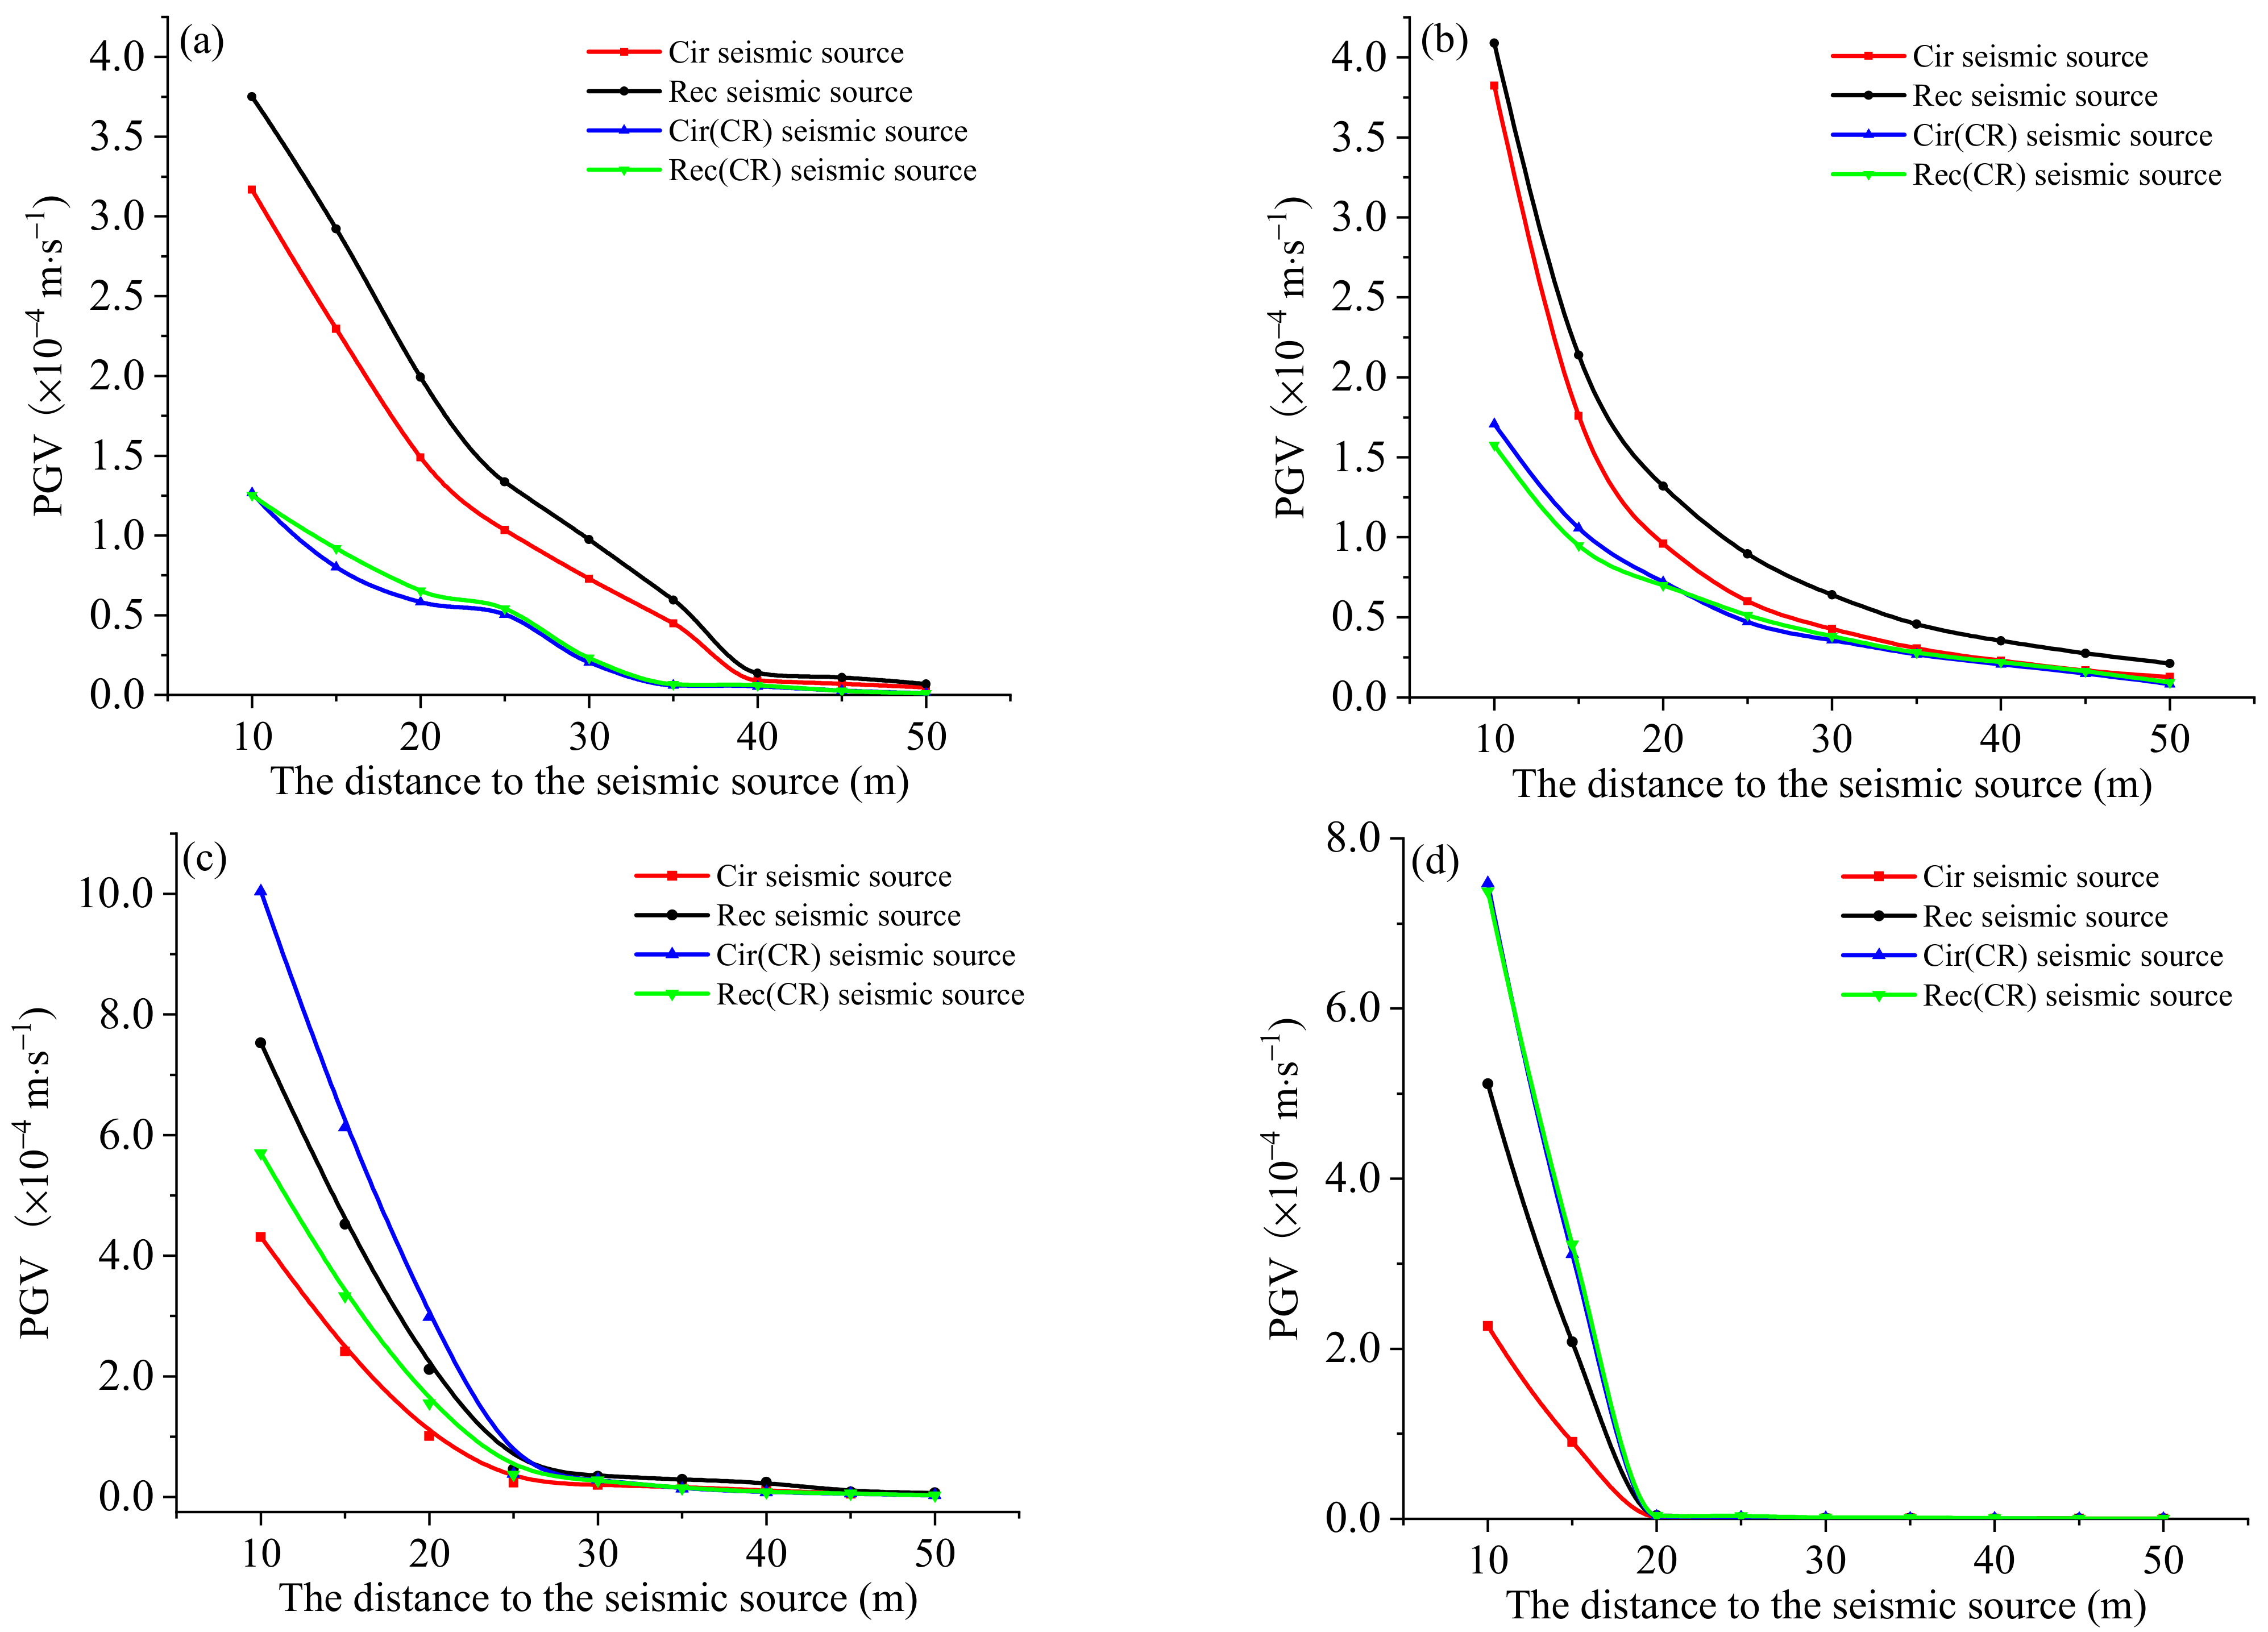
4.2. Peak Ground Motion Velocity (PGV)

4.2.1. The Effect of Source Type on PGV

Peak ground motion velocity (PGV) is a vital indicator of rock mass stability. It can be seen from Figure 12 that there are significant differences in the PGV variation rules at different distances from the seismic source center under other types of sources. On the L1 and L2 lines, within approximately five times the radius (40 m), the source model, without considering the rupturing effect, generates a higher PGV than the two sources considering the rupturing effect. The PGV caused by the rectangular source is highest on the L1 and L2 lines. The PGV generated by the Cir seismic source and the Rec(CR) seismic source are consistent at a certain distance from the seismic source. In the direction of L3 and L4, in the range of three times the radius, the order of the PGV values is as follows: Cir(CR) seismic source, Rec(CR) seismic source, Rec seismic source, and Cir seismic source. When the source distance is more than three times the radius, the PGV induced by the four sources tends to be the same.
According to the typical fault-slip radiation pattern, the PGV of line L1 in the S-wave radiation area is generally higher than that of line L2 in the P-wave radiation area. However, in Figure 12a,b, the PGV in line L1 is lower than that in line L2 at 10 m from the seismic source. The reason for this is that there is a superposition area in the P-wave and S-wave radiation area on the L2 line near the source, resulting in the PGV on the L2 line near the source (10 m) being higher than that on the L1 line in the S-wave radiation area. Meanwhile, with the increased distance, the PGV on the L1 line of the same distance is significantly higher than that on the L2 line. When the rock masses are within 3~4 times (20~30 m) the radius of the source, the PGV of the Cir(CR) and Rec(CR) seismic source is higher than that of the Cir and Rec seismic source, which is mainly caused by the propagation of stress waves at the front of the fault rupture and the superposition of rupture effects.

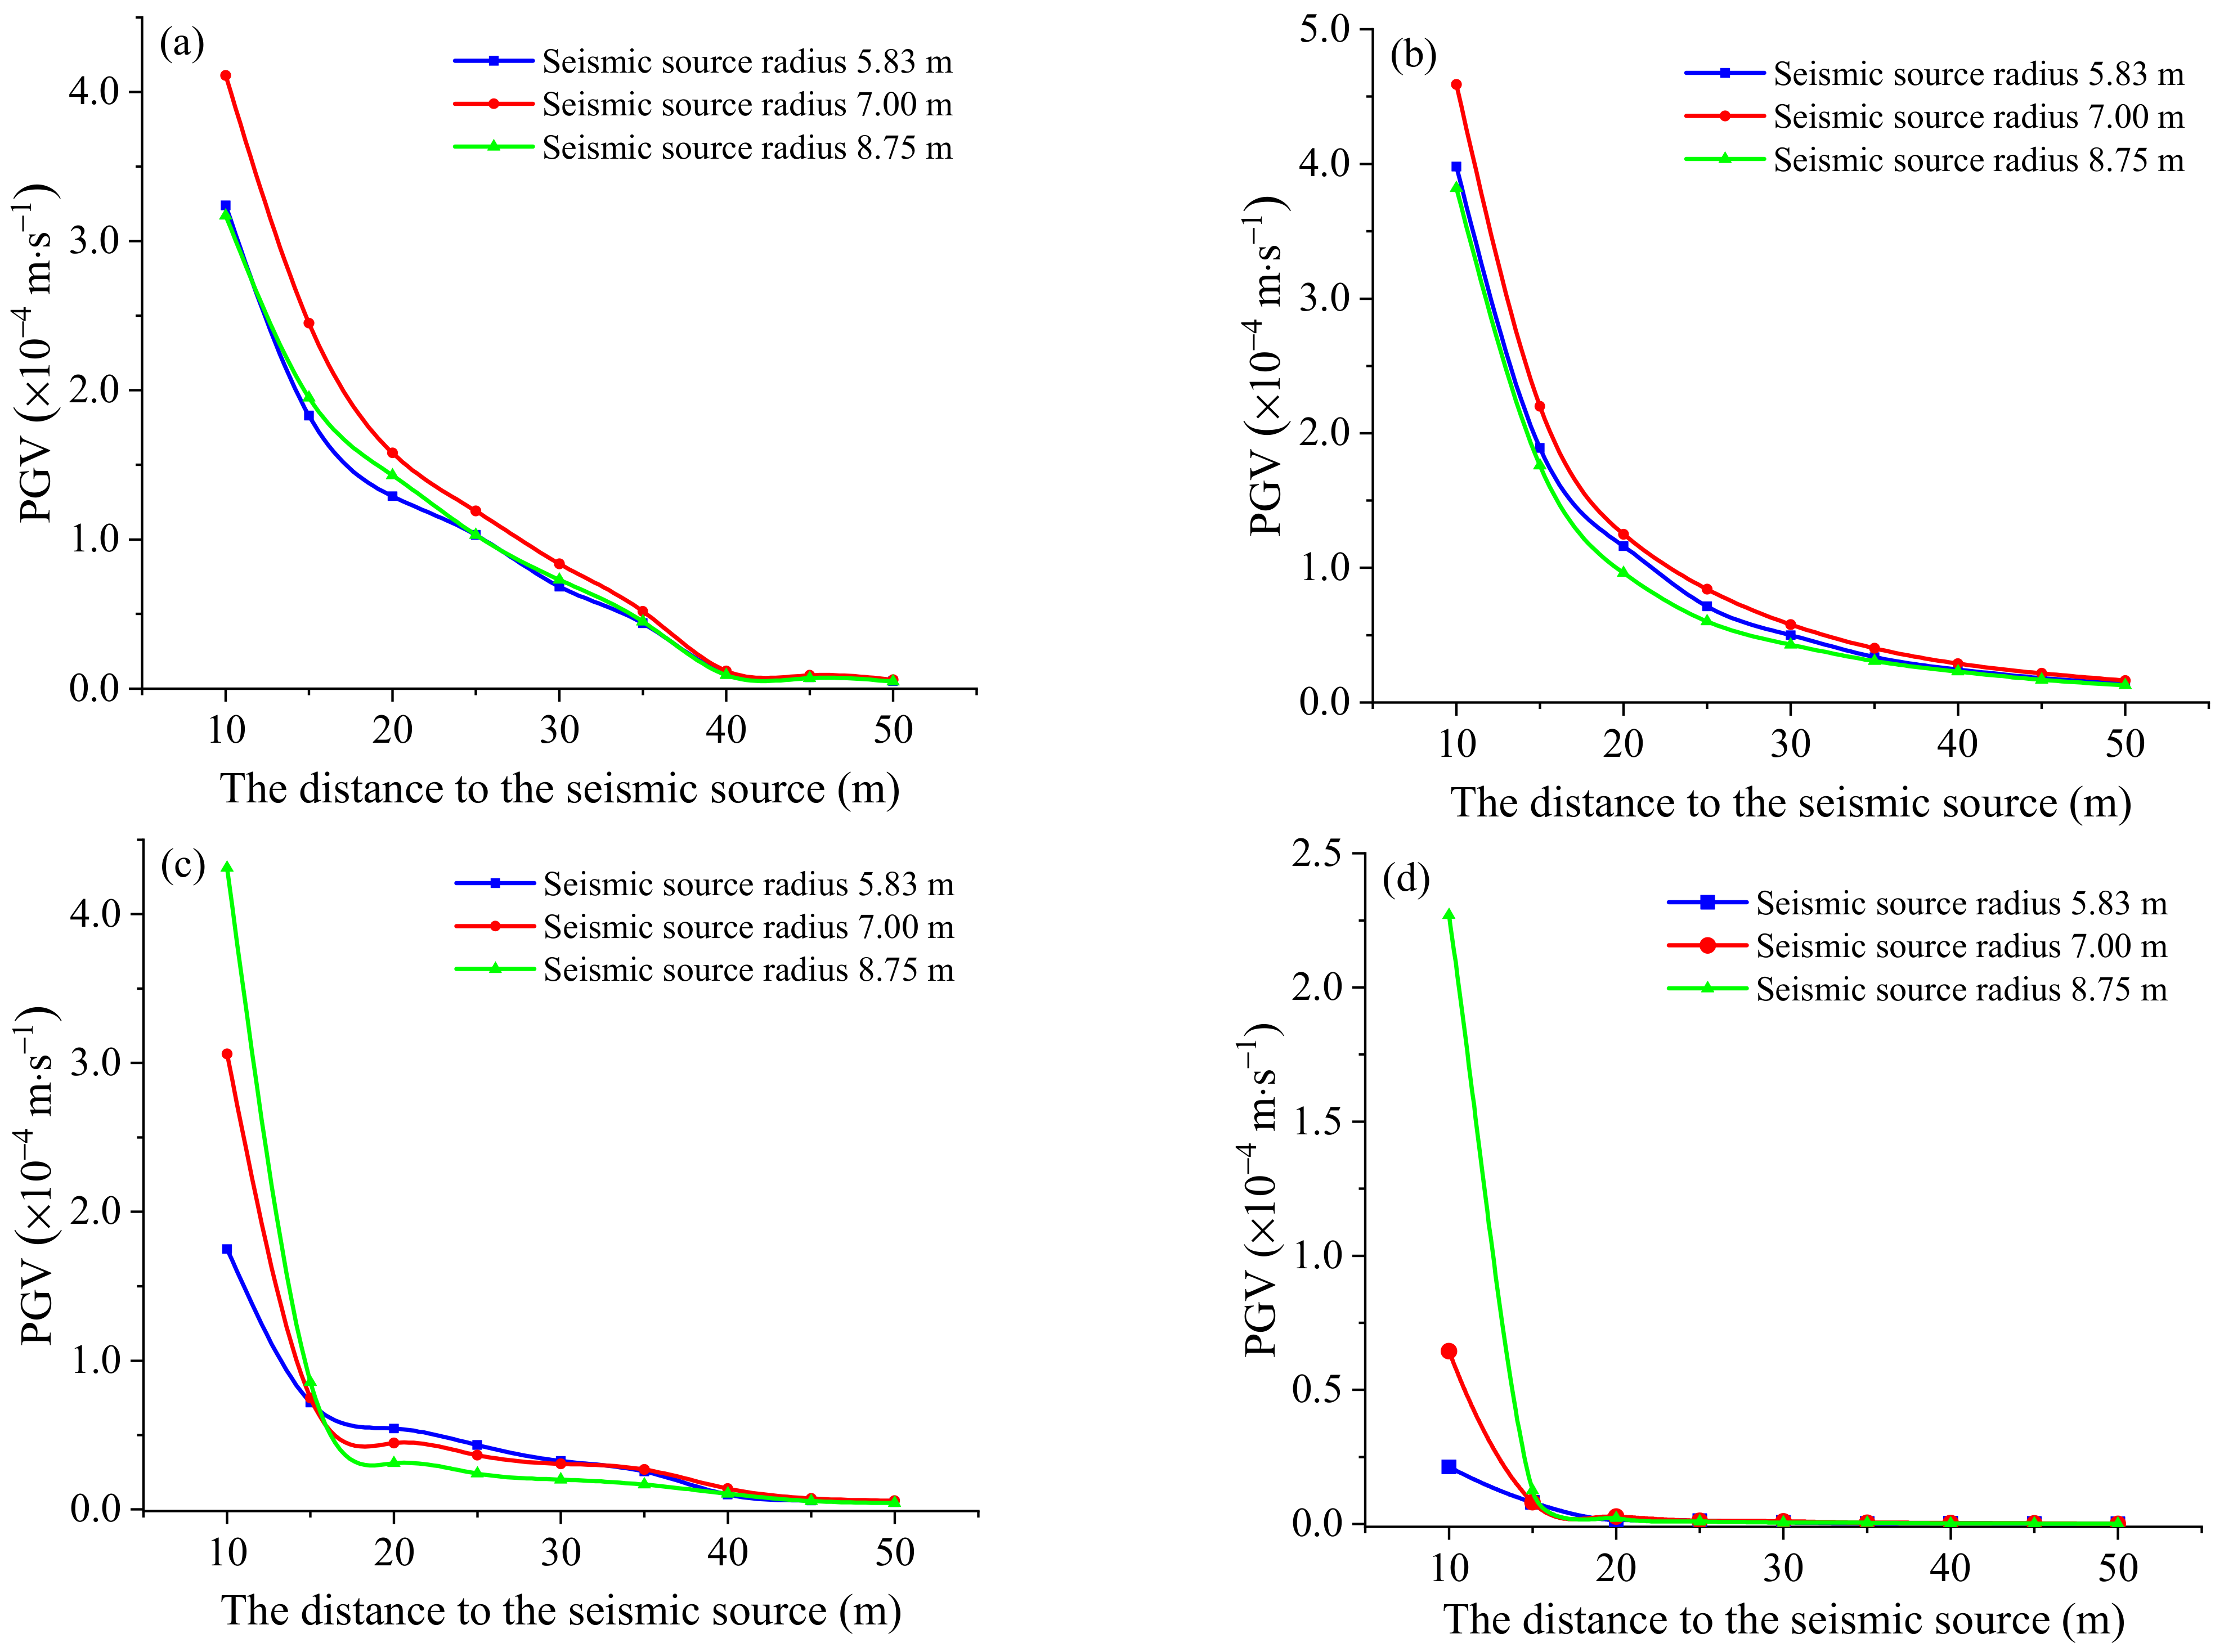
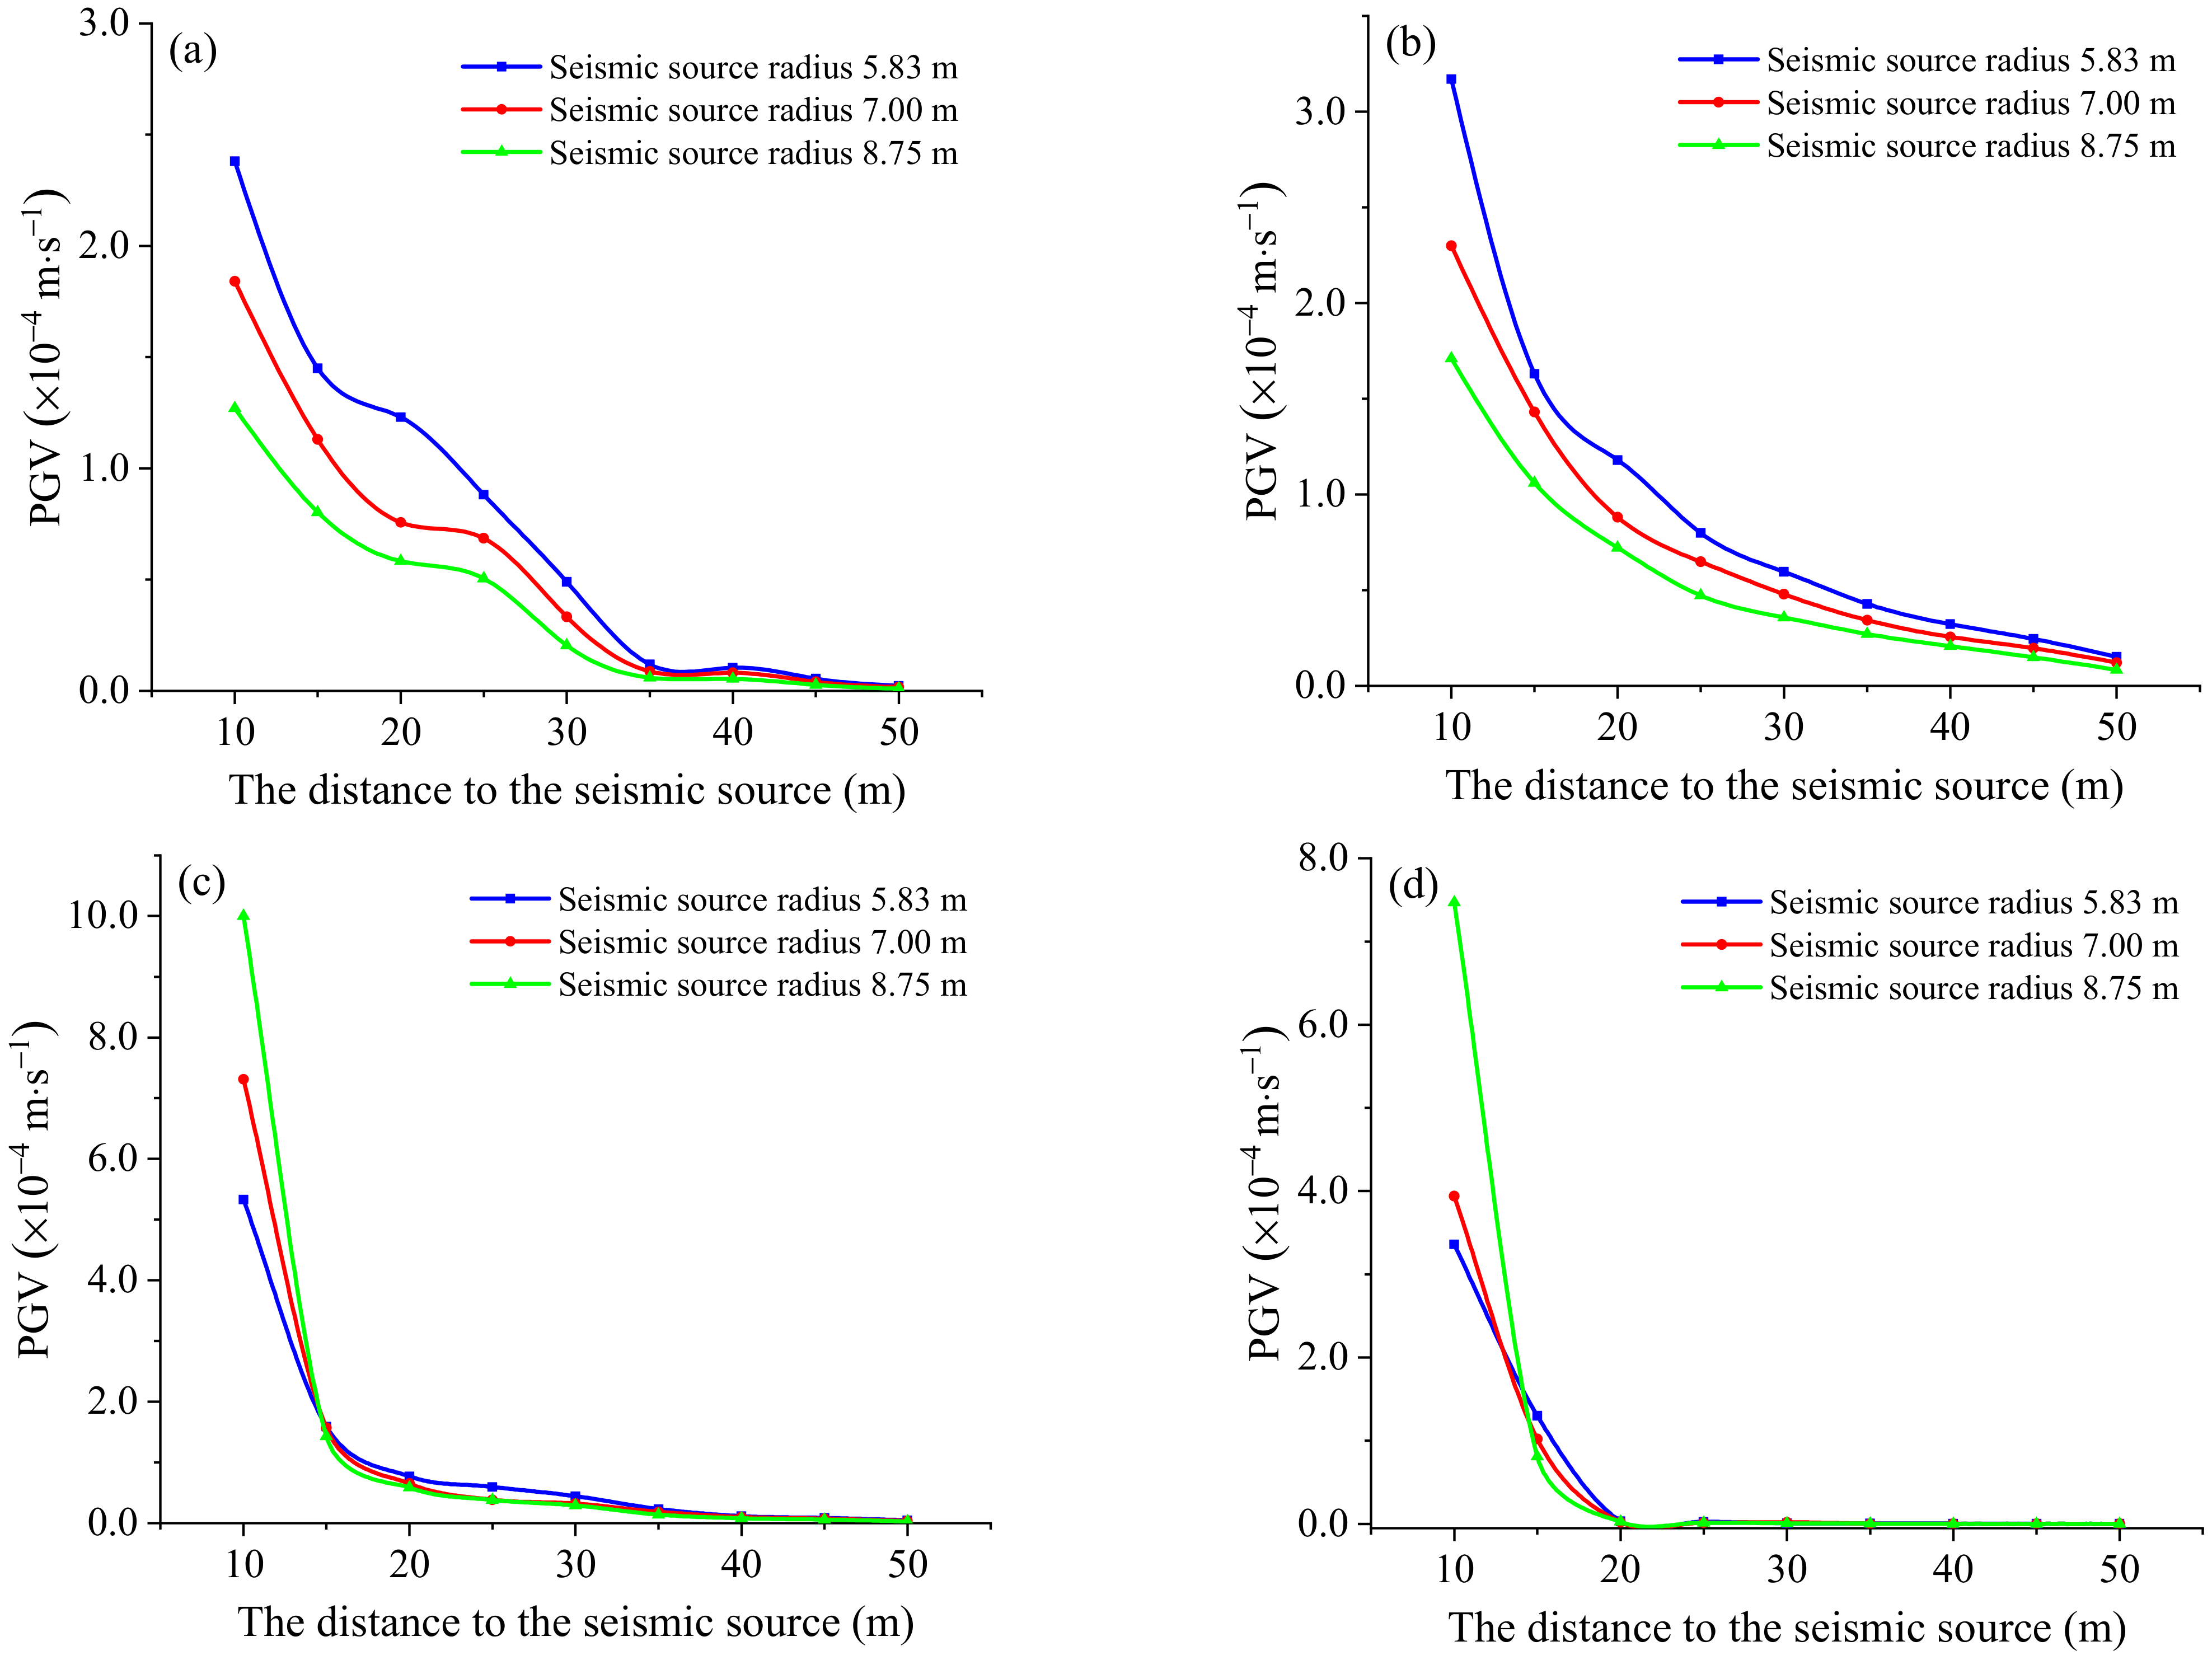
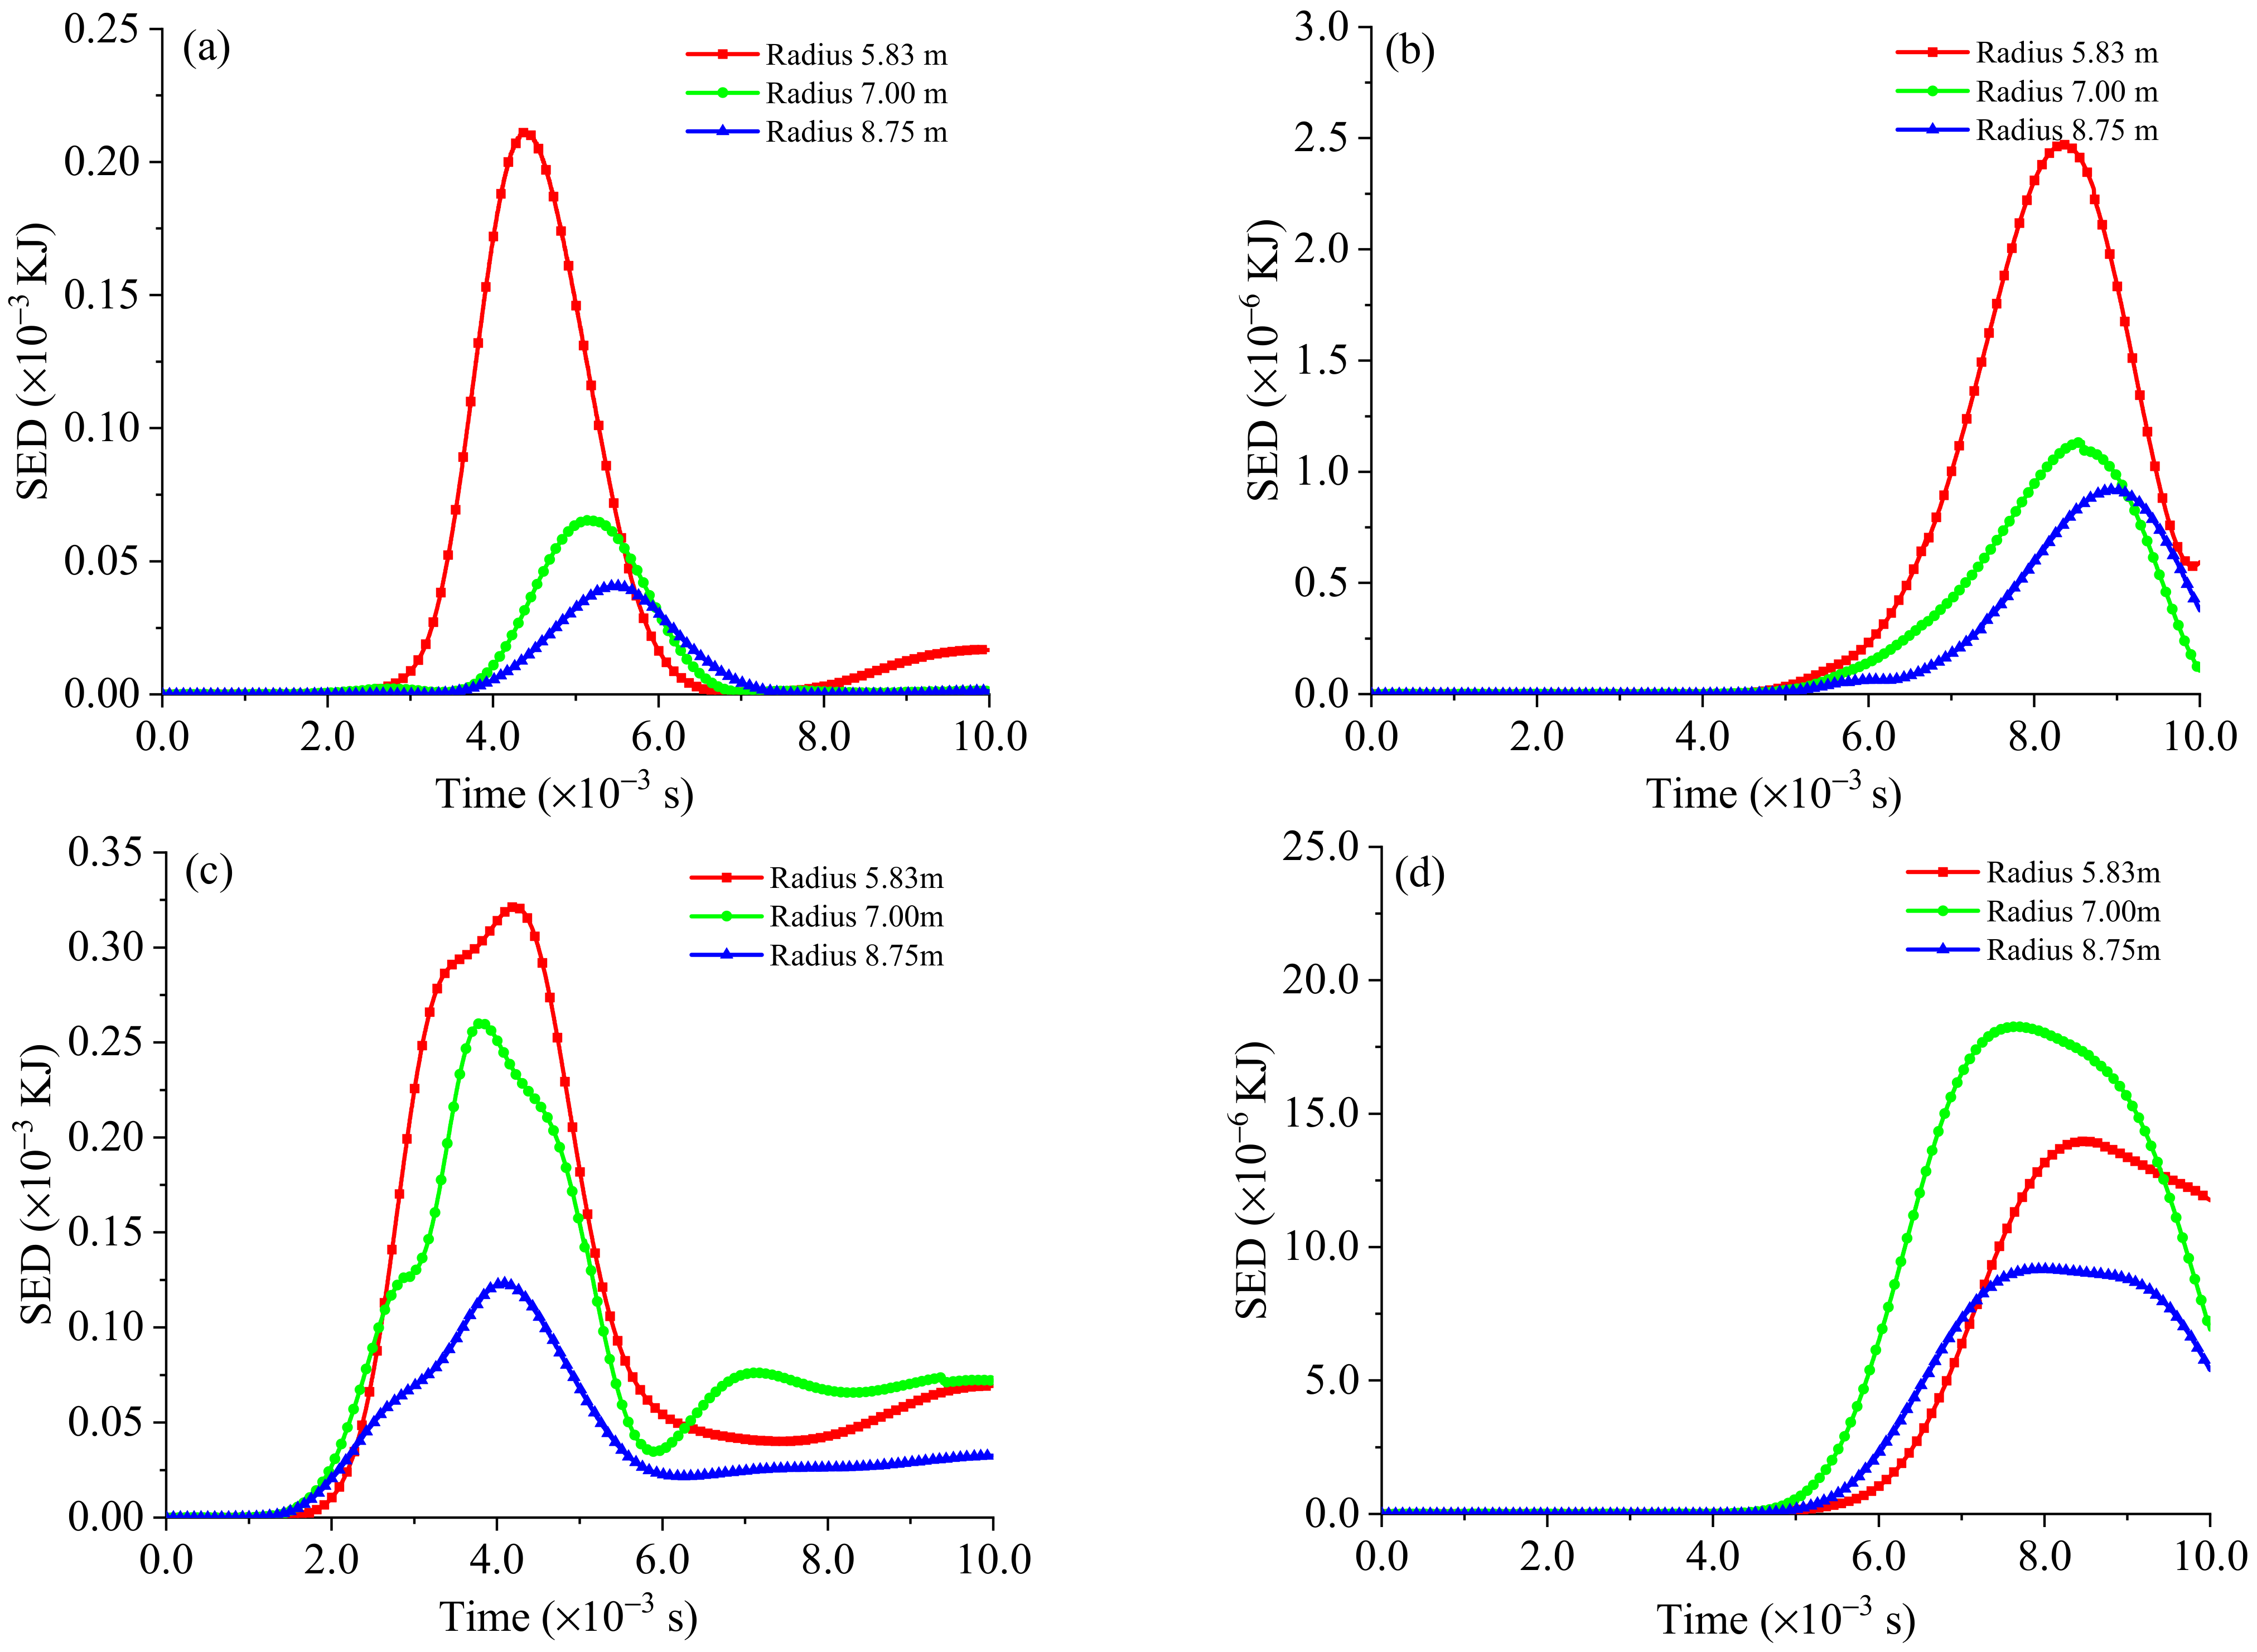
4.2.2. The Influence of Source Radius on PGV

For an exact seismic moment, different corner frequencies correspond to the different radii and the slippage time functions (Figure 6a). The smaller the radius, the smaller the force scope, and the peak velocity leads to uncertainty regarding stress wave propagation. In this series of models, the Cir seismic source and the Cir(CR) seismic source were considered, while different source radii (5.83 m, 7.00 m, and 8.75 m) were examined.
The change in the PGV as a function of distance to the seismic source is plotted in Figure 13 and Figure 14. It can be seen that the PGV of line L1 and line L2 around the seismic source is affected by the typical impact of the source radius and the slippage time function. The source with a radius of 5.83 m and 8.75 m slightly influences the near field ground motion between 15 m and 25 m, and the difference between the PGV gradually decreases at other distances from the source. When the radius is 7.0 m, with a corner frequency of 100 Hz, the PGV located in L1 and L2 is highest within the range of less than 35 m. The source radius on the L3 and L4 measurement lines significantly impacts the PGV near the source. The farther away from the source center, the less influence the source radius has on the PGV. After 40 m from the source center, the PGV on the L3 survey line is almost unaffected by the source radius.
It is worth noting that the effect of the source radius on the PGV is quite different when the rupturing effect is considered, as shown in Figure 14. Specifically, it is embodied as follows: First, on the L1 and L2 lines, the larger the radius of the source, the smaller the PGV value caused by the rock mass around the source. Second, when the points on lines L3 and L4 are within 15 m of the source, the larger the source radius, the smaller the PGV. However, when the distance from the source is greater than 15 m, the PGV in lines L3 and L4 shows the same properties as that in L1 and L2, and the larger the source radius, the smaller the PGV. Third, influenced by the front end of the fault rupture, the PGV in lines L3 and L4 is higher than that of L1 and L2; at the same time, the decay rate with distance is also faster than that of lines L1 and L2.

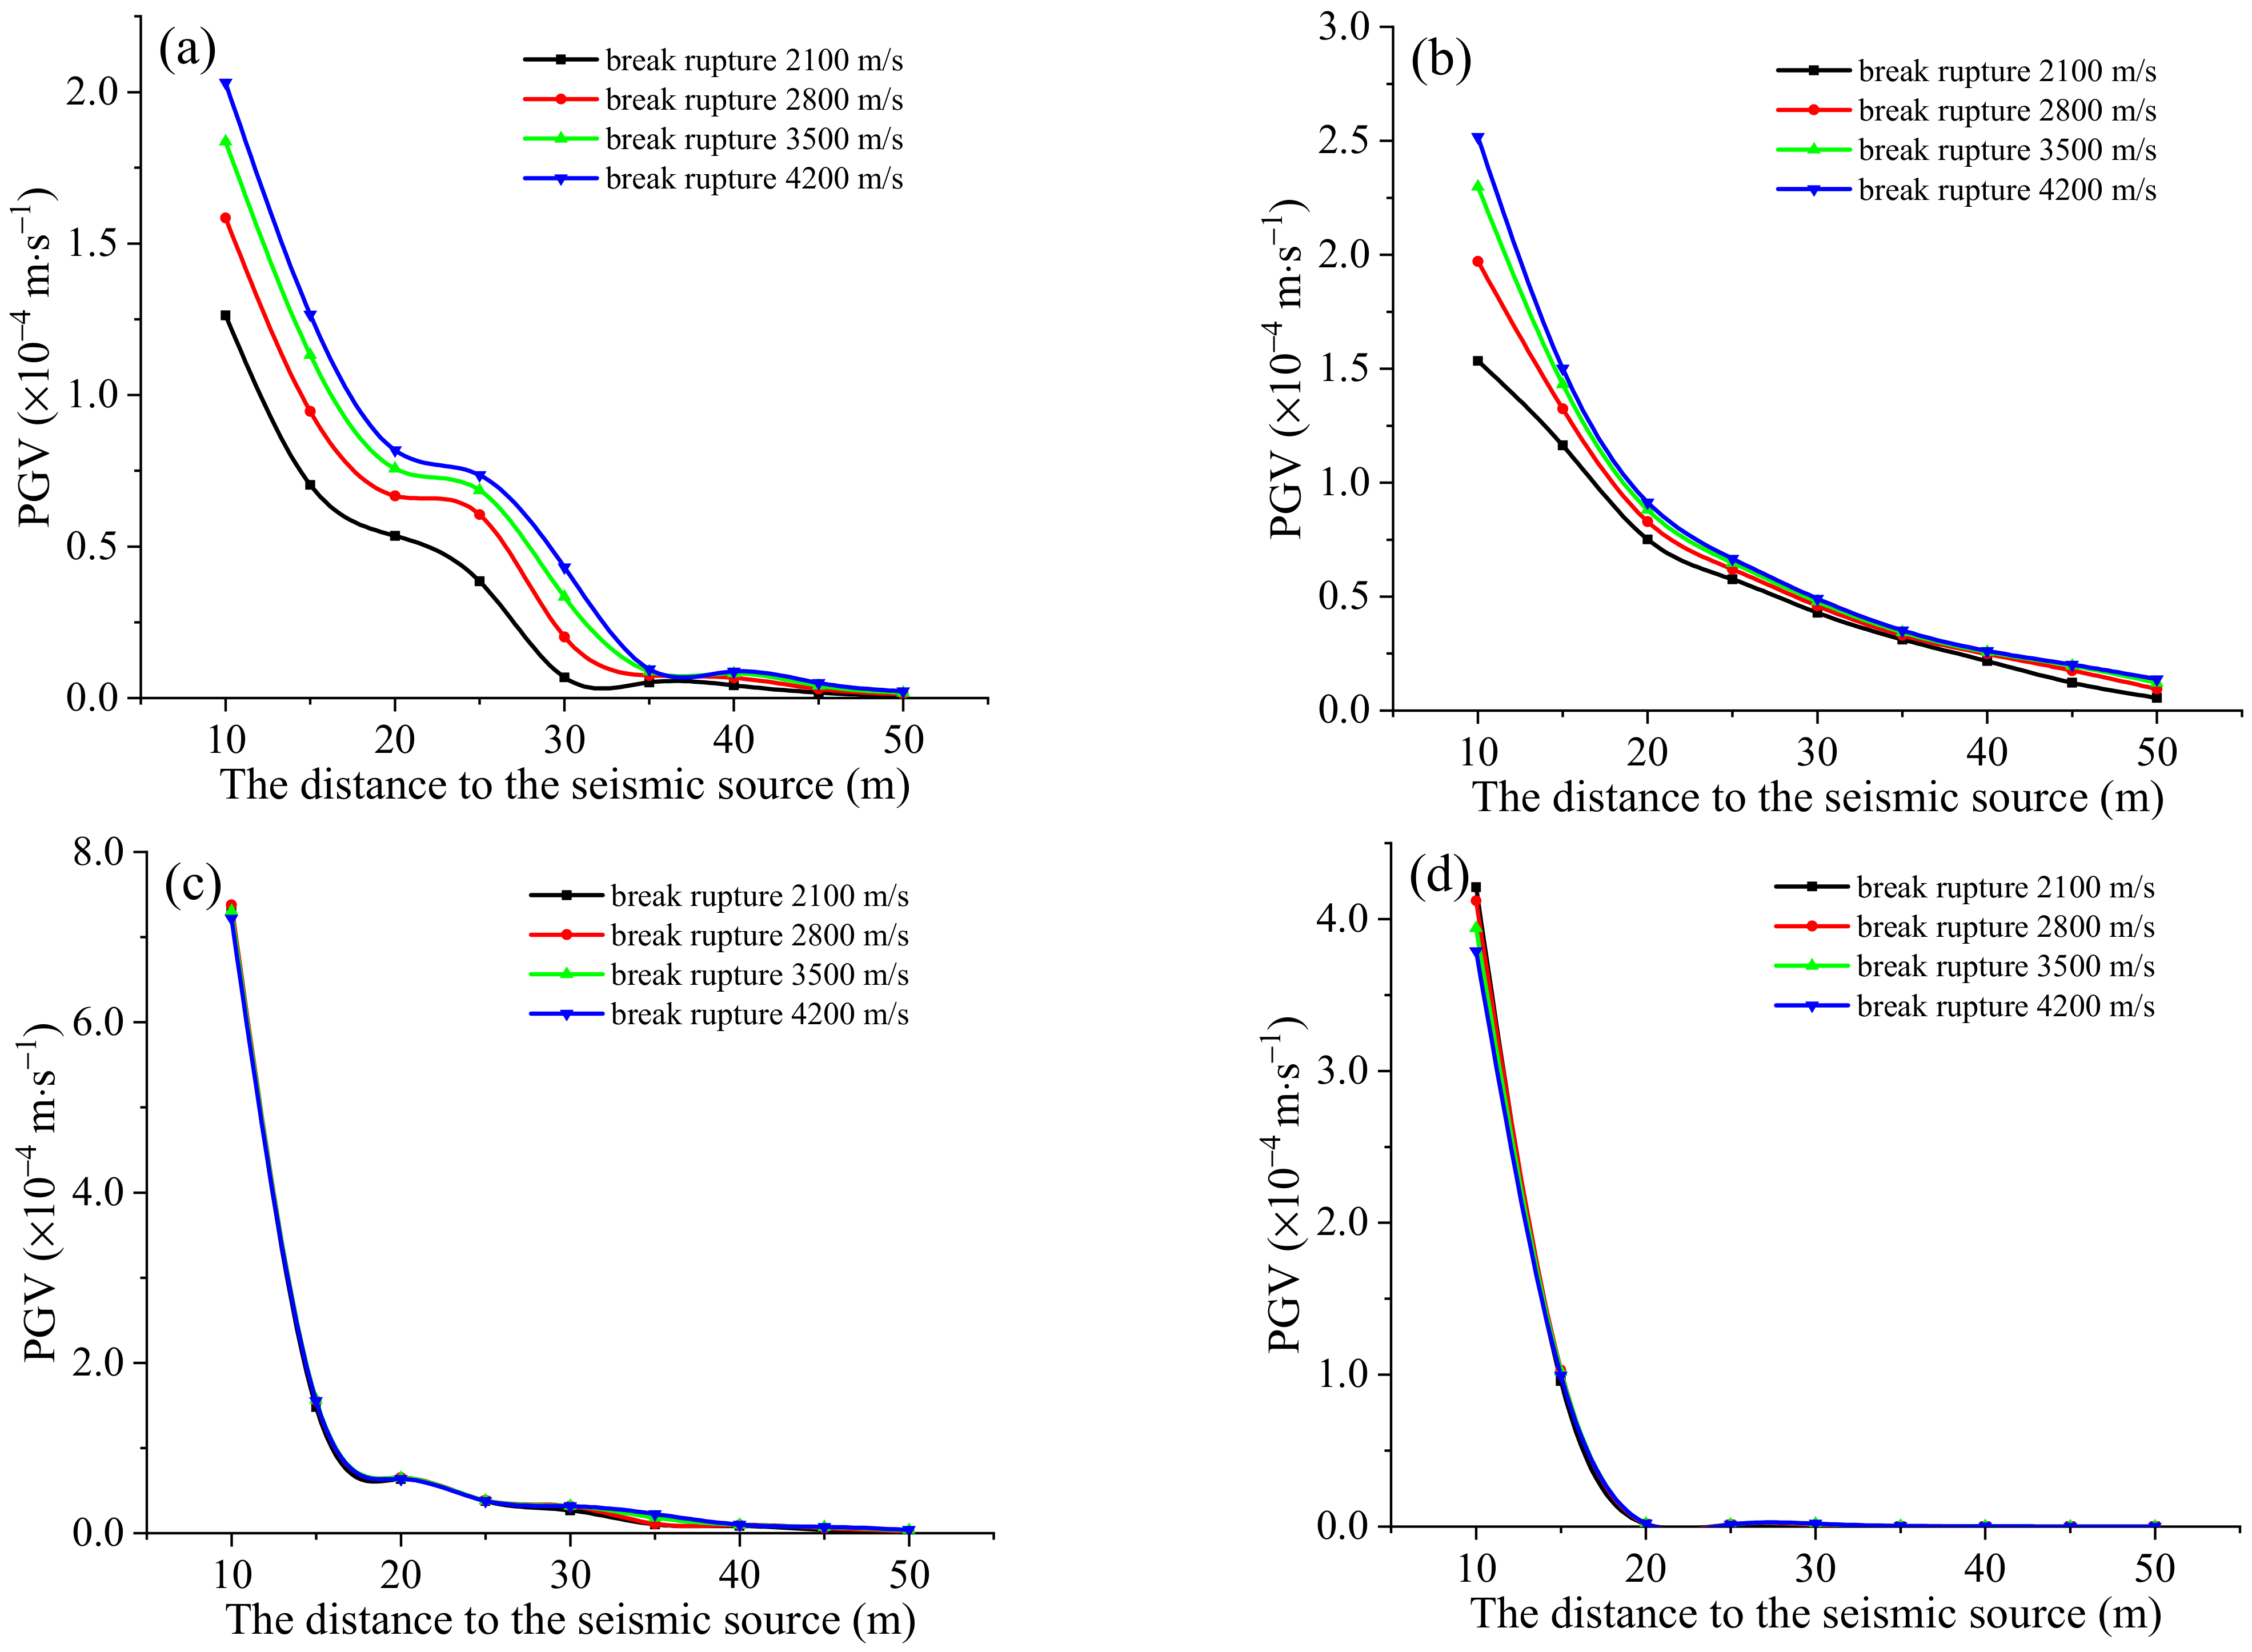
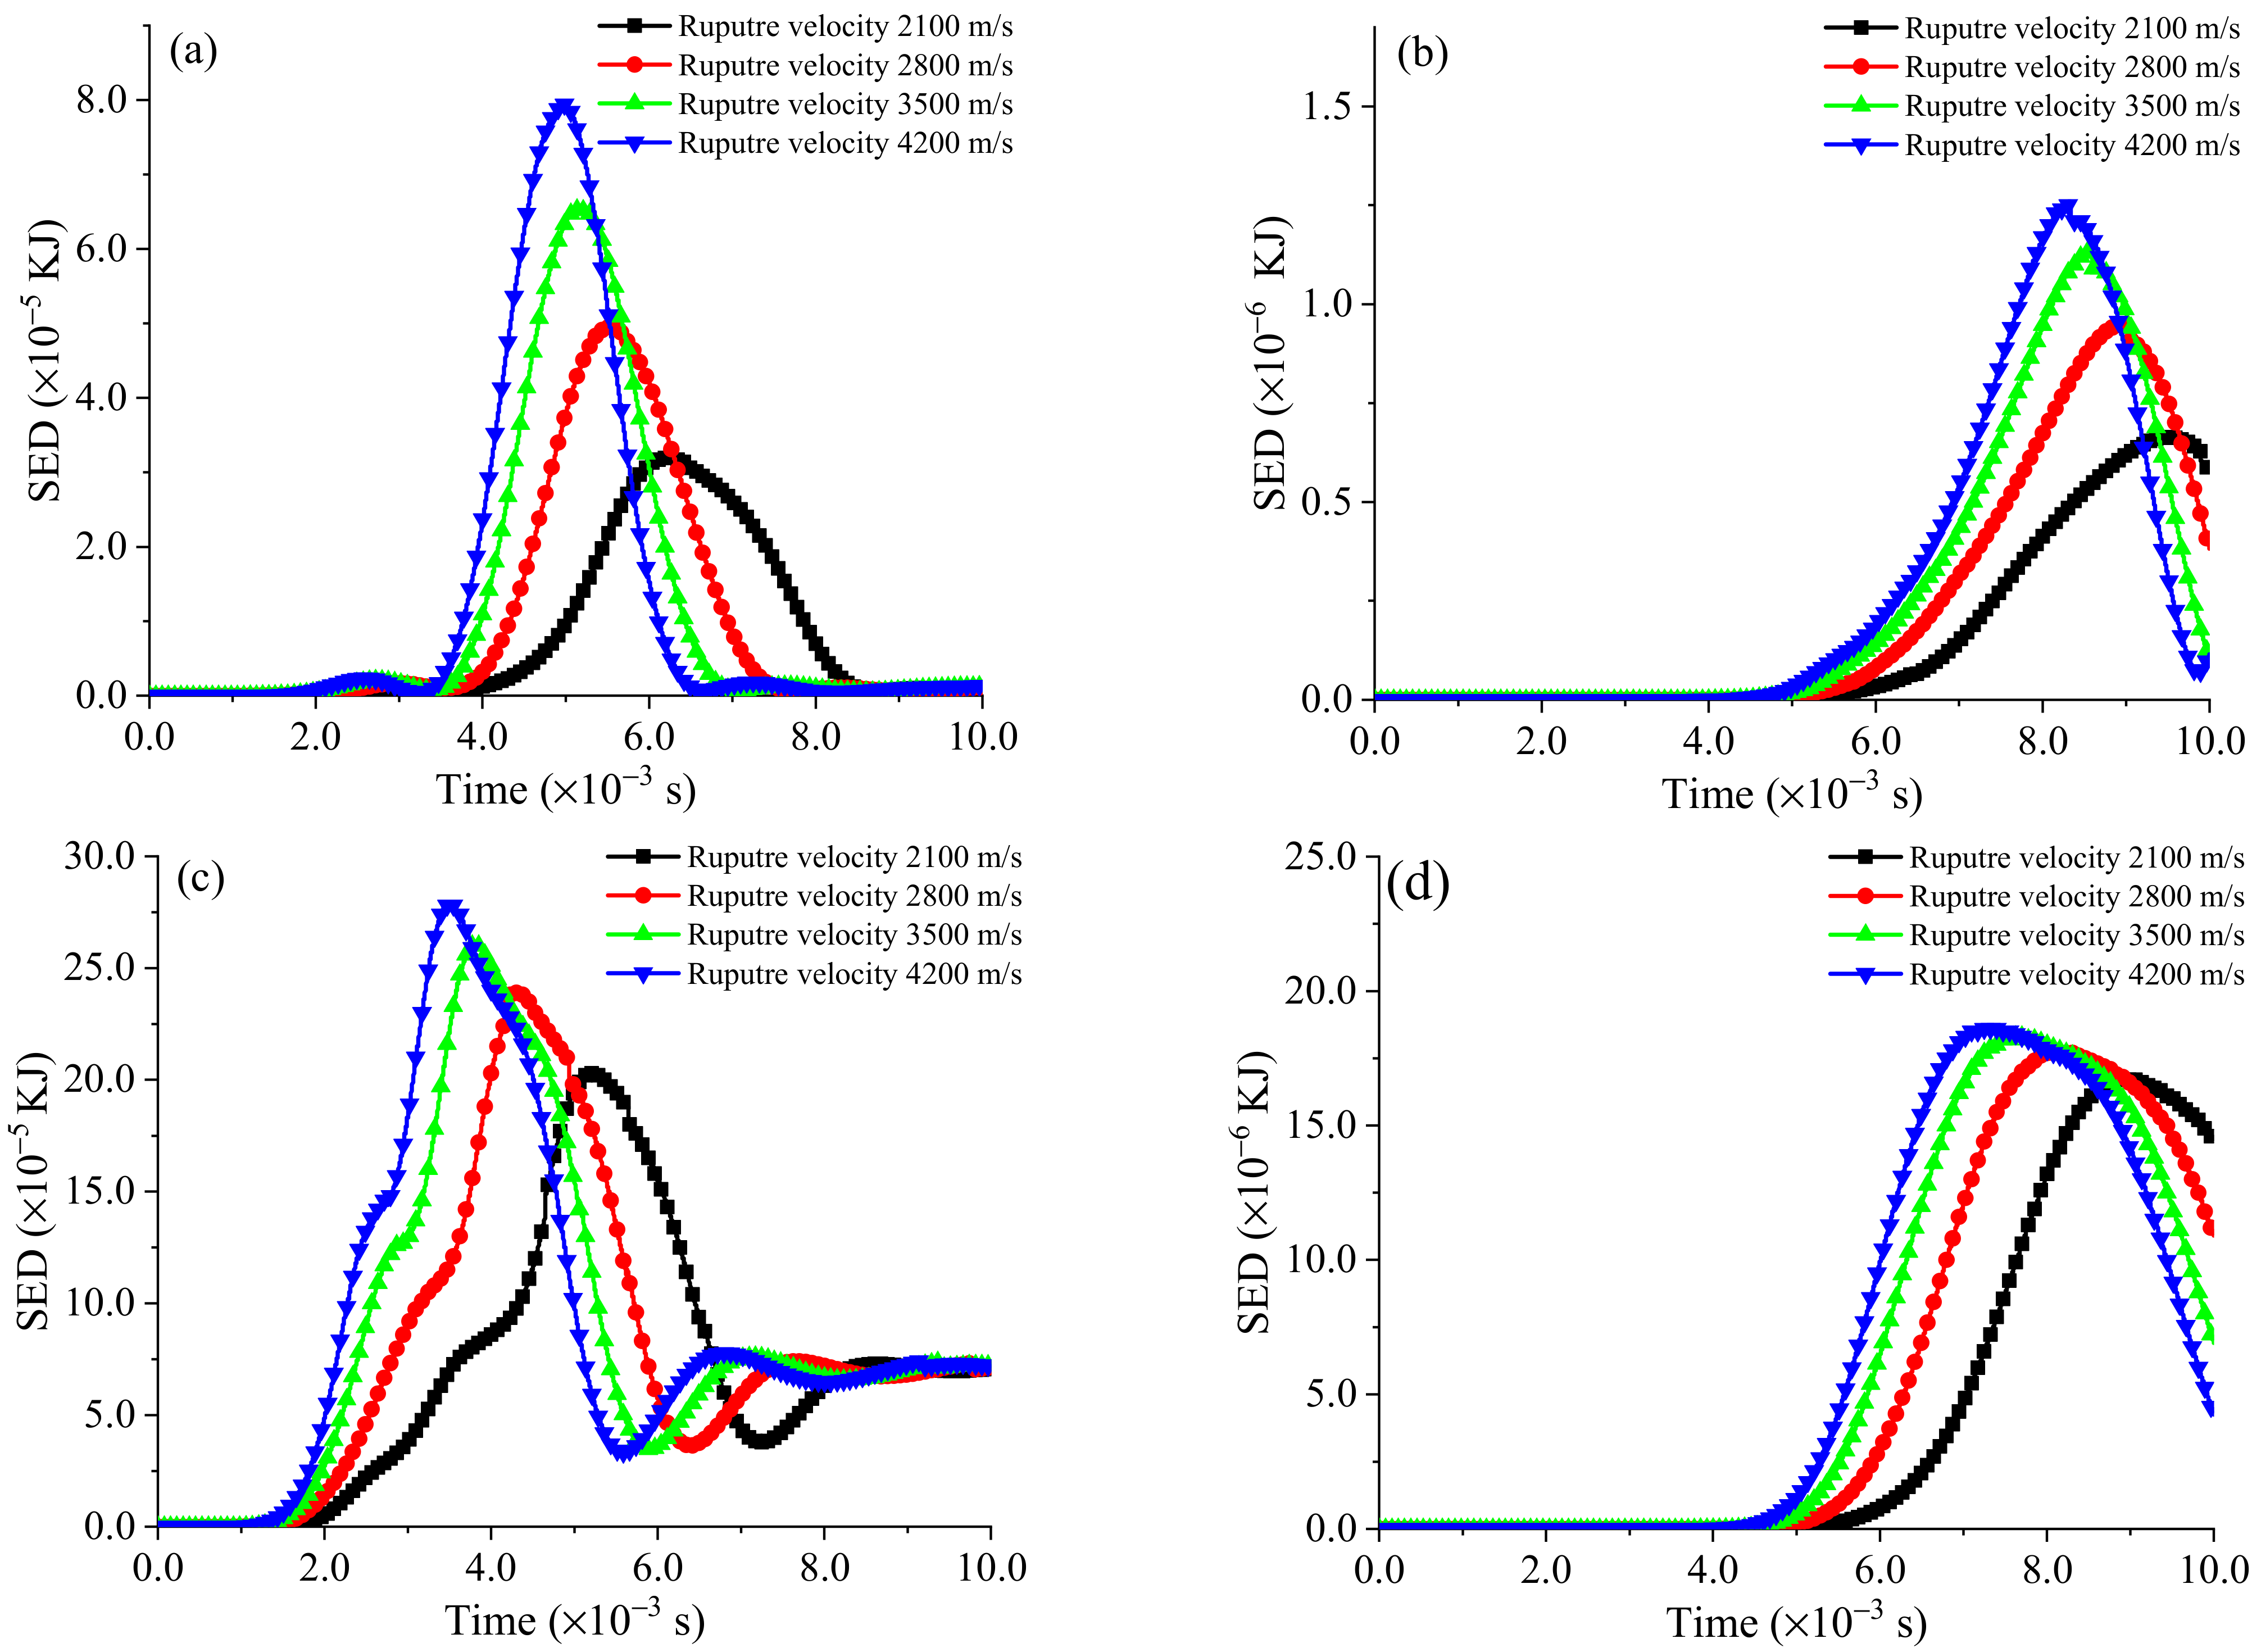
4.2.3. The Effect of Rupture Velocity on PGV

To explore the effect of rupture velocity on the PGV around the fault, the Cir(CR) seismic source with a source radius of 7.0 m is used as an example. Usually, the rupture velocity is compared with the rock shear-wave velocity. Sub-shear waves travel less than the shear-wave velocity; those waves more remarkable than the shear-wave velocity are called super shear waves. Shear-wave velocities of 0.6×, 0.8×, 1.0×, and 1.2× are used as the rupture velocity.
Figure 15 shows that on the vertical section of the fault plane (L1 and L2), the increasing rupture velocity can enhance the PGV of the radiation region of the P-wave and S-wave in the near field. Within the range of 40 m from the seismic source, the PGV increases with the increase in the rupture velocity. While in the radiation area of the S-wave, within the range of 30 m from the source, the change law of PGV with the rupture velocity is similar to that of the P-wave radiation zone.
However, along the fault strike direction, the PGV is hardly affected by the rupture velocity. The PGV only differs around the seismic source on the L4 measurement line.

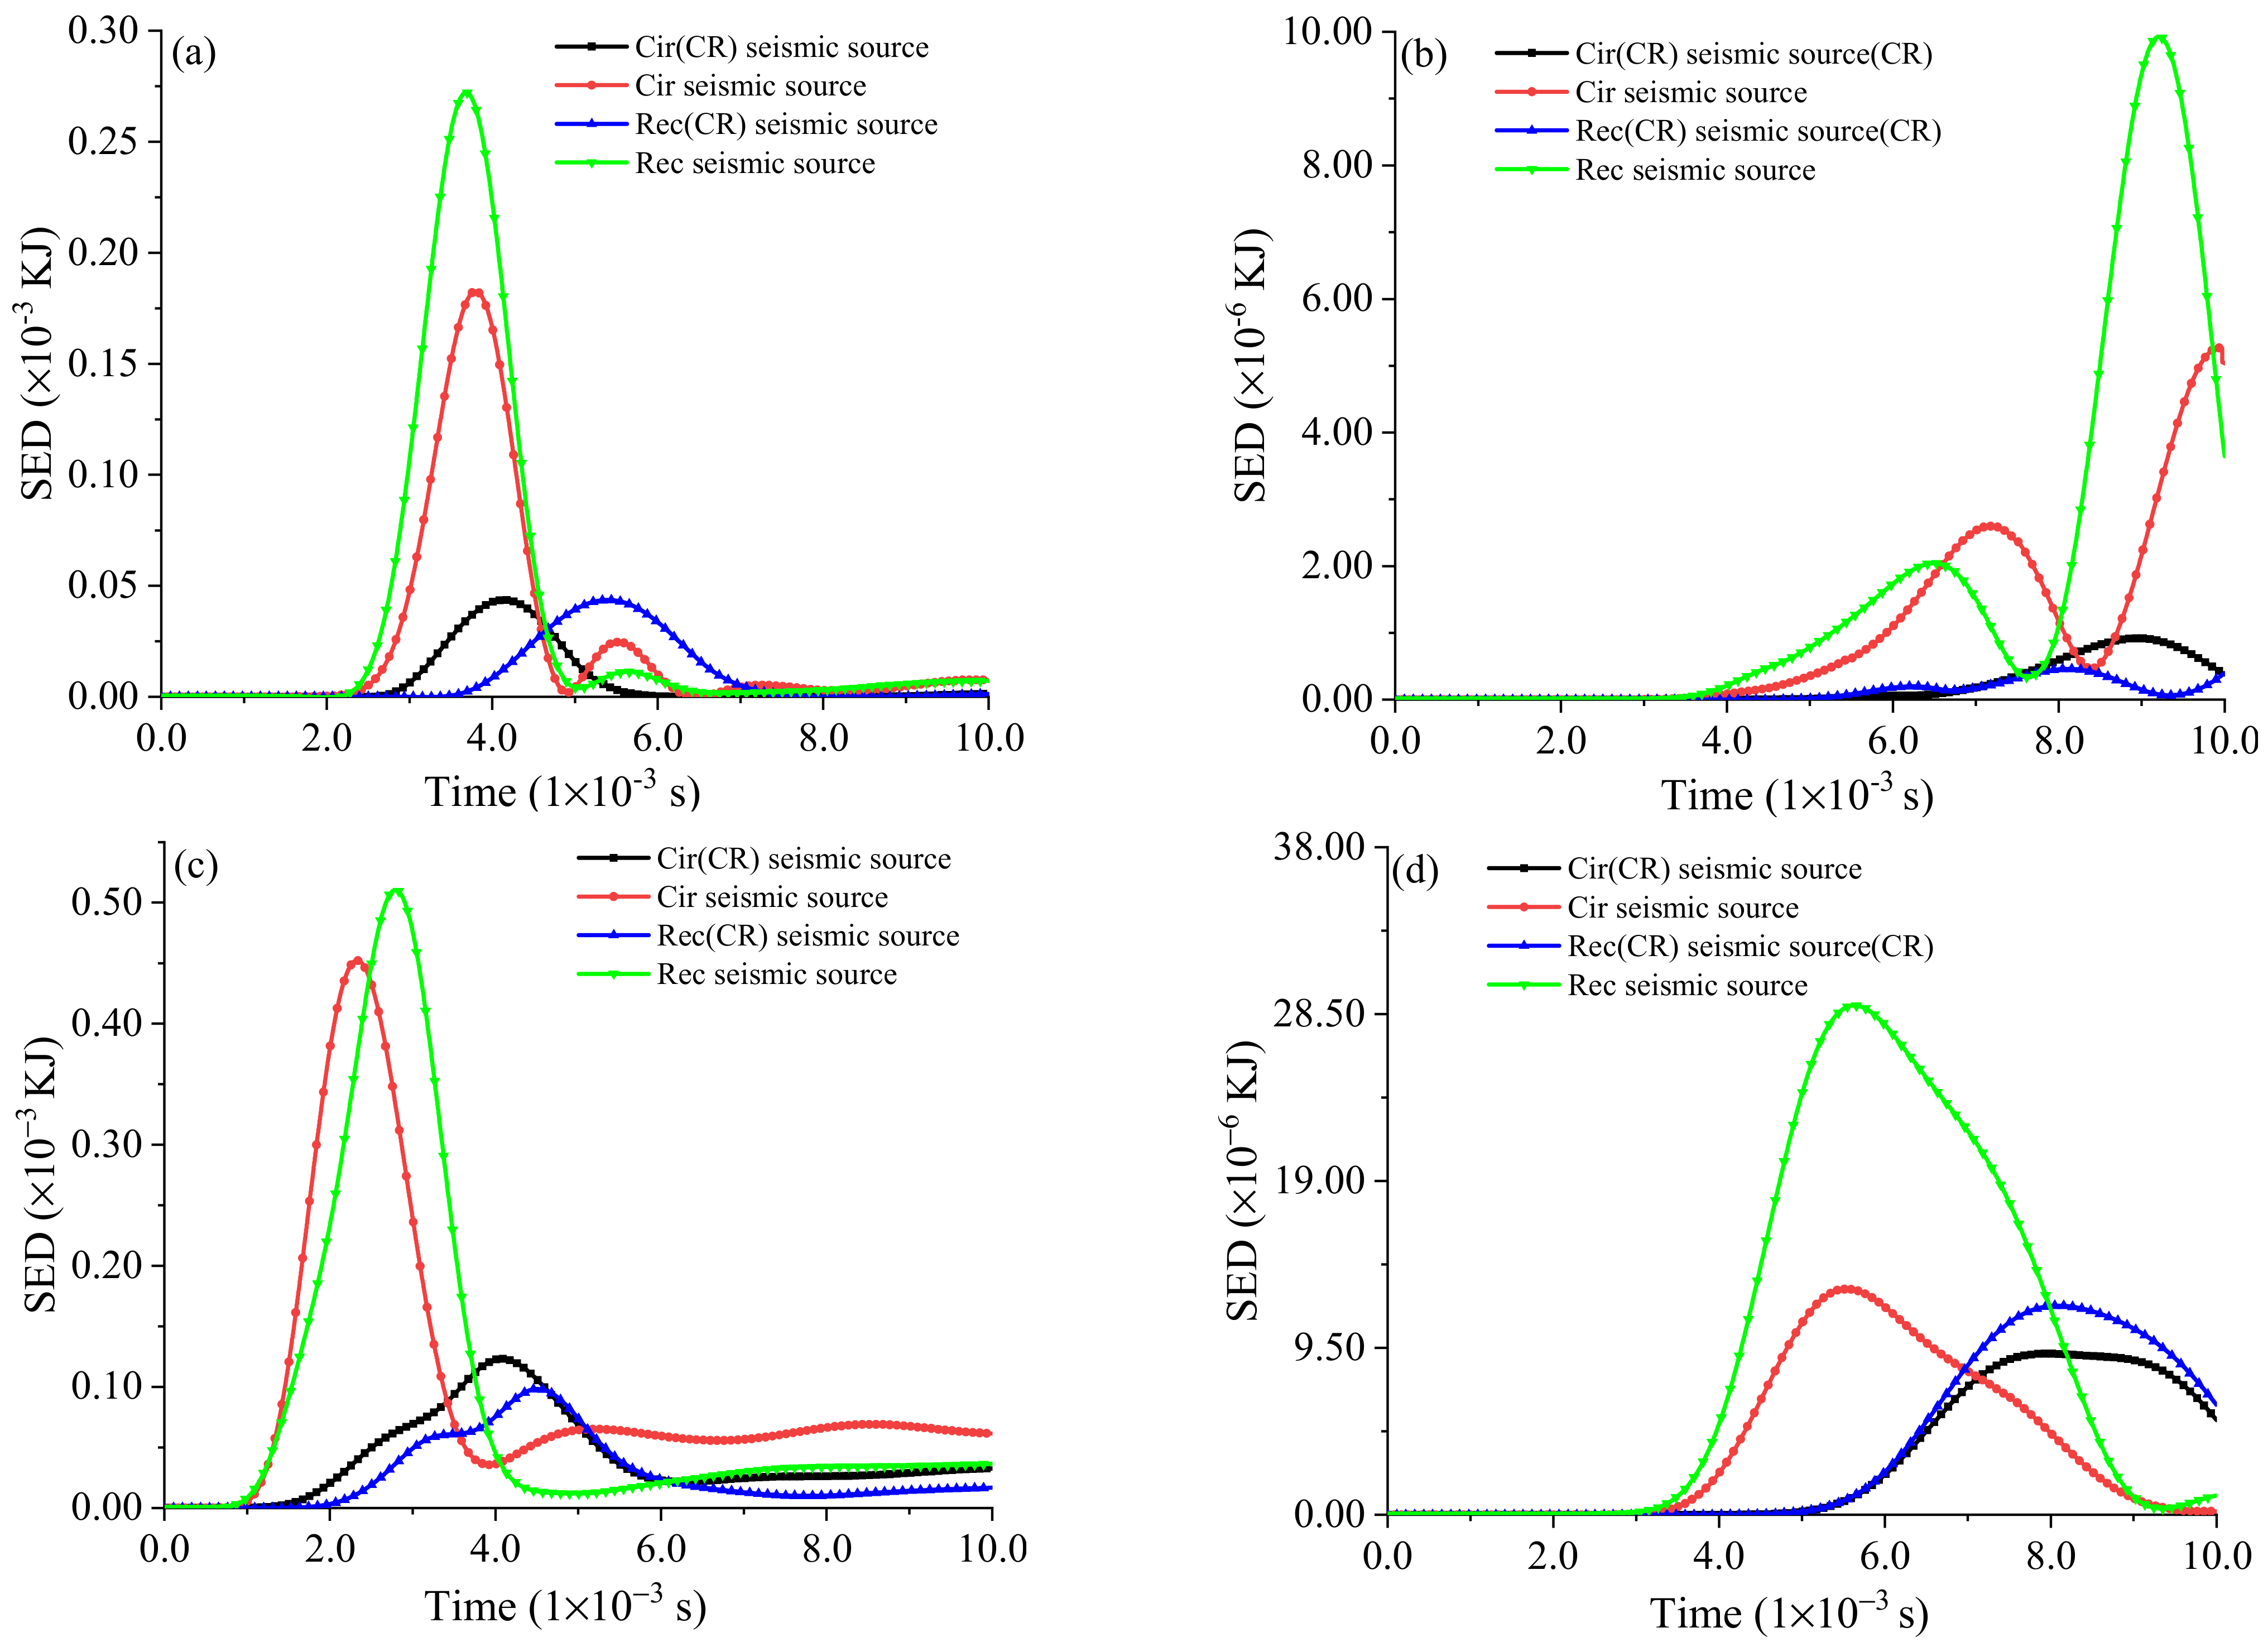
4.3. Sensitivity Analysis of Strain Energy Density (SED)

In engineering practice, the stress wave produced by a fault slip will cause changes in the energy of the rock mass, and the increment in strain energy density reflects the change rule of energy. The strain energy density (SED) of a rock medium is:
U r = 1 2 E [ σ 1 2 + σ 2 2 + σ 3 2 2 ν ( σ 1 σ 2 + σ 1 σ 3 + σ 2 σ 3 ) ]
where ν is the Poisson ratio of the rock mass; E stands for Young’s modulus; and σ1, σ2, and σ3 represent the maximum principal stress, the intermediate principal stress, and the minimum principal stress, respectively. Ur is defined using the Fish function in 3DEC7.0 to obtain the change law of SED with time. Since the circular source has good transmission of stress waves, when analyzing the SED, the Cir and the Cir(CR) seismic sources are used for illustration.
Figure 16 shows the trend of SED overtime at 10 m and 30 m on lines L1 and L2, corresponding to different source types. We know that, whether in the near field or far field, the amplitude of energy of the Cir seismic source is more vital than that of the Cir(CR) seismic source. For the fault in which rupture velocity was not considered, the rupture velocity of the entire fault plane is close to infinity; hence, the fault nodes slip simultaneously. This results in seismic ground motion, and the strain energy triggered by the stress wave in the Cir and Rec seismic source models is more significant than the actual value. It can be judged that the risk of instability of the rock mass will increase.
Similarly, taking a Cir seismic source as an example, we analyze the influence of source radius on SED. It is found that, under the exact seismic moment, the smaller the source radius, the greater the SED value in the process of stress wave propagation, while at the same distance from the source, the SED value on L2 is larger than that on L1, except for the SED varying the regularity of the far field (30 m) on line L2. With the increased distance from the seismic source, the SED value decreases in the order of magnitude, which can be compared via Figure 17a,b.
In addition, the effect of rupture velocity on the SED is also apparent, as shown in Figure 18. The faster the fault ruptures outwards, the more violent the change in the SED value of the rock mass. The trend of SED corresponds to the PGV; the more violent the ground motion, the greater the strain energy of the rock mass, reflecting the excellent regularity of the SED increasing with the increase in the rupture velocity. Since this paper simulates a small microseismic event, the SED is only 10−5 KJ in magnitude, and such small magnitudes do not threaten the stability of the rock mass. Although the peak SED values on lines L1 and L2 are positively correlated with the rupture velocity, with the end of the stress wave propagation, the final SED values are consistent. The influence of the rupture velocity on the SED gradually decreases along with the increased distance from the seismic source. It can be judged that the impact of the rupture velocity on the SED value is also limited in the far field. Therefore, in future applications, the effect of the rupture velocity on the dynamic response of the rock mass can be ignored in the far-field area. Taking a source radius of 7.0 m as an example, combined with the PGV analysis, in Figure 12b, the maximum curvature of the PGV is 25 m from the seismic source; that is, 3.6 times outside the seismic source, the rock mass can be considered to be in the far-field range.

5. Engineering Applications

The microseismic sensor arrangement in the underground exploration tunnel in Beishan. A three-component sensor located around test section II was used to record microseismic events around the Shiyuejing fault. The IMS system’s recorded microseismic waveform is inverted to obtain information such as the focal magnitude, size, dip angle, inclination, etc. In addition, considering the fracture velocity, the circular source is used for modeling in 3DEC, and the simulated signal of the microseismic event is obtained.
From the analysis of the waveform spectrum in the three directions of x, y, and z, it can be seen that the main frequency range of this microseismic event is between 10 and 70 Hz. The frequency characteristics are within the microseismic event’s frequency range, comparable to the waveform data monitored on site. As shown in Figure 19, the amplitude of the simulated signal is in the same order of magnitude as the recorded waveform, and the starting direction of the stress wave is also relatively consistent. In the last part, the PGV and SED values of the rock mass around the seismic source were analyzed with regard to factors such as the source model, the source radius, and the rupture velocity. We know these factors will lead to differences in the simulation results, and the slip function has two control parameters. The slip-time history will also impact the circular fault considering the rupture is used for simulation. Overall, the simulated waveform cannot be entirely consistent with the actual signal, but the magnitude of the amplitude, frequency, and vibration direction is determined. It can be considered that it is feasible and reasonable to use a circular source considering fault rupture to reproduce microseismic events.

6. Conclusions

It is crucial to obtain dynamic response with microseismic events that are caused by fault-slip behavior. This study provides insights into the parametric sensitivity analysis of seismic sources. A finite seismic source was established and investigated with numerical simulation and engineering verification. The primary conclusions are as follows:
(1)
The results of the parametric sensitivity analysis proved that the establishment of the circular seismic source provided a novel method for reproducing microseismic events, and an accurate grasp of the dynamic characteristics of underground motion by source parameter optimization could be achieved.
(2)
It was found that by analyzing the two indices of PGV and SED, the differences in dynamic characteristics caused by seismic source types, source radius, and rupture velocity can be distinguished; thus, the two indices are effective.
(3)
The establishment of a circular seismic source considering the rupture process can provide a strong foundation for a series of subsequent studies—for example, the effect of microseismic events on underground structures, such as stopes, goafs, backfilling bodies, and supporting material, etc.

Author Contributions

Conceptualization, M.L. and R.Y.; methodology, Q.K.; software, M.L.; validation, Y.H. and Q.K.; formal analysis, Y.H.; investigation, Q.K; resources, M.L.; data curation, M.L.; writing—original draft preparation, M.L.; writing—review and editing, M.L. and R.Y.; visualization, Y.H.; supervision, Y.H.; project administration, Q.K.; funding acquisition, M.L. All authors have read and agreed to the published version of the manuscript.

Funding

This research was funded by the National Natural Science Foundation of China, grant numbers “12005099” and “51904334”, the Key Research Project of Hunan Provincial Education Department, grant number “19A425”, the National Natural Science Foundation of Hunan Province, grant number “2020JJ5490”.

Institutional Review Board Statement

Not applicable.

Informed Consent Statement

Not applicable.

Data Availability Statement

Not applicable.

Conflicts of Interest

The authors declare no conflict of interest.

References

  1. Zhang, X.; Qu, T.; Wang, Y. Optimal strategies for stakeholders of Fukushima nuclear waste water discharge in Japan. Mar. Policy 2022, 135, 104881. [Google Scholar]
  2. Gallardo, A.H.; Matsuzaki, T.; Aoki, H. Geological storage of nuclear wastes: Insights following the Fukushima crisis. Energy Policy 2014, 73, 391–400. [Google Scholar] [CrossRef]
  3. Brunnengräber, A.; Schreurs, M. Nuclear energy and nuclear waste governance perspectives after the Fukushima nuclear disaster. In Nuclear Waste Governance; Springer: Wiesbaden, Germany, 2015; pp. 47–78. [Google Scholar]
  4. Hollister, C.D.; Anderson, D.R.; Health, G.R. Subseabed disposal of nuclear wastes. Science 1981, 213, 1321–1326. [Google Scholar] [CrossRef] [PubMed]
  5. Beswick, A.J.; Gibb, F.G.F.; Travis, K.P. Deep borehole disposal of nuclear waste: Engineering challenges. Proc. Inst. Civ. Eng.-Energy 2014, 167, 47–66. [Google Scholar] [CrossRef] [Green Version]
  6. Skarlatidou, A.; Cheng, T.; Haklay, M. What do lay people want to know about the disposal of nuclear waste? A mental model approach to the design and development of an online risk communication. Risk Anal. Int. J. 2012, 32, 1496–1511. [Google Scholar] [CrossRef]
  7. Zuo, J.P.; Wang, J.T.; Sun, Y.J.; Chen, Y.; Jiang, G.H.; Li, Y.H. Effects of thermal treatment on fracture characteristics of granite from Beishan, a possible high-level radioactive waste disposal site in China. Eng. Fract. Mech. 2017, 182, 425–437. [Google Scholar] [CrossRef]
  8. Wang, J.; Chen, L.; Su, R.; Zhao, X. The Beishan underground research laboratory for geological disposal of high-level radioactive waste in China: Planning, site selection, site characterization and in situ tests. J. Rock Mech. Geotech. Eng. 2018, 10, 411–435. [Google Scholar] [CrossRef]
  9. Zhang, Y.; Zhang, Q.Y.; Duan, K.; Yu, G.Y.; Jiao, Y.Y. Reliability analysis of deep underground research laboratory in Beishan for geological disposal of high-level radioactive waste. Comput. Geotech. 2020, 118, 103328. [Google Scholar] [CrossRef]
  10. Wei, X.; Guo, Y.; Cheng, H.; Meng, X.; Cheng, M.; Yang, T.; Xu, C. Rock Mass Characteristics in Beishan, A Preselected Area for China’s High-Level Radioactive Waste Disposal. Acta Geol. Sin.-Engl. Ed. 2019, 93, 362–372. [Google Scholar] [CrossRef]
  11. Li, H.; Wang, J.; Mao, L.; Zhao, S.; Jia, M.; Liu, Y.; Huang, S. Safety assessment of Beishan pre-selection area for geological disposal of high-level radioactive waste in China. J. Radioanal. Nucl. Chem. 2022, 331, 2573–2581. [Google Scholar] [CrossRef]
  12. Zhu, J.; Li, Y.; Peng, Q.; Deng, X.; Gao, M.; Zhang, J. Stress wave propagation across jointed rock mass under dynamic extension and its effect on dynamic response and supporting of underground opening. Tunn. Undergr. Space Technol. 2021, 108, 103648. [Google Scholar] [CrossRef]
  13. Vazaios, I.; Vlachopoulos, N.; Diederichs, M.S. Mechanical analysis and interpretation of excavation damage zone formation around deep tunnels within massive rock masses using hybrid finite–discrete element approach: Case of Atomic Energy of Canada Limited (AECL) Underground Research Laboratory (URL) test tunnel. Can. Geotech. J. 2019, 56, 35–59. [Google Scholar]
  14. Abbas, Y.M.; Hegazy, T.M.; Nassif, M.S.; Shoeib, M.Y.; Abd-Elraheem, A.F. Measurement of 226Ra concentration and radon exhalation rate in rock samples from Al-Qusair area using CR-39. J. Radiat. Res. Appl. Sci. 2020, 13, 102–110. [Google Scholar] [CrossRef] [Green Version]
  15. Pereira, A.; Lamas, R.; Miranda, M.; Domingos, F.; Neves, L.; Ferreira, N.; Costa, L. Estimation of the radon production rate in granite rocks and evaluation of the implications for geogenic radon potential maps: A case study in Central Portugal. J. Environ. Radioact. 2017, 166, 270–277. [Google Scholar] [CrossRef]
  16. Xie, C.; Xiong, G.; Chen, Z. Using CFD to Simulate the Concentration of Polluting and Harmful Gases in the Roadway of Non-Metallic Mines Reveals Its Migration Law. Sustainability 2022, 14, 13349. [Google Scholar] [CrossRef]
  17. Khayrutdinov, M.M.; Golik, V.I.; Aleksakhin, A.V.; Trushina, E.V.; Lazareva, N.V.; Aleksakhina, Y.V. Proposal of an Algorithm for Choice of a Development System for Operational and Environmental Safety in Mining. Resources 2022, 11, 88. [Google Scholar] [CrossRef]
  18. Rybak, J.; Khayrutdinov, M.M.; Kuziev, D.A.; Kongar-Syuryun, C.B.; Babyr, N.V. Prediction of the geomechanical state of the rock mass when mining salt deposits with stowing. J. Min. Inst. 2022, 253, 61–70. [Google Scholar] [CrossRef]
  19. Litvinenko, V. Advancement of geomechanics and geodynamics at the mineral ore mining and underground space development. In EUROCK2018: Geomechanics and Geodynamics of Rock Masses; CRC Press: Boca Raton, FL, USA, 2018; pp. 3–16. [Google Scholar]
  20. Kongar-Syuryun, C.; Ubysz, A.; Faradzhov, V. Models and algorithms of choice of development technology of deposits when selecting the composition of the backfilling mixture. In IOP Conference Series: Earth and Environmental Science; IOP Publishing: Bristol, UK, 2021; Volume 684, p. 012008. [Google Scholar]
  21. Jing, L.; Feng, X. Main rock mechanics issues in geological disposal of radioactive wastes. Chin. J. Rock Mech. Eng. 2006, 25, 833–841. [Google Scholar]
  22. Niu, L. In-Situ Stress Measurement in Nuclear Waste Disposal Sites Preselected Area. Master’s Thesis, Chinese Academy of Geological Sciences, Beijing, China, 2015. [Google Scholar]
  23. Yang, J.H. Coupling Effect of Blasting and Transient Release of In-Situ Stress during Deep Rock Mass Excavation. Ph.D. Thesis, Wuhan University, Wuhan, China, 2014. [Google Scholar]
  24. Kwon, S.; Min, K.B. Fracture transmissivity evolution around the geological repository of nuclear waste caused by the excavation damage zone, thermoshearing and glaciation. Int. J. Rock Mech. Min. Sci. 2021, 137, 104554. [Google Scholar] [CrossRef]
  25. Lei, Q.; Loew, S. Modelling coseismic displacements of fracture systems in crystalline rock during large earthquakes: Implications for the safety of nuclear waste repositories. Int. J. Rock Mech. Min. Sci. 2021, 138, 104590. [Google Scholar] [CrossRef]
  26. Chen, G.; Li, X.; Zhang, P. Simulation of fault slip rockburst seismic source based on improved Haskell model. China Saf. Sci. J. 2016, 26, 122–127. [Google Scholar]
  27. Chen, G.H.; Li, X.; Zhang, P.; Lu, J.T.; Dong, L.J. Dynamic response of rockmass under fault-slip rockburst based on focal mechanism. China Saf. Sci. J. 2016, 26, 121–126. [Google Scholar]
  28. Lan, M.; Zhang, C.X.; Hong, C.X.; Li, X.Y. Response Characteristics of Rock Mass in Different Radiation Zones under Disturbance of Fault Slip. J. Univ. South China (Sci. Technol.) 2020, 34, 36–42. [Google Scholar]
  29. Haskell, N.A. Elastic displacements in the near-field of a propagating fault. Bull. Seismol. Soc. Am. 1969, 59, 865–908. [Google Scholar]
  30. Madariaga, R. Seismic source theory. Earthq. Seismol. 2007, 4, 59–82. [Google Scholar]
  31. Nielsen, S.; Madariaga, R. On the self-healing fracture mode. Bull. Seismol. Soc. Am. 2003, 93, 2375–2388. [Google Scholar] [CrossRef]
  32. Sato, T.; Hirasawa, T. Body wave spectra from propagating shear cracks. J. Phys. Earth 1973, 21, 415–431. [Google Scholar]
  33. Ma, L.K. Study on the Long-Term Stability of Beishan Granitic Host Rock for High-Level Radioactive Waste Repository in the Beishan Area in Gansu Province. Ph.D. Thesis, Beijing Research Institute of Uranium Geology, Beijing, China, 2017. [Google Scholar]
  34. He, S.S.; Zhou, H.W.; Wang, S.C.; Wang, Z.H.; Chen, L.; Liu, J.F. Fisher Discriminant Analysis Model for Microseismic Events of Beishan Granite Area. J. Xi’an Univ. Sci. Technol. 2017, 37, 515–521. [Google Scholar]
  35. Gao, F.; Kang, H.; Li, J. Numerical simulation of fault-slip rockbursts using the distinct element method. Tunn. Undergr. Space Technol. 2021, 110, 103805. [Google Scholar]
  36. Wang, S.; Zhu, S.B. Finite element method simulations of the influences of fault rupture velocities on ground motions and seismic hazards. Chin. J. Geophys. 2022, 65, 686–697. [Google Scholar]
Figure 1. Haskell fault motion model.
Sustainability 15 01711 g001
Figure 2. Circle fault motion model.
Sustainability 15 01711 g002
Figure 3. Comparison between the original Yoffe function (a) and the regularized Yoffe function (b). Vpeak is the peak velocity; τR is the slip time from Vpeak to the end; and τ R e f f is the slip time from zero to the end.
Sustainability 15 01711 g003
Figure 4. Schematic diagram of the Beishan exploration tunnel field-test layout.
Sustainability 15 01711 g004
Figure 5. 3DEC model for simulating the seismic source. The red dot is the seismic source and the black arrows show the fault-slip directions.
Sustainability 15 01711 g005
Figure 6. Curves of source function with time: (a) slip rates change with time at each node on the fault and (b) displacement varies with time at each node on the fault plane.
Sustainability 15 01711 g006
Figure 7. Circular seismic source (a) and rectangular seismic source model (b) with the same equivalent area.
Sustainability 15 01711 g007
Figure 8. Radiation pattern diagrams of the radial displacement component of P-waves (a) and the transverse displacement component of S-waves (b).
Sustainability 15 01711 g008
Figure 9. Arrangement of monitoring lines (L1, L2, L3, and L4) around the fault.
Sustainability 15 01711 g009
Figure 10. Contour diagram of stress wave propagation under different seismic source models (vertical fault section): (a) Cir seismic source, (b) Rec seismic source, (c) Cir (CR) seismic source, and (d) Rec (CR) seismic source.
Sustainability 15 01711 g010
Figure 11. Contour diagram of stress wave propagation under different seismic source models (along fault section): (a) Cir seismic source; (b) Rec seismic source; (c) Cir (CR) seismic source; and (d) Rec (CR) seismic source.
Sustainability 15 01711 g011
Figure 12. Effects of different seismic source type on PGV: (a) L1 measurement line; (b) L2 measurement line; (c) L3 measurement line; and (d) L4 measurement line.
Sustainability 15 01711 g012
Figure 13. Effect of source radius on PGV under Cir seismic source: (a) L1 measurement line; (b) L2 measurement line; (c) L3 measurement line; and (d) L4 measurement line.
Sustainability 15 01711 g013
Figure 14. Effect of source radius on PGV under Cir(CR)seismic source: (a) L1 measurement line; (b) L2 measurement line; (c) L3 measurement line; and (d) L4 measurement line.
Sustainability 15 01711 g014
Figure 15. Effect of rupture velocity on PGV under Cir(CR) seismic source with a radius of 7.0 m: (a) L1 measurement line; (b) L2 measurement line; (c) L3 measurement line; and (d) L4 measurement line.
Sustainability 15 01711 g015
Figure 16. Effect of seismic source on SED: (a) 10 m to the seismic source in the L1 line; (b) 30 m to the seismic source in the L1 line; (c) 10 m to the seismic source in the L2 line; and (d) 30 m to the seismic source in the L2 line.
Sustainability 15 01711 g016
Figure 17. Effect of seismic source radius on SED: (a) 10 m to the seismic source in the L1 line; (b) 30 m to the seismic source in the L1 line; (c) 10 m to the seismic source in the L2 line; and (d) 30 m to the seismic source in the L2 line.
Sustainability 15 01711 g017
Figure 18. Effect of fault rupture velocity on SED: (a) 10 m to the seismic source in the L1 line; (b) 30 m to the seismic source in the L1 line; (c) 10 m to the seismic source in the L2 line; and (d) 30 m to the seismic source in the L2 line.
Sustainability 15 01711 g018
Figure 19. Simulated (a) microseismic signals and their (b) frequency spectrum. The red curve represents the seismic wave and frequency spectrum in X direction; the green curve represents the seismic wave and frequency spectrum in Y direction; and the blue curve represents the seismic wave and frequency spectrum in Z direction.
Sustainability 15 01711 g019
Table 1. Basic rock mechanics parameters of Beishan exploration tunnel.
Density
(ρ)/Kg∙m−3
Young’s Modulus (E)/GPaPoisson’s Ratio (v)Uniaxial Compressive Strength (σc)/MPaTensile Strength (σt)/MPaCohesion (c)/MPaFriction Angle (φ)/°
280065.250.21159.048.72545
Table 2. Reference values of seismic source parameters.
Shear Modulus (G)/GPaSlippage
Displacement (D)/m
Rupture Area (S)/m2Seismic
Moment (M0)/(N·m−1)
Fault
Radius (R0)/m
25.721.21 × 10−10 f 0 2 1.54 × 10⁶/ f 0 2 4.79 × 106699.77/f0
25.727.74 × 10−7240.44.79 × 1068.75
25.721.21 × 10−6153.94.79 × 1067.00
25.721.74 × 10−6106.74.79 × 1065.83
Table 3. Case list of simulated seismic sources. “ × ” means the considering factor.
Seismic Simulated ModelConsidering Factors
Source TypeSource Radius (m)Rupture Velocity (m/s)
RectangleCircle8.757.005.83 + 2100280035004800
1 × × ×
2 × × ×
3 × × ×
4 × × ×
5 × × ×
6 × × ×
7 × × ×
8 × × ×
9 × × ×
10 × × ×
29 × × ×
30 × × ×
Disclaimer/Publisher’s Note: The statements, opinions and data contained in all publications are solely those of the individual author(s) and contributor(s) and not of MDPI and/or the editor(s). MDPI and/or the editor(s) disclaim responsibility for any injury to people or property resulting from any ideas, methods, instructions or products referred to in the content.

