
Using Multicriteria Decision Making to Evaluate the Risk of Hydrogen Energy Storage and Transportation in Cities


Abstract
:1. Introduction
2. Literature Review
2.1. Risk Factors Influencing RSTH
2.2. Risk Management and Control
2.3. Method of Assessing RSTH
2.4. Prototype Decision Structure
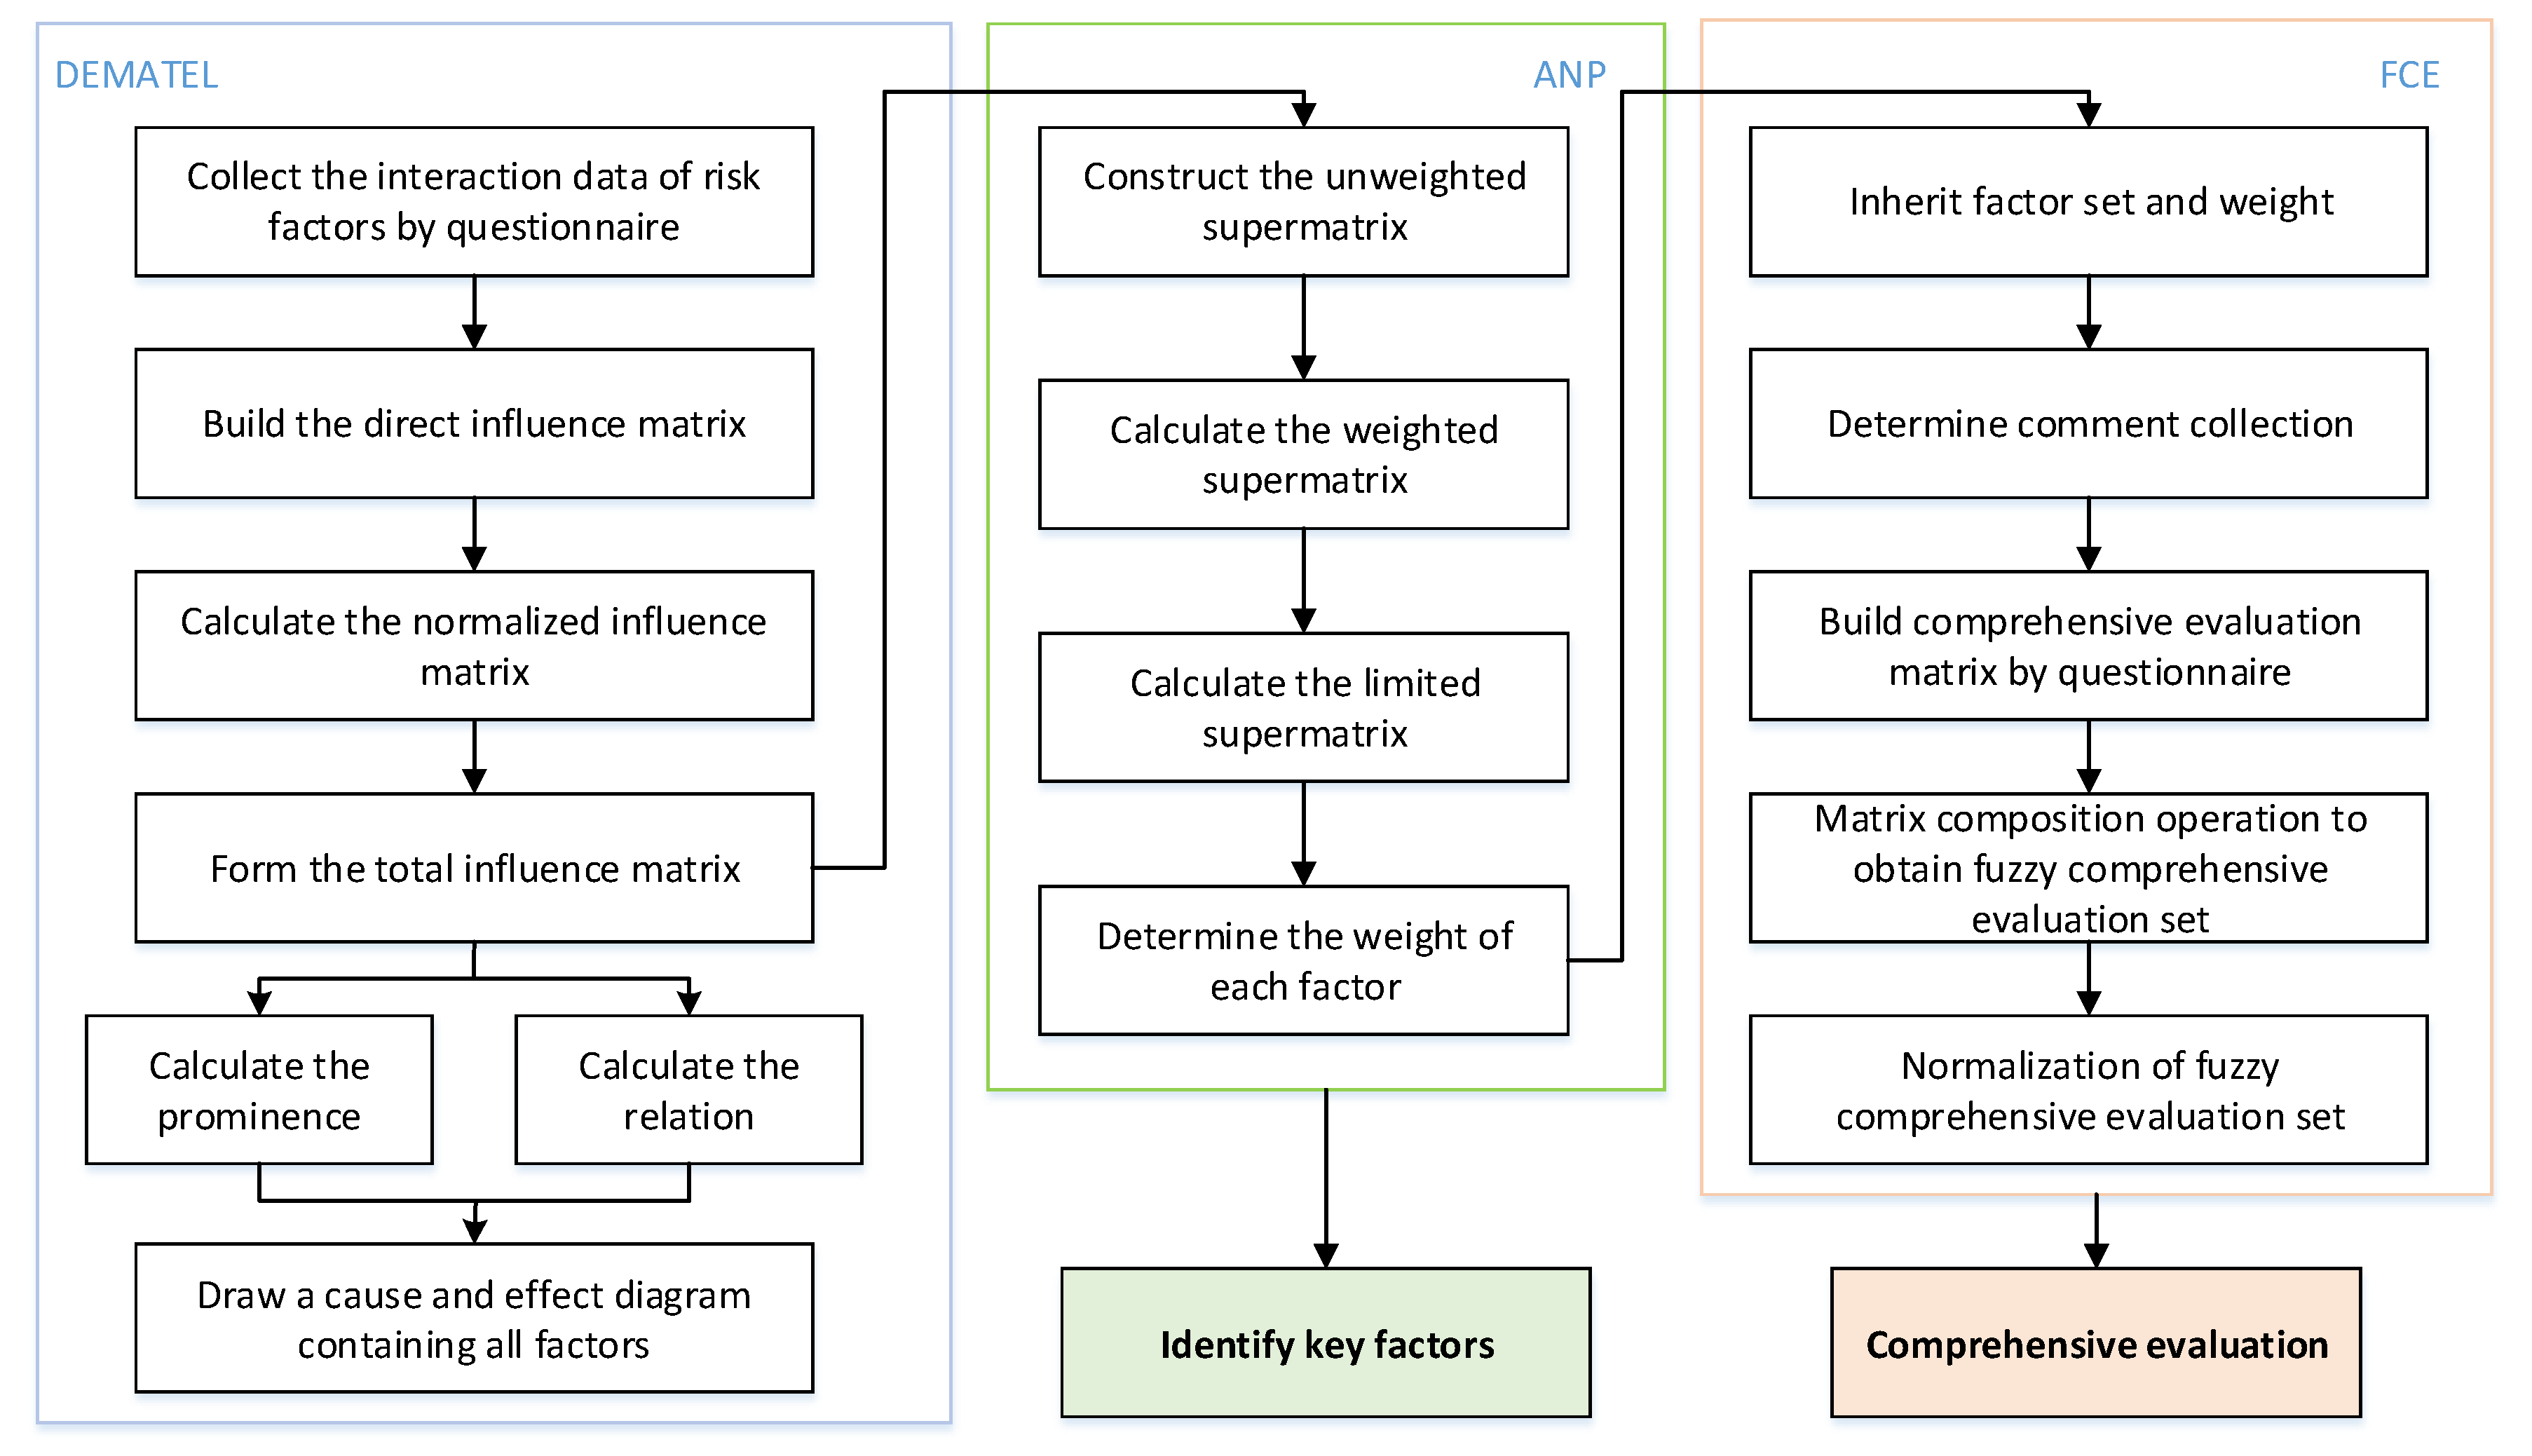
3. Materials and Methods
3.1. Materials
3.2. DEMATEL-Based ANP
3.3. Fuzzy Evaluation
4. Empirical Study
4.1. Introduction to the Case
4.2. Determining the Formal Decision Structure
4.3. Identifying Key Risk Factors
4.4. Assessment of Urban RSTH
5. Discussion
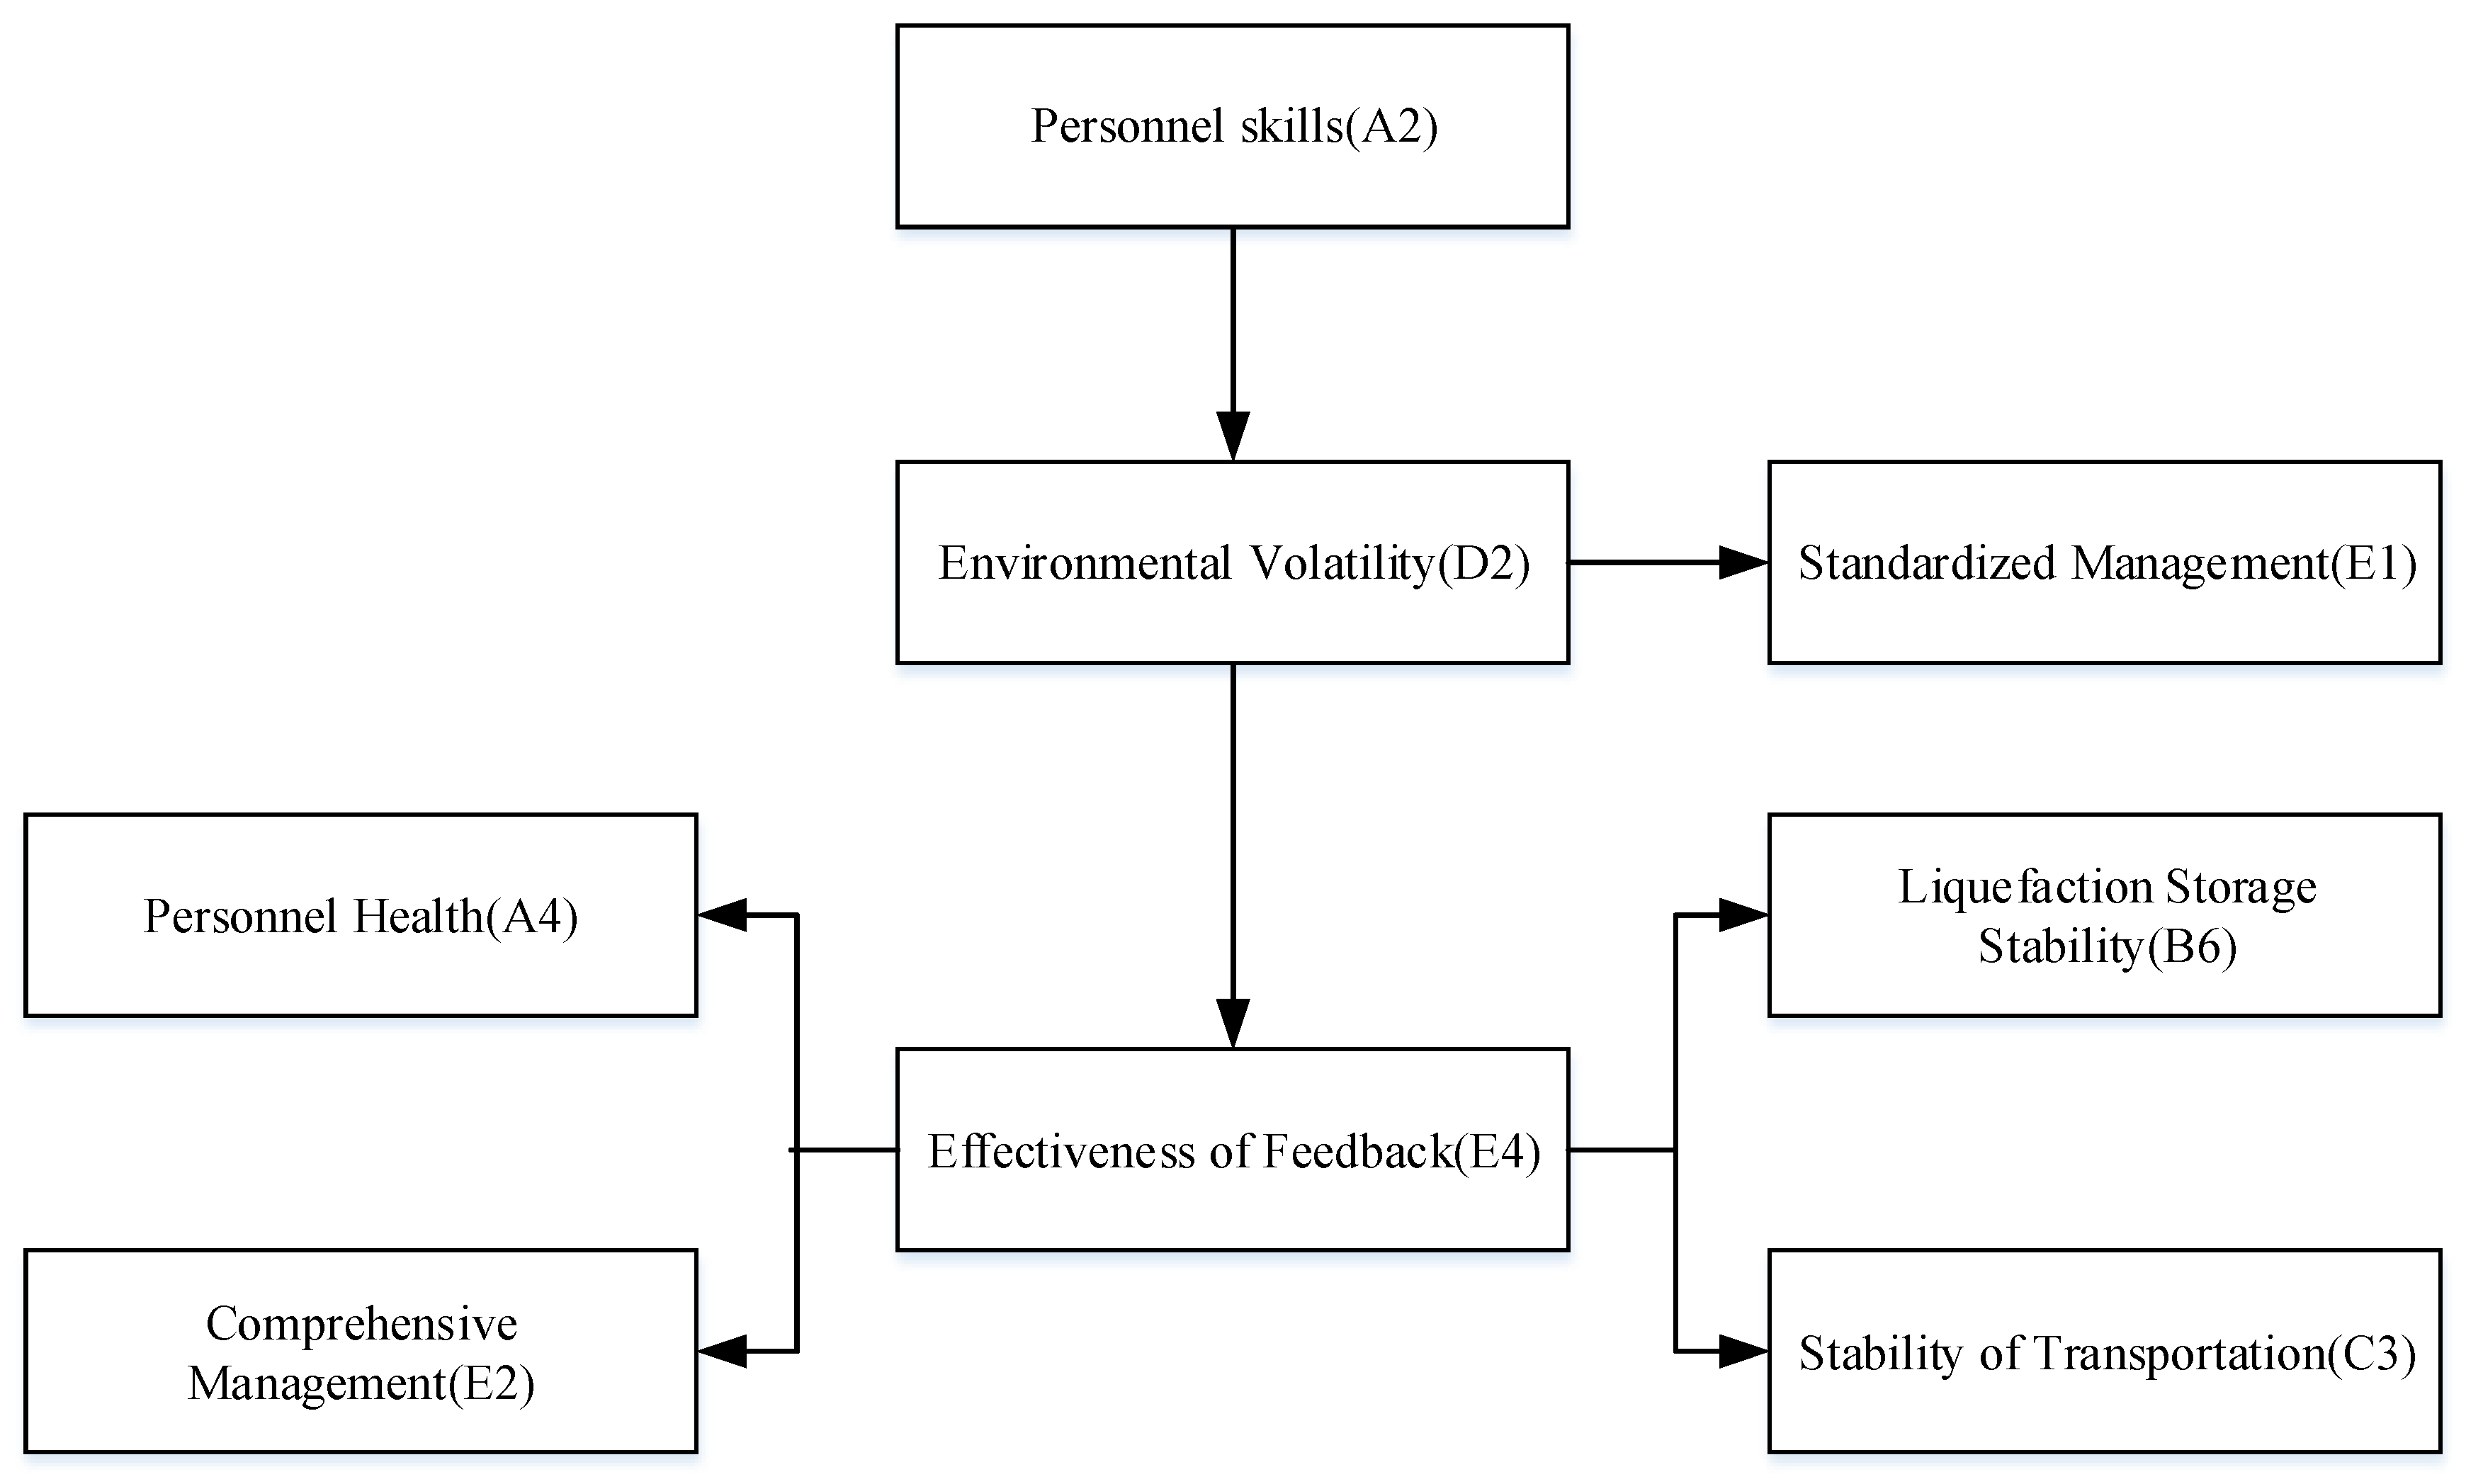
5.1. Causality between Critical Factors
5.2. Managerial Implications
- (1)
- The risk weight of personnel skills (A2) was 0.0880, the rank of A2 was first, and was a root driving factor. A2 was part of people-related risks and formed the most important risk factor. This is because the human operators involved in the supply chain for hydrogen energy are sometimes not trained appropriately, are unfamiliar with the characteristics of hydrogen energy, and cannot deal with emergencies. This result is consistent with that of Zheng et al., who evaluated risk factors for typical hydrogen storage processes in China [45]. Le et al. reached a similar conclusion when studying integrated technical frameworks for safety information of hydrogen energy storage [46]. Furthermore, our study explicitly demonstrates that AI and big data technology can be integrated into the process to assist in decision making in case of emergencies [47]. This can reduce the risks caused by differences in the quality of operators.
- (2)
- Environmental volatility (D2) is part of environmental risk, the risk weight of D2 is 0.0726, the rank of D2 is third, and it is also a driving factor for E4 and E1. The results here showed that the security of the storage and transportation of hydrogen energy depend on the stability of the environment and the process. Kim [13] and Zhang [17], respectively, proved the impact of external temperature and pressure on RSTHs, and Lam et al. [15] proved that the performance of the complicated environmental volatility is a critical risk factor. However, the solution to the D2 is generally based on the control of static storage environment volatility, and few studies have been conducted to deal with dynamic environment volatility. In practice, with the development of hydrogen energy commercialization, more and more hydrogen energy will be in a dynamic transportation environment. This paper proposes that the logistics network for hydrogen energy needs to be redesigned and segmented transportation should be used to reduce the risk due to D2. Large-scale centralized transportation is needed between cities, and small-scale and high frequency distribution is needed within them.
- (3)
- Effectiveness of feedback (E4) is part of management-related risk. The risk weight of E4 is 0.0757, the rank of E4 is second, and it is also a driving factor for A4, B6, E2, C3. Most previous studies focused on the breakthrough of feedback technologies [48,49]. Dynamic path scheduling in combination with the GIS, GPS, and AI; and site selection based on the characteristics of hydrogen energy storage; and monitoring and providing an early warning of surrounding hazardous sources by using IOT-based sensing equipment were proved to be crucial for reducing the risk of E4 [50]. However, ignoring the guiding role of the RSTH management will lead to the role of the technology being greatly reduced. Enterprises are used to attending to safety issues rather than the supply chain [51]. Supply chain management for hydrogen energy is invariably fragmented owing to the large number of personnel and conversion of equipment during storage and transportation [52]. Therefore, risk control measures are needed from the perspective of integrating the supply chain, including improving safety standards for urban hydrogen energy, using information technology to ensure that the responsibility for charging stations in the supply chain is clear and the RSTHs can be traced, and unifying the online management of the equipment and sites used for the storage and transportation of hydrogen energy [17].
- (4)
- Some risk factors are related to key technologies and are not easy to address in a short time. this finding is consistent with that of Mufachi [53] and Pugazhendhi [54]. Furthermore, it is proved that the technology and the mode of operation used must match each other in RSTH management; otherwise, the short board effect occurs [17]. This paper clarifies the responsibilities of the subjects in the hydrogen energy supply chain and designs the strategies to strengthen management cooperation. One effective solution is for technology suppliers to undertake liability for operational management because their professional knowledge of hydrogen energy is conducive to addressing vulnerabilities in management. At the same time, an incentive mechanism should be designed to ensure the enthusiasm of the technicians involved in supply chain management.
6. Conclusions
Author Contributions
Funding
Institutional Review Board Statement
Informed Consent Statement
Data Availability Statement
Acknowledgments
Conflicts of Interest
Appendix A

| A1 | A2 | A3 | A4 | B1 | B2 | B3 | B4 | B5 | B6 | C1 | C2 | C3 | D1 | D2 | D3 | E1 | E2 | E3 | E4 | |
|---|---|---|---|---|---|---|---|---|---|---|---|---|---|---|---|---|---|---|---|---|
| A1 | 0 | 1 | 0 | 0 | 0 | 0 | 0 | 0 | 2 | 1 | 0 | 1 | 2 | 2 | 0 | 0 | 1 | 1 | 0 | 1 |
| A2 | 0 | 0 | 1 | 0 | 0 | 1 | 0 | 0 | 1 | 0 | 0 | 1 | 1 | 1 | 1 | 0 | 1 | 1 | 1 | 1 |
| A3 | 0 | 0 | 0 | 2 | 0 | 0 | 0 | 0 | 0 | 0 | 0 | 0 | 1 | 1 | 0 | 0 | 1 | 1 | 1 | 1 |
| A4 | 1 | 1 | 0 | 0 | 0 | 0 | 0 | 2 | 1 | 0 | 0 | 1 | 1 | 1 | 0 | 0 | 1 | 1 | 1 | 0 |
| B1 | 0 | 0 | 0 | 2 | 0 | 0 | 2 | 0 | 0 | 2 | 0 | 1 | 2 | 0 | 0 | 0 | 1 | 0 | 0 | 1 |
| B2 | 0 | 0 | 0 | 1 | 1 | 0 | 0 | 1 | 2 | 1 | 0 | 1 | 2 | 0 | 0 | 0 | 0 | 0 | 1 | 0 |
| B3 | 0 | 0 | 0 | 2 | 0 | 0 | 0 | 0 | 1 | 1 | 0 | 0 | 2 | 0 | 2 | 1 | 0 | 0 | 2 | 1 |
| B4 | 0 | 0 | 0 | 2 | 1 | 2 | 1 | 0 | 2 | 1 | 0 | 0 | 1 | 0 | 1 | 0 | 1 | 0 | 1 | 0 |
| B5 | 0 | 0 | 0 | 1 | 2 | 1 | 2 | 0 | 0 | 1 | 0 | 0 | 1 | 0 | 1 | 0 | 0 | 0 | 1 | 1 |
| B6 | 0 | 0 | 0 | 2 | 1 | 1 | 2 | 1 | 0 | 0 | 0 | 0 | 1 | 1 | 0 | 2 | 1 | 1 | 1 | 1 |
| C1 | 0 | 0 | 0 | 0 | 0 | 0 | 0 | 0 | 0 | 0 | 0 | 1 | 1 | 0 | 0 | 0 | 0 | 0 | 0 | 0 |
| C2 | 0 | 0 | 0 | 1 | 0 | 0 | 1 | 0 | 0 | 0 | 0 | 0 | 2 | 1 | 1 | 1 | 0 | 0 | 0 | 0 |
| C3 | 0 | 0 | 0 | 0 | 0 | 1 | 1 | 1 | 1 | 0 | 0 | 2 | 0 | 1 | 2 | 0 | 3 | 2 | 4 | 2 |
| D1 | 0 | 0 | 0 | 0 | 0 | 0 | 1 | 0 | 0 | 1 | 0 | 1 | 2 | 0 | 1 | 0 | 0 | 0 | 0 | 0 |
| D2 | 0 | 0 | 0 | 0 | 0 | 0 | 2 | 1 | 1 | 2 | 0 | 0 | 4 | 1 | 0 | 0 | 3 | 1 | 1 | 1 |
| D3 | 0 | 0 | 0 | 0 | 1 | 0 | 0 | 0 | 1 | 2 | 0 | 0 | 0 | 1 | 1 | 0 | 0 | 0 | 1 | 1 |
| E1 | 0 | 1 | 0 | 0 | 0 | 2 | 2 | 1 | 2 | 2 | 1 | 1 | 2 | 2 | 0 | 0 | 0 | 1 | 1 | 1 |
| E2 | 2 | 1 | 1 | 0 | 0 | 2 | 2 | 1 | 2 | 2 | 2 | 1 | 2 | 2 | 0 | 0 | 0 | 0 | 1 | 1 |
| E3 | 0 | 0 | 0 | 0 | 1 | 1 | 2 | 0 | 1 | 1 | 1 | 1 | 1 | 3 | 0 | 0 | 3 | 1 | 0 | 0 |
| E4 | 0 | 0 | 0 | 0 | 1 | 0 | 1 | 0 | 3 | 4 | 0 | 1 | 4 | 1 | 0 | 0 | 2 | 3 | 1 | 0 |
| A1 | A2 | A3 | A4 | B1 | B2 | B3 | B4 | B5 | B6 | C1 | C2 | C3 | D1 | D2 | D3 | E1 | E2 | E3 | E4 | |
|---|---|---|---|---|---|---|---|---|---|---|---|---|---|---|---|---|---|---|---|---|
| A1 | 0 | 0 | 0 | 0 | 0 | 0 | 2 | 0 | 1 | 0 | 0 | 0 | 1 | 2 | 0 | 0 | 1 | 1 | 2 | 2 |
| A2 | 0 | 0 | 1 | 0 | 0 | 0 | 1 | 1 | 2 | 0 | 0 | 2 | 1 | 2 | 1 | 0 | 1 | 1 | 1 | 1 |
| A3 | 1 | 1 | 0 | 2 | 0 | 0 | 0 | 0 | 0 | 0 | 0 | 0 | 1 | 1 | 0 | 0 | 1 | 1 | 1 | 1 |
| A4 | 2 | 1 | 0 | 0 | 0 | 0 | 0 | 2 | 1 | 0 | 0 | 1 | 2 | 1 | 0 | 0 | 1 | 1 | 2 | 0 |
| B1 | 0 | 0 | 0 | 2 | 0 | 0 | 2 | 0 | 0 | 1 | 0 | 1 | 2 | 0 | 0 | 0 | 1 | 0 | 0 | 1 |
| B2 | 0 | 0 | 0 | 1 | 1 | 0 | 0 | 1 | 2 | 1 | 0 | 1 | 2 | 0 | 0 | 0 | 0 | 0 | 1 | 0 |
| B3 | 0 | 0 | 0 | 1 | 0 | 0 | 0 | 0 | 1 | 1 | 0 | 0 | 2 | 0 | 1 | 1 | 0 | 0 | 1 | 1 |
| B4 | 0 | 0 | 0 | 2 | 1 | 2 | 1 | 0 | 2 | 1 | 0 | 0 | 1 | 0 | 1 | 0 | 1 | 0 | 1 | 0 |
| B5 | 0 | 0 | 0 | 1 | 2 | 1 | 2 | 0 | 0 | 1 | 0 | 0 | 2 | 0 | 1 | 0 | 0 | 0 | 1 | 1 |
| B6 | 0 | 0 | 0 | 1 | 1 | 3 | 3 | 2 | 0 | 0 | 0 | 0 | 1 | 2 | 0 | 3 | 1 | 2 | 1 | 1 |
| C1 | 0 | 0 | 0 | 0 | 0 | 0 | 0 | 0 | 0 | 0 | 0 | 1 | 1 | 0 | 0 | 0 | 1 | 0 | 0 | 0 |
| C2 | 0 | 0 | 0 | 1 | 0 | 0 | 2 | 0 | 0 | 0 | 0 | 0 | 1 | 1 | 1 | 1 | 0 | 0 | 0 | 0 |
| C3 | 0 | 0 | 0 | 1 | 0 | 1 | 2 | 0 | 0 | 1 | 0 | 1 | 0 | 2 | 3 | 0 | 3 | 3 | 3 | 1 |
| D1 | 0 | 0 | 0 | 0 | 0 | 0 | 1 | 0 | 0 | 1 | 0 | 2 | 1 | 0 | 1 | 0 | 0 | 0 | 0 | 0 |
| D2 | 0 | 0 | 0 | 0 | 0 | 0 | 3 | 1 | 1 | 2 | 0 | 0 | 3 | 1 | 0 | 0 | 3 | 2 | 2 | 2 |
| D3 | 0 | 0 | 0 | 0 | 2 | 0 | 0 | 0 | 1 | 2 | 0 | 0 | 0 | 1 | 1 | 0 | 0 | 0 | 1 | 1 |
| E1 | 2 | 1 | 0 | 0 | 0 | 2 | 2 | 1 | 1 | 2 | 2 | 1 | 1 | 2 | 0 | 0 | 0 | 1 | 1 | 1 |
| E2 | 3 | 1 | 1 | 0 | 0 | 2 | 2 | 1 | 2 | 2 | 2 | 1 | 2 | 1 | 0 | 0 | 0 | 0 | 1 | 1 |
| E3 | 0 | 0 | 0 | 0 | 1 | 1 | 2 | 0 | 1 | 1 | 1 | 1 | 1 | 3 | 0 | 0 | 2 | 1 | 0 | 0 |
| E4 | 0 | 0 | 0 | 0 | 1 | 0 | 1 | 0 | 3 | 3 | 0 | 1 | 3 | 1 | 0 | 0 | 2 | 3 | 1 | 0 |
| A1 | A2 | A3 | A4 | B1 | B2 | B3 | B4 | B5 | B6 | C1 | C2 | C3 | D1 | D2 | D3 | E1 | E2 | E3 | E4 | |
|---|---|---|---|---|---|---|---|---|---|---|---|---|---|---|---|---|---|---|---|---|
| A1 | 0 | 0 | 0 | 0 | 0 | 0 | 2 | 0 | 1 | 0 | 0 | 0 | 1 | 2 | 0 | 0 | 1 | 2 | 2 | 2 |
| A2 | 0 | 0 | 1 | 0 | 0 | 0 | 1 | 1 | 2 | 0 | 0 | 2 | 1 | 2 | 1 | 0 | 1 | 1 | 1 | 1 |
| A3 | 0 | 1 | 0 | 2 | 0 | 0 | 0 | 0 | 0 | 0 | 0 | 0 | 1 | 2 | 0 | 0 | 1 | 1 | 1 | 1 |
| A4 | 2 | 2 | 0 | 0 | 0 | 0 | 0 | 2 | 1 | 0 | 0 | 1 | 2 | 2 | 0 | 0 | 1 | 1 | 2 | 0 |
| B1 | 0 | 0 | 0 | 2 | 0 | 0 | 2 | 0 | 0 | 2 | 0 | 1 | 2 | 0 | 0 | 0 | 1 | 0 | 0 | 1 |
| B2 | 0 | 0 | 0 | 1 | 1 | 0 | 0 | 2 | 2 | 1 | 0 | 1 | 2 | 0 | 0 | 0 | 0 | 0 | 1 | 0 |
| B3 | 0 | 0 | 0 | 2 | 0 | 0 | 0 | 0 | 1 | 1 | 0 | 0 | 2 | 0 | 2 | 1 | 0 | 0 | 2 | 1 |
| B4 | 0 | 0 | 0 | 2 | 1 | 2 | 1 | 0 | 2 | 1 | 0 | 0 | 1 | 0 | 1 | 0 | 1 | 0 | 1 | 0 |
| B5 | 0 | 0 | 0 | 2 | 2 | 1 | 2 | 0 | 0 | 1 | 0 | 0 | 2 | 0 | 1 | 0 | 0 | 0 | 1 | 1 |
| B6 | 0 | 0 | 0 | 2 | 1 | 3 | 2 | 1 | 0 | 0 | 0 | 0 | 1 | 1 | 0 | 2 | 3 | 2 | 1 | 1 |
| C1 | 0 | 0 | 0 | 0 | 0 | 0 | 0 | 0 | 0 | 0 | 0 | 1 | 1 | 0 | 0 | 0 | 2 | 0 | 0 | 0 |
| C2 | 0 | 0 | 0 | 1 | 0 | 0 | 1 | 0 | 0 | 0 | 0 | 0 | 2 | 1 | 1 | 1 | 0 | 0 | 0 | 0 |
| C3 | 0 | 0 | 0 | 1 | 0 | 1 | 2 | 0 | 0 | 1 | 0 | 1 | 0 | 1 | 0 | 0 | 2 | 2 | 1 | 1 |
| D1 | 0 | 0 | 0 | 0 | 0 | 0 | 1 | 0 | 0 | 1 | 0 | 2 | 2 | 0 | 1 | 0 | 0 | 0 | 0 | 0 |
| D2 | 0 | 0 | 0 | 0 | 0 | 0 | 2 | 1 | 1 | 2 | 0 | 0 | 4 | 1 | 0 | 0 | 4 | 3 | 1 | 1 |
| D3 | 0 | 0 | 0 | 0 | 1 | 0 | 0 | 0 | 1 | 2 | 0 | 0 | 0 | 1 | 1 | 0 | 0 | 0 | 1 | 1 |
| E1 | 2 | 1 | 0 | 0 | 0 | 2 | 2 | 1 | 2 | 2 | 2 | 1 | 2 | 2 | 0 | 0 | 0 | 1 | 1 | 1 |
| E2 | 1 | 1 | 1 | 0 | 0 | 2 | 2 | 1 | 2 | 2 | 2 | 1 | 2 | 2 | 0 | 0 | 0 | 0 | 1 | 1 |
| E3 | 0 | 0 | 0 | 0 | 1 | 1 | 2 | 0 | 1 | 1 | 1 | 1 | 1 | 3 | 0 | 0 | 3 | 1 | 0 | 0 |
| E4 | 0 | 0 | 0 | 0 | 1 | 0 | 1 | 0 | 3 | 4 | 0 | 1 | 4 | 1 | 0 | 0 | 2 | 3 | 1 | 0 |
| A1 | A2 | A3 | A4 | B1 | B2 | B3 | B4 | B5 | B6 | C1 | C2 | C3 | D1 | D2 | D3 | E1 | E2 | E3 | E4 | |
|---|---|---|---|---|---|---|---|---|---|---|---|---|---|---|---|---|---|---|---|---|
| A1 | 0 | 1 | 0 | 0 | 0 | 0 | 0 | 0 | 2 | 1 | 0 | 1 | 2 | 2 | 0 | 0 | 1 | 1 | 0 | 1 |
| A2 | 0 | 0 | 1 | 0 | 0 | 1 | 0 | 0 | 1 | 0 | 0 | 1 | 1 | 1 | 1 | 0 | 1 | 1 | 1 | 1 |
| A3 | 1 | 1 | 0 | 2 | 0 | 0 | 0 | 0 | 0 | 0 | 0 | 0 | 1 | 1 | 0 | 0 | 1 | 1 | 1 | 1 |
| A4 | 1 | 1 | 0 | 0 | 0 | 0 | 0 | 2 | 1 | 0 | 0 | 1 | 1 | 1 | 0 | 0 | 1 | 1 | 1 | 0 |
| B1 | 0 | 0 | 0 | 2 | 0 | 0 | 2 | 0 | 0 | 2 | 0 | 1 | 2 | 0 | 0 | 0 | 1 | 0 | 0 | 1 |
| B2 | 0 | 0 | 0 | 1 | 1 | 0 | 0 | 1 | 2 | 1 | 0 | 1 | 2 | 0 | 0 | 0 | 0 | 0 | 1 | 0 |
| B3 | 0 | 0 | 0 | 2 | 0 | 0 | 0 | 0 | 1 | 1 | 0 | 0 | 2 | 0 | 2 | 1 | 0 | 0 | 2 | 1 |
| B4 | 0 | 0 | 0 | 2 | 1 | 2 | 1 | 0 | 2 | 1 | 0 | 0 | 1 | 0 | 1 | 0 | 1 | 0 | 1 | 0 |
| B5 | 0 | 0 | 0 | 1 | 2 | 1 | 2 | 0 | 0 | 1 | 0 | 0 | 1 | 0 | 1 | 0 | 0 | 0 | 1 | 1 |
| B6 | 0 | 0 | 0 | 2 | 1 | 2 | 2 | 1 | 0 | 0 | 0 | 0 | 1 | 1 | 0 | 2 | 2 | 1 | 1 | 1 |
| C1 | 0 | 0 | 0 | 0 | 0 | 0 | 0 | 0 | 0 | 0 | 0 | 1 | 1 | 0 | 0 | 0 | 0 | 0 | 0 | 0 |
| C2 | 0 | 0 | 0 | 1 | 0 | 0 | 1 | 0 | 0 | 0 | 0 | 0 | 2 | 1 | 1 | 1 | 0 | 0 | 0 | 0 |
| C3 | 0 | 0 | 0 | 0 | 0 | 1 | 1 | 1 | 1 | 0 | 0 | 2 | 0 | 1 | 2 | 0 | 2 | 2 | 3 | 2 |
| D1 | 0 | 0 | 0 | 0 | 0 | 0 | 1 | 0 | 0 | 1 | 0 | 1 | 2 | 0 | 1 | 0 | 0 | 0 | 0 | 0 |
| D2 | 0 | 0 | 0 | 0 | 0 | 0 | 2 | 1 | 1 | 2 | 0 | 0 | 4 | 1 | 0 | 0 | 3 | 1 | 1 | 1 |
| D3 | 0 | 0 | 0 | 0 | 1 | 0 | 0 | 0 | 1 | 2 | 0 | 0 | 0 | 1 | 1 | 0 | 0 | 0 | 1 | 1 |
| E1 | 0 | 1 | 0 | 0 | 0 | 2 | 2 | 1 | 2 | 2 | 1 | 1 | 2 | 2 | 0 | 0 | 0 | 1 | 1 | 1 |
| E2 | 2 | 1 | 1 | 0 | 0 | 1 | 3 | 1 | 2 | 2 | 2 | 1 | 2 | 2 | 0 | 0 | 0 | 0 | 1 | 1 |
| E3 | 0 | 0 | 0 | 0 | 1 | 1 | 2 | 0 | 1 | 1 | 1 | 1 | 1 | 3 | 0 | 0 | 3 | 1 | 0 | 0 |
| E4 | 0 | 0 | 0 | 0 | 1 | 0 | 1 | 0 | 3 | 4 | 0 | 1 | 4 | 1 | 0 | 0 | 2 | 3 | 1 | 0 |
| A1 | A2 | A3 | A4 | B1 | B2 | B3 | B4 | B5 | B6 | C1 | C2 | C3 | D1 | D2 | D3 | E1 | E2 | E3 | E4 | |
|---|---|---|---|---|---|---|---|---|---|---|---|---|---|---|---|---|---|---|---|---|
| A1 | 0 | 0 | 0 | 0 | 0 | 0 | 2 | 0 | 1 | 0 | 0 | 0 | 1 | 2 | 0 | 0 | 1 | 1 | 2 | 2 |
| A2 | 0 | 0 | 1 | 0 | 0 | 0 | 1 | 1 | 2 | 0 | 0 | 2 | 1 | 2 | 1 | 0 | 1 | 1 | 1 | 1 |
| A3 | 1 | 1 | 0 | 2 | 0 | 0 | 0 | 0 | 0 | 0 | 0 | 0 | 1 | 1 | 0 | 0 | 1 | 1 | 1 | 1 |
| A4 | 2 | 1 | 0 | 0 | 0 | 0 | 0 | 2 | 1 | 0 | 0 | 1 | 2 | 1 | 0 | 0 | 1 | 1 | 2 | 0 |
| B1 | 0 | 0 | 0 | 2 | 0 | 0 | 2 | 0 | 0 | 1 | 0 | 1 | 2 | 0 | 0 | 0 | 1 | 0 | 0 | 1 |
| B2 | 0 | 0 | 0 | 1 | 1 | 0 | 0 | 1 | 2 | 1 | 0 | 1 | 2 | 0 | 0 | 0 | 0 | 0 | 1 | 0 |
| B3 | 0 | 0 | 0 | 1 | 0 | 0 | 0 | 0 | 1 | 1 | 0 | 0 | 2 | 0 | 1 | 1 | 0 | 0 | 1 | 1 |
| B4 | 0 | 0 | 0 | 2 | 1 | 2 | 1 | 0 | 2 | 1 | 0 | 0 | 1 | 0 | 1 | 0 | 1 | 0 | 1 | 0 |
| B5 | 0 | 0 | 0 | 1 | 2 | 1 | 2 | 0 | 0 | 1 | 0 | 0 | 2 | 0 | 1 | 0 | 0 | 0 | 1 | 1 |
| B6 | 0 | 0 | 0 | 1 | 1 | 3 | 3 | 2 | 0 | 0 | 0 | 0 | 1 | 2 | 0 | 3 | 1 | 2 | 1 | 1 |
| C1 | 0 | 0 | 0 | 0 | 0 | 0 | 0 | 0 | 0 | 0 | 0 | 1 | 1 | 0 | 0 | 0 | 1 | 0 | 0 | 0 |
| C2 | 0 | 0 | 0 | 1 | 0 | 0 | 2 | 0 | 0 | 0 | 0 | 0 | 1 | 1 | 1 | 1 | 0 | 0 | 0 | 0 |
| C3 | 0 | 0 | 0 | 1 | 0 | 1 | 2 | 0 | 0 | 1 | 0 | 1 | 0 | 2 | 2 | 0 | 3 | 2 | 2 | 1 |
| D1 | 0 | 0 | 0 | 0 | 0 | 0 | 1 | 0 | 0 | 1 | 0 | 2 | 1 | 0 | 1 | 0 | 0 | 0 | 0 | 0 |
| D2 | 0 | 0 | 0 | 0 | 0 | 0 | 3 | 1 | 1 | 2 | 0 | 0 | 3 | 1 | 0 | 0 | 3 | 2 | 2 | 2 |
| D3 | 0 | 0 | 0 | 0 | 1 | 0 | 0 | 0 | 1 | 2 | 0 | 0 | 0 | 1 | 1 | 0 | 0 | 0 | 1 | 1 |
| E1 | 2 | 1 | 0 | 0 | 0 | 2 | 2 | 1 | 1 | 2 | 2 | 1 | 1 | 2 | 0 | 0 | 0 | 1 | 1 | 1 |
| E2 | 2 | 1 | 1 | 0 | 0 | 3 | 1 | 1 | 2 | 2 | 2 | 1 | 2 | 1 | 0 | 0 | 0 | 0 | 1 | 1 |
| E3 | 0 | 0 | 0 | 0 | 1 | 1 | 2 | 0 | 1 | 1 | 1 | 1 | 1 | 3 | 0 | 0 | 2 | 1 | 0 | 0 |
| E4 | 0 | 0 | 0 | 0 | 1 | 0 | 1 | 0 | 3 | 3 | 0 | 1 | 3 | 1 | 0 | 0 | 2 | 3 | 1 | 0 |
| A1 | A2 | A3 | A4 | B1 | B2 | B3 | B4 | B5 | B6 | C1 | C2 | C3 | D1 | D2 | D3 | E1 | E2 | E3 | E4 | |
|---|---|---|---|---|---|---|---|---|---|---|---|---|---|---|---|---|---|---|---|---|
| A1 | 0.0000 | 0.0131 | 0.0000 | 0.0000 | 0.0000 | 0.0000 | 0.0392 | 0.0000 | 0.0458 | 0.0131 | 0.0000 | 0.0131 | 0.0458 | 0.0654 | 0.0000 | 0.0000 | 0.0327 | 0.0392 | 0.0392 | 0.0523 |
| A2 | 0.0000 | 0.0000 | 0.0327 | 0.0000 | 0.0000 | 0.0131 | 0.0196 | 0.0196 | 0.0523 | 0.0000 | 0.0000 | 0.0523 | 0.0327 | 0.0523 | 0.0327 | 0.0000 | 0.0327 | 0.0327 | 0.0327 | 0.0327 |
| A3 | 0.0196 | 0.0261 | 0.0000 | 0.0654 | 0.0000 | 0.0000 | 0.0000 | 0.0000 | 0.0000 | 0.0000 | 0.0000 | 0.0000 | 0.0327 | 0.0392 | 0.0000 | 0.0000 | 0.0327 | 0.0327 | 0.0327 | 0.0327 |
| A4 | 0.0523 | 0.0392 | 0.0000 | 0.0000 | 0.0000 | 0.0000 | 0.0000 | 0.0654 | 0.0327 | 0.0000 | 0.0000 | 0.0327 | 0.0523 | 0.0392 | 0.0000 | 0.0000 | 0.0327 | 0.0327 | 0.0523 | 0.0000 |
| B1 | 0.0000 | 0.0000 | 0.0000 | 0.0654 | 0.0000 | 0.0000 | 0.0654 | 0.0000 | 0.0000 | 0.0523 | 0.0000 | 0.0327 | 0.0654 | 0.0000 | 0.0000 | 0.0000 | 0.0327 | 0.0000 | 0.0000 | 0.0327 |
| B2 | 0.0000 | 0.0000 | 0.0000 | 0.0327 | 0.0327 | 0.0000 | 0.0000 | 0.0392 | 0.0654 | 0.0327 | 0.0000 | 0.0327 | 0.0654 | 0.0000 | 0.0000 | 0.0000 | 0.0000 | 0.0000 | 0.0327 | 0.0000 |
| B3 | 0.0000 | 0.0000 | 0.0000 | 0.0523 | 0.0000 | 0.0000 | 0.0000 | 0.0000 | 0.0327 | 0.0327 | 0.0000 | 0.0000 | 0.0654 | 0.0000 | 0.0523 | 0.0327 | 0.0000 | 0.0000 | 0.0523 | 0.0327 |
| B4 | 0.0000 | 0.0000 | 0.0000 | 0.0654 | 0.0327 | 0.0654 | 0.0327 | 0.0000 | 0.0654 | 0.0327 | 0.0000 | 0.0000 | 0.0327 | 0.0000 | 0.0327 | 0.0000 | 0.0327 | 0.0000 | 0.0327 | 0.0000 |
| B5 | 0.0000 | 0.0000 | 0.0000 | 0.0392 | 0.0654 | 0.0327 | 0.0654 | 0.0000 | 0.0000 | 0.0327 | 0.0000 | 0.0000 | 0.0523 | 0.0000 | 0.0327 | 0.0000 | 0.0000 | 0.0000 | 0.0327 | 0.0327 |
| B6 | 0.0000 | 0.0000 | 0.0000 | 0.0523 | 0.0327 | 0.0784 | 0.0784 | 0.0458 | 0.0000 | 0.0000 | 0.0000 | 0.0000 | 0.0327 | 0.0458 | 0.0000 | 0.0784 | 0.0523 | 0.0523 | 0.0327 | 0.0327 |
| C1 | 0.0000 | 0.0000 | 0.0000 | 0.0000 | 0.0000 | 0.0000 | 0.0000 | 0.0000 | 0.0000 | 0.0000 | 0.0000 | 0.0327 | 0.0327 | 0.0000 | 0.0000 | 0.0000 | 0.0261 | 0.0000 | 0.0000 | 0.0000 |
| C2 | 0.0000 | 0.0000 | 0.0000 | 0.0327 | 0.0000 | 0.0000 | 0.0458 | 0.0000 | 0.0000 | 0.0000 | 0.0000 | 0.0000 | 0.0523 | 0.0327 | 0.0327 | 0.0327 | 0.0000 | 0.0000 | 0.0000 | 0.0000 |
| C3 | 0.0000 | 0.0000 | 0.0000 | 0.0196 | 0.0000 | 0.0327 | 0.0523 | 0.0131 | 0.0131 | 0.0196 | 0.0000 | 0.0458 | 0.0000 | 0.0458 | 0.0588 | 0.0000 | 0.0850 | 0.0719 | 0.0850 | 0.0458 |
| D1 | 0.0000 | 0.0000 | 0.0000 | 0.0000 | 0.0000 | 0.0000 | 0.0327 | 0.0000 | 0.0000 | 0.0327 | 0.0000 | 0.0523 | 0.0523 | 0.0000 | 0.0327 | 0.0000 | 0.0000 | 0.0000 | 0.0000 | 0.0000 |
| D2 | 0.0000 | 0.0000 | 0.0000 | 0.0000 | 0.0000 | 0.0000 | 0.0784 | 0.0327 | 0.0327 | 0.0654 | 0.0000 | 0.0000 | 0.1176 | 0.0327 | 0.0000 | 0.0000 | 0.1046 | 0.0588 | 0.0458 | 0.0458 |
| D3 | 0.0000 | 0.0000 | 0.0000 | 0.0000 | 0.0392 | 0.0000 | 0.0000 | 0.0000 | 0.0327 | 0.0654 | 0.0000 | 0.0000 | 0.0000 | 0.0327 | 0.0327 | 0.0000 | 0.0000 | 0.0000 | 0.0327 | 0.0327 |
| E1 | 0.0392 | 0.0327 | 0.0000 | 0.0000 | 0.0000 | 0.0654 | 0.0654 | 0.0327 | 0.0523 | 0.0654 | 0.0523 | 0.0327 | 0.0523 | 0.0654 | 0.0000 | 0.0000 | 0.0000 | 0.0327 | 0.0327 | 0.0327 |
| E2 | 0.0654 | 0.0327 | 0.0327 | 0.0000 | 0.0000 | 0.0654 | 0.0654 | 0.0327 | 0.0654 | 0.0654 | 0.0654 | 0.0327 | 0.0654 | 0.0523 | 0.0000 | 0.0000 | 0.0000 | 0.0000 | 0.0327 | 0.0327 |
| E3 | 0.0000 | 0.0000 | 0.0000 | 0.0000 | 0.0327 | 0.0327 | 0.0654 | 0.0000 | 0.0327 | 0.0327 | 0.0327 | 0.0327 | 0.0327 | 0.0980 | 0.0000 | 0.0000 | 0.0850 | 0.0327 | 0.0000 | 0.0000 |
| E4 | 0.0000 | 0.0000 | 0.0000 | 0.0000 | 0.0327 | 0.0000 | 0.0327 | 0.0000 | 0.0980 | 0.1176 | 0.0000 | 0.0327 | 0.1176 | 0.0327 | 0.0000 | 0.0000 | 0.0654 | 0.0980 | 0.0327 | 0.0000 |
| A1 | A2 | A3 | A4 | B1 | B2 | B3 | B4 | B5 | B6 | C1 | C2 | C3 | D1 | D2 | D3 | E1 | E2 | E3 | E4 | |
|---|---|---|---|---|---|---|---|---|---|---|---|---|---|---|---|---|---|---|---|---|
| A1 | 0.0214 | 0.0710 | 0.0247 | 0.0178 | 0.0230 | 0.0242 | 0.0513 | 0.0177 | 0.0633 | 0.0356 | 0.0292 | 0.0411 | 0.0475 | 0.0782 | 0.0261 | 0.0220 | 0.0494 | 0.0663 | 0.0556 | 0.0864 |
| A2 | 0.0226 | 0.0214 | 0.3348 | 0.0223 | 0.0234 | 0.0401 | 0.0387 | 0.0556 | 0.0688 | 0.0243 | 0.0273 | 0.0878 | 0.0421 | 0.0673 | 0.0781 | 0.0205 | 0.0508 | 0.0583 | 0.0504 | 0.0625 |
| A3 | 0.0894 | 0.1326 | 0.0266 | 0.0942 | 0.0125 | 0.0180 | 0.0171 | 0.0214 | 0.0195 | 0.0173 | 0.0256 | 0.0229 | 0.0350 | 0.0549 | 0.0159 | 0.0097 | 0.0466 | 0.0562 | 0.0464 | 0.0563 |
| A4 | 0.1822 | 0.1787 | 0.0304 | 0.0200 | 0.0222 | 0.0278 | 0.0248 | 0.1398 | 0.0531 | 0.0203 | 0.0291 | 0.0655 | 0.0489 | 0.0591 | 0.0271 | 0.0154 | 0.0511 | 0.0566 | 0.0676 | 0.0219 |
| B1 | 0.0243 | 0.0235 | 0.0089 | 0.1047 | 0.0152 | 0.0211 | 0.0642 | 0.0256 | 0.0185 | 0.0604 | 0.0171 | 0.0598 | 0.0547 | 0.0201 | 0.0233 | 0.0330 | 0.0492 | 0.0244 | 0.0236 | 0.0601 |
| B2 | 0.0140 | 0.0132 | 0.0060 | 0.0651 | 0.0887 | 0.0217 | 0.0203 | 0.0908 | 0.0728 | 0.0414 | 0.0129 | 0.0573 | 0.0514 | 0.0165 | 0.0218 | 0.0205 | 0.0197 | 0.0173 | 0.0471 | 0.0168 |
| B3 | 0.0193 | 0.0180 | 0.0093 | 0.0833 | 0.0243 | 0.0214 | 0.0225 | 0.0242 | 0.0490 | 0.0484 | 0.0191 | 0.0196 | 0.0558 | 0.0234 | 0.1042 | 0.1248 | 0.0279 | 0.0273 | 0.0688 | 0.0618 |
| B4 | 0.0248 | 0.0242 | 0.0082 | 0.1099 | 0.0934 | 0.1065 | 0.0462 | 0.0311 | 0.0806 | 0.0481 | 0.0207 | 0.0219 | 0.0411 | 0.0207 | 0.0734 | 0.0234 | 0.0517 | 0.0218 | 0.0533 | 0.0219 |
| B5 | 0.0175 | 0.0164 | 0.0084 | 0.0755 | 0.1499 | 0.0603 | 0.0674 | 0.0241 | 0.0203 | 0.0492 | 0.0161 | 0.0214 | 0.0513 | 0.0196 | 0.0739 | 0.0269 | 0.0258 | 0.0246 | 0.0519 | 0.0627 |
| B6 | 0.0376 | 0.0336 | 0.0266 | 0.0988 | 0.0997 | 0.1311 | 0.0821 | 0.1198 | 0.0362 | 0.0359 | 0.0374 | 0.0324 | 0.0485 | 0.0677 | 0.0339 | 0.2778 | 0.0714 | 0.0828 | 0.0612 | 0.0691 |
| C1 | 0.0054 | 0.0055 | 0.0021 | 0.0043 | 0.0022 | 0.0059 | 0.0058 | 0.0048 | 0.0039 | 0.0043 | 0.0072 | 0.0466 | 0.0223 | 0.0060 | 0.0073 | 0.0061 | 0.0278 | 0.0058 | 0.0055 | 0.0051 |
| C2 | 0.0108 | 0.0102 | 0.0047 | 0.0519 | 0.0080 | 0.0086 | 0.0427 | 0.0129 | 0.0103 | 0.0122 | 0.0071 | 0.0119 | 0.0402 | 0.0391 | 0.0703 | 0.1160 | 0.0137 | 0.0133 | 0.0152 | 0.0134 |
| C3 | 0.0417 | 0.0366 | 0.0349 | 0.0514 | 0.0305 | 0.0792 | 0.0727 | 0.0597 | 0.0477 | 0.0535 | 0.0548 | 0.0904 | 0.0354 | 0.0752 | 0.1230 | 0.0347 | 0.1064 | 0.1107 | 0.1042 | 0.0866 |
| D1 | 0.0060 | 0.0053 | 0.0043 | 0.0125 | 0.0072 | 0.0112 | 0.0355 | 0.0117 | 0.0080 | 0.0361 | 0.0069 | 0.0743 | 0.0398 | 0.0111 | 0.0685 | 0.0225 | 0.0137 | 0.0135 | 0.0131 | 0.0126 |
| D2 | 0.0415 | 0.0370 | 0.0332 | 0.0343 | 0.0350 | 0.0500 | 0.0947 | 0.0981 | 0.0666 | 0.0926 | 0.0549 | 0.0371 | 0.0986 | 0.0663 | 0.0414 | 0.0455 | 0.1282 | 0.1049 | 0.0798 | 0.0953 |
| D3 | 0.0079 | 0.0070 | 0.0056 | 0.0167 | 0.0985 | 0.0174 | 0.0189 | 0.0154 | 0.0416 | 0.0704 | 0.0119 | 0.0136 | 0.0162 | 0.0423 | 0.0640 | 0.0255 | 0.0181 | 0.0175 | 0.0412 | 0.0559 |
| E1 | 0.1422 | 0.1512 | 0.0308 | 0.0339 | 0.0364 | 0.1169 | 0.0773 | 0.0911 | 0.0786 | 0.0829 | 0.1965 | 0.0744 | 0.0604 | 0.0849 | 0.0375 | 0.0431 | 0.0299 | 0.0656 | 0.0606 | 0.0710 |
| E2 | 0.2203 | 0.1531 | 0.3381 | 0.0378 | 0.0385 | 0.1161 | 0.0781 | 0.0903 | 0.0907 | 0.0826 | 0.2340 | 0.0749 | 0.0688 | 0.0761 | 0.0392 | 0.0432 | 0.0336 | 0.0340 | 0.0634 | 0.0745 |
| E3 | 0.0261 | 0.0241 | 0.0177 | 0.0255 | 0.0852 | 0.0686 | 0.0716 | 0.0245 | 0.0504 | 0.0518 | 0.1378 | 0.0691 | 0.0431 | 0.1051 | 0.0295 | 0.0323 | 0.0921 | 0.0547 | 0.0231 | 0.0240 |
| E4 | 0.0448 | 0.0374 | 0.0447 | 0.0401 | 0.1064 | 0.0539 | 0.0682 | 0.0415 | 0.1200 | 0.1326 | 0.0543 | 0.0777 | 0.0989 | 0.0665 | 0.0417 | 0.0572 | 0.0928 | 0.1444 | 0.0680 | 0.0420 |
References
- Dokhani, S.; Assadi, M.; Pollet, B.G. Techno-economic assessment of hydrogen production from seawater. Int. J. Hydrogen Energy 2022, in press. [Google Scholar] [CrossRef]
- Yang, Y.; Tong, L.; Yin, S.; Liu, Y.; Wang, L.; Qiu, Y.; Ding, Y. Status and challenges of applications and industry chain technologies of hydrogen in the context of carbon neutrality. J. Clean. Prod. 2022, 376, 134347. [Google Scholar] [CrossRef]
- Moon, S.; Kim, K.; Seung, H.; Kim, J. Strategic analysis on effects of technologies, government policies, and consumer perceptions on diffusion of hydrogen fuel cell vehicles. Energy Econ. 2022, 115, 106382. [Google Scholar] [CrossRef]
- Foorginezhad, S.; Mohseni-Dargah, M.; Falahati, Z.; Abbassi, R.; Razmjou, A.; Asadnia, M. Sensing advancement towards safety assessment of hydrogen fuel cell vehicles. J. Power Sources 2021, 489, 229450. [Google Scholar] [CrossRef]
- Hirayama, M.; Shinozaki, H.; Kasai, N.; Otaki, T. Comparative risk study of hydrogen and gasoline dispensers for vehicles. Int. J. Hydrogen Energy 2018, 43, 12584–12594. [Google Scholar] [CrossRef]
- Hirayama, M.; Ito, Y.; Kamada, H.; Kasai, N.; Otaki, T. Simplified approach to evaluating safety distances for hydrogen vehicle fuel dispensers. Int. J. Hydrogen Energy 2019, 44, 18639–18647. [Google Scholar] [CrossRef]
- Tsunemi, K.; Kihara, T.; Kato, E.; Kawamoto, A.; Saburi, T. Quantitative risk assessment of the interior of a hydrogen refueling station considering safety barrier systems. Int. J. Hydrogen Energy 2019, 44, 23522–23531. [Google Scholar] [CrossRef]
- Rasul, M.G.; Hazrat, M.A.; Sattar, M.A.; Jahirul, M.I.; Shearer, M.J. The future of hydrogen: Challenges on production, storage and applications. Energy Convers. Manag. 2022, 272, 116326. [Google Scholar] [CrossRef]
- Ono, K.; Kato, E.; Tsunemi, K. Construction of a structural equation model to identify public acceptance factors for hydrogen refueling stations under the provision of risk and safety information. Int. J. Hydrogen Energy 2022, 47, 31974–31984. [Google Scholar] [CrossRef]
- Chang, Y.; Zhang, C.; Shi, J.; Li, J.; Zhang, S.; Chen, G. Dynamic Bayesian network based approach for risk analysis of hydrogen generation unit leakage. Int. J. Hydrogen Energy 2019, 44, 26665–26678. [Google Scholar] [CrossRef]
- Hienuki, S.; Noguchi, K.; Shibutani, T.; Fuse, M.; Noguchi, H.; Miyake, A. Risk identification for the introduction of advanced science and technology: A case study of a hydrogen energy system for smooth social implementation. Int. J. Hydrogen Energy 2020, 45, 15027–15040. [Google Scholar] [CrossRef]
- Ono, K.; Tsunemi, K. Identification of public acceptance factors with risk perception scales on hydrogen fueling stations in Japan. Int. J. Hydrogen Energy 2017, 42, 10697–10707. [Google Scholar] [CrossRef]
- Kim, D.-H.; Lim, J.-Y.; Park, W.-I.; Joe, C.-H. Quantitative risk assessment of a mobile hydrogen refueling station in Korea. Int. J. Hydrogen Energy 2022, 47, 33541–33549. [Google Scholar] [CrossRef]
- Kawatsu, K.; Suzuki, T.; Shiota, K.; Izato, Y.-i.; Komori, M.; Sato, K.; Takai, Y.; Ninomiya, T.; Miyake, A. Dynamic physical model of Japanese hydrogen refueling stations for quantitative trade-off study between benefit and risk. Int. J. Hydrogen Energy 2022, in press. [Google Scholar] [CrossRef]
- Lam, C.Y.; Fuse, M.; Shimizu, T. Assessment of risk factors and effects in hydrogen logistics incidents from a network modeling perspective. Int. J. Hydrogen Energy 2019, 44, 20572–20586. [Google Scholar] [CrossRef]
- Li, X.; Han, Z.; Zhang, R.; Zhang, Y.; Zhang, L. Risk assessment of hydrogen generation unit considering dependencies using integrated DEMATEL and TOPSIS approach. Int. J. Hydrogen Energy 2020, 45, 29630–29642. [Google Scholar] [CrossRef]
- Zhang, L.B.; Hu, J.Q.; Zhang, X.Y.; Xiang, S.R. Research status and development trends of safety and emergency guarantee tech-nology for production, storage and transportation of hydrogen. Pet. Sci. Bull. 2021, 6, 167–180. [Google Scholar] [CrossRef]
- Moradi, R.; Groth, K.M. Hydrogen storage and delivery: Review of the state of the art technologies and risk and reliability analysis. Int. J. Hydrogen Energy 2019, 44, 12254–12269. [Google Scholar] [CrossRef]
- Fabiano, B.; Currò, F.; Palazzi, E.; Pastorino, R. A framework for risk assessment and decision-making strategies in dangerous good transportation. J. Hazard. Mater. 2002, 93, 1–15. [Google Scholar] [CrossRef]
- Fabiano, B.; Currò, F.; Reverberi, A.P.; Pastorino, R. Dangerous good transportation by road: From risk analysis to emergency planning. J. Loss Prev. Process Ind. 2005, 18, 403–413. [Google Scholar] [CrossRef]
- Guo, Y.; Meng, X.; Wang, D.; Meng, T.; Liu, S.; He, R. Comprehensive risk evaluation of long-distance oil and gas transportation pipelines using a fuzzy Petri net model. J. Nat. Gas Sci. Eng. 2016, 33, 18–29. [Google Scholar] [CrossRef]
- Guo, J.; Luo, C. Risk assessment of hazardous materials transportation: A review of research progress in the last thirty years. J. Traffic Transp. Eng. 2022, 9, 571–590. [Google Scholar] [CrossRef]
- Pasman, H.J.; Rogers, W.J. Risk assessment by means of Bayesian networks: A comparative study of compressed and liquefied H2 transportation and tank station risks. Int. J. Hydrogen Energy 2012, 37, 17415–17425. [Google Scholar] [CrossRef]
- Correa-Jullian, C.; Groth, K.M. Data requirements for improving the Quantitative Risk Assessment of liquid hydrogen storage systems. Int. J. Hydrogen Energy 2022, 47, 4222–4235. [Google Scholar] [CrossRef]
- Yoo, B.-H.; Wilailak, S.; Bae, S.-H.; Gye, H.-R.; Lee, C.-J. Comparative risk assessment of liquefied and gaseous hydrogen refueling stations. Int. J. Hydrogen Energy 2021, 46, 35511–35524. [Google Scholar] [CrossRef]
- Lee, Y.; Lee, U.; Kim, K. A comparative techno-economic and quantitative risk analysis of hydrogen delivery infrastructure options. Int. J. Hydrogen Energy 2021, 46, 14857–14870. [Google Scholar] [CrossRef]
- Viana, F.F.C.L.; Alencar, M.H.; Ferreira, R.J.P.; De Almeida, A.T. Multidimensional risk assessment and categorization of hydrogen pipelines. Int. J. Hydrogen Energy 2022, 47, 18424–18440. [Google Scholar] [CrossRef]
- Castiglia, F.; Giardina, M. Analysis of operator human errors in hydrogen refuelling stations: Comparison between human rate assessment techniques. Int. J. Hydrogen Energy 2013, 38, 1166–1176. [Google Scholar] [CrossRef]
- Lee, C.-Y.; Shen, C.-C.; Lee, S.-J.; Chiu, C.-W.; Lin, H.-T. Real-time microscopic monitoring of temperature and strain on the surface of magnesium hydrogen storage tank by high temperature resistant flexible integrated microsensor. Int. J. Hydrogen Energy 2022, 47, 12815–12821. [Google Scholar] [CrossRef]
- Davies, P.A.; Lees, F.P. The assessment of major hazards: The road transport environment for conveyance of hazardous materials in Great Britain. J. Hazard. Mater. 1992, 32, 41–79. [Google Scholar] [CrossRef]
- Erkut, E.; Tjandra, S.A.; Verter, V. Chapter 9 Hazardous Materials Transportation. In Handbooks in Operations Research and Management Science; Barnhart, C., Laporte, G., Eds.; Elsevier: Amsterdam, The Netherlands, 2007; Volume 14, pp. 539–621. [Google Scholar] [CrossRef]
- Current, J.; Ratick, S. A model to assess risk, equity and efficiency in facility location and transportation of hazardous materials. Locat. Sci. 1995, 3, 187–201. [Google Scholar] [CrossRef]
- Leonelli, P.; Bonvicini, S.; Spadoni, G. New detailed numerical procedures for calculating risk measures in hazardous materials transportation. J. Loss Prev. Process Ind. 1999, 12, 507–515. [Google Scholar] [CrossRef]
- Mouli-Castillo, J.; Haszeldine, S.R.; Kinsella, K.; Wheeldon, M.; McIntosh, A. A quantitative risk assessment of a domestic property connected to a hydrogen distribution network. Int. J. Hydrogen Energy 2021, 46, 16217–16231. [Google Scholar] [CrossRef]
- Alencar, M.H.; de Almeida, A.T. Assigning priorities to actions in a pipeline transporting hydrogen based on a multicriteria decision model. Int. J. Hydrogen Energy 2010, 35, 3610–3619. [Google Scholar] [CrossRef]
- OuYang, Y.-P.; Shieh, H.-M.; Tzeng, G.-H. A VIKOR technique based on DEMATEL and ANP for information security risk control assessment. Inf. Sci. 2013, 232, 482–500. [Google Scholar] [CrossRef]
- Wu, Y.; Chu, H.; Xu, C. Risk assessment of wind-photovoltaic-hydrogen storage projects using an improved fuzzy synthetic evaluation approach based on cloud model: A case study in China. J. Energy Storage 2021, 38, 102580. [Google Scholar] [CrossRef]
- Wang, W.; Dong, C.; Dong, W.; Yang, C.; Ju, T.; Huang, L.; Ren, Z. The design and implementation of risk assessment model for hazard installations based on AHP–FCE method: A case study of Nansi Lake Basin. Ecol. Inform. 2016, 36, 162–171. [Google Scholar] [CrossRef]
- Othman, M.K.; Abdul Rahman, N.S.F.; Ismail, A.; Saharuddin, A.H. Factors contributing to the imbalances of cargo flows in Malaysia large-scale minor ports using a fuzzy analytical hierarchy process (FAHP) approach. Asian J. Shipp. Logist. 2020, 36, 113–126. [Google Scholar] [CrossRef]
- Ouyang, Y.-P.; Shieh, H.-M.; Leu, J.-D.; Tzeng, G.-H. A novel hybrid MCDM model combined with DEMATEL and ANP with applications. Int. J. Oper. Res 2008, 5, 160–168. [Google Scholar]
- Mubarik, M.S.; Kazmi, S.H.A.; Zaman, S.I. Application of gray DEMATEL-ANP in green-strategic sourcing. Technol. Soc. 2021, 64, 101524. [Google Scholar] [CrossRef]
- Zhang, Q.; Wang, X.P. The comparison of some f fuzzy operators used in fuzzy comprehensive evaluation Models. Fuzzy Syst. Math. 2016, 30, 165–171. [Google Scholar]
- Jiang, P.; Wang, Y.; Liu, C.; Hu, Y.-C.; Xie, J. Evaluating Critical Factors Influencing the Reliability of Emergency Logistics Systems Using Multiple-Attribute Decision Making. Symmetry 2020, 12, 1115. [Google Scholar] [CrossRef]
- He, S.; Xu, H.; Zhang, J.; Xue, P. Risk assessment of oil and gas pipelines hot work based on AHP-FCE. Petroleum 2022, in press. [Google Scholar] [CrossRef]
- Zheng, J.Y.; Kai, F.M.; Liu, Z.Q.; Chen, R.; Chen, C.P. Risk assessment and control of high pressure hydrogen equipment. Acta Energ. Sol. Sin. 2006, 27, 1168–1174. [Google Scholar]
- Le, S.T.; Nguyen, T.N.; Linforth, S.; Ngo, T.D. Safety investigation of hydrogen energy storage systems using quantitative risk assessment. Int. J. Hydrogen Energy 2022, in press. [Google Scholar] [CrossRef]
- Li, J.; Herdem, M.S.; Nathwani, J.; Wen, J.Z. Methods and applications for Artificial Intelligence, Big Data, Internet of Things, and Blockchain in smart energy management. Energy AI 2023, 11, 100208. [Google Scholar] [CrossRef]
- Karipoğlu, F.; Serdar Genç, M.; Akarsu, B. GIS-based optimal site selection for the solar-powered hydrogen fuel charge stations. Fuel 2022, 324, 124626. [Google Scholar] [CrossRef]
- Chen, J.; Zhang, Q.; Xu, N.; Li, W.; Yao, Y.; Li, P.; Yu, Q.; Wen, C.; Song, X.; Shibasaki, R.; et al. Roadmap to hydrogen society of Tokyo: Locating priority of hydrogen facilities based on multiple big data fusion. Appl. Energy 2022, 313, 118688. [Google Scholar] [CrossRef]
- Wang, W.B. Development status and application prospect of hydrogen energy. J. Yuncheng Univ. 2006, 24, 47–48. [Google Scholar]
- Mani, V.; Jabbour, C.J.C.; Mani, K.T.N. Supply chain social sustainability in small and medium manufacturing enterprises and firms’ performance: Empirical evidence from an emerging Asian economy. Int. J. Prod. Econ. 2020, 227, 107656. [Google Scholar] [CrossRef]
- Widera, B. Renewable hydrogen implementations for combined energy storage, transportation and stationary applications. Therm. Sci. Eng. Prog. 2020, 16, 100460. [Google Scholar] [CrossRef]
- Al-Mufachi, N.A.; Shah, N. The role of hydrogen and fuel cell technology in providing security for the UK energy system. Energy Policy 2022, 171, 113286. [Google Scholar] [CrossRef]
- Pugazhendhi, A.; Chen, W.-H. Hydrogen energy technology for future. Int. J. Hydrogen Energy 2022, 47, 37153. [Google Scholar] [CrossRef]
- Schönauer, A.-L.; Glanz, S. Hydrogen in future energy systems: Social acceptance of the technology and its large-scale infrastructure. Int. J. Hydrogen Energy 2022, 47, 12251–12263. [Google Scholar] [CrossRef]
- Razzhivin, I.A.; Rudnik, V.E.; Bay, Y.D.; Kievec, A.V. Coordinated control of a hybrid type 3 wind turbine and hydrogen energy storage model to provide efficient frequency control. Int. J. Hydrogen Energy 2022, 47, 35947–35958. [Google Scholar] [CrossRef]
- Choi, J.; Choi, D.G.; Park, S.Y. Analysis of effects of the hydrogen supply chain on the Korean energy system. Int. J. Hydrogen Energy 2022, 47, 21908–21922. [Google Scholar] [CrossRef]
- Meng, X.Y.; Chen, M.Y.; Gu, A.L.; Wu, X.G.; Liu, B.; Zhou, J.; Mao, Z.Q. China’s hydrogen development strategy in the context of double carbon targets. Nat. Gas Ind. 2022, 42, 156–179. [Google Scholar] [CrossRef]


| Risk Category | Risk Factor | Risk Description | Reference |
|---|---|---|---|
| People-related Risk | Incorrect Operation | Human error; incorrect usage; illegal operation. | [15,16] |
| Carelessness | Not being careful leads to problems. | [16] | |
| Lack of Expertise | Lack of relevant operational experience leads to operation problems. | [16] | |
| Storage Risk | Equipment Cracking | Damage to equipment; cracked equipment case; deformation of equipment; high pressure affects the equipment and leads to penetration of hydrogen. | [13,15] |
| Equipment Failure | Equipment malfunction; equipment fails to work; equipment not working as expected. | [15] | |
| Material Fatigue | Material aging; the storage system requires repeated loading of hydrogen, which has stringent requirements on the fatigue life of the container, but the fatigue resistance of the metal tank is inadequate. | [17,18,21] | |
| Liner Corrosion and Hydrogen Embrittlement | Corrosion and hydrogen-induced embrittlement of materials or connection tube; once hydrogen-induced embrittlement occurs, the safety of the storage cylinder is compromised, leading to hydrogen leakage. | [15,17,18,21] | |
| Frequent Filling of Equipment | Repeated use of hydrogen storage tank produces subtle cracks or knock friction, causing it to easily explode. | [17] | |
| Combination of Gases | During hydrogen canning, impurities such as hydrogen with slightly higher oxygen content remain in the storage tank. If the residual gas is not checked in time, the purity of hydrogen in the storage tank decreases, resulting in the formation of flammable mixed gas. | [17] | |
| Transportation Risk | Vehicular Collision | Transportation accidents. | [15] |
| Environmental Risk | Weather | Heavy rain; earthquake; thunder strike; flood; mudslide. | [15,16,19,20,33] |
| Hyperbaric Environment | After long-term exposure to high-pressure hydrogen, the antihydrogen brittleness energy of high-strength steel decreases with increasing strength, resulting in a decrease in its local plasticity and the acceleration of crack propagation. | [17] | |
| Temperature | Once the surrounding insulation layer has been destroyed and the ambient temperature has increased, liquefied hydrogen inside the storage container is rapidly vaporized, creating an instant strong pressure and explosion. | [17] | |
| Road Conditions | Tunnels; radii of bending; height gradient; slope; frequency of trucks; dangerous goods’ trucks. | [19,20] | |
| Depth of the Pipeline | In the process of hydrogen transportation in a pipeline, if the pipeline is shallow, it is easily damaged. | [21] | |
| Soil Movement | If the soil moves during the transportation of hydrogen in a pipeline, the pipeline is damaged. | [21,23] | |
| Management Risk | Unclear Instructions | Lack of safety instructions; warning labels missing. | [15] |
| Insufficient Safety Training | The lack of safety training leads to poor safety awareness among operators. | [16] | |
| Incorrect Maintenance Schedule | Maintenance of equipment is not performed as required. | [16,21] | |
| Deficient Operational Duties | Unclear powers and responsibilities. | [16] | |
| Decision Errors | Incorrect commands by managers. | [16] |
| Expert | Organization | Position | Duties | Seniority (yr) |
|---|---|---|---|---|
| A | Traffic Detachment of Municipal Public Security Bureau | Division marshal | Handle safety accidents | 21 |
| B | City business bureau | Deputy director | Implement and investigate safety management laws and regulations | 20 |
| C | A hydrogen energy technology and equipment company | Technical director | Hydrogen energy storage and transportation technology management | 18 |
| D | A new energy technology research Institute | Senior Research Fellow | Risk assessment and safety assurance for hydrogen facilities | 16 |
| E | An international testing group | Technical director | Safety design and risk assessment in hazardous situations | 10 |
| Aspect | Criteria | Explanation |
|---|---|---|
| People-related Risk (A) | Personnel Awareness (A1) | Risk in operational activities is caused by a lack of awareness of personnel. |
| Personnel Skills (A2) | Risk in operational activities is caused by limited technical competence of personnel. | |
| Personnel Emotions (A3) | Personnel are at risk in operational activities owing to psychological and emotional fluctuations. | |
| Personnel Health (A4) | Risk in operational activities is caused by the poor physical health of personnel. | |
| Storage Risk (B) | Equipment Liner Corrosion and Hydrogen-induced Embrittlement (B1) | When the stored hydrogen contains impurities, corrosion is more serious. Once hydrogen-induced embrittlement occurs, the safety of the storage cylinder decreases, leading to leakage. |
| Equipment Fatigue (B2) | The storage system requires repeated loading of hydrogen, which has stringent requirements on the fatigue life of the container, but the fatigue resistance of the metal tank is inadequate. | |
| Penetration (B3) | Hydrogen permeation is a problem in composite containers with metal tanks under high pressure. | |
| Frequent Filling of Equipment (B4) | Repeated use of the hydrogen storage tank produces subtle cracks or knock friction, making it easy to explode. | |
| Combination of Gases (B5) | During the canning of hydrogen, such impurities as hydrogen with slightly higher oxygen content remain in the storage tank. If the residual gas is not checked in time, hydrogen in the storage tank becomes impure and this can lead to the formation of flammable mixed gas. | |
| Liquefaction Storage Stability (B6) | Once the surrounding insulation layer has been destroyed and the ambient temperature increased, liquefied hydrogen inside the storage container is vaporized rapidly to create an instant strong pressure and explosion. | |
| Transportation Risk (C) | Deficiency of Transportation Equipment (C1) | Serious accidents may be caused due to design, manufacturing, installation and other reasons of transportation tools. |
| Transport Equipment Failure (C2) | This is the risk of a sudden loss of a prescribed functioning condition of a conveyance. | |
| Stability of Transportation (C3) | Inevitable movements occur in in the normal operation of the transportation vehicle that must be controlled. | |
| Environmental Risk (D) | Accuracy of Environmental Information (D1) | Inaccurate information is obtained regarding storage and transportation due to problems with personnel, tools, and equipment. |
| Environmental Volatility (D2) | This is uncertainty in the risk of hydrogen storage and transportation caused by environmental fluctuations and changes in the process. | |
| Hyperbaric Environment (D3) | After long-term exposure to high pressure hydrogen, the antihydrogen brittleness energy of high-strength steel decreases with increasing pressure, resulting in a decrease in its local plasticity and the acceleration of crack propagation. | |
| Management Risk (E) | Standardized Management (E1) | The process of hydrogen storage and transportation is relatively standardized. |
| Comprehensive Management (E2) | Comprehensively manage the plan, equipment, testing personnel, and tools for hydrogen storage and transportation process. | |
| Dynamic Monitoring (E3) | The personnel, vehicles, environment, and equipment are tested during storage and transportation. | |
| Effectiveness of Feedback (E4) | Timely feedback regarding problems identified by monitoring can prevent accidents during storage and transportation. |
| A1 | A2 | A3 | A4 | B1 | B2 | B3 | B4 | B5 | B6 | C1 | C2 | C3 | D1 | D2 | D3 | E1 | E2 | E3 | E4 | |
|---|---|---|---|---|---|---|---|---|---|---|---|---|---|---|---|---|---|---|---|---|
| A1 | 0.0000 | 0.4000 | 0.0000 | 0.0000 | 0.0000 | 0.0000 | 1.2000 | 0.0000 | 1.4000 | 0.4000 | 0.0000 | 0.4000 | 1.4000 | 2.0000 | 0.0000 | 0.0000 | 1.0000 | 1.2000 | 1.2000 | 1.6000 |
| A2 | 0.0000 | 0.0000 | 1.0000 | 0.0000 | 0.0000 | 0.4000 | 0.6000 | 0.6000 | 1.6000 | 0.0000 | 0.0000 | 1.6000 | 1.0000 | 1.6000 | 1.0000 | 0.0000 | 1.0000 | 1.0000 | 1.0000 | 1.0000 |
| A3 | 0.6000 | 0.8000 | 0.0000 | 2.0000 | 0.0000 | 0.0000 | 0.0000 | 0.0000 | 0.0000 | 0.0000 | 0.0000 | 0.0000 | 1.0000 | 1.2000 | 0.0000 | 0.0000 | 1.0000 | 1.0000 | 1.0000 | 1.0000 |
| A4 | 1.6000 | 1.2000 | 0.0000 | 0.0000 | 0.0000 | 0.0000 | 0.0000 | 2.0000 | 1.0000 | 0.0000 | 0.0000 | 1.0000 | 1.6000 | 1.2000 | 0.0000 | 0.0000 | 1.0000 | 1.0000 | 1.6000 | 0.0000 |
| B1 | 0.0000 | 0.0000 | 0.0000 | 2.0000 | 0.0000 | 0.0000 | 2.0000 | 0.0000 | 0.0000 | 1.6000 | 0.0000 | 1.0000 | 2.0000 | 0.0000 | 0.0000 | 0.0000 | 1.0000 | 0.0000 | 0.0000 | 1.0000 |
| B2 | 0.0000 | 0.0000 | 0.0000 | 1.0000 | 1.0000 | 0.0000 | 0.0000 | 1.2000 | 2.0000 | 1.0000 | 0.0000 | 1.0000 | 2.0000 | 0.0000 | 0.0000 | 0.0000 | 0.0000 | 0.0000 | 1.0000 | 0.0000 |
| B3 | 0.0000 | 0.0000 | 0.0000 | 1.6000 | 0.0000 | 0.0000 | 0.0000 | 0.0000 | 1.0000 | 1.0000 | 0.0000 | 0.0000 | 2.0000 | 0.0000 | 1.6000 | 1.0000 | 0.0000 | 0.0000 | 1.6000 | 1.0000 |
| B4 | 0.0000 | 0.0000 | 0.0000 | 2.0000 | 1.0000 | 2.0000 | 1.0000 | 0.0000 | 2.0000 | 1.0000 | 0.0000 | 0.0000 | 1.0000 | 0.0000 | 1.0000 | 0.0000 | 1.0000 | 0.0000 | 1.0000 | 0.0000 |
| B5 | 0.0000 | 0.0000 | 0.0000 | 1.2000 | 2.0000 | 1.0000 | 2.0000 | 0.0000 | 0.0000 | 1.0000 | 0.0000 | 0.0000 | 1.6000 | 0.0000 | 1.0000 | 0.0000 | 0.0000 | 0.0000 | 1.0000 | 1.0000 |
| B6 | 0.0000 | 0.0000 | 0.0000 | 1.6000 | 1.0000 | 2.4000 | 2.4000 | 1.4000 | 0.0000 | 0.0000 | 0.0000 | 0.0000 | 1.0000 | 1.4000 | 0.0000 | 2.4000 | 1.6000 | 1.6000 | 1.0000 | 1.0000 |
| C1 | 0.0000 | 0.0000 | 0.0000 | 0.0000 | 0.0000 | 0.0000 | 0.0000 | 0.0000 | 0.0000 | 0.0000 | 0.0000 | 1.0000 | 1.0000 | 0.0000 | 0.0000 | 0.0000 | 0.8000 | 0.0000 | 0.0000 | 0.0000 |
| C2 | 0.0000 | 0.0000 | 0.0000 | 1.0000 | 0.0000 | 0.0000 | 1.4000 | 0.0000 | 0.0000 | 0.0000 | 0.0000 | 0.0000 | 1.6000 | 1.0000 | 1.0000 | 1.0000 | 0.0000 | 0.0000 | 0.0000 | 0.0000 |
| C3 | 0.0000 | 0.0000 | 0.0000 | 0.6000 | 0.0000 | 1.0000 | 1.6000 | 0.4000 | 0.4000 | 0.6000 | 0.0000 | 1.4000 | 0.0000 | 1.4000 | 1.8000 | 0.0000 | 2.6000 | 2.2000 | 2.6000 | 1.4000 |
| D1 | 0.0000 | 0.0000 | 0.0000 | 0.0000 | 0.0000 | 0.0000 | 1.0000 | 0.0000 | 0.0000 | 1.0000 | 0.0000 | 1.6000 | 1.6000 | 0.0000 | 1.0000 | 0.0000 | 0.0000 | 0.0000 | 0.0000 | 0.0000 |
| D2 | 0.0000 | 0.0000 | 0.0000 | 0.0000 | 0.0000 | 0.0000 | 2.4000 | 1.0000 | 1.0000 | 2.0000 | 0.0000 | 0.0000 | 3.6000 | 1.0000 | 0.0000 | 0.0000 | 3.2000 | 1.8000 | 1.4000 | 1.4000 |
| D3 | 0.0000 | 0.0000 | 0.0000 | 0.0000 | 1.2000 | 0.0000 | 0.0000 | 0.0000 | 1.0000 | 2.0000 | 0.0000 | 0.0000 | 0.0000 | 1.0000 | 1.0000 | 0.0000 | 0.0000 | 0.0000 | 1.0000 | 1.0000 |
| E1 | 1.2000 | 1.0000 | 0.0000 | 0.0000 | 0.0000 | 2.0000 | 2.0000 | 1.0000 | 1.6000 | 2.0000 | 1.6000 | 1.0000 | 1.6000 | 2.0000 | 0.0000 | 0.0000 | 0.0000 | 1.0000 | 1.0000 | 1.0000 |
| E2 | 2.0000 | 1.0000 | 1.0000 | 0.0000 | 0.0000 | 2.0000 | 2.0000 | 1.0000 | 2.0000 | 2.0000 | 2.0000 | 1.0000 | 2.0000 | 1.6000 | 0.0000 | 0.0000 | 0.0000 | 0.0000 | 1.0000 | 1.0000 |
| E3 | 0.0000 | 0.0000 | 0.0000 | 0.0000 | 1.0000 | 1.0000 | 2.0000 | 0.0000 | 1.0000 | 1.0000 | 1.0000 | 1.0000 | 1.0000 | 3.0000 | 0.0000 | 0.0000 | 2.6000 | 1.0000 | 0.0000 | 0.0000 |
| E4 | 0.0000 | 0.0000 | 0.0000 | 0.0000 | 1.0000 | 0.0000 | 1.0000 | 0.0000 | 3.0000 | 3.6000 | 0.0000 | 1.0000 | 3.6000 | 1.0000 | 0.0000 | 0.0000 | 2.0000 | 3.0000 | 1.0000 | 0.0000 |
| A1 | A2 | A3 | A4 | B1 | B2 | B3 | B4 | B5 | B6 | C1 | C2 | C3 | D1 | D2 | D3 | E1 | E2 | E3 | E4 | |
|---|---|---|---|---|---|---|---|---|---|---|---|---|---|---|---|---|---|---|---|---|
| A1 | 0.0069 | 0.0176 | 0.0026 | 0.0137 | 0.0114 | 0.0190 | 0.0730 | 0.0094 | 0.0692 | 0.0432 | 0.0090 | 0.0326 | 0.0852 | 0.0903 | 0.0162 | 0.0068 | 0.0560 | 0.0605 | 0.0635 | 0.0684 |
| A2 | 0.0073 | 0.0053 | 0.0346 | 0.0171 | 0.0116 | 0.0314 | 0.0550 | 0.0296 | 0.0752 | 0.0295 | 0.0084 | 0.0695 | 0.0754 | 0.0777 | 0.0486 | 0.0064 | 0.0575 | 0.0533 | 0.0575 | 0.0495 |
| A3 | 0.0289 | 0.0328 | 0.0028 | 0.0722 | 0.0062 | 0.0141 | 0.0243 | 0.0114 | 0.0213 | 0.0210 | 0.0078 | 0.0182 | 0.0628 | 0.0634 | 0.0099 | 0.0030 | 0.0528 | 0.0513 | 0.0530 | 0.0446 |
| A4 | 0.0588 | 0.0442 | 0.0031 | 0.0153 | 0.0110 | 0.0218 | 0.0353 | 0.0745 | 0.0581 | 0.0246 | 0.0089 | 0.0519 | 0.0876 | 0.0683 | 0.0169 | 0.0048 | 0.0579 | 0.0517 | 0.0772 | 0.0174 |
| B1 | 0.0079 | 0.0058 | 0.0009 | 0.0802 | 0.0075 | 0.0166 | 0.0914 | 0.0137 | 0.0203 | 0.0733 | 0.0052 | 0.0473 | 0.0980 | 0.0232 | 0.0145 | 0.0103 | 0.0557 | 0.0223 | 0.0270 | 0.0476 |
| B2 | 0.0045 | 0.0033 | 0.0006 | 0.0499 | 0.0441 | 0.0170 | 0.0289 | 0.0484 | 0.0797 | 0.0503 | 0.0040 | 0.0453 | 0.0922 | 0.0191 | 0.0135 | 0.0064 | 0.0224 | 0.0158 | 0.0538 | 0.0133 |
| B3 | 0.0062 | 0.0045 | 0.0010 | 0.0638 | 0.0121 | 0.0168 | 0.0320 | 0.0129 | 0.0536 | 0.0588 | 0.0059 | 0.0155 | 0.0999 | 0.0270 | 0.0648 | 0.0388 | 0.0317 | 0.0250 | 0.0785 | 0.0490 |
| B4 | 0.0080 | 0.0060 | 0.0008 | 0.0842 | 0.0465 | 0.0835 | 0.0657 | 0.0166 | 0.0882 | 0.0584 | 0.0064 | 0.0174 | 0.0737 | 0.0239 | 0.0457 | 0.0073 | 0.0585 | 0.0199 | 0.0608 | 0.0174 |
| B5 | 0.0057 | 0.0041 | 0.0009 | 0.0579 | 0.0746 | 0.0473 | 0.0959 | 0.0128 | 0.0222 | 0.0597 | 0.0049 | 0.0170 | 0.0919 | 0.0227 | 0.0459 | 0.0084 | 0.0292 | 0.0225 | 0.0592 | 0.0497 |
| B6 | 0.0121 | 0.0083 | 0.0027 | 0.0757 | 0.0496 | 0.1028 | 0.1169 | 0.0638 | 0.0397 | 0.0436 | 0.0115 | 0.0257 | 0.0869 | 0.0783 | 0.0211 | 0.0865 | 0.0809 | 0.0757 | 0.0698 | 0.0547 |
| C1 | 0.0018 | 0.0014 | 0.0002 | 0.0033 | 0.0011 | 0.0046 | 0.0082 | 0.0025 | 0.0043 | 0.0052 | 0.0022 | 0.0369 | 0.0399 | 0.0069 | 0.0045 | 0.0019 | 0.0315 | 0.0053 | 0.0063 | 0.0041 |
| C2 | 0.0035 | 0.0025 | 0.0005 | 0.0398 | 0.0040 | 0.0067 | 0.0607 | 0.0069 | 0.0112 | 0.0148 | 0.0022 | 0.0094 | 0.0721 | 0.0452 | 0.0437 | 0.0361 | 0.0156 | 0.0122 | 0.0173 | 0.0106 |
| C3 | 0.0135 | 0.0091 | 0.0036 | 0.0394 | 0.0152 | 0.0621 | 0.1035 | 0.0318 | 0.0522 | 0.0650 | 0.0168 | 0.0716 | 0.0635 | 0.0869 | 0.0765 | 0.0108 | 0.1205 | 0.1011 | 0.1190 | 0.0686 |
| D1 | 0.0019 | 0.0013 | 0.0004 | 0.0096 | 0.0036 | 0.0088 | 0.0505 | 0.0062 | 0.0087 | 0.0439 | 0.0021 | 0.0588 | 0.0713 | 0.0129 | 0.0426 | 0.0070 | 0.0155 | 0.0123 | 0.0150 | 0.0100 |
| D2 | 0.0134 | 0.0092 | 0.0034 | 0.0263 | 0.0174 | 0.0392 | 0.1348 | 0.0523 | 0.0729 | 0.1124 | 0.0168 | 0.0293 | 0.1766 | 0.0766 | 0.0258 | 0.0142 | 0.1453 | 0.0958 | 0.0912 | 0.0755 |
| D3 | 0.0025 | 0.0017 | 0.0006 | 0.0128 | 0.0490 | 0.0136 | 0.0269 | 0.0082 | 0.0455 | 0.0855 | 0.0037 | 0.0108 | 0.0289 | 0.0489 | 0.0398 | 0.0079 | 0.0205 | 0.0160 | 0.0471 | 0.0442 |
| E1 | 0.0459 | 0.0374 | 0.0032 | 0.0260 | 0.0181 | 0.0917 | 0.1101 | 0.0486 | 0.0860 | 0.1006 | 0.0602 | 0.0589 | 0.1083 | 0.0981 | 0.0233 | 0.0134 | 0.0339 | 0.0600 | 0.0692 | 0.0562 |
| E2 | 0.0711 | 0.0379 | 0.0349 | 0.0290 | 0.0191 | 0.0910 | 0.1112 | 0.0481 | 0.0993 | 0.1003 | 0.0717 | 0.0593 | 0.1233 | 0.0880 | 0.0244 | 0.0134 | 0.0380 | 0.0310 | 0.0725 | 0.0590 |
| E3 | 0.0084 | 0.0060 | 0.0018 | 0.0196 | 0.0424 | 0.0538 | 0.1019 | 0.0130 | 0.0551 | 0.0628 | 0.0423 | 0.0547 | 0.0772 | 0.1215 | 0.0184 | 0.0100 | 0.1043 | 0.0500 | 0.0264 | 0.0190 |
| E4 | 0.0144 | 0.0093 | 0.0046 | 0.0307 | 0.0529 | 0.0423 | 0.0971 | 0.0221 | 0.1312 | 0.1610 | 0.0167 | 0.0615 | 0.1772 | 0.0769 | 0.0259 | 0.0178 | 0.1051 | 0.1320 | 0.0777 | 0.0333 |
| Factor | D | C | D + C | D − C | Type |
|---|---|---|---|---|---|
| A1 | 0.7544 | 0.3227 | 1.0771 | 0.4317 | Driving factors |
| A2 | 0.8005 | 0.2476 | 1.0482 | 0.5529 | Driving factors |
| A3 | 0.6017 | 0.1033 | 0.7050 | 0.4984 | Driving factors |
| A4 | 0.7894 | 0.7664 | 1.5557 | 0.0230 | Driving factors |
| B1 | 0.6686 | 0.4976 | 1.1662 | 0.1710 | Driving factors |
| B2 | 0.6124 | 0.7843 | 1.3967 | −0.1718 | Outcome factors |
| B3 | 0.6979 | 1.4235 | 2.1213 | −0.7256 | Outcome factors |
| B4 | 0.7888 | 0.5329 | 1.3217 | 0.2559 | Driving factors |
| B5 | 0.7325 | 1.0941 | 1.8266 | −0.3616 | Outcome factors |
| B6 | 1.1063 | 1.2138 | 2.3202 | −0.1075 | Outcome factors |
| C1 | 0.1721 | 0.3066 | 0.4787 | −0.1345 | Outcome factors |
| C2 | 0.4151 | 0.7914 | 1.2065 | −0.3764 | Outcome factors |
| C3 | 1.1306 | 1.7919 | 2.9225 | −0.6613 | Outcome factors |
| D1 | 0.3825 | 1.1557 | 1.5382 | −0.7731 | Outcome factors |
| D2 | 1.2284 | 0.6221 | 1.8505 | 0.6063 | Driving factors |
| D3 | 0.5143 | 0.3114 | 0.8257 | 0.2029 | Driving factors |
| E1 | 1.1492 | 1.1327 | 2.2819 | 0.0165 | Driving factors |
| E2 | 1.2225 | 0.9137 | 2.1362 | 0.3088 | Driving factors |
| E3 | 0.8886 | 1.1420 | 2.0307 | −0.2534 | Outcome factors |
| E4 | 1.2898 | 0.7919 | 2.0818 | 0.4979 | Driving factors |
| A1 | A2 | A3 | A4 | B1 | B2 | B3 | B4 | B5 | B6 | C1 | C2 | C3 | D1 | D2 | D3 | E1 | E2 | E3 | E4 | Rank | |
|---|---|---|---|---|---|---|---|---|---|---|---|---|---|---|---|---|---|---|---|---|---|
| A1 | 0.0449 | 0.0449 | 0.0449 | 0.0449 | 0.0449 | 0.0449 | 0.0449 | 0.0449 | 0.0449 | 0.0449 | 0.0449 | 0.0449 | 0.0449 | 0.0449 | 0.0449 | 0.0449 | 0.0449 | 0.0449 | 0.0449 | 0.0449 | 13 |
| A2 | 0.0588 | 0.0588 | 0.0589 | 0.0588 | 0.0588 | 0.0588 | 0.0588 | 0.0588 | 0.0588 | 0.0588 | 0.0588 | 0.0588 | 0.0588 | 0.0588 | 0.0588 | 0.0588 | 0.0588 | 0.0588 | 0.0588 | 0.0588 | 7 |
| A3 | 0.0440 | 0.0440 | 0.0440 | 0.0440 | 0.0440 | 0.0440 | 0.0440 | 0.0440 | 0.0440 | 0.0440 | 0.0440 | 0.0440 | 0.0440 | 0.0440 | 0.0440 | 0.0440 | 0.0440 | 0.0440 | 0.0440 | 0.0440 | 14 |
| A4 | 0.0571 | 0.0571 | 0.0571 | 0.0571 | 0.0571 | 0.0571 | 0.0571 | 0.0571 | 0.0571 | 0.0571 | 0.0571 | 0.0571 | 0.0571 | 0.0571 | 0.0571 | 0.0571 | 0.0571 | 0.0571 | 0.0571 | 0.0571 | 8 |
| B1 | 0.0394 | 0.0394 | 0.0394 | 0.0394 | 0.0394 | 0.0394 | 0.0394 | 0.0394 | 0.0394 | 0.0394 | 0.0394 | 0.0394 | 0.0394 | 0.0394 | 0.0394 | 0.0394 | 0.0394 | 0.0394 | 0.0394 | 0.0394 | 15 |
| B2 | 0.0352 | 0.0352 | 0.0352 | 0.0352 | 0.0352 | 0.0352 | 0.0352 | 0.0352 | 0.0352 | 0.0352 | 0.0352 | 0.0352 | 0.0352 | 0.0352 | 0.0352 | 0.0352 | 0.0352 | 0.0352 | 0.0352 | 0.0352 | 16 |
| B3 | 0.0455 | 0.0455 | 0.0455 | 0.0455 | 0.0455 | 0.0455 | 0.0455 | 0.0455 | 0.0455 | 0.0455 | 0.0455 | 0.0455 | 0.0455 | 0.0455 | 0.0455 | 0.0455 | 0.0455 | 0.0455 | 0.0455 | 0.0455 | 11 |
| B4 | 0.0471 | 0.0471 | 0.0471 | 0.0471 | 0.0471 | 0.0471 | 0.0471 | 0.0471 | 0.0471 | 0.0471 | 0.0471 | 0.0471 | 0.0471 | 0.0471 | 0.0471 | 0.0471 | 0.0471 | 0.0471 | 0.0471 | 0.0471 | 9 |
| B5 | 0.0452 | 0.0452 | 0.0452 | 0.0452 | 0.0452 | 0.0452 | 0.0452 | 0.0452 | 0.0452 | 0.0452 | 0.0452 | 0.0452 | 0.0452 | 0.0452 | 0.0452 | 0.0452 | 0.0452 | 0.0452 | 0.0452 | 0.0452 | 12 |
| B6 | 0.0704 | 0.0704 | 0.0704 | 0.0704 | 0.0704 | 0.0704 | 0.0704 | 0.0704 | 0.0704 | 0.0704 | 0.0704 | 0.0704 | 0.0704 | 0.0704 | 0.0704 | 0.0704 | 0.0704 | 0.0704 | 0.0704 | 0.0704 | 5 |
| C1 | 0.0090 | 0.0090 | 0.0090 | 0.0090 | 0.0090 | 0.0090 | 0.0090 | 0.0090 | 0.0090 | 0.0090 | 0.0090 | 0.0090 | 0.0090 | 0.0090 | 0.0090 | 0.0090 | 0.0090 | 0.0090 | 0.0090 | 0.0090 | 20 |
| C2 | 0.0255 | 0.0255 | 0.0255 | 0.0255 | 0.0255 | 0.0255 | 0.0255 | 0.0255 | 0.0255 | 0.0255 | 0.0255 | 0.0255 | 0.0255 | 0.0255 | 0.0255 | 0.0255 | 0.0255 | 0.0255 | 0.0255 | 0.0255 | 18 |
| C3 | 0.0702 | 0.0702 | 0.0702 | 0.0702 | 0.0702 | 0.0702 | 0.0702 | 0.0702 | 0.0702 | 0.0702 | 0.0702 | 0.0702 | 0.0702 | 0.0702 | 0.0702 | 0.0702 | 0.0702 | 0.0702 | 0.0702 | 0.0702 | 6 |
| D1 | 0.0216 | 0.0216 | 0.0216 | 0.0216 | 0.0216 | 0.0216 | 0.0216 | 0.0216 | 0.0216 | 0.0216 | 0.0216 | 0.0216 | 0.0216 | 0.0216 | 0.0216 | 0.0216 | 0.0216 | 0.0216 | 0.0216 | 0.0216 | 19 |
| D2 | 0.0726 | 0.0726 | 0.0726 | 0.0726 | 0.0726 | 0.0726 | 0.0726 | 0.0726 | 0.0726 | 0.0726 | 0.0726 | 0.0726 | 0.0726 | 0.0726 | 0.0726 | 0.0726 | 0.0726 | 0.0726 | 0.0726 | 0.0726 | 3 |
| D3 | 0.0318 | 0.0318 | 0.0318 | 0.0318 | 0.0318 | 0.0318 | 0.0318 | 0.0318 | 0.0318 | 0.0318 | 0.0318 | 0.0318 | 0.0318 | 0.0318 | 0.0318 | 0.0318 | 0.0318 | 0.0318 | 0.0318 | 0.0318 | 17 |
| E1 | 0.0713 | 0.0713 | 0.0713 | 0.0713 | 0.0713 | 0.0713 | 0.0713 | 0.0713 | 0.0713 | 0.0713 | 0.0713 | 0.0713 | 0.0713 | 0.0713 | 0.0713 | 0.0713 | 0.0713 | 0.0713 | 0.0713 | 0.0713 | 4 |
| E2 | 0.0880 | 0.0880 | 0.0880 | 0.0880 | 0.0879 | 0.0880 | 0.0880 | 0.0880 | 0.0880 | 0.0880 | 0.0880 | 0.0880 | 0.0880 | 0.0880 | 0.0880 | 0.0879 | 0.0880 | 0.0880 | 0.0880 | 0.0880 | 1 |
| E3 | 0.0467 | 0.0467 | 0.0467 | 0.0467 | 0.0467 | 0.0467 | 0.0467 | 0.0467 | 0.0467 | 0.0467 | 0.0467 | 0.0467 | 0.0467 | 0.0467 | 0.0467 | 0.0467 | 0.0467 | 0.0467 | 0.0467 | 0.0467 | 10 |
| E4 | 0.0757 | 0.0757 | 0.0757 | 0.0757 | 0.0757 | 0.0757 | 0.0757 | 0.0757 | 0.0757 | 0.0757 | 0.0757 | 0.0757 | 0.0757 | 0.0757 | 0.0757 | 0.0757 | 0.0757 | 0.0757 | 0.0757 | 0.0757 | 2 |
| Criterion | Significant Risk | Larger Risk | General Risk | Less Risk |
|---|---|---|---|---|
| A1 | 0.1 | 0.1 | 0.3 | 0.5 |
| A2 | 0.1 | 0.2 | 0.3 | 0.4 |
| A3 | 0.08 | 0.21 | 0.23 | 0.48 |
| A4 | 0 | 0.17 | 0.3 | 0.53 |
| B1 | 0.2 | 0.2 | 0.3 | 0.3 |
| B2 | 0.11 | 0.23 | 0.35 | 0.31 |
| B3 | 0.1 | 0.14 | 0.33 | 0.43 |
| B4 | 0.1 | 0.1 | 0.5 | 0.3 |
| B5 | 0.2 | 0.1 | 0.3 | 0.4 |
| B6 | 0.05 | 0.11 | 0.46 | 0.38 |
| C1 | 0 | 0.02 | 0.42 | 0.56 |
| C2 | 0 | 0.12 | 0.32 | 0.56 |
| C3 | 0.09 | 0.14 | 0.67 | 0.1 |
| D1 | 0 | 0.42 | 0.33 | 0.25 |
| D2 | 0.04 | 0.16 | 0.57 | 0.23 |
| D3 | 0.03 | 0.12 | 0.34 | 0.51 |
| E1 | 0.13 | 0.22 | 0.34 | 0.31 |
| E2 | 0.11 | 0.21 | 0.41 | 0.27 |
| E3 | 0.04 | 0.22 | 0.39 | 0.35 |
| E4 | 0.09 | 0.34 | 0.27 | 0.3 |
Disclaimer/Publisher’s Note: The statements, opinions and data contained in all publications are solely those of the individual author(s) and contributor(s) and not of MDPI and/or the editor(s). MDPI and/or the editor(s) disclaim responsibility for any injury to people or property resulting from any ideas, methods, instructions or products referred to in the content. |
© 2023 by the authors. Licensee MDPI, Basel, Switzerland. This article is an open access article distributed under the terms and conditions of the Creative Commons Attribution (CC BY) license (https://creativecommons.org/licenses/by/4.0/).
Share and Cite
Sun, D.; Guo, D.; Xie, D. Using Multicriteria Decision Making to Evaluate the Risk of Hydrogen Energy Storage and Transportation in Cities. Sustainability 2023, 15, 1088. https://doi.org/10.3390/su15021088
Sun D, Guo D, Xie D. Using Multicriteria Decision Making to Evaluate the Risk of Hydrogen Energy Storage and Transportation in Cities. Sustainability. 2023; 15(2):1088. https://doi.org/10.3390/su15021088
Chicago/Turabian StyleSun, Dongshi, Di Guo, and Danlan Xie. 2023. "Using Multicriteria Decision Making to Evaluate the Risk of Hydrogen Energy Storage and Transportation in Cities" Sustainability 15, no. 2: 1088. https://doi.org/10.3390/su15021088