1. Introduction
The research on Industrial Symbiosis (IS) has increased over the past two decades, and the time is ripe for a comprehensible review of the concept, its applications, and the collective benefits [
1]. The research efforts described in the literature first focused on understanding the evolution and development of IS. For example, Frosch and Gallopoulos [
2] introduced “industrial ecosystems” as an important solution for achieving the productive use of waste and by-products and minimising environmental degradation. Wastewater reuse in industrial plants has been considered by many studies related to IS, with most having given their main attention to achieving cost reductions in individual plants [
3,
4]. Many studies have analysed the economic and environmental gains of individual industries [
3], with their focus mostly on economic indicators [
5]. A study by Jacobsen [
6] analysed the wastewater flow network of IS based on environmental effects, with the study only considering the possibility of reducing the freshwater intake. Moreover, many studies have been conducted to develop optimisation models for water exchange with economic and environmental objectives [
7]. Kim and Lee, in study [
8], designed a Pareto optimal network based on the context of benefit sharing among participants. Furthermore, water minimisation and integration were the key objectives considered in studies on optimisation networks [
9]. Most optimisation models in the previous literature have considered cost reduction in water treatment and transportation. Optimisation models have focused on the minimisation of capital and operating costs of treatment facilities and the quantity of water consumed by eco-industrial parks (EIPs) [
3,
10]. Ref. [
11] also studied the input–output modelling of water supply chains in industrial parks. Tiu and Cruz [
5] conducted a study that developed an optimisation model for water flow in EIPs by means of water quality. Nobel and Allen studied the use of geographic information systems (GIS) for industrial water reuse modelling [
12].
In current practice, industrial entities or plants are consuming more freshwater for their industrial processes, which are discharging wastewater in an inefficient and linear way [
13]. The industrial sector consumes water in large volumes for various direct and indirect industrial processes. Due to the rapid industry development, conventional water resources have been critically depleted. Due to the high level of contamination in ground water and surface water sources caused by wastewater discharge, many people inevitably consume unsafe water [
14]. This has created numerous environmental and health impacts due to the escalating impacts of the water footprint. In this context, increasing attention is being directed towards the development of the water sector, the efficient utilisation of water resources, and wastewater recovery & reuse for sustainable water resources management [
8]. As a solution, industries can exchange treated wastewater to replace the utilisation of freshwater [
14].
However, wastewater is not optimally reused within the IS networks, and it is apparent that a limited consideration has been provided to optimise water flow between industrial entities. Although possible water synergies between participating industries in an IS network are recognised through pre-industrial workshops, the current IS planning process distresses have the means to evaluate the identified water synergies to determine the optimum water flow between the participating industrial entities. As the existing process for IS initiation does not have a universal method for assessing the optimum water flow of IS and its relevance to industry, many IS networks have failed in the long term without the maximum recovery and reuse of wastewater. Hence, existing evaluation emphasises the need to have a standardised way to assess the optimum water flow of IS. Accordingly, the aim of this research is to develop a model for assessing the optimum water flow of IS through maximum wastewater recovery.
As the first phase of the research, this paper aimed at conceptualising a model to assess the optimum water flow of IS by identifying key variables, parameters, and constraints, followed by a preliminary evaluation of the model.
Many studies have focused on developing optimisation models for water exchange by means of economic and environmental objectives which include water minimisation and the reduction in water transportation and treatment costs. However, the novelty of the current study is its objective of reducing the freshwater consumption of the IS network through maximum wastewater recovery in assessing the optimum water flow of IS. The variables, functions, and formula embedded in the conceptual model form a unique foundation for assessing the optimum water flow of IS, thus adding value for further research by contributing to new knowledge on IS. However, the proposed model will be subjected to more empirical testing and research for its practicality as a way forward for the research.
2. Materials and Methods
The first phase of this research comprised a desk study to collect reliable data from published sources on IS projects. Data related to the resource flow, water synergies between industries, and water inputs and outputs of IS networks were collected through the desk study. As stated by [
15], the desk study is a quick and easy method for collecting data from existing sources. It reduces data collection time and adds to the conclusion’s accuracy, as the data are collected from reliable, published sources. Furthermore, it prevents interviewee bias and allows researchers to access valuable information at little or no cost. By adopting the following criteria, 13 global IS projects from across the world were selected for the desk study based on the availability of three or more firms in the network, the geographical proximity of the enterprises, the availability of water flow synergies, and the availability of empirical data (refer to
Table 1).
Out of 13 IS projects, 5 projects supporting the criteria were specifically selected for analysing the water flow of IS. The five selected IS projects include (a) Kalundborg IS Project, Denmark, (b) Choctaw Eco-Industrial Park, USA, (c) Kwinana Industrial Area, Australia, (d) Qijiang Industrial Park, China, and (e) Songmudao Chemical Industrial Park, China. These five projects were selected based on the fulfilment of all four criteria. The identified IS projects were reviewed to identify the resources flow of IS, its transformation over the years, and the water flow of IS. The review was based on the key research publications describing the water flow of IS. Further, optimisation methodologies were also reviewed by referring to related journal articles published over the years. The collected data were analysed and integrated to develop the conceptual model of the research.
In addition to that, expert interviews were conducted with five selected professionals with more than 10 years of experience in the fields of water management, industrial wastewater treatment, and reuse—(E1) Project Director (20 years), (E2) Deputy General Manager (13 years), (E3) Project Consultant (11 years), (E4) Manager—Compliance and Sustainability (11 years), and (E5) Director (20 years)—to evaluate the developed model to identify further improvements prior to its application in a real industry scenario.
3. A Conceptual Model for Assessing the Optimum Water Flow of IS
A conceptual model was developed as a generic and systematic way to assess the optimum water flow of IS based on the secondary data reviewed by referring to key literature. The process of model development comprises four key steps, namely, (i) identification of water inputs and outputs, (ii) data compilation and initial processing, (iii) optimisation model design and development, and (iv) assessment of the optimal configuration, as described below.
3.1. Step 1—Identification of Water Inputs and Outputs
As key literature findings derived through the review, the inputs and outputs of the water flow of IS were identified. The summary of the typical water inputs and outputs of these five IS networks is shown in
Table 2.
Within the industrial park or the cluster selected, the two major industrial actors are the processing firm (manufacturing organisation/plant) and the wastewater treatment unit. Cooling water, process water, demineralised water, soft water, steam, and steam condensate are mainly generated through the production process of firms co-located in the industrial park. The municipality generally handles the wastewater treatment of the industrial network; thus, it is a major contributor to the water flow. In most cases, wastewater from the processing firms is linked to wastewater treatment by the municipality.
The utilisation of freshwater from reservoirs and the city mains is also visible. According to a study by [
21], water flow between industrial firms is considered as a utility synergy flow of IS. As per [
27], the Kalundborg Industrial Symbiosis Project includes three types of flows, namely, materials, energy, and utilities. The authors indicated that the flow of freshwater, wastewater, and recycled water is considered under the utility flow. Furthermore, industries generate production process-oriented water outflows which can be directly or indirectly used by other industries. According to a study by [
16], treated wastewater is one of the major resources exchanged between industries. The author indicated that the wastewater generated by industries is an input to a water recycling company: after being recycled, the water then flows to other industries as treated water.
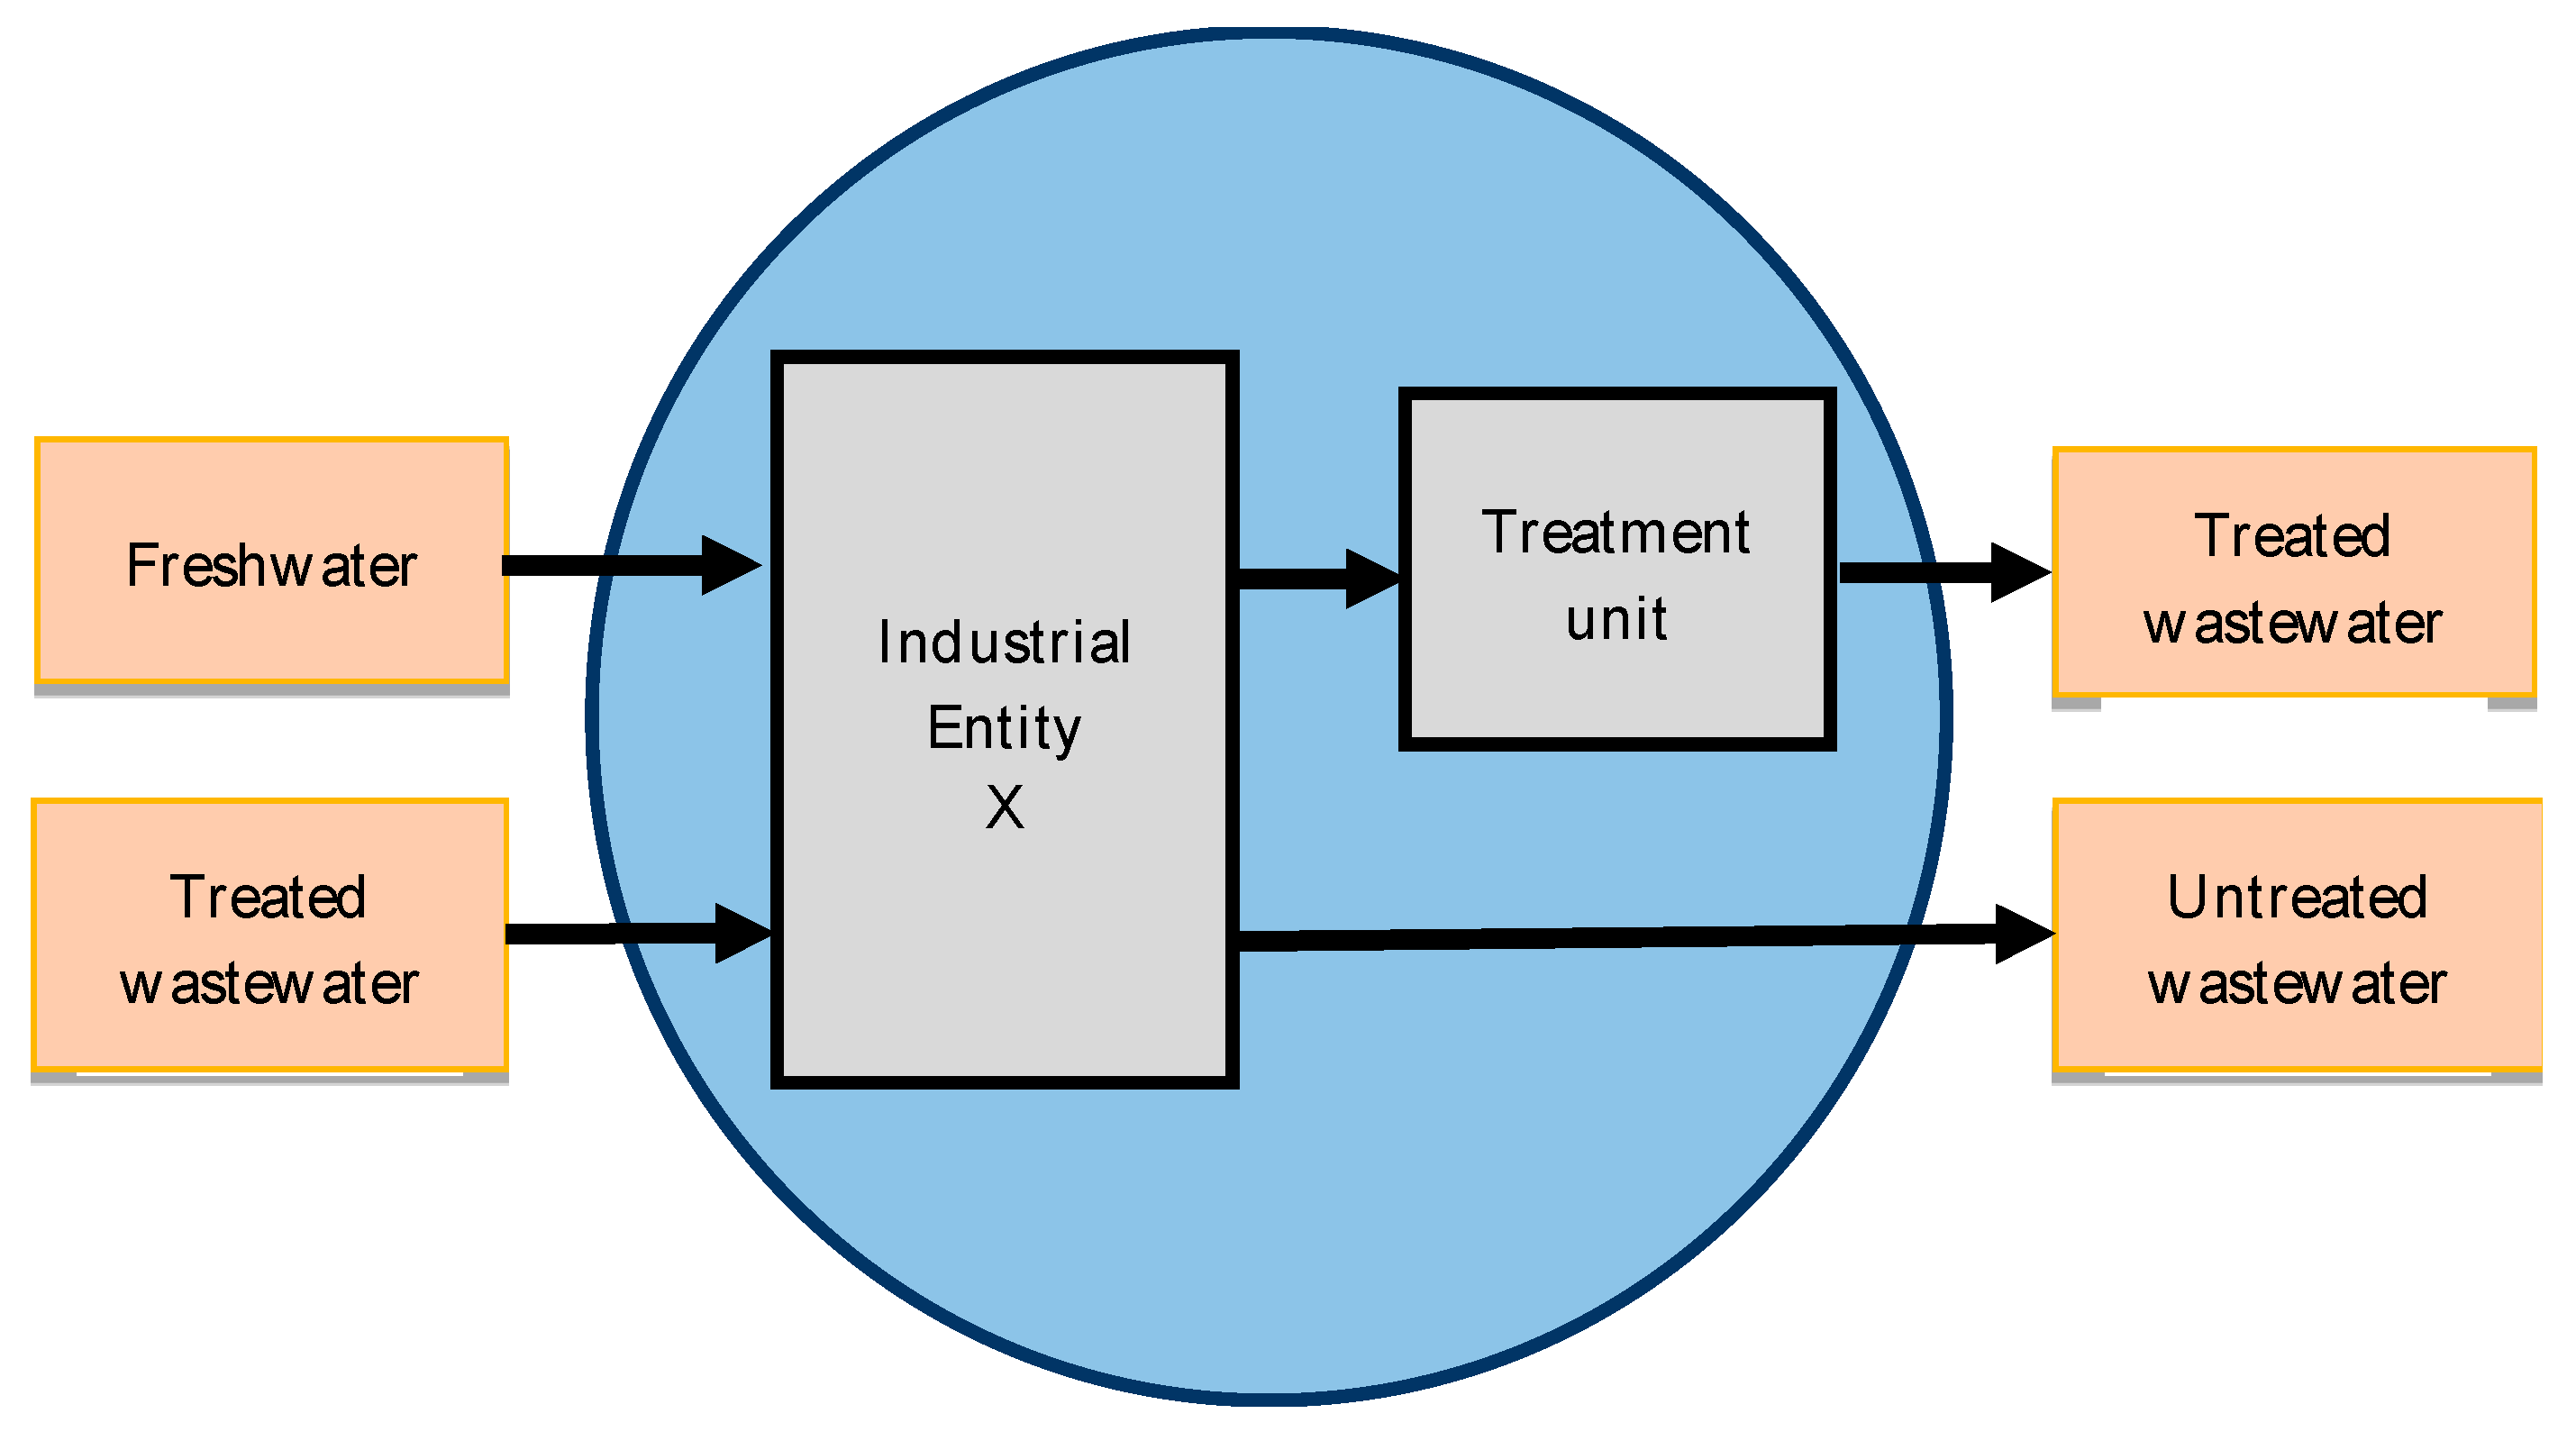
Figure 1 illustrates the water inputs and outputs of a typical industrial entity, namely, freshwater input, treated wastewater input, treated wastewater output, and untreated wastewater output. It is assumed that each industrial entity consists of a manufacturing process plant/s and the wastewater treatment unit. Freshwater and treated wastewater were identified as water inputs to the overall industrial entity, where treated wastewater and untreated wastewater can be discharged as water outputs.
The water input and output data entered into the process are managed by using the subsequent steps described below.
3.2. Step 2—Data Compilation and Initial Processing
This step comprises three (03) key activities, namely, (i) the selection of the boundary for optimisation, (ii) the identification of water synergies, and (iii) theoretical framework development, as described below.
3.2.1. Selection of the Boundary for Optimisation
The theory of IS refers to “the engagement of traditionally separated and geographically proximate industrial entities to achieve collaborative benefits through the physical exchange of resources including materials, energy, water, by-products, services and infrastructure” ([
28], p. 12). As stated by Chertow [
14,
15,
16], “at least three different entities must be involved in exchanging at least two different resources to counter it as a basic type of IS. By involving three entities, none of which is primarily engaged in a recycling-oriented business, where the 3-2 heuristic begins to recognise the complex relationships rather than the linear one-way exchanges”.
Collaborative sharing and the circular nature between firms in industrial estates may enhance the collective economic and environmental benefits. Specifically, industries with close proximity and those that have the willingness to engage are mainly considered when initiating symbiotic relationships. In this sense, industrial sites/parks have been recognised as ideal environments for initiating the IS clusters. For example, the first IS cluster was fully realised in the EIP at Kalundborg, Denmark. Choctaw Eco-Industrial Park, USA, Qijiang Industrial Park, China, and Songmudao Chemical Industrial Park, China are the other examples for the IS-based eco-industrial clusters that have been initiated. It is evident in many studies that the industrial park is a perfect spatial platform in which to facilitate waste and by-product exchanges between neighbouring industrial firms. As stated by [
3], the probability of occurring water synergies is an important factor to be considered in exchanging water among the industrial entities, even though they are located with proximity. Hence, synergy identification has become a crucial step in initiating IS networks. Further, having required infrastructure including water transferring connections and storage is another concern raised by [
29]. Further to the authors, no water can be transferred if no connections existed. Quality at the water-generating sources ensures that each industrial entity only accepts input water from water sources if the water satisfies the maximum contaminant limit [
5]. As [
5] further mentioned, the quality of freshwater and wastewater discharge by each individual industry can be measured as per the available water quality regulations.
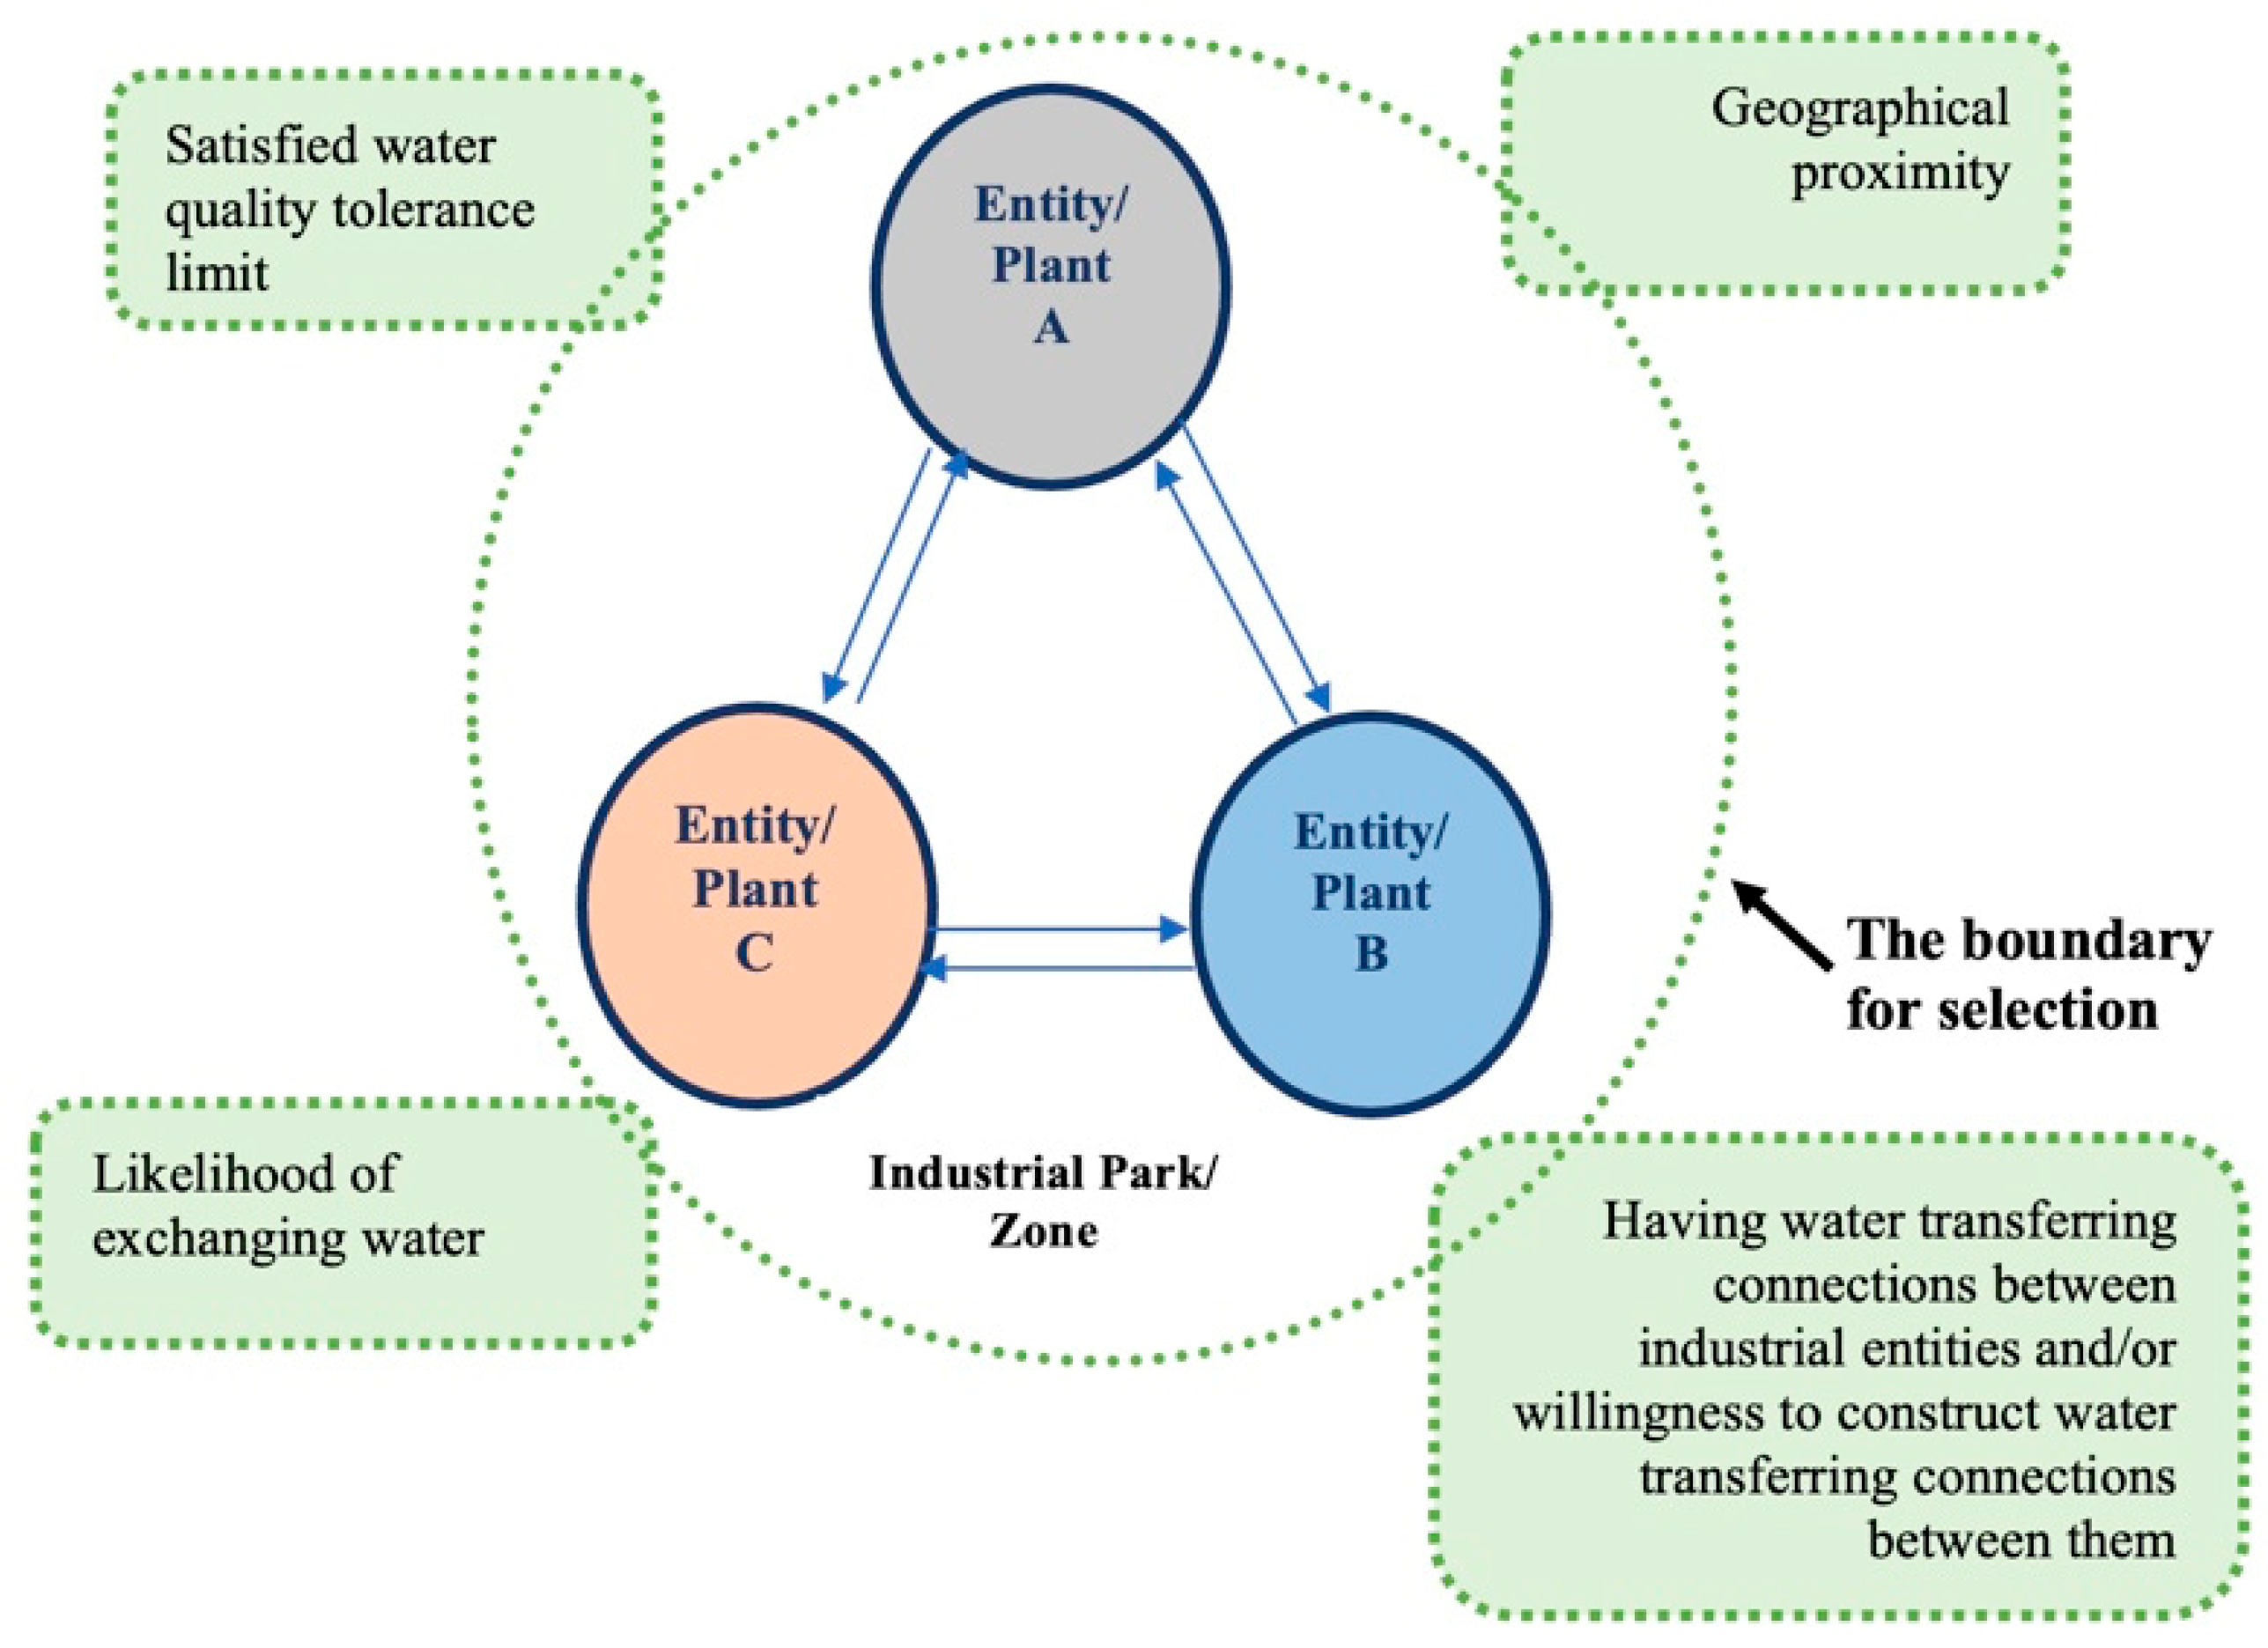
In accordance with the above points, the current study considered a cluster of three “traditionally separated” industrial entities (Entity/Plant A, Entity/Plant B and Entity/Plant C) located in the same industrial park/zone to initiate the water network. The selection of industrial entities was undertaken, subject to the following criteria, as shown in
Figure 2.
Industries within the same industrial park with geographical proximity [
16],
Industrial entities that demonstrate the likelihood of exchanging wastewater [
3],
Industrial entities with water transferring connections between them and/or industrial entities with a willingness to invest for constructing the water transferring connections with other industries [
10,
29], and
The industries satisfying the upper tolerance limit of water quality [
5].
Figure 2.
Selection of the boundary.
Figure 2.
Selection of the boundary.
3.2.2. Identification of Water Synergies
Each industrial plant is viewed as a “black box” with only a single stream of water considered to enter and exit the plant. Therefore, information regarding the internal sub-processes of the selected industrial entities is not considered. As stated by [
3], the sharing of information between the participating industries in industrial parks is a critical concern due to confidentiality issues. As stated in a study by [
29], all participant information is not transparent in developing exchange networks. These authors added that industrial entities must therefore be considered as “black boxes” in which detailed information about their internal processes is not revealed, and only the input and output resources flow characteristics are used in common. For example, [
30] successfully utilised the same approach to design an exchange network that considered regeneration units in EIPs.
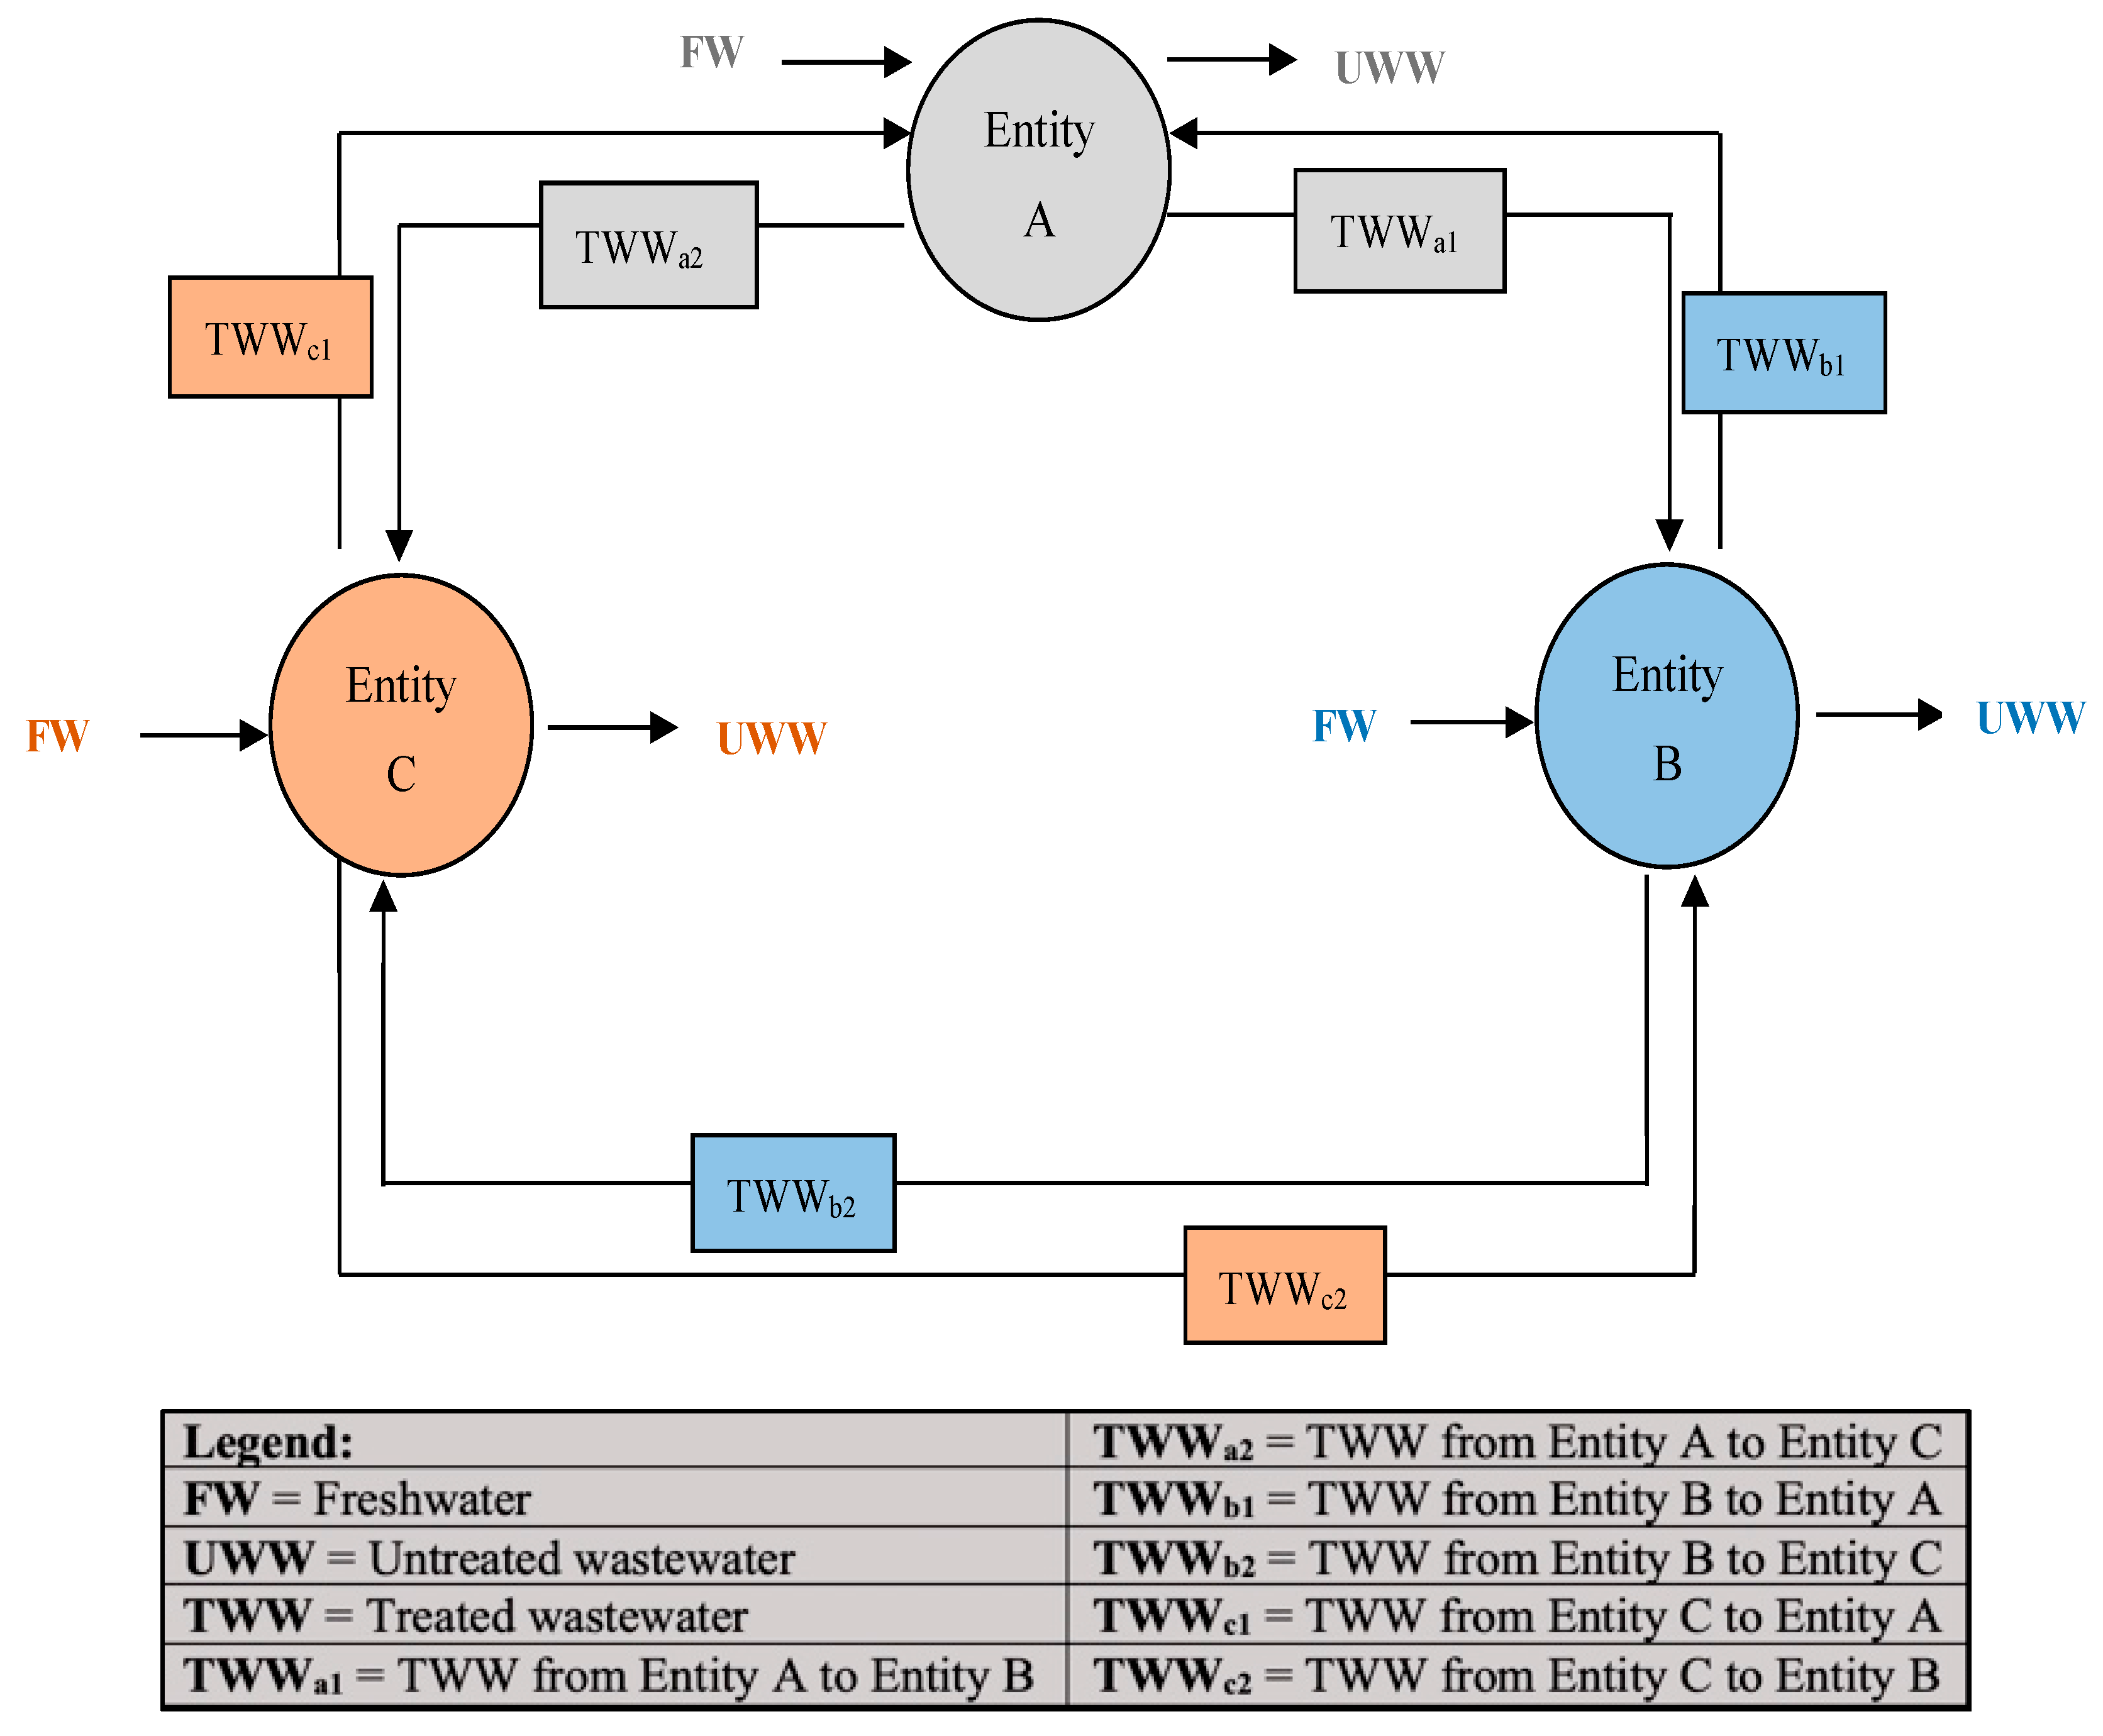
Hence, the water input flows and water output flows of each entity are only considered where the information about the internal processes is not revealed. In relation to the water flow, all possible water synergies between the selected industrial entities in the cluster are presented in
Figure 3. As depicted in
Figure 3, the input and output flows of water, freshwater inputs, treated wastewater inputs, and un-treated wastewater outputs are considered in determining the water synergies between the participating industrial entities.
Water can be exchanged between the participating industrial entities A, B, and C in various ways. Freshwater (FW), utilised from an external water source, is the main input for all three entities, with untreated wastewater (UWW) being discharged from each entity. As hypothesised, treated wastewater (TWW) can be exchanged between each entity, providing possible synergies. For example, TWWa1 and TWWa2 of Plant A are flowing to Plants B and C, respectively, or vice versa. The optimum solution is determined by considering the probability of the occurrence of all such possible water synergies.
As the major concern of the current research is to develop an optimisation model for minimising freshwater utilisation, the water source–water sink relationship of the water exchange network is considered. As stated by [
10], each water-generating industrial entity is considered as a “water source”, while each water-using industrial entity is considered as a “water sink”. As participating industrial entities in an industrial park have the probability of obtaining various synergies, different approaches have been proposed to aid in the systematic planning of resource exchange networks. A study conducted by [
29] proposed the use of a source–sink framework to optimise energy exchange systems, with this being mathematically equivalent to the synthesis of single-component resource conservation networks. Furthermore, this can be solved by considering various constraints with the use of linear programming techniques [
11]. Similarly, ref. [
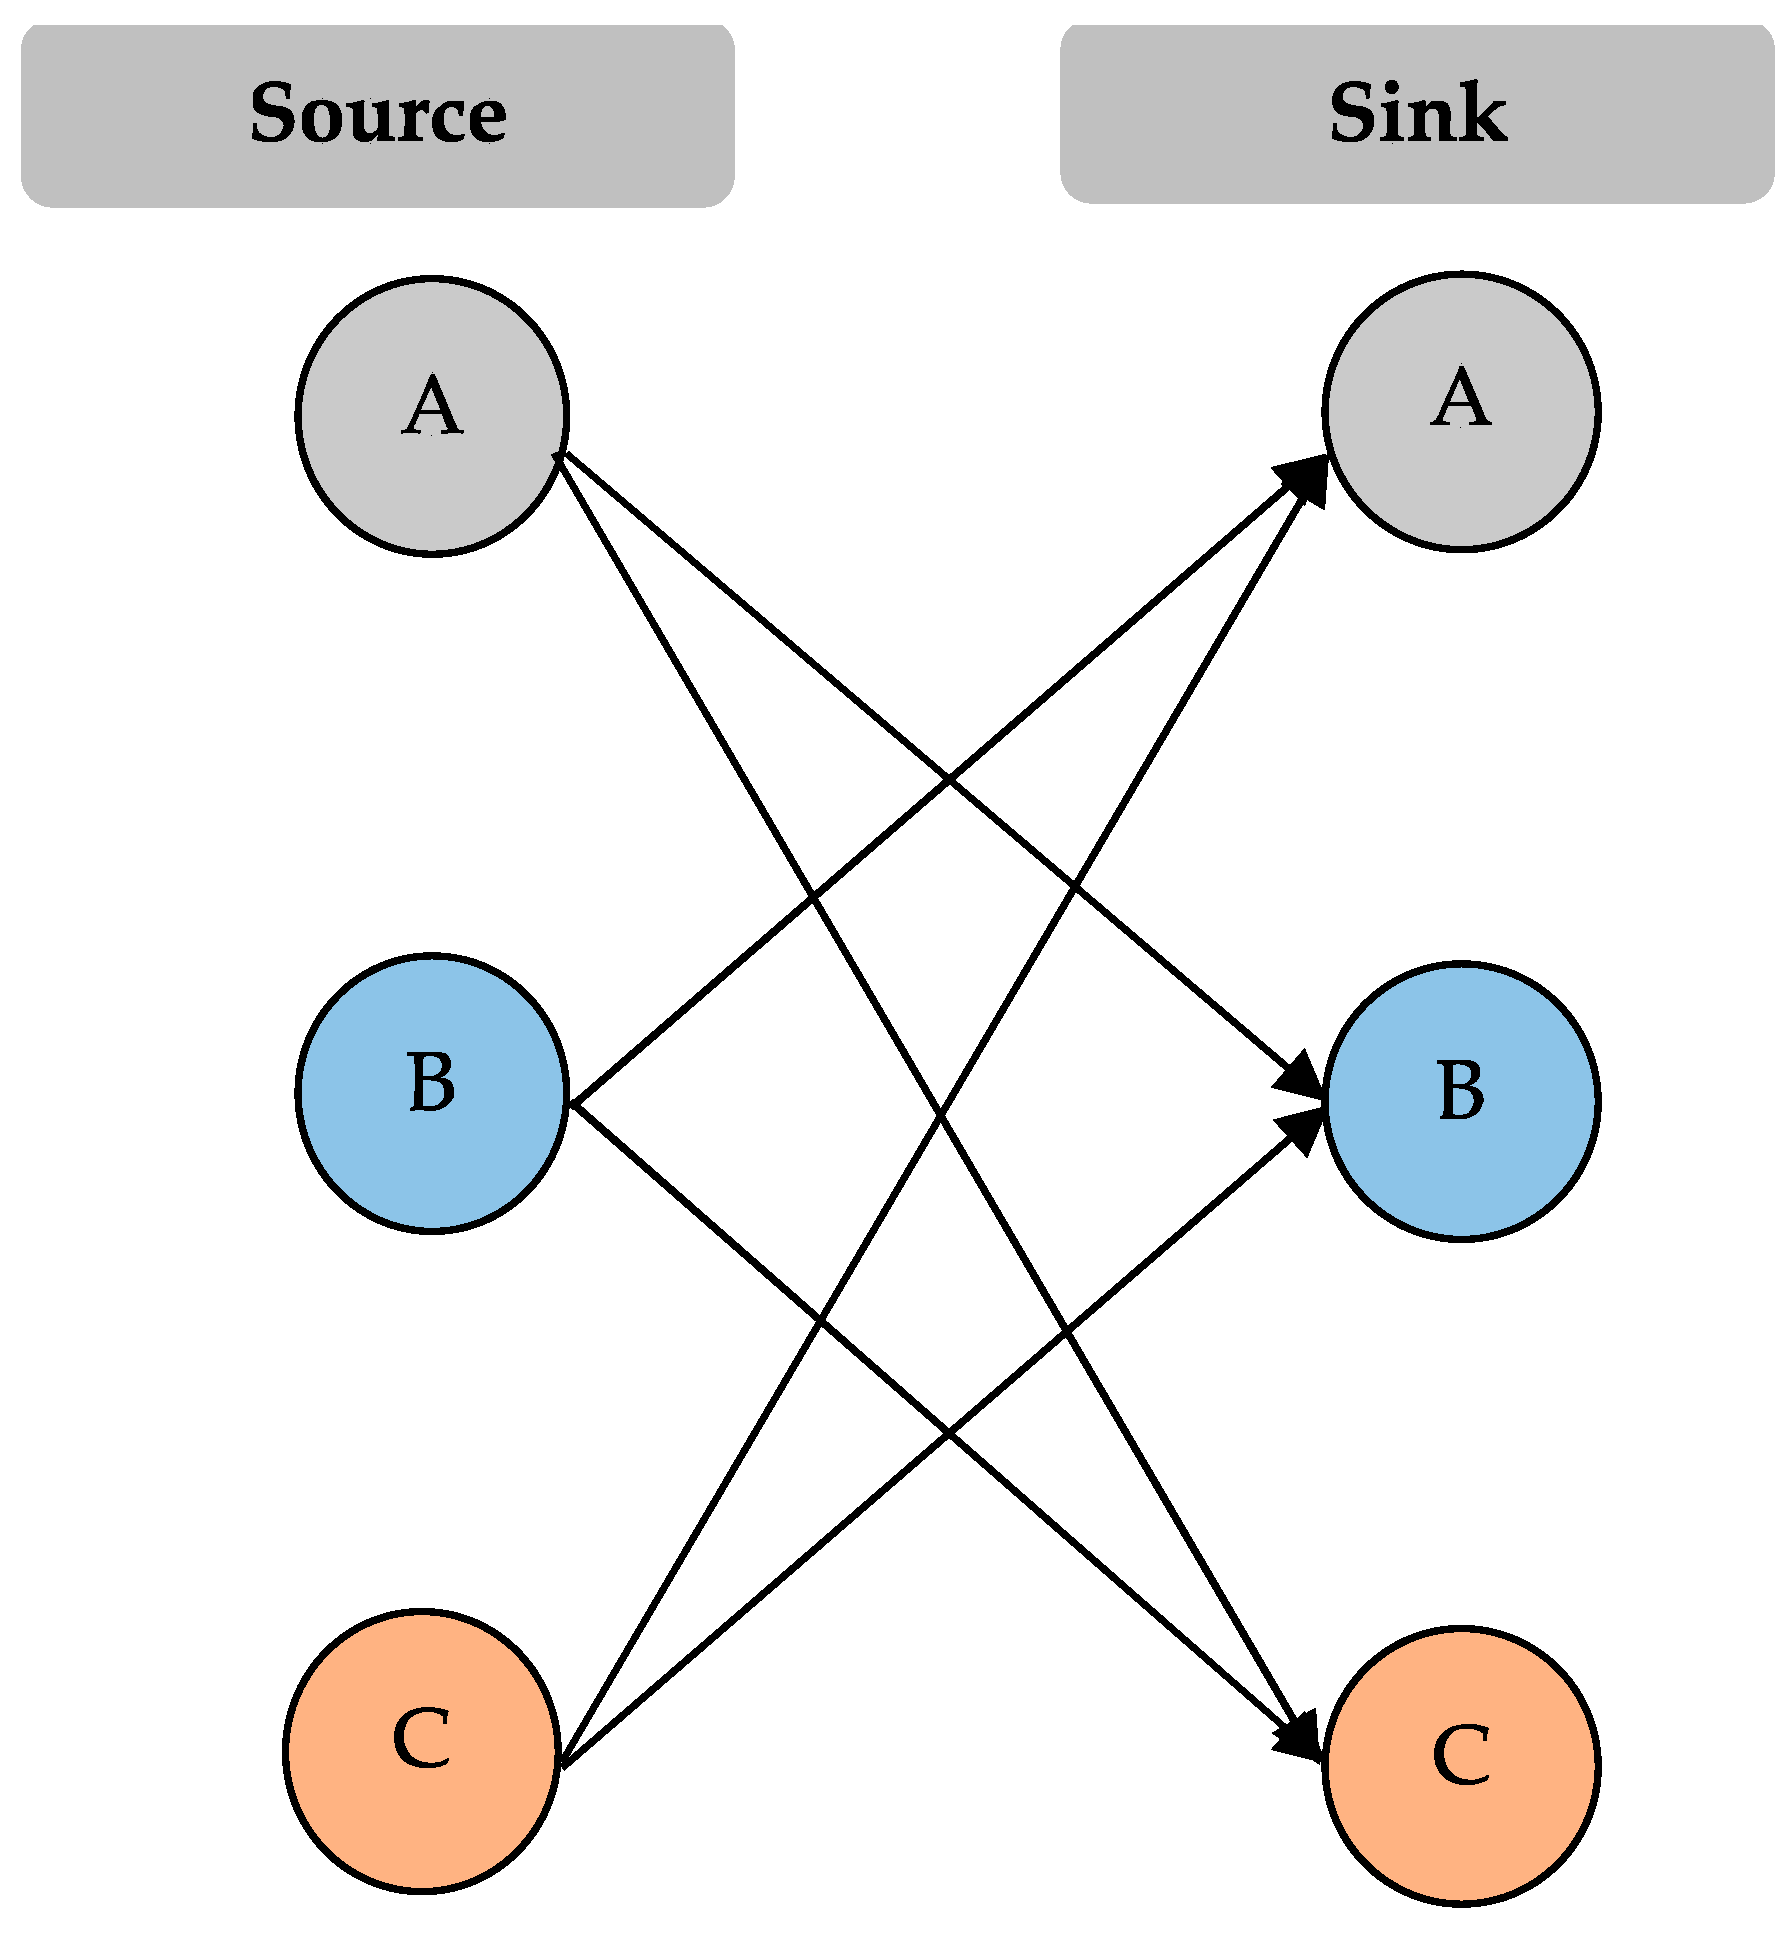
10] utilised source–sink modelling in his study that proposed a water network for a hypothetical industrial cluster with the overall objective of achieving economic viability. All possible source–sink relationships between the industrial entities A, B, and C are shown in
Figure 4.
As shown in
Figure 4, each entity, which is generating and supplying water to other plants, can be considered as a water source. Each entity, which is receiving water from other plants, can be considered as a water sink. Therefore, the selected cluster of industrial entities is characterised by “n” = the number of wastewater-generating industrial entities (water sources) and “n” = the number of water-using industrial entities (water sinks). Based on the above considerations, the theoretical framework is presented next.
3.2.3. Theoretical Framework Development
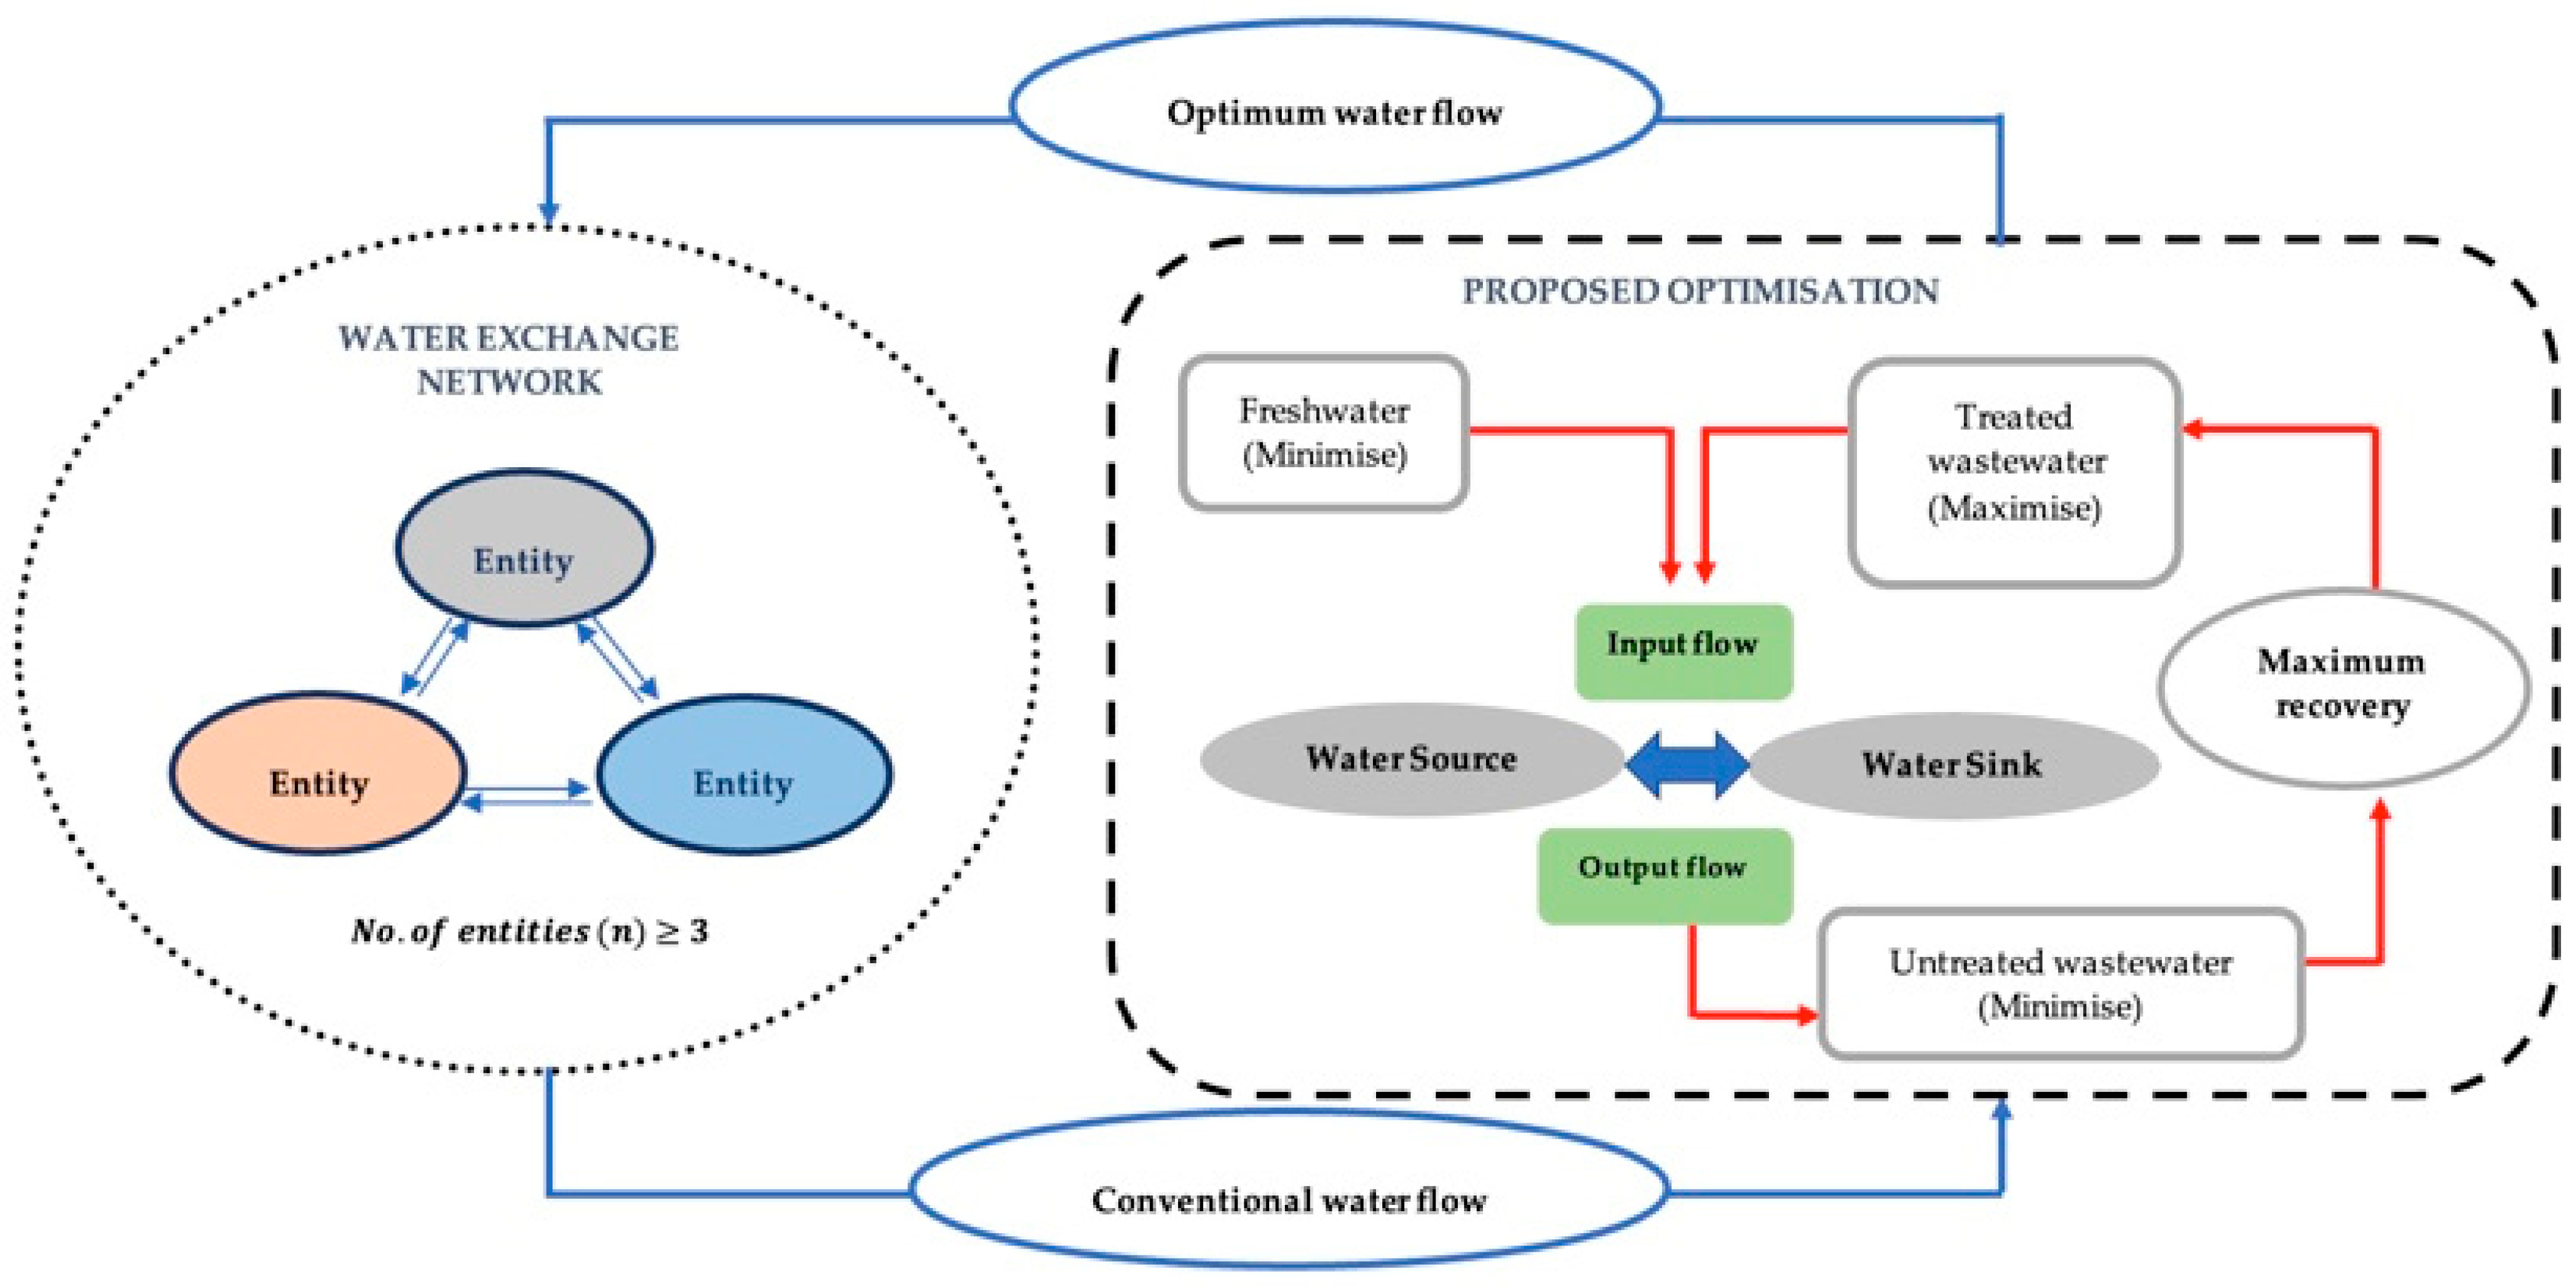
Figure 5 presents the theoretical framework developed for the proposed optimisation. The framework indicates the importance of designing optimum water exchange networks in order to reduce their inefficiencies. The relationships between water sinks and water sources in the water exchange network are considered as a base from which to develop the proposed optimisation model. The optimum water exchange network solution between the participating industrial entities is finally determined to reduce the total freshwater (FW) consumption in the selected park, which results in minimum wastewater (WW) discharge.
3.3. Step 3—Optimisation Model Design and Development
Step 2 of the process is devoted to presenting the optimisation model which is developed to assess the optimum water flow of IS. Hence, the systematic method used for developing the model, the objectives of optimisation, the constraints, and the key variables are described in the following sections.
3.3.1. Proposed Systematic Method for Optimisation Model Design
Various graphical and mathematical modelling approaches have been adopted for modelling optimum resource exchange networks. In a study by [
31], the authors applied the graphical approach in their study of water system integration that targeted maximum water reuse. However, a major drawback of the graphical approach was found by [
32], as the approach was ineffective for use in large-scale systems consisting of multiple water sources, water sinks, and contaminants. Studies conducted by [
33,
34] also verified the ineffectiveness of pinch analysis for use in water networks with multiple contaminants and multiple freshwater sources. As [
32] stated, the mathematical programming technique has emerged to overcome the limitations of the graphical approach.
The studies by [
35,
36] proposed water targeting network models with multiple contaminants based on mathematical programming. The main mathematical programming approaches used are linear programming (LP), mixed integer linear programming (MILP), and mixed integer non-linear programming (MINLP) models which can easily deal with multiple contaminants, different constraints, and multiple water sinks, sources, and water treatments. Moreover, the linear programming (LP) approach, as a powerful tool, can find the optimal value of a linear objective function, subject to linear constraints [
32].
According to a study by [
10], flexible and robust optimisation are other approaches used, in which robust optimisation provides a more feasible solution for decision makers to use in developing optimum exchange networks. The same approach has been utilised by various researchers in the similar field of designing industrial networks. For example, [
29] proposed an optimal allocation of energy sources to related energy sinks by using robust optimisation rather than a flexible model, adding that flexible networks could involve variations due to seasonal and daily changes in the process. Considering the above points, the optimal water flow assessment model in the current study was developed using the mixed integer linear programming (MILP) approach (the Symplex coding method) to find the optimal value of the targeted objective as the objective, and all constraints were linear.
3.3.2. Objective of Optimisation
In the existing literature, the main objectives for optimisation problems are related to the economic and environmental objectives of water networks [
5]. Economic objectives in IS networks have been the most developed and studied objectives in optimisation studies [
37]. Most optimisation models in the previous literature have considered the cost reduction of water treatment and transportation between industrial plants [
3,
5]. Another study by [
9] proposed an optimisation model for minimising the capital and operating costs of constructing piping connections and treatment facilities for wastewater. However, environmental indicators in IS networks have not been as well developed as economic indicators. Fewer studies were found that considered environmental indicators as objectives for optimising the water flow. As examples for the optimisation of environmental objectives, [
5] conducted a study developing an optimisation model for water flow in EIPs by means of water quality. A study by [
12] considered the use of geographic information systems (GISs) for industrial water reuse modelling, while [
11] studied input–output modelling of water supply chains in industrial parks. Therefore, the current study recognised the absence of a model for optimising the water flow of industrial symbiosis through maximum wastewater recovery. Furthermore, in the field of mathematical optimisation, many contributions have been made toward both single- and multi-objective formulations of problems [
38,
39]. For example, a study by [
5] developed an optimisation model by simultaneously considering economic and environmental objectives.
As indicated in the above-mentioned prior research, the objective functions of the capital and operating costs of wastewater treatment as well as the reduction in the environmental impact by EIPs have been solved separately by normalising them as single and separate objectives using the goal programming method. Optimisation models have focused on EIPs in terms of the minimisation of capital and the operating costs of treatment facilities and the minimisation of the quantity of water consumed [
3,
10]. Hence, among the single- and multi-objective optimisation in mathematical programming, the current research used single-objective optimisation and only considered environmental indicators. As research was lacking on environmental indicators of IS networks for optimising water networks in comparison to studies on economic indicators, the objective of the optimisation proposed in this research related only to environmental indicators. Accordingly, the objective of the proposed optimisation was to reduce freshwater consumption in the industrial zone/IS network by reusing treated wastewater through its maximum recovery, which may result in reducing wastewater discharged to the environment.
3.3.3. Constraints for Optimisation
In the optimisation literature, various constraints can be found, which have been considered when designing optimum exchange networks. [
5] developed an MILP model by considering water quality, subject to various constraints, such as the input–output water balance, quality, and topological constraints. A model developed by [
10] was subject to material balances and quality constraints, with the input and output water balance ensuring that each industrial entity would only accept as much water as it demanded and would only release as much water as was available. The average consumption of freshwater inputs and wastewater outputs of each entity is considered in quantifying the available water supply and demand within the network. Furthermore, this assumed that each industrial entity had already integrated recycling or pre-treatment within its facility, thus resulting in the single-inlet and single-outlet streams. The quality constraint considers the maximum allowable rate of contaminants in both freshwater and treated wastewater. Quality at the water sink ensures that each industrial plant only accepts input water from water sources if the water satisfies the maximum contaminant limit [
5]. As reviewed in the literature, the quality of freshwater and wastewater discharge by each individual industry is measured as per the available water quality regulations [
40,
41]. The available water quality regulations adopted in industries were considered to determine the maximum allowable rate of the contaminant of each participating industrial entity of the IS network. Accordingly, by referring to key literature, the proposed model was conceptualised by limiting to the water quality and the water balance at the water sink and water source.
3.3.4. Key Variables and Parameters of the Model
Three key variables, two parameters, and the related formulae (Equations (1)–(3)), which were considered in developing the optimisation model, are shown in
Table 3.
The variables are further elaborated below.
- (a)
Freshwater utilised by water sink
As per the findings derived from the desk study of global IS cases, freshwater is supplied to the industries from external water sources, which mainly include lakes and the city water supply [
26].
- (b)
Wastewater generated by the water source
The desk study findings revealed that wastewater outputs of industrial entities in IS networks include wastewater collected from households at the city level, wastewater with sewerage, and wastewater from manufacturing processes (industry effluent) [
26,
27].
- (c)
Treated wastewater from water source to water sink
Industries obtain treated wastewater from other industries in two different ways, directly and indirectly [
19]. The water sink obtains treated wastewater directly from other water sources and indirectly through centralised wastewater treatment. In the indirect method, the water source sends the wastewater through a centralised wastewater treatment process and shares it with other industries [
19,
21].
According to [
35], water loss may occur during wastewater treatment due to the evaporation and removal of concentrated contaminants. As further stated by these authors, within the process water network, the removed mass load of contaminants from wastewater treatment is usually too small when compared to wastewater flow rates; thus, in these cases, it can be assumed that the inlet and outlet wastewater flows of wastewater treatment units are the same.
The model parameters comprise: (a) the number of water sources and water sinks, and (b) the number and types of water quality parameters, as described below.
- (a)
Number of water sources and water sinks
According to the “3-2 heuristic” criterion introduced by [
16], at least three different entities must be involved in exchanging at least two different resources for the model to be counted as a basic type of IS. Accordingly, the water source–water sink relationship between three industrial entities is considered as the threshold.
- (b)
Number and types of water quality
Many studies can be found in the literature on the optimisation of water networks in industrial symbiosis related to water quality. Aviso developed the optimisation model by considering the multiple quality contaminants of water comprising three parameters, namely, Total Organic Carbon (TOC), Total Suspended Solid (TSS), and Total Dissolved Solids (TDS) [
10]. The optimisation model developed by [
32] also used the multiple quality contaminants in their model, in which Total Suspended Solid (TSS), Total Dissolved Solids (TDS), Biological Oxygen Demand (BOD), Chemical Oxygen Demand (COD), and hardness were considered by setting the maximum tolerance limits. However, the selection of contaminants was based on the specific industrial entities that participated in the water network in the selected context [
10]. Considering the above points, multiple quality contaminant concentrations were considered in the current research model by setting the maximum allowable quality limits. Therefore, it was assumed that all contaminant concentrations of each water sink and water source were fixed to their maximum values. However, the selection of the number and types of quality contaminants remained to be decided upon in the selected context.
3.3.5. Mathematical Formulae Development
With the use of mathematical modelling, the optimisation model was developed with three key mathematical formulations: (i) objective function; (ii) water source and sink balance (water demand and supply); and (iii) quality constraint (maximum allowable concentration of contaminants). The taxonomies of the model indices, parameters, variables, and constraints are shown in Nomenclature.
Problem Statement
Three participating industrial entities (plants) located in the same industrial park in close proximity consume freshwater for their industrial processes and discharge wastewater to the environment with no or minimum recovery. It is planned that the total freshwater (FW) consumption (quantity and cost) in the selected zone be minimised by developing an optimum water flow between the participating industrial entities, which results in minimum wastewater (WW) generation. Each industrial entity is considered as a “black box”, with no information provided regarding its internal sub-processes and only a single stream entering and exiting each entity.
Objective Function
The overall objective is to minimise the freshwater consumption of water sinks (
q) of the selected IS network through maximum wastewater recovery, which results in minimum wastewater generation. The objective function is given in Equation (4).
The objective function is subject to the water balance at both the water source and water sink, with quality constraints explained below.
Water Balance at Sink
In the given scenario, “q” represents the water sink. The demand of the water sink “Dq” is fulfilled by TWW acquired from the water source to the water sink “TWWpq” and by freshwater “FWq”, which is supplied by an external source without exceeding the maximum allowable level of water quality. For each sink q, the freshwater supply (FWq) from the external source and the supply of TWW from source p (TWWpq) must be equal to the required water demand at the water sink (Dq).
The water balance for each sink
q is given in Equation (5).
Water Balance at the Source
In the given scenario, “p” represents the water source. Each water source is characterised by the available water flowrate (Sp) and quality “m” of its available TWW. For each source p, the generated wastewater (WWp) and treated wastewater from source p to sink q (TWWpq) must be equivalent to the available water flow.
The water balance for each source
p is specified in Equation (6).
Quality Constraints at the Sink
It is important to consider the quality of freshwater and treated wastewater as the input flow into the water sink. Therefore, the Nm (number of selected quality parameters m) is considered at each water sink. It is assumed that the contaminant concentration of each sink and source is fixed to their maximum values. Furthermore, the quality of freshwater and wastewater is considered separatel,y as it is impracticable to determine these together. The concentrations of contaminants at each sink referring to the quality of treated wastewater and the quality of freshwater are given in Equations (7) and (8), respectively.
In Equations (7) and (8), Np represents the total number of water sources, TWWpq refers to the flowrate of treated wastewater from source p to sink q, Cpm refers to the quality measurement of parameter m in source p, FWq represents the freshwater utilised by sink q, and Cfm denotes the quality measurement of parameter m in available freshwater. Dq represents the demand flow rate of the water sink q; whereas Cqm refers to the quality measurement of the parameter m in the water sink q.
An additional constraint was introduced to ensure the single inflow and outflow of TWW from one entity to another, considering the following reasons:
The additional constraint is given in Equation (9).
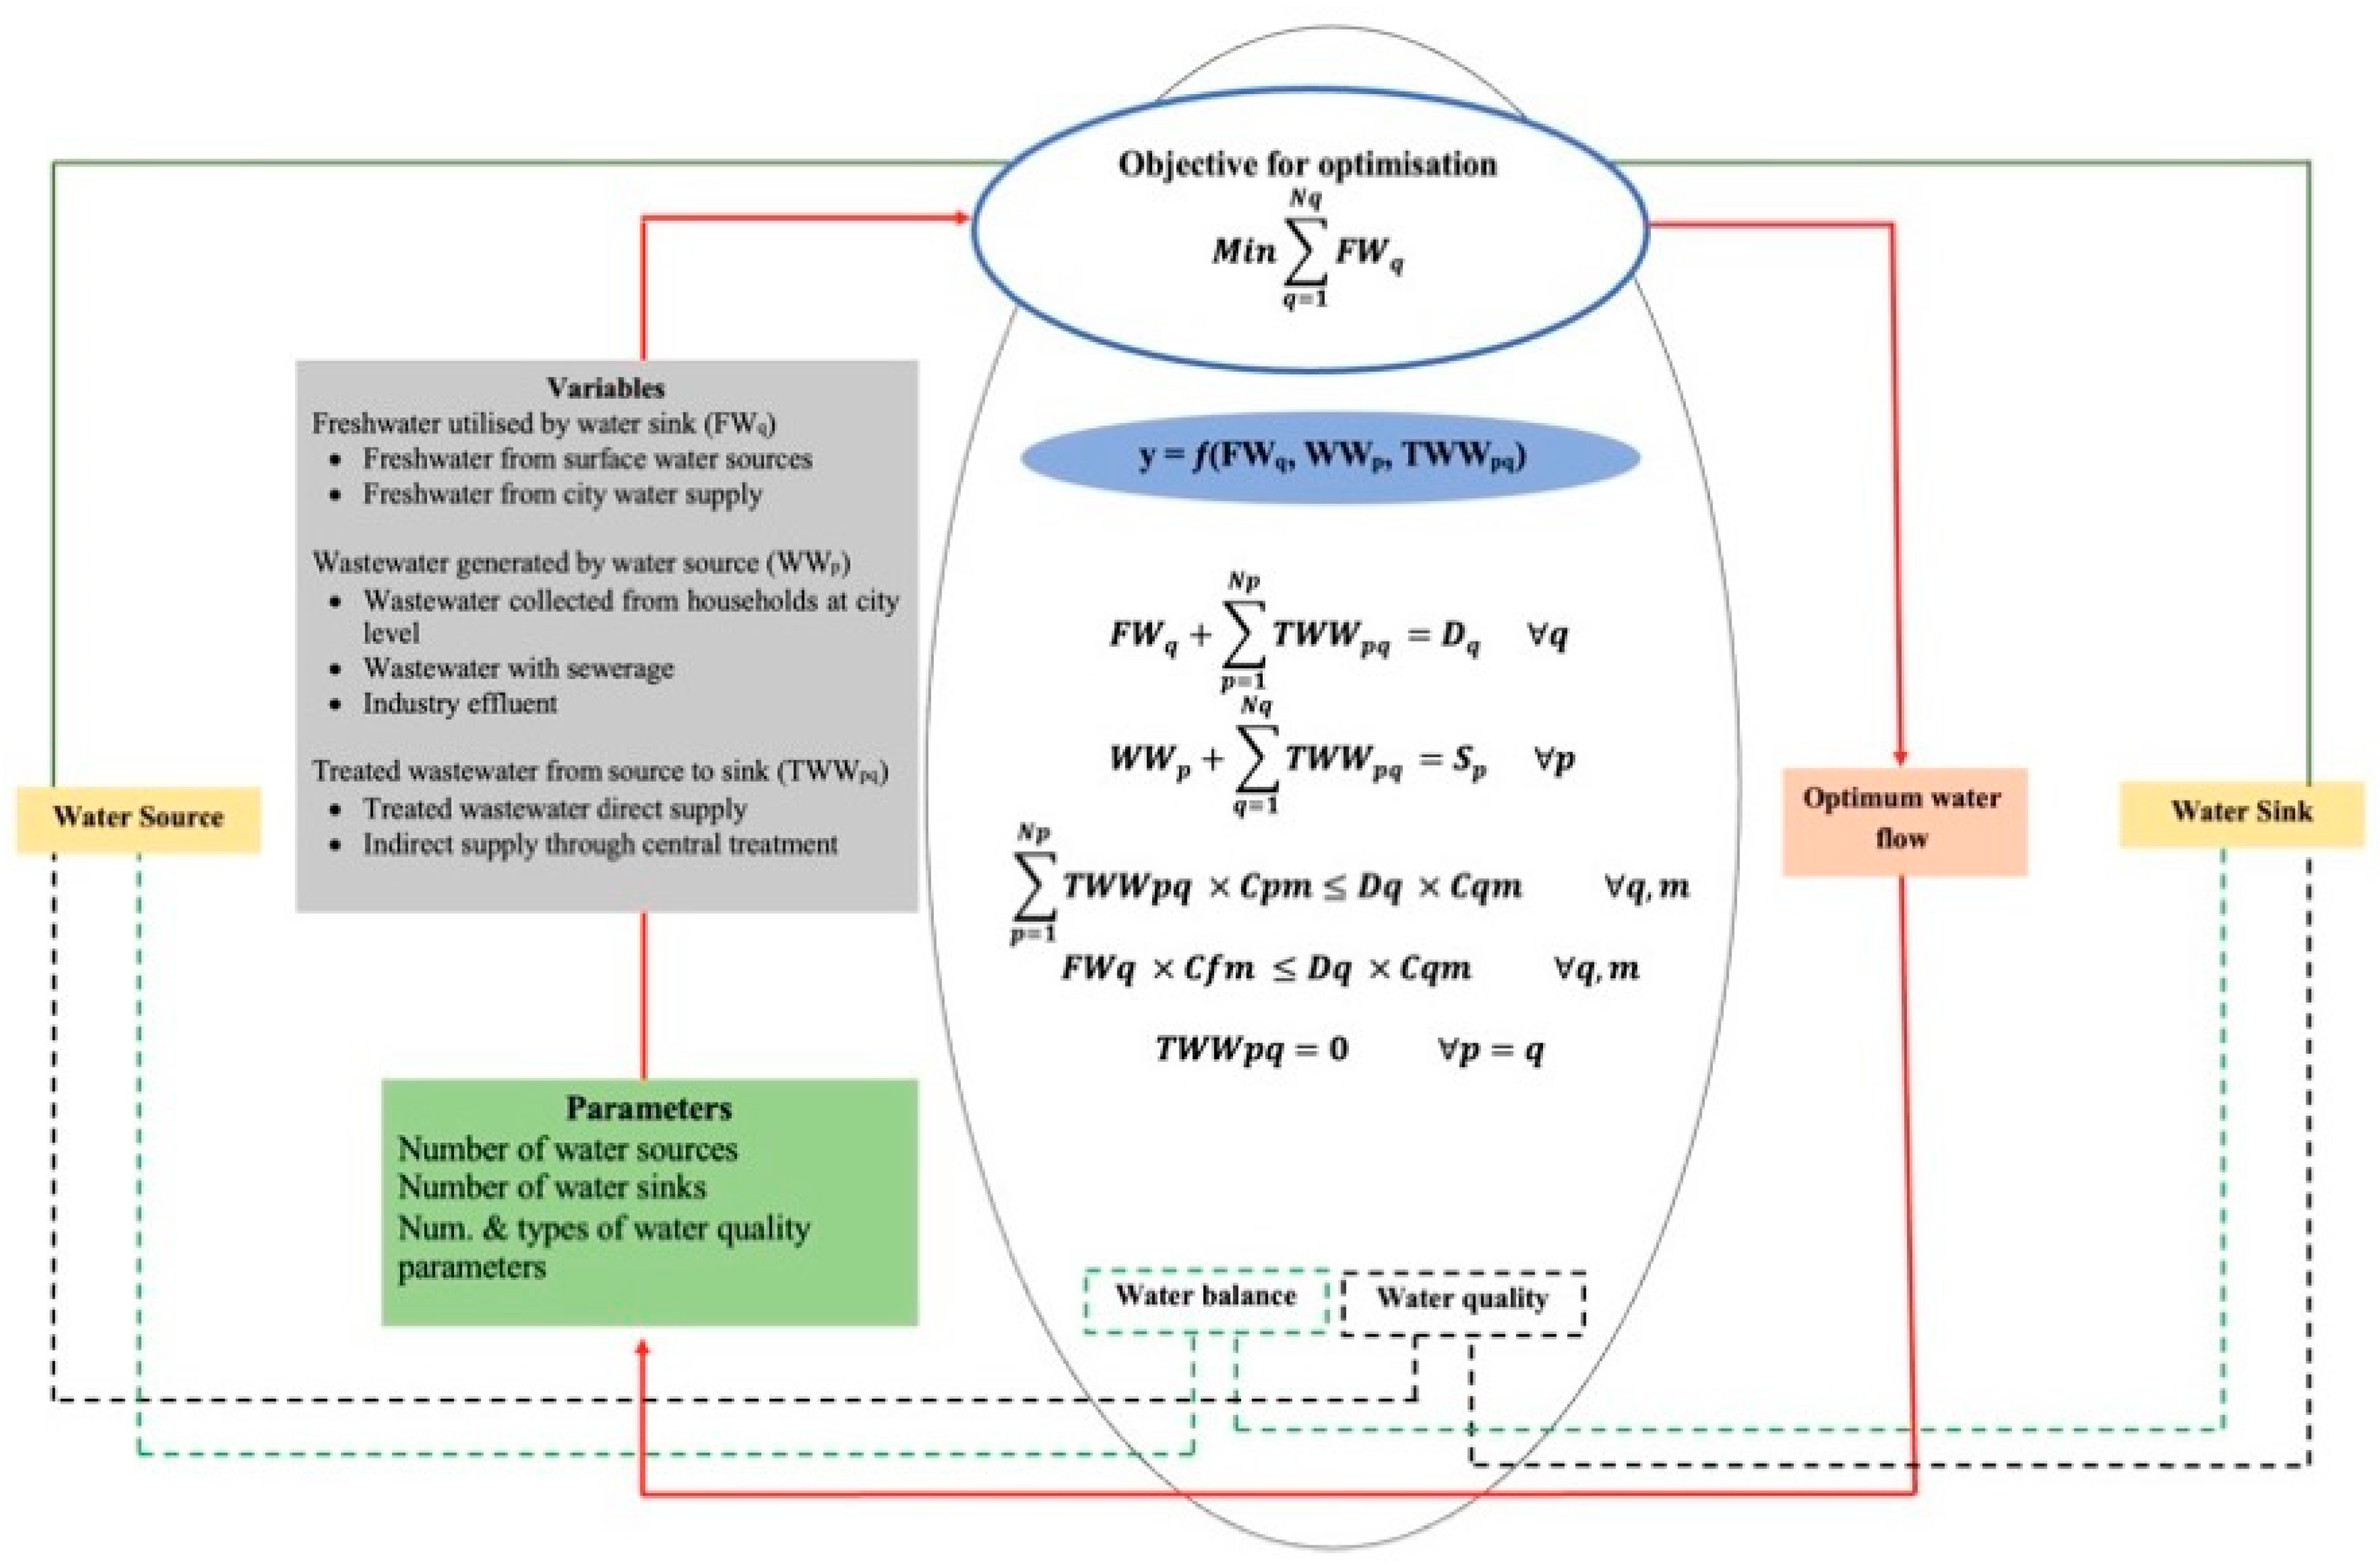
Accordingly, by incorporating the above-identified methods, objectives, constraints, variables, parameters, and mathematical formulae, the conceptual model for assessing the optimum water flow of IS was developed, as presented in
Figure 6.
As specified in the model, the optimum water flow between each industrial entity can be designed by achieving the objective of minimising total freshwater consumption in the industrial zone. Furthermore, as per the objective of optimisation being considered, the reduction in freshwater consumption in the optimal water network can also be obtained.
The developed model was appraised through expert interviews consisting of five selected professionals with more than 10 years of experience in the industry (refer to
Section 2). Through that, key variables of the conceptual model were refined, and further improvements were identified.
According to the analysis, the majority of the experts highlighted that the completeness and appropriateness of the model are at an outstanding level, where the clarity of assessment can be improved by refining the model to a selected context. Accordingly, various improvements were proposed, as summarised in
Table 4.
Since the proposed conceptual model is still at its early development stage, the proposed improvements were considered in order to enhance the clarity of assessment. Further, as a way forward for the research, the model will be subjected to more empirical testing and research for its practicality and further refinement.
3.4. Step 4—Assessment of the Optimal Configuration
The decision about the optimum solution in support of the objective of minimising total freshwater consumption in the industrial zone is considered next. Through using the MILP approach, the optimal value of the targeted objective can be obtained, as the objective and all constraints are linear. The optimum water flow between each industrial entity can be designed by achieving the objective of minimising total freshwater consumption in the industrial zone. Furthermore, as per the objective of optimisation being considered, the reduction in freshwater consumption in the optimal water network can also be obtained. If the optimal value cannot be obtained or the water flow is not optimal, “re-processing” takes place by again proceeding to Step 1 of the optimisation development process.
4. Discussion and Conclusions
As treated wastewater provides an alternative water source for reducing industrial water demand, initiating an IS-based water exchange network between industries is an ideal platform on which to reuse and reshare treated wastewater. As found in previous research, many IS networks across the globe have failed in the long term due to inefficient planning of the water synergies. The traditional top-down planning approach of industrial symbiosis has especially showed a deficiency, lacking a standardised way to pre-evaluate the planned water synergies prior to implementation. Hence, this research proposes a re-development of the traditional top-down planning approach by adding a new stage of “pre-evaluation and optimisation modelling”, which will add value to the industrial symbiosis literature.
The proposed model can be conveniently used to pre-evaluate and design optimum water networks between these industries, which are located within the same geographical boundary.
Pre-evaluation can also be used to provide a feasibility assessment of the planned water synergies before their implementation within the selected industrial setting.
Various graphical and mathematical modelling approaches have been adopted for modelling optimum resource exchange networks in previous research, which have been mainly focused on minimising the operation cost, water transportation cost, and water integration.
The proposed model is more convenient for application in similar industry settings by industry practitioners in assessing the optimum water flow of IS, as it was designed as a generic linear relationship between water source and water sink industries.
Furthermore, it ensures the successful implementation of optimum water exchange networks with warranted economic, environmental, and social benefits in the long term at both institutional and industrial park levels.
Indeed, the proposed model can be used as an iconic solution for countries suffering from water stress to reduce the industrial demand for freshwater. Hence, the proposed conceptual model can be applied in any context for optimising the water flow of IS, subject to context-specific enhancements.
As the next stage of this research, the developed model will be evaluated in a selected context in order to enhance its practicality through empirical testing. Further, the feasibility of the developed model will also be evaluated in terms of economic, environmental, and social feasibility.


