Review

Systematic Search Using the Proknow-C Method for the Characterization of Atmospheric Particulate Matter Using the Materials Science Techniques XRD, FTIR, XRF, and Raman Spectroscopy

by
Mauricio A. Correa-Ochoa
1,
Juliana Rojas
1,
Luisa M. Gómez
1,
David Aguiar
1,
Carlos A. Palacio-Tobón
2 and
Henry A. Colorado
3,*
1
Grupo de Investigación y Laboratorio de Monitoreo Ambiental G-LIMA, Universidad de Antioquia UdeA, Calle 70 N°. 52-21, Medellín 050010, Colombia
2
Grupo Giga, Universidad de Antioquia UdeA, Calle 70 N°. 52-21, Medellín 050010, Colombia
3
CCComposites Laboratory, Universidad de Antioquia UdeA, Calle 70 N°. 52-21, Medellín 050010, Colombia
*
Author to whom correspondence should be addressed.
Sustainability 2023, 15(11), 8504; https://doi.org/10.3390/su15118504
Submission received: 8 February 2023 / Revised: 8 May 2023 / Accepted: 16 May 2023 / Published: 24 May 2023
(This article belongs to the Special Issue Air Pollution Management and Environment Research)

Abstract

:
Particulate matter (PM), particle pollution that can travel long distances, is a big concern because it contains liquid droplets or microscopic solids resulting in significant health issues such as respirational and cancer problems. Therefore, the characterization of these particles is very significant as a hazard to public health. PM can be identified by X-ray diffraction (XRD) and Raman spectroscopy (RS), both powerful and non-destructive technologies. RS, in particular, allows the identification of black carbon, considered one of the pollutants with the greatest influence on climate change. Another important technology for the evaluation of inorganic and organic functional groups present in PM compounds is the Fourier transform infrared spectroscopy (FTIR). X-ray fluorescence (XRF) provides elemental analysis, revealing, in many cases, the original source of the sample. In order to understand the current state of the art, the Proknow-C method was applied to track the most recent information on PM characterization. Aspects such as sample collection, filter material, characterization parameters, PM components, and the advantages and limitations of each technique are discussed. PM minerals are found to be composed of silicates, oxides, sulfates, and carbonates. The elemental components of PM are classified into five categories: marine aerosol, mineral material, anthropogenic elements, organic carbon, and elemental carbon. The XRD technique is a powerful, fast, and non-destructive tool to identify various minerals present in PM. On the other hand, the XRF technique requires minimal sample treatment, but its sensitivity is limited for the determination of trace metals and some relevant environmental elements. FTIR spectroscopy is able to identify and quantify all organic functional groups present in atmospheric PM. Despite its advantages, a proper choice of calibration method is crucial to ensure its effectiveness. RS is fast and simple, although it only detects Raman-active functional groups. These are some of the advantages and limitations of these techniques addressed in the following review article.

1. Introduction

Particulate matter (PM) is typically classified by its aerodynamic diameter (Dp) into PM2.5 (less than 2.5 µm) and PM10 (less than 10 µm) [1]. PM, once in the air, can alter its composition and size by evaporation, condensation, grouping with other particles, or chemical reaction. PM2.5 and PM10 particles are considered as one most significant air contaminants in the world, which have a strong influence in damaging the respiratory system [2,3]. The health effects depend on different parameters, which include exposure dose, chemical composition, morphological characteristics, surface reactivity, hydrophobicity, and hydrophilicity [2]. PM10 particles can be dispersed over long distances from their source, which can be influenced by meteorological factors such as wind and rain. In addition, in many cases, the low visibility in cities is associated with PM10 because of its absorption and sunlight scattering at some wavelengths [4]. On the other hand, the carbonaceous aerosol (black and organic carbon mixture) is among the most important components of PM2.5, playing a key role in the transport of hazardous materials, damaging human health, and causing climate change. Exposure to these particles is associated with an increase in pulmonary and cardiovascular diseases [3].
PM can be of natural or anthropogenic origin [5]. Naturally occurring particles arise from soil erosion [6], transport of sea salt [7], wildfires [8], volcanic eruptions [9], and biological materials emissions [10]. Instead, anthropogenic origin particles come from human actions, which include vehicular traffic, combustion, industrial processes (industries such as brick, glass, cement, and power plants, among others), mining, metallurgy and biomass burning [2]. Anthropogenic particles can be divided into several subtypes: metal particulates, fly ash, soot, and organic matter. Fly ash has a spherical morphology; it is commonly multimineral composed and chemically complex, arising from coal combustion processes. Soot is mainly derived from vehicle exhaust gases and generally has an irregular geometry [11,12].
Different types of mineral particles can act additively and synergistically in their effect on health; therefore, mineralogical characterization studies are essential to understand the source and pathogenicity of PM [13]. The mineral structure of the solid particles can be determined by scanning electron microscopy (SEM) and X-ray diffraction (XRD) [14,15], while X-ray fluorescence (XRF) is used to determine the chemical composition [16]. Other techniques, such as Raman spectroscopy [17] and Fourier transform infrared spectroscopy (FTIR) [18], allow the identification of the composition of PM. The mineral compositions of the PM depend on factors such as the minerals released by the sources in the particular study area, the geology and geomorphology of the location, and wind direction [19].
According to several authors [20], in main urban locations of Latin America, the PM10 and PM2.5 daily and annually are exceeded the safe concentrations suggested by the World Health Organization (WHO). In 2016, according to WHO, the year average PM2.5 in the main South American urban areas received the highest value in Peru (29.0 μg/m3), followed by Bolivia, Chile, and Colombia. In Colombia, various epidemiological studies correlated air pollution to health effects, finding that there is a high hazard of respiratory issues such as asthma problems in children under 6 years old, particularly due to exposure to high contents of PM2.5, PM10, lead, and soot. The Aburrá Valley, situated in the Department of Antioquia, contains the Metropolitan area of the city of Medellin, located in the middle of the Central Mountain Range of the Colombian Andes. Figure 1 shows different images regarding air pollution in Medellin, generated from vehicles (a and b), and a large haze covering the city (c). From several studies conducted in this region, it is known that PM concentrations exceed the levels allowed in the Annual Air Quality Guidelines for PM2.5 promoted by the global organization WHO. This represents a great risk to the health of the inhabitants, and it is predicted that the number of deaths between 2016 and 2030 will increase by 156% due to this problem [20].
The study of PM2.5 and PM10 characterization and their limitations is closely linked to sustainability elsewhere since it is essential to understand how these pollutants affect the environment and human health. Exposure to elevated concentrations of PM2.5 and PM10 has been associated with various respiratory and cardiovascular problems in humans, as well as with negative impacts on terrestrial and aquatic ecosystems. Thus, researching these pollutants and developing more accurate characterization techniques can not only significantly contribute to the prevention and mitigation of their harmful effects but also solve the problem of having a more sustainable society.
This literature research has been conducted following the Proknow-C search method, which offers an important contribution to the process of selecting relevant literature for systematic reviews. Given the increase in the number of scientific publications in recent years when compared with the Methodi Ordinatio (traditional method), it became necessary to identify and select relevant publications to ensure the quality of systematic reviews using quantitative and/or qualitative approaches. In addition, the articles citing Proknow-C cover a wider range of research fields, suggesting that the method is applicable to a variety of disciplines. In contrast, the articles citing the Methodi Ordinatio focus on a more limited set of subject areas. It is important to note that both tools have been recognized for their effectiveness in selecting relevant literature and their ability to adapt to different fields of research. However, the Proknown-C method has been selected in this research for its ability to adapt to different research needs and to analyze with filters and other criteria global data in a systematic way [21].
The Proknow-C method is divided into four main sections: portfolio selection, bibliometrics, research questions, and systematic analysis. The bibliometrics section corresponds to what is known in the research, where several criteria are established to choose a collection of significant publications. The bibliometrics section includes descriptive bibliometric parameters, such as the count of articles published by year, publication type, and the most cited references. The systematic analysis involves a traditional systematic review of publications. The research questions section is the definition of novel research questions. On the other hand, while the Proknow-C methodology comprises four sections, the Methodi Ordinatio only focuses on the first section, i.e., the selection of relevant publications (i.e., the initial bibliometric stage) [21].

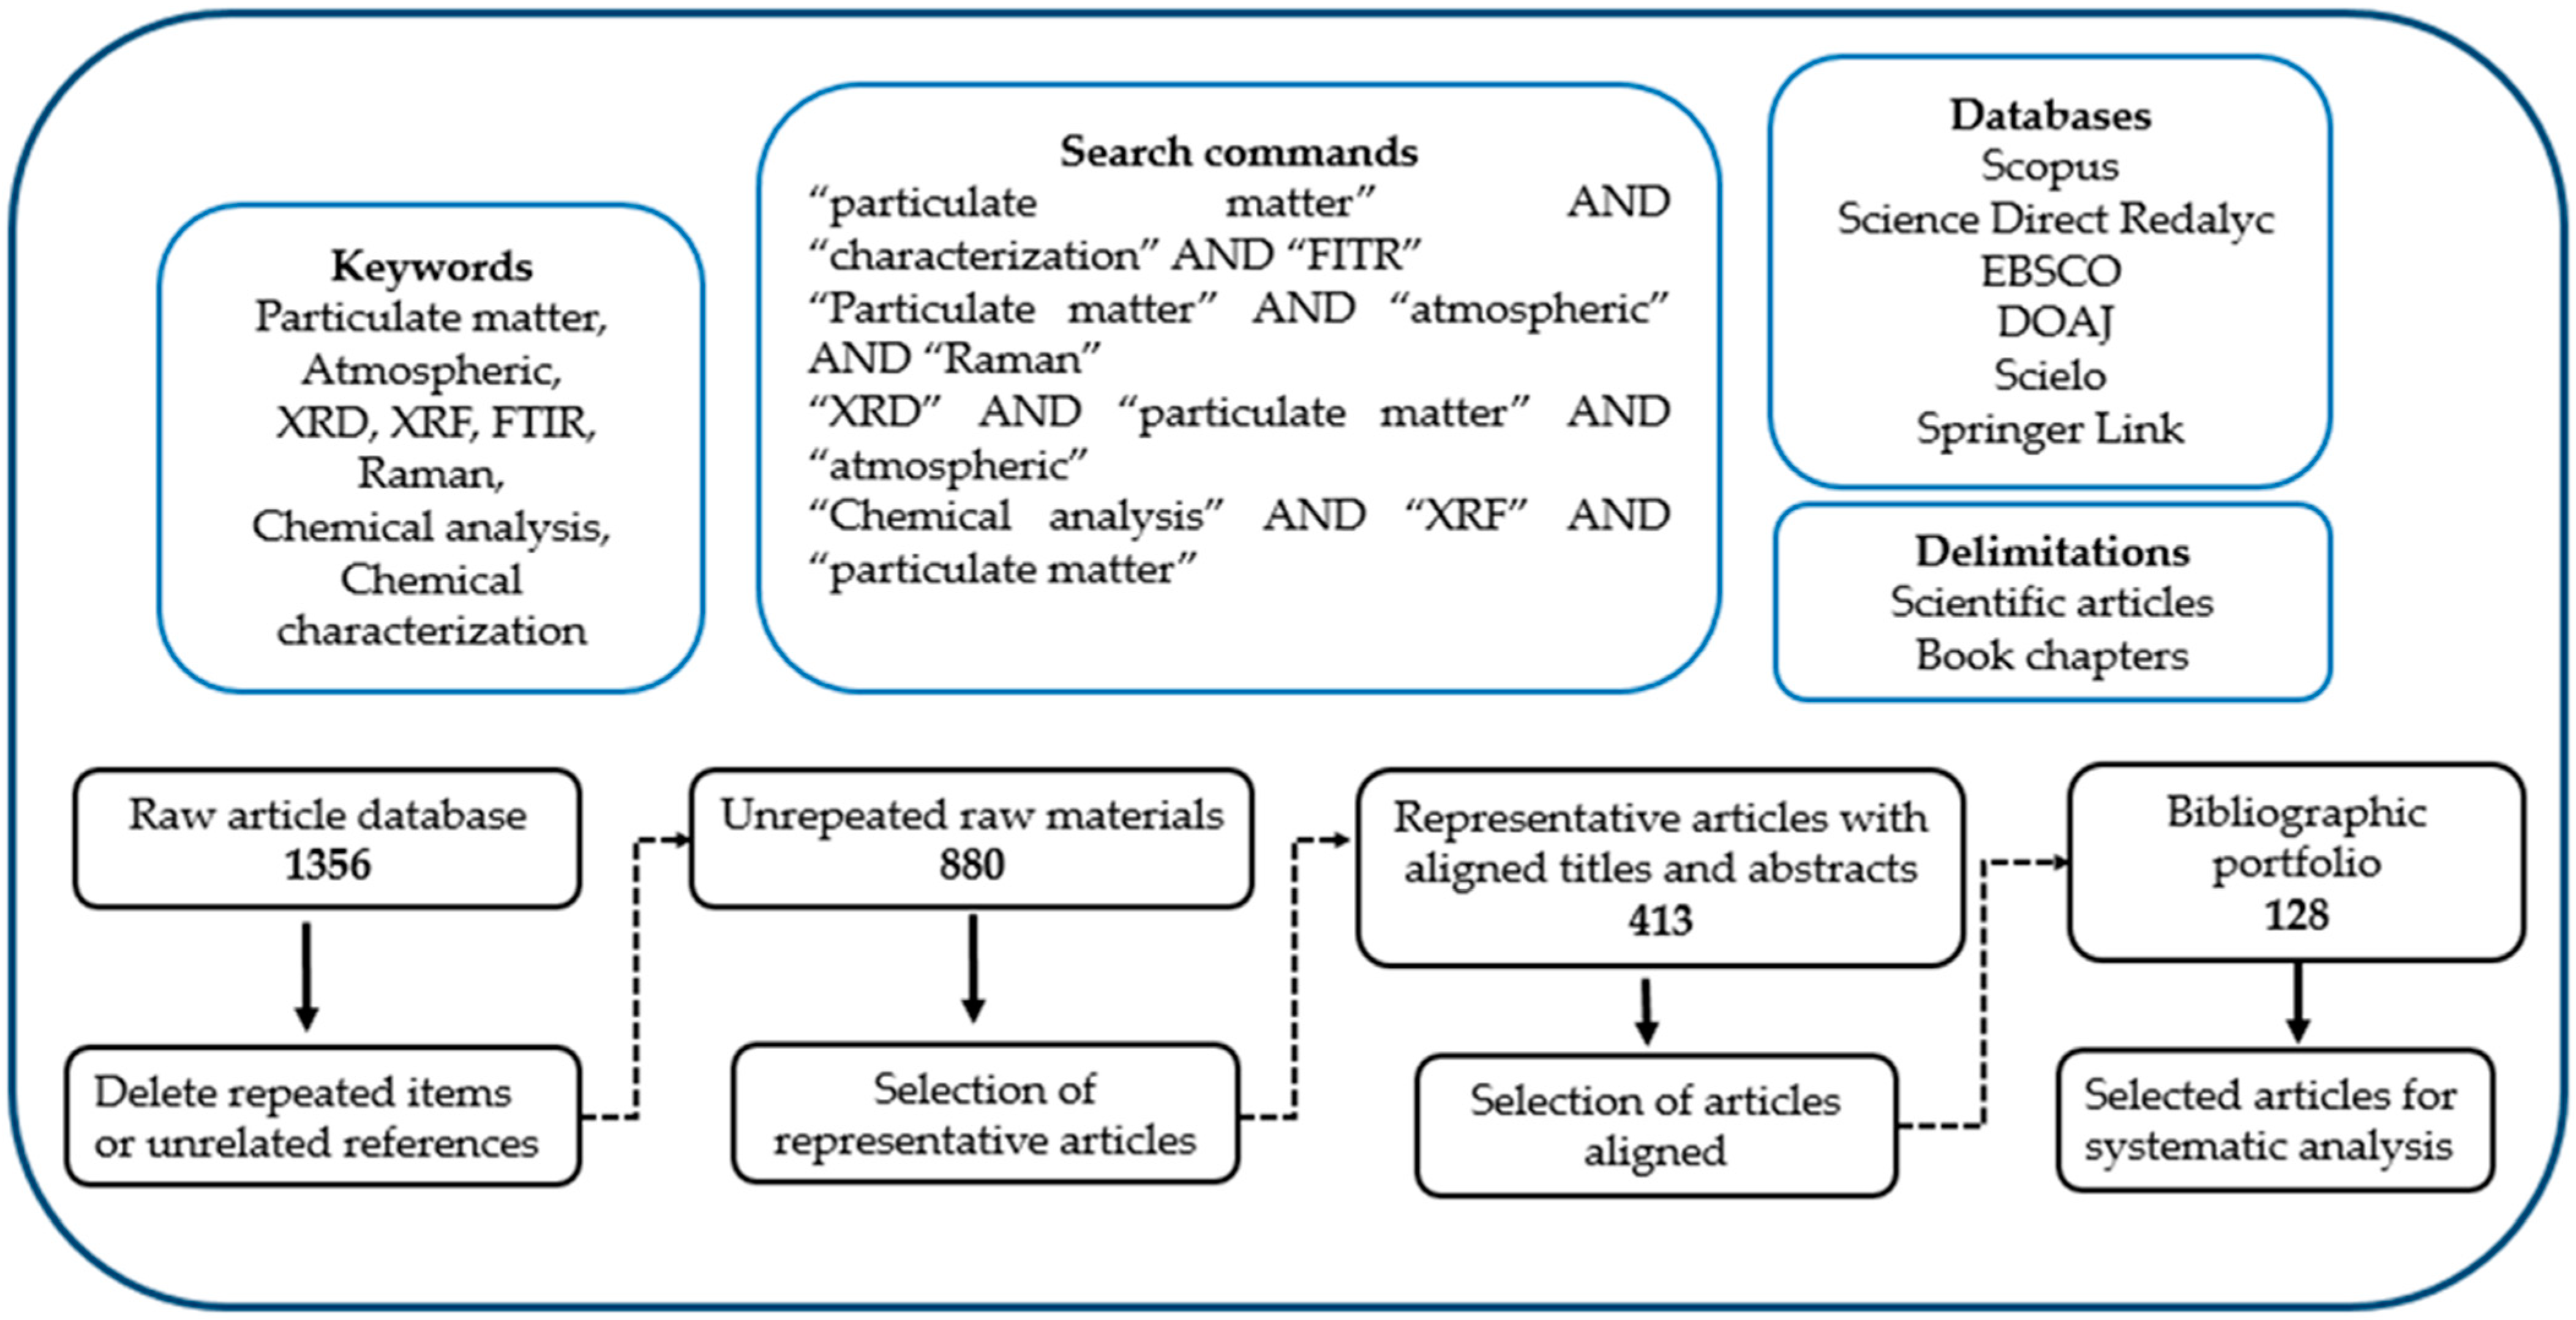
2. Search Methodology

A rigorous systematic review was carried out based on the Constructivist Knowledge Development Process (Proknow-C), which is characterized as a systematic review technique of the scientific literature that aims at the elaboration of a bibliographic portfolio on a specific research topic. This methodology is based on a structured and rigorous process that allows the identification, selection, and analysis of the most relevant and representative scientific articles on a given topic. The Proknow-C method begins with the definition of the research topic and the identification of keywords. Next, the most suitable databases and repositories for searching scientific articles are selected, and the crawling commands and delimitations are used to narrow down the search for publications.
Thus, four techniques were selected for the characterization of PM2.5 and PM10 particulate matter: XRD, FTIR, XRF, and Raman spectroscopy (RS). For each technique, a certain number of search equations, including specific keywords, were used (Table 1). The databases used in the search included Scopus, ScienceDirect, Redalyc, EBSCO, DOAJ, Scielo, and Springer Link.
Articles published in English and Spanish from 2005 onwards were considered, while articles that were not available in the full text were eliminated. A total of 1356 raw articles were found, of which 880 were unrepeated articles related to the topic. Through a rigorous selection process, the most relevant articles were selected according to the title, keywords, abstract, and conclusions, reducing the number of articles to 413. A thorough review of these articles was conducted to determine if they were fully aligned with the research objectives, resulting in a final bibliometric portfolio of 60 articles. The procedure is summarized in Figure 2.
To analyze the data, the software Microsoft Excel was used to filter the information and to create a bibliometric matrix that included relevant information for each article, such as title, author, year, journal, keywords, topic, context, location/country, objectives, sampling methodology, characterization techniques used, test parameters, results, conclusions, author’s recommendations, and remarks. The matrix was completed with the information obtained in each of the selected articles. The limitations of this systematic review were related to the limited availability of some articles (full text), which affected the inclusion of certain studies in the final bibliometric portfolio. However, every effort was made to obtain as much relevant and high-quality information as possible for this study.

3. Results and Discussion

Figure 3 shows the results obtained after applying the Proknow-C method to the literature search. The bar graphs shown provide an overview of the results of the search with the most relevant trends in terms of scientific production in the area of study.

3.1. X-ray Diffraction (XRD)

3.1.1. PM Collection Parameters for XRD Analysis

PM samples are typically collected for 24 h once a week or every six days [22,23]. Samples are usually collected in high-volume air samplers with a flow rate between 30–38 L/min [13,19]. Filters are conditioned for 48 h at a temperature of between 20 and 25 °C and to relative humidity (RH) between 40 and 50%. These filters should be weighed before and after and packed in zippered plastic bags to avoid contamination [22,24]. The date, time, and sampling at the site are recorded on the bag and maintained at a standard temperature [19].
The selection of the filter material is relevant when it comes to characterization studies. Some researchers agree that XRD analyses should be performed on quartz filters with a diameter of 47 mm [23,25]. However, the results may be affected by the presence of silica (SiO2) in the composition of the quartz filter. Thus, to avoid the interferences that this filter may cause, it is recommended to extract the PM with ethanol in an ultrasonic bath [26]. In addition, it is recommended to use polytetrafluoroethylene (PTFE) filters, popularly known as Teflon, which are suitable for gravimetric and elemental analysis using XRD. These filters are very stable and have low levels of contamination [1,13,24,27]. To characterize atmospheric PM by XRD, different authors have considered specific parameters to identify the mineral phases present in the PM collected in the filters.
XRD methods use intense radiation, i.e., Kα radiation, to produce diffraction, following Bragg’s law. Some authors use a variable voltage and current to identify the crystalline PM of the samples [28]. Other research takes a voltage between 40 and 45 kV and a current of 40 mA [27,29,30]. Other authors used 40 kV, with currents ranging from 100 to 200 mA [3,11,13]. These variations look to obtain a better intensity of the peaks. The detection limits of a compound vary depending on its characteristics and the used method of analysis. In general, for scan times of approximately one hour, the detection limits for XRD are estimated to range from 40 to 75 μg for some compounds [31].

3.1.2. Minerals Present in Particulate Matte

According to several studies, PM minerals identified in the atmosphere are composed of silicates, oxides, sulfates, carbonates, and other minerals, see Figure 4 and Table 2. Silicates are present as quartz (SiO2), illite, smectite, wollastonite (CaSiO3), vermiculite (MgAlFeSiO7), kaolinite (Al₂Si₂O₅(OH)₄), and calcium and aluminum silicates. Oxides are found as calcium oxide, iron oxide, magnetite (Fe3O4), and wustite (FeO) [32,33,34,35]. The sulfates occur as gypsum and koktaite (NH4)2Ca(SO4)2, while the phosphates are found as magnesium phosphate (Mg2P2O7) and silicon phosphates (SiP2O7) [36,37,38,39]. Carbonates could appear as calcite, magnesite, and dolomite (Ca(Mg(CO3)2, which is considered an additive in Portland cement [11,19,27,40].
SiO2 and aluminosilicates (kaolinite, feldspar, and others) are the main silicon-containing particles, which can be considered of natural and anthropogenic origin [41,42]. Sulfates such as gypsum, koktaite, and mascagnite are considered secondary PM of anthropogenic origin. These sulfates are formed because the oxidation of sulfur dioxide (SO2) generated as a consequence of hydroxyl radicals (OH) can generate sulfuric acid (H2SO4). This acid can eventually interact with ammonia (NH3), thus forming fine ammonium sulfate particles (<0.5 µm in diameter). The atmosphere´s calcite reacts with ammonium sulfate, giving rise to koktaite as an intermediate product, to finally form gypsum [27,43]. Gypsum mineral is a very common component of building materials and sea salt, appearing mostly in PM10 [11,27,44], while koktaite and mascagnite occur in the fine PM fraction (PM2.5) [43].
On the other hand, calcite (CaCO3) naturally appears in limestone rocks, soil, and in skeletons of marine nature [45]. In PM, the main calcite source is dust generated by construction [11]. Halite is considered the main representative mineral of sea salts [44,46]. Crystalline ferruginous phases include jarosite (KFe3+3(SO4)2(OH)6), magnetite, pyrrhotite (FeS), ankerite (CaFe2+(CO3)2), Schwertmannite (Fe8O8(OH)6(SO4)), chromite (FeCr2O4), yavapaiite (KFe(SO4)2), and hematite (Fe2O3), all associated with natural and anthropogenic sources such as steel and metalworking [29]. All these ferruginous phases are ubiquitous in fly ash samples and are derived from pyrite present in parent coal, also known to have high geochemical reactivity [12].
Table 2. Different minerals found in atmospheric particulate pollutants characterized by XRD.
MineralPreferential Diffraction Angle (2ϴ)References
1Kaolinite12.3°, 17.80°[2,27]
2Wollastonite12.5°, 8.5°, 21.6°[27]
3Wustite15.4°, 10.1°[27]
4Dorrite18.2°[27]
5Magnetite18.2°, 37.0°[27]
6Quartz20.9°, 26.70°, 40.36°[2,27,47]
7Koktaite7.8°, 21.7°[27,47]
8Gypsum23.7°, 24.01°, 27.5°[27]
9Feldspar13.7°[27]
10Calcite31.5°, 36.06°, 39.50°[1,2,3,4]
11Vermiculite21.8°, 23.5°[27]
12Dolomite16.9°, 31°, 41.2°[1,2,4]
13Halite31.5°[27]
14Muscovite20.6°[2]
15Hematite19.91°, 22°, 24.3°[2,4]
16Montmorillonite19.8°, 27.2°, 35.03°[2]
17Illite17.8°, 23.7°, 26.3°[2,4]
18Vaterite20.7°, 25.2°, 27.5°[2,4]
19Chrysolite19.7°, 24.3°[2]
20Mascagnite20.5°, 22.8°[3]

3.2. X-ray Fluorescence (XRF)

3.2.1. PM Collection Parameters for XRF Analysis

Different authors prefer to use the XRF (X-ray fluorescence) technique for the chemical characterization of particulate matter (PM) immersed in collection filters. This is because it allows multi-elemental analysis with a certain operational ease and does not require sample preparation. In addition, it is classified as a non-destructive technique [48]. These X-ray technologies use either photons or a focused beam of charged particles to excite electrons in the sample, enabling qualitative and quantitative analysis of trace matter [49]. The XRF analysis causes the ionization of atoms through an energetic X-rays beam. The emitted radiation by these ionized atoms in relaxation comprises qualitative and quantitative information from the elementals of a given sample [50,51,52].
The XRF technique uses an X-ray tube to excite the sample, a high-resolution semiconductor detector which is able to measure in the sample its emitted characteristic X lines. This technique can detect Si, Ca, S, Cl, Al, K, Cr, Ti, V, Ni, Mn, Pb, Fe, Zn, Br, and Cu in PM samples [52,53,54,55]. Several working conditions can be used for the detection of light elements (such as Si and Al) or heavier elements (such as Pb) [56]. The limit of detection for most elements is in the mg/kg order. A lower sensitivity was reported in lighter elements, such as those with an atomic number lower than 12 [57].
PM samples are collected in 24 h periods in medium-volume air samplers [58,59]. Generally, polytetrafluoroethylene (PTFE) or Teflon filters with a pore size of 2.0 µm and a diameter of 37 mm are used [58,59,60,61]. The filter is heated to a temperature of 80 °C for 2 h. This process eliminates any previous contamination the filter may have. After heating, it is stored for 24 h at a constant temperature of 21 °C (±0.5 °C) and relative humidity (RH) between 40 and 50%. This step ensures that the filter is in proper condition prior to sampling [58,59]. Figure 5 shows other polymeric materials that are used as filters, such as polyvinyl chloride (PVC), polypropylene (PPE), or polycarbonate (PC). After collection, filters can be analyzed using the techniques EDXRF, WDXRF, 3D-EDXRF, and P-EDXRF [57].

3.2.2. Elemental Composition of PM

The elemental components of PM are classified into five categories according to related to their origin and chemical composition: mineral material (MM), marine aerosol (MA), anthropogenic elements (AE), organic carbon (OC), and elemental carbon (EC) [62,63,64,65]. The marine aerosols category includes Na and Cl, while the mineral material category consists of K, Mg, Al, Si, Fe, and Ca. The category of anthropogenic elements includes S, Ni, Ti, Cr, As, V, Mn, Br, Cu, Zn, Sr, Pb, and Ba [66,67,68,69]. The presence of mineral material in PM is associated with soil dust resuspension processes and Saharan dust intrusions. K arises from the contribution of different combustion sources, including emissions from traffic engines, as this element is a component of lubricating oil additives [58]. Ca, as a mineral material, arises from a high concentration of limestone in the soil, while K and Fe could have an anthropogenic origin. On the other hand, it has been shown that the smaller the PM size, the higher concentration of anthropogenic elements. Within this classification, S is a prominent element in both PM10 and PM2.5 fractions [70,71,72,73]. According to the literature, S is typically found as ammonium sulfate when ammonia is present in high concentrations [56].
The main sources of Zn are vehicle emissions (tire wear) and the steel industry because it is used in the manufacture of alloys and for the surface coating of steel coils [35,74,75,76,77]. Both S and Ba are produced by the presence of water desalination plants, and in particular, S is generated by heavy industries such as power plants, which work based on fossil fuels [78,79,80,81]. Other elements such as Ni and V are associated with the oil sector, particularly fuel oil and petroleum coke used in ceramics and cement industries [70,82,83,84]. The presence of Al, Ca, K, Mg, and Rb is mainly due to mineral uses, which originate from road construction, ceramic emissions, soil resuspension, and dust emissions from the processing of mineral raw materials (quarries) [53,85]. Zn, Cu, Sb, and Sn are found due to brake and tire wear. Petroleum coke is characterized by the emission of elements such as V and Ni, which are enriched by the petrochemical industry [86,87,88]. Ti arises from emissions from stack kilns of cement and ceramic factories that use heavy oil fractions as fuel [89,90].

3.3. Fourier Transform Infrared Spectroscopy (FTIR)

3.3.1. PM Collection Parameters for FTIR Analysis

Fourier transform infrared spectroscopy (FTIR) technology enables the identification of the composition of PM. It is a non-destructive analytical technique that provides information on the bonds and functional groups present in a given sample [91]. This technique provides fast and low-cost analysis. In addition, the information provided by FTIR is useful for studying the behavior, origin, and properties of the inorganic and organic parts of PM, which can also be quantified by this technique [92]. For FTIR analysis of PM2.5 and PM10, an attenuated total refraction Fourier transform Attenuated FTIR spectrometer (ATR FTIR) can be used. ATR FTIR and regular FTIR spectra are similar: in general, they have the same peaks but with different relative intensities. One of the advantages of attenuated total reflectance spectroscopy is that, with minimal preparation, absorption spectra can be easily obtained for a wide variety of sample types [28].
PM sampling is performed continuously for 24 h using constant caudal and quartz or PTFE filters (47 mm diameter). Before carrying out the sampling of particulate matter, it is common to carry out a filter conditioning process. This process consists of heating at a temperature of 480 °C for 6 h in order to eliminate any residue or contaminant present on its surface [92,93]. In the measurement of PM2.5 and PM10, the presence of water can affect the accuracy of the results because the water peak can overlap with the peaks of functional groups of interest. For this reason, it must be ensured that the sample is dry before performing an IR analysis to obtain accurate and reliable results.
For the measurement of FTIR spectra, a 128-fold scan at a resolution of 4 cm−1 is required, using wavenumbers from 600 to 3550 cm−1 [42,92]. It is recommended to perform a previous process of dispersion and compaction with KBr. This process is carried out by dispersing 1 mg of KBr powder at a ratio of 1:20 and compacting at a pressure of approximately 1 MPa [88]. KBr is used in the preparation of samples with associated moisture since it is not active in the IR. The detection limits for some functional groups are presented in Table 3.

3.3.2. Organic and Inorganic Components Present in PM

PM2.5 is a complex blend of elemental, organic, and inorganic components such as sulfate ( S O 4 2 ), nitrate ( N O 3 ), ammonium ( N H 4 + ), and trace elements as well [37,95]. Analysis of FTIR spectra indicates the presence of different organic and inorganic functional groups. It is reported in the literature that the sulfate ion has an absorption peak of around 615 to 599 cm−1 [58,93]. It may have another absorption peak at 1100 cm−1, which due to absorption interference, is very difficult to recognize from the Teflon filter. Wavenumbers in the ranges of 3239–3215, 3054–3030, and 1435–1418 cm−1 correspond to the stretching of N H 4 + . The absorption bands at 3054–3030 cm−1 show weak signals associated with stretching vibrations of N H 4 + bonds, while around 1435–1418 cm−1, the absorption bands are much stronger thanks to the deformation of N H 4 + [96].
Table 4 shows that the peaks around 1356, 1320, and 825 cm−1 correspond to the absorptions of N O 3 , which is a fundamental component of PM2.5. On the other hand, sulfite ion ( S O 3 2 ) and calcium sulfate ( C a S O 4 ) have bands at around 694 and 671 cm−1, respectively [65,95,97,98,99]. The wavenumber of 671 cm−1 is attributed to the mineral syngenite K 2 C a ( S O 4 ) 2 · H 2 O . The band around 912 cm−1 is associated with the deformation of the Al-Al-OH group, belonging to the palygorskite´s dioctahedral layer [94,100,101]. The frequency peaks at 3535 and 3404 cm−1 are assigned to gypsum ( C a S O 4 · 2 H 2 O ) , and the bands appearing around 1682 and 1620 cm−1 correspond to sulfate stretching in gypsum [96]. The stretching vibrations of the -OH groups from clay minerals have been found to be associated with bands at 3693 and 3617 cm−1.
Silicate and silica ion adsorptions can be due to various minerals. Quartz and kaolinite are minerals found mainly in coarse atmospheric aerosol samples. Quartz (SiO2) absorbs more around 1090 cm−1 and 730 cm−1, while kaolinite ( A l 2 O H 4 ( S i 2 O 5 ) ) absorbs at 1010 cm−1 [92,102,103]. Calcium carbonate is one of the carbonate species identified in the coarse aerosol. Carbonate ions absorb at 1433 cm−1, generally showing a weaker but sharper peak at 877 cm−1. A lower frequency absorption can be used to characterize CaCO3 in atmospheric PM [104,105,106].
Organic uptakes in atmospheric PM arise from a complex mixture of hydrocarbons of different compounds. These absorptions, unlike inorganic absorptions, have the contribution of many different species in a single absorption. For example, the absorption of C=O will contain contributions from many different molecular species, which have different frequencies and intensities from each other [101,107,108,109]. The absorption bands between 1715 and 1705 cm−1 correspond to carbonyl groups (C=O) such as ketones, aldehydes, and carboxylic acids, which arise from different anthropogenic sources [58,110]. C-H bonds in the methyl and methylene groups have vibrations around 1460 cm−1. The existence of alkenes in PM samples was associated with bands from 990 to 815 cm−1 [111].

3.4. Raman Spectroscopy

3.4.1. PM Collection Parameters for Raman Analysis

In the Raman spectroscopy technique, a monochromatic laser light beam with a specific wavelength is used to illuminate an unknown sample of material. The sample can absorb, transmit, reflect or scatter laser light. The light scattered by the sample can result from two types of collisions: elastic (Rayleigh scattering) or inelastic (Raman scattering) collisions of the light with the sample molecules. Unlike Rayleigh scattered light, which maintains the same frequency as incident laser light, Raman scattered light has different frequencies corresponding to the vibrations of the molecular bonds present in the sample [28]. Scattering theory shows that this phenomenon is related to quantized vibrational changes similar to those occurring in infrared absorption. As a result, the wavelength difference between incident visible radiation and scattered radiation is related to the mid-infrared wavelength region. The infrared absorption spectrum and the Raman scattering spectrum are often very similar for a given species. However, there are differences between functional groups that are active in the infrared and those active in Raman, showing that these technologies can be used complementary. An important advantage of Raman spectra is that water does not cause interference, which makes it possible to obtain Raman spectra of aqueous solutions [28].
Raman spectroscopy is a simple, fast, and non-destructive method to characterize materials. It has wide applications for investigating the properties of airborne particles, such as chemical composition, pH, hygroscopicity, and more. This technique characterizes the degree of disorder of particles emitted by engines, soot particles, and other carbonaceous atmospheric aerosols [112]. The Raman spectrum is influenced by the space group of the crystal, so different polymorphs usually show different spectra [113]. Raman spectroscopy is a sensitive technique capable of measuring particles in samples from low-concentration environments. Detection limits vary depending on the experimental conditions and equipment used. Some studies report that the detection limits for PM2.5 and PM10 are 1µg/m3 and 5 µg/m3, respectively. Additionally, Raman spectroscopy has been found to be useful in quantifying respirable crystalline silica (RCS) mass, with a detection limit approaching 1/10th of that obtained with other techniques. Raman spectroscopy is more efficient than X-ray diffraction for measuring RCS concentration. This is because Raman spectroscopy has a typical detection limit of 0.21 µg, while XRD has a detection limit of 1 µg [114,115].
PM10 samples are collected for 24 h in 47 mm diameter quartz filters using low-volume samplers. On the other hand, PM2.5 samples are collected in Teflon of 37 mm diameter. The characterization of PM from Raman spectroscopy requires different equipment parameters to ensure proper analysis of air samples and minimum damage to the samples. For this reason, some parameters that different authors have used for the analysis of PM by this technique will be described. Some authors recommend that the laser wavelength should be 785 nm, while others use high-intensity pulses with frequency-doubled Nd: YAG lasers with a 532 nm wavelength [112,113,116,117]. The choice of laser power is essential to avoid thermo-decomposition of the samples, with ideally a power of 1 mW or 2 mW [117]. However, another study suggests performing the analysis using between 0.0001% and 10% of the laser power (150 µW) [116]. A silicon (Si) foil is used for the calibration of the equipment, with characteristic bands (520 cm−1). It is recommended that the spectral resolution be 1 to 2.5 cm−1, taken in the range of 100 to 2000 cm−1 or even up to 3000 cm−1 [112,113,116,117].
All point-by-point measurements are collected using exposure times between 2 and 10 s, while each spectrum is obtained over a range of 1 to 30 accumulations. PM particles commonly generate autofluorescence backgrounds associated with organic species that hinder the identification process; therefore, automatic polynomial baseline correction must be performed to smooth the fluorescence background [112,116,117].

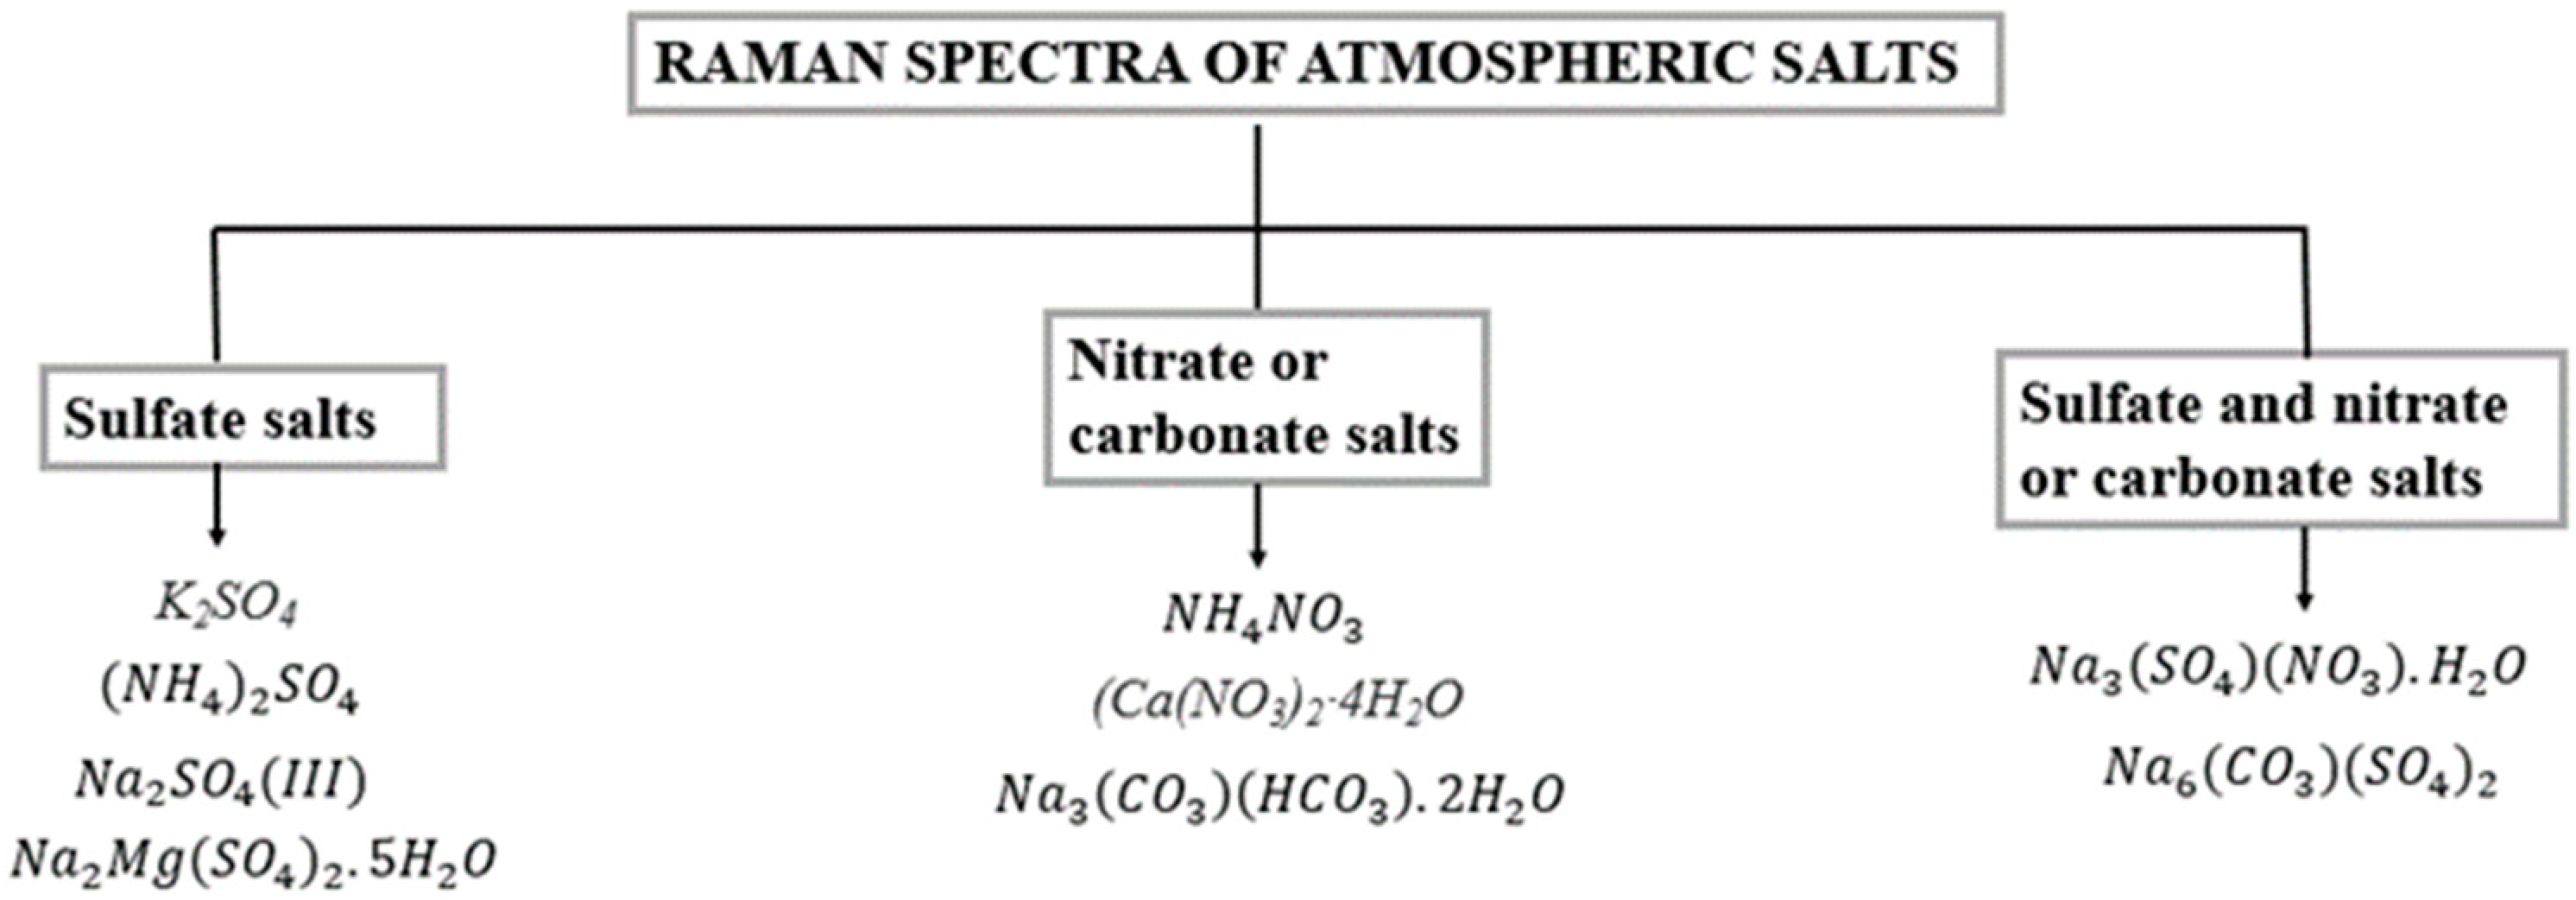
3.4.2. Compounds Identified with Raman Spectroscopy

The composition of the PM collection filter is sensitive to Raman. For this reason, it is recommended to measure the Raman spectrum of the filters to have a target as a reference. Particularly, quartz filters show broad bands at 480, 610, 800, 980, and 1890 cm−1 [116].
Black carbon (BC) is a key component of PM that affects both human health and climate. It is currently considered the second pollutant with the greatest influence on climate change. BC is a carbonaceous material usually linked with anthropogenic actions, such as biomass combustion and fossil fuel, and it is emitted directly into the atmosphere and has unique physical properties. BC is composed mainly of elemental carbon, hydrogen, and oxygen with less content. Moreover, contents of soot particles, organic carbon, and graphitic carbon originated from biomass partially burned [112,116]. With the Raman technique, it is possible to identify the presence of atmospheric BC particles.
Raman spectra of BC samples are generally analyzed in the wavenumber range of 800 to 2000 cm−1. It has been found for BC two overlapping bands at 1580 cm−1 and 1360 cm−1. The 1580 cm−1 band is associated with the G band of graphite, while the 1360 cm−1 band is the D band (defect band). These two bands show different shapes depending on the nature of the carbon [112,116], indicating that the CB particles consist of both crystalline graphite and non-graphite. Additionally, they can be decomposed into several bands, all representing D by the peak position. The D1 band, known as the “disorder band”, appears between ~1320–1360 cm−1, and it is characteristic of structures associated with soot particles. This band corresponds to a vibrational mode involving the edges of the graphene layer (A1g symmetry). In addition, there are three other bands D2, D3 and D4, at around 1620 cm−1, 1530 cm−1, and 1180 cm−1, respectively. The D2 band is linked with lattice vibration involving the graphene surface layers. The D3 band is linked to the amorphous carbon content of the soot, while the D4 band originates from vibrations of graphite lattices (A1g symmetry), ionic impurities, and sp2 and sp3 hybridized bonds. On the other hand, the G band corresponds to the mode of vibration of the E2g symmetry of crystalline graphite. The spectral parameters I D / I G , I D 3 / I G , R 2 = I D 1 / ( I G + I D 1 + I D 2 ) y R 3 = I D 3 / ( I G + I D 2 + I D 3 ) are used in the Raman spectroscopy characterization of carbon materials, including BC derived from biomass combustion, coal, gasoline, and diesel vehicle emissions. These parameters are defined as the ratio between the intensities of some peaks of Raman spectra of a sample. The peak intensity ratio ( I D / I G ) is one of the most common approaches to characterize carbonaceous structures of partially graphitic materials. This ratio is a useful measure of the number of structural defects in the BC, while the I D 3 / I G ratio is more sensitive to low-energy structural defects. On the other hand, the R2 and R3 ratios determine the amount of BC in a sample since it allows to distinguish BC from other types of carbon. Vehicle emissions, biomass burning and coal combustion are the main sources of BC [112,116,117].
Nitrate and sulfate salts are present in atmospheric PM, while carbonate and bicarbonate can also play an important role in atmospheric chemistry. Depending on the crystalline structure, the normal modes of both displacement and splitting can appear in the Raman spectra [113].
The strongest bands of the sulfate salts in the Raman spectra are associated with the S O 4 2 ion. This has four normal modes, which occur at 981 cm−1 (ν1), 451 cm−1 (ν2), 1104 cm−1 (ν3), and 613 cm−1 (ν4). Crystalline ammonium sulfate (NH4)2SO4 and potassium sulfate (K2SO4) at room temperature belong to the orthorhombic system, see Figure 6. Symmetric S O 4 2 stretching (ν1) appears around 972 and 980 cm−1 for (NH4)2SO4 and K2SO4, respectively. The differences between the Raman spectra of these two salts can be explained by their structural arrangement. In both cases, the S O 4 2 ion occupies the C S symmetry site, but K + or N H 4 + ions modify the unit cell (bond angles and interatomic distances). The S-O distances in K2SO4 and (NH4)2SO4 are 1.466 Å and 1.49 Å, respectively. Short interatomic distances imply higher forces, as well as higher wavenumbers. The four normal modes of the N O 3 ion are 1049 cm−1 (ν1), 830 cm−1 (ν2), 1355 cm−1 (ν3), and 690 cm−1 (ν4). Calcium nitrate tetrahydrate (Ca(NO3)2·4H2O) belongs to the monoclinic system, and it has three active normal modes, with a strong band at 1047 cm−1, corresponding to symmetric stretching and overlapping bands assigned to H2O stretching modes [112,113].
On the other hand, bicarbonate H C O 3 has nine normal modes of vibration, all active by both infrared and Raman. CaCO3 crystallizes as calcite, aragonite, or vaterite, three polymorphs characterized by Raman spectroscopy. Calcite is part of the trigonal system and is the most thermodynamically stable polymorph with a strong band near 1083 cm−1, which corresponds to ν1 stretching.
Minerals such as hematite (Fe2O3) and magnetite (Fe3O4) can be detected from Raman spectra. Syngenite (K2Ca(SO4)2·H2O) can also be found around 601, 633, 661, 982 and 1004 cm−1, and gypsum (CaSO4·2H2O) at 1008 cm−1. Basanite (CaSO4·½H2O) contains a Raman band at 1017 cm−1. Other complex minerals such as Fe polyhalite (K2FeCa2(SO4)4·2H2O) occur at 437, 474, 635, 659, 982, and 1010 cm−1 [116].

4. Discussion

PM characterization involves very powerful and modern materials science technologies, available in most countries but with restricted use in many developing countries and many cities worldwide. Thus, more investments in these technologies are recommended elsewhere in order to know more about the PM sources, which facilitates the implementation of strategies for mitigating pollution globally, as pollution is from a planetary scale. Colombia is not far from this problem. The air quality problem at the local level (Aburrá Valley, Medellin, Colombia) has been alarming since 2014, with the most severe pollution episode recorded in 2016. In March of that year, the monitoring stations recorded that the air quality was “Not Good”, while all other stations recorded an “Unhealthy” quality index corresponding to concentrations above 55 µg/m3 of PM2.5. Specifically, in Medellin, 24-h average concentrations reach values of 113 µg/m3, which are above the maximum daily permissible level [20].
Although the PM concentration values are known, more of the characterization apparatus, such as those discussed above, are required in the cities in order to evaluate aspects such as the mineralogical, elemental, and chemical composition of the PM. The study of these factors allows a complete analysis of the air quality in different areas, enabling us to know which are the main sources of atmospheric material. According to reports, XRD is probably the most popular analytical method for the analysis of minerals present in PM. However, infrared spectroscopy has also been postulated as a complementary analytical tool as many components of PM are not crystalline and thus invisible for XRD. Similarly, in recent years, Raman spectroscopy has acquired great importance in the analysis of mineralogical material and in the chemical characterization of PM, which complements the elemental analysis provided by X-ray fluorescence (XRF). Some advantages and limitations of each of these techniques applied to atmospheric PM are presented below.

4.1. Advantages and Limitations of X-ray Diffraction (XRD)

XRD is a fast, powerful, non-destructive, and high penetration (up to 15 µm) technique that enables the identification and characterization of materials and components of PM. It is commonly used in different research departments and is widely used in industry [48]. Minerals are natural materials that crystallize from fluids containing a wide variety of elements; therefore, their crystal structures are complex and have diverse crystallographic structures [118]. This is what makes its characterization possible by XRD since it is a technique where different crystalline structures diffract X-rays in different directions and intensities, thus identifying such structures. Structural disorder reduces diffraction intensities, especially at high Bragg angles, which means that disordered structures are generally determined with less precision compared to structures that have long-range orderings. Following this concept, amorphous or non-crystalline compounds cannot be detected, therefore limiting the quantification of the sample’s total mass. Although XRD is not fully quantitative, it is considered “quantitative” or “semi-quantitative”, depending on the method used. This represents a major limitation to the use of the technique [30,119].

4.2. Advantages and Limitations of X-ray Fluorescence (XRF)

PM collection filters of different size ranges are used to estimate PM content and its chemical profile. One of the advantages of XRF, when compared with other analytical techniques (ICP-MS or ICP-OES), is the direct analysis of the loaded filter. The filter can be analyzed from WDXRF, EDXRF 3D-EDXRF, and EDXRF [69,120,121]. This last filter, due to its portability, is suitable for use in indoor studies to assess air quality in the workplace, which suggests a great advantage [70,122,123,124]. In recent decades, XRF has become a powerful and inexpensive analytical technique that enables multi-elemental analysis of a wide variety of samples, mainly in the solid state. Despite this, XRF systems still present certain weaknesses, such as the limited sensitivity to quantify trace and ultra-trace elements in the sample. Therefore, calibration approaches and matrix correction models should be developed to obtain a more significant representation. The evaluation of these methods is not a simple task, and therefore, the use of this technique in some applications is limited [57].
XRF and proton-induced ionizing particle emission (PIXE) are elemental analysis techniques used in materials science. Both techniques involve the excitation of atoms within a sample and the detection of the resulting emission of X-rays or charged particle [125]. They are used to determine the elemental composition of atmospheric PM samples in filters. Both techniques have advantages such as multi-elementality, are non-destructive, have good precision and accuracy, and do not require sample preparation. One of the main disadvantages of low-energy X-rays. The comparison between PIXE and XRF on Teflon filters shows a very good correlation and comparable results. On quartz filters, PIXE cannot successfully perform accurate quantification of light elements, such as Na and Mg, but it has advantages in measurement speed and the possibility of simultaneously performing different IBA technologies, such as PIGE (Particle Induced Gamma-ray Emission) and RBS (Rutherford Backscattering Spectrometry) [126]. XRF allows more accurate quantification of the light elements in samples collected on quartz filters, thanks to the use of different XRF filters. In addition, this technique uses lower-cost instruments and has developed portable instrumentation [127]. Both techniques are prone to low-energy X-ray absorption effects when applied to the study of aerosol samples collected on quartz fiber filters.

4.3. Advantages and Limitations of Fourier-Transform Infrared Spectroscopy (FTIR)

The IR technique enables the identification and quantification of mass of all functional groups of organic compounds, i.e., carboxylic acid functional and aromatic C-H functional groups, both present in atmospheric particles. In addition, this technique has the ability to detect compounds in small quantities. The instrumentation can be positioned at the PM sampling site in order to eliminate losses or transformations during transport and storage. The great challenge encountered in the use of FTIR on atmospheric PM samples is the choice and implementation of a suitable calibration method. Multivariate calibration improves the sensitivity and accuracy of quantification compared to univariate calibration since multivariate calibration correlates changes in the values of absorbance at each frequency with changes in the concentrations of the functional group. This decreases problems related to peak overlap and allows different frequencies to be used to calibrate a given functional group. These methods allow the identification of specific functional groups of the carbonyl functional group (C=O), such as carboxylic acids and esters, with a carbonyl bond [94].

4.4. Advantages and Limitations of Raman Spectroscopy (RS)

Among the advantages of Raman spectroscopy are that it is a method that does not require sample preparation, it is simple, fast, and widely used to characterize the chemical composition of PM. In addition, Raman spectra enable the identification of PM sources since different types of carbonaceous particles are generated in fossil fuel combustion [116]. One of the Raman spectroscopy disadvantages is that it is only sensible to register functional groups that are active in Raman and does not provide accurate information about molecular structures. Raman scattering is better than FTIR for samples containing water since, in FTIR, water has strong peaks that do not allow the detection of other components [128].
At the local level in Colombia, the implementation of these techniques is still limited mainly because of the lack of technologies and insufficient studies around the country’s regions. This is supported by the results obtained in Figure 3c, where the number of articles related to the characterization of PM in Colombia is reduced to very few papers from the search conducted in this study, although there is an increasing interest from academic, industry, society, and government in solving the problem [129]. Table 5 summarizes each of the measurements provided by each characterization technique, which shows the usefulness of these techniques in the analysis and identification of atmospheric PM.
Finally, the use of a large number of bibliographic references in a review article is common and necessary for a thorough and rigorous review of the literature. There are also many different types of review articles, from a more traditional style [130] to a more systematic and structured way to look for the information [131,132]. The Proknow-C method is used as a powerful method to systematically select and evaluate a large number of relevant and significant publications for review. The Proknow-C method analyzes a lot of references as a product of rigorous and objective processes, ensuring that these references are the most relevant and significant for the search. In addition, the number of references may depend on the scope and complexity of the research topic, as well as on the thoroughness and completeness of the literature review. Therefore, the references studied in this research represent a complete panorama of the subject [21].

5. Conclusions

This study has shown details and advantages of some of the more worldwide used materials science technologies for characterizing PM. They all provide very different but complementary information about the elements and compounds sources, chemistry, and other fundamental properties that enables the authorities to make decisions for the benefit of reducing PM and thus improving public health. Although these techniques are well-known in the materials field, it is necessary to acquire and use these types of equipment at least for the main cities of the countries, which could improve not only scientific knowledge of PM but also the implementation of technical strategies to reduce PM.
Atmospheric particulate matter is made up of different minerals characterized in many cases by their degree of crystallinity. Among the minerals analyzed in studies dedicated to PM characterization, it was found that koktaite and mascagnite form by the interaction of dust particles and gas emissions in the atmosphere and are characteristic phases of PM10. In addition, iron-based minerals (hematite), carbonate minerals (calcite, dolomite, and vaterite), clay minerals (kaolinite and illite), and crystalline silicate minerals (quartz) are found. Mineral abundance varies with season and wind direction, although it is also related to the location of the sampling device.
It was found that PM2.5 is mainly constituted of organic and elemental carbon and inorganic components such as sulfate and nitrate, which were identified from FTIR and Raman. Raman spectra also allow the identification of black carbon (BC) from biomass burning, coal combustion, and gasoline and diesel vehicle emissions. Raman evaluates other compounds such as salts found in atmospheric PM, Fe oxides, singenite, gypsum, basanite and complex minerals such as Fe-polyhalite mixture. On the other hand, from the XRF, it is established that the mineral materials are constituted by Al, Si, K, Ca, Fe, and Mg, sometimes associated with soil dust resuspension processes and Saharan intrusions. XRD is a very powerful materials science technique that enables the identification of crystalline compounds.
The use of particulate material characterization techniques such as SEM, XRD, FTIR, and Raman enables valuable scientific information on the chemical composition, crystalline structure, and physical properties of atmospheric pollutants. This information is crucial for understanding the origin and potential effects of these contaminants on the environment and human health. In addition, these data can be used to develop control and mitigation strategies that reduce exposure to contaminants and contribute to long-term sustainability. For this reason, the characterization of particulate matter is a key tool in promoting environmental sustainability and protecting human health.

6. Recommendations

Before proceeding with the characterization of atmospheric PM, it is essential to have knowledge about the various material science techniques that can be employed. It is also recommended to consider the location and time of day when samples are taken, as the composition of PM can be influenced by these factors. Sample preparation is a crucial aspect in the characterization of atmospheric PM since the effectiveness of the selected method for mineralogical, elemental and chemical analysis will depend on the conditioning process and the chosen parameters. Each atmospheric PM characterization technique provides information on the composition and properties of the material, so it is suggested that different techniques be used together to obtain a complete understanding of the sample being evaluated. Finally, it is important to interpret the results of the characterization in terms of the environmental and geographical context of the sampling location, which will allow a better understanding of the sources of contamination and help to implement effective strategies, thus potentially reducing the PM emissions in the zone of interest.

Author Contributions

Conceptualization, M.A.C.-O., D.A. and H.A.C.; methodology, J.R., L.M.G., D.A. and H.A.C.; validation, J.R., L.M.G. and D.A.; writing—original draft preparation, J.R., D.A. and H.A.C.; writing—review and editing, J.R. and H.A.C.; supervision, M.A.C.-O., D.A. and H.A.C.; project administration, C.A.P.-T., M.A.C.-O. and D.A.; funding acquisition, C.A.P.-T. and M.A.C.-O. All authors have read and agreed to the published version of the manuscript.

Funding

This investigation was financed by the Grupo de Investigación y Laboratorio de Monitoreo Ambiental G-LIMA from Universidad de Antioquia.

Institutional Review Board Statement

Not applicable.

Informed Consent Statement

Not applicable.

Data Availability Statement

Data will be available upon request.

Acknowledgments

The authors gratefully acknowledge Universidad de Antioquia for the support in this project.

Conflicts of Interest

The authors declare no conflict of interest.

References

  1. Morantes, G.; González, J.C.; Rincón, G. Characterisation of particulate matter and identification of emission sources in Greater Caracas, Venezuela. Air Qual. Atmos. Health 2021, 14, 1989–2014. [Google Scholar] [CrossRef]
  2. Neupane, B.B.; Sharma, A.; Giri, B.; Joshi, M.K. Characterization of airborne dust samples collected from core areas of Kathmandu Valley. Heliyon 2020, 6, e03791. [Google Scholar] [CrossRef] [PubMed]
  3. Choung, S.; Oh, J.; Han, W.S.; Chon, C.-M.; Kwon, Y.; Kim, D.Y.; Shin, W. Comparison of physicochemical properties between fine (PM2.5) and coarse airborne particles at cold season in Korea. Sci. Total Environ. 2016, 541, 1132–1138. [Google Scholar] [CrossRef] [PubMed]
  4. Roy, D.; Singh, G.; Gosai, N. Identification of possible sources of atmospheric PM10 using particle size, SEM-EDS and XRD analysis, Jharia Coalfield Dhanbad, India. Environ. Monit. Assess. 2015, 187, 680. [Google Scholar] [CrossRef]
  5. Valido, I.H.; Padoan, E.; Moreno, T.; Querol, X.; Font, O.; Amato, F. Physico-chemical characterization of playground sand dust, inhalable and bioaccessible fractions. Chemosphere 2018, 190, 454–462. [Google Scholar] [CrossRef]
  6. Raysoni, A.U.; Armijos, R.X.; Margaret Weigel, M.; Echanique, P.; Racines, M.; Pingitore, N.E.; Li, W.-W. Evaluation of sources and patterns of elemental composition of PM2.5 at three low-income neighborhood schools and residences in Quito, Ecuador. Int. J. Environ. Res. Public Health 2017, 14, 674. [Google Scholar] [CrossRef] [PubMed]
  7. Javed, W.; Guo, B. Chemical characterization and source apportionment of fine and coarse atmospheric particulate matter in Doha, Qatar. Atmos. Pollut. Res. 2021, 12, 122–136. [Google Scholar] [CrossRef]
  8. Ramírez, O.; Sánchez de la Campa, A.M.; Amato, F.; Catacolí, R.A.; Rojas, N.Y.; de la Rosa, J. Chemical composition and source apportionment of PM10 at an urban background site in a high–altitude Latin American megacity (Bogota, Colombia). Environ. Pollut. 2018, 233, 142–155. [Google Scholar] [CrossRef]
  9. Cazorla, M.; Herrera, E. Air quality in the Galapagos Islands: A baseline view from remote sensing and In Situ measurements. Meteorol. Appl. 2020, 27, e1878. [Google Scholar] [CrossRef]
  10. Grigorov, I.V.; Kolarov, G.V.; Gurdev, L.L.; Cherkezova-Zheleva, Z.P.; Slavov, L.S.; Ghelev, C.G.; Ilieva, R.V.; Iliev, M.V.; Groudeva, V.I.; Stoyanov, D.V.; et al. Characterization of in-situ-sampled particulate matter in air pollution localized by lidar monitoring. Bulg. Chem. Commun. 2018, 50, 205–210. [Google Scholar]
  11. Song, X.; Shao, L.; Zheng, Q.; Yang, S. Characterization of crystalline secondary particles and elemental composition in PM10 of North China. Environ. Earth Sci. 2015, 74, 5717–5727. [Google Scholar] [CrossRef]
  12. Martinello, K.; Oliveira, M.L.S.; Molossi, F.A.; Ramos, C.G.; Teixeira, E.C.; Kautzmann, R.M.; Silva, L.F.O. Direct identification of hazardous elements in ultra-fine and nanominerals from coal fly ash produced during diesel co-firing. Sci. Total Environ. 2014, 470–471, 444–452. [Google Scholar] [CrossRef] [PubMed]
  13. Lu, S.; Luan, Q.; Jiao, Z.; Wu, M.; Li, Z.; Shao, L.; Wang, F. Mineralogy of inhalable particulate matter (PM10) in the atmosphere of Beijing, China. Water. Air. Soil Pollut. 2007, 186, 129–137. [Google Scholar] [CrossRef]
  14. Galvão, E.S.; Santos, J.M.; Lima, A.T.; Reis, N.C.; Stuetz, R.M.; Orlando, M.T.D. Resonant Synchrotron X-ray Diffraction determines markers for iron-rich atmospheric particulate matter in urban region. Chemosphere 2018, 212, 418–428. [Google Scholar] [CrossRef]
  15. Bartz, W.; Górka, M.; Rybak, J.; Rutkowski, R.; Stojanowska, A. The assessment of effectiveness of SEM- EDX and ICP-MS methods in the process of determining the mineralogical and geochemical composition of particulate matter deposited on spider webs. Chemosphere 2021, 278, 130454. [Google Scholar] [CrossRef] [PubMed]
  16. Perrino, C.; Canepari, S.; Catrambone, M.; Dalla Torre, S.; Rantica, E.; Sargolini, T. Influence of natural events on the concentration and composition of atmospheric particulate matter. Atmos. Environ. 2009, 43, 4766–4779. [Google Scholar] [CrossRef]
  17. Arrais, A.; Diana, E.; Boccaleri, E. A study on the carbon soot derived from the wood combustion and on the relative alkali-extractable fraction. J. Mater. Sci. 2006, 41, 6035–6045. [Google Scholar] [CrossRef]
  18. Güney, B.; Aladağ, A. Microstructure and chemical analysis of particulate matter from diesel-fuelled vehicle emissions | Dizel yakıtlı taşıtlardan salınan partikül maddelerin mikroyapı ve kimyasal karakterizasyonu. El-Cezeri 2021, 8, 287–298. [Google Scholar] [CrossRef]
  19. Ahmady-Birgani, H.; Mirnejad, H.; Feiznia, S.; McQueen, K.G. Mineralogy and geochemistry of atmospheric particulates in western Iran. Atmos. Environ. 2015, 119, 262–272. [Google Scholar] [CrossRef]
  20. Aguiar-Gil, D.; Gómez-Peláez, L.M.; Álvarez-Jaramillo, T.; Correa-Ochoa, M.A.; Saldarriaga-Molina, J.C. Evaluating the impact of PM2.5 atmospheric pollution on population mortality in an urbanized valley in the American tropics. Atmos. Environ. 2020, 224, 117343. [Google Scholar] [CrossRef]
  21. De Carvalho, G.D.G.; Sokulski, C.C.; Da Silva, W.V.; De Carvalho, H.G.; De Moura, R.V.; De Francisco, A.C.; Da Veiga, C.P. Bibliometrics and systematic reviews: A comparison between the Proknow-C and the Methodi Ordinatio. J. Informetr. 2020, 14, 101043. [Google Scholar] [CrossRef]
  22. González, L.T.; Longoria-Rodríguez, F.E.; Sánchez-Domínguez, M.; Leyva-Porras, C.; Acuña-Askar, K.; Kharissov, B.I.; Arizpe-Zapata, A.; Alfaro-Barbosa, J.M. Seasonal variation and chemical composition of particulate matter: A study by XPS, ICP-AES and sequential microanalysis using Raman with SEM/EDS. J. Environ. Sci. 2018, 74, 32–49. [Google Scholar] [CrossRef] [PubMed]
  23. Gilbert, J.; Sartim, R.; Suringar, M.E.; Richards, J. Positive bias in particulate matter emissions data due to sulfur dioxide adsorption and oxidation on glass fiber filters. J. Air Waste Manag. Assoc. 2021, 71, 1076–1084. [Google Scholar] [CrossRef] [PubMed]
  24. Saikia, J.; Narzary, B.; Roy, S.; Bordoloi, M.; Saikia, P.; Saikia, B.K. Nanominerals, fullerene aggregates, and hazardous elements in coal and coal combustion-generated aerosols: An environmental and toxicological assessment. Chemosphere 2016, 164, 84–91. [Google Scholar] [CrossRef]
  25. Davis, B.L.; Johnson, L. On the use of various filter substrates for quantitative particulate analysis by X-ray diffraction. Atmos. Environ. 1982, 16, 273–282. [Google Scholar] [CrossRef]
  26. Santacatalina, M.; Reche, C.; Minguillón, M.C.; Escrig, A.; Sanfelix, V.; Carratalá, A.; Nicolás, J.F.; Yubero, E.; Crespo, J.; Alastuey, A.; et al. Impact of fugitive emissions in ambient PM levels and composition. A case study in Southeast Spain. Sci. Total Environ. 2010, 408, 4999–5009. [Google Scholar] [CrossRef]
  27. Satsangi, P.G.; Yadav, S. Characterization of PM2.5 by X-ray diffraction and scanning electron microscopy-energy dispersive spectrometer: Its relation with different pollution sources. Int. J. Environ. Sci. Technol. 2014, 11, 217–232. [Google Scholar] [CrossRef]
  28. Skoog, D.A.; Holler, F.J.; Nieman, T.A. Principios de Análisis Instrumental, 5th ed.; McGrawHill: New York, NY, USA, 2001; pp. 1–856. [Google Scholar]
  29. González, L.T.; Rodríguez, F.E.L.; Sánchez-Domínguez, M.; Leyva-Porras, C.; Silva-Vidaurri, L.G.; Acuna-Askar, K.; Kharisov, B.I.; Villarreal Chiu, J.F.; Alfaro Barbosa, J.M. Chemical and morphological characterization of TSP and PM2.5 by SEM-EDS, XPS and XRD collected in the metropolitan area of Monterrey, Mexico. Atmos. Environ. 2016, 143, 249–260. [Google Scholar] [CrossRef]
  30. Nowak, S.; Lafon, S.; Caquineau, S.; Journet, E.; Laurent, B. Quantitative study of the mineralogical composition of mineral dust aerosols by X-ray diffraction. Talanta 2018, 186, 133–139. [Google Scholar] [CrossRef]
  31. Sturges, W.T.; Harrison, R.M. Semi-quantitative X-ray diffraction analysis of size fractionated atmospheric particles. Atmos. Environ. 1989, 23, 1083–1098. [Google Scholar] [CrossRef]
  32. Jiang, J.-G.; Xu, X.; Wang, J.; Yang, S.-J.; Zhang, Y. Investigation of basic properties of fly ash from urban waste incinerators in China. J. Environ. Sci. 2007, 19, 458–463. [Google Scholar] [CrossRef] [PubMed]
  33. Duan, Q.; Jiang, T.; Xue, C.; Liu, H.; Liu, F.; Alee, M.; Ali, A.; Chen, L.; Yu, L. Preparation and characterization of starch/enteromorpha/nano-clay hybrid composites. Int. J. Biol. Macromol. 2020, 150, 16–22. [Google Scholar] [CrossRef]
  34. Erol, M.; Küçükbayrak, S.; Ersoy-Meriçboyu, A. Comparison of the properties of glass, glass-ceramic and ceramic materials produced from coal fly ash. J. Hazard. Mater. 2008, 153, 418–425. [Google Scholar] [CrossRef] [PubMed]
  35. Judy, J.D.; Harris, W.; Hettiarachchi, G.M.; Buchanan, A.C.; Reddy, K.R. Mineralogy of particulate inputs and P-speciation and mineralogy of recently accreted soils within Everglades stormwater treatment wetlands. Sci. Total Environ. 2021, 781, 146740. [Google Scholar] [CrossRef]
  36. Oo, H.M.; Karin, P.; Chollacoop, N.; Hanamura, K. Physicochemical characterization of forest and sugarcane leaf combustion’s particulate matters using electron microscopy, EDS, XRD and TGA. J. Environ. Sci. 2021, 99, 296–310. [Google Scholar] [CrossRef] [PubMed]
  37. Senthil Kumar, R.; Rajkumar, P. Characterization of minerals in air dust particles in the state of Tamilnadu, India through FTIR, XRD and SEM analyses. Infrared Phys. Technol. 2014, 67, 30–41. [Google Scholar] [CrossRef]
  38. Batonneau, Y.; Bremard, C.; Gengembre, L.; Laureyns, J.; Le Maguer, A.; Le Maguer, D.; Perdrix, E.; Sobanska, S. Speciation of PM10 sources of airborne nonferrous metals within the 3-km zone of lead/zinc smelters. Environ. Sci. Technol. 2004, 38, 5281–5289. [Google Scholar] [CrossRef]
  39. Oproiu, C.-L.; Voicu, G.; Bădănoiu, A.; Nicoară, A.-I. The solidification/stabilization of wastewater (From a landfill leachate) in specially designed binders based on coal ash. Materials 2021, 14, 5610. [Google Scholar] [CrossRef]
  40. Cano, M.; Vega, F.; Navarrete, B.; Plumed, A.; Camino, J.A. Characterization of Emissions of Condensable Particulate Matter in Clinker Kilns Using a Dilution Sampling System. Energy Fuels 2017, 31, 7831–7838. [Google Scholar] [CrossRef]
  41. Shao, L.Y.; Li, W.J.; Yang, S.S.; Shi, Z.B.; Lü, S.L. Mineralogical characteristics of airborne particles collected in Beijing during a severe Asian dust storm period in spring 2002. Sci. China Ser. D Earth Sci. 2007, 50, 953–959. [Google Scholar] [CrossRef]
  42. Bora, J.; Deka, P.; Bhuyan, P.; Sarma, K.P.; Hoque, R.R. Morphology and mineralogy of ambient particulate matter over mid-Brahmaputra Valley: Application of SEM–EDX, XRD, and FTIR techniques. SN Appl. Sci. 2021, 3, 137. [Google Scholar] [CrossRef]
  43. Hamdan, N.M.; Alawadhi, H. X-ray diffraction as a major tool for the analysis of PM2.5 and PM10 aerosols. Powder Diffr. 2020, 35, 98–103. [Google Scholar] [CrossRef]
  44. Farahat, A.; Al Otaibi, M.; Tawabini, B.; Amao, A.O. Characteristics of PM10 at industrial cities using integrated analytical techniques: Al-Jubail and Ras Tanura case study. Int. J. Environ. Sci. Technol. 2021, 19, 705–716. [Google Scholar] [CrossRef]
  45. Lee, K.S.; Jung, J.H.; Keel, S.I.; Yun, J.H.; Min, T.J.; Kim, S.S. Characterization of calcium carbonate sorbent particle in furnace environment. Sci. Total Environ. 2012, 429, 266–271. [Google Scholar] [CrossRef] [PubMed]
  46. Díaz-Hernández, J.L.; Martín-Ramos, J.D.; López-Galindo, A. Quantitative analysis of mineral phases in atmospheric dust deposited in the south-eastern Iberian Peninsula. Atmos. Environ. 2011, 45, 3015–3024. [Google Scholar] [CrossRef]
  47. Hamdan, N.M.; Alawadhi, H.; Shameer, M. Characterization of PM2.5 at a traffic site using several integrated analytical techniques. X-Ray Spectrom. 2021, 50, 106–120. [Google Scholar] [CrossRef]
  48. Galvão, E.S.; Santos, J.M.; Lima, A.T.; Reis, N.C.; Orlando, M.T.D.A.; Stuetz, R.M. Trends in analytical techniques applied to particulate matter characterization: A critical review of fundaments and applications. Chemosphere 2018, 199, 546–568. [Google Scholar] [CrossRef] [PubMed]
  49. Potts, P.J.; Potts, P.J. X-ray fluorescence analysis: Principles and practice of wavelength dispersive spectrometry. In A Handbook of Silicate Rock Analysis; Springer: Dordrecht, The Netherlands, 1987; pp. 226–285. [Google Scholar]
  50. Kunecki, P.; Franus, W.; Wdowin, M. Statistical study and physicochemical characterization of particulate matter in the context of Kraków, Poland. Atmos. Pollut. Res. 2020, 11, 520–530. [Google Scholar] [CrossRef]
  51. Li, D.; Du, Q.; Dong, H.; Gao, J.; Cui, Z.; Yu, J.; Liu, Y. Field measurements on the generation and emission characteristics of PM2.5 from industrial fluidized bed boilers. Energy Sources Part A Recover. Util. Environ. Eff. 2020, 42, 773–784. [Google Scholar] [CrossRef]
  52. Lima, F.D.M.; Pérez-Martínez, P.J.; de Fatima Andrade, M.; Kumar, P.; de Miranda, R.M. Characterization of particles emitted by pizzerias burning wood and briquettes: A case study at Sao Paulo, Brazil. Environ. Sci. Pollut. Res. 2020, 27, 35875–35888. [Google Scholar] [CrossRef]
  53. Senlin, L.; Longyi, S.; Minghong, W.; Zheng, J.; Xiaohui, C. Chemical elements and their source apportionment of PM10 in Beijing urban atmosphere. Environ. Monit. Assess. 2007, 133, 79–85. [Google Scholar] [CrossRef]
  54. Popovicheva, O.; Kireeva, E.; Persiantseva, N.; Timofeev, M.; Bladt, H.; Ivleva, N.P.; Niessner, R.; Moldanová, J. Microscopic characterization of individual particles from multicomponent ship exhaust. J. Environ. Monit. 2012, 14, 3101–3110. [Google Scholar] [CrossRef] [PubMed]
  55. Tshehla, C.; Wright, C.Y. Spatial variability of PM10, PM2.5 and PM chemical components in an industrialised rural area within a mountainous terrain. S. Afr. J. Sci. 2019, 115. [Google Scholar] [CrossRef] [PubMed]
  56. Marcazzan, G.M.; Vaccaro, S.; Valli, G.; Vecchi, R. Characterisation of PM10 and PM2.5 particulate matter in the ambient air of Milan (Italy). Atmos. Environ. 2001, 35, 4639–4650. [Google Scholar] [CrossRef]
  57. Marguí, E.; Queralt, I.; de Almeida, E. X-ray fluorescence spectrometry for environmental analysis: Basic principles, instrumentation, applications and recent trends. Chemosphere 2022, 303, 135006. [Google Scholar] [CrossRef] [PubMed]
  58. Xue, H.; Liu, G.; Zhang, H.; Hu, R.; Wang, X. Similarities and differences in PM10 and PM2.5 concentrations, chemical compositions and sources in Hefei City, China. Chemosphere 2019, 220, 760–765. [Google Scholar] [CrossRef]
  59. Niu, J.; Rasmussen, P.E.; Wheeler, A.; Williams, R.; Chénier, M. Evaluation of airborne particulate matter and metals data in personal, indoor and outdoor environments using ED-XRF and ICP-MS and co-located duplicate samples. Atmos. Environ. 2010, 44, 235–245. [Google Scholar] [CrossRef]
  60. Almeida, S.M.; Manousakas, M.; Diapouli, E.; Kertesz, Z.; Samek, L.; Hristova, E.; Šega, K.; Alvarez, R.P.; Belis, C.A.; Eleftheriadis, K.; et al. Ambient particulate matter source apportionment using receptor modelling in European and Central Asia urban areas. Environ. Pollut. 2020, 266, 115199. [Google Scholar] [CrossRef]
  61. Borgese, L.; Bilo, F.; Zacco, A.; Federici, S.; Mutahi, A.W.; Bontempi, E.; Trzepla, K.; Hyslop, N.; Yatkin, S.; Wobrauschek, P.; et al. The assessment of a method for measurements and lead quantification in air particulate matter using total reflection X-ray fluorescence spectrometers. Spectrochim. Acta Part B At. Spectrosc. 2020, 167, 105840. [Google Scholar] [CrossRef]
  62. Longo, A.F.; Vine, D.J.; King, L.E.; Oakes, M.; Weber, R.J.; Huey, L.G.; Russell, A.G.; Ingall, E.D. Composition and oxidation state of sulfur in atmospheric particulate matter. Atmos. Chem. Phys. 2016, 16, 13389–13398. [Google Scholar] [CrossRef]
  63. Bilo, F.; Borgese, L.; Wambui, A.; Assi, A.; Zacco, A.; Federici, S.; Eichert, D.M.; Tsuji, K.; Lucchini, R.G.; Placidi, D.; et al. Comparison of multiple X-ray fluorescence techniques for elemental analysis of particulate matter collected on air filters. J. Aerosol Sci. 2018, 122, 1–10. [Google Scholar] [CrossRef]
  64. Sofowote, U.M.; Di Federico, L.M.; Healy, R.M.; Debosz, J.; Su, Y.; Wang, J.; Munoz, A. Heavy metals in the near-road environment: Results of semi-continuous monitoring of ambient particulate matter in the greater Toronto and Hamilton area. Atmos. Environ. X 2019, 1, 100005. [Google Scholar] [CrossRef]
  65. Day, D.A.; Takahama, S.; Gilardoni, S.; Russell, L.M. Organic composition of single and submicron particles in different regions of western North America and the eastern Pacific during INTEX-B 2006. Atmos. Chem. Phys. 2009, 9, 5433–5446. [Google Scholar] [CrossRef]
  66. Cuccia, E.; Piazzalunga, A.; Bernardoni, V.; Brambilla, L.; Fermo, P.; Massabò, D.; Molteni, U.; Prati, P.; Valli, G.; Vecchi, R. Carbonate measurements in PM10 near the marble quarries of Carrara (Italy) by infrared spectroscopy (FT-IR) and source apportionment by positive matrix factorization (PMF). Atmos. Environ. 2011, 45, 6481–6487. [Google Scholar] [CrossRef]
  67. Fakinle, B.S.; Uzodinma, O.B.; Odekanle, E.L.; Sonibare, J.A. Impact of elemental composition of particulate matter in the airshed of a University Farm on the local air quality. Heliyon 2020, 6, e03216. [Google Scholar] [CrossRef] [PubMed]
  68. Ariola, V.; D’Alessandro, A.; Lucarelli, F.; Marcazzan, G.; Mazzei, F.; Nava, S.; Garcia-Orellana, I.; Prati, P.; Valli, G.; Vecchi, R.; et al. Elemental characterization of PM10, PM2.5 and PM1 in the town of Genoa (Italy). Chemosphere 2006, 62, 226–232. [Google Scholar] [CrossRef]
  69. Veleva, B.; Hristova, E.; Nikolova, E.; Kolarova, M.; Valcheva, R. Statistical evaluation of elemental composition data of PM10 air particulate in Sofia. Int. J. Environ. Pollut. 2015, 57, 175–188. [Google Scholar] [CrossRef]
  70. Tsai, M.Y.; Hoek, G.; Eeftens, M.; de Hoogh, K.; Beelen, R.; Beregszászi, T.; Cesaroni, G.; Cirach, M.; Cyrys, J.; De Nazelle, A.; et al. Spatial variation of PM elemental composition between and within 20 European study areas—Results of the ESCAPE project. Environ. Int. 2015, 84, 181–192. [Google Scholar] [CrossRef]
  71. Gupta, S.; Soni, P.; Gupta, A.K. Optimization of WD-XRF analytical technique to measure elemental abundance in PM2.5 dust collected on quartz-fibre filter. Atmos. Pollut. Res. 2021, 12, 345–351. [Google Scholar] [CrossRef]
  72. Canepari, S.; Perrino, C.; Astolfi, M.L.; Catrambone, M.; Perret, D. Determination of soluble ions and elements in ambient air suspended particulate matter: Inter-technique comparison of XRF, IC and ICP for sample-by-sample quality control. Talanta 2009, 77, 1821–1829. [Google Scholar] [CrossRef]
  73. Gramsch, E.; Oyola, P.; Reyes, F.; Rojas, F.; Henríquez, A.; Kang, C.-M. Trends in particle matter and its elemental composition in Santiago de Chile, 2011–2018. J. Air Waste Manag. Assoc. 2021, 71, 721–736. [Google Scholar] [CrossRef] [PubMed]
  74. Alonso, C.D.; Martins, M.H.R.B.; Romano, J.; Godinho, R. São paulo aerosol characterization study. J. Air Waste Manag. Assoc. 1997, 47, 1297–1300. [Google Scholar] [CrossRef]
  75. Mpanza, M.; Adam, E.; Moolla, R. Dust deposition impacts at a liquidated gold mine village: Gauteng province in South Africa. Int. J. Environ. Res. Public Health 2020, 17, 4929. [Google Scholar] [CrossRef]
  76. El Haddar, A.; Gharibi, E.; Azdimousa, A.; Fagel, N.; El Amrani El Hassani, I.-E.; El Ouahabi, M. Characterization of halloysite (North East Rif, Morocco): Evaluation of its suitability for the ceramics industry. Clay Miner. 2018, 53, 65–78. [Google Scholar] [CrossRef]
  77. Temuujin, J.; Minjigmaa, A.; Davaabal, B.; Ochirbat, Z. Characterisation of fly ashes from 4th Thermal Power Station of Ulaanbaatar city and its applicability for a zeolite synthesis. Mong. J. Chem. 2014, 12, 16–19. [Google Scholar] [CrossRef]
  78. Rajamma, R.; Ball, R.J.; Tarelho, L.A.C.; Allen, G.C.; Labrincha, J.A.; Ferreira, V.M. Characterisation and use of biomass fly ash in cement-based materials. J. Hazard. Mater. 2009, 172, 1049–1060. [Google Scholar] [CrossRef] [PubMed]
  79. Cuccia, E.; Bernardoni, V.; Massabò, D.; Prati, P.; Valli, G.; Vecchi, R. An alternative way to determine the size distribution of airborne particulate matter. Atmos. Environ. 2010, 44, 3304–3313. [Google Scholar] [CrossRef]
  80. Barthel, M.; Pedan, V.; Hahn, O.; Rothhardt, M.; Bresch, H.; Jann, O.; Seeger, S. XRF-analysis of fine and ultrafine particles emitted from laser printing devices. Environ. Sci. Technol. 2011, 45, 7819–7825. [Google Scholar] [CrossRef]
  81. Castanheiro, A.; Hofman, J.; Nuyts, G.; Joosen, S.; Spassov, S.; Blust, R.; Lenaerts, S.; De Wael, K.; Samson, R. Leaf accumulation of atmospheric dust: Biomagnetic, morphological and elemental evaluation using SEM, ED-XRF and HR-ICP-MS. Atmos. Environ. 2020, 221, 117082. [Google Scholar] [CrossRef]
  82. Fang, T.; Guo, H.; Verma, V.; Peltier, R.E.; Weber, R.J. PM2.5 water-soluble elements in the southeastern United States: Automated analytical method development, spatiotemporal distributions, source apportionment, and implications for heath studies. Atmos. Chem. Phys. Discuss. 2015, 15, 17189–17227. [Google Scholar] [CrossRef]
  83. Dourado, T.A.; Gemeiner, H.; Gomes, A.C.F.; Almeida, E.; da Silva, A.C.; Valadão, N.; Menegário, A.A.; Govone, J.S.; Gastmans, D. Elemental Composition of Particulate Matter in the Southeastern Brazilian Ceramic Pole by Synchrotron Radiation X-ray Fluorescence Technique (SR-XRF). J. Braz. Chem. Soc. 2020, 31, 1203–1215. [Google Scholar] [CrossRef]
  84. Indresand, H.; White, W.H.; Trzepla, K.; Dillner, A.M. Preparation of sulfur reference materials that reproduce atmospheric particulate matter sample characteristics for XRF calibration. X-Ray Spectrom. 2013, 42, 359–367. [Google Scholar] [CrossRef]
  85. Morillas, H.; Gredilla, A.; Gallego-Cartagena, E.; Upasen, S.; Maguregui, M.; Madariaga, J.M. PM10 spatial distribution and metals speciation study in the Bilbao metropolitan area during the 2017–2018 period. Chemosphere 2020, 259, 127482. [Google Scholar] [CrossRef]
  86. Eze, C.P.; Nyale, S.M.; Akinyeye, R.O.; Gitari, W.M.; Akinyemi, S.A.; Fatoba, O.O.; Petrik, L.F. Chemical, mineralogical and morphological changes in weathered coal fly ash: A case study of a brine impacted wet ash dump. J. Environ. Manage. 2013, 129, 479–492. [Google Scholar] [CrossRef] [PubMed]
  87. Rani, N.; Rani, S.; Bansal, K.; Singh, S.; Singh, G. Characterization of fly ash using different techniques: A review. AIP Conf. Proc. 2021, 2352, 030014. [Google Scholar]
  88. Gan, M.; Ji, Z.; Fan, X.; Chen, X.; Li, Q.; Yin, L.; He, X.; Zhou, Y.; Jiang, T. Emission behavior and physicochemical properties of aerosol Particulate Matter (PM10/2.5) from Iron Ore Sintering Process. ISIJ Int. 2015, 55, 2582–2588. [Google Scholar] [CrossRef]
  89. Hamdan, N.M.; Alawadhi, H.; Jisrawi, N.; Shameer, M. Characterization of fine particulate matter in Sharjah, United Arab Emirates using complementary experimental techniques. Sustainability 2018, 10, 1088. [Google Scholar] [CrossRef]
  90. Gautam, S.P.; Bundela, P.S.; Murumkar, M. Paint sludge waste co-processing at the ACC Wadi Cement Works in Karnataka, India. WIT Trans. Ecol. Environ. 2010, 140, 57–66. [Google Scholar]
  91. Ismail; Ashraf, A.; van de Voort, F.R.; Sedman, J. Fourier transform infrared spectroscopy: Principles and applications. In Techniques and Instrumentation in Analytical Chemistry; Elsevier: Amsterdam, The Netherlands, 1997; Volume 18, pp. 93–139. [Google Scholar]
  92. Yu, X.; Song, W.; Yu, Q.; Li, S.; Zhu, M.; Zhang, Y.; Deng, W.; Yang, W.; Huang, Z.; Bi, X.; et al. Fast screening compositions of PM2.5 by ATR-FTIR: Comparison with results from IC andOC/EC analyzers. J. Environ. Sci. 2018, 71, 76–88. [Google Scholar] [CrossRef]
  93. Karthikeyan, S.; Balasubramanian, R.; See, S.W. Optimization and validation of a low temperature microwave-assisted extraction method for analysis of polycyclic aromatic hydrocarbons in airborne particulate matter. Talanta 2006, 69, 79–86. [Google Scholar] [CrossRef] [PubMed]
  94. Coury, C.; Dillner, A.M. A method to quantify organic functional groups and inorganic compounds in ambient aerosols using attenuated total reflectance FTIR spectroscopy and multivariate chemometric techniques. Atmos. Environ. 2008, 42, 5923–5932. [Google Scholar] [CrossRef]
  95. Zapata-Hernandez, C.; Durango-Giraldo, G.; Tobón, C.; Buitrago-Sierra, R. Physicochemical Characterization of Airborne Particulate Matter in Medellín, Colombia, and its Use in an In Silico Study of Ventricular Action Potential. Water. Air. Soil Pollut. 2020, 231, 508. [Google Scholar] [CrossRef]
  96. Son, S.C.; Yu, G.H.; Park, S.; Lee, S. Comprehensive characterization of PM2.5 using chemical, optical, and spectroscopic methods during pollution episodes at an urban site in Gwangju, Korea. Atmos. Pollut. Res. 2021, 12, 101199. [Google Scholar] [CrossRef]
  97. Cano, M.; Reina, T.R.; Portillo, E.; Gallego Fernández, L.M.; Navarrete, B. Characterization of emissions of condensable particulate matter under real operation conditions in cement clinker kilns using complementary experimental techniques. Sci. Total Environ. 2021, 786, 147472. [Google Scholar] [CrossRef] [PubMed]
  98. Wei, X.; Gui, H.; Liu, J.; Zhang, J.; Schwab, J.; Gao, M. Aerosol pollution characterization before chinese new year in Zhengzhou in 2014. Aerosol Air Qual. Res. 2019, 19, 1294–1306. [Google Scholar] [CrossRef]
  99. Romanías, M.N.; Ourrad, H.; Thévenet, F.; Riffault, V. Investigating the Heterogeneous Interaction of VOCs with Natural Atmospheric Particles: Adsorption of Limonene and Toluene on Saharan Mineral Dusts. J. Phys. Chem. A 2016, 120, 1197–1212. [Google Scholar] [CrossRef]
  100. Varrica, D.; Tamburo, E.; Vultaggio, M.; Di Carlo, I. ATR–FTIR spectral analysis and soluble components of PM10 and PM2.5 particulate matter over the urban area of palermo (Italy) during normal days and saharan events. Int. J. Environ. Res. Public Health 2019, 16, 2507. [Google Scholar] [CrossRef]
  101. Grassi, P.; Drumm, F.C.; da Silveira Salla, J.; Silvestri, S.; da Boit Martinello, K.; Dotto, G.L.; Foletto, E.L.; Jahn, S.L. Investigation of the reaction pathway for degradation of emerging contaminant in water by photo-Fenton oxidation using fly ash as low-cost raw catalyst. Int. J. Environ. Res. 2020, 14, 427–438. [Google Scholar] [CrossRef]
  102. Wibawa, P.J.; Nur, M.; Asy’ari, M.; Nur, H. SEM, XRD and FTIR analyses of both ultrasonic and heat generated activated carbon black microstructures. Heliyon 2020, 6, e03546. [Google Scholar] [CrossRef]
  103. Akinyemi, S.A.; Bohórquez, F.; Islam, N.; Saikia, B.K.; Sampaio, C.H.; Crissien, T.J.; Silva, L.F.O. Petrography and geochemistry of exported Colombian coals: Implications from correlation and regression analyses. Energy Geosci. 2021, 2, 201–210. [Google Scholar] [CrossRef]
  104. Comelli, N.A.; Ruiz, M.L.; Merino, N.A.; Lick, I.D.; Rodríguez-Castellón, E.; Jiménez-López, A.; Ponzi, M.I. Preparation and characterisation of calcined Mg/Al hydrotalcites impregnated with alkaline nitrate and their activities in the combustion of particulate matter. Appl. Clay Sci. 2013, 80–81, 426–432. [Google Scholar] [CrossRef]
  105. Škvára, F.; Kopecký, L.; Šmilauer, V.; Bittnar, Z. Material and structural characterization of alkali activated low-calcium brown coal fly ash. J. Hazard. Mater. 2009, 168, 711–720. [Google Scholar] [CrossRef] [PubMed]
  106. Chauhan, A.P.S.; Chawla, K. Comparative studies on Graphite and Carbon Black powders, and their dispersions. J. Mol. Liq. 2016, 221, 292–297. [Google Scholar] [CrossRef]
  107. Dominic, M.; Joseph, R.; Sabura Begum, P.M.; Kanoth, B.P.; Chandra, J.; Thomas, S. Green tire technology: Effect of rice husk derived nanocellulose (RHNC) in replacing carbon black (CB) in natural rubber (NR) compounding. Carbohydr. Polym. 2020, 230, 115620. [Google Scholar] [CrossRef] [PubMed]
  108. Mishra, A.; Prasad, R. Catalysis and kinetics of diesel soot oxidation over nano-size perovskite catalyst. Clean Technol. Environ. Policy 2017, 19, 2405–2416. [Google Scholar] [CrossRef]
  109. Mateus, A.; Torres, J.; Marimon-Bolivar, W.; Pulgarín, L. Implementation of magnetic bentonite in food industry wastewater treatment for reuse in agricultural irrigation. Water Resour. Ind. 2021, 26, 100154. [Google Scholar] [CrossRef]
  110. Allen, D.T.; Palen, E.J.; Haimov, M.I.; Hering, S.V.; Young, J.R. Inorganic Absorbances Observed in Spectra of Ambient Aerosol. Aerosol Sci. Technol. 1994, 21, 325–342. [Google Scholar] [CrossRef]
  111. Sreejith, M.V.; Thomas, J.R.; Aravindakumar, C.T.; Aravind, U.K. Characterisation of atmospheric particulate matter over a site in southern Kerala, India-Using ATR-FTIR and confocal micro-raman spectroscopy. Mater. Today Proc. 2019, 33, 1410–1414. [Google Scholar] [CrossRef]
  112. Feng, Y.; Liu, L.; Yang, Y.; Deng, Y.; Li, K.; Cheng, H.; Dong, X.; Li, W.; Zhang, L. The application of Raman spectroscopy combined with multivariable analysis on source apportionment of atmospheric black carbon aerosols. Sci. Total Environ. 2019, 685, 189–196. [Google Scholar] [CrossRef]
  113. Jentzsch, P.V.; Kampe, B.; Ciobotǎ, V.; Rösch, P.; Popp, J. Inorganic salts in atmospheric particulate matter: Raman spectroscopy as an analytical tool. Spectrochim. Acta Part A Mol. Biomol. Spectrosc. 2013, 115, 697–708. [Google Scholar] [CrossRef]
  114. Stacey, P.; Mader, K.T.; Sammon, C. Feasibility of the quantification of respirable crystalline silica by mass on aerosol sampling filters using raman microscopy. J. Raman Spectrosc. 2017, 48, 720–725. [Google Scholar] [CrossRef]
  115. Stacey, P.; Hall, S.; Stagg, S.; Clegg, F.; Sammon, C. Raman spectroscopy and X-ray diffraction responses when measuring health-related micrometre and nanometre particle size fractions of crystalline quartz and the measurement of quartz in dust samples from the cutting and polishing of natural and artificial. J. Raman Spectrosc. 2021, 52, 1095–1107. [Google Scholar] [CrossRef]
  116. Marina-Montes, C.; Pérez-Arribas, L.V.; Anzano, J.; de Vallejuelo, S.F.O.; Aramendia, J.; Gómez-Nubla, L.; de Diego, A.; Manuel Madariaga, J.; Cáceres, J.O. Characterization of atmospheric aerosols in the Antarctic region using Raman Spectroscopy and Scanning Electron Microscopy. Spectrochim. Acta Part A Mol. Biomol. Spectrosc. 2022, 266, 120452. [Google Scholar] [CrossRef]
  117. Ghosal, S.; Wall, S. Identifying regional soil as the potential source of PM2.5 particulate matter on air filters collected in Imperial Valley, California—A Raman micro-spectroscopy study. Environ. Pollut. 2019, 253, 181–189. [Google Scholar] [CrossRef]
  118. Grey, I.E. Diffraction methods in the characterization of new mineral species. J. Solid State Chem. 2022, 312, 123239. [Google Scholar] [CrossRef]
  119. Clegg, W. X-ray and Neutron Diffraction; Elsevier Inc.: Amsterdam, The Netherlands, 2021; Volume 1, ISBN 9780081026885. [Google Scholar]
  120. Gunchin, G.; Osan, J.; Migliori, A.; Shagjjamba, D.; Streli, C. Chromium and zinc speciation in airborne particulate matter collected in ulaanbaatar, mongolia, by X-ray absorption near-edge structure spectroscopy. Aerosol Air Qual. Res. 2021, 21, 210018. [Google Scholar] [CrossRef]
  121. Buczyńska, A.J.; Krata, A.; Van Grieken, R.; Brown, A.; Polezer, G.; De Wael, K.; Potgieter-Vermaak, S. Composition of PM2.5 and PM1 on high and low pollution event days and its relation to indoor air quality in a home for the elderly. Sci. Total Environ. 2014, 490, 134–143. [Google Scholar] [CrossRef]
  122. Cornelius, M.-L.U.; Ameh, A.E.; Eze, C.P.; Fatoba, O.; Sartbaeva, A.; Petrik, L.F. The behaviour of rare earth elements from south african coal fly ash during enrichment processes: Wet, magnetic separation and zeolitisation. Minerals 2021, 11, 950. [Google Scholar] [CrossRef]
  123. Agnihotri, R.; Mishra, S.K.; Yadav, P.; Singh, S.; Rashmi; Prasad, M.V.S.N.; Sharma, C.; Arya, B.C. Bulk level to individual particle level chemical composition of atmospheric dust aerosols (PM5) over a semi-arid urban zone of western india (rajasthan). Aerosol Air Qual. Res. 2015, 15, 58–71. [Google Scholar] [CrossRef]
  124. Flanagan, J.B.; Jayanty, R.K.M.; Rickman, E.E.; Peterson, M.R. PM2.5 speciation trends network: Evaluation of whole-system uncertainties using data from sites with collocated samplers). J. Air Waste Manag. Assoc. 2006, 56, 492–499. [Google Scholar] [CrossRef] [PubMed]
  125. Jakšić, M.; Paszti, F.; Kotai, A.; Fazinic, S. Instrumentation for PIXE and RBS. Iaea-Tecdoc 2000, 1190, 1–71. [Google Scholar]
  126. Chiari, M.; Yubero, E.; Calzolai, G.; Lucarelli, F.; Crespo, J.; Galindo, N.; Nicolás, J.F.; Giannoni, M.; Nava, S. Comparison of PIXE and XRF analysis of airborne particulate matter samples collected on Teflon and quartz fibre filters. Nucl. Instrum. Methods Phys. Res. Sect. B Beam Interact. Mater. At. 2018, 417, 128–132. [Google Scholar] [CrossRef]
  127. Sottili, L.; Giuntini, L.; Mazzinghi, A.; Massi, M.; Carraresi, L.; Castelli, L.; Czelusniak, C.; Giambi, F.; Mandò, P.A.; Manetti, M.; et al. The Role of PIXE and XRF in Heritage Science: The INFN-CHNet LABEC Experience. Appl. Sci. 2022, 12, 6585. [Google Scholar] [CrossRef]
  128. Liang, Z.; Chu, Y.; Gen, M.; Chan, C.K. Single-particle Raman spectroscopy for studying physical and chemical processes of atmospheric particles. Atmos. Chem. Phys. 2022, 22, 3017–3044. [Google Scholar] [CrossRef]
  129. Correa, M.A.; Franco, S.A.; Gómez, L.M.; Aguiar, D.; Colorado, H.A. Characterization Methods of Ions and Metals in Particulate Matter Pollutants on PM2.5 and PM10 Samples from Several Emission Sources. Sustain. 2023, 15, 4402. [Google Scholar] [CrossRef]
  130. Villegas, J.E.; Gutiérrez, J.; Colorado, H. Active materials for adaptive building envelopes: A review. J. Mater. Environ. Sci 2020, 2020, 988–1009. [Google Scholar]
  131. Colorado, H.A.; Mendoza, D.E.; Lin, H.T.; Gutierrez-Velasquez, E. Additive manufacturing against the COVID-19 pandemic: A technological model for the adaptability and networking. J. Mater. Res. Technol. 2022, 16, 1150–1164. [Google Scholar] [CrossRef]
  132. Castañeda, M.; Gutiérrez-Velásquez, E.I.; Aguilar, C.E.; Monteiro, S.N.; Amell, A.A.; Colorado, H.A. Sustainability and Circular Economy Perspectives of Materials for Thermoelectric Modules. Sustainability 2022, 14, 5987. [Google Scholar] [CrossRef]
Figure 1. Environmental pollution in Medellin, Colombia. (a,b) pollution generated by vehicles in different areas of the city; (c) haze generated by pollution in Medellin.
Sustainability 15 08504 g001
Figure 2. Search methodology using Proknow-C.
Sustainability 15 08504 g002
Figure 3. Search results: (a) quantity of articles per year, (b) quantity of articles per characterization technique, (c) quantity of articles per country.
Sustainability 15 08504 g003
Figure 4. Minerals identified in atmospheric particulate matter. (a) oxides, (b) phosphates, and (c) carbonates.
Sustainability 15 08504 g004
Figure 5. XRF methods for atmospheric particulate analysis.
Sustainability 15 08504 g005
Figure 6. Atmospheric salts identified with Raman spectroscopy.
Sustainability 15 08504 g006
Table 1. Some search commands used for the search of the information using the Proknow-C method.
TypeSearch Command
1“XRD” and (PM2.5 OR PM10) and “Clay minerals”
2“XRD” and (PM2.5 OR PM10) and “Aluminosilicates”
3“XRD” and “Particulate matter” and “Atmospheric”
4“Chemical analysis” and “XRF” and “Particulate matter”
5“Elemental compositions” and “XRF” and “Particulate matter”
6“X-ray fluorescence” and (PM2.5 OR PM10)
7“Particulate matter” and “Atmospheric” and “FTIR”
8“FTIR” and (PM2.5 OR PM10) and (organics OR inorganics)
9“Particulate matter” and “Atmospheric” and “Raman”
10“Raman spectroscopy” and (PM2.5 or PM10) and “Black carbon”
Table 3. Detection Limit Method (MDL) for some functional groups [94].
Functional GroupMDL (ng m−3)
Methyl CH31.67
Methylene CH291.39
Aliphatic CH7.69
Alkene C=C1.06
Aromatic CH16.55
Aldehydes/Ketones -(O)R14.77
Esters/lactones -C(O)O-24
Amines NH24.84
Calcium silicate CaSiO34.14
Carbohydrate ether -C-O-C4.61
Table 4. Inorganic Absorbances Observed in Spectra of Ambient Aerosol.
Functional GroupsFrequency from Literature (cm−1)References
Inorganics
CaSO4calcium sulfate671[39]
CaCO3calcium carbonate877, 1433[40]
CaSO4·2H2Ogypsum3404, 3535[39]
SO32−sulfite ion671, 694[39]
SO42−sulfate ion599–617[39]
NH4+ammonium ions1414, 3045, 3215[36,37,39]
SiO2silicon oxide730, 109[40]
NO3nitrate ions825, 1320, 1356[36,37,39]
NaNO3sodium nitrate1768[40]
HSO4bisulfate ions867, 1029, 1180[40]
Organics
C=Ocarbonyl carbons1640–1850[36]
C-Haliphatic carbons1452, 2800–3000[40]
COHalcohols3500–3750[40]
CH2methylene2924, 2854[36]
CH3methyl1375[36]
Table 5. Aspects measured by each characterization technique.
Technique Information Provided by Each Technique
X-ray Diffraction (XRD)Identification of crystalline material, identification of various polymorphic forms (fingerprints), differentiation between amorphous and crystalline material, and quantification of the percentage of crystallinity of samples.
X-ray Fluorescence (XRF)Detection and measurement of most of the elements of periodic table, from uranium (U), the heaviest element, to the lightest elements, such as magnesium (Mg) and beryllium (Be).
Fourier Transform Infrared Spectroscopy (FTIR)Determination of functional groups present in organic and inorganic compounds; measurement of energy required to initiate molecular vibrations in a sample.
Raman spectroscopyIt provides complementary information to that obtained by IR spectroscopy; it allows the analysis of chemical composition and molecular structure; it identifies one of the atmospheric pollutants: black carbon (BC)
Disclaimer/Publisher’s Note: The statements, opinions and data contained in all publications are solely those of the individual author(s) and contributor(s) and not of MDPI and/or the editor(s). MDPI and/or the editor(s) disclaim responsibility for any injury to people or property resulting from any ideas, methods, instructions or products referred to in the content.

