
Synthesis and Characterization of the Carbonate Hydrotalcites (NiAl-HT, CoAl-HT, and NiCoAl-HT), and Its Application for Removal of the Anionic Azo Dye Titan Yellow from Aqueous Solution
 , ,
, ,  , and
, and
Abstract
:1. Introduction
2. Materials and Methods
2.1. Chemicals and Materials
2.2. NiAl-HT, CoAL-HT, and NiCoAL-HT Synthesis
2.3. Characterization
2.4. Adsorption Procedure
2.4.1. Effect of Initial pH
2.4.2. Effect of Adsorbent Mass
2.4.3. Effect of Contact Time
2.4.4. Effect of Temperature
3. Results and Discussion
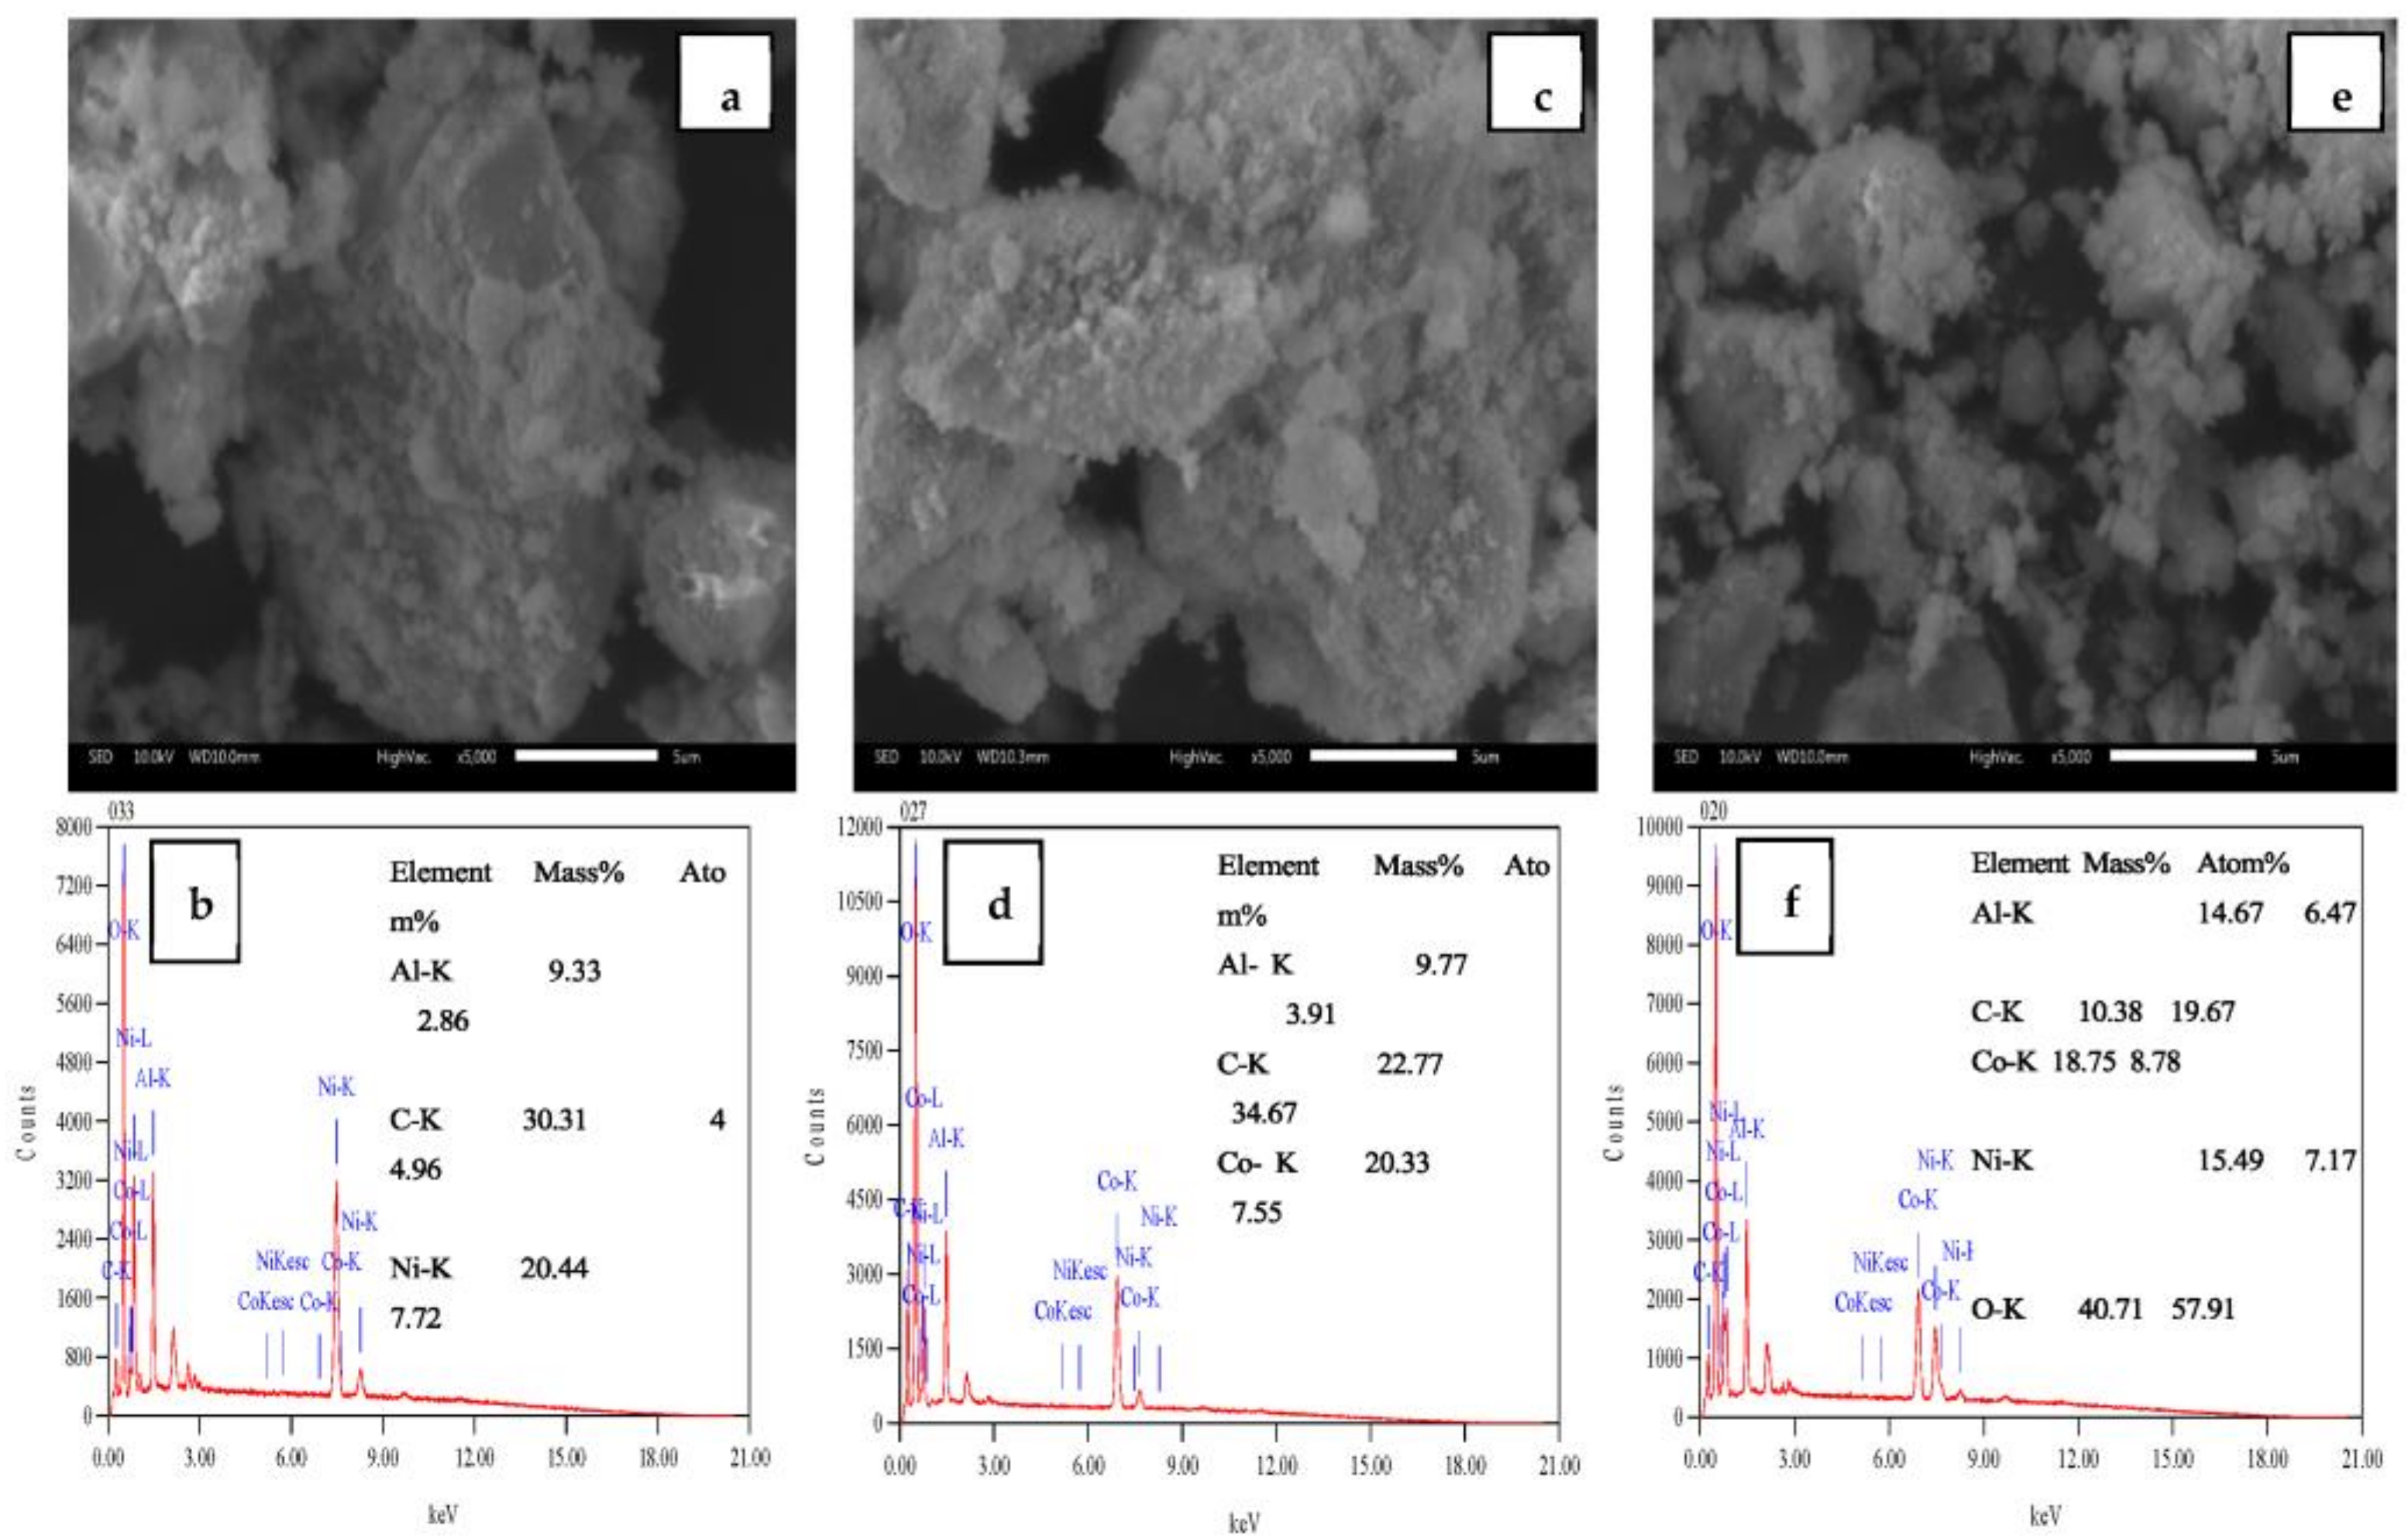
3.1. Characterization of NiAl-HT, CoAl-HT, and NiCoAl-HT
3.2. Adsorption Study of Titan Yellow
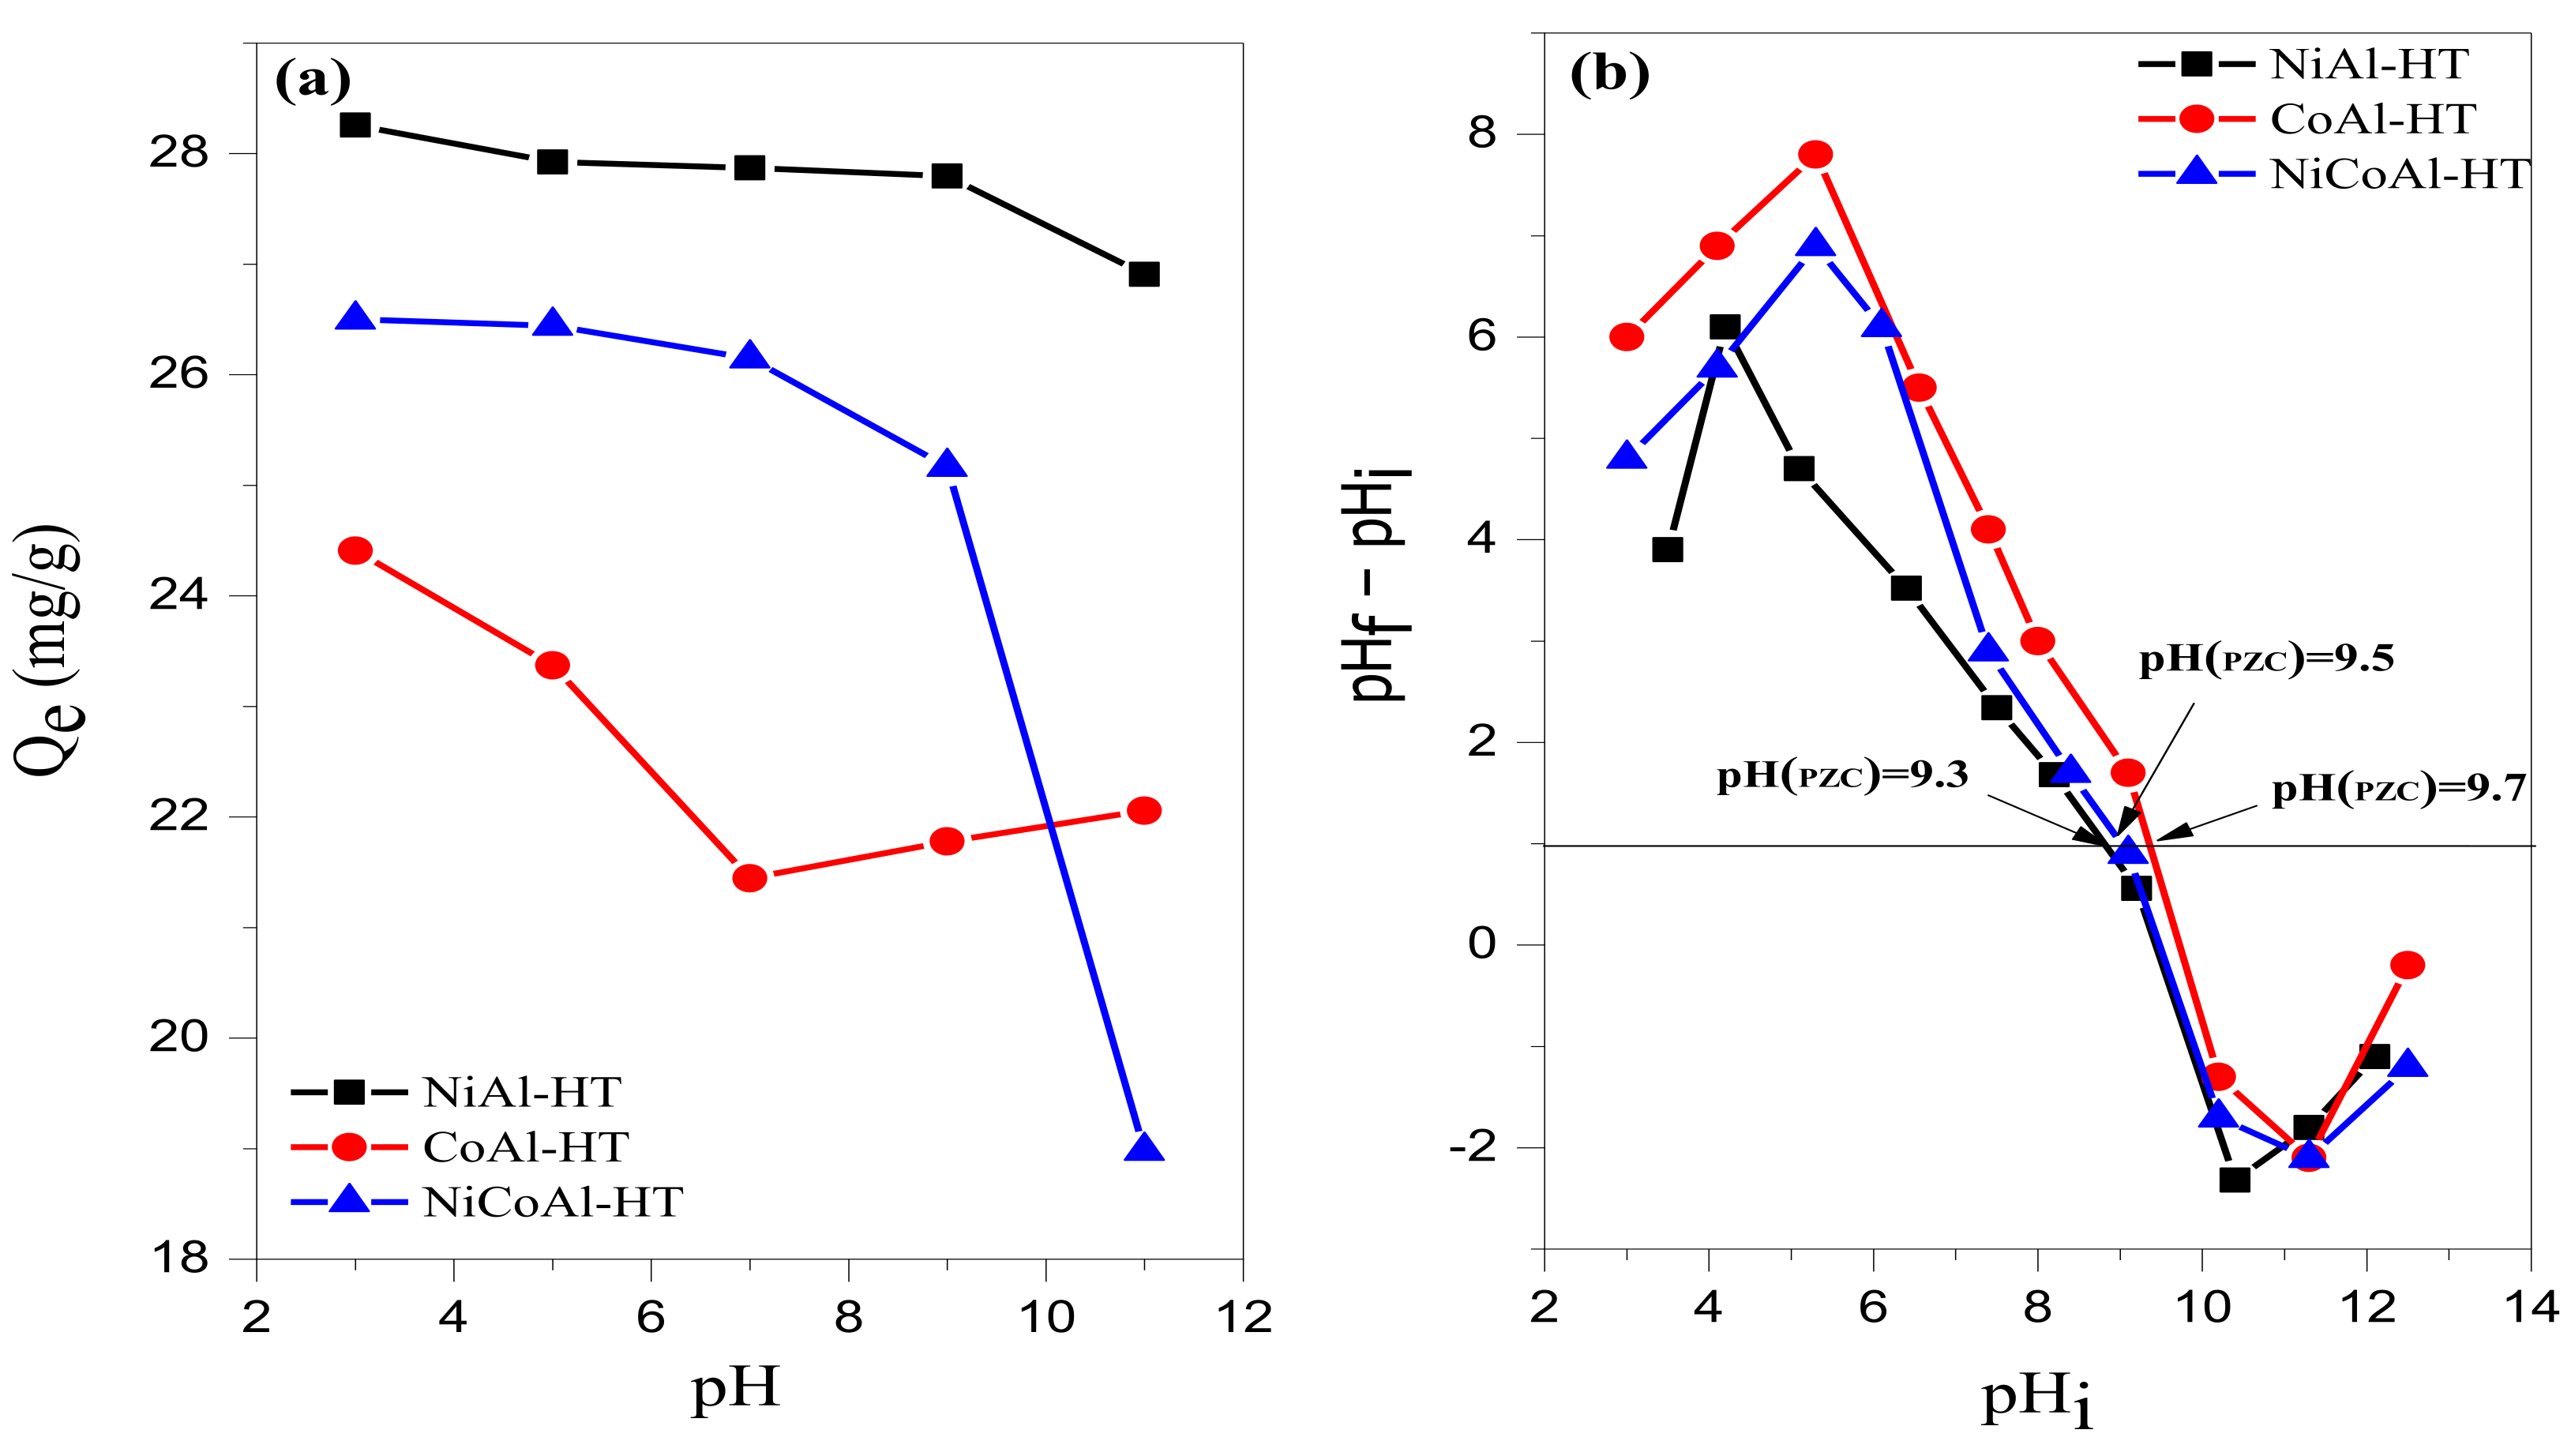
3.2.1. Effect of Initial pH
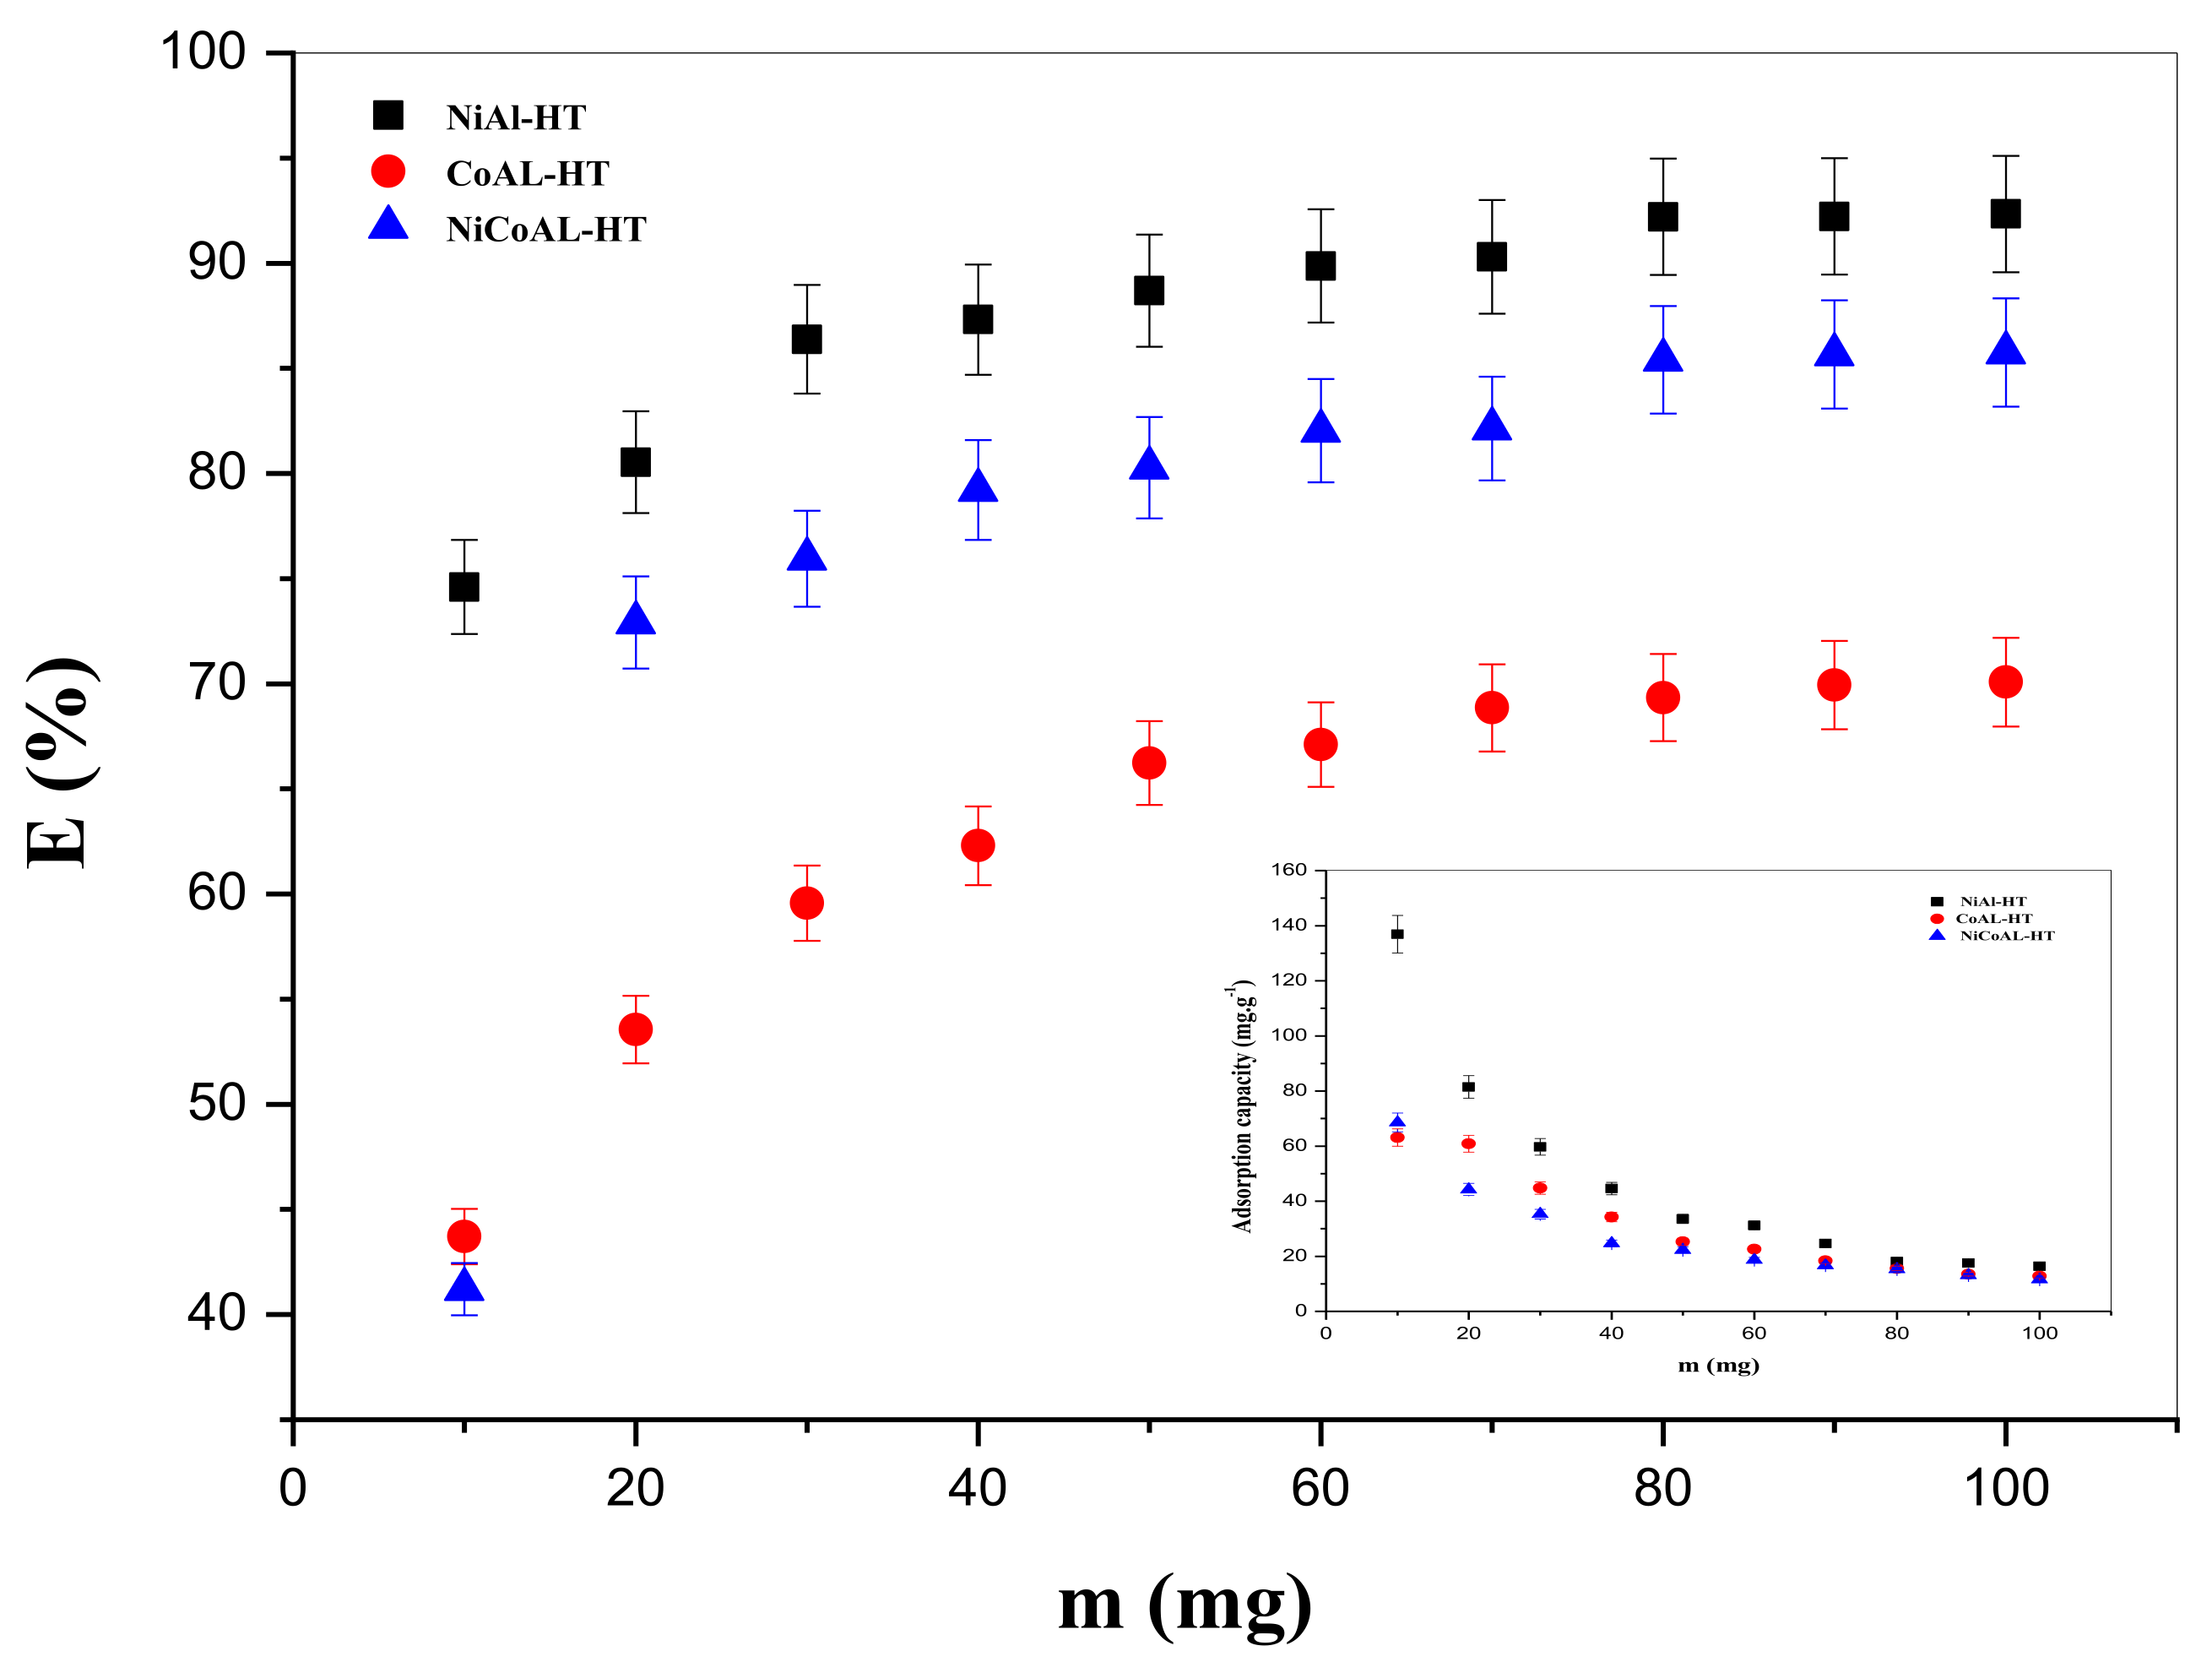
3.2.2. Effect of Adsorbent Dose
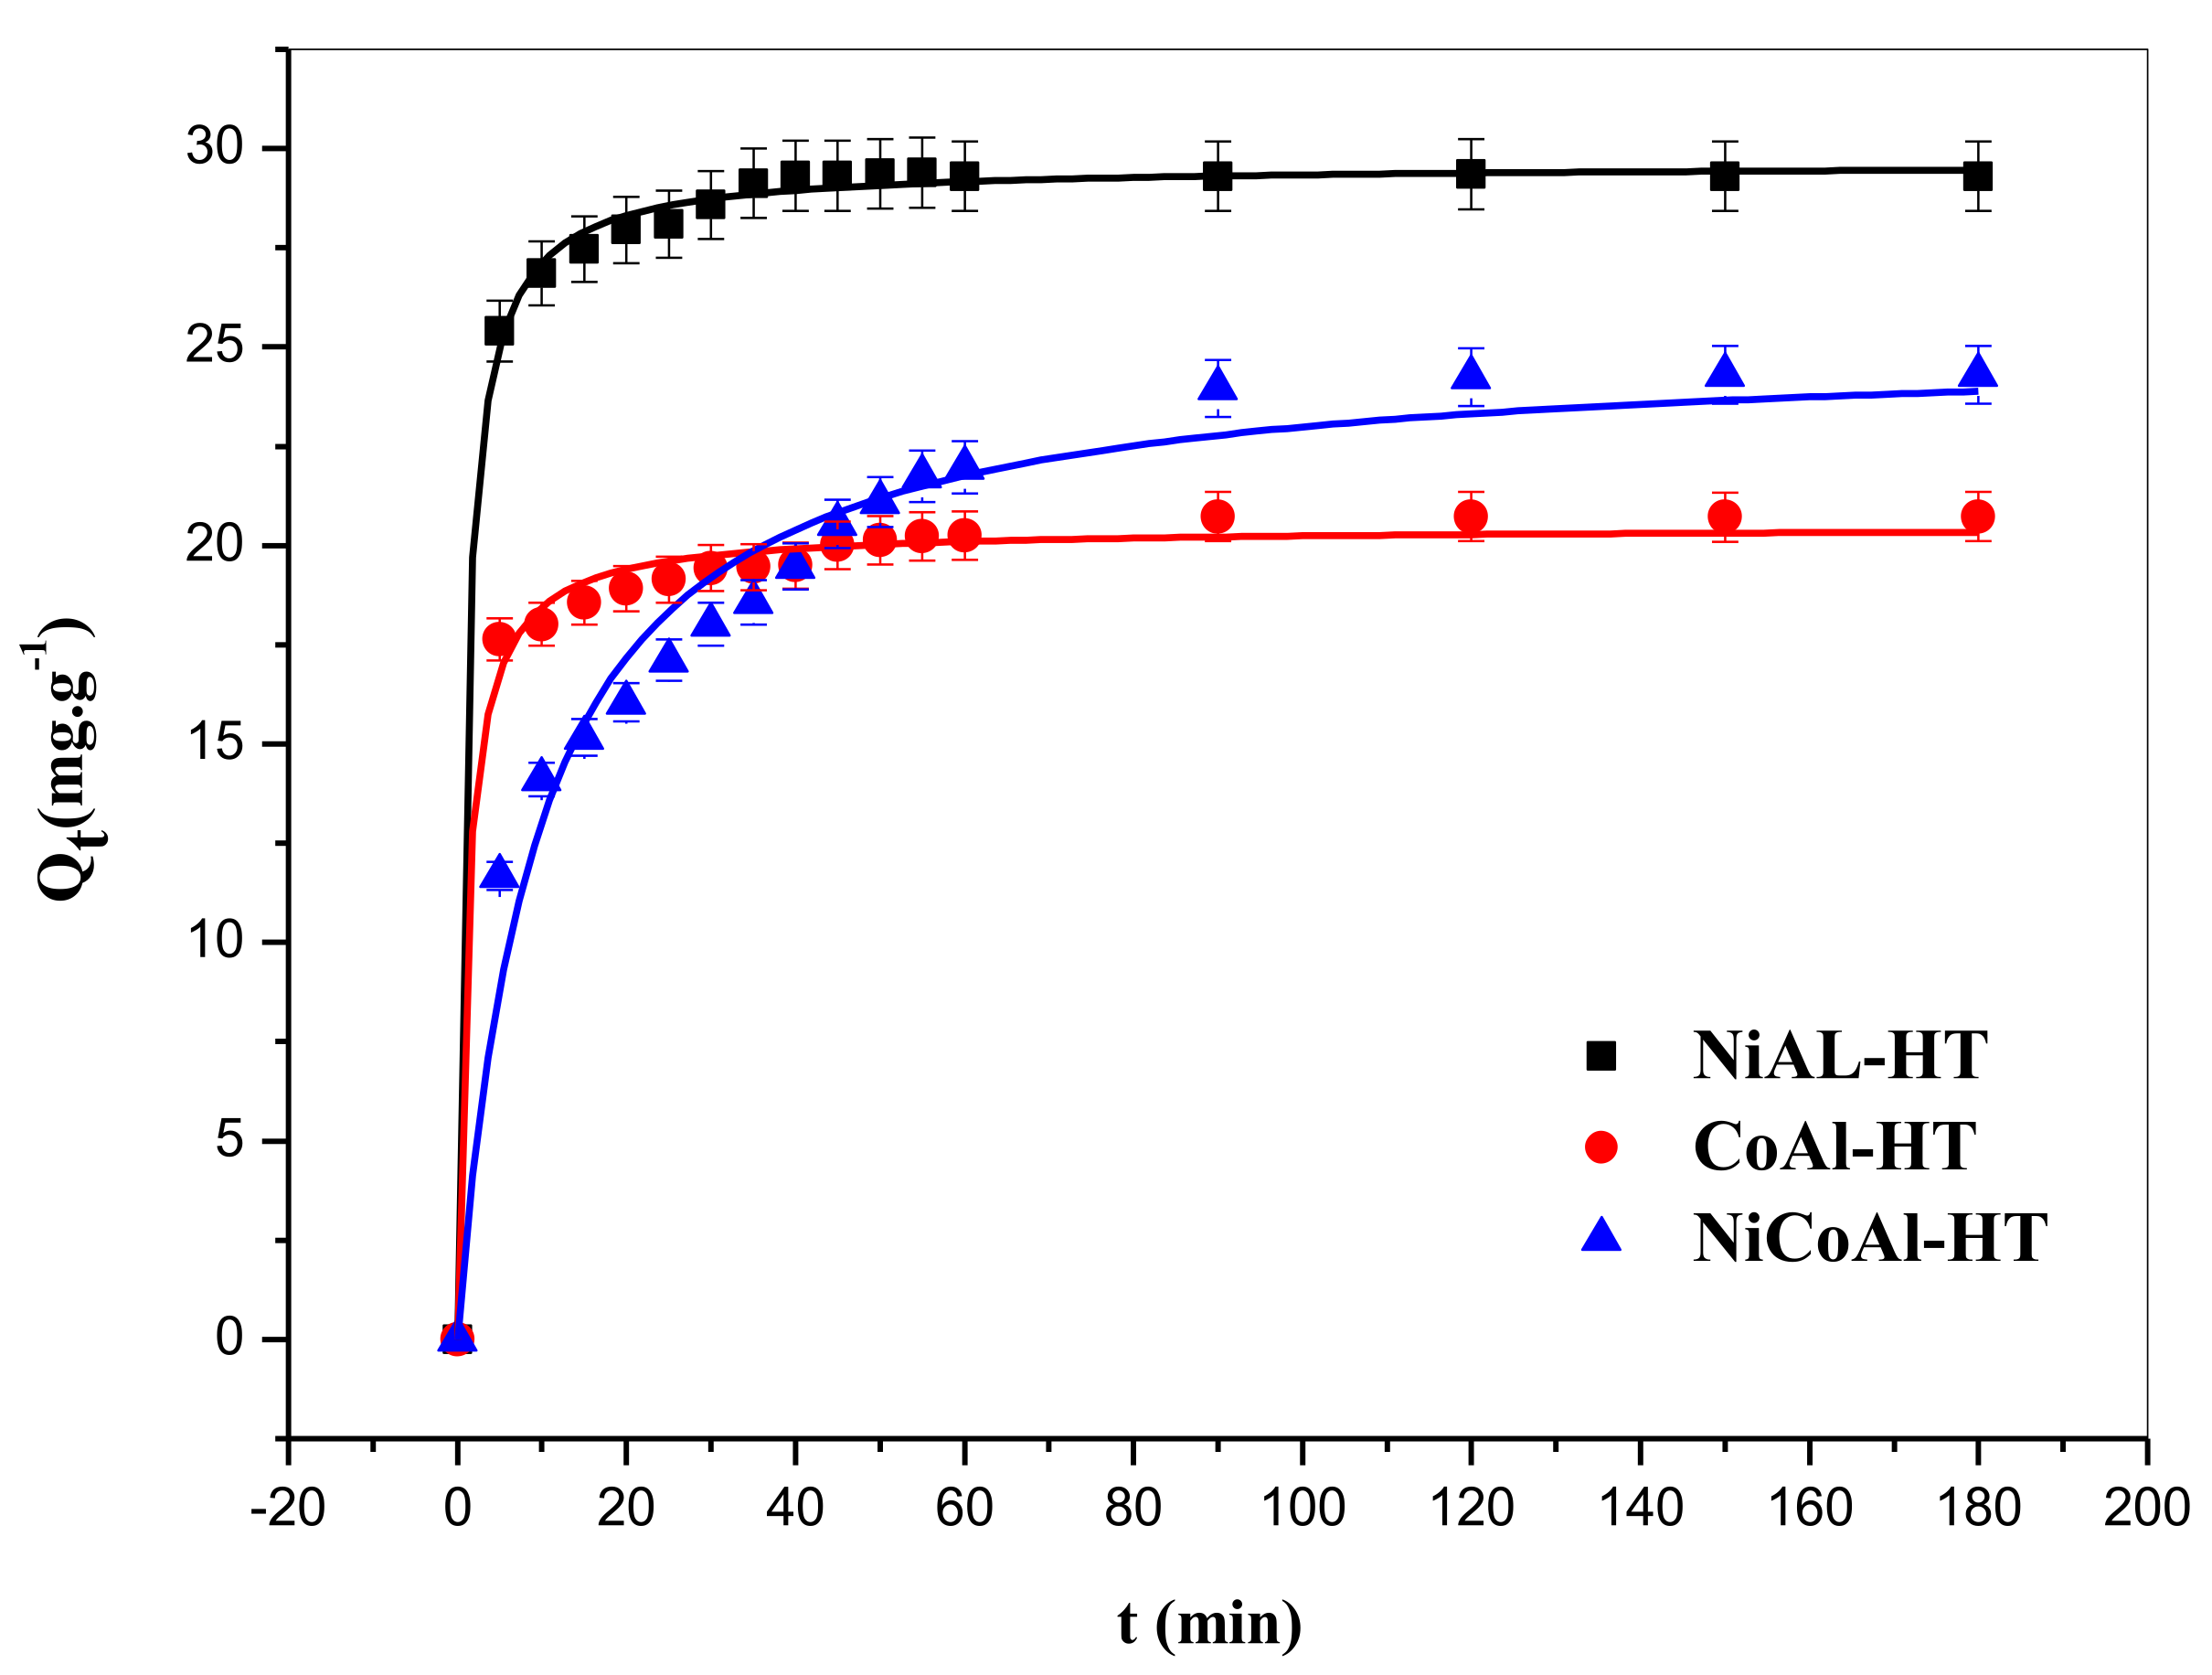
3.2.3. Effect of Contact Time
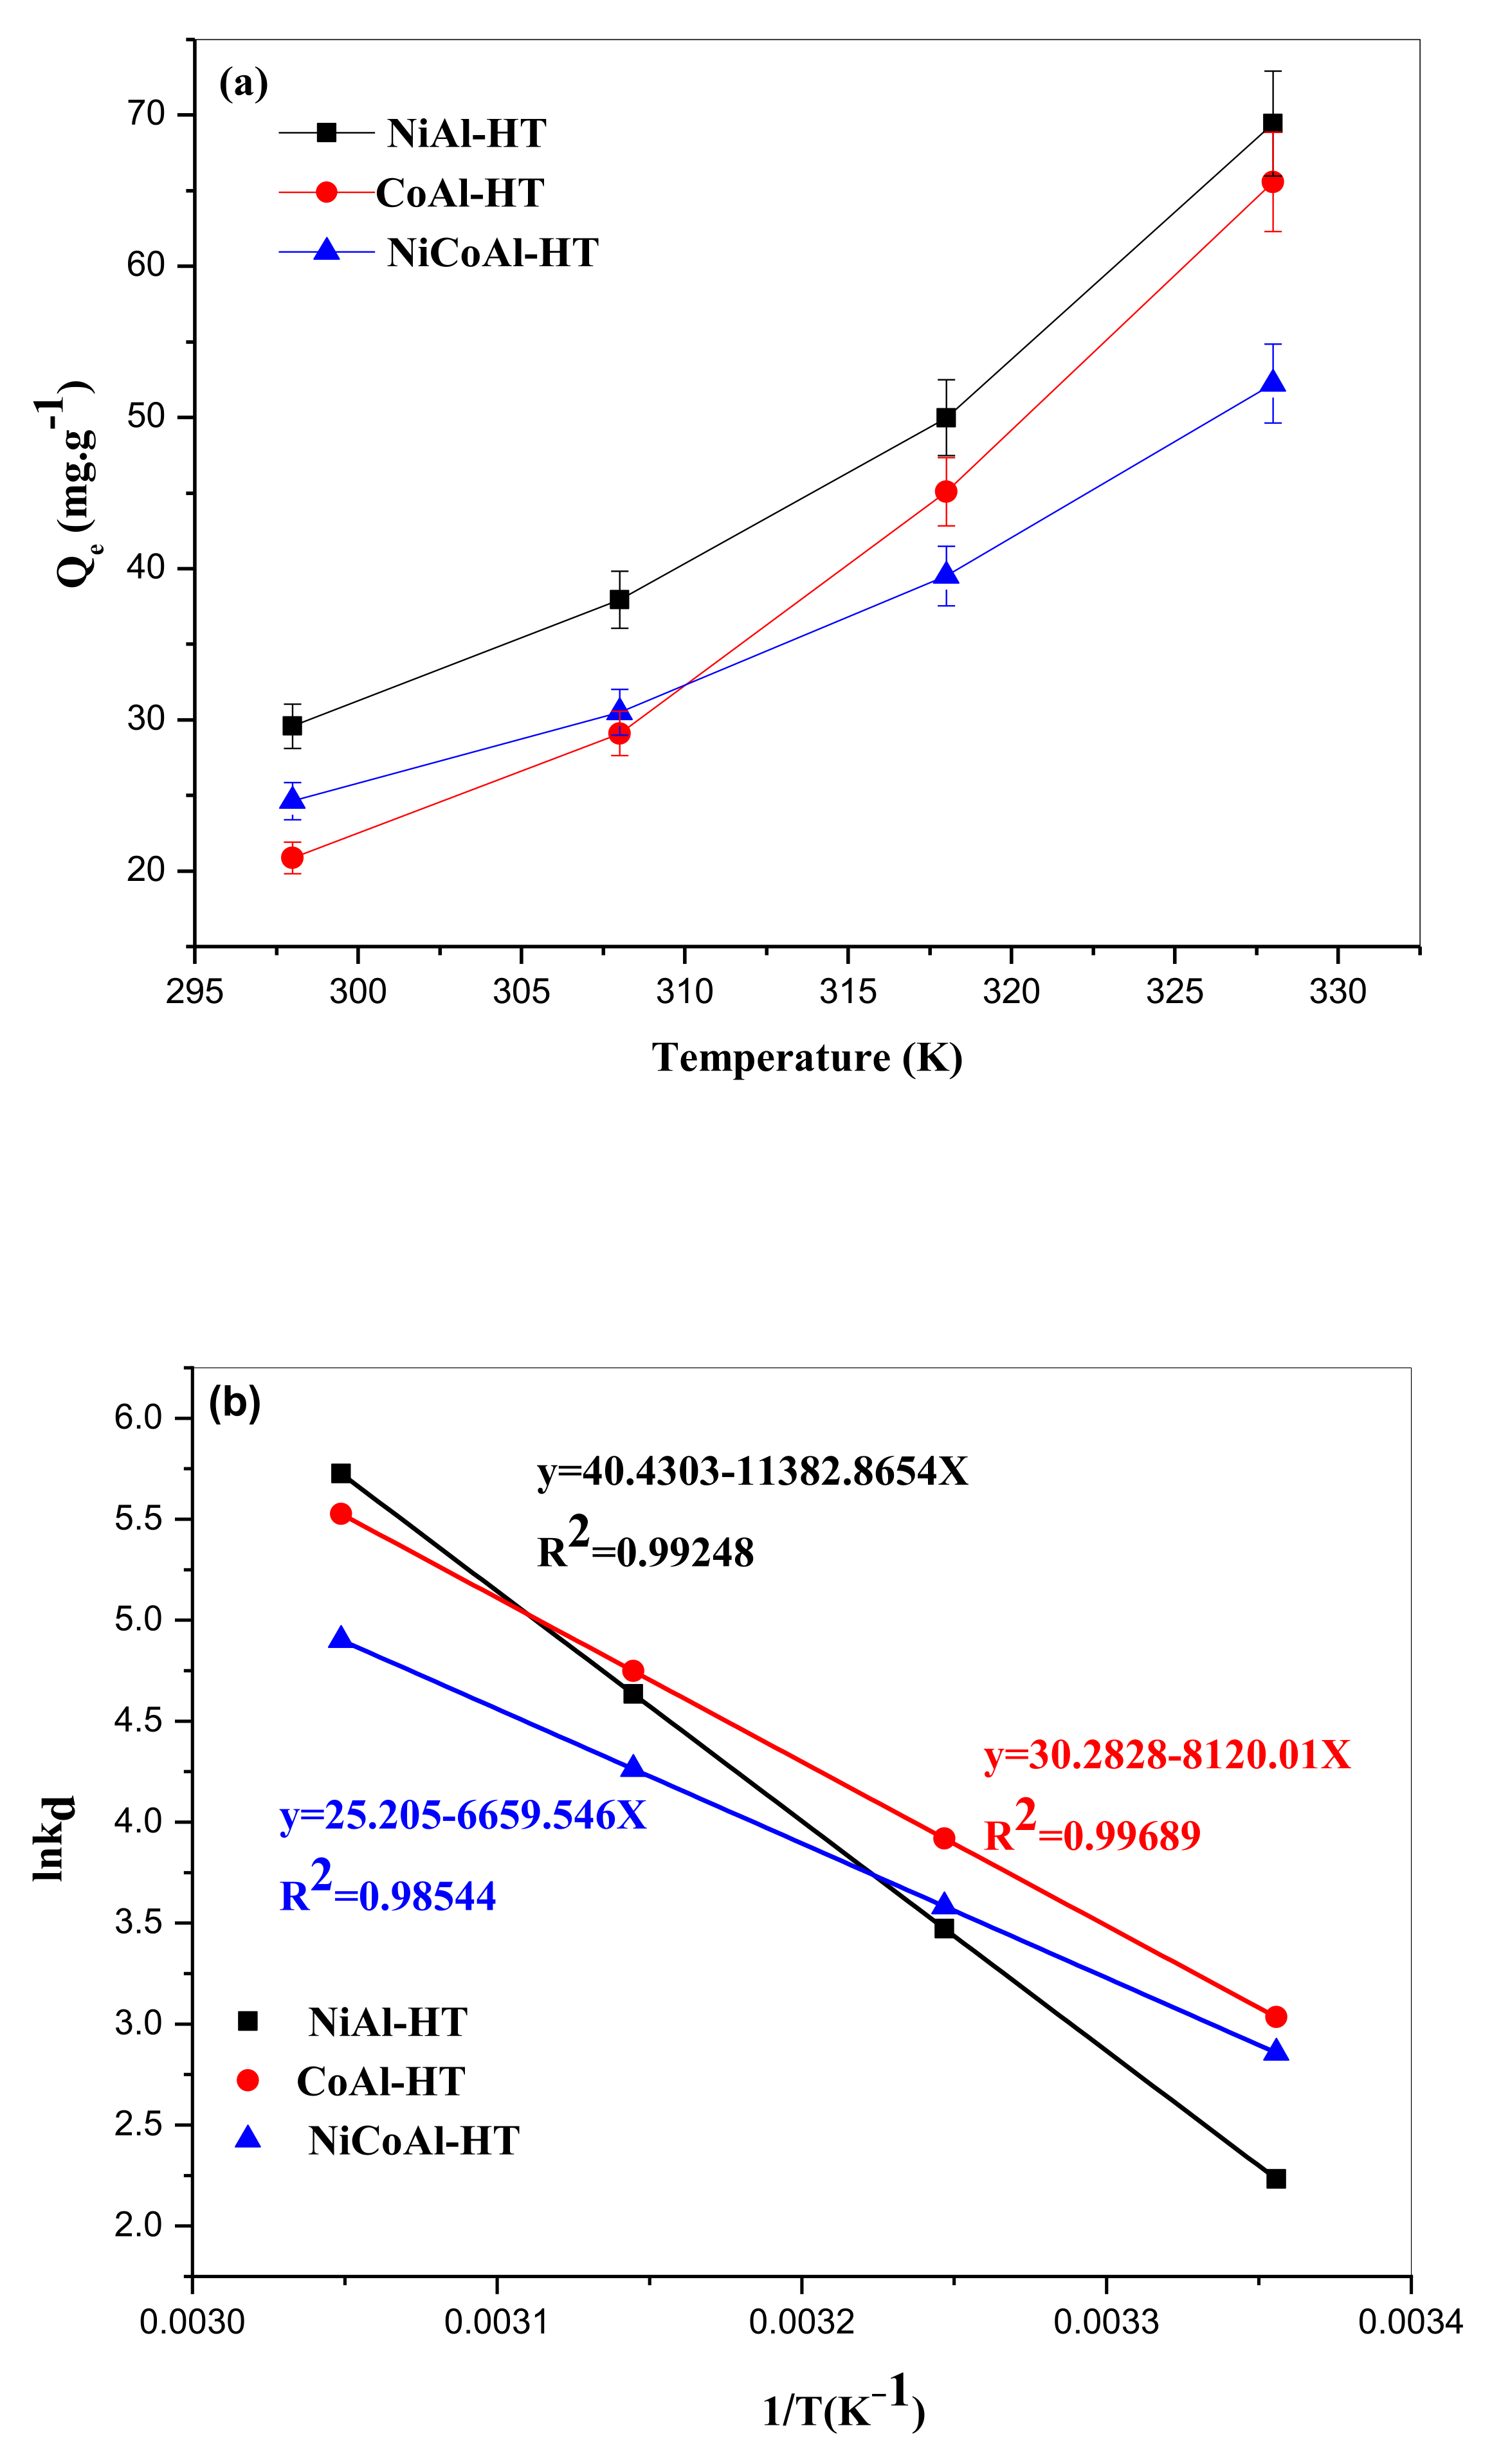
3.2.4. Effect of Temperature
3.2.5. Kinetics Studies
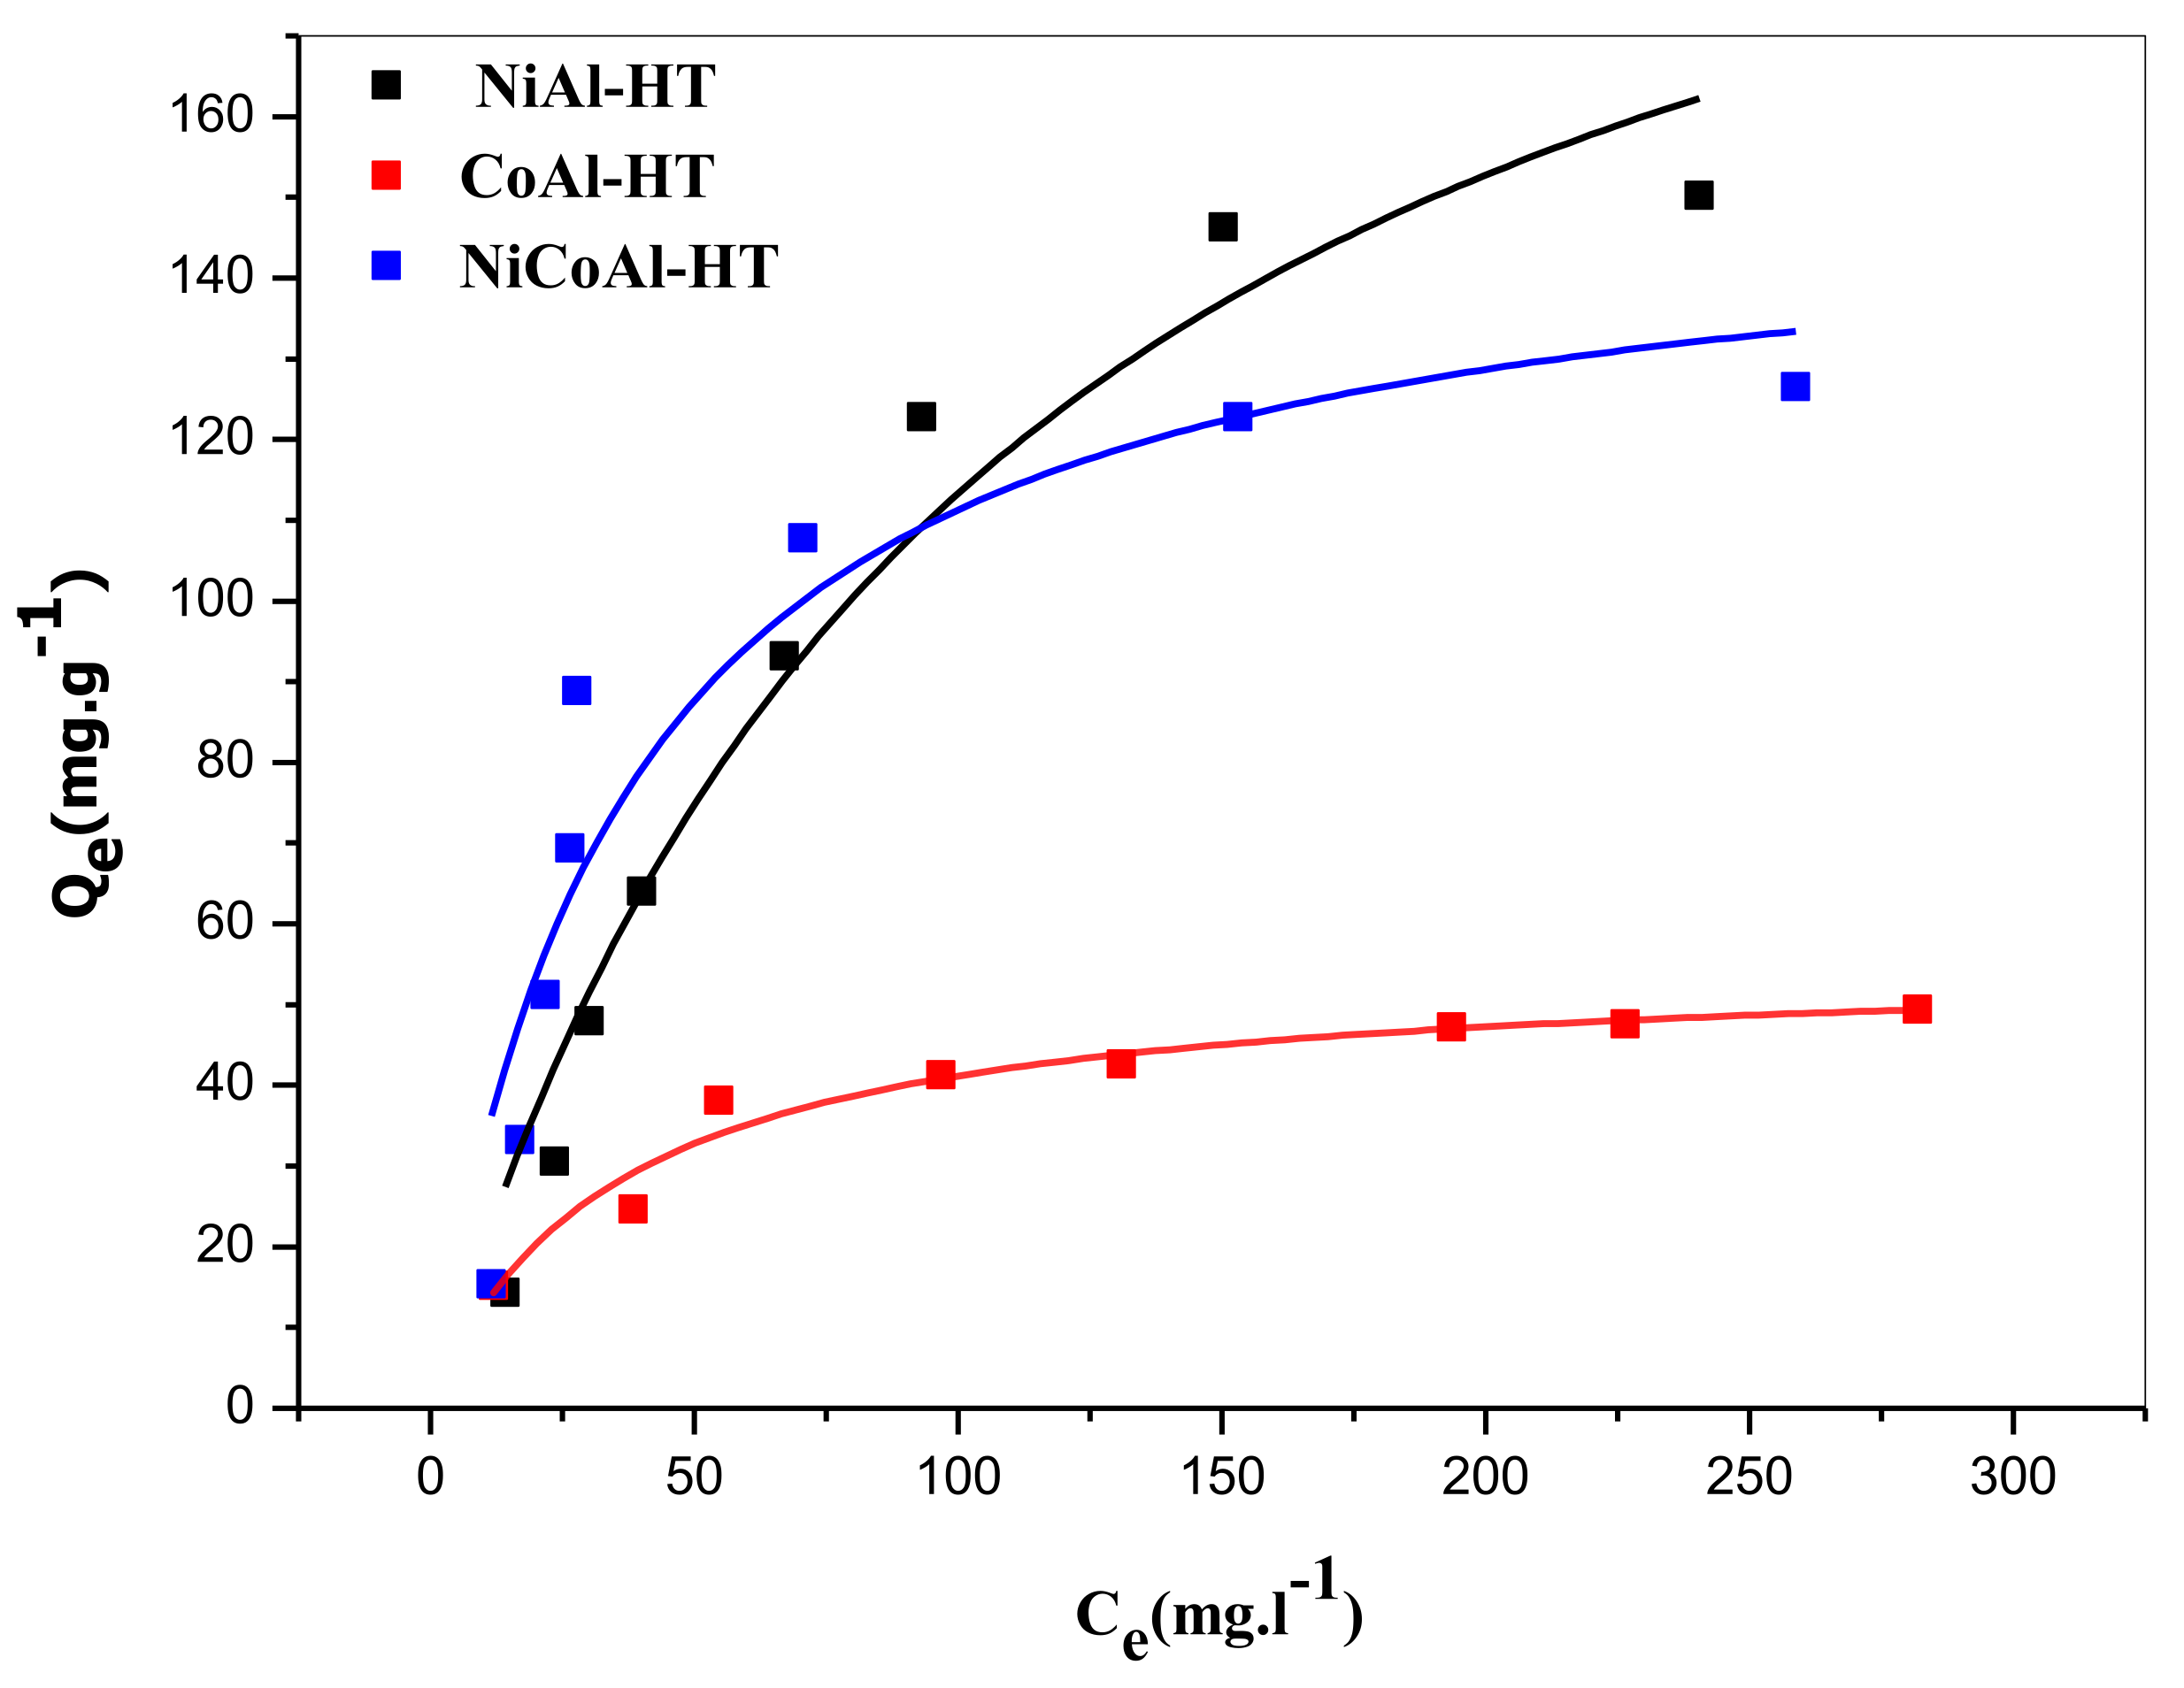
3.2.6. Adsorption Equilibrium Isotherms
3.2.7. Adsorption Thermodynamics
4. Conclusions
Author Contributions
Funding
Institutional Review Board Statement
Informed Consent Statement
Data Availability Statement
Acknowledgments
Conflicts of Interest
References
- Owa, F.D. Water Pollution: Sources, Effects, Control and Management. Mediterr. J. Soc. Sci. 2013, 4, 65. [Google Scholar] [CrossRef]
- Jayaswal, K.; Sahu, V.; Gurjar, B. Water Pollution, Human Health and Remediation. In Water Remediation. Energy, Environment, and Sustainability; Springer: Singapore, 2018; pp. 11–27. ISBN 978-981-10-7550-6. [Google Scholar]
- Chedri Mammar, A.; Mouni, L.; Bollinger, J.-C.; Belkhiri, L.; Bouzaza, A.; Assadi, A.A.; Belkacemi, H. Modeling and Optimization of Process Parameters in Elucidating the Adsorption Mechanism of Gallic Acid on Activated Carbon Prepared from Date Stones. Sep. Sci. Technol. 2020, 55, 3113–3125. [Google Scholar] [CrossRef]
- Khattab, T.; Abdelrahman, M.; Rehan, M. Textile Dyeing Industry: Environmental Impacts and Remediation. Environ. Sci. Pollut. Res. 2020, 27, 3803–3818. [Google Scholar] [CrossRef] [PubMed]
- El-Azazy, M.; Dimassi, S.; El-Shafie, A.; Issa, A. Bio-Waste Aloe Vera Leaves as an Efficient Adsorbent for Titan Yellow from Wastewater: Structuring of a Novel Adsorbent Using Plackett-Burman Factorial Design. Appl. Sci. 2019, 9, 4856. [Google Scholar] [CrossRef]
- Haque, M.M.; Haque, M.A.; Mosharaf, M.K.; Marcus, P. Decolorization, Degradation and Detoxification of Carcinogenic Sulfonated Azo Dye Methyl Orange by Newly Developed Biofilm Consortia. Saudi J. Biol. Sci. 2020, 28, 793–804. [Google Scholar] [CrossRef]
- Fenelon, E.; Ni’am, A.; Wang, Y.-F.; You, S.-J. Study of the Potential of La/Bi2S3 Catalyst for Photodegradation of Acid Yellow 42 Dye under Visible Light. J. Nanomater. 2022, 2022, 2990466. [Google Scholar] [CrossRef]
- Shi, Q.-X.; Li, Y.; Wang, L.; Wang, J.; Cao, Y.-L. Preparation of Supported Chitosan Adsorbent with High Adsorption Capacity for Titan Yellow Removal. Int. J. Biol. Macromol. 2020, 152, 449–455. [Google Scholar] [CrossRef]
- Dadou, S.; Berrama, T.; Doufene, N.; Zekkaoui, C.; Beriber, A. Evaluating Untreated Clay’s Adsorptive Capacity to Remove an Anionic Dye from Aqueous Solution. Arab. J. Sci. Eng. 2019, 44, 9889–9903. [Google Scholar] [CrossRef]
- Hadadi, A.; Imessaoudene, A.; Bollinger, J.-C.; Cheikh, S.; Assadi, A.A.; Amrane, A.; Kebir, M.; Mouni, L. Parametrical Study for the Effective Removal of Mordant Black 11 from Synthetic Solutions: Moringa Oleifera Seeds’ Extracts Versus Alum. Water 2022, 14, 4109. [Google Scholar] [CrossRef]
- BinSabt, M.; Sagar, V.; Singh, J.; Rawat, M.; Shaban, M. Green Synthesis of CS-TiO2 NPs for Efficient Photocatalytic Degradation of Methylene Blue Dye. Polymers 2022, 14, 2677. [Google Scholar] [CrossRef]
- Bhad, R.M.; Das, A.; Kodape, S.M. Ozonation of Procion Blue Reactive Dye and Its Kinetics Study. Pollution 2022, 8, 529–541. [Google Scholar] [CrossRef]
- Vecino, X.; Reig, M. Wastewater Treatment by Adsorption and/or Ion-Exchange Processes for Resource Recovery. Water 2022, 14, 911. [Google Scholar] [CrossRef]
- Nidheesh, P.V.; Couras, C.; Karim, A.V.; Nadais, H. A Review of Integrated Advanced Oxidation Processes and Biological Processes for Organic Pollutant Removal. Chem. Eng. Commun. 2021, 209, 390–432. [Google Scholar] [CrossRef]
- Abd Malek, N.; Jawad, A.H.; Ismail, K.; Razuan, R.; Alothman, Z. Fly Ash Modified Magnetic Chitosan-Polyvinyl Alcohol Blend for Reactive Orange 16 Dye Removal: Adsorption Parametric Optimization. Int. J. Biol. Macromol. 2021, 189, 464–476. [Google Scholar] [CrossRef]
- Liu, F.; Hua, S.; Wang, C.; Qiu, M.; Jin, L.; Hu, B. Adsorption and Reduction of Cr(VI) from Aqueous Solution Using Cost-Effective Caffeic Acid Functionalized Corn Starch. Chemosphere 2021, 279, 130539. [Google Scholar] [CrossRef]
- Bekhoukh, A.; Moulefera, I.; Zeggai, F.Z.; Benyoucef, A.; Bachari, K. Anionic Methyl Orange Removal from Aqueous Solutions by Activated Carbon Reinforced Conducting Polyaniline as Adsorbent: Synthesis, Characterization, Adsorption Behavior, Regeneration and Kinetics Study. J. Polym. Environ. 2022, 30, 886–895. [Google Scholar] [CrossRef]
- Sarabadan, M.; Bashiri, H.; Mousavi, S. Adsorption of Crystal Violet Dye by Zeolite-Montmorillonite: Modeling, Kinetic and Equilibrium Studies. Clay Miner. 2019, 54, 357–368. [Google Scholar] [CrossRef]
- Wang, X.; Pfeiffer, H.; Wei, J.; Dan, J.; Wang, J.; Zhang, J. 3D Porous Ca-Modified Mg-Zr Mixed Metal Oxide for Fluoride Adsorption. Chem. Eng. J. 2021, 428, 131371. [Google Scholar] [CrossRef]
- Junejo, R.; Memon, S.; Memon, F.; Memon, A.; Durmaz, F.; Bhatti, A.; Bhatti, A. Thermodynamic and Kinetic Studies for Adsorption of Reactive Blue (RB-19) Dye Using Calix[4]Arene-Based Adsorbent. J. Chem. Eng. Data 2019, 64, 3407–3415. [Google Scholar] [CrossRef]
- Bouchelkia, N.; Tahraoui, H.; Amrane, A.; Belkacemi, H.; Bollinger, J.-C.; Bouzaza, A.; Zoukel, A.; Zhang, J.; Mouni, L. Jujube Stones Based Highly Efficient Activated Carbon for Methylene Blue Adsorption: Kinetics and Isotherms Modeling, Thermodynamics and Mechanism Study, Optimization via Response Surface Methodology and Machine Learning Approaches. Process Saf. Environ. Prot. 2022, 170, 513–535. [Google Scholar] [CrossRef]
- Sabrina, C.; Imessaoudene, A.; Bollinger, J.-C.; Hadadi, A.; Manseri, A.; Bouzaza, A.; Assadi, A.; Amrane, A.; Zamouche, M.; Jery, A.; et al. Complete Elimination of the Ciprofloxacin Antibiotic from Water by the Combination of Adsorption-Photocatalysis Process Using Natural Hydroxyapatite and TiO2. Catalysts 2023, 13, 336. [Google Scholar] [CrossRef]
- Shah, A.K.; Ali, Z.M.; Laghari, A.; Farman, S.; Shah, S.F.; Kazi, D. Utilization of Fly Ash as Low-Cost Adsorbent for the Treatment of Industrial Dyes Effluents—A Comparative Study. Res. Rev. J. Eng. Technol. 2013, 2, 1–10. [Google Scholar]
- Lim, L.; Priyantha, N.; Chan, C.; Matassan, D.; Hei Ing, C.; Kooh, M.R.R. Adsorption Behavior of Methyl Violet 2B Using Duckweed: Equilibrium and Kinetics Studies. Arab. J. Sci. Eng. 2014, 39, 6757–6765. [Google Scholar] [CrossRef]
- Kooh, M.R.R.; Dahri, M.K.; Lim, L.; Lim, L.-H. Batch Adsorption Studies on the Removal of Acid Blue 25 from Aqueous Solution Using Azolla Pinnata and Soya Bean Waste. Arab. J. Sci. Eng. 2016, 41, 2453–2464. [Google Scholar] [CrossRef]
- Lu, Y.; Kooh, M.R.R.; Lim, L.; Priyantha, N. Effective and Simple NaOH-Modification Method to Remove Methyl Violet Dye via Ipomoea Aquatica Roots. Adsorpt. Sci. Technol. 2021, 2021, 5932222. [Google Scholar] [CrossRef]
- Lim, L.; Priyantha, N.; Mansor, N. Artocarpus Altilis (Breadfruit) Skin as a Potential Low-Cost Biosorbent for the Removal of Crystal Violet Dye: Equilibrium, Thermodynamics and Kinetics Studies. Environ. Earth Sci. 2014, 73, 3239–3247. [Google Scholar] [CrossRef]
- Zaidi, N.; Lim, L.; Usman, A.; Kooh, M.R.R. Efficient Adsorption of Malachite Green Dye Using Artocarpus Odoratissimus Leaves with Artificial Neural Network Modelling. Desalination Water Treat. 2018, 101, 313–324. [Google Scholar] [CrossRef]
- Gama, B.M.V.d.; Selvasembian, R.; Giannakoudakis, D.A.; Triantafyllidis, K.S.; McKay, G.; Meili, L. Layered Double Hydroxides as Rising-Star Adsorbents for Water Purification: A Brief Discussion. Molecules 2022, 27, 4900. [Google Scholar] [CrossRef]
- El Hassani, K.; Beakou, B.; Kalnina, D.; Oukani, E.; Anouar, A. Effect of Morphological Properties of Layered Double Hydroxides on Adsorption of Azo Dye Methyl Orange: A Comparative Study. Appl. Clay Sci. 2017, 140, 124–131. [Google Scholar] [CrossRef]
- Hidouri, S.; Errachid, A.; Baussels, J.; Korpan, Y.; Ruiz-Sanchez, O.; Baccar, Z. Potentiometric Sensing of Histamine Using Immobilized Enzymes on Layered Double Hydroxides. J. Food Sci. Technol. Mysore 2020, 58, 2936–2942. [Google Scholar] [CrossRef]
- Fatima, K.; EZZIANE, K.; Bahmani, A.; Nourredine, B.; Mayouf, S. Evans Blue Dye Removal from Contaminated Water on Calcined and Uncalcined Cu-Al-CO3 Layered Double Hydroxide Materials Prepared by Coprecipitation. Bull. Mater. Sci. 2019, 42, 14. [Google Scholar] [CrossRef]
- Vaccari, A. Layered Double Hydroxides: Present and Future: V. Rives (Ed.), Nova Science Publishers, Inc., New York, 2001, IX+439 Pp., ISBN 1-59033-060-9. Appl. Clay Sci. 2002, 22, 75–76. [Google Scholar] [CrossRef]
- Santos, R.M.M.D.; Gonçalves, R.G.L.; Constantino, V.R.L.; Santilli, C.V.; Borges, P.D.; Tronto, J.; Pinto, F.G. Adsorption of Acid Yellow 42 Dye on Calcined Layered Double Hydroxide: Effect of Time, Concentration, PH and Temperature. Appl. Clay Sci. 2017, 140, 132–139. [Google Scholar] [CrossRef]
- Malak-Polaczyk, A.; Vix-Guterl, C.; Frackowiak, E. Carbon/Layered Double Hydroxide (LDH) Composites for Supercapacitor Application. Energy Fuels 2010, 24, 3346–3351. [Google Scholar] [CrossRef]
- Sudare, T.; Tamura, S.; Tanaka, H.; Hayashi, F.; Teshima, K. Highly Crystalline Ni–Co Layered Double Hydroxide Fabricated via Topochemical Transformation with a High Adsorption Capacity for Nitrate Ions. Inorg. Chem. 2019, 58, 15710–15719. [Google Scholar] [CrossRef]
- Ali, B.; Benhadria, N.; Abdelkader, E.; Karima, E.; Nourredine, B. Competitive Adsorption of Binary Dye from Aqueous Solutions Using Calcined Layered Double Hydroxides. Int. J. Environ. Anal. Chem. 2020, 102, 1–20. [Google Scholar] [CrossRef]
- Bouteraa, S.; Saiah, F.B.D.; Hamouda, S.; Bettahar, N. Zn-M-CO3 Layered Double Hydroxides (M = Fe, Cr, or Al): Synthesis, Characterization, and Removal of Aqueous Indigo Carmine. Bull. Chem. React. Eng. Catal. 2020, 15, 43–54. [Google Scholar] [CrossRef]
- Rezak, N.; Bahmani, A.; Bettahar, N. Adsorptive Removal of P(V) and Cr(VI) by Calcined Zn-Al-Fe Ternary LDHs. Water Sci. Technol. 2021, 83, 2504–2517. [Google Scholar] [CrossRef]
- Santosa, S.; Krisbiantoro, P.; Astuti, D. Reusable High Performance of Calcined Mg/Al Hydrotalcite for the Removal of Navy Blue and Yellow F3G Dyes. Chin. J. Chem. Eng. 2020, 38, 247–254. [Google Scholar] [CrossRef]
- Amin, M.; Alazba, P.; Shafiq, M. LDH of NiZnFe and Its Composites with Carbon Nanotubes and Data-Palm Biochar with Efficient Adsorption Capacity for RB5 Dye from Aqueous Solutions: Isotherm, Kinetic, and Thermodynamics Studies. Curr. Appl. Phys. 2020, 40, 90–100. [Google Scholar] [CrossRef]
- Bardestani, R.; Patience, G.; Kaliaguine, S. Experimental Methods in Chemical Engineering: Specific Surface Area and Pore Size Distribution Measurements—BET, BJH, DFT. Can. J. Chem. Eng. 2019, 97, 2781–2791. [Google Scholar] [CrossRef]
- Imessaoudene, A.; Sabrina, C.; Bollinger, J.-C.; Belkhiri, L.; Tiri, A.; Bouzaza, A.; Jery, A.; Amrane, A.; Mouni, L. Zeolite Waste Characterization and Use as Low-Cost, Ecofriendly, and Sustainable Material for Malachite Green and Methylene Blue Dyes Removal: Box–Behnken Design, Kinetics, and Thermodynamics. Appl. Sci. 2022, 12, 7587. [Google Scholar] [CrossRef]
- Djezar, H.; Rida, K.; Salhi, M. Efficient Adsorbent for the Removal of Methyl Orange and Congo Red by Calcined Zn-Al Layered Double Hydroxide. Inorg. Nano-Met. Chem. 2021, 52, 161–172. [Google Scholar] [CrossRef]
- Sun, S.; Jin, X.; Cong, B.; Zhou, X.; Hong, W.; Chen, G. Construction of Porous Nanoscale NiO/NiCo2O4 Heterostructure for Highly Enhanced Electrocatalytic Oxygen Evolution Activity. J. Catal. 2019, 379, 1–9. [Google Scholar] [CrossRef]
- Abdellaoui, K.; Pavlovic, I.; Bouhent, M.; Benhamou, A.; Barriga, C. A comparative study of the amaranth azo dye adsorption/desorption from aqueous solutions by layered double hydroxides. Appl. Clay Sci. 2017, 143, 142–150. [Google Scholar] [CrossRef]
- Rivera, J.A.; Fetter, G.; Jiménez, Y.; Xochipa, M.M.; Bosch, P. Nickel Distribution in (Ni, Mg)/Al-Layered Double Hydroxides. Appl. Catal. A Gen. 2007, 316, 207–211. [Google Scholar] [CrossRef]
- Auxilio, A.; Andrews, P.; Junk, P.; Spiccia, L.; Neumann, D.; Vanderhoek, N. Adsorption and Intercalation of Acid Blue 9 on Mg–Al Layered Double Hydroxides of Variable Metal Composition. Polyhedron 2007, 26, 3479–3490. [Google Scholar] [CrossRef]
- Khenifi, A.; Derriche, Z.; Mousty, C.; Prévot, V.; Forano, C. Adsorption of Glyphosate and Glufosinate by Ni2AlNO3 Layered Double Hydroxide. Appl. Clay Sci. 2010, 47, 362–371. [Google Scholar] [CrossRef]
- El Hassan, E.; Lakraimi, M.; Badreddine, M.; Legrouri, A.; Cherkaoui, O.; Berraho, M. Removal of Remazol Blue 19 from Wastewater by Zinc–Aluminium–Chloride-Layered Double Hydroxides. Appl. Water Sci. 2014, 3, 431–438. [Google Scholar] [CrossRef]
- Thommes, M.; Kaneko, K.; Neimark, A.V.; Olivier, J.P.; Rodriguez-Reinoso, F.; Rouquerol, J.; Sing, K.S.W. Physisorption of Gases, with Special Reference to the Evaluation of Surface Area and Pore Size Distribution (IUPAC Technical Report). Pure Appl. Chem. 2015, 87, 1051–1069. [Google Scholar] [CrossRef]
- Lazaridis, N.K.; Karapantsios, T.D.; Georgantas, D. Kinetic Analysis for the Removal of a Reactive Dye from Aqueous Solution onto Hydrotalcite by Adsorption. Water Res. 2003, 37, 3023–3033. [Google Scholar] [CrossRef]
- Imessaoudene, A.; Sabrina, C.; Hadadi, A.; Nadia, H.; Bollinger, J.-C.; Amrane, A.; Tahraoui, H.; Manseri, A.; Mouni, L. Adsorption Performance of Zeolite for the Removal of Congo Red Dye: Factorial Design Experiments, Kinetic, and Equilibrium Studies. Separations 2023, 10, 57. [Google Scholar] [CrossRef]
- Giles, C.H.; MacEwan, T.H.; Nakhwa, S.N.; Smith, D. Studies in Adsorption Part XI: A System of Classification of Solution Adsorption Isotherms and Its Use in Diagnosis of Adsorption Mechanism and Measurement of Specific Surface Areas of Solid. J. Chem. Soc. (Resumed) 1960, 111, 3973. [Google Scholar] [CrossRef]
- Rastgordani, M.; Zolgharnein, J.; Mahadavi, V. Derivative Spectrophotometry and Multivariate Optimization for Simultaneous Removal of Titan Yellow and Bromophenol Blue Dyes Using Polyaniline@SiO2 Nanocomposite. Microchem. J. 2020, 155, 104717. [Google Scholar] [CrossRef]


| Adsorbent LDH | Adsorbate | Method of Synthesis | Molar Ratio | pH | Ref |
|---|---|---|---|---|---|
| Cu-Al-CO3 | Evans Blue | Co-precipitation | 2 | 10 | [32] |
| Ni−Co LDH | SO42−, HPO42− NO3− | flux method | - | - | [36] |
| Ni2Al-CO3 LDH (LDH) and Ni2Al-CO3 LDO (LDO) | Indigo Carmine Congo Red | Co-precipitation | 2 | 10 | [37] |
| Zn-Fe-CO3 Zn-Cr-CO3Zn-Al-CO3 | Indigo Carmine | Co-precipitation | 2 | 7 | [38] |
| Zn-Al-Fe | Phosphate P(V) and chromate Cr (VI) | Co-precipitation | 2/0.5/0.5 | 10 | [39] |
| Mg/Al HT | Navy Blue Yellow F3G | Co-precipitation | - | - | [40] |
| Mg-Al-CO3-LDH | Acid Yellow 42 | Co-precipitation | - | 10 | [34] |
| Ni/Zn/Fe-LDH | Reactive Black 5 RB5 | Co-precipitation | 0.5/1/1 | 10 | [41] |
| LDHs | d003 (Å) | a (Å) | c (Å) |
|---|---|---|---|
| NiAl-HT | 7.621 | 3.021 | 22.864 |
| NiCoAl-HT | 7.597 | 3.044 | 22.791 |
| CoAl-HT | 7.568 | 3.018 | 22.704 |
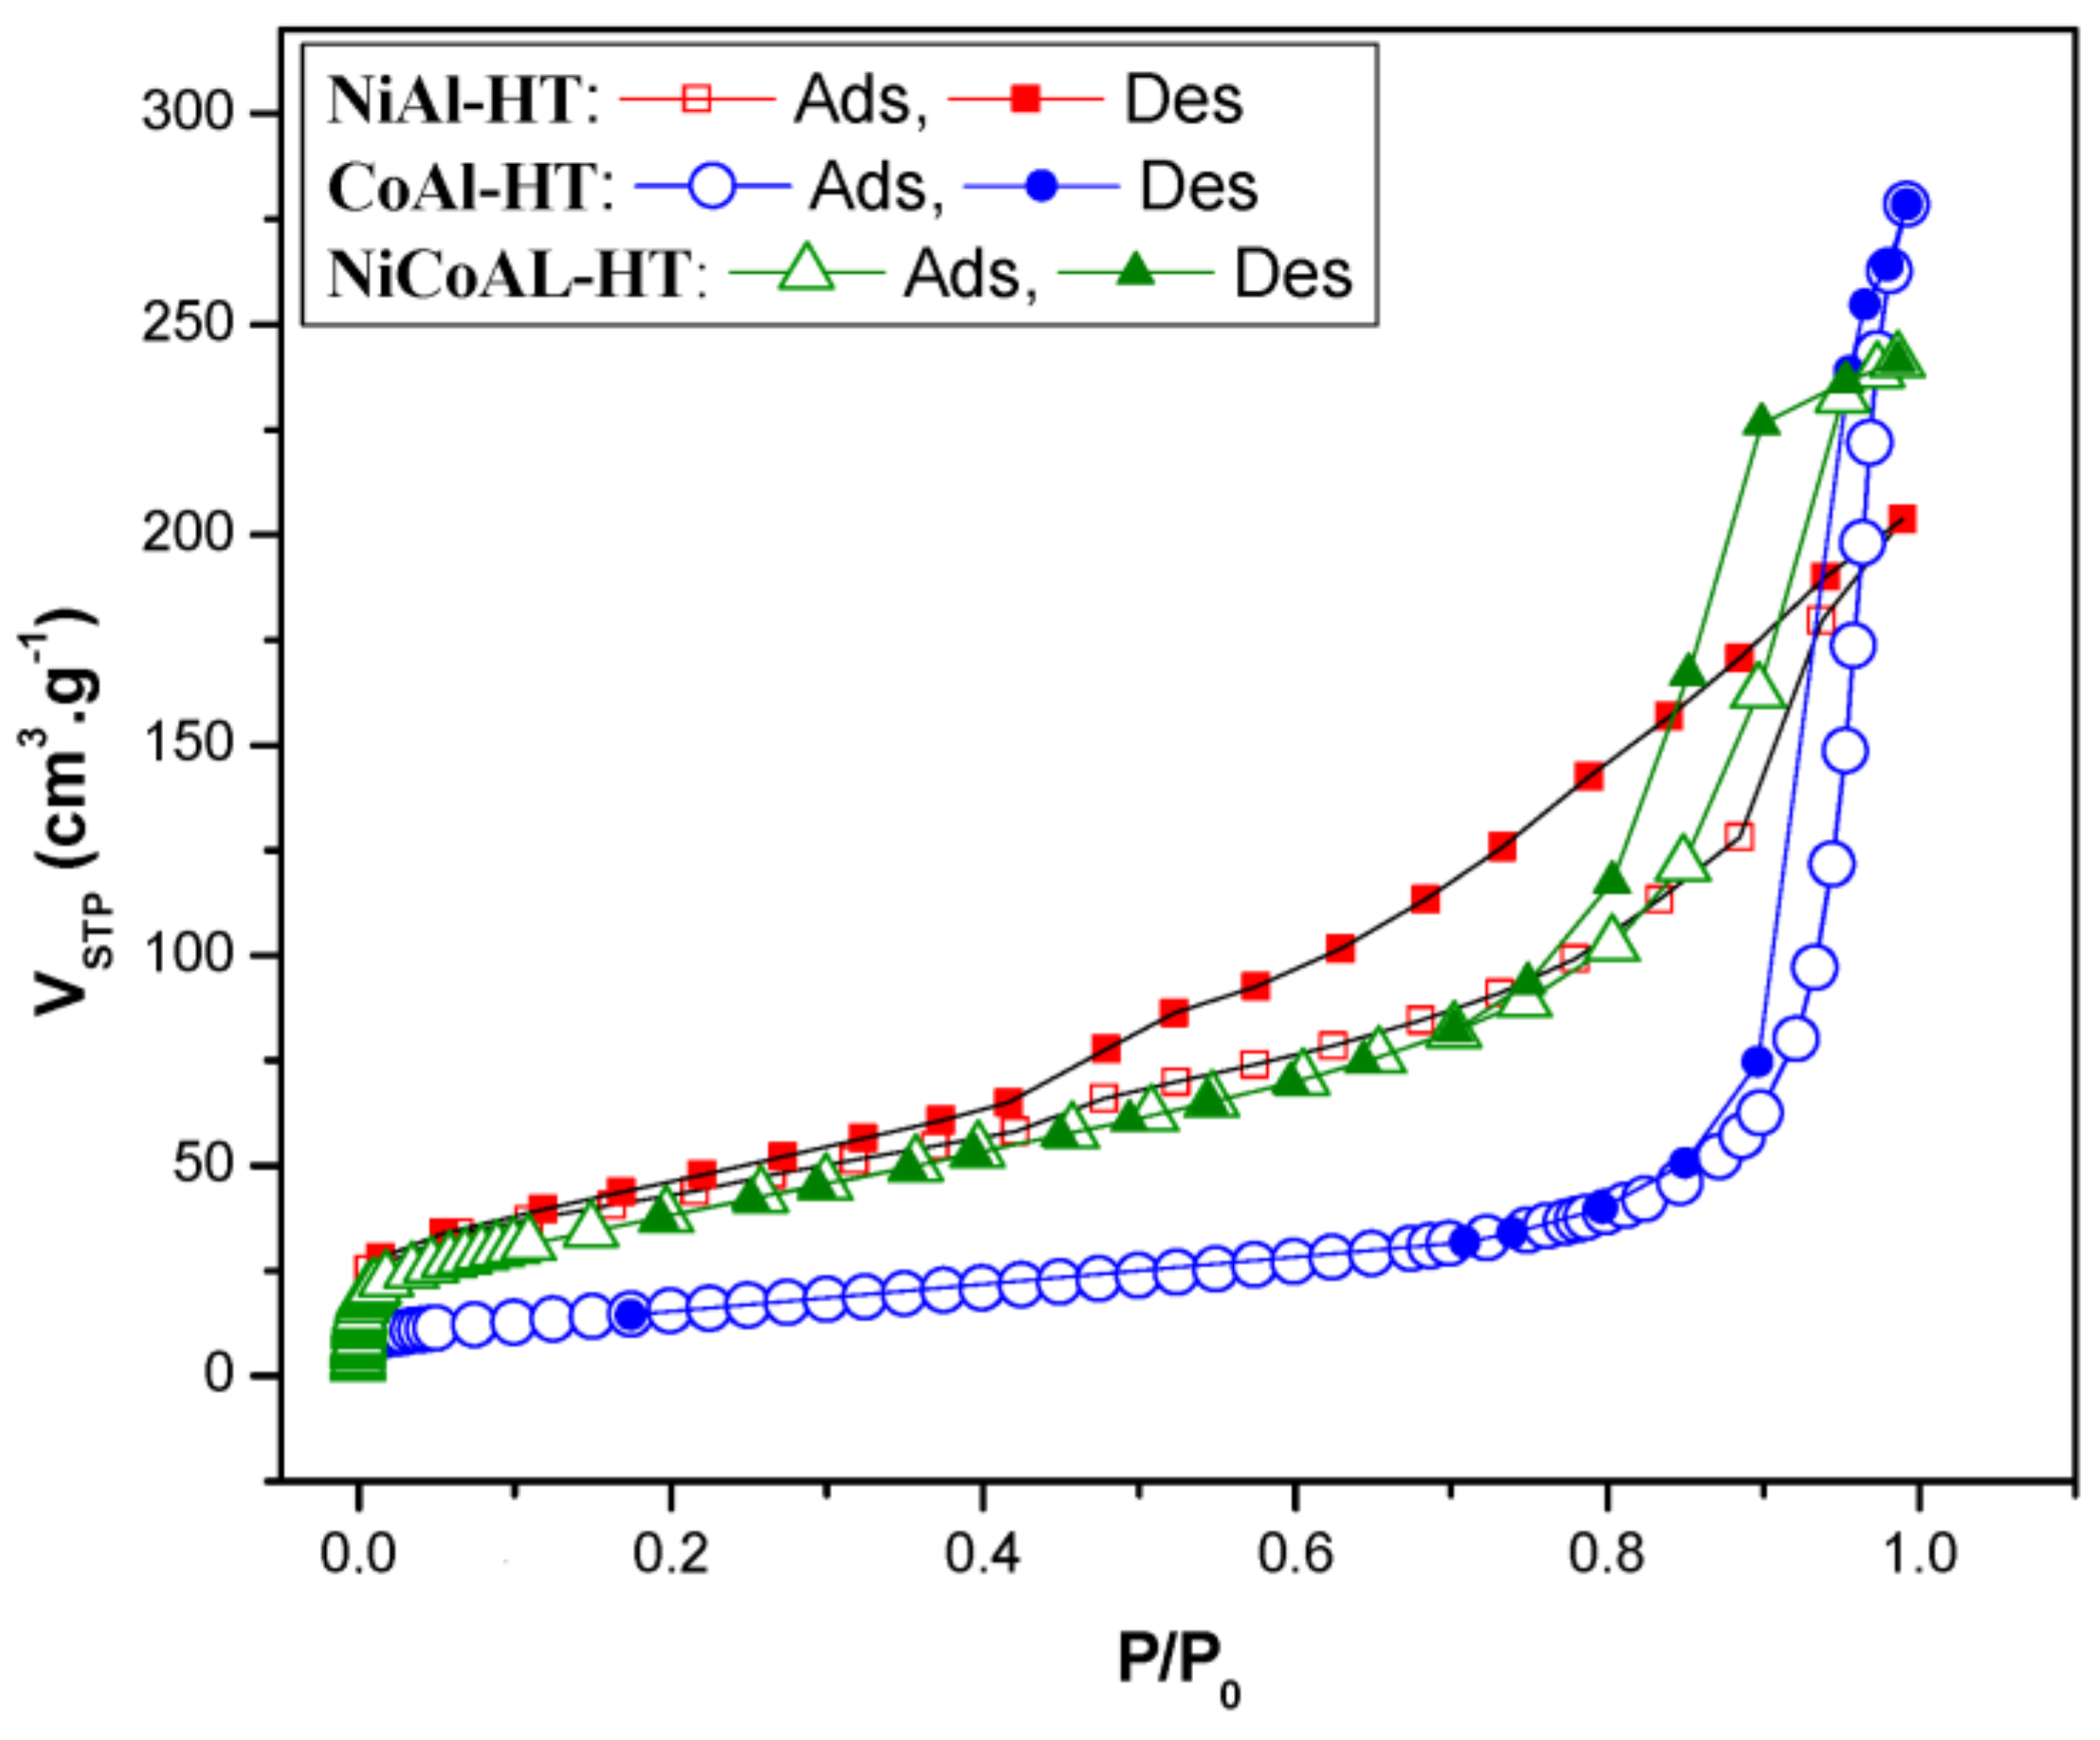
| Sample | Specific Surface Area SBET (m2∙g−1) | Pore Volume Vp (cm3∙g−1) | Average Pore Size Radius (nm) |
|---|---|---|---|
| NiAl-HT | 156.819 | 0.283 | 36.054 |
| CoAl-HT | 56.98 | 0.406 | 22.769 |
| NiCoAl-HT | 142.72 | 0.369 | 13.132 |
| Parameters | NiAl-HT | CoAL-HT | NiCoAl-HT |
|---|---|---|---|
| pseudo-first-order model | |||
| Qe,exp (mg∙g−1) | 29.299 | 20.814 | 24.303 |
| K1 (min−1) | 0.335 ± 0.030 | 0.402 ± 0.059 | 0.036 ± 0.007 |
| Qe,cal (mg∙g−1) | 29.299 ± 0.227 | 19.825 ± 0.206 | 24.343 ± 1.717 |
| R2 | 0.985 | 0.974 | 0.715 |
| RMSE | 0.852 | 0.783 | 3.245 |
| MSE | 0.726 | 0.613 | 10.528 |
| pseudo-second-order model | |||
| Qe,exp (mg∙g−1) | 29.299 | 20.814 | 24.303 |
| K2 (g∙mg−1∙min−1) | 0.0369 ± 0.003 | 0.0448 ± 0.007 | 0.0043 ± 0.0006 |
| Qe,cal (mg∙g−1) | 29.607 ± 0.103 | 20.461 ± 0.157 | 25.115 ± 0.644 |
| R2 | 0.998 | 0.992 | 0.965 |
| RMSE | 0.292 | 0.437 | 1.132 |
| MSE | 0.085 | 0.191 | 1.281 |
| Intraparticle diffusion model | |||
| Kint (mg∙g−1∙min−1) | 1.149 ± 0.421 | 0.864 ± 0.277 | 1.534 ± 0.204 |
| C (mg∙g−1) | 19.372 ± 3.112 | 12.810 ± 2.051 | 8.306 ± 1.508 |
| R2 | 0.287 | 0.353 | 0.776 |
| RMSE | 5.929 | 3.907 | 2.873 |
| MSE | 35.159 | 15.266 | 8.257 |
| Parameters | NiAl-HT | CoAL-HT | NiCoAl-HT |
|---|---|---|---|
| Langmuir | |||
| Qmax(mg∙g−1) | 234.245 ± 29.722 | 55.369 ± 2.542 | 152.511 ± 17.595 |
| KL | 0.009 ± 0.002 | 0.028 ± 0.005 | 0.027 ± 0.008 |
| RL | 0.217 | 0.082 | 0.084 |
| R2 | 0.954 | 0.954 | 0.867 |
| RMSE | 11.171 | 2.618 | 15.099 |
| MSE | 124.781 | 6.856 | 227.993 |
| Freundlich | |||
| KF | 7.893 ± 3.537 | 9.319 ± 2.334 | 18.307 ± 7.474 |
| n | 1.784 ± 0.296 | 3.270 ± 0.539 | 2.72 ± 0.651 |
| R2 | 0.881 | 0.884 | 0.738 |
| RMSE | 18.045 | 4157 | 21.214 |
| MSE | 325.627 | 17.283 | 450.053 |
| Parameters | T (K) | ΔG° (KJ∙mol−1) | ΔH° (KJ∙mol−1) | ΔS° (KJ∙mol−1∙K−1) |
|---|---|---|---|---|
| NiAl-HT | 298 | −5.532 | 94.637 | 0.34 |
| 308 | −8.893 | |||
| 318 | −12.255 | |||
| 328 | −15.616 | |||
| CoAl-HT | 298 | −7.518 | 67.509 | 0.25 |
| 308 | −10.036 | |||
| 318 | −12.553 | |||
| 328 | −15.071 | |||
| NiCoAl-HT | 298 | −7.079 | 55.367 | 0.21 |
| 308 | −9.175 | |||
| 318 | −11.271 | |||
| 328 | −13.366 |
Disclaimer/Publisher’s Note: The statements, opinions and data contained in all publications are solely those of the individual author(s) and contributor(s) and not of MDPI and/or the editor(s). MDPI and/or the editor(s) disclaim responsibility for any injury to people or property resulting from any ideas, methods, instructions or products referred to in the content. |
© 2023 by the authors. Licensee MDPI, Basel, Switzerland. This article is an open access article distributed under the terms and conditions of the Creative Commons Attribution (CC BY) license (https://creativecommons.org/licenses/by/4.0/).
Share and Cite
Chouikh, S.; Cheikh, S.; Imessaoudene, A.; Mouni, L.; Amrane, A.; Benahmed, A.; Bettahar, N. Synthesis and Characterization of the Carbonate Hydrotalcites (NiAl-HT, CoAl-HT, and NiCoAl-HT), and Its Application for Removal of the Anionic Azo Dye Titan Yellow from Aqueous Solution. Sustainability 2023, 15, 7948. https://doi.org/10.3390/su15107948
Chouikh S, Cheikh S, Imessaoudene A, Mouni L, Amrane A, Benahmed A, Bettahar N. Synthesis and Characterization of the Carbonate Hydrotalcites (NiAl-HT, CoAl-HT, and NiCoAl-HT), and Its Application for Removal of the Anionic Azo Dye Titan Yellow from Aqueous Solution. Sustainability. 2023; 15(10):7948. https://doi.org/10.3390/su15107948
Chicago/Turabian StyleChouikh, Samira, Sabrina Cheikh, Ali Imessaoudene, Lotfi Mouni, Abdeltif Amrane, Amine Benahmed, and Noureddine Bettahar. 2023. "Synthesis and Characterization of the Carbonate Hydrotalcites (NiAl-HT, CoAl-HT, and NiCoAl-HT), and Its Application for Removal of the Anionic Azo Dye Titan Yellow from Aqueous Solution" Sustainability 15, no. 10: 7948. https://doi.org/10.3390/su15107948