Article

Does Coal Consumption Control Policy Synergistically Control Emissions and Energy Intensity?

1
School of International Trade and Economics, University of International Business and Economics, Beijing 100029, China
2
School of Environment, Tsinghua University, Beijing 100084, China
3
China Petroleum Planning and Engineering Institute, CPPEI, Beijing 100089, China
*
Author to whom correspondence should be addressed.
Sustainability 2023, 15(10), 7748; https://doi.org/10.3390/su15107748
Submission received: 12 April 2023 / Revised: 6 May 2023 / Accepted: 7 May 2023 / Published: 9 May 2023

Abstract

:
The coal consumption constraint policy (CCCP) serves a crucial role in the maintenance of environmental and economic sustainability for China. However, it is debatable whether the CCCP reduces emissions and energy intensity. The present study explores the impact and realization pathways of the CCCP on energy and emissions intensity at the city level from 2005 to 2019 using a time-varying difference-in-differences (DID) and structural equation model (SEM) approach. We find that the CCCP can control emissions and energy intensity synergistically. Particularly, the CCCP has significantly reduced SO2 and CO2 emission intensity and energy intensity by 0.1283%, 0.0747%, and 0.2493%, respectively. Moreover, the CCCP can effectively reduce emissions intensity through industrial restructuring, and technology advancement is the only effective way to reduce energy intensity. The study provides some valuable suggestions to enable the control of coal consumption.

1. Introduction

As the largest producer and consumer of coal in the world, China’s rapid economic growth has been supported by its coal-based energy structure [1,2]. Since 2011, China has consumed more coal than the rest of the world combined [3]. Coal has facilitated China’s economic prosperity, but it also offers enormous obstacles to the country’s long-term development, such as air pollution and climate change [4,5]. In response to environmental challenges, China has made controlling coal consumption a top priority and has put in place a number of policies over the past few years. In 2011, China introduced the “Energy Conservation and Emission Reduction Work Plan”, which proposes to put into practice the coal consumption constraint policy (CCCP) in the pilot city. In 2016, China launched an additional CCCP, “Notice on Coal Consumption Reduction and Substitution”, expanding the range of CCCP pilot cities in 2011. As a succession of coal consumption constraint policies has been carried out for over a decade, there is an immediate need to quantify the policies’ effects. However, studies on the effect of the CCCP have primarily examined the effect of various policies from the single perspective of pollution, carbon, and coal consumption reduction, without an in-depth interpretation of the co-control effect of the CCCP and its implementation efficiency, and ignoring the systematic nature and continuity of the CCCP. In addition, the path to policy reform and optimization remains obscure.
As a typical command-and-control policy, the impact of the CCCP has fueled debates. It is widely accepted that coal control strategies are essential for improving air quality [5]. However, how the CCCP affects CO2 emissions, economics, and energy intensity is still debatable. Some scholars predicted that the CCCP would inevitably reduce social welfare and economic development, but could help control pollution emissions, such as SO2, NOx, PM2.5, and CO2 [6,7]. Some researchers, on the other hand, believe that the CCCP, a non-market-driven policy, is technically infeasible and that it not only allows for a significant increase in economic costs, but also leads to an increase in pollution emissions [2,8]. As for the effect of the CCCP on energy intensity, Shi and Li found that coal-to-gas policies have a negative but insignificant effect on energy intensity in the Jing-Jin-Ji region [9]. Guo et al. also support this opinion; they found that the CCCP fails to reduce the energy intensity based on 289 cities in China [2]. Conversely, Ji et al. noted that the CCCP has significantly promoted the share of electricity consumption [10], which would decrease China’s energy intensity [11]. Scholars have realized that the city is often regarded as the most appropriate level for evaluating the effect of the CCCP under China’s administrative structure [2,8]. However, most relevant studies focusing on cities only cover a few large cities due to the scarcity of city-level data that cannot be generalized to most Chinese cities [12,13]. To the best of our knowledge, Guo et al. is the only study that evaluated the effect of the CCCP based on data from 289 cities [2]. However, the total energy consumption data on the city level that they used was estimated based on provincial data, which was not accurate, and they did not give a specific estimation method. In addition, they only focused on the effects of the CCCP introduced in 2011 and ignored the effects of the CCCP that continued to be launched in 2016, resulting in incomprehensible results.
In terms of the achieved path of the CCCP impact, extensive research has shown that, because of the substitution effect from coal to natural gas and electricity [14], the CCCP can optimize energy structure and then reduce SO2, NOx, and CO2 emissions [12,15]. However, Guo et al. argued that the CCCP, as command-and-control environmental regulations, mainly reduced CO2 emissions by improving technology levels [2]. To the best of our knowledge, there is no study that comprehensively investigates the specific mechanism of the CCCP effect.
In this study, we provide an evaluation of the impact of CCCP on CO2 emissions intensity, air pollution emissions intensity, and energy intensity based on realistic data from policy-consecutive perspectives. Furthermore, we also employ the structural equation model (SEM) model to track the specific realization path of CCCP affecting CO2 emissions, air pollution, and energy intensity.
The main contributions of this paper are as follows.
(1)
The CCCP policy announced in 2016 is a continuation and addition to the policy introduced in 2011; evaluating those two policies separately is inappropriate. However, existing studies focus only on a specific policy in a limited number of big cities. As far as policy relevance and integrity are concerned, this study uses time-varying difference-in-differences (DID) to examine the synergistic effects of those two consecutive CCCP in 73 cities across the country. Comprehensive analysis reveals a broader and more accurate picture of the effects of the CCCP.
(2)
Unlike previous studies that mainly explored the environmental and economic impacts of the CCCP separately, this study estimates the impacts of CCCP from the intensity perspective, including greenhouse gas (GHG) intensity, pollution emission intensity, and energy intensity, which helps us to effectively embody the efficiency of the policy implementation.
(3)
For the very first time, an SEM model is introduced to more precisely identify the mechanisms of the CCCP affecting GHG intensity, pollution emission intensity, and energy intensity. This can help policymakers further formulate effective policy instruments of the CCCP to balance reducing coal consumption with other desirable environmental effects.

2. Literature Review

2.1. The Effects of CCCP

There are a large number of published studies describing the effects of coal consumption constraint policies. From an economic perspective, the consequences of the CCCP are unfavorable. Li and Yao demonstrated that the CCCP contributed to energy conservation and carbon emission reduction, but with a loss of economic efficiency [16]. Furthermore, full compliance with the CCCP would lead to a significant gap between supply and demand, resulting in a substantial increase in coal prices and economic costs [8]. Different policy tools of the CCCP have very different effects on the macroeconomic system. However, no matter which policy tool is used, the CCCP will always decrease social welfare [6]. The CCCP was enacted primarily to improve air quality [17]; consequently, whether or not it has improved air quality remains an intriguing and significant scholarly question. Zhang et al. use Shandong province as a case study to analyze the strategy on China’s CCCP; they conclude that the PM2.5 concentration will decrease in 2020 based on the province’s planned scenario [17]. Chen and Chen focused on “2 + 26 cities” and predicted the environmental effect of the CCCP in the building sector. The results showed that the policy could cause an increase in natural gas and electricity consumption, which could help reduce SO2 and NOx emissions, and it is helpful for some underdeveloped areas to achieve the goal of low carbon faster [18]. Ji et al. used Jiangsu province as a case study to evaluate the impact of CCCP. They found that a stricter target for the CCCP would promote energy structure adjustment, curb pollution, and protect traditional energy resources [10].
Compared with the analysis of the CCCP effect from an aggregate perspective, emission intensity and energy intensity have more research value because they are binding indicators for local government evaluation in China. However, there is a relatively small body of literature that evaluates the CCCP from an intensity perspective. Zhang et al. revealed that, with the planned scenario of Shandong, the province’s energy consumption intensity and CO2 emission intensity will reduce, even more than the goals set by the central government for Shandong [17]. Conversely, some empirical studies do not support this opinion. Shi and Li have taken the Jing-Jin-Ji region as their study subject and point out that coal-to-power and coal-to-gas policies have an insignificant negative effect on energy intensity [9]. Guo et al. expanded the study’s scope to 289 cities across the country [2]. They found that the CCCP had unexpectedly increased China’s energy intensity. Only with the help of supportive policies could the CCCP have a negative effect on energy intensity.

2.2. Determinants of GHG Emission Intensity, Pollutant Emission Intensity, and Energy Intensity

This paper examines the impact of the CCCP in terms of three aspects, namely GHG intensity, pollutant emission intensity, and energy intensity. However, there are many other factors that influence these three indices as well.
Air pollutant emissions are relevant to economic development, industrial structure, technological innovation [19], population [20], foreign direct investment [21], and energy structure [22]. GHG emissions are related to economic growth [23], foreign direct investment [24], energy structure [25], industrial structure [26], population [27], and technological innovation [28].
A constant decline in energy intensity shows that a country’s economic activities are moving toward a more ecological and sustainable mode [29]. A number of studies have examined the determinations of energy intensity and accepted that technological progress and Gross Domestic Product (GDP) per capita are the most crucial factors in improving energy intensity [30,31,32]. With the progress of economic globalization, research has shown that technology spillovers from foreign direct investment also affect energy intensity [33]. Wu and Ding and Chen and Lee found that secondary industries consume more energy than other industries, and as industrialization continues, energy intensity also increases [28,34]. Moreover, the impact of population on energy intensity is ambiguous: as an energy consumer, a large population would increase total energy consumption, but as a labor force, it would significantly increase GDP [35].

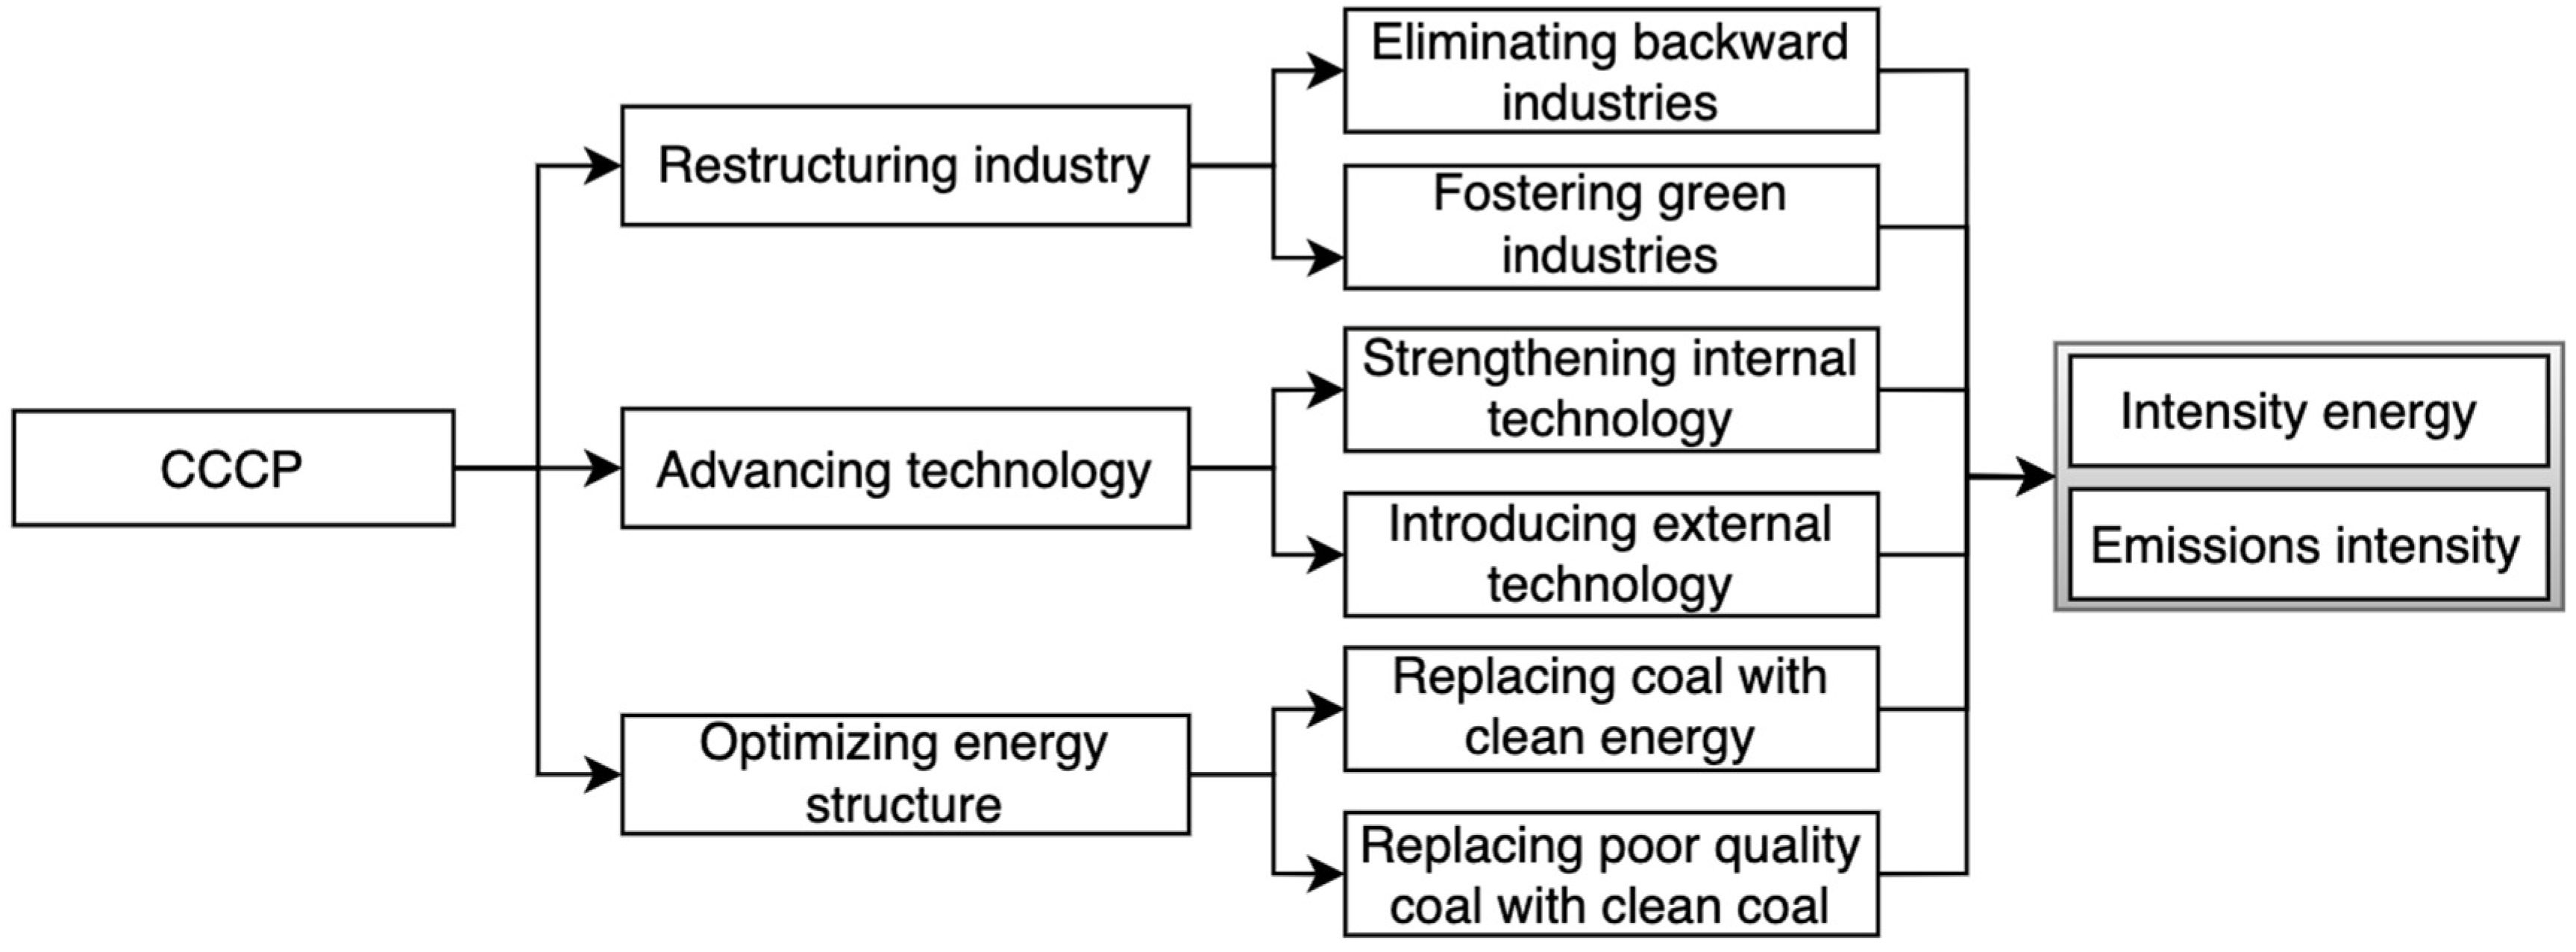
3. The Mechanism of CCCP Affecting Emissions and Energy Intensity

China’s emissions are primarily caused by the production process energy consumption. According to the CCCP issued by the government, three measures are implemented by the government to reduce coal consumption (as shown in Figure 1).
Restructuring industry. Under the constraints of the CCCP, the government prioritizes the elimination of backward industries with high energy consumption and pollution, contributing more capital and labor to fostering green industries with low energy consumption and emission levels. With the assistance of industrial restructuring, energy consumption, emissions, and energy intensity will undoubtedly decrease.
Advancing Technology. To attain stable and low energy consumption and sustainable development, the government will, on the one hand, increase research funds to strengthen internal technology; on the other hand, they will upgrade technology by introducing external resources, such as the importation of advanced energy-saving and environmental protection technologies, achieving qualitative changes in energy use efficiency, and decreasing emission intensity.
Optimizing energy structure. First, encouraging industries to use clean energy sources, such as electricity and natural gas, to compensate for the decrease in coal consumption. Due to the energy substitution effect, changing the energy structure from coal-based to diverse energy sources will have an effect on energy and emission intensity. In addition, the government’s clean coal subsidy policy encourages industries to begin coal-based operations. For instance, substituting clean and high-quality coal for low-quality coal in the production process can have a substantial impact on total energy intensity and emission intensity as well.
In conclusion, under the constraints of the CCCP, the government will implement three primary strategies to reduce the intensity of emissions and energy consumption: industrial restructuring, technological advancement, and energy structure optimization.

4. Methodology

4.1. Empirical Strategy

The DID method was first introduced to the field of economics by Ashenfelter [36], and it has since evolved. In recent years, academics have begun to evaluate policy effects using this method [2,9,37]. The CCCP, introduced in 2011 and its pilot range expanded in 2016, is expected to reduce emissions and energy intensity. Such a progressively piloted policy can be regarded as a natural experiment, allowing us to employ a time-varying DID method to assess the effect of the policy. The DID can effectively control the air quality trends shared by both treatment and control groups, thereby assisting in the resolution of the endogeneity issue. Specifically, in this study, the differences in emissions and energy intensity between cities following the implementation of the CCCP policy are derived from three sources: time effects, attribute differences, and policy effects. The time effect is the change in emissions and energy intensity over time, even in cities without CCCP. The attribute effect is the change in emissions and energy intensity owing to different city characteristics. The DID method identifies the net effect of policy treatment by measuring policy shocks through differences in both group and time dimensions.
Following Beck et al. [38], we set pilot cities as the treatment group and others as the control group to evaluate the impact of the CCCP implementation at the city level. The baseline regressions model was set up as follows:
lngso2it = β0 + β1Dit + θ1lnpgdpit + θ2industryit + θ3lnpopit + θ4lntecit+ θ5lnfdiit + θ6coal_cit + μi + γt + εit
lngco2it = β′0 + β′1Dit + θ′1lnpgdpit + θ′2industryit + θ′3lnpopit + θ′4lntecit + θ′5lnfdiit + θ′6coal_cit + μ′i + γ′t + ε′it
toconsum_git = β″0 + β″1Dit + θ″1lnpgdpit + θ″2industryit + θ″3lnpopit + θ″4lntecit+ θ″5lnfdiit + θ″6coal_cit + μ″i + γ″t + ε″it
where Dit = treatedi × periodt, treatment city: treatedi = 1, control city: treatedi = 0; periodt = 1 after a city has implemented CCCP; otherwise, periodt = 0. i and t denote cities and years, respectively. To control potential heteroskedasticity, some variables were generated in natural logarithmic form. lngso2 is a logarithmic form of SO2 emission intensity; lngco2 represents a logarithmic form of CO2 emission intensity; toconsum_g denotes energy intensity that depends on lnpgdp (logarithmic form of GDP per capita), industry (secondary industry output value), lnfdi (logarithmic form of foreign direct investment), coal_c (coal consumption in total energy consumption), lnpop (logarithmic form of population), and lntec (logarithmic form of technological progress). The variable of interest is Dit, D′it, D″it, three dummy variables that take the value of 1 in the years after city i implemented CCCP and 0 otherwise. The coefficients β1, β′1, β″1 are the parameters to be estimated, representing the net effect of CCCP. A positive and significant one indicates that the CCCP has a positive effect on the intensity of SO2 emissions, CO2 emissions, and energy; otherwise, it has a negative effect. μi, μ′i, μ″i and γt, γ′t, γ″t are vectors of city and year dummy variables that account for city and year fixed effects. εit, ε′it, ε″it are the random disturbance terms.
To further understand the specific implementation path of the policy, we also employ the path analysis to explore the mechanisms by which the CCCP affects CO2 emissions intensity, SO2 emissions intensity, and energy intensity. Mediation is a typical function of path analysis, which implies that a variable can influence an outcome both directly and indirectly through another variable [39]. Conversely, the traditional multiple mediation model, a regression analysis based on the causality test proposed by Baron and Kenny [40], is less efficient in estimating mediation effects [41]. The Sobel test used in regression analysis assumes that a*b obeys a normal distribution, whereas mediation effects often do not meet the requirement, resulting in test results being relatively unreliable [42,43]. The SEM, which was developed as path analysis [44], is a powerful multivariate technique used increasingly in academic studies to test and assess multivariate causal relationships; it can address the limitations of the aforementioned methods. It is the best framework for mediated effects analysis because it can estimate all model parameters simultaneously [45]. Therefore, we explore the specific pathways through which CCCP works by building SEM models.

4.2. Data

This study examines the impact of CCCP on CO2 emissions intensity, air pollution intensity, and energy intensity by covering 73 cities in China over the period from 2005 to 2019. Table A1 reported the list of cities in the Appendix A. The data are from China National Knowledge Infrastructure (CNKI, http://data.cnki.net (accessed on 31 July 2022)). Cities with missing data for consecutive years were removed and the number of cities was finally set to 73. The variables description and descriptive statistics of the variables are shown in Table 1.

4.2.1. Explained Variables

The three explained variables in this paper are SO2 emission intensity, CO2 emission intensity, and energy intensity.
(1)
SO2 emission intensity (gso2): we take the SO2 emission per unit of GDP to measure this variable.
(2)
CO2 emission intensity (gso2): we use the CO2 emission per unit of GDP to suggest this variable. The measurement of CO2 emissions is shown in Appendix B.
(3)
Energy intensity (toconsum_g): consistent with existing studies, we use energy consumption per unit of GDP. As for energy consumption, firstly, we collected original data on 24 energy types (raw coal, finely washed coal, other washed coal, briquette, other coal products (pulverized coal, coal water slurry), coke, crude oil, fuel oil, gasoline, diesel oil, general kerosene, refinery thousand gas, liquefied natural gas, liquefied petroleum gas, naphtha, other petroleum products, natural gas, blast furnace gas, converter gas, coke oven gas, other gas, heat, electricity) from the urban statistical yearbooks. Then, all 24 types of energy data are converted to standard coal and added together, which is total energy consumption. Additionally, coal consumption is calculated using the 12 coal energies (raw coal, washed coal, other washed coal, coal products, coke, other coking products, coke oven gas, blast furnace gas, converter gas, producer gas, other coal gas) of the industry, which is uniformly converted to standard coal and summed up.

4.2.2. Explanatory Variable: Policy Variable

The policy variable was CCCP, measured by setting time and between-group dummy variables. The implementation of the CCCP was progress into two phases, namely “Energy Conservation and Emission Reduction Work Plan” in 2011 and “Notice on Coal Consumption Reduction and Substitution” in 2016. The policy variable was denoted by Dit in our time-varying DID model, as shown above.

4.2.3. Control Variables

The following control variables have been selected for this paper based on previous research: industrial structure (industry), GDP per capita (pgdp), population (pop), foreign direct investment (fdi), energy structure (coal_c), and technological progress (tec).

4.2.4. Mediator Variables

According to the mechanism we analyzed above, adjusting industrial structure, promoting technological progress, and optimizing energy structure are three essential measures for industries to reduce coal energy consumption, solve pollution problems and achieve balanced ecological development. Therefore, we select industrial structure (industry), energy structure (coal_c), and technological progress (tec) as mediating variables to further test specific implementation path of the policy.

5. Results and Discussion

5.1. Effects of the CCCP

In this study, we control the city-fixed effects and time-fixed effects and use a time-varying DID model to evaluate the effects of the CCCP. The results are shown in Table 2. We find that the CCCP can reduce the intensity of CO2 and SO2 emissions, as well as energy intensity significantly.
The CCCP has a negative effect on emissions, which can help China to maintain the sustainability of the environment. These results are in line with those of previous studies [5,12,14,15]. In detail, the CCCP has decreased SO2 intensity by 0.1283% and CO2 emission intensity by 0.0747%, indicating that the CCCP, which was designed to reduce air pollution, can synergistically control CO2 emissions. There are two possible explanations for the synergistic control effect. First, fossil fuel combustion is a significant cause of air pollution and an important anthropogenic source of GHG. Therefore, limiting coal consumption, which is the primary energy source in China, can simultaneously reduce CO2 and air pollutant emissions, leading to co-control effects for the climate and the air quality. Second, research shows that the two different types of environmental problems—air pollution and GHG—are mostly caused by the same patterns of energy production and consumption. This means that the same steps can be taken to reduce both types of pollution.
The effect of the policy on energy intensity is negative and significant, indicating that the implementation of the CCCP significantly reduces energy intensity by 0.249%. These results differ from Guo’s [2] estimate of energy intensity, but they are broadly consistent with earlier [10] findings. This disparity could be attributed to the fact that Guo et al. [2] only assessed the impact of the first phase of the CCCP in 2011. However, China also introduced the second phase of policy in 2016, which increased the force of implementation and expanded the range of policy cities. Regarding the CCCP as a whole series policy, our study supplements Guo’s research, whose evaluation was insufficient. Moreover, we can also see that technological progress and economic development are the most critical factors in reducing energy intensity, which is consistent with Guo et al. [46].

5.2. Robustness Test

The time-varying DID method is based on a series of assumptions. Our model still needs a variety of tests to ensure the robustness of the results.

5.2.1. Parallel Trend Hypothesis Test: Event Study

Before building the DID, it is necessary to determine whether the parallel trend hypothesis is supported. In this research, an event study is used to test the parallel trend hypothesis and analyse the policy’s dynamic impact. The following equations are established:
lngso2it = Σ5τ=1β−τDi,t−τ + βDit + Σ8τ=1βDi,t+τ + λXit + μi + γt + εit
lngco2it = Σ5τ=1β′−τDi,t−τ + β′Dit + Σ8τ=1β′Di,t+τ + λ′Xit + μ′i + γ′t + ε′it
toconsum_git = Σ5τ=1β″−τDi,t−τ + β″Dit + Σ8τ=1β″Di,t+τ + λ″Xit + μ″i + γ″t + ε″it
The CCCP has been implemented since 2011; therefore, we take 2011 as the base year. β τ denotes the impact in period τ before the policy treatment, and β denotes the impact in period τ after the treatment. Xit is the control variable, including pgdp, industry, pop, tec, fdi, and coal_c; β denotes the impact of the current treatment period, so D i t takes the value of 1 when the year is the treatment period, otherwise it takes the value of 0. If β−τ, β′−τ, β″−τ are not significant, the parallel trend hypothesis is valid; μi, μ′i, μ″i and γt, γ′t, γ″t are vectors of city and year dummy variables that account for city and year fixed effects. ε i t , ε i t , ε i t are the random disturbance terms.
The test results are shown in Figure 2, and we can illustrate two key points: Firstly, the coefficients of the dummy variables D i t for the 4 years prior to the CCCP are not significantly different from 0, with SO2 emission intensity, CO2 emission intensity, and energy intensity showing no trends prior to the policy, suggesting that the parallel trend assumption is satisfied. Secondly, the values of β, β′, β″ are significantly less than 0 after the implementation of the CCCP and show decreasing trends, implying that the CCCP has a negative effect on SO2 emission intensity, CO2 emission intensity, and energy intensity. It is notable that in the regression results for energy intensity (as shown in Figure 2a–c), β″ starts to show a significant downward trend in the third year after the implementation of the CCCP, suggesting that the impact of the CCCP on energy intensity is lagged. This is likely because most of the change in energy intensity is caused by technological progress and economic growth, which do not happen overnight but take time and political power to build up.

5.2.2. Placebo Test

(1)
Re-grouping analysis
Even though control variables and city fixed effects have been added to the baseline regressions to account for the effect of non-time-varying city characteristics on the quality of city development, there may still be some unobserved variables that affect our results. Therefore, we randomly select several virtual experimental groups in the sample and regress them consistent with our basic regression to provide robustness assurance for the original findings. Specifically, we conducted 1000 samplings among 73 cities. For each sampling, 40 cities were chosen randomly as a “pseudo-experimental group,” and one year was chosen randomly as the policy time for each pseudo-experimental group, and then it would generate an incorrect estimate of β. The process is then repeated 1000 times, and the distribution of the 1000 incorrect β is plotted, as shown in Figure 3. It can be seen that the estimated coefficients of the virtual dummy policies (incorrect β) are mostly around 0, and the p-values of most of the estimates are greater than 0.1 (not significant at the 10% level). Moreover, the true coefficients of the policies (vertical dashed lines other than 0) are all significant outliers. This represents that the virtual CCCP pilot cities had no significant effect in these 1000 samples, and our estimates are unlikely to have been obtained by chance. Therefore, our results obtained above are reliable.
(2)
Counterfactual Analysis
The basic idea of the counterfactual test is to observe the effect of a policy by artificially setting the timing of the policy and then observing the effect of the policy. Following some previous studies [47,48], we retest the robustness of the results by varying the timing of the CCCP pilot. We assume that the CCCP was implemented two (three) years ahead of the actual schedule. In other words, we assumed that the first phase of the CCCP proposal was implemented in 2008/2009; and that the second phase of the CCCP, which means pilot cities, was expanded in 2013/2014. D_2/D_3 is constructed as the virtual policy effects. If the CCCP implemented at the virtual time still has a significant effect on SO2 emission intensity, CO2 emission intensity, and energy intensity, then we can conclude that the previously obtained results are not robust. Otherwise, the previously derived results are robust.
From Table 3, it can be seen that the coefficients of the effects of virtual policy (D_2/D_3) are insignificant. This indicates that the effect of the artificial CCCP on SO2 emission intensity, CO2 emission intensity, and energy intensity is insignificant, supporting the randomization of policy implementation hypothesis. Therefore, the previously obtained results are robust and reliable.

5.3. Mechanism Test of CCCP

In this study, the SEM model is employed to further explore the specific realization path of CCCP implementation to reduce CO2 and SO2 emission intensity and energy intensity, and to shed light on the effective initiatives China should focus on in the future. Due to the nonlinear distributional properties of the mediation effects, a nonparametric bootstrapping method is used in this paper to adjust the estimation bias [41].
Table 4 shows the results of the intermediary effects of CO2 emission intensity. The confidence interval (BC and P interval 95%) of the direct effect contains 0, indicating that the effect of CCCP on CO2 intensity is a fully mediated effect. As shown in Table 4, the coefficient of the mediated effect of industrial structure is −2.629%, and the confidence interval does not contain 0, denoting that industrial restructuring is an important mechanism for CCCP to reduce CO2 intensity. In contrast, the confidence intervals of technological progress and energy structure both contain 0, representing that CCCP does not effectively reduce CO2 intensity by technological progress and energy structure optimization.
Similarly, Table 5 shows the results of the intermediary effects of SO2 emission intensity, which is partially mediated. Furthermore, the CCCP can reduce SO2 emission intensity by industry structure adjustment, whereas it does not effectively reduce SO2 emission intensity by industrial structure adjustment and energy structure optimization. Table 6 shows the estimation results of the indirect effects of energy intensity are presented, which is a fully mediated effect. We can see that the CCCP was able to effectively reduce energy intensity through increased technological progress in industrial production, caused by the innovation compensation effect promoted by the command-and-control policy of the government. At the same time, it cannot be effective in reducing energy intensity through industry structure adjustment and energy structure optimization.
Our finding shows that restructuring industry is the only effective way for CCCP to reduce CO2 and SO2 emissions intensity. On the one hand, CCCP is a command-and-control policy, which means the government can use non-market tools to achieve the goal of coal reduction. Closing the backward factory is an important and representative action for China. China has set a strict ratio for getting rid of backward production capacity and forced more than 1000 backward coal mines to close. As the backward industry closes, the industry restructures immediately, which means coal-induced emissions will be reduced as well.
What is surprising is that China invests large amounts of financial support to help enterprise and households replace coal with other clean energy, but the adjusted energy structure still fails to reduce emissions intensity significantly. Scholars give explanations from different perspectives. Shi et al. [8] noted that due to technological and financial barriers, the CCCP could not reduce emissions through coal replacement. Shao et al. [49] conclude that, as a command-and-control policy, encouraging the replacement of coal with other clean energy is likely to lead to a loss of resource allocation efficiency. The loss of efficiency in coal resource allocation may lead to an increase in total energy consumption, which is not significantly beneficial to emission intensity.
Advancing technology is an essential key to ultra-low emissions [50], but it fails to significantly assist the CCCP in reducing SO2 and CO2 emission intensity. The result is likely to be related to the limitations of non-market policy. Command-and-control policies have always been strict and inflexible, which frequently loses sight of industries’ varying pollution control capabilities [51,52]. On the one hand, it is difficult to motivate enterprises to continually develop new emission reduction technology. On the other hand, in order to comply with stringent regulatory requirements, certain businesses must buy pollution treatment equipment rapidly, which will swiftly increase costs and may even lead to a decline in inventive activity [53]. As a result, as a command-and-control strategy, the CCCP finds it difficult to upgrade technology in order to reduce emissions significantly. These findings are consistent with recent research, indicating that as command-and-control environmental regulation is strengthened, excessive environmental thresholds result in enterprise resistance, which increases the difficulty of pollutant treatment and dampens innovative zeal [54]. In contrast, energy intensity, which China values more, can only be decreased through technical advancement. The results reflect those of previous research, which also found that technological progress is a significant factor in energy intensity [55,56]. Mandatory initiatives, such as reforming industrial and energy structures, have not lowered energy intensity significantly.

6. Conclusions and Policy Implementations

China began limiting coal consumption in pilot cities in 2011 in an effort to promote sustainable economic development. Additionally, in 2016, China implemented the extra coal capacity cutting strategy, which added the provinces of Liaoning and Henan to the CCCP pilot zones established in 2011. Based on the continuity of such a policy, we used a time-varying DID model with special panel data from 73 Chinese cities from 2005 to 2019 to determine the co-control of these two continuing CCCP policies on SO2 emission intensity, CO2 emission intensity, and energy intensity. Then, based on the results of time-varying DID, we used the SEM model to further explore the mechanism by which the CCCP affects emissions intensity and energy intensity.
Our finding identified that the CCCP has the co-benefits of reducing emissions intensity and optimizing energy use efficiency. As expected, CCCP has a synergistic control effect in reducing emissions and energy intensity. We find that the CCCP can control emissions and energy intensity synergistically. Particularly, the CCCP has significantly reduced SO2 and CO2 emission intensity and energy intensity by 0.1283%, 0.0747%, and 0.2493%, respectively. Another important finding is that CCCP, as a command-and-control policy, is more effective at curbing emissions intensity by industrial restructuring than by progressing technology and optimizing the energy structure.
The above findings have significant policy implications. Firstly, the government should make an effort to coordinate the various issues involved, and take steps to avoid “one cut fits all” measures and reduce the cost of policy compliance for the institutions. Second, diverse and market-oriented methods should be adopted to adjust the industrial structure. Finally, greater efforts are needed to ensure sustainable innovation.
Our research has some limitations. This study uses data from the industrial sector only. The limited data may lead to an underestimation of the effect of CCCP. Although we are shifting our eye contact from a few major cities in the north to 73 cities across the country, this cannot be applied to all Chinese cities. Therefore, we should consider a broader range of cities in future research.

Author Contributions

Conceptualization, W.Z. and L.Y.; methodology, J.H.; software, J.H.; validation, W.Z., L.Y. and J.H.; formal analysis, J.H.; investigation, J.H.; resources, J.H.; data curation, J.H.; writing—original draft preparation, J.H.; writing—review and editing, W.Z.; supervision, W.Z.; project administration, W.Z. All authors have read and agreed to the published version of the manuscript.

Funding

This research received no external funding.

Institutional Review Board Statement

Not applicable.

Informed Consent Statement

Not applicable.

Data Availability Statement

Data used in this paper are open data that can be found at CNKI, http://data.cnki.net (accessed on 31 July 2022).

Conflicts of Interest

The authors declare no conflict of interest.

Appendix A

Table A1. The list of 73 cities.
CCCP Pilot Cities in 2011New Added Pilot Cities in 2016Cities without CCCP
Tianjin, Beijing, Tangshan, Shijiazhuang, Handan, Jinan, Jining, Weifang, Qingdao, Zhongshan, Foshan, Guangzhou, Huizhou, Jiangmen, Shenzhen, Zhangqing, Zhuhai, Shanghai, Nanjing, Nantong, Taizhou, Hefei, Jiaxing, Ningbo, Suqian, Changzhou, Wuxi, Wenzhou, Huzhou, Yancheng, Shaoxing, Suzhou, Lianyungang, Jinhua, Zhenjiang, MaanshanNanyang, Dalian, Shenyang, ZhengzhouBaotou, Chengdu, Fuzhou, Guiyang, Guilin, Harbin, Haikou, Hohhot, Jincheng, Jingzhou, Kunming, Nanchang, Nanning, Xiamen, Shangrao, Shuozhou, Siping, Taiyuan, Urumqi, Xi’an, Xianning, Xianyang, Xinzhou, Xinyu, Yangquan, Yichang, Yinchuan, Yulin, Changchun, Changsha, Changzhi, Chongqing, Zunyi

Appendix B

To ensure the accuracy of the estimation result, we take into account all 24 types of fossil fuels reported consecutively in the urban statistical yearbooks to measure the CO2 emissions of each city. Based on the IPCC (2006) methodology, the specific calculation formula is as follows:
C O 2 = K = 1 24   E k × C F k + C F e η × E e
where CO2 is CO2 emissions, k represents primary fuel types, E represents energy consumption, C F k represents the carbon emission factor of k, Ee is total electricity consumption (carbon emission factors were obtained based on the original data from the China Energy Statistics Yearbook, the Guidelines for Provincial Greenhouse Gas Inventories (Trial), the IPCC Guidelines for National Greenhouse Gas Inventories 2006, and the China Greenhouse Gas Inventory Study (2007)), η is the proportion of coal-fired generation to total power (in electricity generation, CO2 is emitted only in thermal power, so we only calculated CO2 emissions from coal-fired power generation; from 2005–2019, the values of η, obtained from the World Bank website and the China Electric Power Yearbook, are 79.20%, 80.34%, 80.95%, 78.75%, 78.38%, 77.19%, 78.88%, 75.66%, 75.28%, 72.63%, 70.31%, 65.51%, 64.67%, 64.09%, 63.89%, respectively).

References

  1. Li, Y.; Chiu, Y.; Lin, T.-Y. Coal Production Efficiency and Land Destruction in China’s Coal Mining Industry. Resour. Policy 2019, 63, 101449. [Google Scholar] [CrossRef]
  2. Guo, X. Emission Reduction and Energy-Intensity Enhancement: The Expected and Unexpected Consequences of China’s Coal Consumption Constraint Policy. J. Clean. Prod. 2020, 271, 122691. [Google Scholar] [CrossRef]
  3. O’Meara, S. China’s Plan to Cut Coal and Boost Green Growth. Nature 2020, 584, S1–S3. [Google Scholar] [CrossRef]
  4. Edwards, G.A.S. Coal and Climate Change. WIREs Clim. Chang. 2019, 10, e607. [Google Scholar] [CrossRef]
  5. Yang, X.; Teng, F. The Air Quality Co-Benefit of Coal Control Strategy in China. Resour. Conserv. Recycl. 2018, 129, 373–382. [Google Scholar] [CrossRef]
  6. Zhang, L.; Yang, M.; Zhang, P.; Hao, Y.; Lu, Z.; Shi, Z. De-Coal Process in Urban China: What Can We Learn from Beijing’s Experience? Energy 2021, 230, 120850. [Google Scholar] [CrossRef]
  7. Xiao, K.; Li, F.; Dong, C.; Cai, Y.; Li, Y.; Ye, P.; Zhang, J. Unraveling Effects of Coal Output Cut Policy on Air Pollution Abatement in China Using a CGE Model. J. Clean. Prod. 2020, 269, 122369. [Google Scholar] [CrossRef]
  8. Shi, X.; Rioux, B.; Galkin, P. Unintended Consequences of China’s Coal Capacity Cut Policy. Energy Policy 2018, 113, 478–486. [Google Scholar] [CrossRef]
  9. Shi, D.; Li, S. The Effect of Green Cooperative Development in Beijing-Tianjin-Hebei Region—A Quasi-Natural Experiment Based on the Policy of “Coal-to-Gas/Electricity”. Res. Econ. Manag. 2018, 39, 64–77. [Google Scholar]
  10. Ji, L.; Zhang, B.-B.; Huang, G.-H.; Xie, Y.-L.; Niu, D.-X. GHG-Mitigation Oriented and Coal-Consumption Constrained Inexact Robust Model for Regional Energy Structure Adjustment—A Case Study for Jiangsu Province, China. Renew. Energy 2018, 123, 549–562. [Google Scholar] [CrossRef]
  11. Han, Z.-Y.; Fan, Y.; Jiao, J.-L.; Yan, J.-S.; Wei, Y.-M. Energy Structure, Marginal Efficiency and Substitution Rate: An Empirical Study of China. Energy 2007, 32, 935–942. [Google Scholar] [CrossRef]
  12. Chen, H.; Chen, W. Potential Impacts of Coal Substitution Policy on Regional Air Pollutants and Carbon Emission Reductions for China’s Building Sector during the 13th Five-Year Plan Period. Energy Policy 2019, 131, 281–294. [Google Scholar] [CrossRef]
  13. Meng, J.; Mi, Z.; Yang, H.; Shan, Y.; Guan, D.; Liu, J. The Consumption-Based Black Carbon Emissions of China’s Megacities. J. Clean. Prod. 2017, 161, 1275–1282. [Google Scholar] [CrossRef]
  14. Shou, M.-H.; Wang, Z.-X.; Li, D.-D.; Wang, Y. Assessment of the Air Pollution Emission Reduction Effect of the Coal Substitution Policy in China: An Improved Grey Modelling Approach. Env. Sci. Pollut. Res. 2020, 27, 34357–34368. [Google Scholar] [CrossRef] [PubMed]
  15. Lin, B.; Jia, Z. Economic, Energy and Environmental Impact of Coal-to-Electricity Policy in China: A Dynamic Recursive CGE Study. Sci. Total Environ. 2020, 698, 134241. [Google Scholar] [CrossRef]
  16. Li, X.; Yao, X. Can Energy Supply-Side and Demand-Side Policies for Energy Saving and Emission Reduction Be Synergistic?—A Simulated Study on China’s Coal Capacity Cut and Carbon Tax. Energy Policy 2020, 138, 111232. [Google Scholar] [CrossRef]
  17. Zhang, Y.; Liu, C.; Li, K.; Zhou, Y. Strategy on China’s Regional Coal Consumption Control: A Case Study of Shandong Province. Energy Policy 2018, 112, 316–327. [Google Scholar] [CrossRef]
  18. Chen, H.; Chen, W. Potential Impact of Shifting Coal to Gas and Electricity for Building Sectors in 28 Major Northern Cities of China. Appl. Energy 2019, 236, 1049–1061. [Google Scholar] [CrossRef]
  19. Wang, H.; Dong, C.; Liu, Y. Beijing Direct Investment to Its Neighbors: A Pollution Haven or Pollution Halo Effect? J. Clean. Prod. 2019, 239, 118062. [Google Scholar] [CrossRef]
  20. Brajer, V.; Mead, R.W.; Xiao, F. Searching for an Environmental Kuznets Curve in China’s Air Pollution. China Econ. Rev. 2011, 22, 383–397. [Google Scholar] [CrossRef]
  21. Copeland, B.; Taylor, M.S. A Simple Model of Trade, Capital Mobility, and the Environment; National Bureau of Economic Research: Cambridge, MA, USA, 1997. [Google Scholar]
  22. Xia, C.; Wang, Z.; Xia, Y. The Drivers of China’s National and Regional Energy Consumption Structure under Environmental Regulation. J. Clean. Prod. 2020, 285, 124913. [Google Scholar] [CrossRef]
  23. Kivyiro, P.; Arminen, H. Carbon Dioxide Emissions, Energy Consumption, Economic Growth, and Foreign Direct Investment: Causality Analysis for Sub-Saharan Africa. Energy 2014, 74, 595–606. [Google Scholar] [CrossRef]
  24. Omri, A.; Nguyen, D.K.; Rault, C. Causal Interactions between CO2 Emissions, FDI, and Economic Growth: Evidence from Dynamic Simultaneous-Equation Models. Econ. Model. 2014, 42, 382–389. [Google Scholar] [CrossRef]
  25. Akalpler, E.; Shingil, M.E. Statistical Reasoning the Link between Energy Demand, CO2 Emissions and Growth: Evidence from China. Procedia Comput. Sci. 2017, 120, 182–188. [Google Scholar] [CrossRef]
  26. Tian, X.; Chang, M.; Shi, F.; Tanikawa, H. How Does Industrial Structure Change Impact Carbon Dioxide Emissions? A Comparative Analysis Focusing on Nine Provincial Regions in China. Environ. Sci. Policy 2014, 37, 243–254. [Google Scholar] [CrossRef]
  27. Dietz, T.; Rosa, E.A. Effects of Population and Affluence on CO2 Emissions. Proc. Natl. Acad. Sci. USA 1997, 94, 175–179. [Google Scholar] [CrossRef]
  28. Chen, Y.; Lee, C.-C. Does Technological Innovation Reduce CO2 Emissions? Cross-Country Evidence. J. Clean. Prod. 2020, 263, 121550. [Google Scholar] [CrossRef]
  29. Ma, B.; Yu, Y. Industrial Structure, Energy-Saving Regulations and Energy Intensity: Evidence from Chinese Cities. J. Clean. Prod. 2017, 141, 1539–1547. [Google Scholar] [CrossRef]
  30. Huang, J.; Chen, X. Domestic R Activities, Technology Absorption Ability, and Energy Intensity in China. Energy Policy 2020, 138, 111184. [Google Scholar] [CrossRef]
  31. Tan, R.; Lin, B. What Factors Lead to the Decline of Energy Intensity in China’s Energy Intensive Industries? Energy Econ. 2018, 71, 213–221. [Google Scholar] [CrossRef]
  32. Zheng, Y.; Qi, J.; Chen, X. The Effect of Increasing Exports on Industrial Energy Intensity in China. Energy Policy 2011, 39, 2688–2698. [Google Scholar] [CrossRef]
  33. Mielnik, O.; Goldemberg, J. Foreign Direct Investment and Decoupling between Energy and Gross Domestic Product in Developing Countries. Energy Policy 2002, 30, 87–89. [Google Scholar] [CrossRef]
  34. Wu, S.; Ding, S. Efficiency Improvement, Structural Change, and Energy Intensity Reduction: Evidence from Chinese Agricultural Sector. Energy Econ. 2021, 99, 105313. [Google Scholar] [CrossRef]
  35. Fang, Q.; Leong, C.K. Impact of Population Growth and One Child Policy on Economic Growth of China. SSRN Electron. J. 2014. [CrossRef]
  36. Ashenfelter, O. Estimating the Effect of Training Programs on Earnings. Rev. Econ. Stat. 1978, 60, 47–57. [Google Scholar] [CrossRef]
  37. Wenjuan, Z.; Jianhua, H.; Lei, Y. Revealing Dynamic Effects of China’s Regional Coal Consumption Control Policy on Energy Efficiency and Pollution Emissions. 11 February 2022, PREPRINT (Version 1), in review, Research Square. [CrossRef]
  38. Beck, T.; Levine, R.; Levkov, A. Big Bad Banks? The Winners and Losers from Bank Deregulation in the United States. J. Financ. 2010, 65, 1637–1667. [Google Scholar] [CrossRef]
  39. Fan, Y.; Chen, J.; Shirkey, G.; John, R.; Wu, S.R.; Park, H.; Shao, C. Applications of Structural Equation Modeling (SEM) in Ecological Studies: An Updated Review. Ecol. Process. 2016, 5, 19. [Google Scholar] [CrossRef]
  40. Baron, R.M.; Kenny, D.A. The Moderator–Mediator Variable Distinction in Social Psychological Research: Conceptual, Strategic, and Statistical Considerations. J. Personal. Soc. Psychol. 1986, 51, 1173–1182. [Google Scholar] [CrossRef]
  41. Fritz, M.S.; MacKinnon, D.P. Required Sample Size to Detect the Mediated Effect. Psychol. Sci. 2007, 18, 233–239. [Google Scholar] [CrossRef]
  42. Bollen, K.A.; Stine, R. Direct and Indirect Effects: Classical and Bootstrap Estimates of Variability. Sociol. Methodol. 1990, 20, 115. [Google Scholar] [CrossRef]
  43. Stone, C.A.; Sobel, M.E. The Robustness of Estimates of Total Indirect Effects in Covariance Structure Models Estimated by Maximum. Psychometrika 1990, 55, 337–352. [Google Scholar] [CrossRef]
  44. Wright, S. On The Nature of Size Factors. Genetics 1918, 3, 367–374. [Google Scholar] [CrossRef] [PubMed]
  45. Zhao, X.; Lynch, J.G.; Chen, Q. Reconsidering Baron and Kenny: Myths and Truths about Mediation Analysis. J. Consum. Res. 2010, 37, 197–206. [Google Scholar] [CrossRef]
  46. Guo, X.; Fu, L.; Sun, X. Can Environmental Regulations Promote Greenhouse Gas Abatement in OECD Countries? Command-and-Control vs. Market-Based Policies. Sustainability 2021, 13, 6913. [Google Scholar] [CrossRef]
  47. Moser, P.; Voena, A. Compulsory Licensing: Evidence from the Trading with the Enemy Act. Am. Econ. Rev. 2012, 102, 396–427. [Google Scholar] [CrossRef]
  48. Shao, S.; Tian, Z.; Yang, L. High Speed Rail and Urban Service Industry Agglomeration: Evidence from China’s Yangtze River Delta Region. J. Transp. Geogr. 2017, 64, 174–183. [Google Scholar] [CrossRef]
  49. Shao, S.; Yang, Z.; Yang, L.; Ma, S. Can China’s Energy Intensity Constraint Policy Promote Total Factor Energy Efficiency? Evidence from the Industrial Sector. Energy J. 2019, 40, 101–128. [Google Scholar] [CrossRef]
  50. Anadon, L.D.; Bunn, M.; Narayanamurti, V. Transforming U.S. Energy Innovation; Cambridge University Press: New York, NY, USA, 2014; ISBN 978-1-107-33889-0. [Google Scholar]
  51. Li, W.; Gu, Y.; Liu, F.; Li, C. The Effect of Command-and-Control Regulation on Environmental Technological Innovation in China: A Spatial Econometric Approach. Environ. Sci. Pollut. Res. 2018, 26, 34789–34800. [Google Scholar] [CrossRef]
  52. Tang, K.; Qiu, Y.; Zhou, D. Does Command-and-Control Regulation Promote Green Innovation Performance? Evidence from China’s Industrial Enterprises. Sci. Total Environ. 2020, 712, 136362. [Google Scholar] [CrossRef]
  53. Pan, X.; Ai, B.; Li, C.; Pan, X.; Yan, Y. Dynamic Relationship among Environmental Regulation, Technological Innovation and Energy Efficiency Based on Large Scale Provincial Panel Data in China. Technol. Forecast. Soc. Chang. 2019, 144, 428–435. [Google Scholar] [CrossRef]
  54. Tang, H.; Liu, J.; Wu, J. The Impact of Command-and-Control Environmental Regulation on Enterprise Total Factor Productivity: A Quasi-Natural Experiment Based on China’s “Two Control Zone” Policy. J. Clean. Prod. 2020, 254, 120011. [Google Scholar] [CrossRef]
  55. Wu, Y. Energy Intensity and Its Determinants in China’s Regional Economies. Energy Policy 2012, 41, 703–711. [Google Scholar] [CrossRef]
  56. Wurlod, J.-D.; Noailly, J. The Impact of Green Innovation on Energy Intensity: An Empirical Analysis for 14 Industrial Sectors in OECD Countries. Energy Econ. 2018, 71, 47–61. [Google Scholar] [CrossRef]
Figure 1. Mechanisms by which the coal consumption constraint policy (CCCP) affects energy and emissions intensity.
Sustainability 15 07748 g001
Figure 2. Parallel trend hypothesis test.
Sustainability 15 07748 g002
Figure 3. Placebo test (Notes: The X-axis indicates the magnitude of the estimated coefficients of the “pseudo-policy dummy variables” and the Y-axis indicates the magnitude of the density values and p-values).
Sustainability 15 07748 g003
Table 1. Variable list.
SymbolVariableUnitMeanStandard Deviation
(S.D)
gso2Sulphur dioxide emissions from industrial sector per unit of output valueTones/CNY0.0042940.0066496
gco2Carbon dioxide emissions from industrial sector per unit of output valueTones/CNY0.0004750.000684
toconsum_gThe proportion of energy consumption to output valueN/A1.1286091.558941
pgdpGDP per capitaCNY/people73,465.8766,010.77
industryThe proportion of secondary industry in total output value%47.973049.367037
popTotal population at the end of the yearMillion440.9437440.9437
tecThe proportion of scientific expenditure in local fiscal expenditureN/A0.02265340.0182364
fdiThe proportion of actual amount of foreign capital used in the year of GDPMillion USD/ten thousand CNY0.00427360.0034741
coal_cThe proportion of coal consumption in total energy consumptionN/A0.66348360.2435611
Table 2. Estimation results of the effects of CCCP.
Lngso2Lngco2Toconsum_g
D−0.1283 **−0.0747 *−0.2493 **
(−2.2283)(−1.7183)(−2.0735)
lnpgdp−0.6909 ***−0.8116 ***−0.4622 *
(−4.3276)(−6.7058)(−1.8887)
industry0.0122 **0.0119 ***−0.0196
−2.2196−2.8816(−1.5973)
lnpop−1.6557 ***−0.8276 **0.7567
(−3.8338)(−2.0245)−1.4118
lntec−0.0104−0.0466−0.2061 **
(−0.2037)(−1.1212)(−2.4355)
lnfdi−0.0853 ***−0.0076−0.0708
(−3.1015)(−0.4092)(−1.5524)
coal_c−0.24120.4925 *0.4498
(−1.5949)−1.8374−1.0179
Intercept10.5287 ***4.41650.9128
cityyesyesyes
yearyesyesyes
N99210261030
r2_a0.92660.92030.7402
Note: t statistics in parentheses. * p < 0.1, ** p < 0.05, *** p < 0.01. City and year represent time fixed effects and individual fixed effects.
Table 3. Estimation results of the robustness tests.
Lngso2Lngco2Toconsum_gLngso2Lngco2Toconsum_g
D_2−0.0941−0.0701−0.0416
(−1.6029)(−1.5137)(−0.3607)
D_3 −0.0844−0.04790.0380
(−1.3439)(−0.9361)(0.3229)
lnpgdp−0.6673 ***−0.8094 ***−0.3294−0.6534 ***−0.7912 ***−0.2804
(−4.1203)(−6.7011)(−1.3835)(−4.0681)(−6.5723)(−1.1499)
industry0.0129 **0.0121 ***−0.01660.0131 **0.0124 ***−0.0158
(2.3602)(2.9812)(−1.3676)(2.4051)(3.0756)(−1.3208)
lnpop−1.6677 ***−0.8401 **0.7645−1.6671 ***−0.8369 **0.7870
(−3.8721)(−2.0501)(1.4305)(−3.8690)(−2.0450)(1.4698)
lntec−0.0139−0.0468−0.2325 ***−0.0163−0.0502−0.2429 ***
(−0.2682)(−1.1126)(−2.6855)(−0.3137)(−1.1978)(−2.7677)
lnfdi−0.0847 ***−0.0081−0.0640−0.0841 ***−0.0071−0.0604
(−3.0787)(−0.4376)(−1.4122)(−3.0546)(−0.3796)(−1.3397)
coal_c−0.24130.4885 *0.4847−0.22930.4992 *0.5005
(−1.6269)(1.8240)(1.0935)(−1.5492)(1.8623)(1.1235)
Intercept 10.3020 ***4.4608−0.877710.1231 ***4.2057−1.6543
(2.7321)(1.4621)(−0.1667)(2.6912)(1.3874)(−0.3105)
N9921026103099210261030
r2_a0.92630.92020.73860.92630.92010.7386
Notes: t statistics in parentheses. * p < 0.1, ** p < 0.05, *** p < 0.01.
Table 4. The indirect effects of CO2 emission intensity.
Bootstrap
Observed CoefficientBiasStd. Err.[95% Conf. Interval]
direct_effect−0.07470.00070.0470−0.17260.0157(P)
−0.17260.0157(BC)
industry structure−0.02630.00000.0113−0.0490−0.0043(P)
−0.0507−0.0060(BC)
technological progress−0.01220.00140.0112−0.03300.0129(P)
−0.03570.0090(BC)
energy structure−0.0192−0.00010.0135−0.05180.0026(P)
−0.05480.0007(BC)
total_effect−0.13240.00190.0479−0.2292−0.0415(P)
−0.2297−0.0424(BC)
Note: If the 95% confidence interval excludes zero, it means that the mediator is statistically significant at the 5% level, otherwise it is not significant.
Table 5. The indirect effects of SO2 emission intensity.
Bootstrap
Observed CoefficientBiasStd. Err.[95% Conf. Interval]
direct_effect−0.1283−0.00180.0585−0.2342−0.0134(P)
−0.2303−0.0059(BC)
industry structure−0.0271−0.00050.0130−0.0525−0.0037(P)
−0.0525−0.0040(BC)
Technological progress−0.00270.00090.0137−0.02950.0242(P)
−0.03120.0227(BC)
energy structure0.00940.00000.0075−0.00090.0269(P)
−0.00010.0317(BC)
total_effect−0.1487−0.00140.0572−0.2571−0.0358(P)
−0.2525−0.0299(BC)
Table 6. The indirect effects of energy intensity.
Bootstrap
Observed CoefficientBiasStd. Err.[95% Conf. Interval]
direct_effect−0.2493−0.01130.1355−0.54530.0025(P)
−0.53330.0138(BC)
industry structure0.04340.00310.0318−0.01210.1160(P)
−0.02060.1116(BC)
Technological progress−0.0539−0.00040.0241−0.1047−0.0101(P)
−0.1081−0.0120(BC)
energy structure−0.0175−0.00190.0208−0.06380.0141(P)
−0.07030.0132(BC)
total_effect−0.2774−0.01040.1276−0.5667−0.0413(P)
−0.5515−0.0202(BC)
Disclaimer/Publisher’s Note: The statements, opinions and data contained in all publications are solely those of the individual author(s) and contributor(s) and not of MDPI and/or the editor(s). MDPI and/or the editor(s) disclaim responsibility for any injury to people or property resulting from any ideas, methods, instructions or products referred to in the content.

