Article

Organic Carbon Content in Fractions of Soils Managed for Soil Fertility Improvement in Sub-Humid Agroecosystems of Kenya

1
Rosewood Futures, Nyahururu P.O. Box 2171-20300, Kenya
2
Cortile Scientific Limited, Nairobi P.O. Box 34991-00100, Kenya
3
Division of Research Innovation and Outreach, KCA University, Nairobi P.O. Box 56808-00200, Kenya
4
National Agriculture Research Laboratories, Kenya Agricultural and Livestock Research Organization, Nairobi P.O. Box 14733-00800, Kenya
5
Department of Soil Sciences, Research Institute of Organic Agriculture FIBL, Ackerstrasse 113, 5070 Frick, Switzerland
6
Department of Plant, Animal and Food Sciences (PAFS), Jaramogi Oginga Odinga University of Science and Technology (JOOUST), Bondo P.O. Box 210-40601, Kenya
*
Author to whom correspondence should be addressed.
Sustainability 2023, 15(1), 683; https://doi.org/10.3390/su15010683
Submission received: 29 October 2022 / Revised: 26 December 2022 / Accepted: 27 December 2022 / Published: 30 December 2022
(This article belongs to the Special Issue The Sustainability of Agricultural Soils)

Abstract

:
Soil health and fertility are indexed by soil organic carbon (SOC) content. Soil management through good agricultural practices that enhance and sustain SOC is vital for soil fertility. We examined the influence of soil fertility management strategies on SOC concentrations in different particle size fractions under a maize cropping system. We laid the experiment in a randomized complete block design, with 14 treatments replicated 4 times, and used the following inputs: inorganic fertilizer (Mf), maize residue +inorganic fertilizer (RMf), maize residue + inorganic fertilizer, and goat manure (RMfM), maize residue + goat manure + Dolichos Lablab L intercrop (RML), maize residue + Tithonia diversifolia + goat manure (RTiM) and maize residue + Tithonia diversifolia + phosphate rock (Minjingu) (RTiP) and a Control (no inputs) under reduced tillage (Mt) or conventional tillage (Ct). Soil samples were collected from two depths, 0–5 cm, and 5–15 cm. We determined the content of organic carbon in three physical fractionation: coarse fractions (1.7 mm, 500 µm sieve), medium fractions (250 µm and 90 µm), and a fine fraction (75 µm). Results showed that treatment with maize residues, goat manure, and legume intercrop (MtRML and CtRML) resulted in higher SOC in most fractions, irrespective of the soil depth. The SOC concentration significantly (p < 0.0001) differed across treatments and depth. It was followed by maize residue, goat manure, and inorganic fertilizer treatments, and the least was inorganic fertilizer treatment. This underpins the importance of manure application and crop residue retention in increasing SOC amounts. Reduced tillage did not influence the SOC amounts during the sampling period in the experimentation site. This study highlights the possibility of improving agricultural productivity by improving soil fertility through a combination of different agricultural soil fertility amendments in Sub-Saharan Africa.

1. Introduction

It is estimated that 65% of the cultivated land in Sub-Saharan Africa is degraded due to inappropriate agricultural management strategies, leading to decreased soil fertility [1]. Declining soil fertility is a major reason for low soil productivity in Sub-Saharan Africa (SSA) due to reducing nutrient retention [2]. Therefore, to improve soil fertility and crop harvests, efficient and sustainable agricultural practices are essential [3,4].
In Kenya, land degradation, climate change, low crop performance, and extreme poverty levels among small-scale farmers have exacerbated food insecurity [5]. Further, nutrient insufficiencies and improper land use practices are characteristics of most smallholder farming systems in Kenya’s high agricultural potential areas [6,7]. Additionally, smallholder farming systems are affected by numerous challenges, such as climate change and soil water requirements [8,9]. Therefore, farming practices that can enhance soil fertility (for example, reduced tillage, crop residue retention, and manure application) are essential for increased crop production [5,10,11,12]. Therefore, there is a need for agricultural management strategies that could increase soil fertility and crop performance.
Soil organic carbon (SOC) is an important soil quality parameter Merante et al. [13]. Soil with high SOC has higher crop yields than those depleted [14]. Soil organic matter (SOM) decomposition enhances soil water infiltration and structure and enhances cation exchange capacity thus improving soil fertility [15]. Increasing C inputs or decreasing SOC mineralization is vital in improving soil health and sustainability in farming [7,16,17]. Many agricultural practices influence SOC fluctuations, e.g., tillage and application of external inputs [18,19]. Integrating organic and inorganic inputs leads to enhanced mineral fertilizers’ efficiency and reduced loss of nutrients from the soil [20], thus creating a sustainable strategy for the effective use of nutrients [21]. Using animal, green manure, and crop residue retention increases C input, thus restoring SOC and contributing to SOC storage [22,23]. The influence of soil fertility improvement strategies on the amounts of SOC and yields in Kenya Central has been reported by Kiboi et al. [24]. However, the scope of SOC storage in major soil particle fractions influenced by soil fertility management practices has not been extensively studied in Kenya’s Central highlands. Information on SOC concentration in different fractions is important in understanding the SOC storage capacity as influenced by agricultural management systems, impacting crop production and performance.
Tillage is an important agricultural practice that loosens and aerates the topsoil for enhanced crop performance [25]. Additionally, tillage controls weed and soil compaction, thus encouraging the decomposition of crop residues [26]. According to Haddaway et al. [25], tillage affects soil properties, crop growth, and yields [27]. Continuous mixing of soil in conventional tillage increases the leaching of nutrients and reduces soil nutrients [28]. Tillage also induces soil moisture and temperature changes [29,30]. Additionally, tillage leads to the destruction of macroaggregates and reduced soil organic matter Jat et al. [31], leading to low soil fertility. For instance, Sanderman et al. [32] showed that tillage decreases C in SOM by 26%. Loss of C subsequently affects soil fertility, crop growth, and crop production. Conversely, as a conservation tillage strategy, reduced tillage has been proposed to improve agricultural sustainability [16]. Reduced tillage positively modifies soil biophysical and chemical processes and properties [33,34]. The loss of air capacity increased diffusion resistance, and bulk density in the topsoil are evident in reduced tillage [35]. Further, reduced tillage increases SOC Sheehy et al. [36], maintains the soil aggregate structure, and thereby protects C from mineralization [37]. Additionally, soil aggregation slows down soil organic matter (SOM) decomposition [38]. Prasad et al. [39] showed reduced tillage increased soil C sequestration rate from 0.12 to 0.20 Mg C ha−1 year−1 in semiarid continental and tropical climates. In Italy, a study by Piazza et al. [40] on reduced tillage showed an accumulation rate of SOC of 0.16 Mg C ha−1 year−1 in the topsoil. In Kenyan Central Highlands, continuous conventional tillage coupled with low nutrient replenishments under smallholder farming systems has reduced soil fertility leading to low yields [41]. To improve yields, soil fertility enhancement is foremost, and tillage practices that enhance soil fertility are essential in maintaining crop performance and production.
Understanding the SOC dynamics in the soil when soil inputs and tillage are used is crucial in directing management practices that improve soil fertility. What is the influence of soil external inputs and tillage on soil organic carbon in the Central Highlands of Kenya? Studies have documented that integrated soil fertility strategies increase SOC Bationo et al. [42] and Tittonell et al. [43]. Still, little has been reported on its concentrations in different fractions in smallholder cropping systems in Sub-Saharan Africa. Further, the use of soil in agro-ecologies to improve soil fertility by increasing SOC concentrations in the topsoil sub-humid agro-ecologies of the Kenya Central Highlands is limited. Using organic soil inputs and inorganic fertilizers with crop residue retention and appropriate tillage practice would boost good farming practices leading to efficient use of nutrients, enhancement, and maintenance of SOC, leading to improved soil quality. Therefore, this study aimed to determine the effect of selected soil fertility management strategies (integrating soil inputs and tillage) on the amount of SOC in two depths and the amount of C in particle size fractions.

2. Materials and Methods

2.1. Site Characteristics

The study was carried out in Kangutu primary school two-acre farm (1468 m, 00°98′ S, 37°08′ E), Meru South sub-county, Kenya. The sub-county is located on the Upper Midland two (UM2) agro-ecological zone on the Eastern slopes of Mount Kenya [44]. The area receives rain in two seasons per annum, from March to May (long rains-LR) and October to December (short rains-SR), with an annual average rainfall of 1500 mm [44]. The temperatures experienced range from 18.2 to 20.6 °C annually. The soils are deep, friable clay with humic topsoil but require amendments to improve and sustain their fertility. The baseline soil characteristics at the experimental site were 1.48% TOC, 0.17% TN, bulk density of 0.83 g cm3, pH of 4.85, and a textural class of clay [24]. Maize, beans, and bananas are the main food crops.

2.2. Experimental Setup

We implemented 14 treatments (Table 1) and replicated them four times in a randomized complete block design. The plot size was 6 by 4.5 m while maize (Zea mays L.), variety H516, was the test crop. Planting spacing was 0.75 by 0.5 m inter and intra row, respectively. Land preparation was done fourteen days before the rainfall onset. In reduced tillage plots, land plowing was done at 10 cm depth, using a machete (“panga”). Organic inputs, goat manure, and Tithonia diversifolia were incorporated into the soil in the planting holes. Conventional tillage (traditional hand hoeing) involves land preparation using a hand hoe up to 15 cm depth. Goat manure and Tithonia diversifolia were spread on the plots and incorporated into the soil using a hand hoe. All plots were planted two weeks after incorporating Tithonia diversifolia and goat manure with three seeds per hill. Thinning was done after seed emergency leading to two seedlings per hill, achieving 53,333 ha −1 plant density. In treatments with maize crop residues, it was surface applied after thinning at a rate of 5 Mg ha−1. An equal quantity of 60 kg N ha−1 was applied to meet the recommended nitrogen content for maize in the area [45]. For organic inputs (goat manure) and mineral fertilizer (Nitrogen Phosphorous Potassium, NPK) treatment combinations, an equivalence of 30 kg N ha−1 from organic inputs and 30 kg N ha−1 from inorganic fertilizer was applied. 90 kg ha−1 Triple superphosphate was applied to supply P in treatments with mineral fertilizers during planting. Hand pulling of weeds was done in treatments under reduced tillage, and hand hoeing was done in conventional tillage treatments.

2.3. Soil Samples Collection

We collected soil samples at the end of the long rains 2019 season, after six consecutive cropping seasons since the establishment of the experiment in the long rain season of 2016. A composite soil sample from each plot was taken from two depths, 0–5 cm and 5–15 cm, using an Eijkelkamp gouge auger. Each sample was packed in a labeled zip-lock bag and transported to the laboratory for analysis.

2.4. Rainfall Characteristics at the Experimental Site

Cumulative rainfall received in the Kangutu site for the seven (7) consecutive cropping seasons was 4479 mm; long rains (2709 mm), short rains (1504 mm), and offseason (256 mm) (Table 2). During the LR16, 879 mm was received, 385 mm in SR16, 341 mm in LR17, 571 mm in SR17, and 145 mm during the offseason. During LR18, 1167 mm was received, 558 mm during SR18, 322 mm during LR19, and 111 mm during the offseason. Given that the rainfall start dates in the study area are estimated to be on 15 March for long rains and 15 October for short rains Ngetich et al. [46], the SR18 season was within the range, while the LR19 was late. The rainfall cessation dates were 59 days during the SR18 season and 21 days for the LR19 season. The LR19 recorded the lowest rainfall and the earliest cessation date (Table 2).
During the LR19 season, when the sampling was carried out, a meteorological drought of 59 days and 14 days of dry spells were experienced. Meteorological drought herein describes the absence of rainfall for more than 28 days in the growing season and a dry spell as an absence of between 10 to 28 days during the crop growing season [47]. Most of the farmers in the study rely on rainfall for farming activities. However, rainfall in this region is both spatially and temporally variable, as observed by Ngetich et al. [46], making it unreliable for crop growth and yield output. As such, incidences of soil moisture stress which leads to crop failure, have been experienced in the region. This unreliable and erratic rainfall impacts soil moisture availability. Soil moisture influences SOC in the soil as it affects SOM mineralization Fantappiè et al. [48] and Farina et al. [49], decomposition, and microbial activities. The soil microbial activities further affect decomposition rates which affect SOC amounts in the soil.

2.5. Laboratory Analysis

Soil organic carbon content was determined by physical fractionation following the procedures by Cambardella and Elliott [50]. A 50 g dry-weight soil sample was dispersed with a 10% sodium hexametaphosphate (Calgon) solution, and the sample was shaken in a mechanical shaker overnight. The dispersed soil sample was placed on the rack with sieves arranged as follows, coarse fractions (sieves 1.7 mm, 500 µm), medium fractions (250 µm and 90 µm), and a fine fraction (75 µm). The sample was poured into the first sieve (1.7 mm) and using free-flowing water, the sample was filtered through the first sieve onto the next sieve until the last sieve. The soil retained on the top sieve was washed using free-flowing water until the bottom sieve water was clear. The fractions from individual sieves were collected and dried in the oven at 65 °C for 24 h, and the final weight was recorded. A 5 g dry-weight soil sample was dried in the oven for 24 h at 105 °C for soil moisture content determination. Organic carbon concentration was determined by oxidizing samples with potassium dichromate and titrating them with ferrous ammonium sulfate [51]. A 0.1 g dried-weight soil sample was oxidized using 5 mL of potassium dichromate solution in a block digester tube. The tube was placed in a pre-heated block at 145 °C for 30 min, removed, and allowed to cool. The tube’s content was quantitatively transferred by washing off all the contents with distilled water into a 0.1 L conical flask, and a 0.3 mL indicator was added. The digest (the unused potassium dichromate) was titrated with ferrous ammonium sulfate solution while stirring with a magnetic stirrer to allow for good mixing until the color changed from greenish to brown. The difference between added and residual potassium dichromate resulted in the soil’s amount of organic C content. The titer was recorded, and the mean of the two reagent blanks (T) was corrected. Organic carbon was calculated as per Equation (1).
O r g a n i c   c a r b o n   ( % ) = T × 0.2 × 0.3 S a m p l e   W e i g h t
where T is the mean of 2 reagent blanks.

2.6. Data Analysis

Statistical data analysis was conducted using the Mixed Procedure Model in SAS 9.4 for analysis of variance (ANOVA) to get the model’s effect F value. The data were tested for normality using Shapiro–Wilk Test. Duncan’s Multiple Range Test was used to examine the treatment means difference at p ≤ 0.05.

3. Results and Discussion

3.1. Soil Organic Carbon Concentration in Soil Sampled at 0 to 5 cm Depth

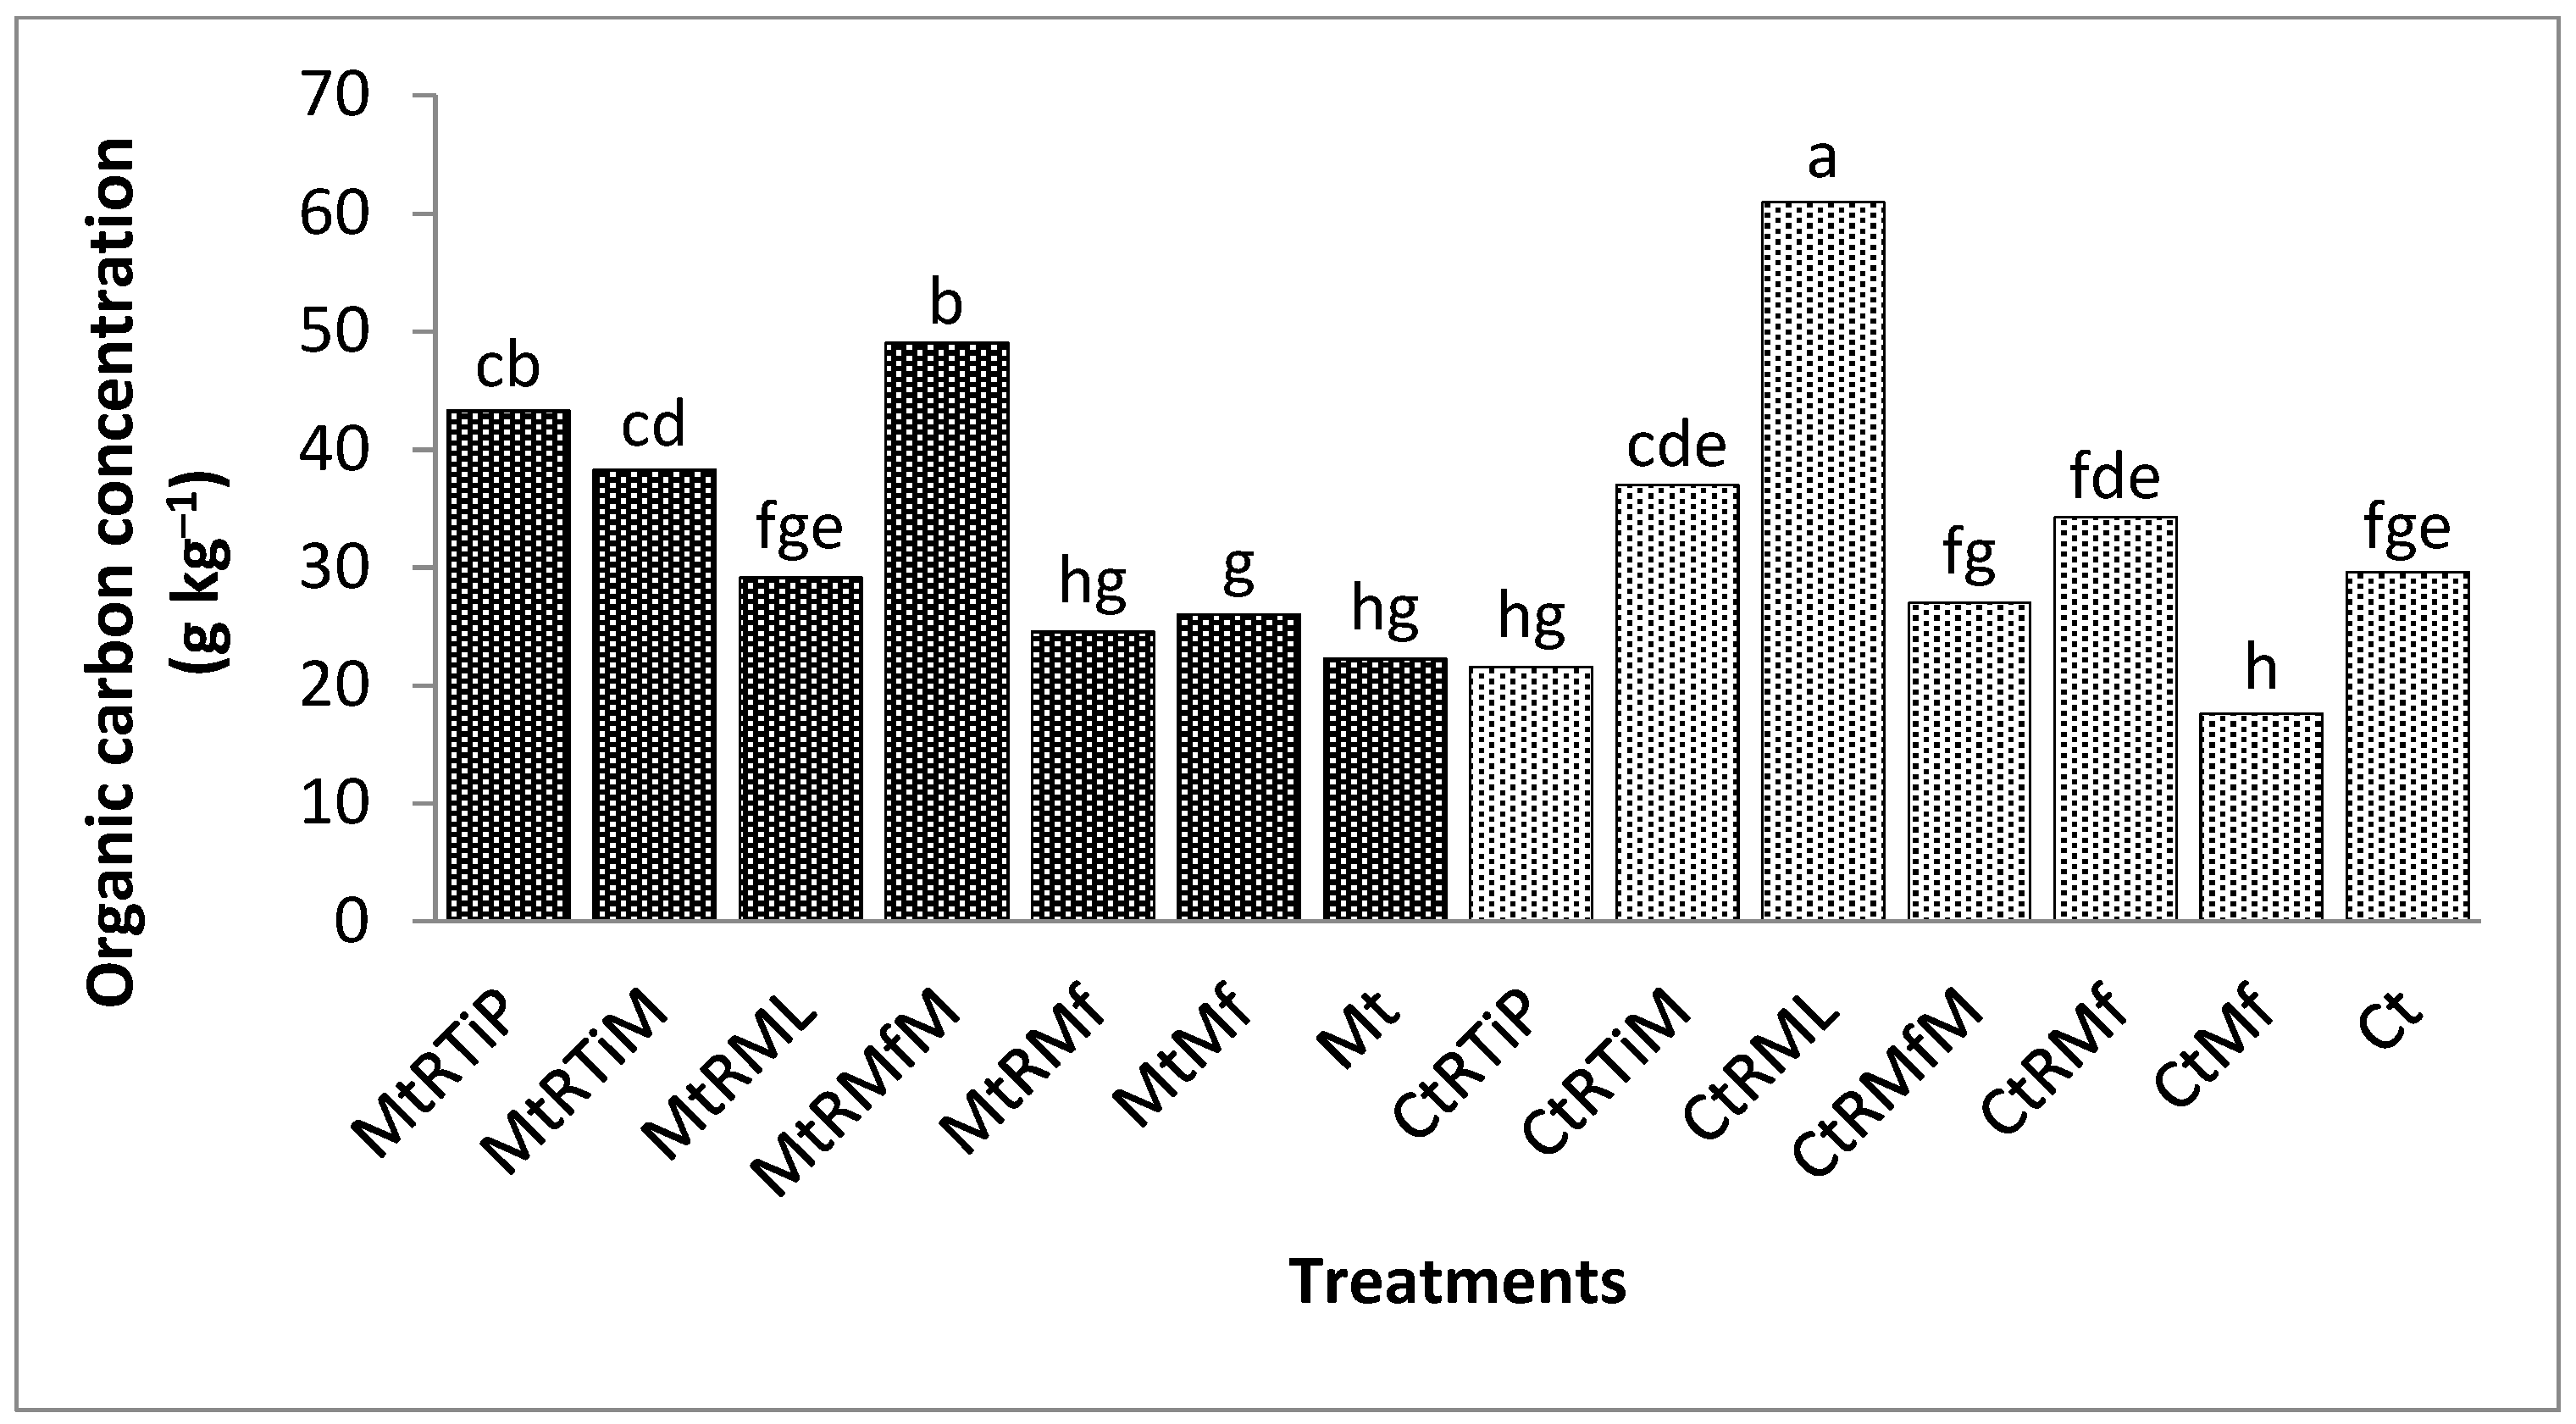
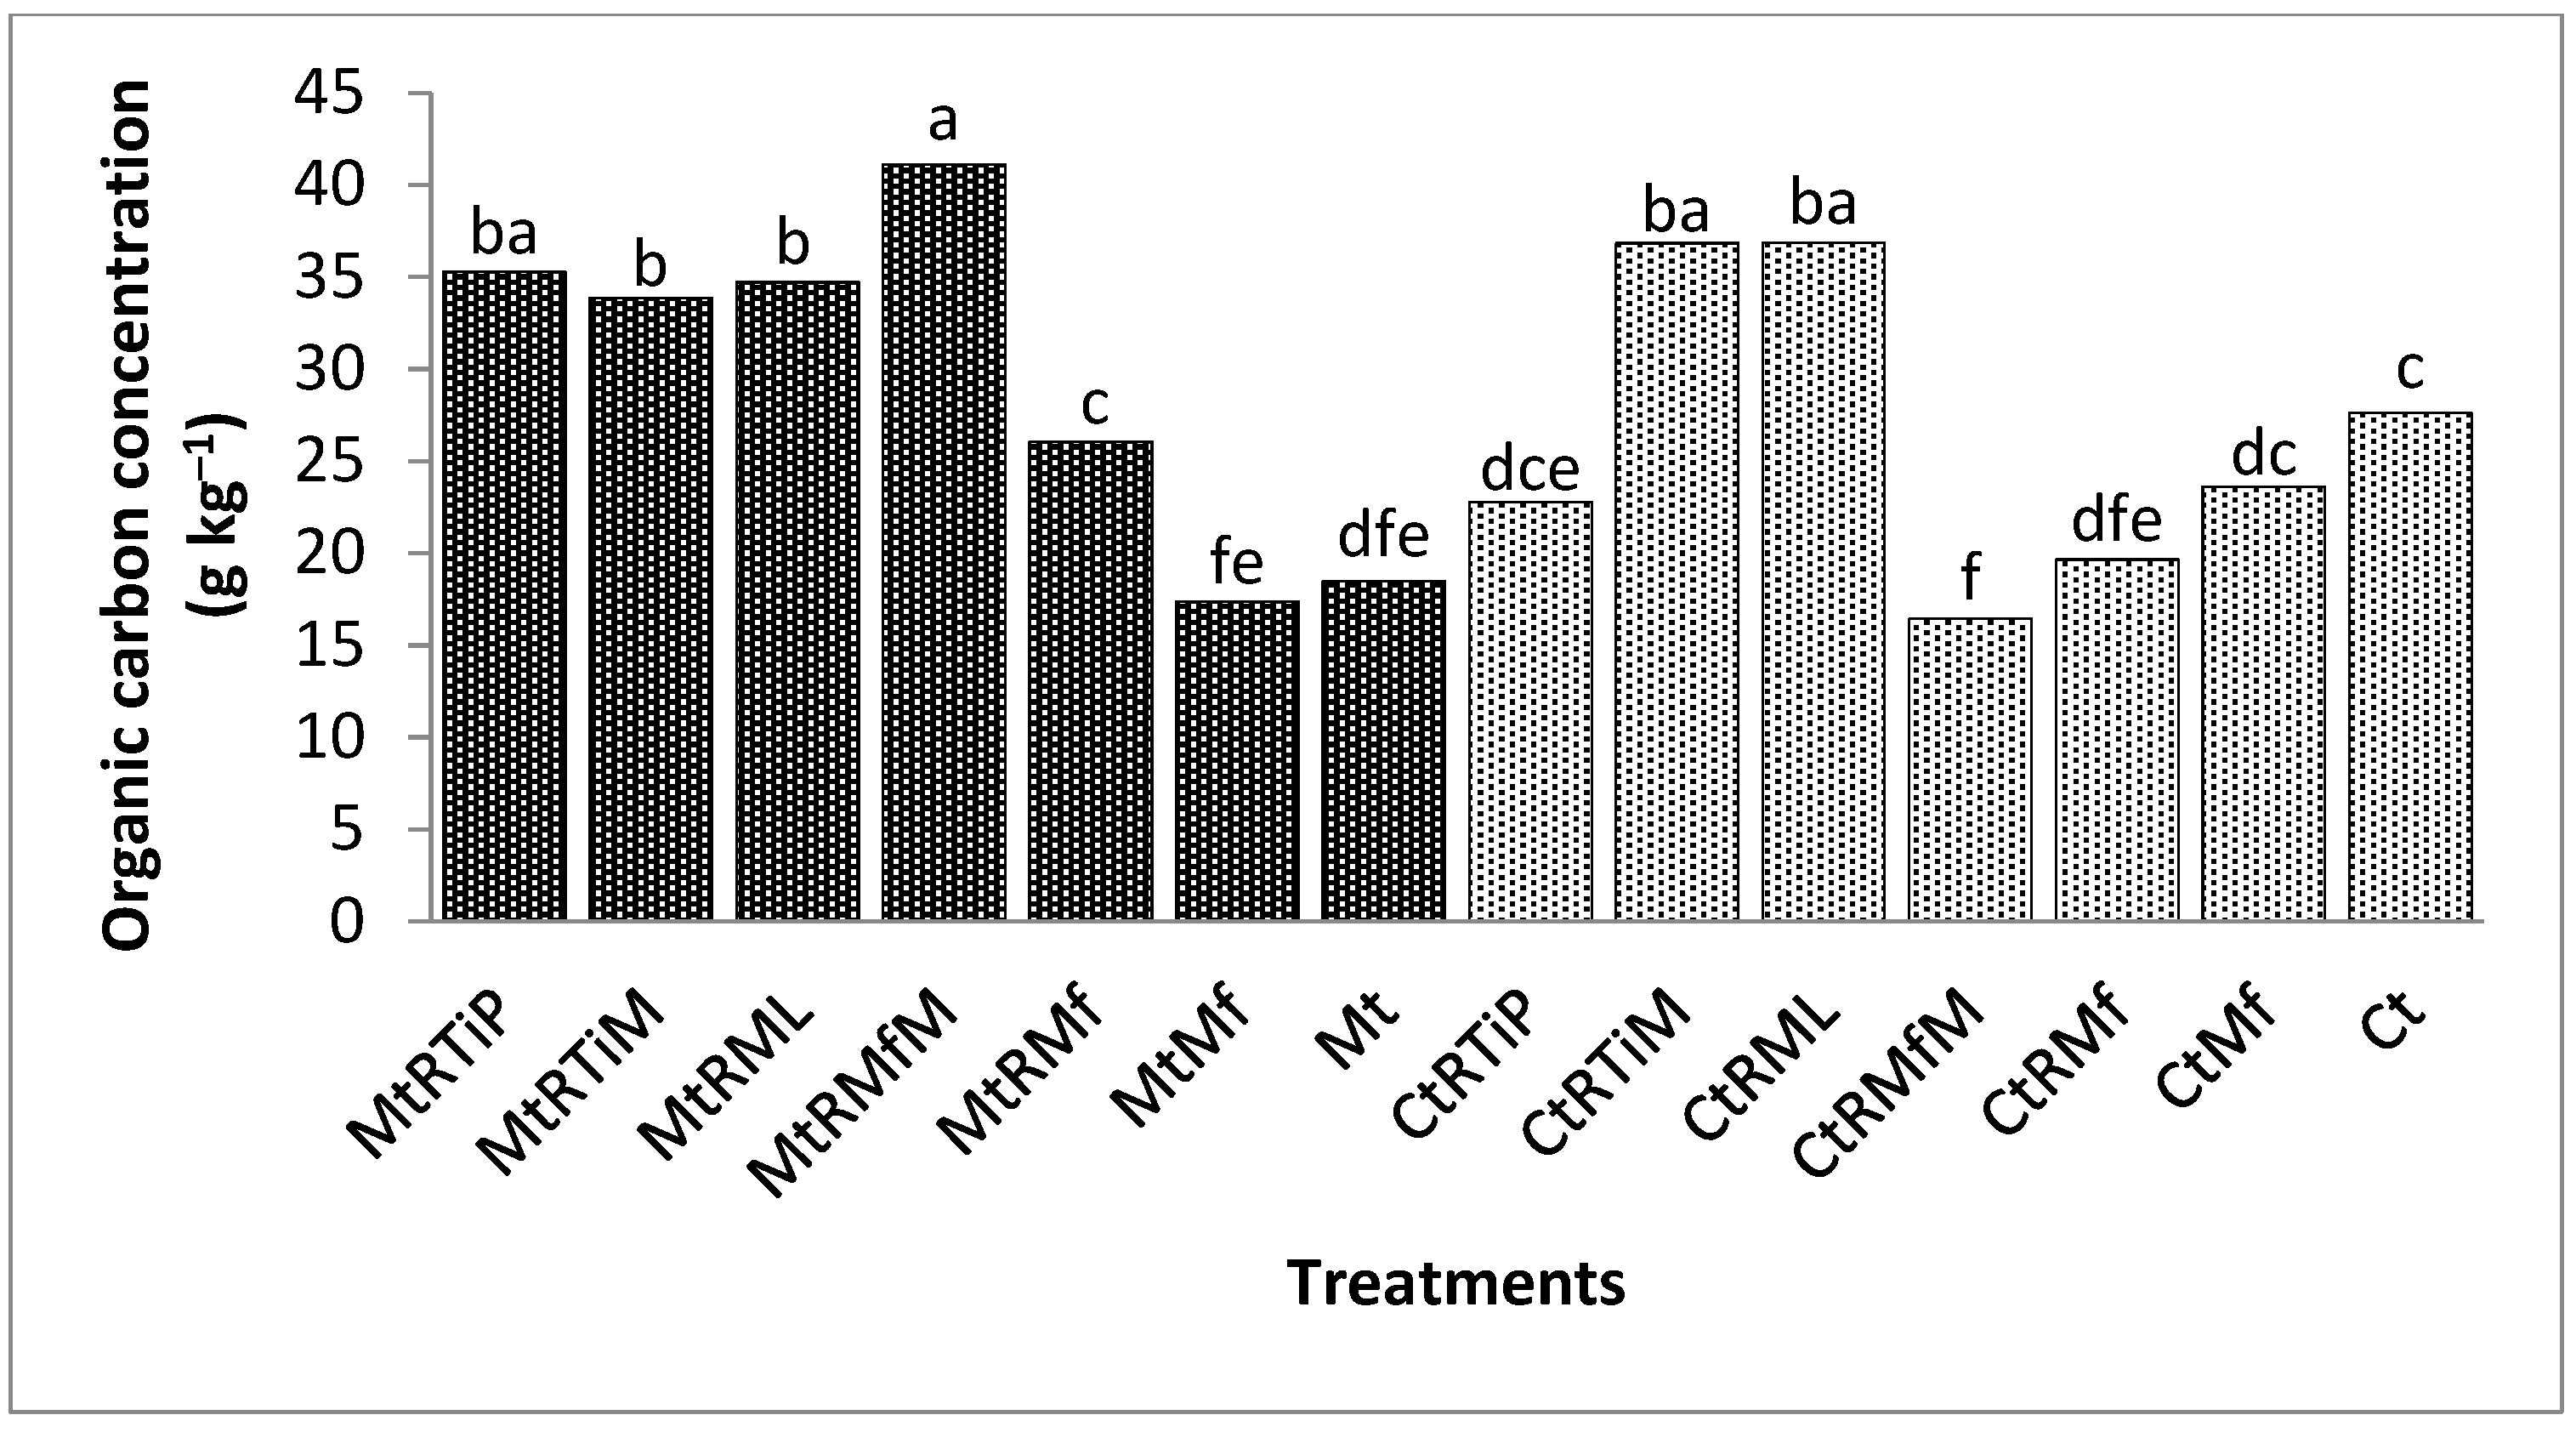
3.1.1. The Concentration of Organic Carbon in the 1.7 mm Fraction

In the 1.7 mm fraction, OC concentration was significantly higher (p < 0.0001) under CtRML MtRMfM, MtRTiP, and MtRTiM by 106, 66, and 29% compared with the control (Figure 1).

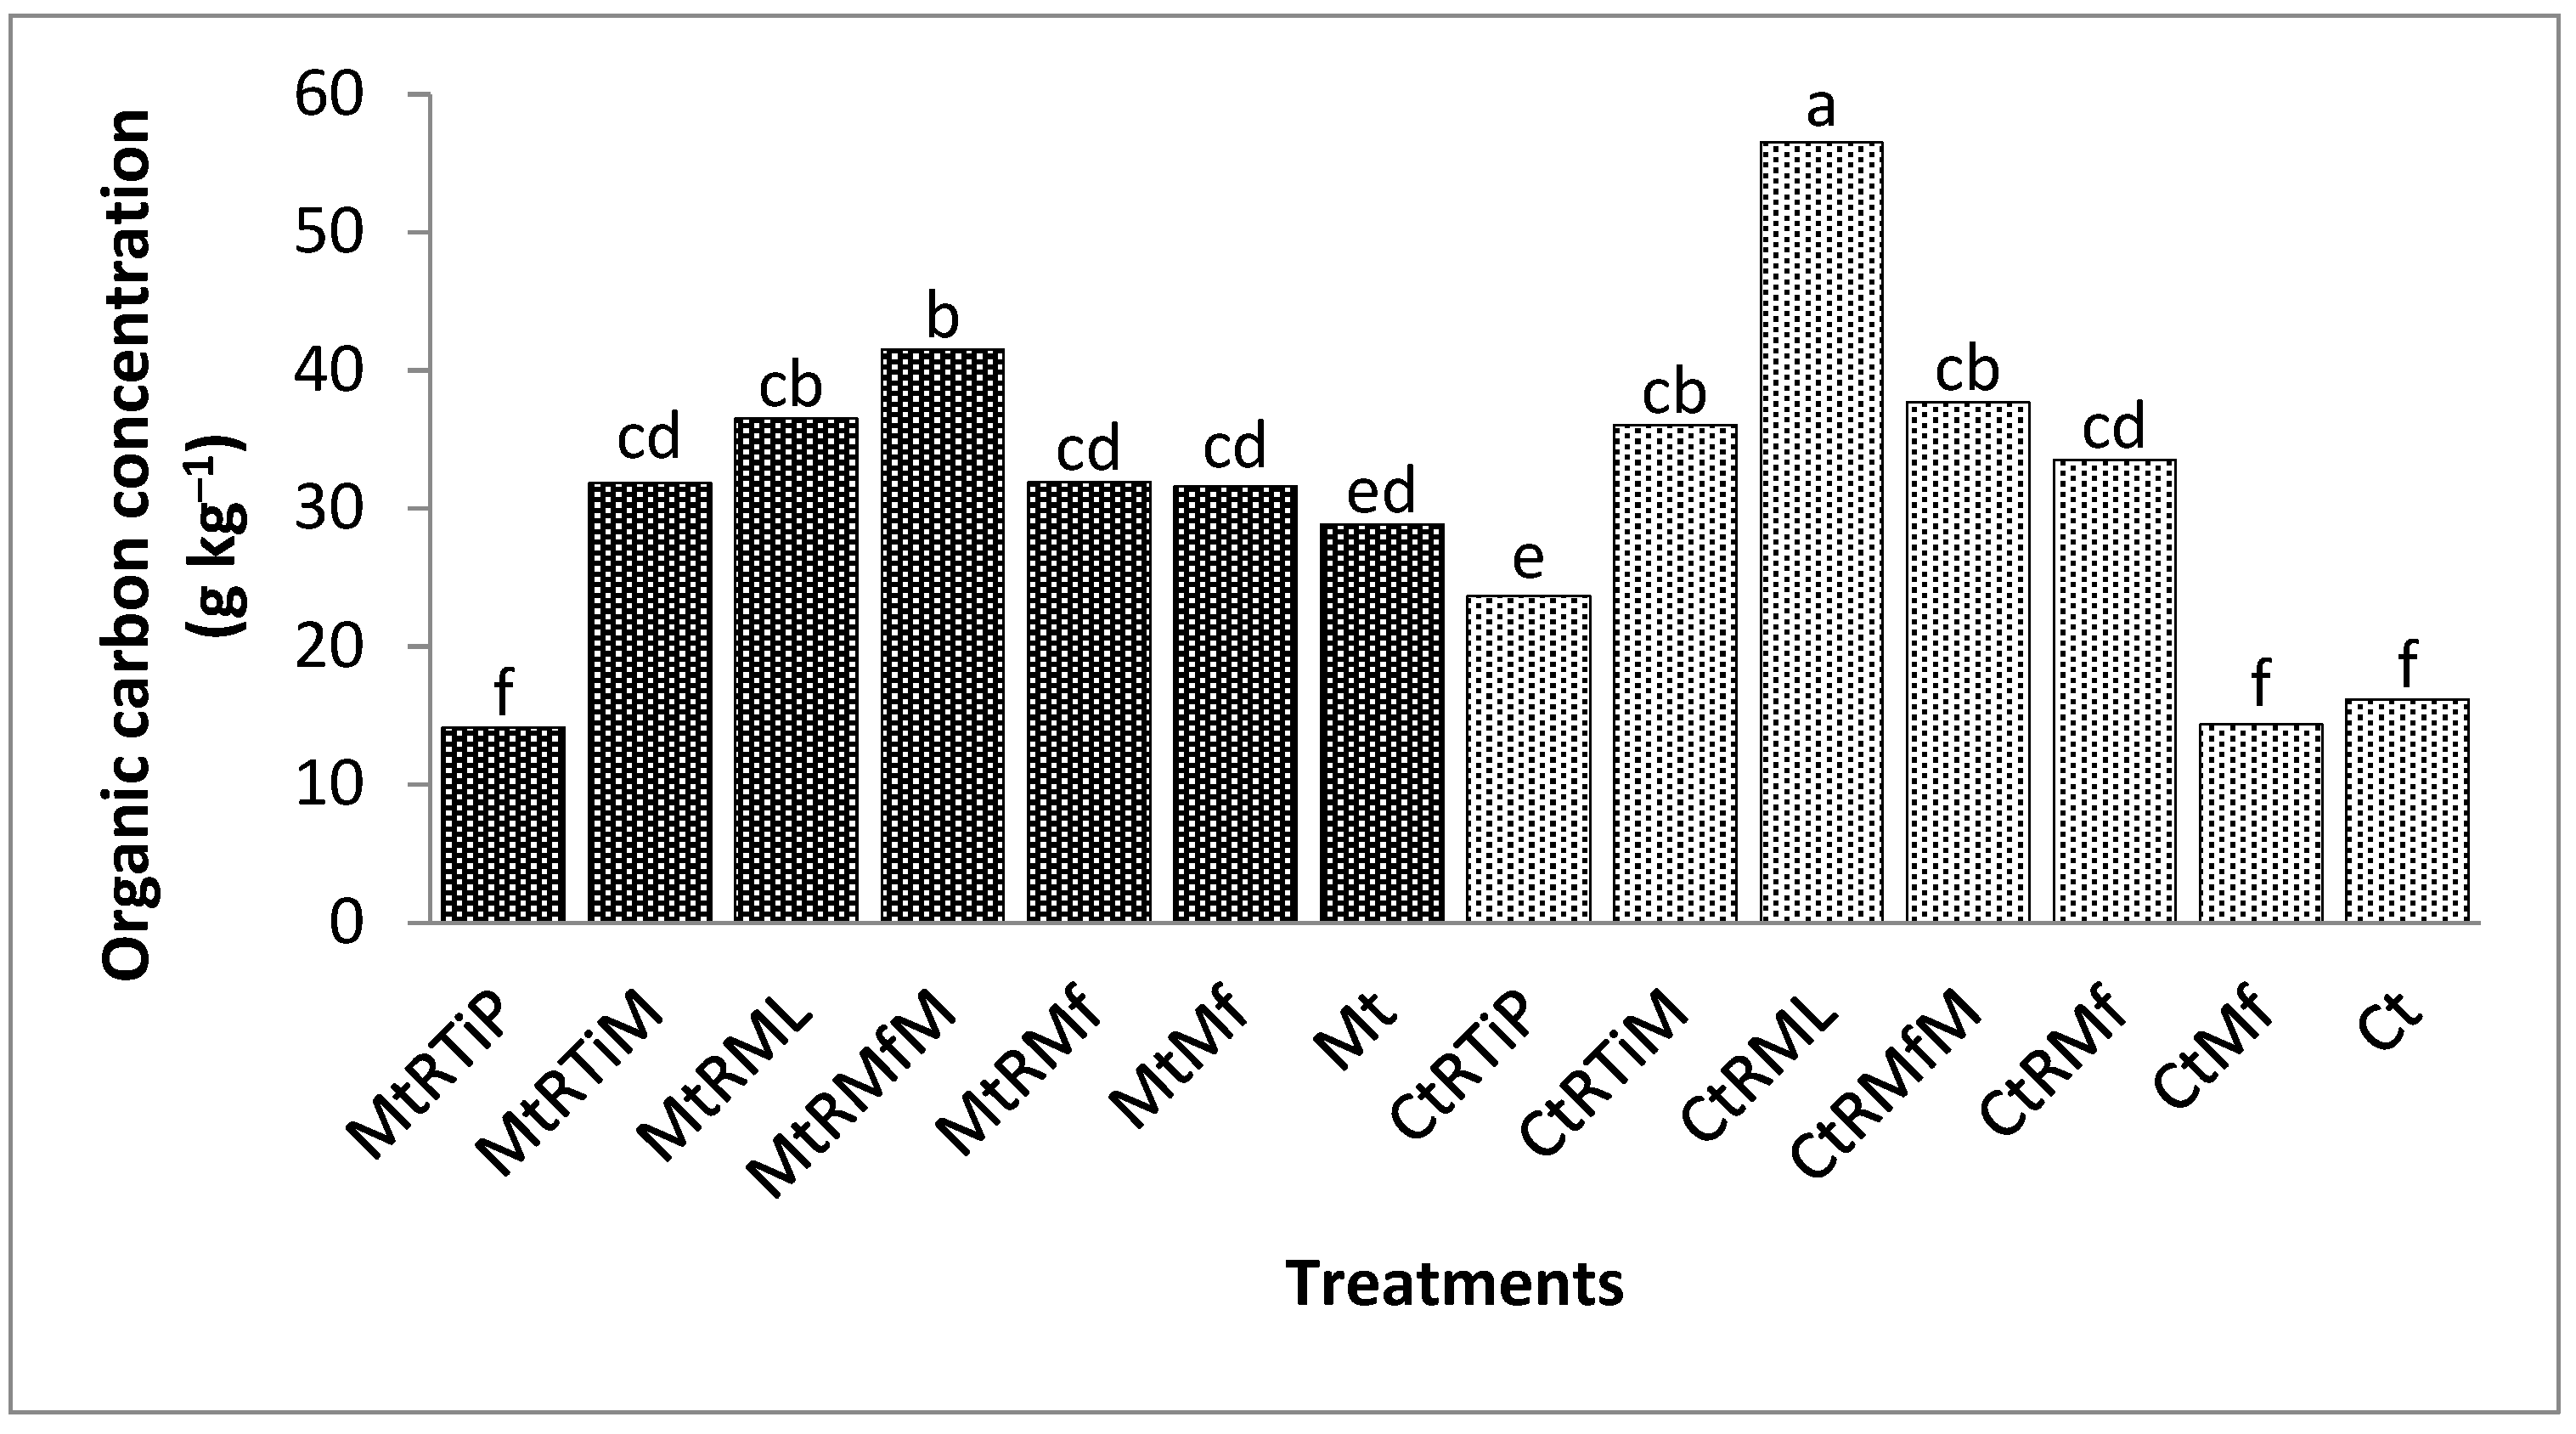
3.1.2. Organic Carbon Concentration in the 500 µm Fraction

Organic carbon concentration was significantly (p < 0.0001) higher under MtRML, MtRMf, CtRTiM, CtRML, and MtRTiM by 150, 124, 54, 42, and 33% compared with the control in the 500 µm fraction (Figure 2).

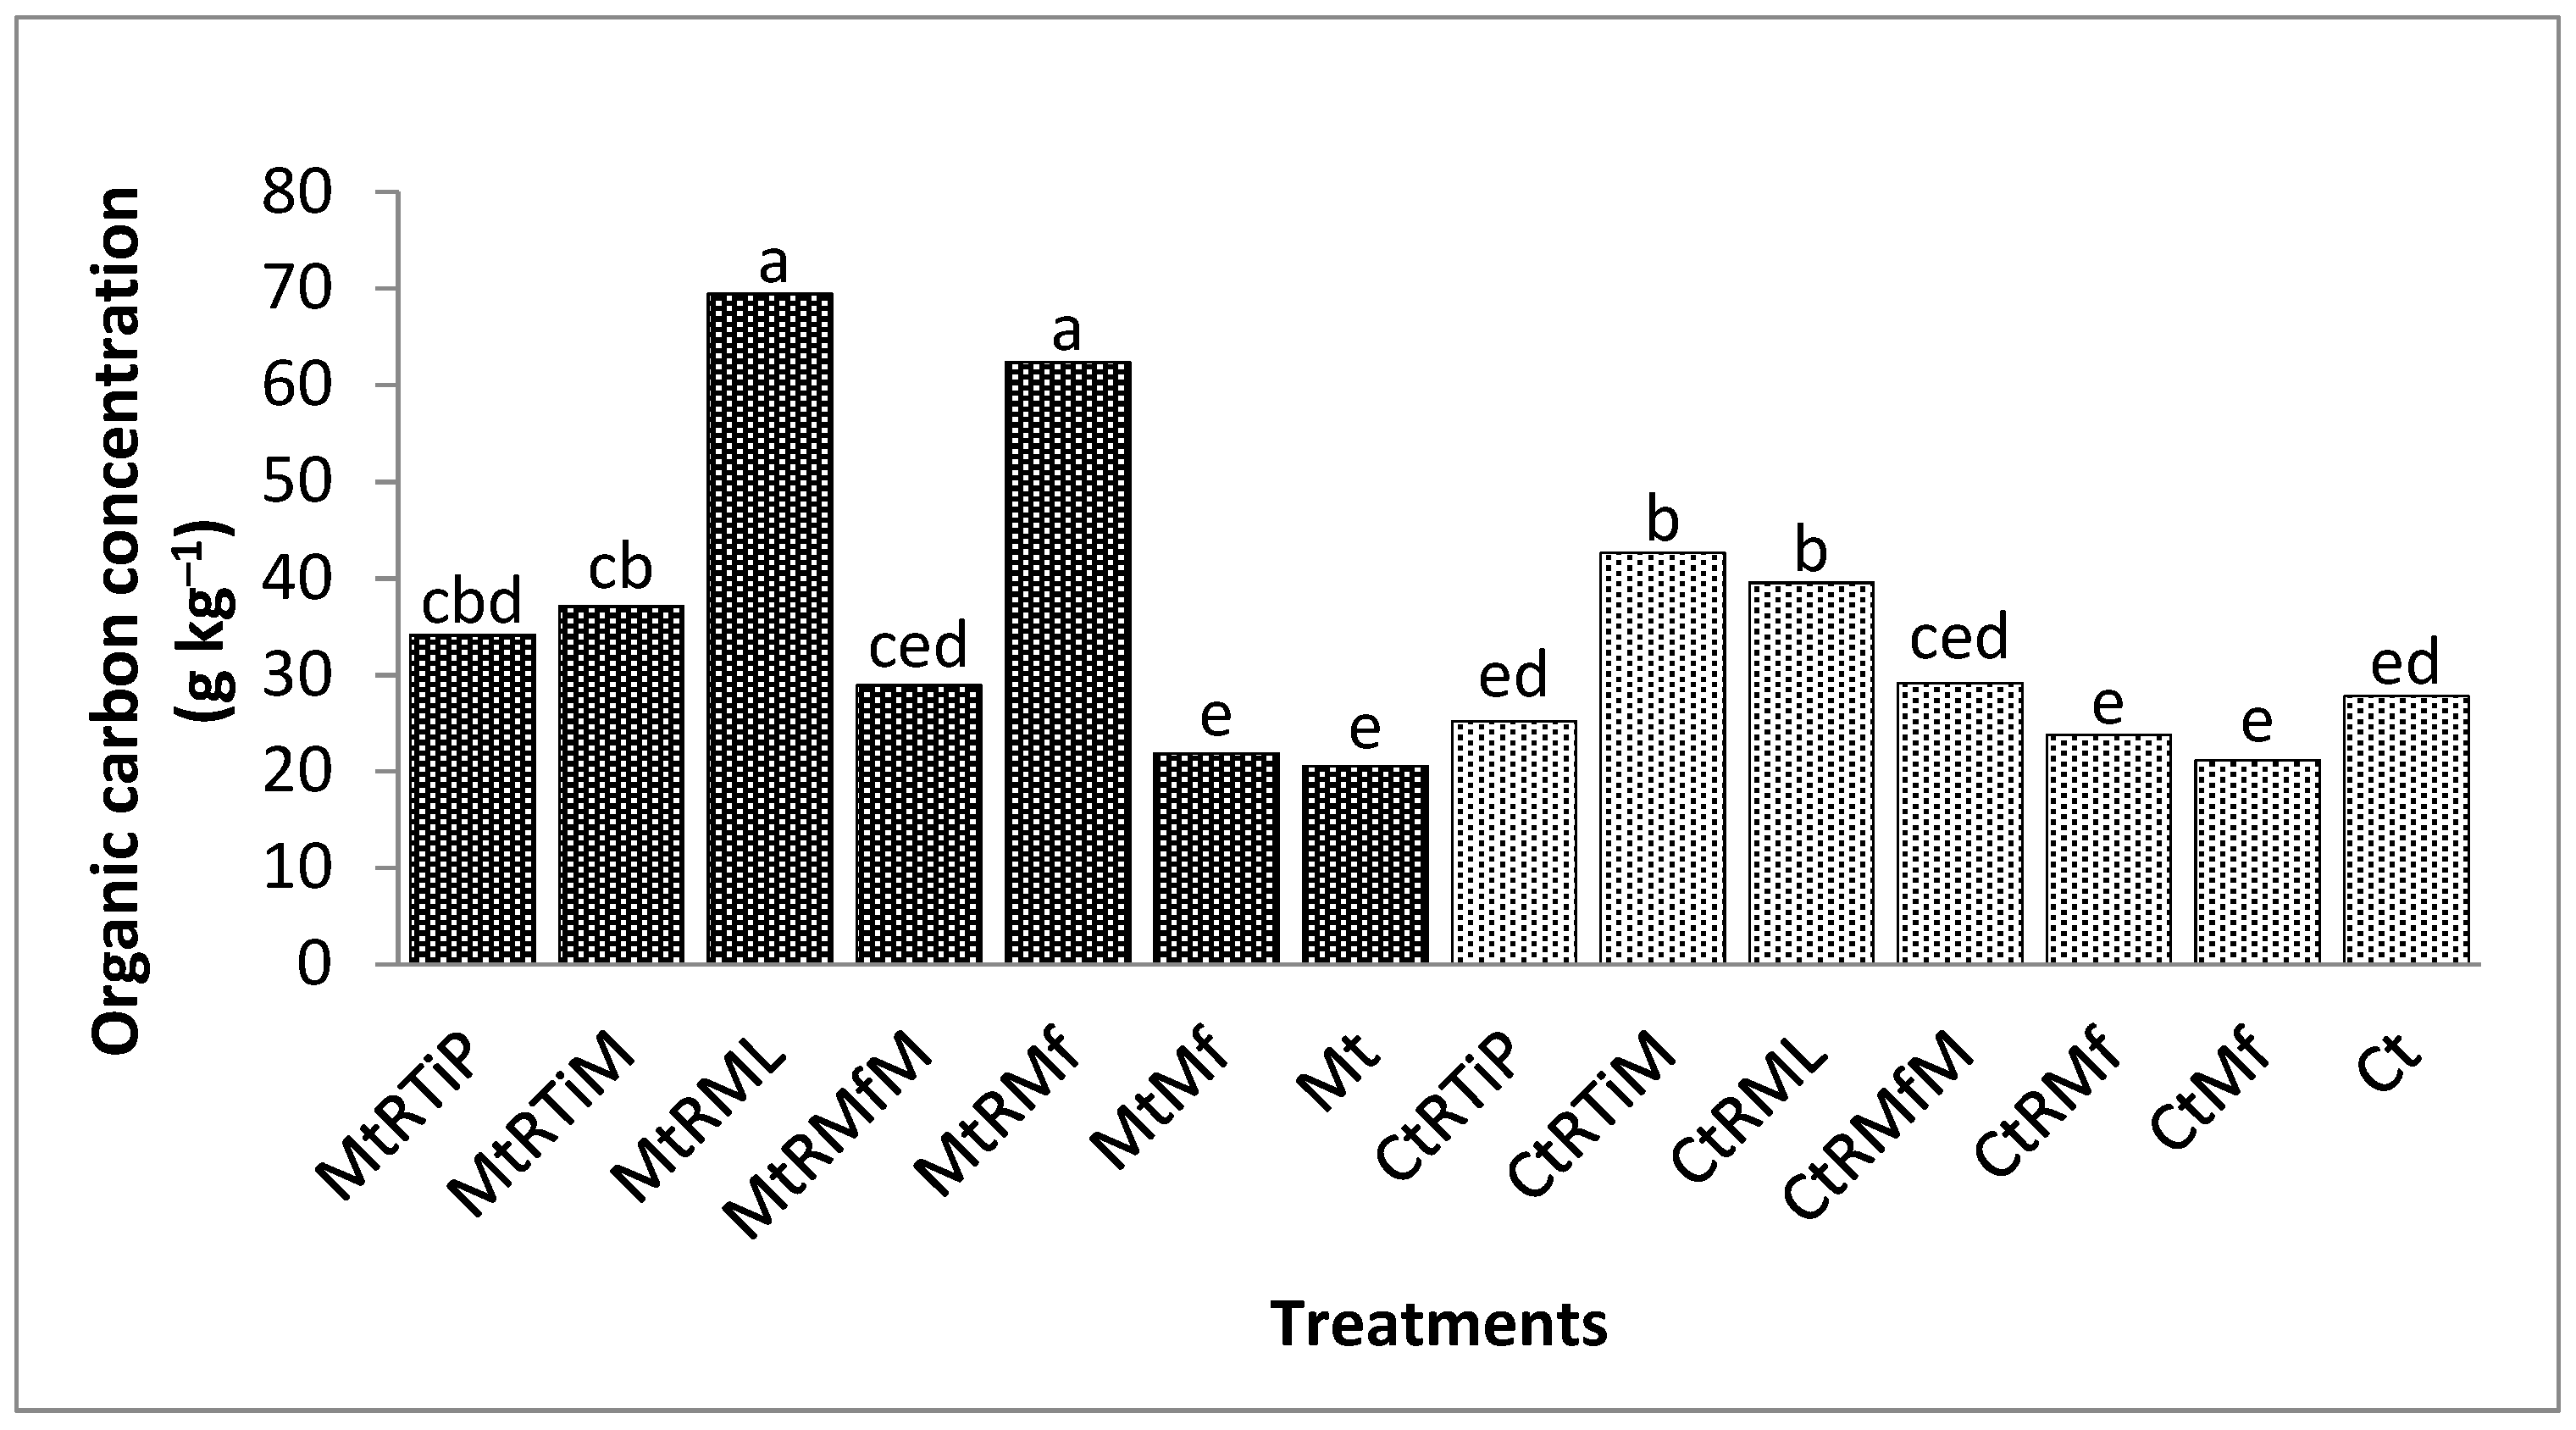
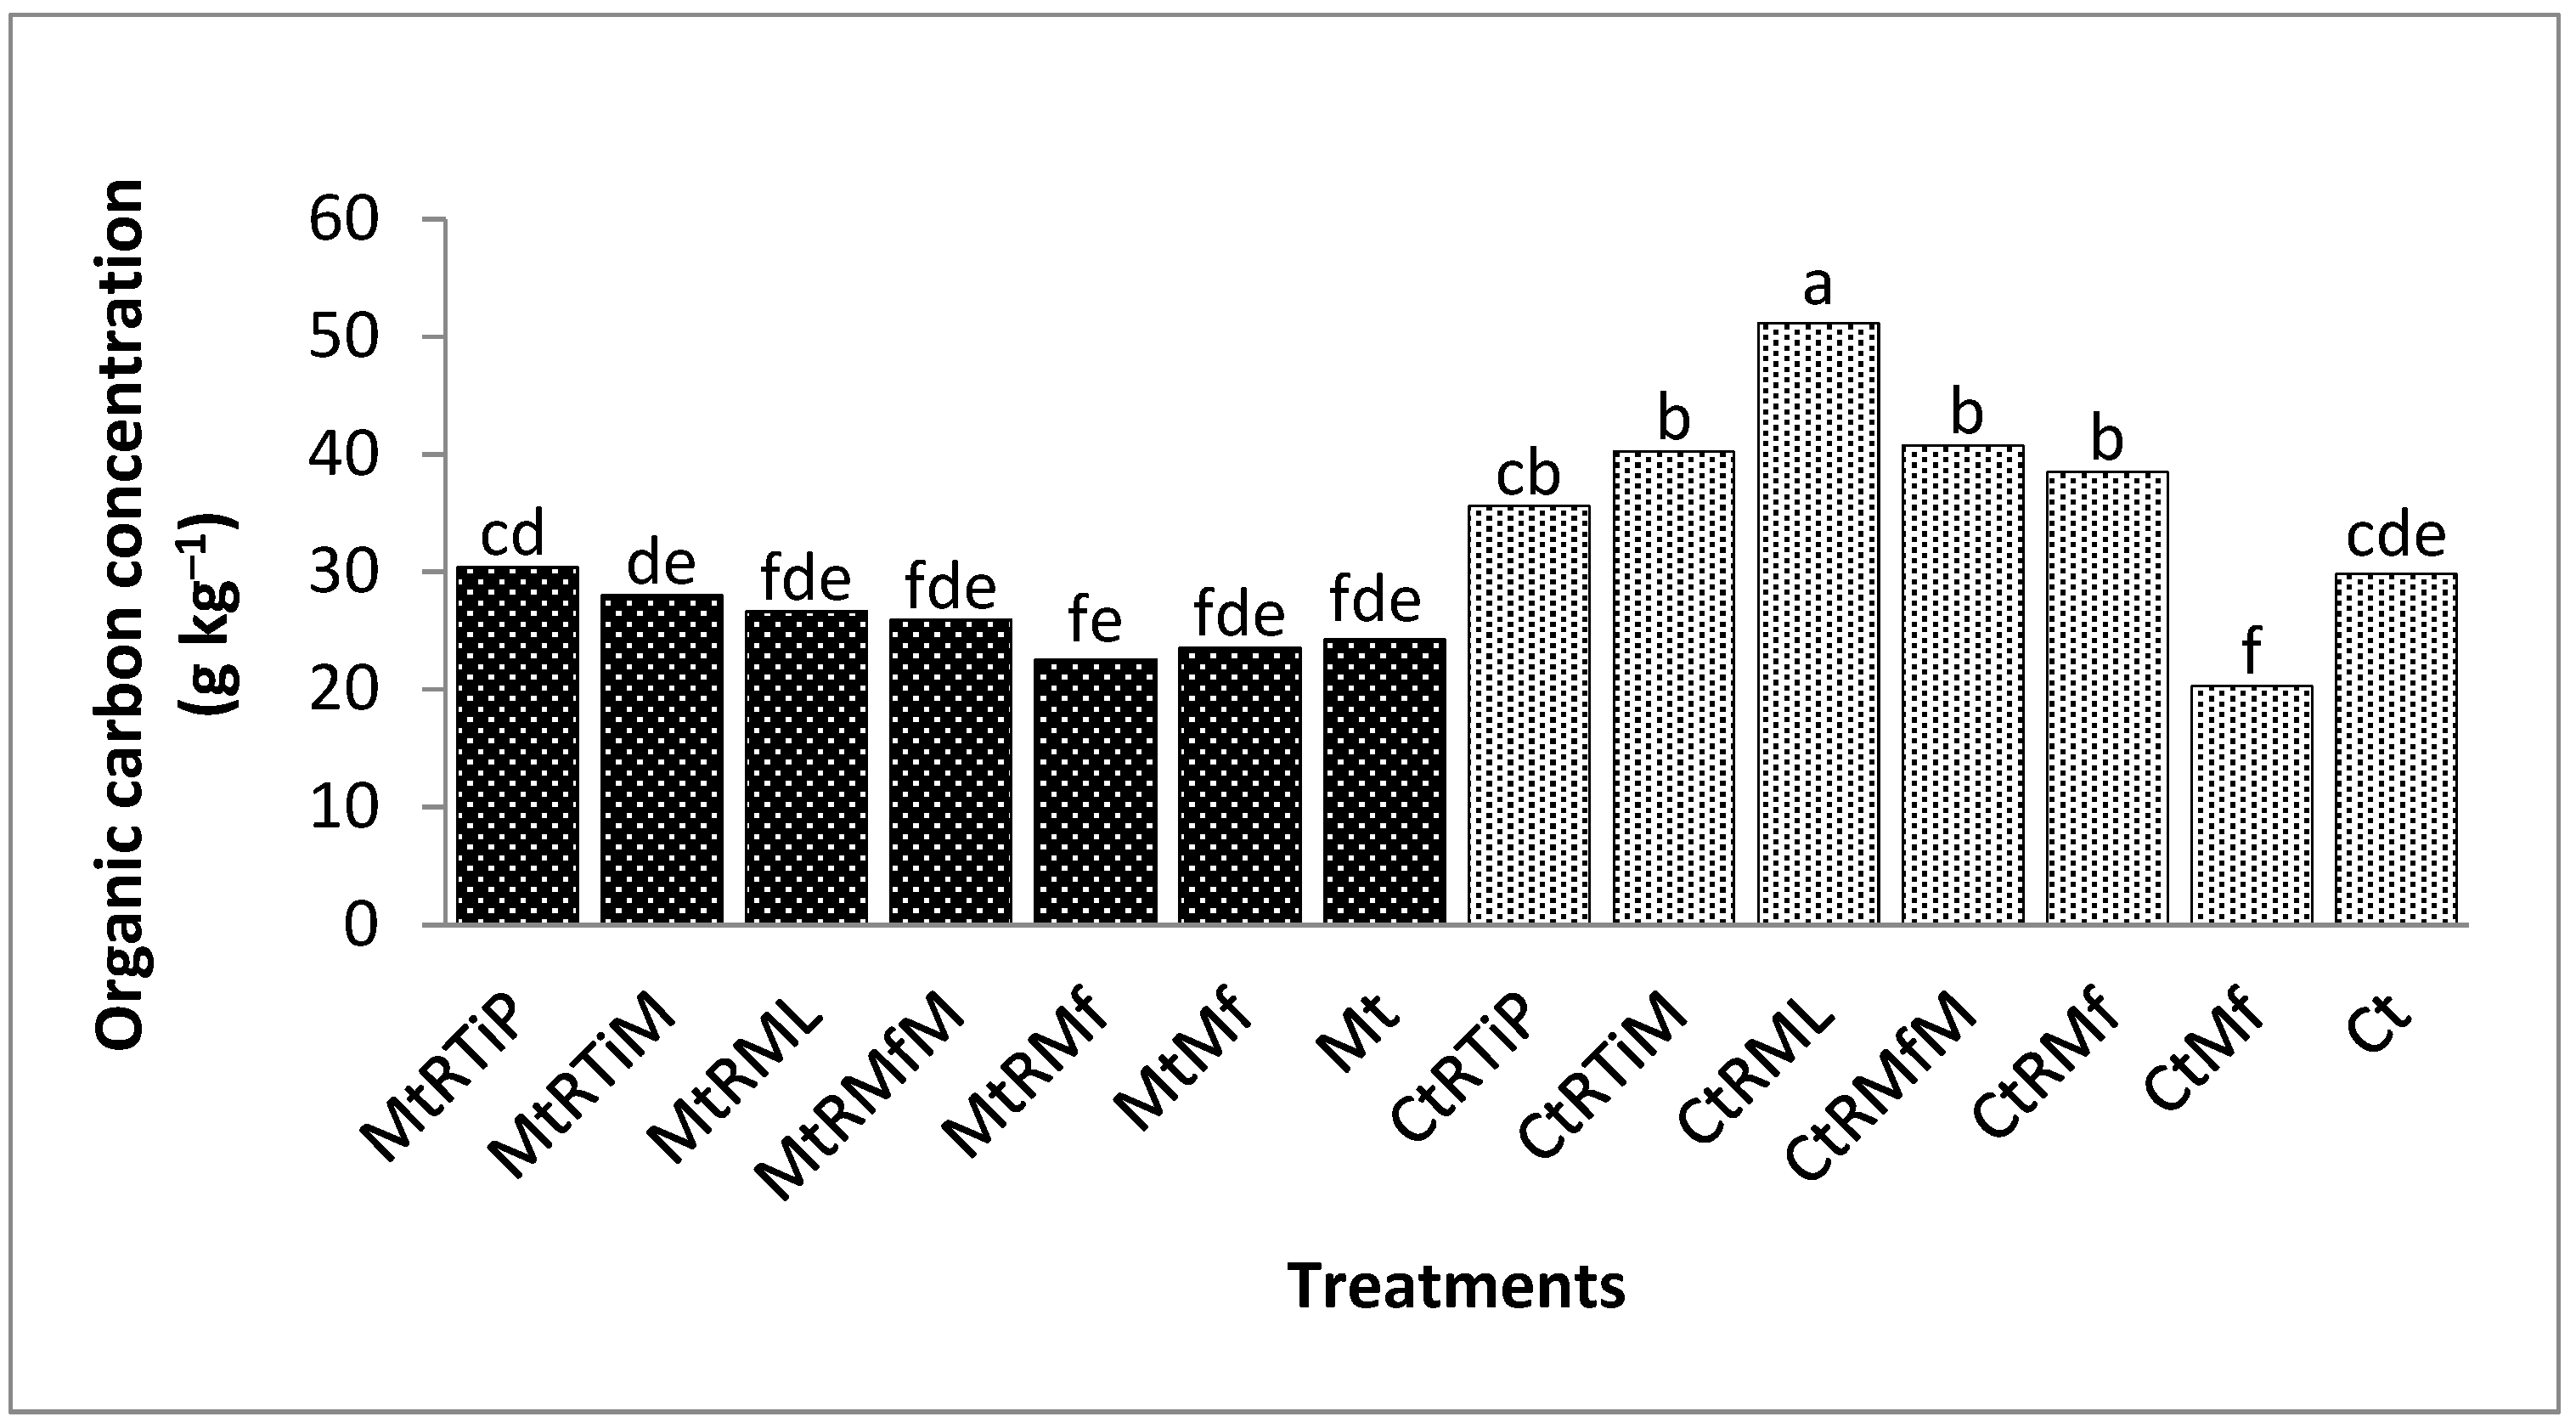
3.1.3. The Concentration of Organic Carbon in the 250 µm Fraction

In comparison with the control, the OC concentration was significantly higher (p < 0.0001) under CtRML, MtRMf, MtRML, MtRTiM, CtRMfM, and CtRTiM by 178, 156, 74, 58, 57, and 47%. The OC concentration was not significantly different between CtMf and the control in this fraction (Figure 3).

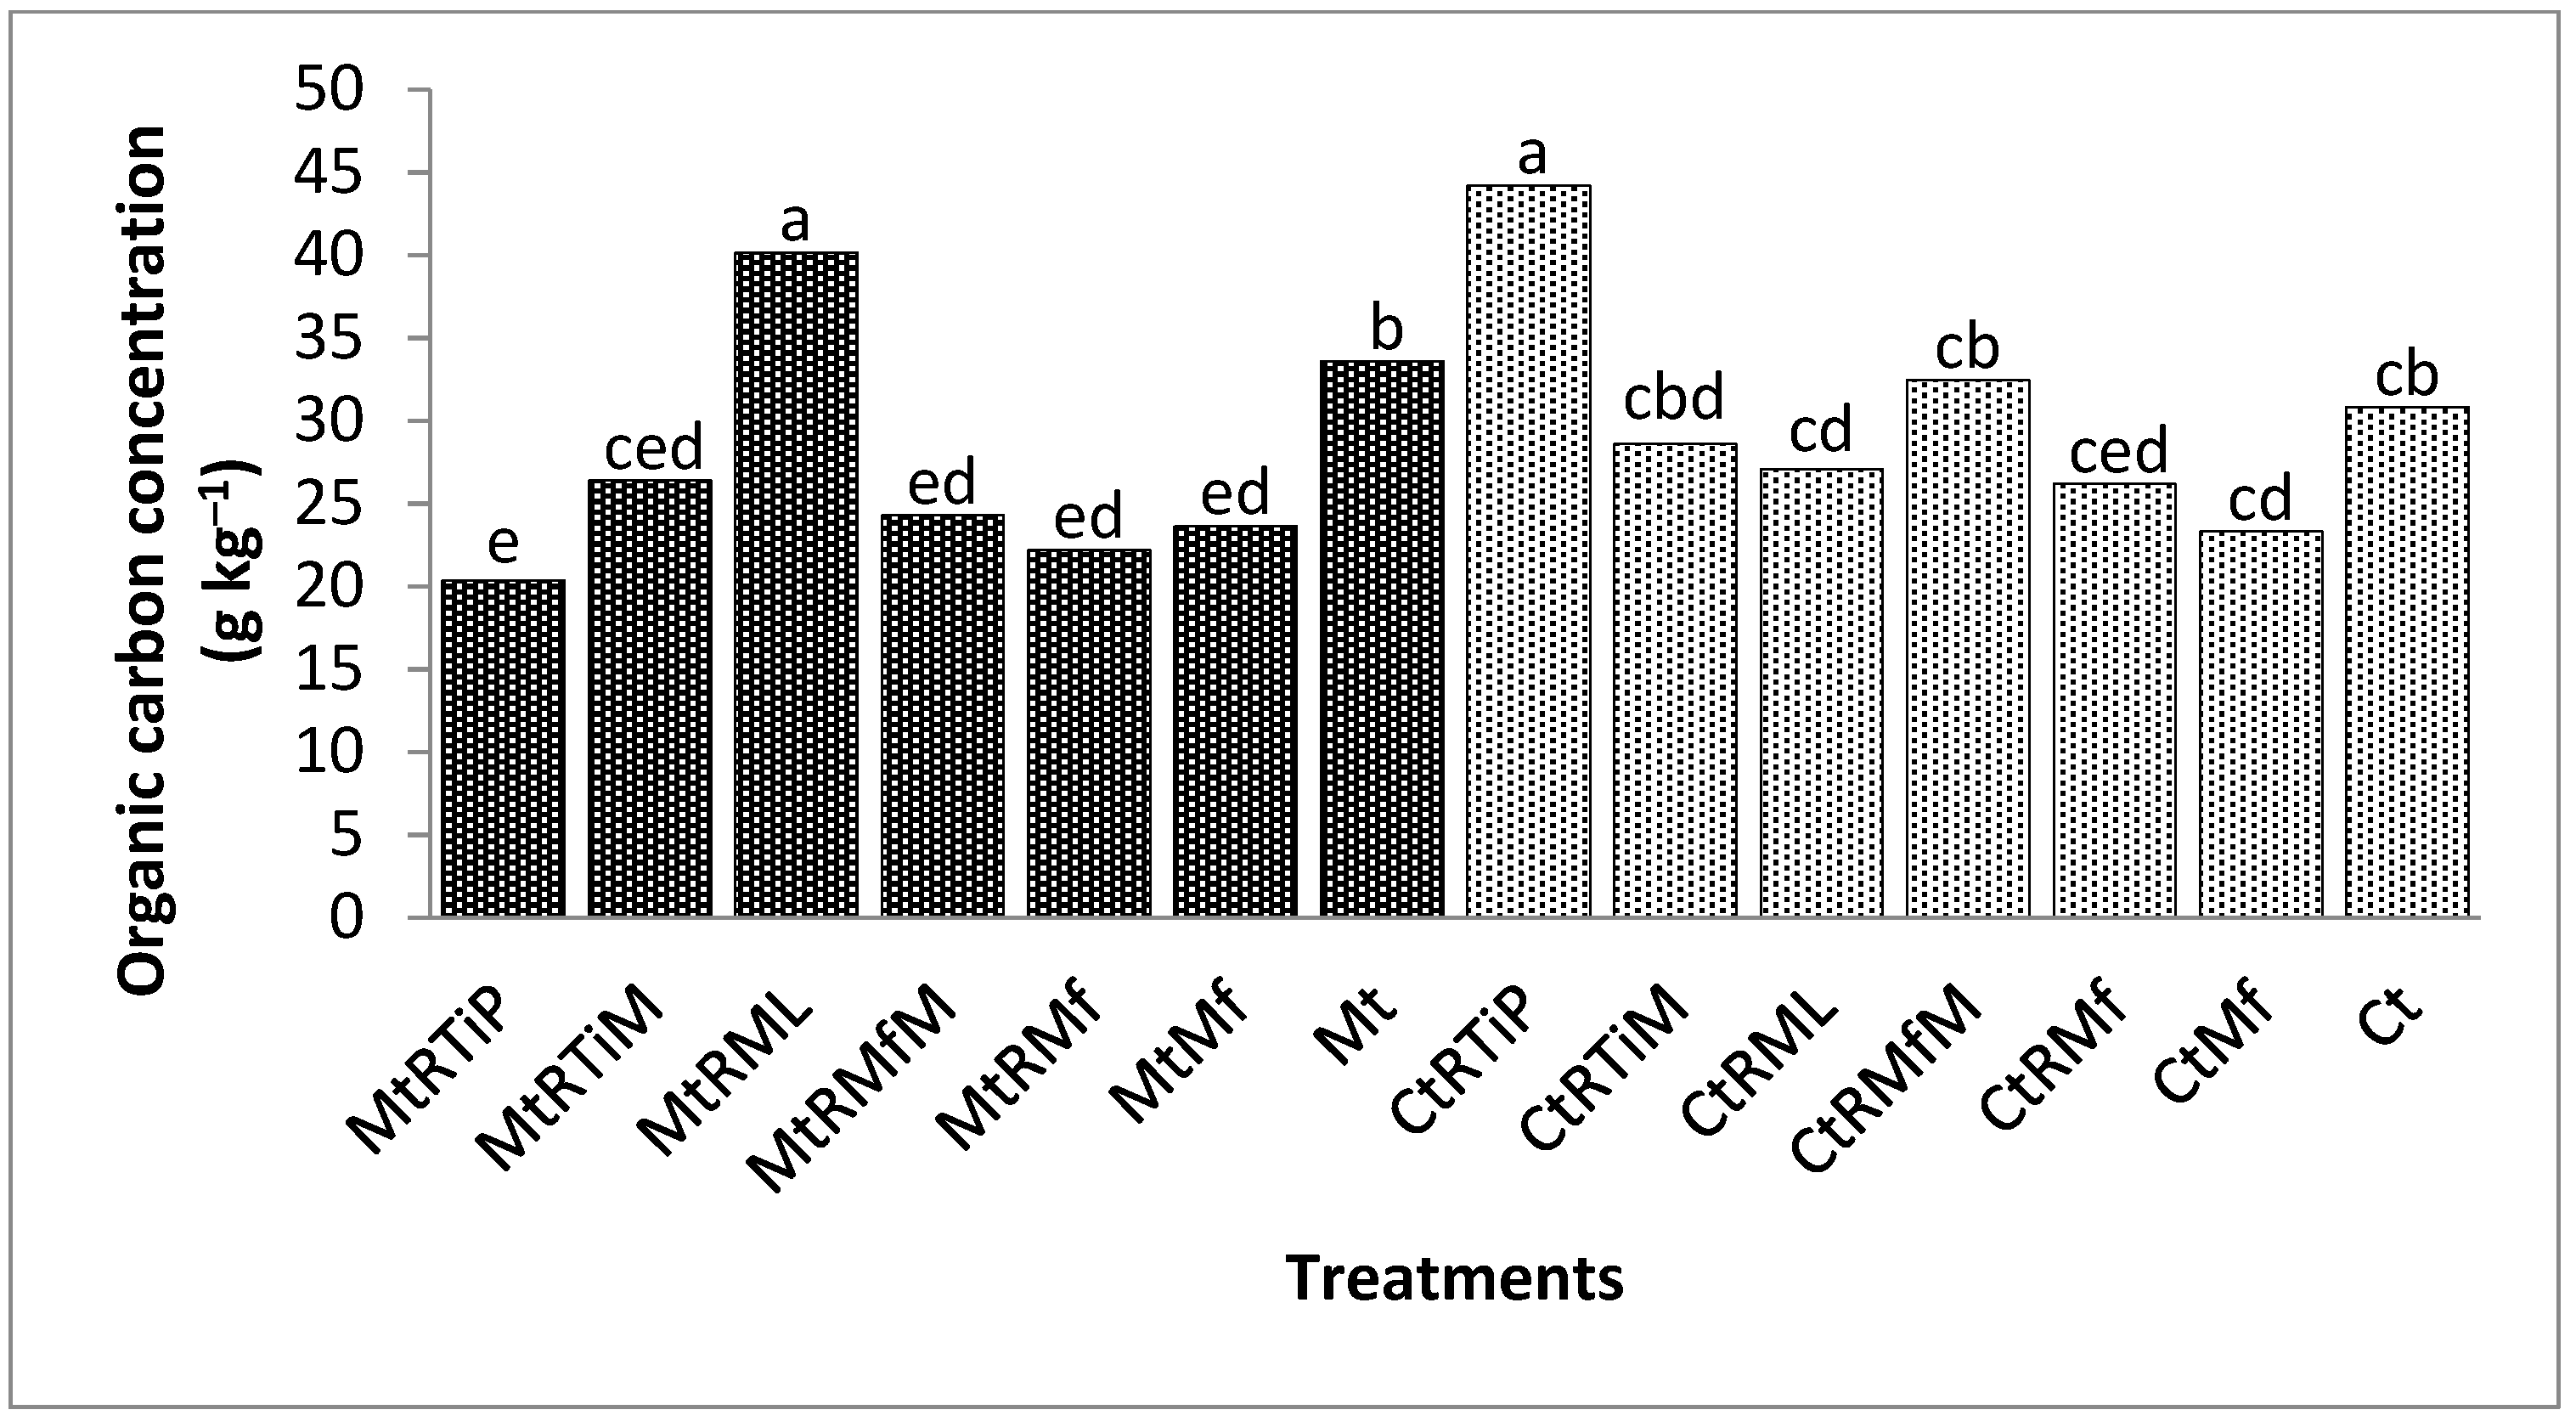
3.1.4. The Concentration of Organic Carbon in the 90 µm Fraction

The OC concentration was significantly (p < 0.0001) higher under CtRMfM, MtRTiM, and MtRMfM by 75, 42, and 40% compared with the control (Figure 4).

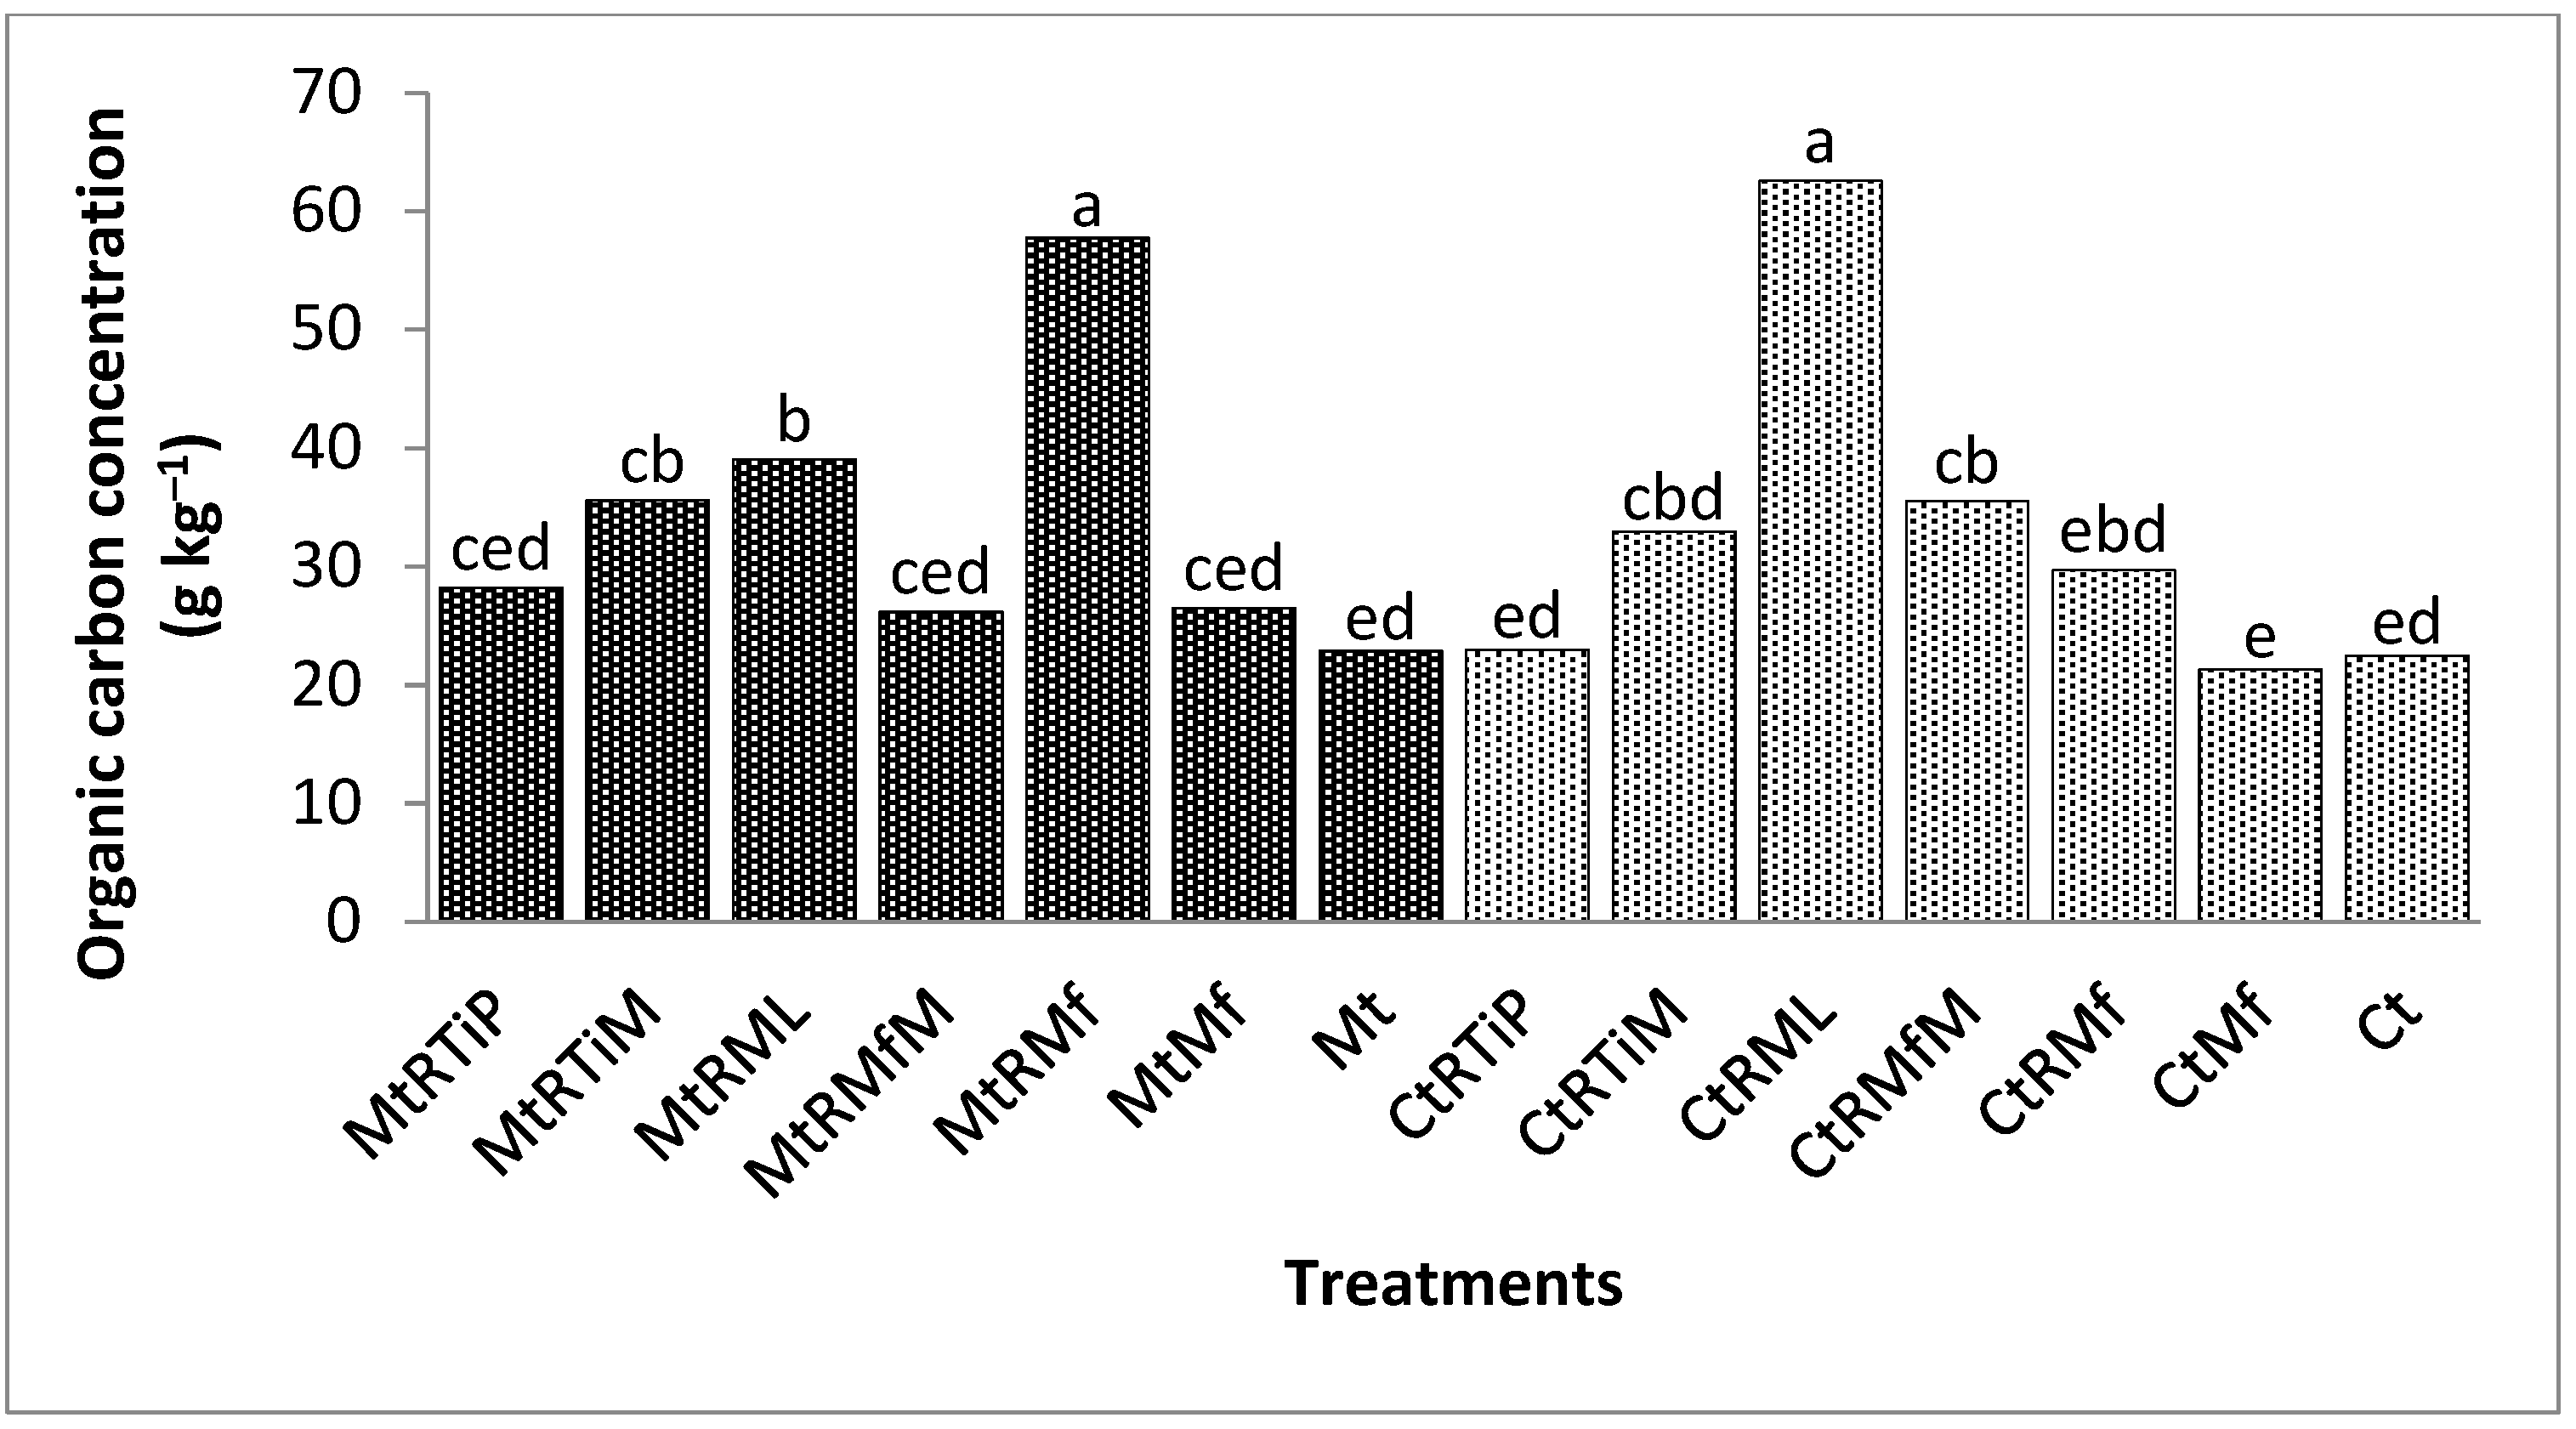
3.1.5. The Concentration of Organic Carbon in the 75 µm Fraction

The OC concentration was significantly higher (p < 0.0001) under MtRMfM, CtRML, CtRTiM, MtRTiP, MtRML, and MtRTiM by 49, 34, 33, 28, 26, and 22% compared with the control (Figure 5).
Soil management practices influence soil organic carbon concentration [52]. This corroborated our observations, whereby the amendments significantly influenced OC concentration in the different fractions. The OC concentration in CtRML treatment was high in 1.7 mm, 500 µm, 250 µm, and 75 µm while in MtRML treatment, it was high in 500 µm, 250 µm, and 75 µm fractions. We attributed this to the additional N from the legume intercrop (Dolichos lablab L.). This agreed with Cong et al. [53] who, in a 7 year study on intercropping, reported an increase in the root biomass that increased OC in a depth of 0–20 cm. However, our results were contrary to Rusinamhodzi et al.’s [54] findings in a 2 year study, which found no difference in OC amounts between sole and intercropping. These variations in the results among different studies may be due to the study period difference in Kiboi et al. [24], with longer study periods resulting in increased OC [55].
We found high OC concentration in 0–5 cm depth under MtRMfM in 1.7 mm, 90 µm, and 75 µm fractions and under CtRMfM treatment in 250 µm and 90 µm. We ascribed this to the combination of mineral fertilizer and organics. This is in line with a study by Brar et al. [56], indicating that when manure and fertilizer were added into the soil, it led to 5.07 g/kg of SOC compared to fertilizer alone (4.33 g/kg) in the 0–5 cm depth. This was attributed to the greater input of root and plant biomass and root exudates in the surface layer. Also, a combination of organics and fertilizer improves the amount of N in the soil. The applied inorganic N priming effect on fresh organic material stimulates the microbes resulting in SOM decomposition [56]. Sun et al. [57] also reported increased organic carbon (OC) levels in inorganic and organic inputs combination. According to Cotrufo et al. [58], a combination of inorganic and organic fertilizers allows for less carbon mineralization due to the formation of compounds resistant to microbial activity, leading to increased C storage.
The OC concentration in MtRTiM treatment was high in all the fractions, while under CtRTiM treatment, it was high in 500 µm, 250 µm, and 75 µm for samples from 0–5 cm depth. This may be a result of the sole use of organic inputs. High organic C input from manure with N from Tithonia diversifolia allows C retention in the soil [59]. Malhi et al.’s [60] study showed more C input through crop residues and animal manure application.
We observed that treatments that had manure increased OC in the 0–5 cm depth of soil and all fractions, and this was attributed to the manure providing C input to the soil. This is in line with a Liang et al. [61] study that reported that when manure was used as a management practice, the largest increase in SOC amounts was in the coarse fractions (2000 mm–250 µm) 123% and fine sand (250–53 µm) 101% compared to the unfertilized control in the 0 to 10 cm depth. The authors pointed to the fact that sand fractions were more sensitive to the inputs added to the soil affecting SOC’s amount. This could be due to the manure-derived organic matter, which was initially in the soil and found in the coarser fractions [30]. Also, manure’s use adds C sources, macro, and micronutrients to the soil, further increasing SOC [62]. Consequently, animal manure decomposes slowly due to its low nitrogen and high ash amounts, less likely to be mineralized rapidly.
The OC concentration in MtRTiP treatment was high in 1.7 mm and 75 µm fractions. Tithonia diversifolia green manure with a high decomposition rate provides nutrients to the soil, adds crop biomass, and indirectly surges C input in the soil [63]. Montemurro et al. [64] indicated that the use of green manure (e.g., Tithonia diversifolia) increases soil output, adds to C sequestration, and augments microbial biomass and enzyme activities. Green manure also decreases excessive P loading and salinization than manure application [65]. The addition of phosphate rock in the soil provided P, which increases root biomass, thus encouraging extensive exploitation of nutrients in the soil that indirectly increases C input.
Organic carbon concentration in MtRMf treatment was high in 500 µm and 250 µm fractions. Mulching using crop residues changes the soil environment by increasing microbial activities and improving nutrient availability and uptake [66]. This may be attributed to the residue decomposition rate, which is influenced by the mineral fraction interaction and the interaction of microorganisms with the added organic material [67]. The increase in OC concentration in the MtRMf treatment was in the coarse sand fraction. This is supported by Galantini et al. [68], who assert that the coarse sand fraction is influenced by soil use changes and management, especially in the first few centimeters. Further, Hao et al. [69] reported that adding crop residue leading to an accumulation of OM could considerably influence SOC amounts in the coarse soil particles. Consequently, SOC concentration in the coarse sand particle size indicates soil quality because of its positive effects on biophysical and chemical properties [70].

3.2. Organic Carbon Concentration in Soils Sampled at 5 to 15 cm Depth

3.2.1. The Concentration of Organic Carbon in the 1.7 mm Fraction

Compared with the control, OC concentration was significantly higher (p < 0.0001) under CtRTiM, MtRML, and CtRML by 426, 292, and 256% (Figure 6).

3.2.2. The Concentration of Organic Carbon in the 500 µm Fraction

Except for MtRTiP and CtMf treatments, OC concentration was significantly higher (p < 0.0001) in other treatments in comparison with the control (Figure 7).

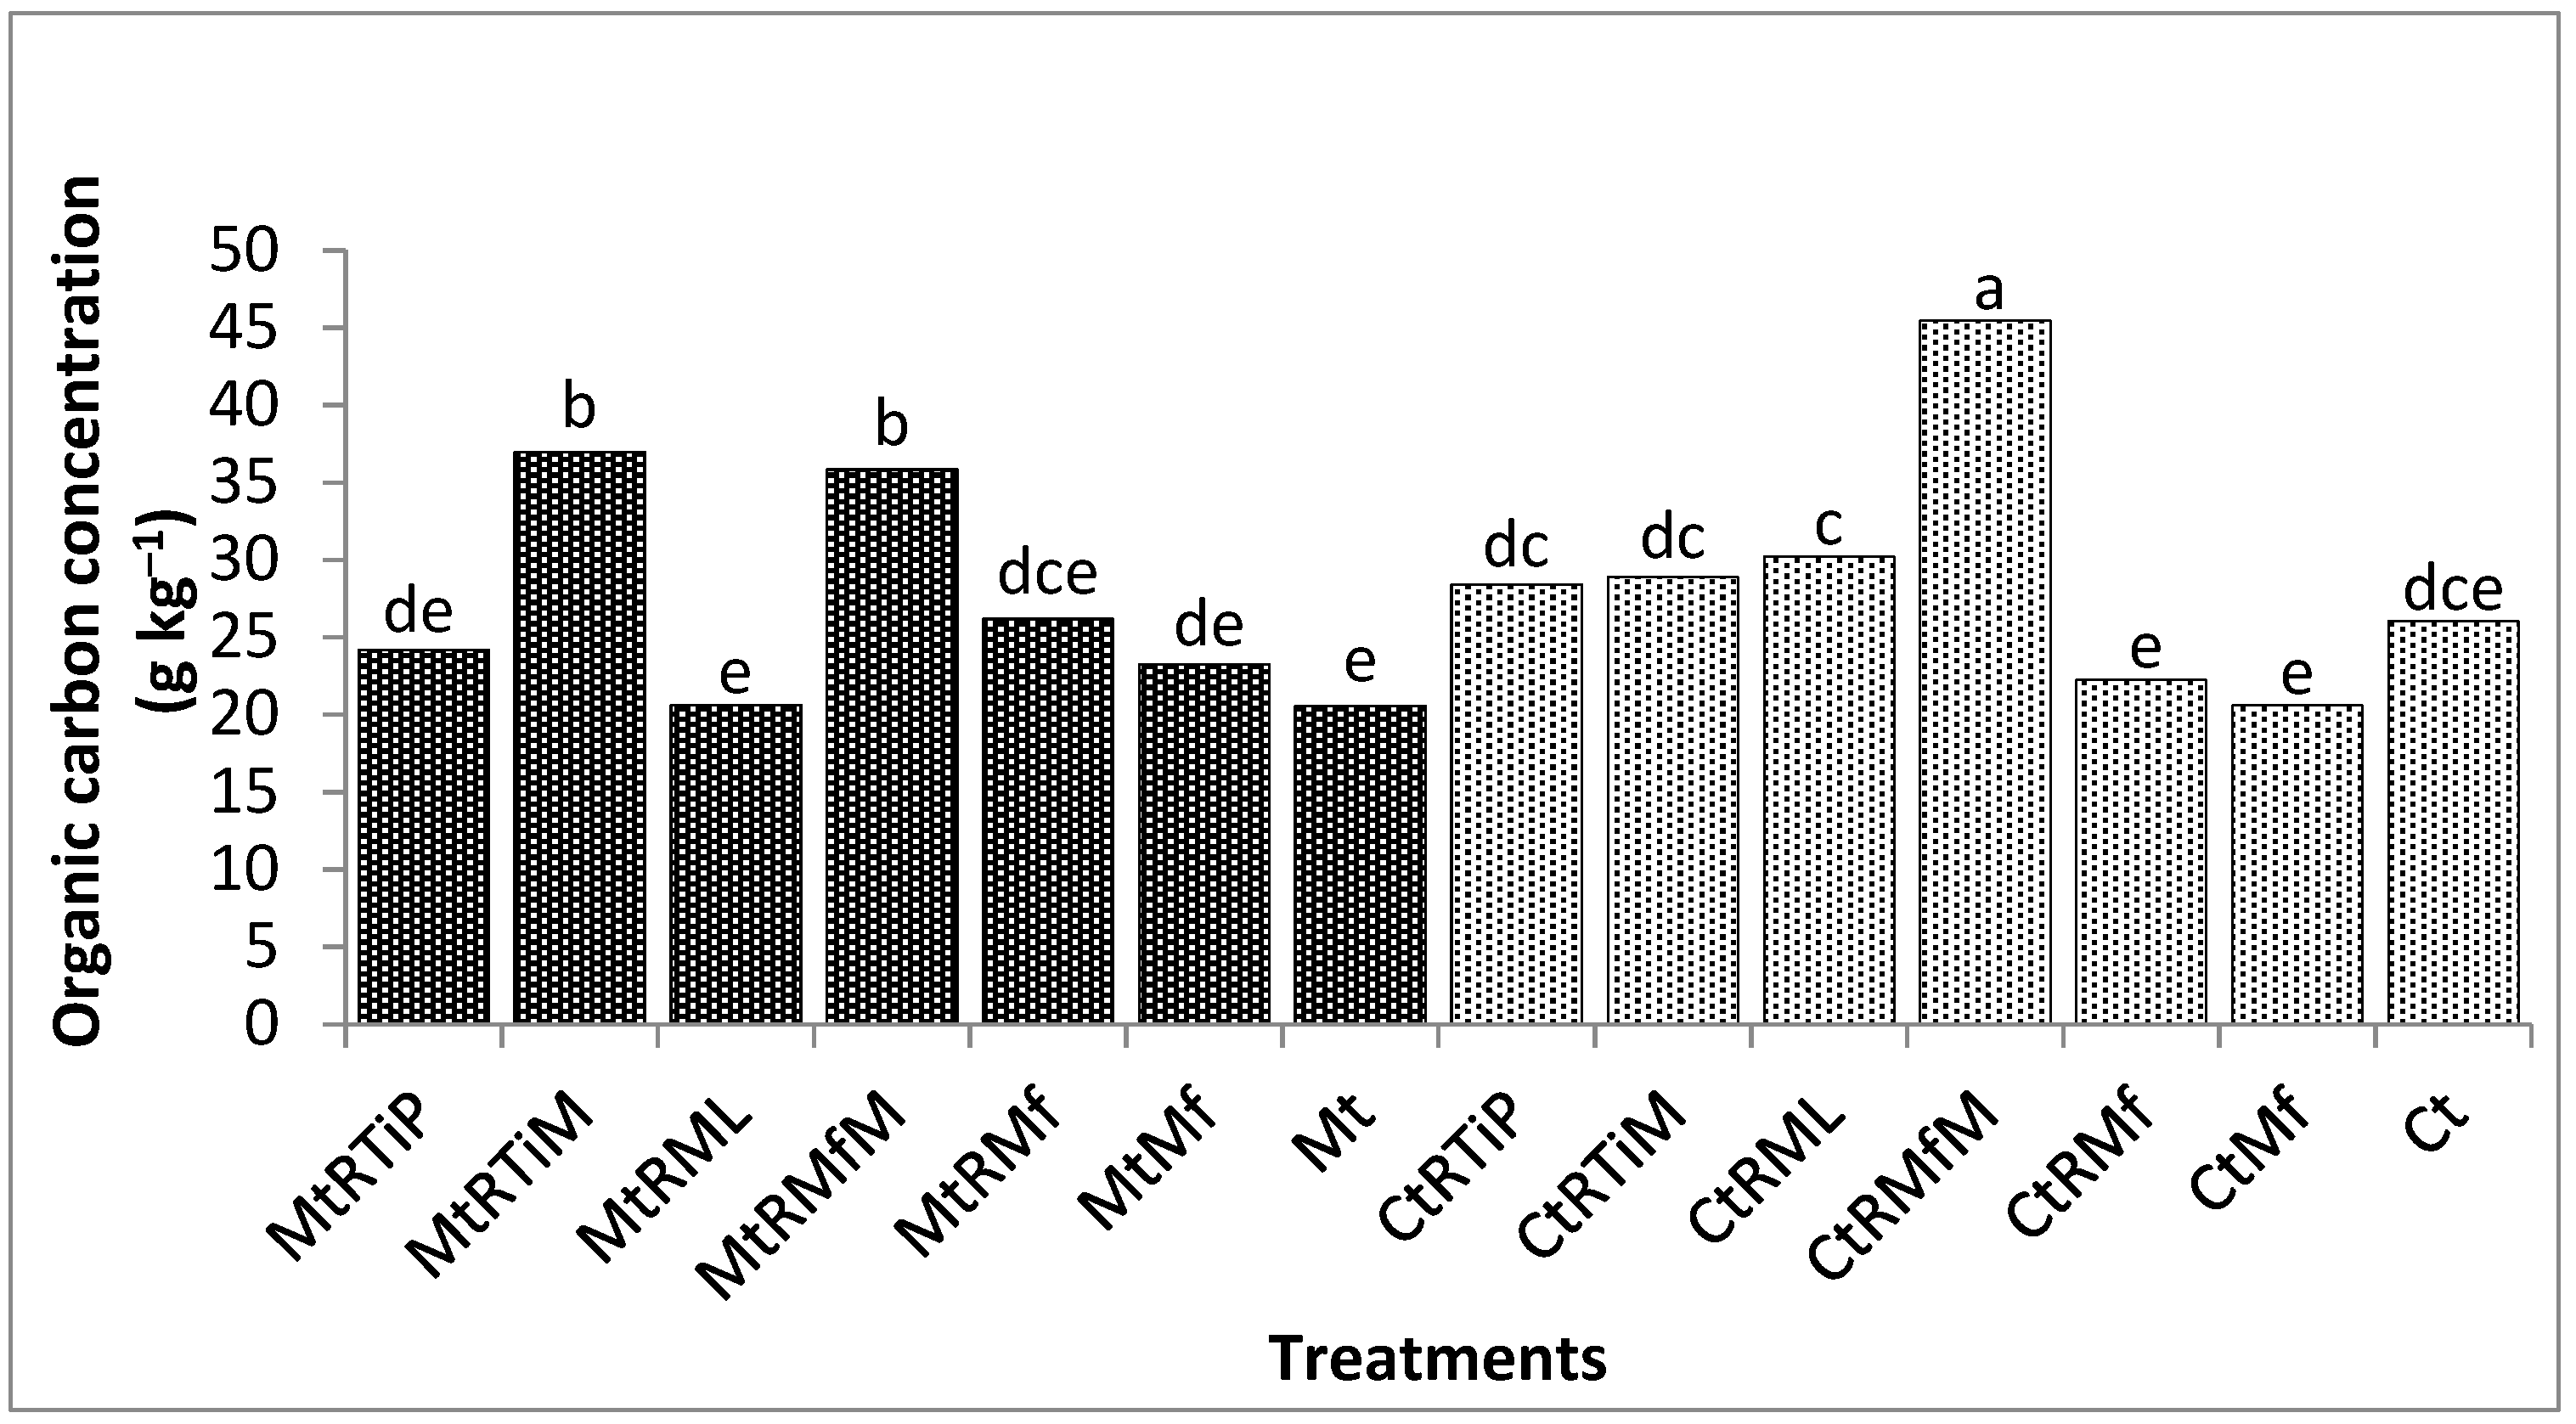
3.2.3. The Concentration of Organic Carbon in the 250 µm Fraction

The OC concentration was significantly (p < 0.0001) higher under CtRML, CtRMfM, CtRTiM, and CtRMf by 72, 37, 35, and 29% compared with the control (Figure 8).

3.2.4. The Concentration of Organic Carbon in the 90 µm Fraction

In comparison with the control, OC concentrations were significantly higher (p < 0.0001) in CtRTiP and MtRML treatments by 44 and 31% (Figure 9).

3.2.5. The Concentration of Organic Carbon in the 75 µm Fraction

The OC concentration was significantly (p < 0.0001) higher under MtRTiM, CtRML, and CtRMfM, by 267, 97, and 77% compared with the control (Figure 10).
The treatments significantly influenced OC concentration in the 5–15 cm depth. This was attributed to the root proliferation within this depth and C inputs from the O horizon, as Berhongaray et al. [71] observed. There could have been a higher microbial population at this depth, increasing microbial activity, which increases the decomposition of SOM, influencing the SOC amounts. In extension, the rhizosphere, where a significant amount of C accumulates Marinho et al. [72] as an increase in root biomass and exudates, provides substrates for organic matter decomposition.
From the soils sampled in 5–15 cm depth, OC concentration was higher in 1.7 mm, 500 µm, 250 µm, and 75 µm fractions in CtRML treatment, while in MtRML treatment, the OC concentration was higher in 1.7 mm, 500 µm, 90 µm, and 75 µm fractions. The incorporation of legume could have influenced the amount of OC as it provides readily degradable substrates that are decomposed by the soil microbes to allow for the release of cementing agents resulting in more stable fractions. Legumes also help in P uptake through the exudation of phosphatases and carboxylates in the rooting zone Li et al. [47], increasing soil C availability. Our findings concur with Margenot et al.’s [73] study, which reported that intercropping with legumes could potentially increase SOC. Further, Nyawade et al. [74] study indicated SOC content increase at a depth of 20 cm on sand fraction could be due to added biomass from the legume cropping system.
The OC concentration in CtRMfM and MtRMfM treatments was high in 500 µm, 250 µm (Figure 8 and Figure 9) and 500 µm and 75 µm (Figure 8 and Figure 10), respectively. This could be a result of the combination of the inorganic and organic resources that provided C input from organic sources. The inorganic fertilizer added N to the soil, stimulating root-derived soil C [75]. Ding et al. [76] observed that organic material directly influences soil mineralization rates by increasing soil C. Organic resources induced soil C inputs more than soil C loss. This agrees with Huang et al. [77], who showed that combining inorganic and organic nutrient sources improves coherence and harmonization between the availability of nutrients and plant improvement, especially in the rhizosphere. According to Mahmood et al. [78], the effects of soil inputs (organic and inorganic) on maize and their effect on soil properties in the first 20 cm of soil depth enhanced SOC. Yang et al. [79] showed a surge in SOC amounts when manure and mineral fertilizer were combined in the sand fractions (2000 mm–53 µm) at 0–20 cm depth. Analogous results by Tian et al. [80] showed that the addition of manure with mineral fertilizer added SOC content in the vulnerable fractions of the SOM, in our case, the sand fractions.
Further, manure with mineral fertilizers combination may result in a proliferation of roots E et al. [81] than under treatment without fertilization leading to increased soil C. Organic carbon concentration in CtRMf treatment was high in 500 µm and 250 µm while under MtRMf, it was high in the 500 µm fraction. This is reinforced by Kiboi et al. [24], who reported that combining mineral fertilizer and animal manure affected microbial activity positively. The authors attributed this to the addition of soil nutrients from the intricate interaction of inorganic fertilizer and organic inputs, consequently affecting the soil microbial activities.
In CtRTiM treatment, the OC concentration was high in 1.7 mm, 500 µm, and 250 µm whereas in MtRTiM treatment, it was high under 500 µm and 75 µm fractions. We attributed this to applying green manure and animal manure that allows for increased microbial activity due to the availability of microbial substrate from the organic material. Habte et al. [82] showed OC concentration in soil amended with Tithonia diversifolia increased from 1.14 to 1.45% in the 0–20 cm depth. According to Yao et al. [83], green manure enhanced the OC concentration by 14 to 24%. Adding organic amendments significantly increased SOC in the coarse sand fractions in the 0–20 cm depth [84,85]. The C inputs from the organic amendments may have provided the sand fractions with coarse particulate organic matter occluded within the aggregates, which added a new OM source. This new OM source may have augmented microbial activity in the coarse sand fraction [84].
The OC concentration in CtRTiP treatment was high in 500 µm and 90 µm fractions. The application of phosphate rock could have improved phosphorous efficiency by reducing its fixation resulting in increased competition for P-binding sites by organic anions [86]. This could have made P available for root growth, increasing C inputs in the soil through crop root biomass. For example, Endris [87] reported Tithonia diversifolia and phosphorus fertilizer combination made P available for root biomass growth, which increased crop biomass, consequently augmenting C input in soils. In the long term, SOC increase due to green manure application has been observed to be restricted to the 0 to 15 cm depth [88]. Gerzabek et al. [89] study on the effect of green manure and other organic amendments in particle-size fractions from topsoil (0–20 cm) concluded that in the sand-sized fractions, the SOC amounts originated from organic amendments.
Despite the significant influence on OC by the treatments in both depths, no effect was attributed to the tillage practices. This could be attributed to the experiment’s duration; as Sheehy et al. [36] indicated, reduced tillage did not affect OC after conducting their study for six years. Further, Paul et al. [90] study on medium-term reduced tillage influence on SOC amounts showed reduced tillage effect on OC in short-term experiments is site and soil specific. Li et al. [47] meta-analysis on reduced tillage showed despite diverse climate conditions and crop management; it added SOC by 6%. Several studies also supported our results: Sheehy et al. [36], Chessman et al. [91], and Hernández et al. [92] showed the potential to accumulate SOC under reduced tillage was limited. The SOC presence in different soil fractions is essential for ensuring nutrient availability across the soil profile. Organic matter plays a key role in nutrient retention and turnover, soil structure, moisture retention and availability, and carbon sequestration [15].

4. Conclusions

Our results showed that treatments with maize residues, goat manure, and legume intercrop (MtRML and CtRML) unswervingly increased OC content in the soil in most of the fractions in the sampled depths. This highlights the importance of organic inputs in improving and maintaining OC in the soil. The results further showed that SOC concentration was more significant near the surface and decreased with depth. This underscores the importance of maize residue retention on the soil’s surface. The application of animal manure significantly improved OC concentrations in all the studied treatments. Therefore, this study underpins the significance of animal manure in improving OC in the soil. The combination of organic and inorganic soil inputs in the study showed a significant increase in OC concentration. Therefore, there is a high probability of improving agricultural productivity by improving soil fertility through soil fertility management practices in sub-Saharan Africa. While reduced tillage has been encouraged as an agricultural management practice to enrich OC content in the soil, there was not much difference during the sampling time in the experimentation site. There is an unrelenting necessity to research the long-term influence of reduced tillage on SOC under integrated soil management practices in smallholder farming systems.

Author Contributions

Conceptualization, M.G. and M.K.; methodology, M.G., M.K., and F.K.N.; validation, C.M.; formal analysis, M.G. and F.K.N.; investigation, M.G., M.K., and F.K.N.; resources, F.K.N., A.M., and A.F.; data curation, M.G.; writing—original draft preparation, M.G. and F.K.N.; writing—review and editing, C.M., A.F., F.K.N., and A.M.; visualization, M.G. and F.K.N.; supervision, F.K.N., A.F., and M.K.; project administration, A.M. and M.K.; funding acquisition, A.F. All authors have read and agreed to the published version of the manuscript.

Funding

This research was funded by the Swiss Agency for Development and Cooperation (SDC) and the Swiss National Science Foundation (SNSF) in the Swiss Programme for Research on Global Issues for Development (r4d programme), Grant No. 400540-152224.

Institutional Review Board Statement

Not applicable.

Informed Consent Statement

Not applicable.

Data Availability Statement

Data is contained within the article.

Acknowledgments

We would like to thank the Research Institute of Organic Agriculture (FiBL), for the support through farmer-driven organic resource management to build soil fertility (ORM4Soil). We acknowledge Peter Wakaba, soil lab technologist from KALRO (Kenya Agricultural & Livestock Research Organization) Muguga, who helped in the laboratory analysis. We thank Kangutu Primary School in Tharaka-Nithi county for providing the experimental site. Thanks to the anonymous reviewers for their insightful contribution that helped shape this paper.

Conflicts of Interest

The authors declare no conflict of interest. The funders had no role in the design of the study; in the collection, analyses, or interpretation of data; in the writing of the manuscript, or in the decision to publish the results.

References

  1. Zingore, S.; Mutegi, J.; Agesa, B.; Tamene, L.; Kihara, J. Soil degradation in sub Saharan Africa and crop production options for soil rehabilitation. Better Crops 2015, 99, 24–26. [Google Scholar]
  2. Adekiya, A.O. Green manures and poultry feather effects on soil characteristics, growth, yield, and mineral contents of tomato. Sci. Hortic. 2019, 257, 108721. [Google Scholar] [CrossRef] [Green Version]
  3. Walter, A.; Chris, J.; Kadambot, H.M.S. Addressing the yield gap in rainfed crops: A review. Agron. Sustain. Dev. 2016, 36, 18. [Google Scholar]
  4. Anderson, W. Closing the gap between actual and potential yield of rainfed wheat. The impacts of environment, management and cultivar. Field Crop. Res. 2010, 116, 14–22. [Google Scholar] [CrossRef]
  5. Kanyenji, G.M.; Oluoch-Kosura, W.; Onyango, C.M.; Ng’Ang’A, S.K. Prospects and constraints in smallholder farmers’ adoption of multiple soil carbon enhancing practices in Western Kenya. Heliyon 2020, 6, e03226. [Google Scholar] [CrossRef] [PubMed]
  6. Cavanagh, C.J.; Chemarum, A.K.; Vedeld, P.O.; Petursson, J.G. Old wine, new bottles? Investigating the differential adoption of ‘climate-smart’ agricultural practices in western Kenya. J. Rural Stud. 2017, 56, 114–123. [Google Scholar] [CrossRef]
  7. Kibet, E.; Musafiri, C.M.; Kiboi, M.N.; Macharia, J.; Ng’Etich, O.K.; Kosgei, D.K.; Mulianga, B.; Okoti, M.; Zeila, A.; Ngetich, F.K. Soil Organic Carbon Stocks under Different Land Utilization Types in Western Kenya. Sustainability 2022, 14, 8267. [Google Scholar] [CrossRef]
  8. Zhao, D.; Eyre, J.X.; Wilkus, E.; de Voil, P.; Broad, I.; Rodriguez, D. 3D characterization of crop water use and the rooting system in field agronomic research. Comput. Electron. Agric. 2022, 202, 107409. [Google Scholar] [CrossRef]
  9. Zhao, D.; Li, N.; Zare, E.; Wang, J.; Triantafilis, J. Mapping cation exchange capacity using a quasi-3d joint inversion of EM38 and EM31 data. Soil Tillage Res. 2020, 200, 104618. [Google Scholar] [CrossRef]
  10. Githongo, M.; Kiboi, M.; Ngetich, F.; Musafiri, C.; Muriuki, A.; Fliessbach, A. The effect of minimum tillage and animal manure on maize yields and soil organic carbon in sub-Saharan Africa: A meta-analysis. Environ. Chall. 2021, 5, 100340. [Google Scholar] [CrossRef]
  11. Omenda, J.A.; Ngetich, K.F.; Kiboi, M.N.; Mucheru-Muna, M.W.; Mugendi, D.N. Soil organic carbon and acid phosphatase enzyme activity response to phosphate rock and organic inputs in acidic soils of central highlands of Kenya in maize. Int. J. Plant Soil Sci. 2019, 30, 1–13. [Google Scholar] [CrossRef] [Green Version]
  12. Ozlu, E.; Gozukara, G.; Acar, M.; Bilen, S.; Babur, E. Field-Scale Evaluation of the Soil Quality Index as Influenced by Dairy Manure and Inorganic Fertilizers. Sustainability 2022, 14, 7593. [Google Scholar] [CrossRef]
  13. Merante, P.; Dibari, C.; Ferrise, R.; Sánchez, B.; Iglesias, A.; Lesschen, J.P.; Kuikman, P.; Yeluripati, J.; Smith, P.; Bindi, M. Adopting soil organic carbon management practices in soils of varying quality: Implications and perspectives in Europe. Soil Tillage Res. 2017, 165, 95–106. [Google Scholar] [CrossRef] [Green Version]
  14. Tian, S.; Ning, T.; Wang, Y.; Liu, Z.; Li, G.; Li, Z.; Lal, R. Crop yield and soil carbon responses to tillage method changes in North China. Soil Tillage Res. 2016, 163, 207–213. [Google Scholar] [CrossRef]
  15. Guillaume, T.; Bragazza, L.; Levasseur, C.; Libohova, Z.; Sinaj, S. Long-term soil organic carbon dynamics in temperate cropland-grassland systems. Agric. Ecosyst. Environ. 2020, 305, 107184. [Google Scholar] [CrossRef]
  16. Chenu, C.; Angers, D.A.; Barré, P.; Derrien, D.; Arrouays, D.; Balesdent, J. Increasing organic stocks in agricultural soils: Knowledge gaps and potential innovations. Soil Tillage Res. 2019, 188, 41–52. [Google Scholar] [CrossRef]
  17. Jarecki, M.; Grant, B.; Smith, W.; Deen, B.; Drury, C.; VanderZaag Qian, A.; Yang B., J.; Wagner-Riddle, C. Long-term trends in corn yields and soil carbon under diversified crop rotations. J. Environ. Qual. 2018, 47, 635–643. [Google Scholar] [CrossRef] [Green Version]
  18. Cai, A.; Xu, H.; Shao, X.; Zhu, P.; Zhang, W.; Xu, M.; Murphy, D.V. Carbon and nitrogen mineralisation in relation to soil Particle-Size fractions after 32 years of chemical and manure application in a continuous cropping system. PLoS ONE 2016, 11, e0152521. [Google Scholar]
  19. Zhu, L.; Hu, N.; Zhang, Z.; Xu, J.; Tao, B.; Meng, Y. Short-term responses of soil organic carbon and carbon pool man-agement index to different annual straw return rates in a rice–wheat cropping system. Catena 2015, 135, 283–289. [Google Scholar] [CrossRef]
  20. Mwaura, G.; Kiboi, M.; Mugwe, J.; Nicolay, G.; Bett, E.; Muriuki, A.; Musafiri, C.; Ngetich, F. Economic evaluation and socioeconomic drivers influencing farmers’ perceptions on benefits of using organic inputs technologies in Upper Eastern Kenya. Environ. Chall. 2021, 5, 100282. [Google Scholar] [CrossRef]
  21. Otieno, E.; Kiboi, M.; Gian, N.; Muriuki, A.; Musafiri, C.; Ngetich, F. Uptake of integrated soil fertility management technologies in heterogeneous smallholder farms in sub-humid tropics. Environ. Chall. 2021, 5, 100394. [Google Scholar] [CrossRef]
  22. Bhattacharyya, S.S.; Kim, K.H.; Das, S.; Uchimiya, M.; Jeon, B.H.; Kwon, E.; Szulejko, J.E. A review on the role of organic inputs in maintaining the soil carbon pool of the terrestrial ecosystem. J. Environ. Manag. 2016, 167, 214–227. [Google Scholar] [CrossRef]
  23. Koishi, A.; Bragazza, L.; Maltas, A.; Guillaume, T.; Sinaj, S. Long-term effects of organic amendments on soil organic matter quantity and quality in conventional cropping systems in Switzerland. Agronomy 2020, 10, 1977. [Google Scholar] [CrossRef]
  24. Kiboi, M.N.; Ngetich, K.F.; Mugendi, D.N.; Muriuki, A.; Adamtey, N.; Fliessbach, A. Microbial biomass and acid phosphomonoesterase activity in soils of the Central Highlands of Kenya Geoderma Regional. Geoderma Reg. 2018, 15, e00193. [Google Scholar] [CrossRef]
  25. Haddaway, N.R.; Hedlund, K.; Jackson, L.E.; Kätterer, T.; Lugato, E.; Thomsen, I.K.; Jørgensen, H.B.; Isberg, P.-E. How does tillage intensity affect soil organic carbon? A systematic review. Environ. Évid. 2017, 6, 30. [Google Scholar] [CrossRef] [Green Version]
  26. Villamil, M.B.; Nafziger, E.D. Corn residues, tillage and nitrogen rate effects on soil properties. Soil Tillage Res. 2015, 151, 61–66. [Google Scholar] [CrossRef] [Green Version]
  27. Alhameid, A.; Ibrahim, M.; Kumar, S.; Sexton, P.; Schumacher, T. Soil Organic Carbon Changes Impacted by Crop Rotational Diversity under No-Till Farming in South Dakota, USA. Soil Sci. Soc. Am. J. 2017, 81, 868–877. [Google Scholar] [CrossRef]
  28. Bogužas, V.; Mikučionienė, R.; Šlepetienė, A.; Sinkevičienė, A.; Feiza, V.; Steponavičienė, V.; Adamavičienė, A. Long-term effect of tillage systems, straw and green manure combinations on soil organic matter. Zemdirb. -Agric. 2015, 102, 243–250. [Google Scholar] [CrossRef] [Green Version]
  29. Kabiri, V.; Raiesi, F.; Ghazavi, M.A. Six years of different tillage systems affected aggregate-associated SOM in a semi-arid loam soil from Central Iran. Soil Tillage Res. 2015, 154, 114–125. [Google Scholar] [CrossRef]
  30. Kirchmann, H.; Haberhauer, G.; Kandeler, E.; Sessitsch, A.; Gerzabek, M. Effects of level and quality of organic matter input on carbon storage and biological activity in soil: Synthesis of a long-term experiment. Glob. Biogeochem. Cycles 2004, 18, 38–46. [Google Scholar] [CrossRef]
  31. Jat, H.S.; Datta, A.; Sharma, P.C.; Kumar, V.; Yadav, A.K.; Choudhary, M.; Choudhary, V.; Gathala, M.K.; Sharma, D.K.; Jat, M.L.; et al. Assessing soil properties and nutrient availability under conservation agriculture practices in a reclaimed sodic soil in cereal-based systems of North-West India. Ach. Agron. Soil Sci. 2018, 64, 531–545. [Google Scholar] [CrossRef] [PubMed] [Green Version]
  32. Sanderman, J.; Creamer, C.; Baisden, W.T.; Farrell, M.; Fallon, S. Greater soil carbon stocks and faster turnover rates with increasing agricultural productivity. Soil 2017, 3, 1–16. [Google Scholar] [CrossRef] [Green Version]
  33. Ercoli, L.; Masoni, A.; Mariotti, M.; Pampana, S.; Pellegrino, E.; Arduini, I. Effect of preceding crop on the agronomic and economic performance of durum wheat in the transition from conventional to reduced tillage. Eur. J. Agron. 2016, 82, 125–133. [Google Scholar] [CrossRef]
  34. Ercoli, L.; Schüßler, A.; Arduini, I.; Pellegrino, E. Strong increase of durum wheat iron and zinc content by field-inoculation with arbuscular mycorrhizal fungi at different soil nitrogen availabilities. Plant Soil 2017, 419, 153–167. [Google Scholar] [CrossRef]
  35. Abdollahi, L.; Munkholm, L.J. Eleven Years’ effect of conservation practices for temperate sandy loams: II. Soil pore char-acteristics. J. Soil Sci. Ame. 2017, 81, 392–403. [Google Scholar] [CrossRef]
  36. Sheehy, J.; Regina, K.; Alakukku, L.; Six, J. Impact of no-till and reduced tillage on aggregation and aggregate-associated carbon in Northern European agro-ecosystems. Soil Tillage Res. 2015, 150, 107–113. [Google Scholar] [CrossRef]
  37. Kane, D.; Solutions, L. Carbon Sequestration Potential on Agricultural Lands: A Review of Current Science and Available Practices; National Sustainable Agriculture Coalition: Washington, DC, USA, 2015. [Google Scholar]
  38. Luo, Z.; Feng, W.; Luo, Y.; Baldock, J.; Wang, E. Soil organic carbon dynamics jointly controlled by climate, carbon inputs, soil properties and soil carbon fractions. Glob. Chang. Biol. 2017, 23, 4430–4439. [Google Scholar] [CrossRef]
  39. Prasad, J.V.N.S.; Rao, C.S.; Srinivas, K.; Jyothi, C.N.; Venkateswarlu, B.; Ramachandrappa, B.K.; Dhanapal, G.N.; Ravichandra, K.; Mishra, P.K. Effect of ten years of reduced tillage and recycling of organic matter on crop yields, soil organic carbon and its fractions in Alfisols of semiarid tropics of southern India. Soil Tillage Res. 2016, 156, 131–139. [Google Scholar] [CrossRef]
  40. Piazza, G.; Pellegrino, E.; Moscatelli, M.C.; Ercoli, L. Long-term conservation tillage and nitrogen fertilisation effects on soil aggregate distribution, nutrient stocks and enzymatic activities in bulk soil and occluded micro-aggregates. Soil Tillage Res. 2019, 196, 104482. [Google Scholar] [CrossRef]
  41. Musafiri, C.M.; Macharia, J.M.; Kiboi, M.N.; Ng’etich, O.K.; Shisanya, C.A.; Okeyo, J.M.; Mugendi, D.N.; Okwuosa, E.A.; Ngetich, F.K. Soil greenhouse gas fluxes from maize cropping system under different soil fertility management technologies in Ken-ya. Agric. Ecosyst. Environ. 2020, 301, 107064. [Google Scholar] [CrossRef]
  42. Bationo, A.; Kihara, J.; Vanlauwe, B.; Waswa, B.; Kimetu, J. Soil organic carbon dynamics, functions and management in West African agro-ecosystems. Agric. Syst. 2007, 94, 13–25. [Google Scholar] [CrossRef] [Green Version]
  43. Tittonell, P.; Corbeels, M.; van Wijk, M.T.; Vanlauwe, B.; Giller, K.E. Combining organic and mineral fertilisers for integrated soil fertility management in smallholder farming systems of Kenya: Explorations using the Crop-Soil model FIELD. J. Agron. 2007, 100, 1511–1526. [Google Scholar] [CrossRef]
  44. Jaetzold, R.; Schmidt, H.; Hornet, Z.B.; Shisanya, C.A. Natural Conditions and Farm Information. Eastern Province. In Farm Management Handbook of Kenya, 2nd ed.; Ministry of Agriculture/GTZ: Nairobi, Kenya, 2007; Volume 11. [Google Scholar]
  45. Fertilizer Use Recommendation Project (FURP). Description of First Priority Trial Site in the Various Districts; Embu District Kenya National Agricultural Research Laboratories: Nairobi, Kenya, 1987; Volume 24. [Google Scholar]
  46. Ngetich, K.F.; Diels, J.; Shisanya, C.A.; Mugwe, J.N.; Mucheru-Muna, M.; Mugendi, D.N. Effects of selected soil and water conservation techniques on runoff, sediment yield and productivity under sub-humid and semiarid conditions in Kenya. Catena 2014, 121, 288–296. [Google Scholar] [CrossRef]
  47. Li, L.; Tilman, D.; Lambers, H.; Zhang, F.S. Plant diversity and over yielding: Insights from belowground facilitation of in-tercropping in agriculture. New Phyt. 2014, 203, 63–69. [Google Scholar] [CrossRef]
  48. Fantappiè, M.; L’Abate, G.; Costantini, E.A.C. Factors influencing soil organic carbon stock variations in Italy during the last three decades. In Land Degradation and Desertification: Assessment, Mitigation and Remediation; Zdruli, P., Pagliai, M., Kapur, S., Cano, A.F., Eds.; Springer: New York, NY, USA, 2010; pp. 435–466. [Google Scholar]
  49. Farina, R.; Seddaiu, G.; Orsini, R.; Steglich, E.; Roggero, P.P.; Francaviglia, R. Soil carbon dynamics and crop productivity as influenced by climate change in a rainfed cereal system under contrasting tillage using EPIC. Soil Tillage Res. 2011, 112, 36–46. [Google Scholar] [CrossRef]
  50. Cambardella, C.A.; Elliott, E.T. Particulate Soil Organic-Matter Changes across a Grassland Cultivation Sequence. Soil Sci. Soc. Am. J. 1992, 56, 777–783. [Google Scholar] [CrossRef]
  51. Nelson, D.W.; Sommers, L.E. Total carbon, organic carbon, and organic matter. In Methods of Soil Analysis: Part 3 Chemical Methods, 5.3; Page, A.L., Miller, R.H., Keeney, D.R., Eds.; Soil Science Society of America, Inc.: Madison, WI, USA, 1996. [Google Scholar]
  52. Yang, F.; Jing Tian, J.; Meersmans, J.; Fang, H.; Yang, H.; Lou, Y.; Li, Z.; Liu, K.; Yi Zhou, Y.; Blagodatskaya, E.; et al. Functional soil organic matter fractions in response to long-term fertilisation in upland and paddy systems in South China. Catena 2018, 162, 270–277. [Google Scholar] [CrossRef] [Green Version]
  53. Cong, W.-F.; Hoffland, E.; Li, L.; Six, J.; Sun, J.-H.; Bao, X.-G.; Zhang, F.-S.; Van Der Werf, W. Intercropping enhances soil carbon and nitrogen. Glob. Chang. Biol. 2015, 21, 1715–1726. [Google Scholar] [CrossRef]
  54. Rusinamhodzi, L.; Murwira, H.K.; Nyamangara, J. Effect of cotton—cowpea intercropping on C and N mineralisation patterns of residue mixtures and soil. Soil Res. 2009, 47, 190–197. [Google Scholar] [CrossRef]
  55. Cong, W.-F.; Van Ruijven, J.; Mommer, L.; De Deyn, G.; Berendse, F.; Hoffland, E. Data from: Plant species richness promotes soil carbon and nitrogen stocks in grasslands without legumes. J. Ecol. 2014, 102, 1163–1170. [Google Scholar] [CrossRef]
  56. Brar, B.S.; Singh, K.; Dheri, G.S.; Kumar, B. Carbon sequestration and soil carbon pools in a rice–wheat cropping system: Effect of long-term use of inorganic fertilisers and organic manure. Soil Tillage Res. 2013, 128, 30–36. [Google Scholar] [CrossRef]
  57. Sun, Y.; Huang, S.; Yu, X.; Zhang, W. Stability and saturation of soil organic carbon in rice fields: Evidence from a long-term fertilisation experiment in subtropical China. J. Soils. Sediments 2013, 13, 1327–1334. [Google Scholar] [CrossRef]
  58. Cotrufo, M.F.; Wallenstein, M.D.; Boot, C.M.; Denef, K.; Paul, E. The Microbial Efficiency-Matrix Stabilization (MEMS) framework integrates plant litter decomposition with soil organic matter stabilisation: Do labile plant inputs form stable soil organic matter? Glob. Chang. Biol. 2013, 19, 988–995. [Google Scholar] [CrossRef] [PubMed]
  59. Rasche, F.; Musyoki, M.K.; Röhl, C.; Muema, E.K.; Vanlauwe, B.; Cadisch, G. Lasting influence of biochemically contrasting organic inputs on abundance and community structure of total and proteolytic bacteria in tropical soils. Soil Biol. Biochem. 2014, 74, 204–213. [Google Scholar] [CrossRef]
  60. Malhi, S.S.; Nyborg, M.; Solberg, E.D.; McConkey, B.; Dyck, M.; Puurveen, D. Long-term straw management and N fer-tiliser rate effects on quantity and quality of organic C and N and some chemical properties in two contrasting soils in Western Canada. Biol. Fert. Soils. 2011, 47, 785–800. [Google Scholar] [CrossRef]
  61. Liang, Q.; Chen, H.; Gong, Y.; Yang, H.; Fan, M.; Kuzyakov, Y. Effect of 15years of manure and mineral fertilisers on enzyme activities in particle-size fractions in a North China Plain soil. Euro. J. Soil Biol. 2014, 60, 112–119. [Google Scholar] [CrossRef]
  62. Zhao, S.; He, P.; Qiu, S.; Jia, L.; Liu, M.; Jin, J.; Johnston, A.M. Long-term effects of potassium fertilisation and straw return on soil potassium levels and crop yields in north-central China. Field. Crop. Res. 2014, 169, 116–122. [Google Scholar] [CrossRef]
  63. Akinola, B.; Salami, A. Effect of Herbicides Application on the Management of Tithonia in Maize (Zea mays). Greener J. Agric. Sci. 2016, 6, 28–40. [Google Scholar] [CrossRef] [Green Version]
  64. Montemurro, F.; Fiore, A.; Campanelli, G.; Tittarelli, F.; Ledda, L.; Canali, S. Organic Fertilization, Green Manure, and Vetch Mulch to Improve Organic Zucchini Yield and Quality. HortScience 2013, 48, 1027–1033. [Google Scholar] [CrossRef] [Green Version]
  65. Zhang, M.; He, Z.; Zhao, A.; Zhang, H.; Endale, D.M.; Schomberg, H.H. Water extractable soil organic carbon and ni-trogen affected by tillage and manure application. Soil Sci. 2011, 176, 307–312. [Google Scholar] [CrossRef]
  66. Hellin, J.; Erenstein, O.; Beuchelt, T.; Camacho, C.; Flores, D. Maize stover use and sustainable crop production in mixed crop–livestock systems in Mexico. Field Crop. Res. 2013, 153, 12–21. [Google Scholar] [CrossRef] [Green Version]
  67. Urquiaga, S.; Alves, B.J.R.; Jantalia, C.P.; Boddey, R.M. Aplicación de técnicas de 13C en estudios de secuestro de carbono en el suelo. In IsoTopos Estables en Agroecosistemas Ampliacio ´n de Actas de las pri Meras Jornadas Argentinas Sobre el Empleo de iso ´topos Estables en Agroeco Sistemas Bahı ´a Blanca; Lázzari, M.A., Videla, C., Eds.; 2007; pp. 91–105. Available online: https://ediuns.com.ar/wp-content/uploads/2018/02/interior-isotopos.pdf (accessed on 29 October 2022).
  68. Galantini, J.A.; Suñer, L. Soil organic matter fractions: Analysis of Argentine soils. Agriscientia 2008, XXV, 41–55. [Google Scholar]
  69. Hao, X.; Benke, M.B.; Li, C.; Larney, F.J.; Beauchemin, K.A.; McAllister, T.A. Nitrogen transformations and greenhouse gas emissions during composting of manure from cattle fed diets containing corn dried distiller’s grains with solubles and con-densed tannins. Anim. Feed Sci. Technol. 2011, 166–167, 539–549. [Google Scholar] [CrossRef]
  70. Udom, B.E.; Ogunwole, J.O. Soil organic carbon, nitrogen, and phosphorus distribution in stable aggregates of an Ultisol under contrasting land use and management history. J. Plant Nutr. Soil Sci. 2015, 178, 460–467. [Google Scholar] [CrossRef]
  71. Berhongaray, G.; Alvarez, R.; De Paepe, J.; Caride, C.; Cantet, R. Land use effects on soil carbon in the Argentine Pampas. Geoderma 2012, 192, 97–110. [Google Scholar] [CrossRef]
  72. Marinho, M.A.; Pereira, M.W.; Vázquez, E.V.; Lado, M.; González, A.P. Depth distribution of soil organic carbon in an Oxisol under different land uses: Stratification indices and multifractal analysis. Geoderma 2017, 287, 126–134. [Google Scholar] [CrossRef]
  73. Margenot, A.J.; Paul, B.K.; Sommer, R.R.; Pulleman, M.M.; Parikh, S.J.; Jackson, L.E.; Fonte, S.J. Can conservation agriculture improve phosphorus (P) availability in weathered soils? Effects of tillage and residue management on soil P status after 9 years in a Kenyan Oxisol. Soil Tillage Res. 2017, 166, 157–166. [Google Scholar] [CrossRef]
  74. Nyawade, S.O.; Karanja, N.K.; Gachene, C.K.K.; Gitari, H.I.; Schulte-Geldermann, E.; Parker, M.L. Short-term dynamics of soil organic matter fractions and microbial activity in smallholder potato-legume intercropping systems. Appl. Soil Ecol. 2019, 142, 123–135. [Google Scholar] [CrossRef]
  75. Catherine, N.K. Long-term land management effects on soil properties and microbial populations in a maize-bean rota-tion at Kabete, Kenya. Afr. J. Agric. Res. 2010, 5, 108–113. [Google Scholar]
  76. Ding, X.; Yuan, Y.; Liang, Y.; Li, L.; Han, X. Impact of long-term Application of manure, crop residue, and mineral fer-tiliser on organic carbon pools and crop yields in a Mollisol. J. Soil Sediments 2014, 14, 854–859. [Google Scholar] [CrossRef]
  77. Huang, S.; Weijian, Z.W.; Yu, X.; Huang, Q. Effects of long-term fertilisation on corn productivity and its sustainability in an Ultisol of southern China. Agric. Ecosyst. Environ. 2010, 138, 44–50. [Google Scholar] [CrossRef]
  78. Mahmood, F.; Khan, I.; Ashraf, U.; Shahzad, T.; Hussain, S.; Shahid, M.; Abid, M.; Ullah, S. Effects of organic and inorganic manures on maize and their residual impact on soil physico-chemical properties. J. Soil Sci. Plant Nutr. 2017, 17, 22–32. [Google Scholar] [CrossRef] [Green Version]
  79. Tong, X.; Xu, M.; Wang, X.; Bhattacharyya, R.; Zhang, W.; Cong, R. Long-term fertilization effects on organic carbon fractions in a red soil of China. Catena 2014, 113, 251–259. [Google Scholar] [CrossRef]
  80. Tian, J.; Lou, Y.; Gao, Y.; Fang, H.; Liu, S.; Xu, M.; Blagodatskaya, E.; Kuzyakov, Y. Response of soil organic matter fractions and composition of microbial community to long-term organic and mineral fertilisation. Biol. Fert. Soils. 2017, 53, 523–532. [Google Scholar] [CrossRef]
  81. E, S.Z.; Li, X.G.; Chen, Z.M.; Li, X.H.; Song, J.R.; Guggenberger, G. Long-term fertilisation and manuring effects on physically separated soil organic-matter pools under continuous wheat cropping at a rainfed semiarid site in China. J. Plant Nutri. Soil Sci. 2012, 175, 689–697. [Google Scholar]
  82. Habte, M.; Gebrekidan, H.; Haile, W. Decomposition and nutrient release of selected green manure species at different stages of growth on Alisols at Areka, Southern Ethiopia. Int. J. Nat. Sci. Res. 2013, 1, 30–42. [Google Scholar]
  83. Yao, Z.; Zhang, D.; Yao, P.; Zhao, N.; Liu, N.; Zhai, B.; Zhang, S.; Li, Y.; Huang, D.; Cao, W.; et al. Coupling life-cycle assessment and the RothC model to estimate the carbon footprint of green manure-based wheat production in China. Sci. Total. Environ. 2017, 607–608, 433–442. [Google Scholar] [CrossRef]
  84. Nicolás, C.; Hernandez, T.; García, C. Organic amendments as strategy to increase organic matter in particle-size fractions of a semi-arid soil. Appl. Soil Ecol. 2012, 57, 50–58. [Google Scholar] [CrossRef]
  85. Ozlu, E.; Arriaga, F.J.; Bilen, S.; Gozukara, G.; Babur, E. Carbon Footprint Management by Agricultural Practices. Biology 2022, 11, 1453. [Google Scholar] [CrossRef]
  86. Palm, C.; Blanco-Canqui, H.; DeClerck, F.; Gatere, L.; Grace, P. Conservation agriculture and ecosystem services: An overview. Agric. Ecosyst. Environ. 2014, 187, 87–105. [Google Scholar] [CrossRef] [Green Version]
  87. Endris, S. Combined Application of Phosphorus Fertilizer with Tithonia Biomass Improves Grain Yield and Agronomic Phosphorus Use Efficiency of Hybrid Maize. Int. J. Agron. 2019, 2019, 6167384. [Google Scholar] [CrossRef] [Green Version]
  88. Blanco-Canqui, H.; Francis, C.A.; Galusha, T.D. Does organic farming accumulate carbon in deeper soil profiles in the long term? Geoderma 2017, 288, 213–221. [Google Scholar] [CrossRef]
  89. Gerzabek, M.H.; Haberhauer, G.; Kirchmann, H. Soil organic matter pools and carbon-13 natural abundances in parti-cle-size fractions of a long-term agricultural field experiment receiving organic amendments. Soil Sci. Soc. Am. J. 2001, 65, 352–358. [Google Scholar] [CrossRef]
  90. Paul, B.K.; Vanlauwe, B.; Ayuke, F.; Gassner, A.; Hoogmoed, M.; Hurisso, T.; Koala, S.; Lelei, D.; Ndabamenye, T.; Six, J.; et al. Medium-term impact of tillage and residue management on soil aggregate stability, soil carbon and crop productivity. Agric. Ecosyst. Environ. 2013, 164, 14–22. [Google Scholar] [CrossRef]
  91. Chessman, S.; Thierfelder, C.; Eash, N.; Kassie, G.; Frossard, E. Soil carbon stocks in conservation agriculture systems of Southern Africa. Soil Tillage Res. 2016, 156, 99–109. [Google Scholar] [CrossRef]
  92. Hernández, T.B.D.; Slater, B.K.; Corbalá, R.T.; Shaffer, J.M. Assessment of long-term tillage practices on physical prop-erties of two Ohio soils. Soil Tillage Res. 2019, 186, 270–279. [Google Scholar] [CrossRef]
Figure 1. The concentration of organic carbon (g kg−1) in 1.7 mm fraction in 0–5 cm depth at the Kangutu site. Treatment means with different letters designate significant difference between treatments at p ≤ 0.05. Black shows minimum tillage and gray conventional tillage.
Sustainability 15 00683 g001
Figure 2. The concentration of organic carbon (g kg−1) in 500 µm fraction in 0–5 cm depth at Kangutu site. Treatment means with different letters designate significant difference between treatments at p ≤ 0.05. Black shows minimum tillage and gray conventional tillage.
Sustainability 15 00683 g002
Figure 3. The concentration of organic carbon (g kg−1) in 250 µm fraction in 0–5 cm depth at the Kangutu site. Treatment means with different letters designate significant difference between treatments at p ≤ 0.05. Black shows minimum tillage and gray conventional tillage.
Sustainability 15 00683 g003
Figure 4. The concentration of organic carbon (g kg−1) in 90 µm fraction in 0–5 cm depth at the Kangutu site. Treatment means with different letters designate significant difference between treatments at p ≤ 0.05. Black shows minimum tillage and gray conventional tillage.
Sustainability 15 00683 g004
Figure 5. The organic carbon concentration (g kg−1) in 75 µm fraction in 0–5 cm depth at the Kangutu site. Treatment means with different letters designate significant difference between treatments at p ≤ 0.05. Black shows minimum tillage and gray conventional tillage.
Sustainability 15 00683 g005
Figure 6. The concentration of organic carbon (g kg−1) in 1.7 mm fraction in 5–15 cm depth at the Kangutu site. Treatment means (n = 4) with different letters designate significant difference between treatments at p ≤ 0.05. Black shows minimum tillage and gray conventional tillage.
Sustainability 15 00683 g006
Figure 7. The concentration of organic carbon (g kg−1) in 500 µm fraction in 5–15 cm depth at Kangutu site. Treatment means (n = 4) with different letters designate significant difference between treatments at p ≤ 0.05. Black shows minimum tillage and gray conventional tillage.
Sustainability 15 00683 g007
Figure 8. The concentration of organic carbon (g kg−1) in 250 µm fraction in 5–15 cm depth at Kangutu site. Treatment means (n = 4) with different letters designate significant difference between treatments at p ≤ 0.05. Black shows minimum tillage and gray conventional tillage.
Sustainability 15 00683 g008
Figure 9. The concentration of organic carbon (g kg−1) in 90 µm fraction in 5–15 cm depth at Kangutu site. Treatment means (n = 3) with different letters designate significant difference between treatments at p ≤ 0.05. Black shows minimum tillage and gray conventional tillage.
Sustainability 15 00683 g009
Figure 10. The concentration of organic carbon (g kg−1) in 75 µm fraction in 5–15 cm depth at the Kangutu site. Treatment means (n = 4) with different letters designate significant difference between treatments at p ≤ 0.05. Black shows minimum tillage and gray conventional tillage.
Sustainability 15 00683 g010
Table 1. Field treatments implemented at the Kangutu experimentation site.
Treatments Abbreviations
Conventional tillage + maize residues + inorganic fertilizer CtRMf
Conventional tillage + maize residues + Tithonia diversifolia + goat manure CtRTiM
Conventional tillage + maize residues + Inorganic fertilizer + goat manure CtRMfM
Conventional tillage + maize residues + Tithonia diversifolia + phosphate rock (Minjingu) CtRTiP
Conventional tillage + maize residues + goat manure + legume intercrop (Dolichos Lablab) CtRML
Conventional tillage + sole inorganic fertilizer CtMf
Conventional tillage (no inputs) 1 Ct
Reduced tillage + maize residues + inorganic fertilizer MtRMf
Reduced tillage + maize residues + Tithonia diversifolia + goat manure MtRTiM
Reduced tillage + maize residues + inorganic fertilizer + goat manure MtRMfM
Reduced tillage + maize residues + Tithonia diversifolia + phosphate rock (Minjingu) MtRTiP
Reduced tillage + maize residues + goat manure + legume intercrop (Dolichos Lablab) MtRML
Reduced tillage + sole inorganic fertilizer MtMf
Reduced tillage (no inputs) 2 Mt
1 Ct is the conventional tillage, and 2 Mt is the minimum tillage.
Table 2. Rainfall characteristics of the Kangutu site for seven consecutive rain seasons (long and short).
LR 1 16SR 2 16LR17SR17LR18SR18LR19
Onset
date
3 April 201625 October 201622 March 201720 October 20173 March 201818 August 201828 March 2019
Cessation
date
29 June 201631 December 201630 May 20174 January 20186 June 201818 January 20191 June 2019
Season’s length 886870779615466
Seasonal rainfall(mm)8793853415711047606377
5–10 days2453323
11–15 days3001051
>15 days1122112
Number of dry spells6576486
1 LR—Long rains, 2 SR—Short rains.
Disclaimer/Publisher’s Note: The statements, opinions and data contained in all publications are solely those of the individual author(s) and contributor(s) and not of MDPI and/or the editor(s). MDPI and/or the editor(s) disclaim responsibility for any injury to people or property resulting from any ideas, methods, instructions or products referred to in the content.

