
A Machine Learning and Computer Vision Study of the Environmental Characteristics of Streetscapes That Affect Pedestrian Satisfaction


Abstract
:1. Introduction
2. Literature Review
2.1. Streetscapes and Walkability
2.2. Machine-Learning Model and Explainable AI
2.3. Limitation of Previous Studies and Differences in This Study
3. Materials and Methods
3.1. Materials
3.1.1. Study Area
3.1.2. Streetscapes Images and the Naver Street View API
3.2. Methods
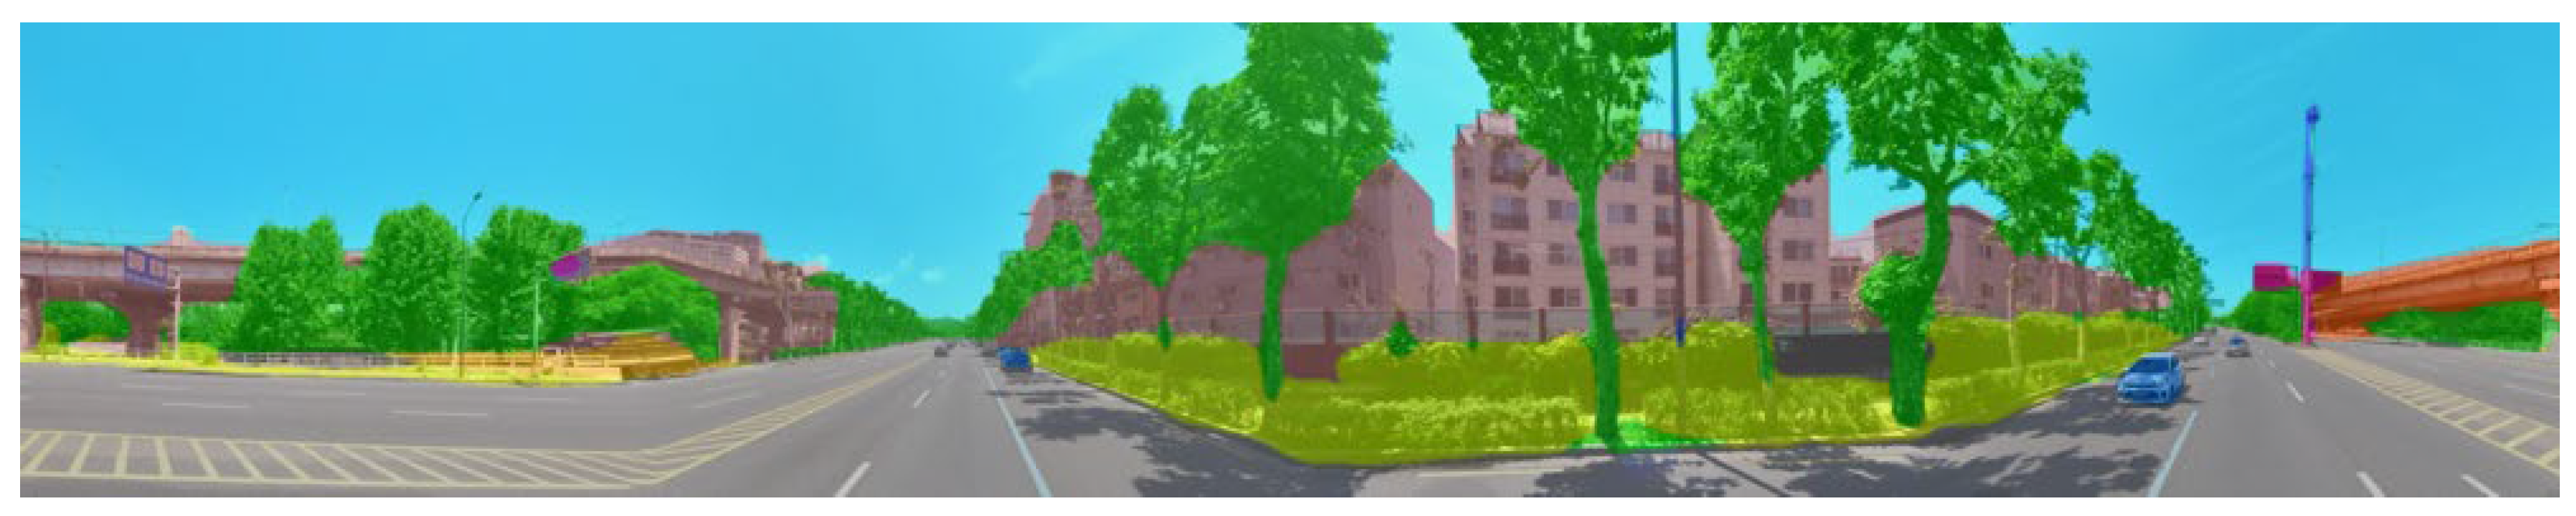
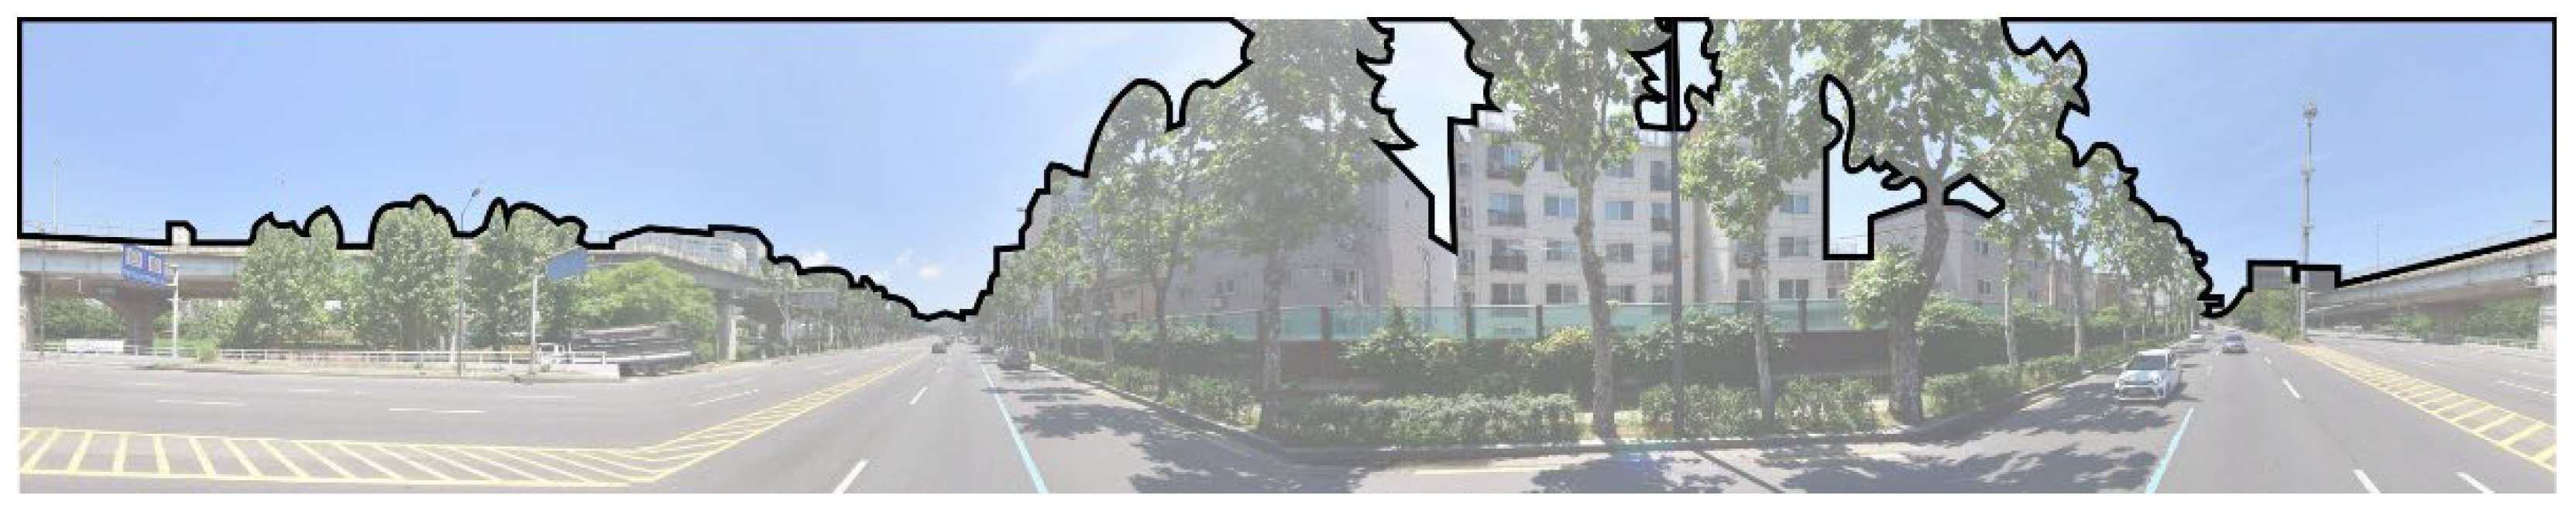
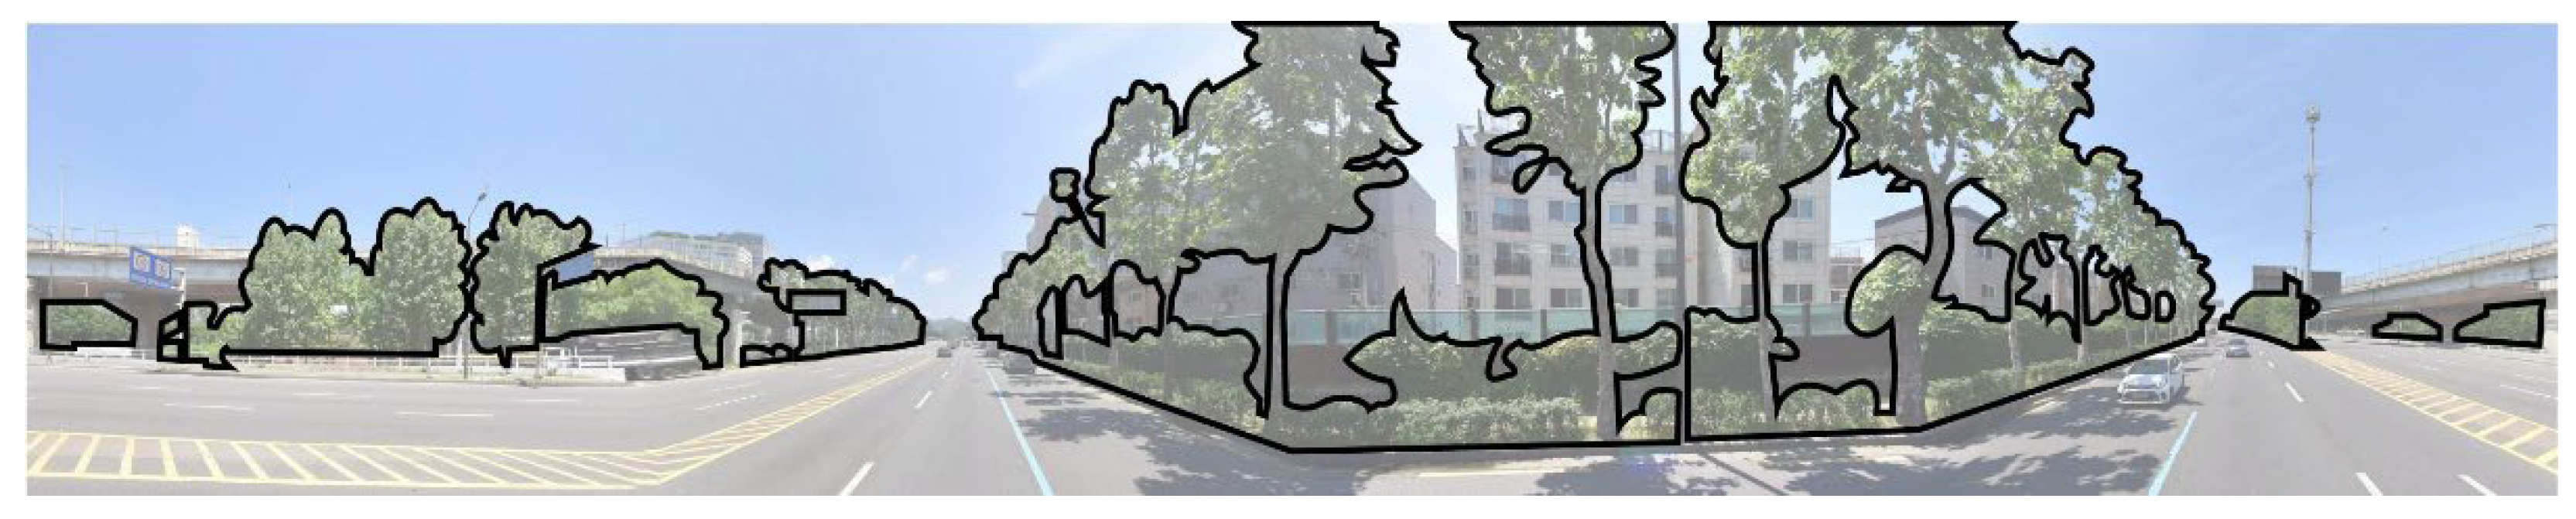
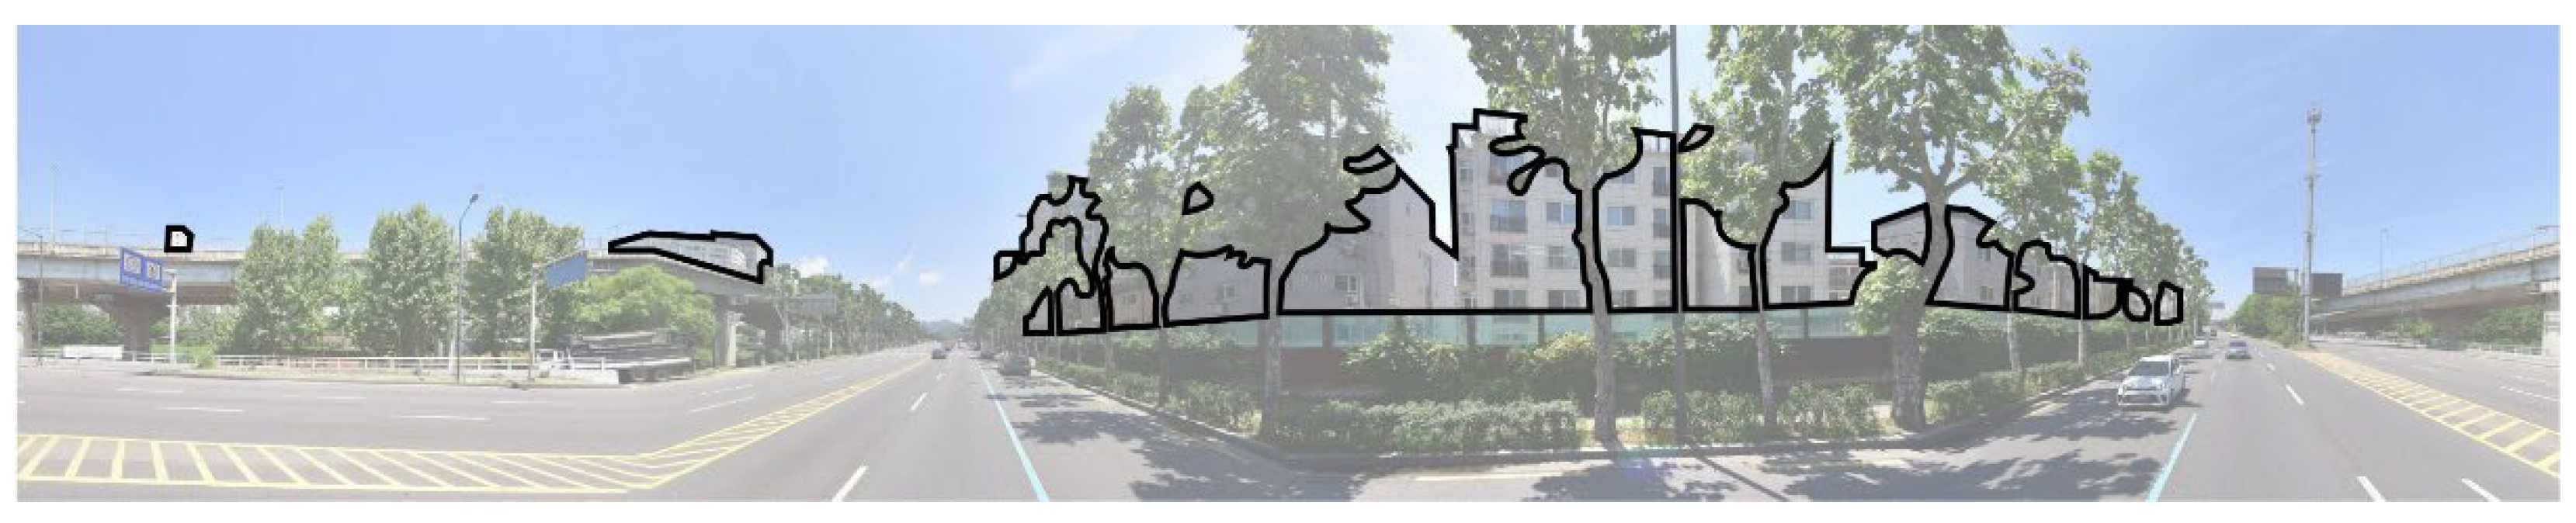
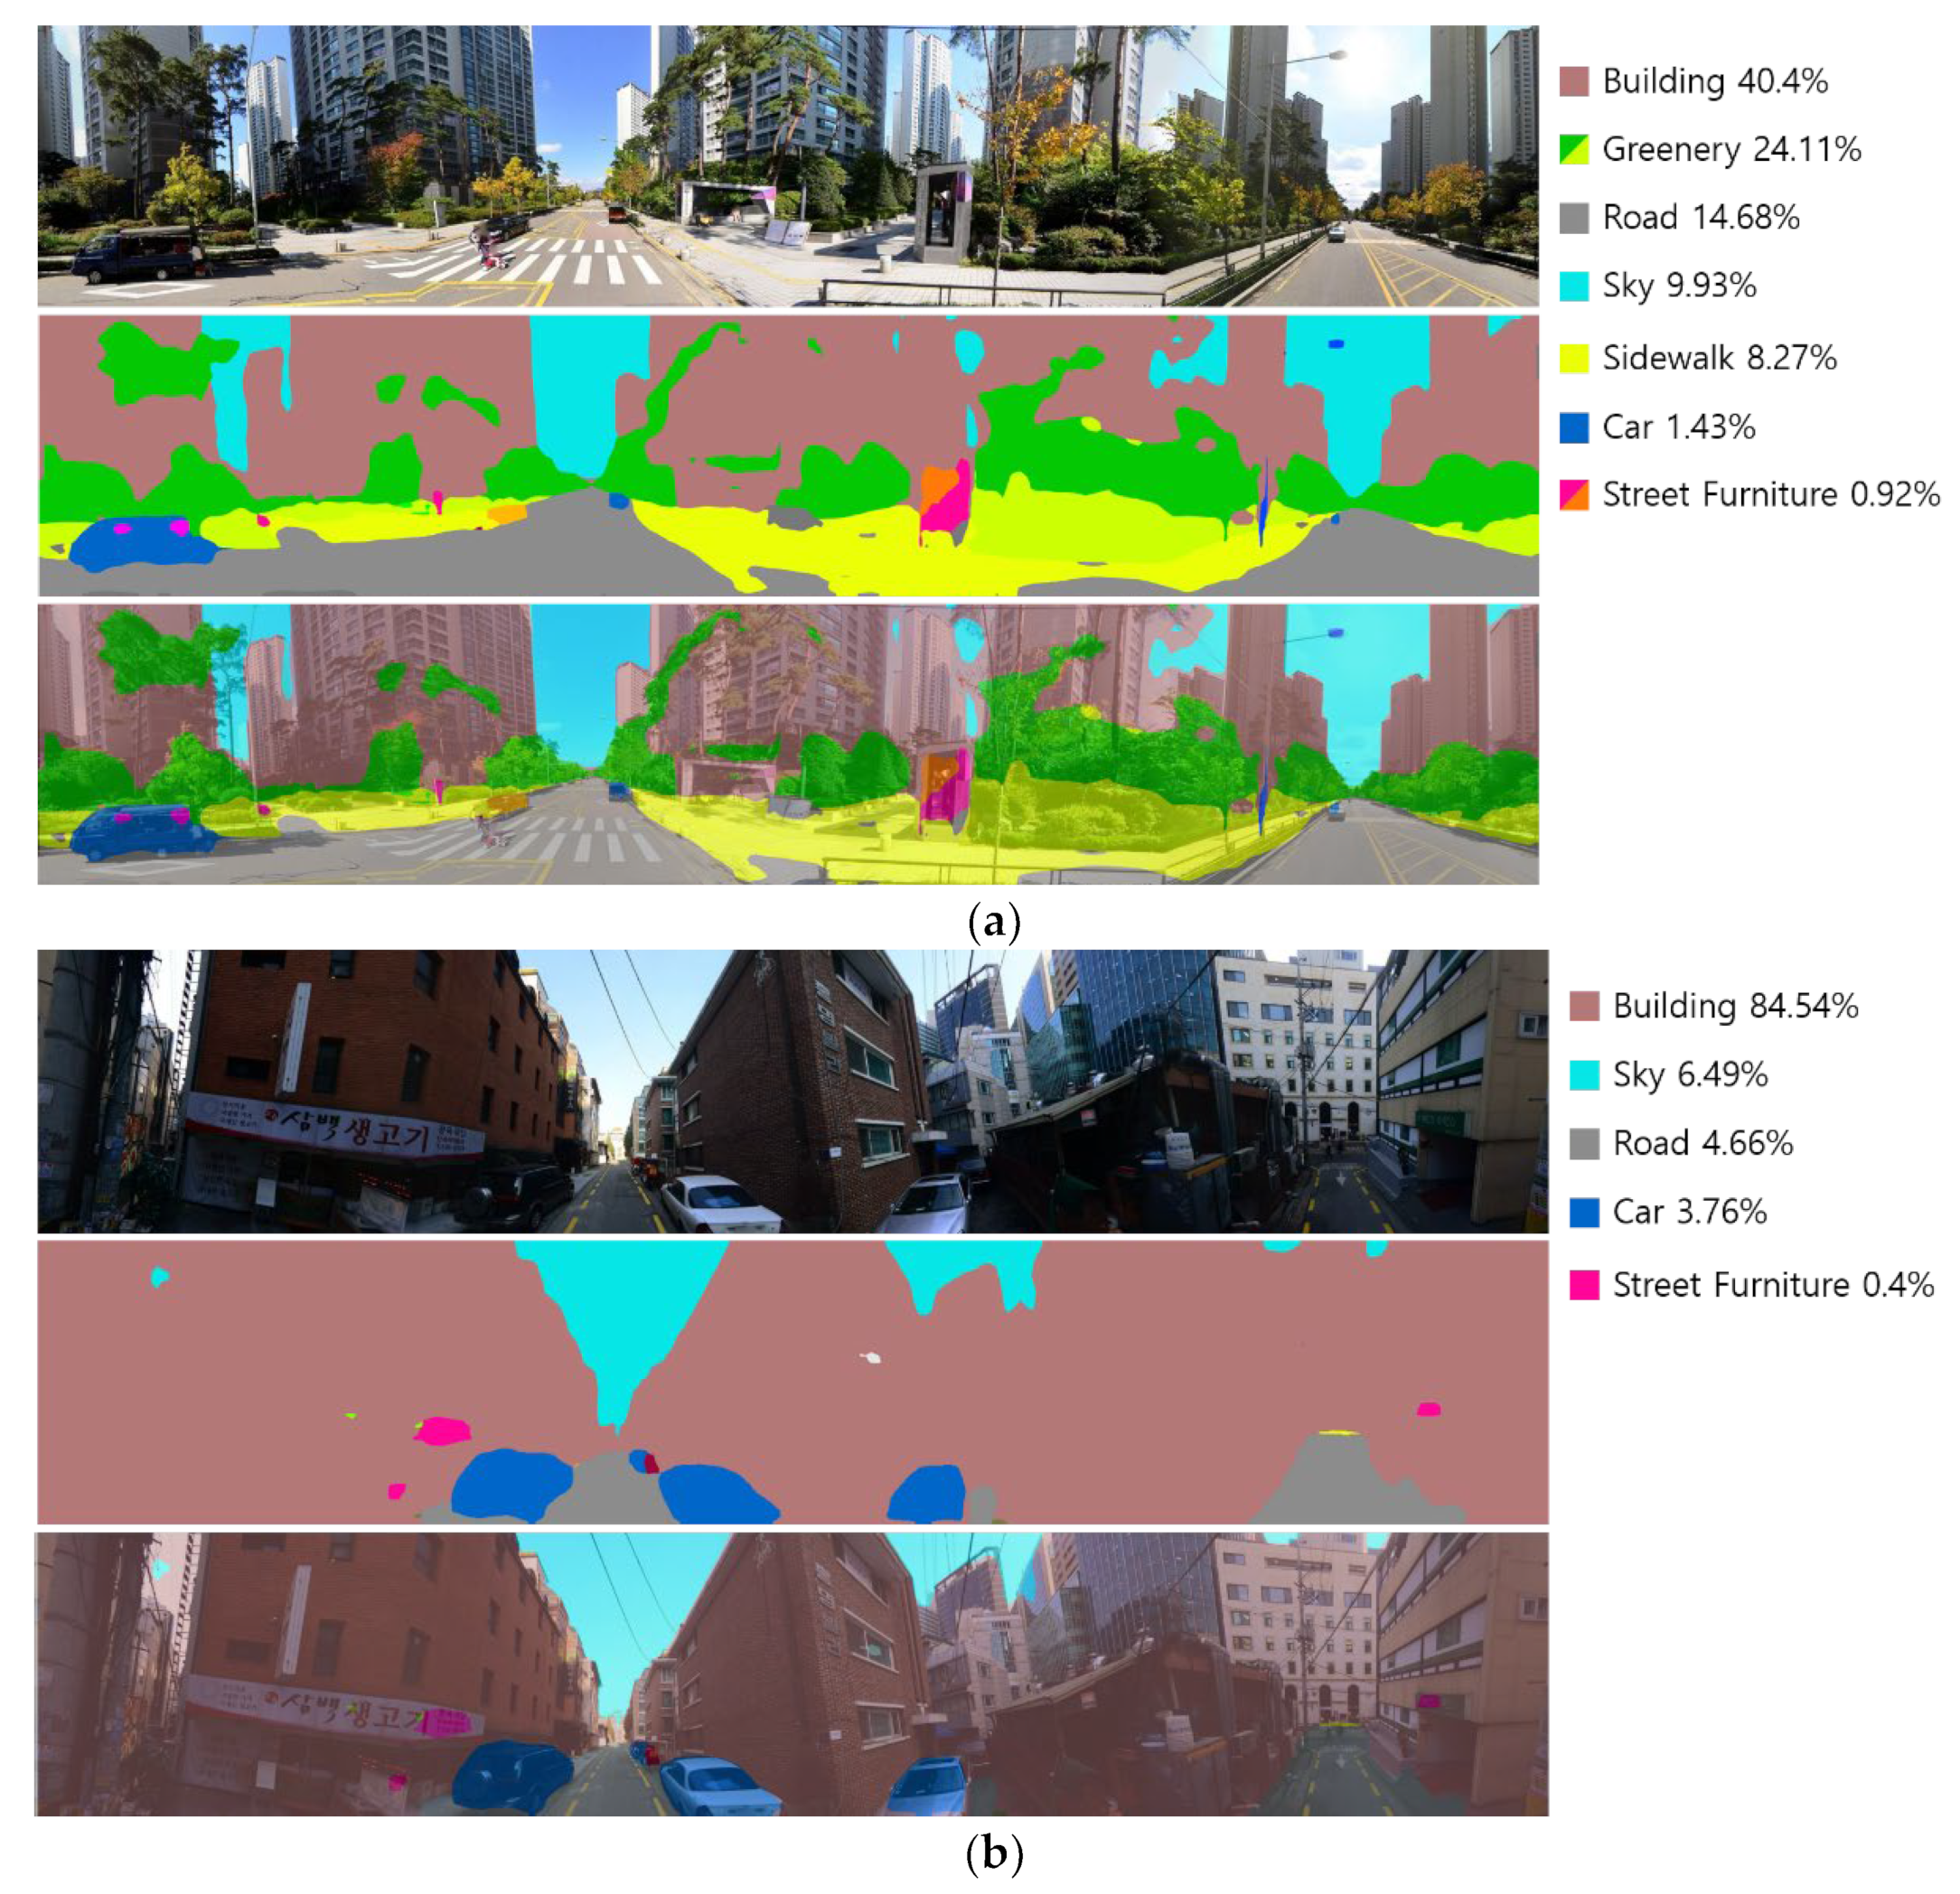
3.2.1. Semantic Segmentation
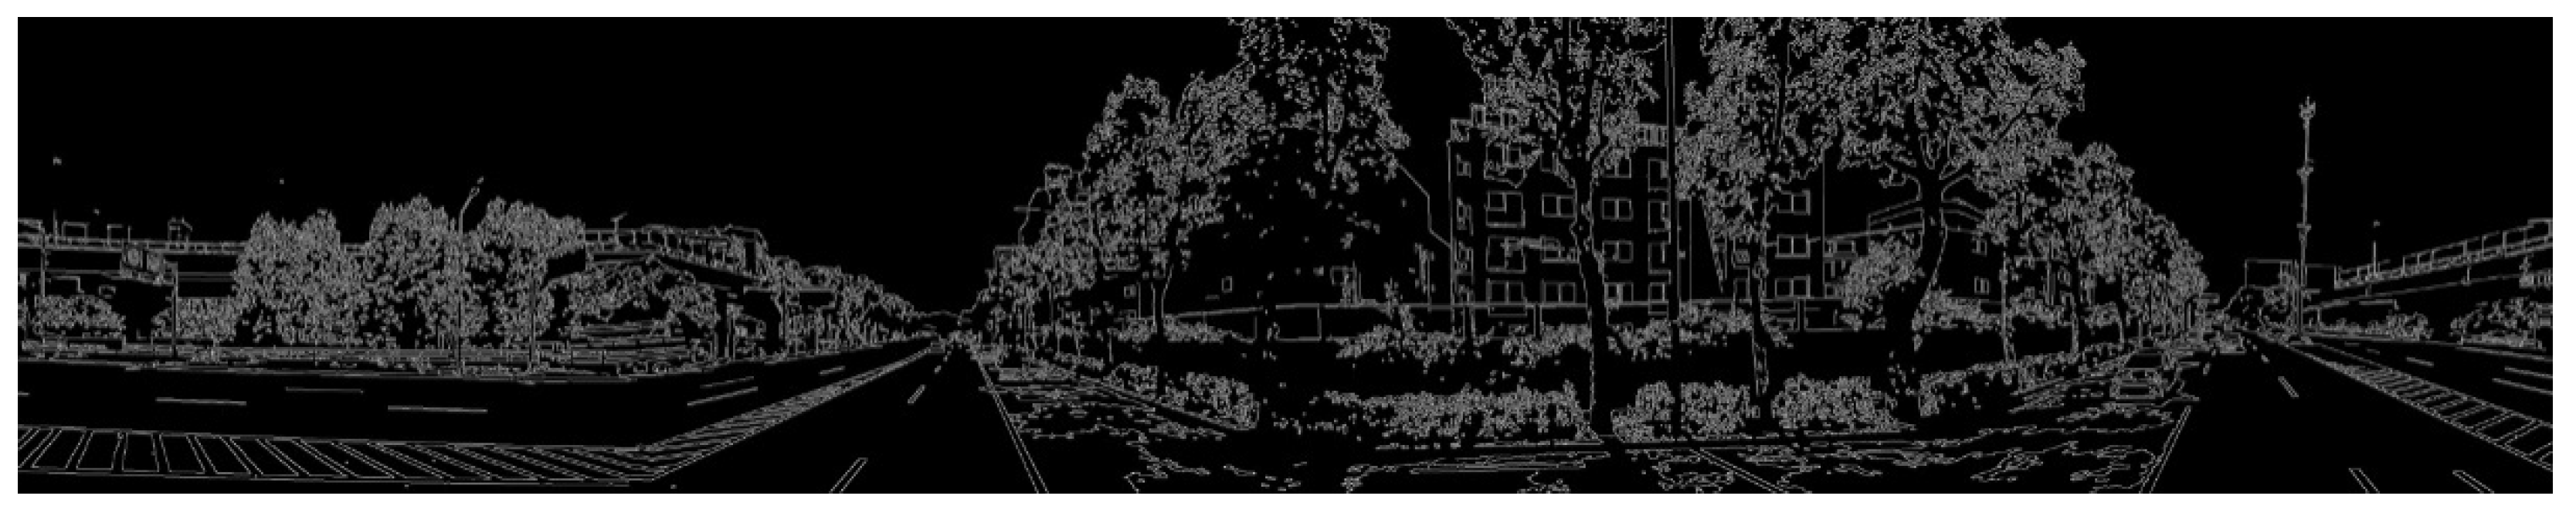
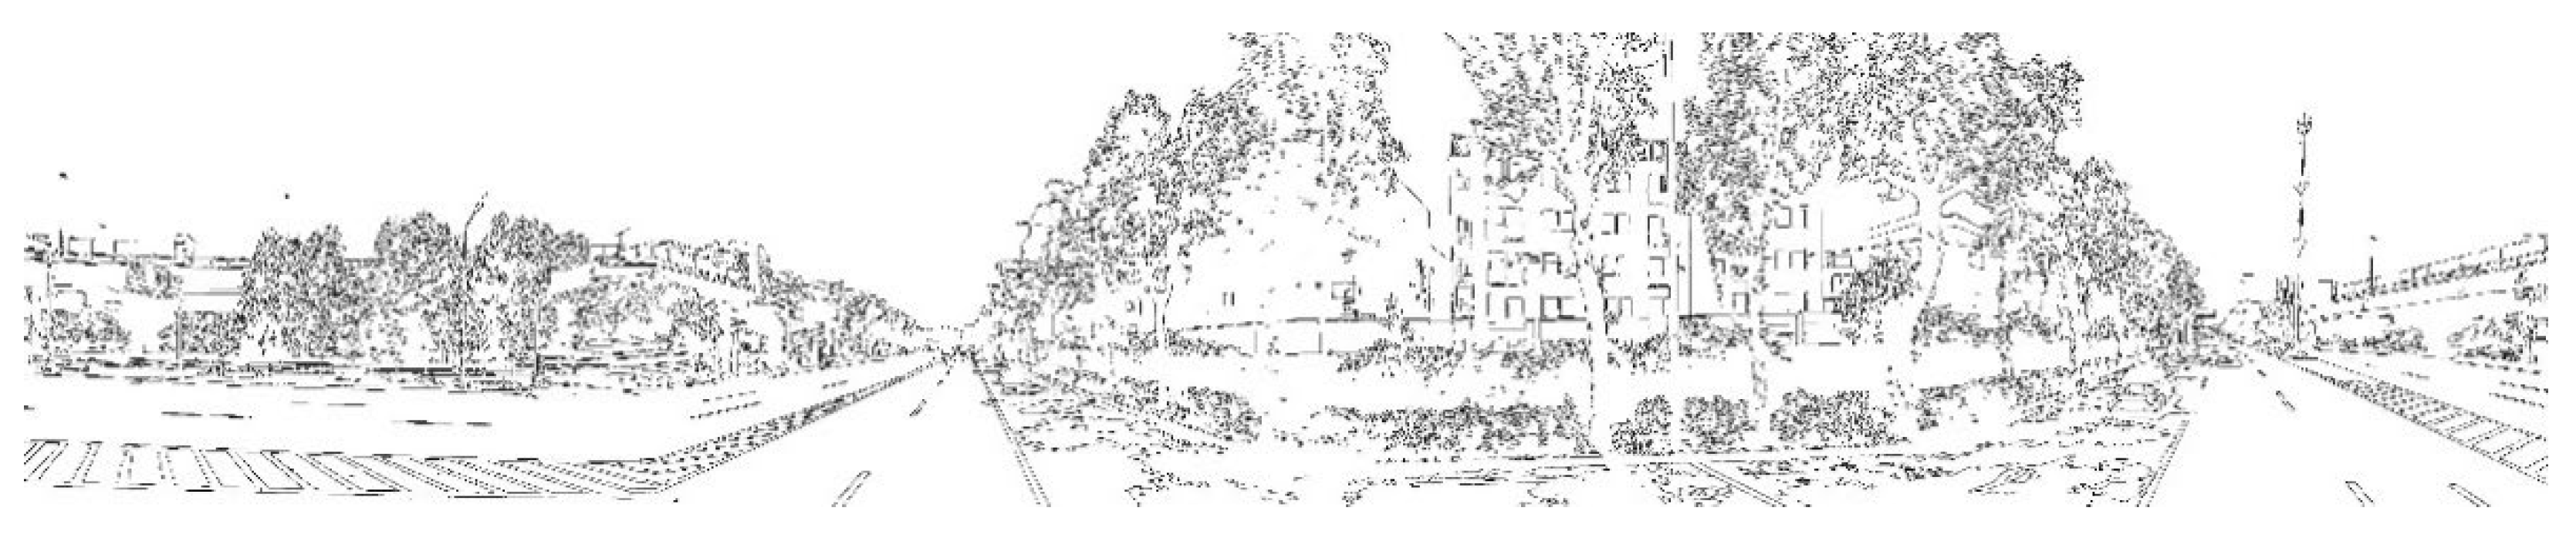
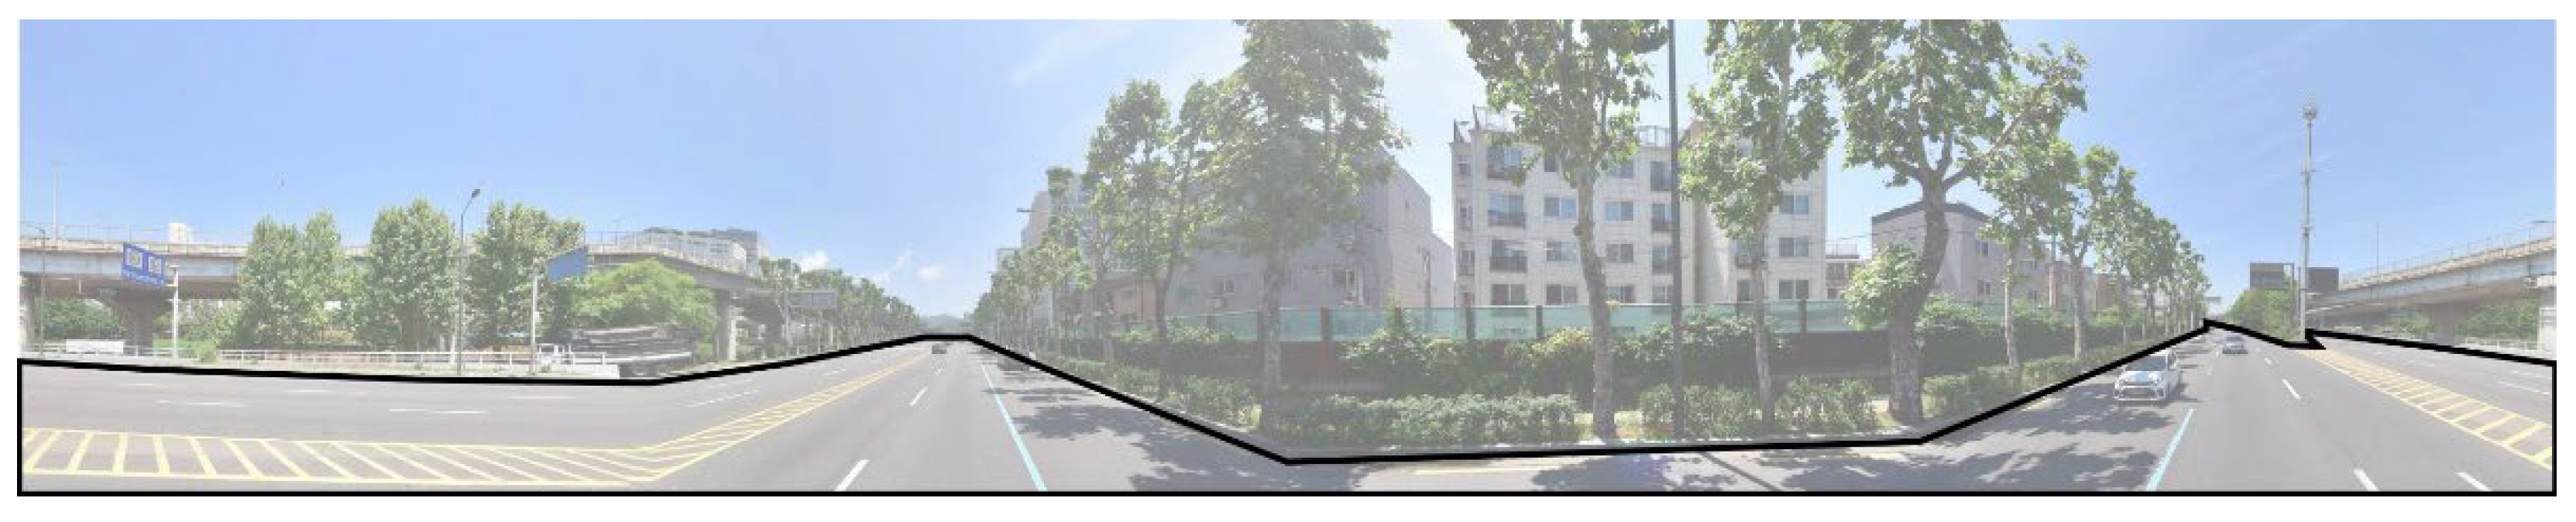
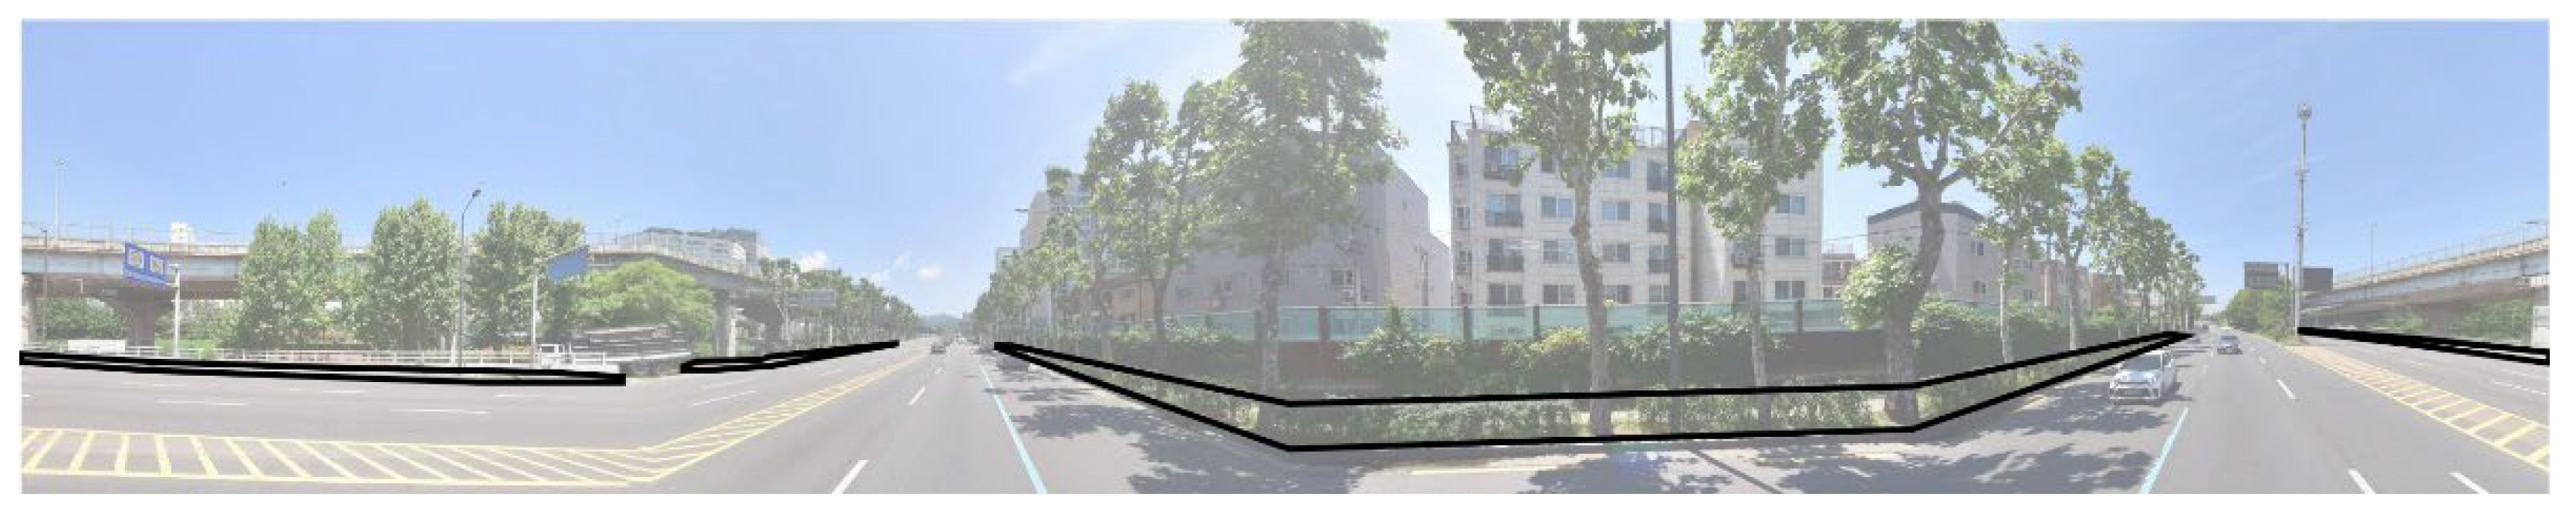
3.2.2. Edge Detection
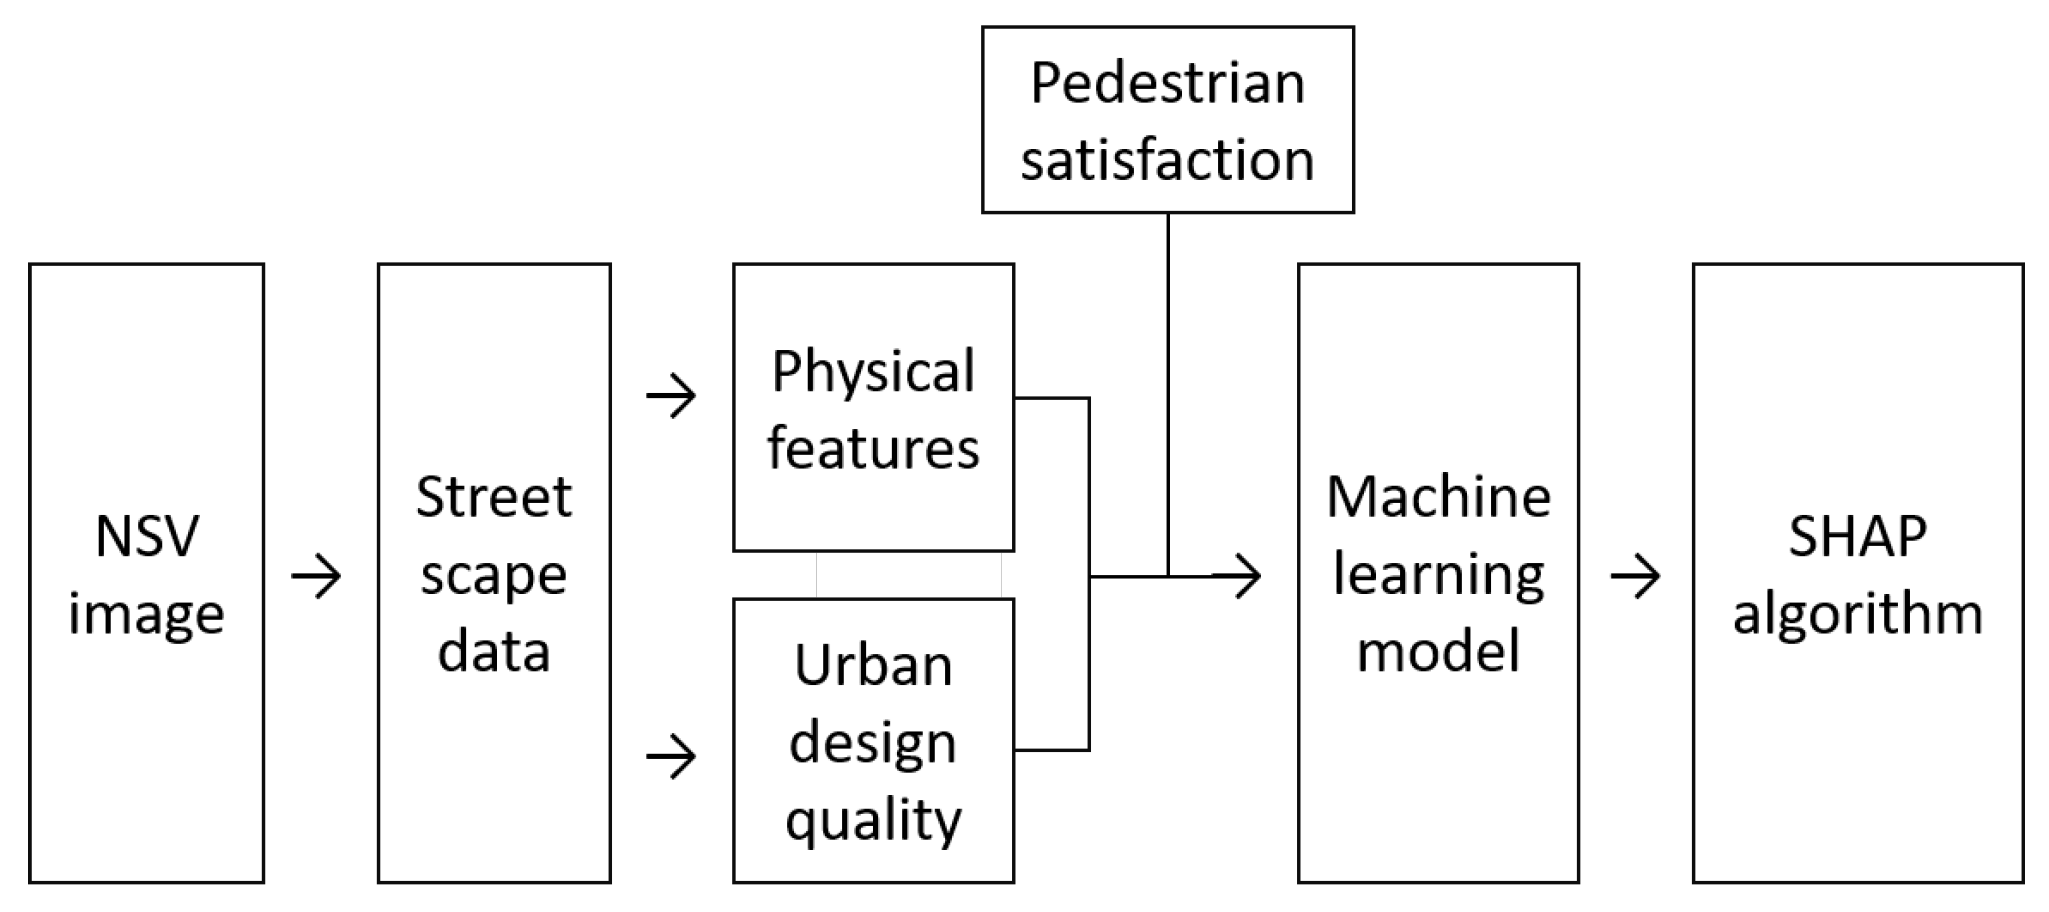
3.2.3. Analytic Frame
4. Variables
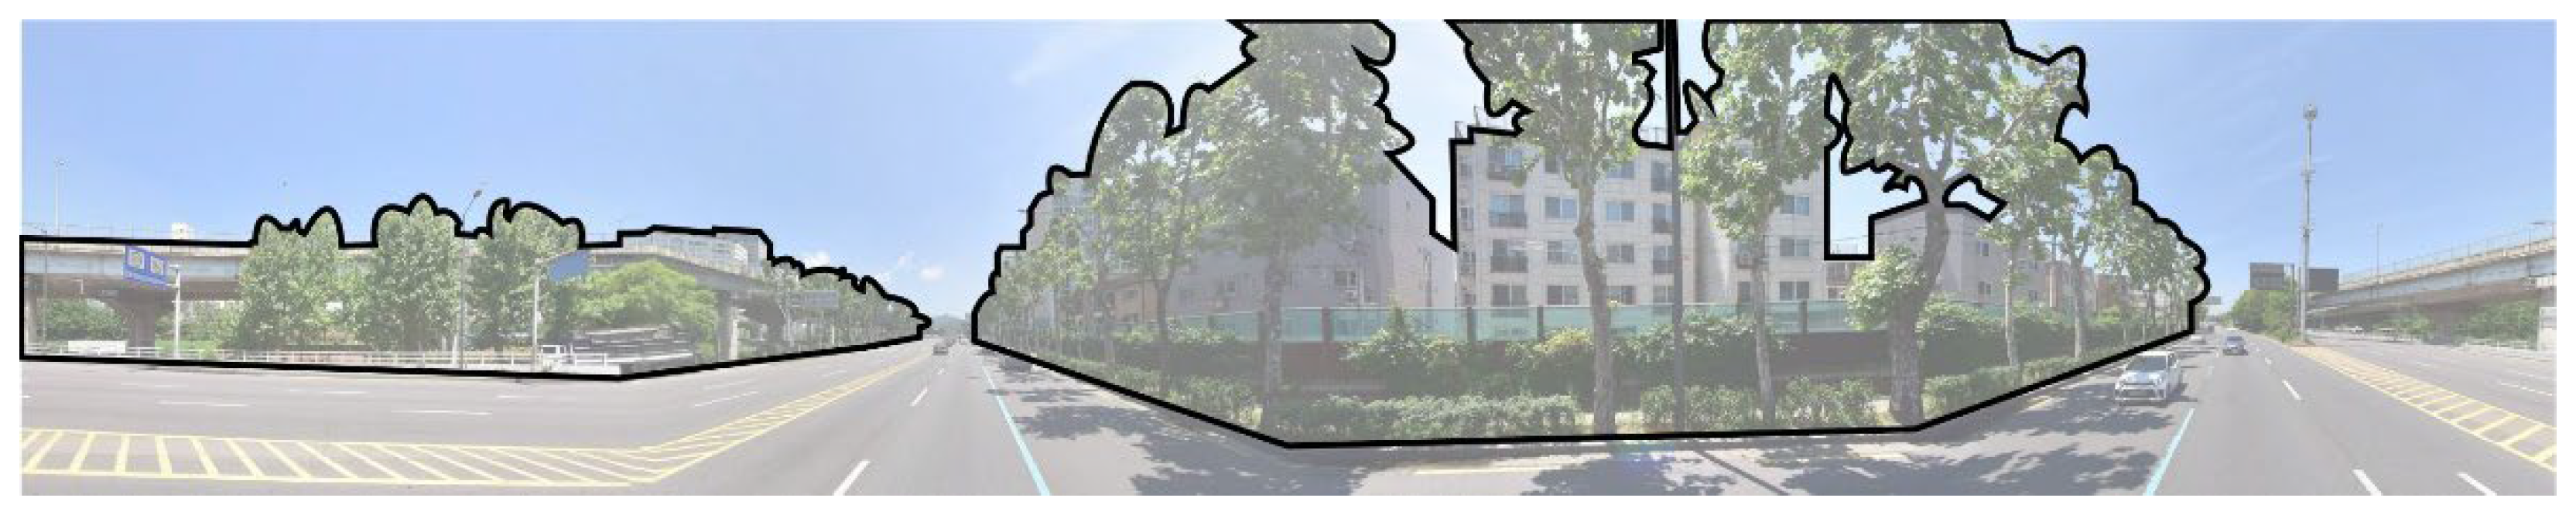
4.1. Enclosure
4.2. Openness
4.3. Greenery
4.4. Complexity
4.5. Area Ratio
5. Analysis
5.1. Machine-Learning Analysis Methods
5.1.1. Logistic Regression Classification
5.1.2. Random Forest Classifier
5.1.3. XGBoost Classifier
5.2. Evaluating the Machine-Learning Techniques
5.3. Interpretable Machine-Learning Techniques
6. Results
6.1. Machine-Learning Models
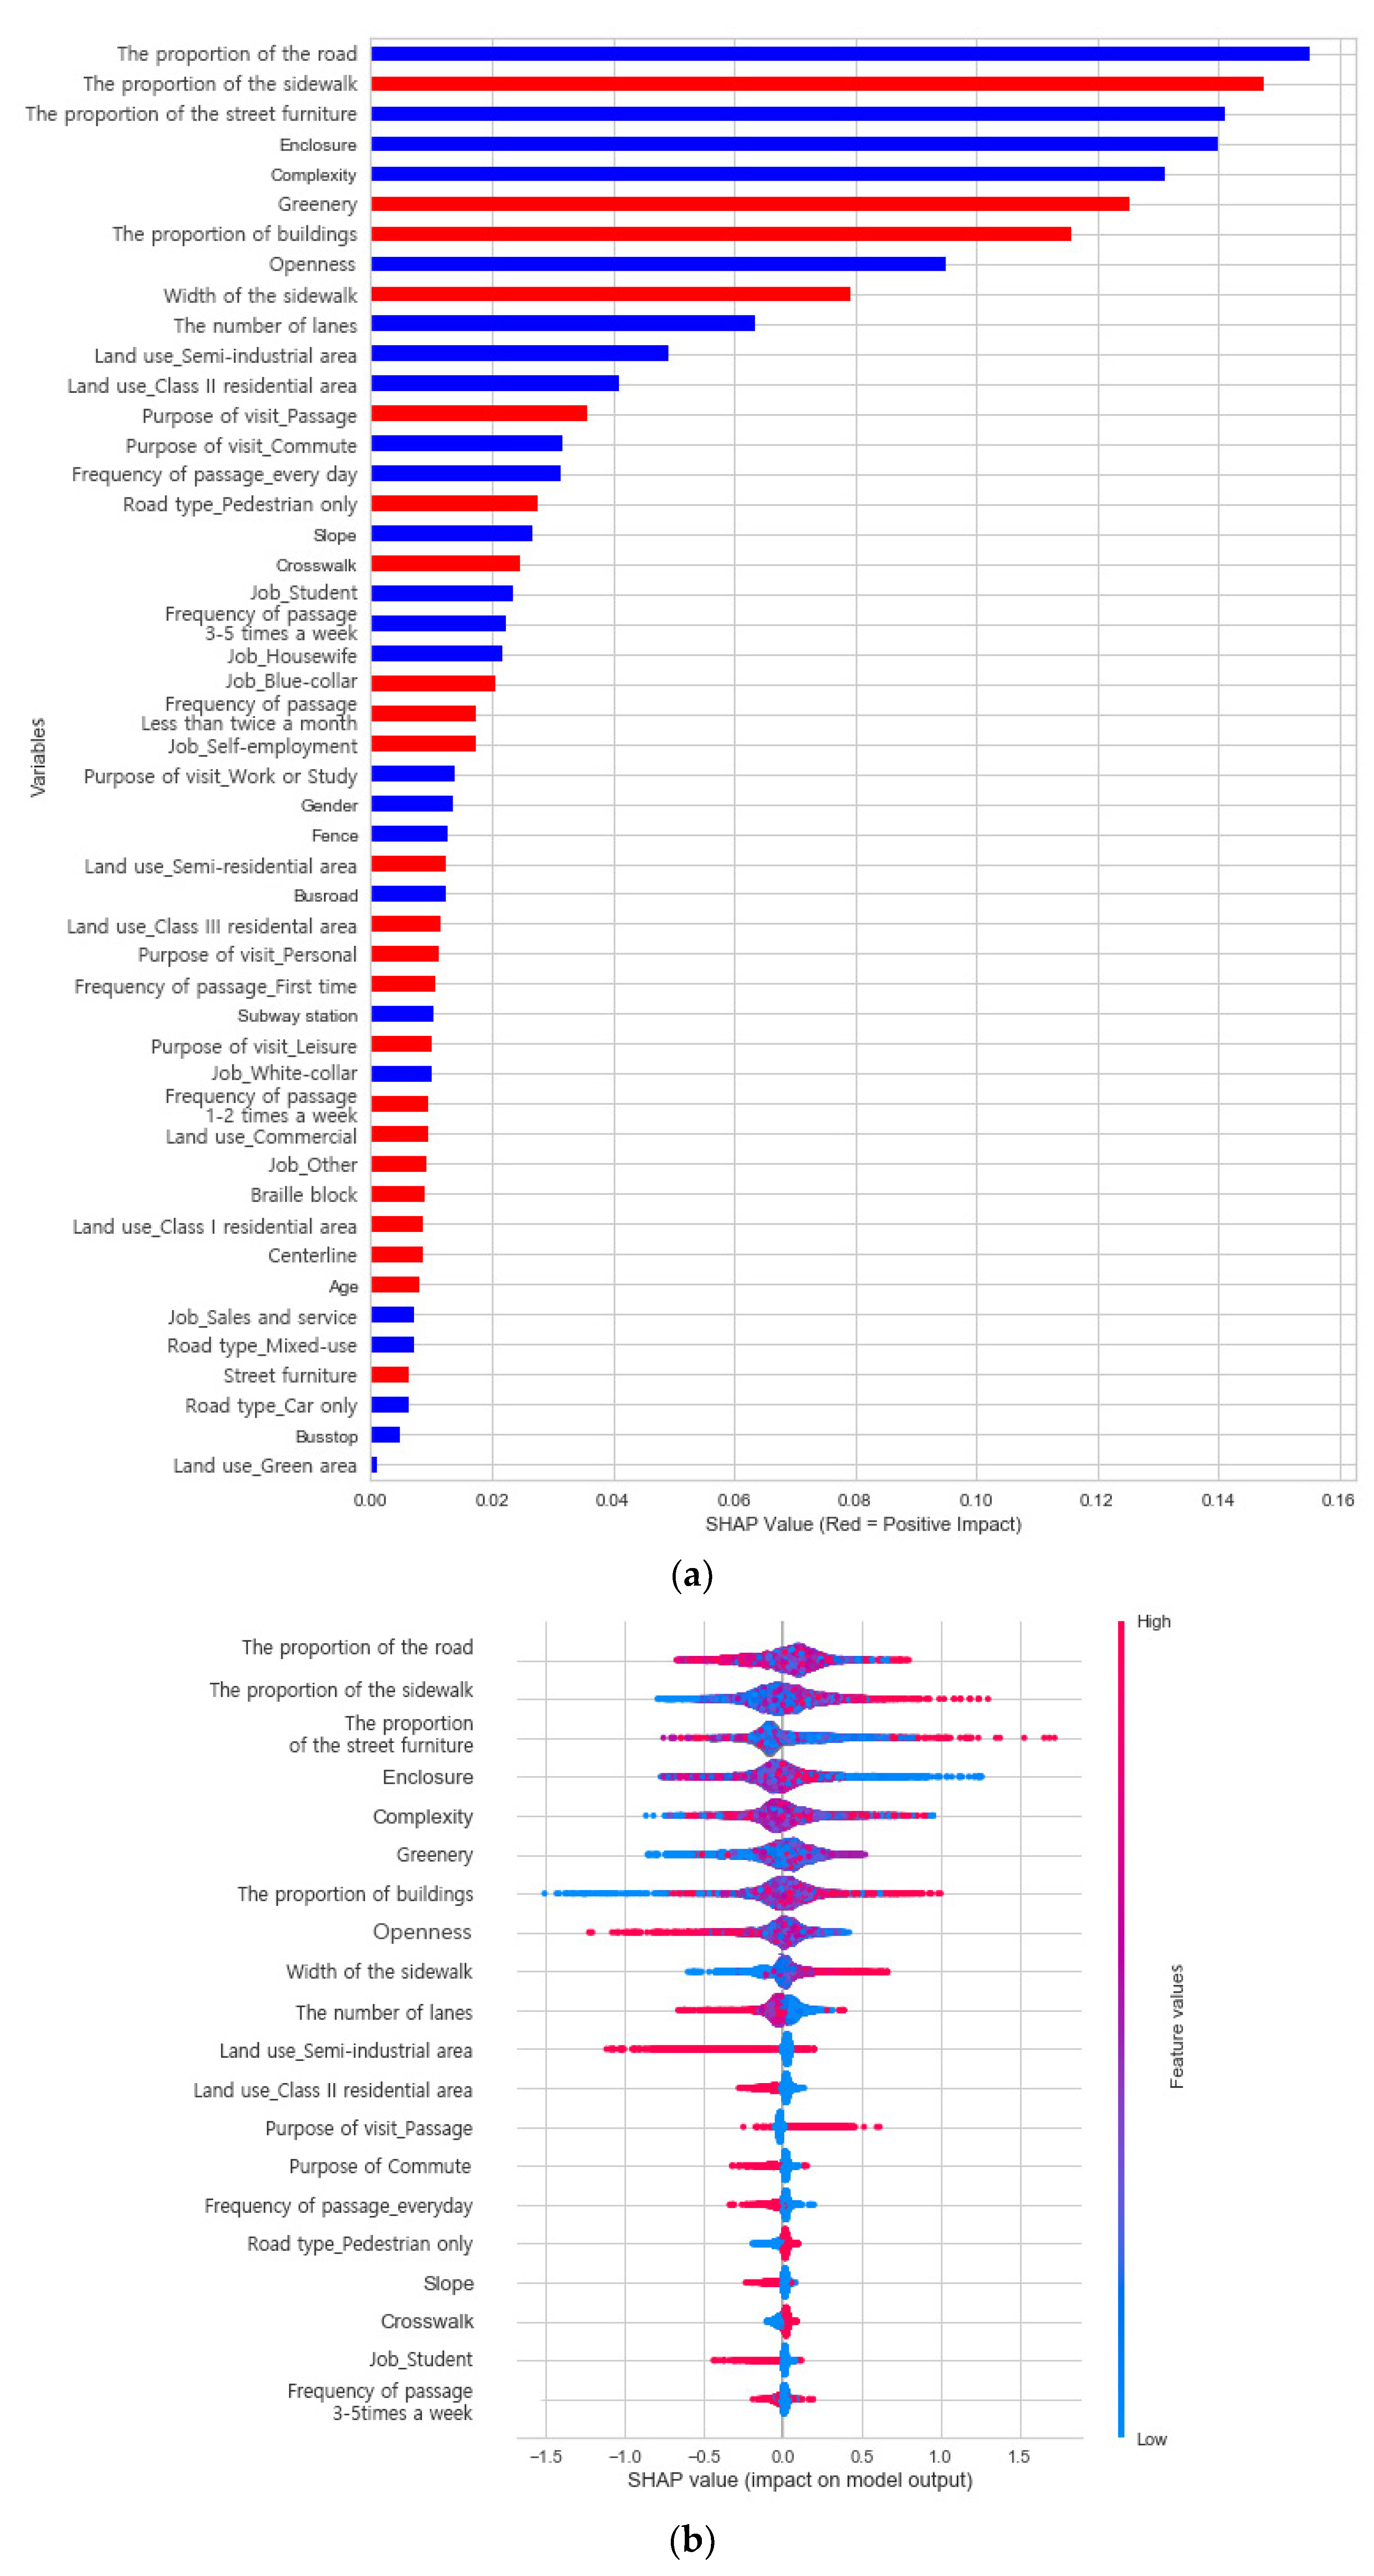
6.2. Interpretation of the Machine-Learning Model
6.2.1. Analysis of the Street Environment Characteristics That Affect Pedestrian Satisfaction
6.2.2. Analysis of the Relationship between Walking Satisfaction and Visual Features
7. Discussion
8. Conclusions
Author Contributions
Funding
Institutional Review Board Statement
Informed Consent Statement
Data Availability Statement
Conflicts of Interest
References
- Suh, J.; Choi, Y. Research on the Visual Cognitivity of Urban Plaza—Focused on preference and complexity. Korea Soc. Des. Trend 2012, 34, 197–206. [Google Scholar]
- Lim, S. Environmental Psychology and Human Behavior: Human-Friendly Environment Design; Bomoondang: Seoul, Korea, 2007. [Google Scholar]
- Kandt, J.; Batty, M. Smart cities, big data and urban policy: Towards urban analytics for the long run. Cities 2021, 109, 102992. [Google Scholar] [CrossRef]
- Gong, Z.; Ma, Q.; Kan, C.; Qi, Q. Classifying Street Spaces with Street View Images for a Spatial Indicator of Urban Functions. Sustainability 2019, 11, 6424. [Google Scholar] [CrossRef] [Green Version]
- Ibrahim, M.R.; Haworth, J.; Cheng, T. Understanding cities with machine eyes: A review of deep computer vision in urban analytics. Cities 2020, 96, 102481. [Google Scholar] [CrossRef]
- Ma, X.; Ma, C.; Wu, C.; Xi, Y.; Yang, R.; Peng, N.; Zhang, C.; Ren, F. Measuring human perceptions of streetscapes to better inform urban renewal: A perspective of scene semantic parsing. Cities 2021, 110, 103086. [Google Scholar] [CrossRef]
- Meng, L.; Wen, K.-H.; Zeng, Z.; Brewin, R.; Fan, X.; Wu, Q. The Impact of Street Space Perception Factors on Elderly Health in High-Density Cities in Macau—Analysis Based on Street View Images and Deep Learning Technology. Sustainability 2020, 12, 1799. [Google Scholar] [CrossRef] [Green Version]
- Choi, I.J.; Jo, H.D. A Study on the Form-Element of Buildings Affecting in Street Spaces. J. Korean Assoc. Geogr. Inf. Stud. 2010, 13, 16–27. [Google Scholar]
- Kim, J.G. A Study on Analysis of Recognition and Preference in Urban Landscape—A Quantatative Experimental Analysis for Subjected Streetscapes. J. Korean Soc. Civ. Eng. 2005, D25, 305–309. [Google Scholar]
- Proshansky, H.M. The city and self-identity. Environ. Behav. 1978, 10, 147–169. [Google Scholar] [CrossRef]
- Lee, I. Development of Pedestrian Path-Choice Model in Urban Residential Area—Comparison of Importance, Satisfaction, and Environmental Tradeoff Models. J. Urban Des. Inst. Korea Urban Des. 2000, 1, 63–78. [Google Scholar]
- Hahm, Y.; Yoon, H.; Choi, Y. The effect of built environments on the walking and shopping behaviors of pedestrians; a study with GPS experiment in Sinchon retail district in Seoul, South Korea. Cities 2019, 89, 1–13. [Google Scholar] [CrossRef]
- Lee, S.; Han, M.; Rhee, K.; Bae, B. Identification of Factors Affecting Pedestrian Satisfaction toward Land Use and Street Type. Sustainability 2021, 13, 10725. [Google Scholar] [CrossRef]
- Ewing, R.; Handy, S. Measuring the Unmeasurable: Urban Design Qualities Related to Walkability. J. Urban Des. 2009, 14, 65–84. [Google Scholar] [CrossRef]
- Tang, J.; Long, Y. Measuring visual quality of street space and its temporal variation: Methodology and its application in the Hutong area in Beijing. Landsc. Urban Plan. 2019, 191, 103436. [Google Scholar] [CrossRef]
- Ernawati, J.; Adhitama, M.S.; Sudarmo, B.S. Urban Design Qualities Related Walkability in a Commercial Neighbourhood. Environ. Behav. Proc. J. 2016, 1, 242–250. [Google Scholar] [CrossRef]
- Müller, A.C.; Guido, S. Introduction to Machine Learning with Python: A Guide for Data Scientists, 1st ed.; O’Reilly Media, Inc.: Sebastopol, CA, USA, 2016. [Google Scholar]
- Hastie, T.; Tibshirani, R.; Friedman, J. The Elements of Statistical Learning: Data Mining, Inference, and Prediction; Springer Science & Business Media: New York, NY, USA, 2009. [Google Scholar]
- Bzdok, D.; Altman, N.; Krzywinski, M. Statistics versus machine learning. Nat. Methods 2018, 15, 233–234. [Google Scholar] [CrossRef]
- Yoo, J.-E. Predictor exploration via group lasso: Focusing on middle school students’ life satisfaction. Stud. Korean Youth 2017, 28, 127–149. [Google Scholar]
- Yoo, J.-E.; Rho, M. Predictive Modeling of Students Creativity via Elastic Net. SNU J. Educ. Res. 2018, 27, 185–205. [Google Scholar]
- Suman, R.R.; Mall, R.; Sukumaran, S.; Satpathy, M. Extracting State Models for Black-Box Software Components. J. Object Technol. 2010, 9, 79–103. [Google Scholar] [CrossRef]
- Gunning, D.; Stefik, M.; Choi, J.; Miller, T.; Stumpf, S.; Yang, G.Z. XAI—Explainable artificial intelligence. Sci. Robot. 2019, 4, eaay7120. [Google Scholar] [CrossRef] [Green Version]
- Lee, Y.-G.; Oh, J.-Y.; Kim, G. Interpretation of Load Forecasting Using Explainable Artificial Intelligence Techniques. Trans. Korean Inst. Electr. Eng. 2020, 69, 480–485. [Google Scholar] [CrossRef]
- Lundberg, S.M.; Lee, S.-I. A unified approach to interpreting model predictions. arXiv 2017, arXiv:1705.07874. [Google Scholar]
- Ribeiro, M.T.; Singh, S.; Guestrin, C. Why Should I Trust You? Explaining the predictions of any classifier. In Proceedings of the 22nd ACM SIGKDD International Conference on Knowledge Discovery and Data Mining, San Francisco, CA, USA, 13–17 August 2016; pp. 1135–1144. [Google Scholar]
- Shapley, L.S. A Value for n-Person Games. In Contributions to the Theory of Games (AM-28); Kuhn, H.W., Tucker, A.W., Eds.; Princeton University Press: Princeton, NJ, USA, 1953; Volume II, pp. 307–318. [Google Scholar]
- Ding, C.; Cao, X.; Næss, P. Applying gradient boosting decision trees to examine non-linear effects of the built environment on driving distance in Oslo. Transp. Res. Part A Policy Pract. 2018, 110, 107–117. [Google Scholar] [CrossRef]
- Wieland, R.; Lakes, T.; Nendel, C. Using SHAP to interpret XGBoost predictions of grassland degradation in Xilingol, China. Geosci. Model Dev. 2020, 1–28. [Google Scholar] [CrossRef]
- Chen, L.; Yao, X.; Liu, Y.; Zhu, Y.; Chen, W.; Zhao, X.; Chi, T. Measuring Impacts of Urban Environmental Elements on Housing Prices Based on Multisource Data—A Case Study of Shanghai, China. ISPRS Int. J. Geo-Inf. 2020, 9, 106. [Google Scholar] [CrossRef] [Green Version]
- Parsa, A.B.; Movahedi, A.; Taghipour, H.; Derrible, S.; Mohammadian, A. Toward safer highways, application of XGBoost and SHAP for real-time accident detection and feature analysis. Accid. Anal. Prev. 2020, 136, 105405. [Google Scholar] [CrossRef]
- Kum, K.-J.; Jang, H.-Y.; Son, S.-N.; Hwang, Y.-J. Analysis of Pedestrian-Streetscape Image in Commercial District Using Structural Equation Model. J. Korea Plan. Assoc. 2010, 45, 97–109. [Google Scholar]
- Yun, N.Y.; Choi, C.G. Relationship between Pedestrian Volume and Pedestrian Environmental Factors on the Commercial Streets in Seoul. J. Korea Plan. Assoc. 2013, 48, 135–150. [Google Scholar]
- Kim, K.-R.; Lee, J.-S. Pedestrian Cognition and Satisfaction on the Physical Elements in Pedestrian Space. J. Urban Des. Inst. Korea Urban Des. 2016, 17, 89–103. [Google Scholar]
- Hu, L.; He, S.; Han, Z.; Xiao, H.; Su, S.; Weng, M.; Cai, Z. Monitoring housing rental prices based on social media: An integrated approach of machine-learning algorithms and hedonic modeling to inform equitable housing policies. Land Use Policy 2019, 82, 657–673. [Google Scholar] [CrossRef]
- Lu, Y.; Sarkar, C.; Xiao, Y. The effect of street-level greenery on walking behavior: Evidence from Hong Kong. Soc. Sci. Med. 2018, 208, 41–49. [Google Scholar] [CrossRef] [PubMed]
- Yin, L.; Wang, Z. Measuring visual enclosure for street walkability: Using machine learning algorithms and Google Street View imagery. Appl. Geogr. 2016, 76, 147–153. [Google Scholar] [CrossRef]
- Zeng, L.; Lu, J.; Li, W.; Li, Y. A fast approach for large-scale Sky View Factor estimation using street view images. Build. Environ. 2018, 135, 74–84. [Google Scholar] [CrossRef]
- Wang, J.; Sun, K.; Cheng, T.; Jiang, B.; Deng, C.; Zhao, Y.; Liu, D.; Mu, Y.; Tan, M.; Wang, X.; et al. Deep high-resolution representation learning for visual recognition. IEEE Trans. Pattern Anal. Mach. Intell. 2020, 43, 3349–3364. [Google Scholar] [CrossRef] [Green Version]
- Gunawardena, G.M.W.L. Evaluation of Streetscape Complexity Created by Streestscape Signage Using Different Objective Analysis Techniques. In Proceedings of the 5th International Conference on Arts and Humanities, Copenhagen, Denmark, 24–27 June 2019; Volume 5, pp. 50–61. [Google Scholar]
- Machado, P.; Romero, J.; Nadal, M.; Santos, A.; Correia, J.; Carballal, A. Computerized measures of visual complexity. Acta Psychol. 2015, 160, 43–57. [Google Scholar] [CrossRef]
- Tucker, C.; Ostwald, M.J.; Chalup, S.K. A method for the visual analysis of streetscape character using digital image processing. In Proceedings of the 38th Annual Conference of the Architectural Science Association ANZAScA and the International Building Performance Simulation Association, Contexts of Architecture, Launceston, Australia, 10–12 November 2004; Australia and New Zealand Architectural Science Association: Sydney, Australia; Auckland, New Zealand, 2004; pp. 134–140. [Google Scholar]
- Wang, H.; Duan, J.; Han, X.; Xiao, B. Research on image complexity evaluation method based on color information. In LIDAR Imaging Detection and Target Recognition; International Society for Optics and Photonics: Bellingham, WA, USA, 2017; p. 106051Q. [Google Scholar]
- Lee, J.-Y.; Park, J. The Analysis of the Effect of Visual Information Volume on the Preference of Commercial Streetscape—Using the Computer Vision Techniques. J. Urban Des. Inst. Korea Urban Des. 2020, 21, 75–86. [Google Scholar] [CrossRef]
- Jacobs, J. The Death and Life of Great American Cities; Random House: New York, NY, USA, 1961. [Google Scholar]
- Berlyne, D.E. Studies in the New Experimental Aesthetics: Steps toward an Objective Psychology of Aesthetic Appreciation; Hemisphere: New York, NY, USA, 1974. [Google Scholar]
- Rapoport, A. History and Precedent in Environmental Design; Kluwer Academic Publishers/Plenum Press: New York, NY, USA, 1990. [Google Scholar]
- Ewing, R.; Clemente, O. Measuring Urban Design: Metrics for Livable Places; Island Press: Washington, DC, USA, 2013. [Google Scholar]
- Jacobs, A.; Appleyard, D. Toward an Urban Design Manifesto. J. Am. Plan. Assoc. 1987, 53, 112–120. [Google Scholar] [CrossRef] [Green Version]
- Wolf, K.L. Business district streetscapes, trees, and consumer response. J. For. 2005, 103, 396–400. [Google Scholar]
- Cao, K.; Guo, H.; Zhang, Y. Comparison of Approaches for Urban Functional Zones Classification Based on Multi-Source Geospatial Data: A Case Study in Yuzhong District, Chongqing, China. Sustainability 2019, 11, 660. [Google Scholar] [CrossRef] [Green Version]
- Chen, T.; Guestrin, C. XGBoost: A Scalable Tree Boosting System. In Proceedings of the 22nd ACM SIGKDD International Conference on Knowledge Discovery and Data Mining, San Francisco, CA, USA, 13–17 August 2016; pp. 785–794. [Google Scholar]
- Štrumbelj, E.; Kononenko, I. Explaining prediction models and individual predictions with feature contributions. Knowl. Inf. Syst. 2014, 41, 647–665. [Google Scholar] [CrossRef]
- Lundberg, S.M.; Erion, G.; Chen, H.; DeGrave, A.; Prutkin, J.M.; Nair, B.; Katz, R.; Himmelfarb, J.; Bansal, N.; Lee, S. From local explanations to global understanding with explainable AI for trees. Nat. Mach. Intell. 2020, 2, 56–67. [Google Scholar] [CrossRef] [PubMed]
- Lundberg, S.M.; Erion, G.; Lee, S. Consistent individualized feature attribution for tree ensembles. arXiv 2018, arXiv:1802.03888. [Google Scholar]
- Ji, W.S.; Koo, Y.S.; Jwa, S.H. A Study on Satisfaction for Pedestrian Environment; Gyeonggi Research Institute: Suwon, Korea, 2008; pp. 3–4. [Google Scholar]


| Survey Point | 1000 Representative Places in Seoul | Survey Locations in Seoul |
|---|---|---|
| Survey Target | Pedestrians passing through the representative points |  |
| Survey Period | Every Friday and Saturday during October 2015 | |
| Survey Range | 10 people per point per day | |
| Survey Method | Individual interviews using questionnaires | |
| Survey Contents | Gender, age, occupation, residence, purpose, frequency of visits, overall satisfaction with the walking environment |
| Factor | Element | Item | Mean/Proportion | S.D. | Min. | Max. | |
|---|---|---|---|---|---|---|---|
| Dependent variable | Pedestrian satisfaction |
| 2.73 | 0.966 | 1 | 5 | |
| Not satisfied (ref.) | 35% | - | - | - | |||
| Satisfied | 65% | - | - | - | |||
| Personal Characteristics | Gender | Men (ref.) | 46% | - | - | - | |
| Women | 54% | - | - | - | |||
| Age | 15–19 | 5% | - | - | - | ||
| 20–29 | 19% | - | - | - | |||
| 30–39 | 18% | - | - | - | |||
| 40–49 | 17% | - | - | - | |||
| 50–59 | 23% | - | - | - | |||
| 60+ | 18% | - | - | - | |||
| Frequency of passage | First time | 4% | - | - | - | ||
| Every day | 30% | - | - | - | |||
| 1–2 times a week | 19% | - | - | - | |||
| 3–5 times a week | 33% | - | - | - | |||
| Less than twice a month | 14% | - | - | - | |||
| Purpose of visit | Commute | 22% | - | - | - | ||
| Personal | 37% | - | - | - | |||
| Work or study | 19% | - | - | - | |||
| Leisure | 14% | - | - | - | |||
| Passage | 8% | - | - | - | |||
| Job | Student | 14% | - | - | - | ||
| Housewife | 22% | - | - | - | |||
| White-collar | 27% | - | - | - | |||
| Blue-collar | 7% | - | - | - | |||
| Sales and service | 11% | - | - | - | |||
| Self-employment | 11% | - | - | - | |||
| Other | 8% | - | - | - | |||
| Physical features | Width of the sidewalk | Width of the sidewalk (m) | 4.12 | 2.312 | 1 | 24 | |
| The number of lanes | The number of lanes | 3.93 | 2.637 | 1 | 18 | ||
| Bus road | Bus road | No (ref.) | 30% | - | - | - | |
| Yes | 70% | - | - | - | |||
| Centerline | Centerline | No (ref.) | 29% | - | - | - | |
| Yes | 71% | - | - | - | |||
| Street furniture | Street furniture | No (ref.) | 8% | - | - | - | |
| Yes | 92% | - | - | - | |||
| Road type | Car only | 7% | - | - | - | ||
| Pedestrian only | 70% | - | - | - | |||
| Mixed-use | 23% | - | - | - | |||
| Braille block | Braille block | No (ref.) | 64% | - | - | - | |
| Yes | 36% | - | - | - | |||
| Slope | Slope | No (ref.) | 77% | - | - | - | |
| Yes | 23% | - | - | - | |||
| Fence | Pedestrian safety fence | No (ref.) | 79% | - | - | - | |
| Yes | 21% | - | - | - | |||
| Bus stop | Bus stop | No (ref.) | 64% | - | - | - | |
| Yes | 36% | - | - | - | |||
| Subway station | Subway station | No (ref.) | 65% | - | - | - | |
| Yes | 35% | - | - | - | |||
| Crosswalk | Crosswalk | No (ref.) | 39% | - | - | - | |
| Yes | 61% | - | - | - | |||
| Land use | Commercial area | 18% | - | - | - | ||
| Green area | 3% | - | - | - | |||
| Semi-residential area | 4% | - | - | - | |||
| Semi-industrial area | 5% | - | - | - | |||
| Class Ⅰ residential area | 6% | - | - | - | |||
| Class Ⅱ residential area | 30% | - | - | - | |||
| Class Ⅲ residential area | 33% | - | - | - | |||
| Visual features | Urban design qualities | Enclosure | Sum of the area ratios of buildings and street trees | 0.549 | 0.153 | 0.145 | 0.912 |
| Openness | The area ratio of the sky | 0.208 | 0.096 | 0 | 0.539 | ||
| Greenery | Sum of planting area ratios | 0.208 | 0.096 | 0 | 0.539 | ||
| Complexity | Amount of visual information | 1.283 | 0.238 | 0.516 | 2.249 | ||
| Area ratio | The proportion of buildings | 0.394 | 0.212 | 0.002 | 0.895 | ||
| The proportion of the road | 0.144 | 0.060 | 0 | 0.273 | |||
| The proportion of the sidewalk | 0.038 | 0.031 | 0 | 0.287 | |||
| The proportion of the street furniture | 0.013 | 0.018 | 0 | 0.160 | |||
| Model | Logistic Regression | Random Forest | XGBoost |
|---|---|---|---|
| Accuracy | 0.65 | 0.72 | 0.82 |
| Precision | 0.60 | 0.76 | 0.83 |
| Recall | 0.51 | 0.81 | 0.92 |
| F1 score | 0.53 | 0.79 | 0.87 |
| AUC score | 0.56 | 0.76 | 0.90 |
| ROC curve |  |  |  |
| Variable | SHAP Value | Variable | SHAP Value |
|---|---|---|---|
| The proportion of the road | 0.1551 | Semi industrial area | 0.0493 |
| The proportion of the sidewalk | 0.1475 | Class Ⅱ residential area | 0.0409 |
| The proportion of the street furniture | 0.1412 | Purpose of passage | 0.0356 |
| Enclosure | 0.1399 | Purpose of commute | 0.0316 |
| Complexity | 0.1311 | Visit every day | 0.0315 |
| Greenery | 0.1252 | Pedestrian-only road | 0.0276 |
| Proportion of buildings | 0.1157 | Slope | 0.0266 |
| Openness | 0.0949 | Crosswalk | 0.0247 |
| Width of the sidewalk | 0.0792 | Student | 0.0236 |
| The number of lanes | 0.0636 | Visit 3–5 times a week | 0.0255 |
| The Proportion of the Road | The Proportion of the Sidewalk | Complexity | Greenery |
|---|---|---|---|
 |  |  |  |
| The Proportion of Street Furniture | Enclosure | The Proportion of Buildings | Openness |
 |  |  |  |
Publisher’s Note: MDPI stays neutral with regard to jurisdictional claims in published maps and institutional affiliations. |
© 2022 by the authors. Licensee MDPI, Basel, Switzerland. This article is an open access article distributed under the terms and conditions of the Creative Commons Attribution (CC BY) license (https://creativecommons.org/licenses/by/4.0/).
Share and Cite
Lee, J.; Kim, D.; Park, J. A Machine Learning and Computer Vision Study of the Environmental Characteristics of Streetscapes That Affect Pedestrian Satisfaction. Sustainability 2022, 14, 5730. https://doi.org/10.3390/su14095730
Lee J, Kim D, Park J. A Machine Learning and Computer Vision Study of the Environmental Characteristics of Streetscapes That Affect Pedestrian Satisfaction. Sustainability. 2022; 14(9):5730. https://doi.org/10.3390/su14095730
Chicago/Turabian StyleLee, Jiyun, Donghyun Kim, and Jina Park. 2022. "A Machine Learning and Computer Vision Study of the Environmental Characteristics of Streetscapes That Affect Pedestrian Satisfaction" Sustainability 14, no. 9: 5730. https://doi.org/10.3390/su14095730