
Research on Airflow Optimization and Infection Risk Assessment of Medical Cabin of Negative-Pressure Ambulance


School of Mechanical Engineering and Automation, Northeastern University, Shenyang 110819, China
*
Author to whom correspondence should be addressed.
Sustainability 2022, 14(9), 4900; https://doi.org/10.3390/su14094900
Submission received: 28 January 2022
/
Revised: 31 March 2022
/
Accepted: 18 April 2022
/
Published: 19 April 2022
(This article belongs to the Topic Sustainable Built Environment)
Abstract
:Medical cabins within negative-pressure ambulances currently only use the front air supply, which causes poor emission of infectious disease droplets. For this problem, based on the classification and design methods of airflow organization, the side and top supply airflow organization model has been designed to study the influence of these airflow organization models on the spread of droplet particles. The distribution of droplet particles within airflow organization models, under conditions in which the patient is coughing and sneezing, is analyzed. According to the comparison and analysis of this distribution, the state of droplet particles, the emission efficiency, and the security coefficient are studied. The response surface method is used to optimize the emission efficiency and security coefficient of the airflow organization. According to the characteristics of the medical cabin within negative-pressure ambulances, a dose-response model is used to evaluate the infection risk of medical personnel and then the infection probability is obtained. These research results can be used to improve the ability of negative-pressure ambulances to prevent cross-infection.
1. Introduction
In recent years, human activities and global climate changes have led to the mutation of viruses and the outbreak of various infectious diseases [1]. At present, Coronavirus disease 2019 (COVID-19) has ravaged the world since 2019 [2], and is a severe infectious disease that has posed a serious threat to humans and has become one of the primary forms of public health emergencies [3]. It endangers the health and safety of people and it affects economic development and social stability [4].
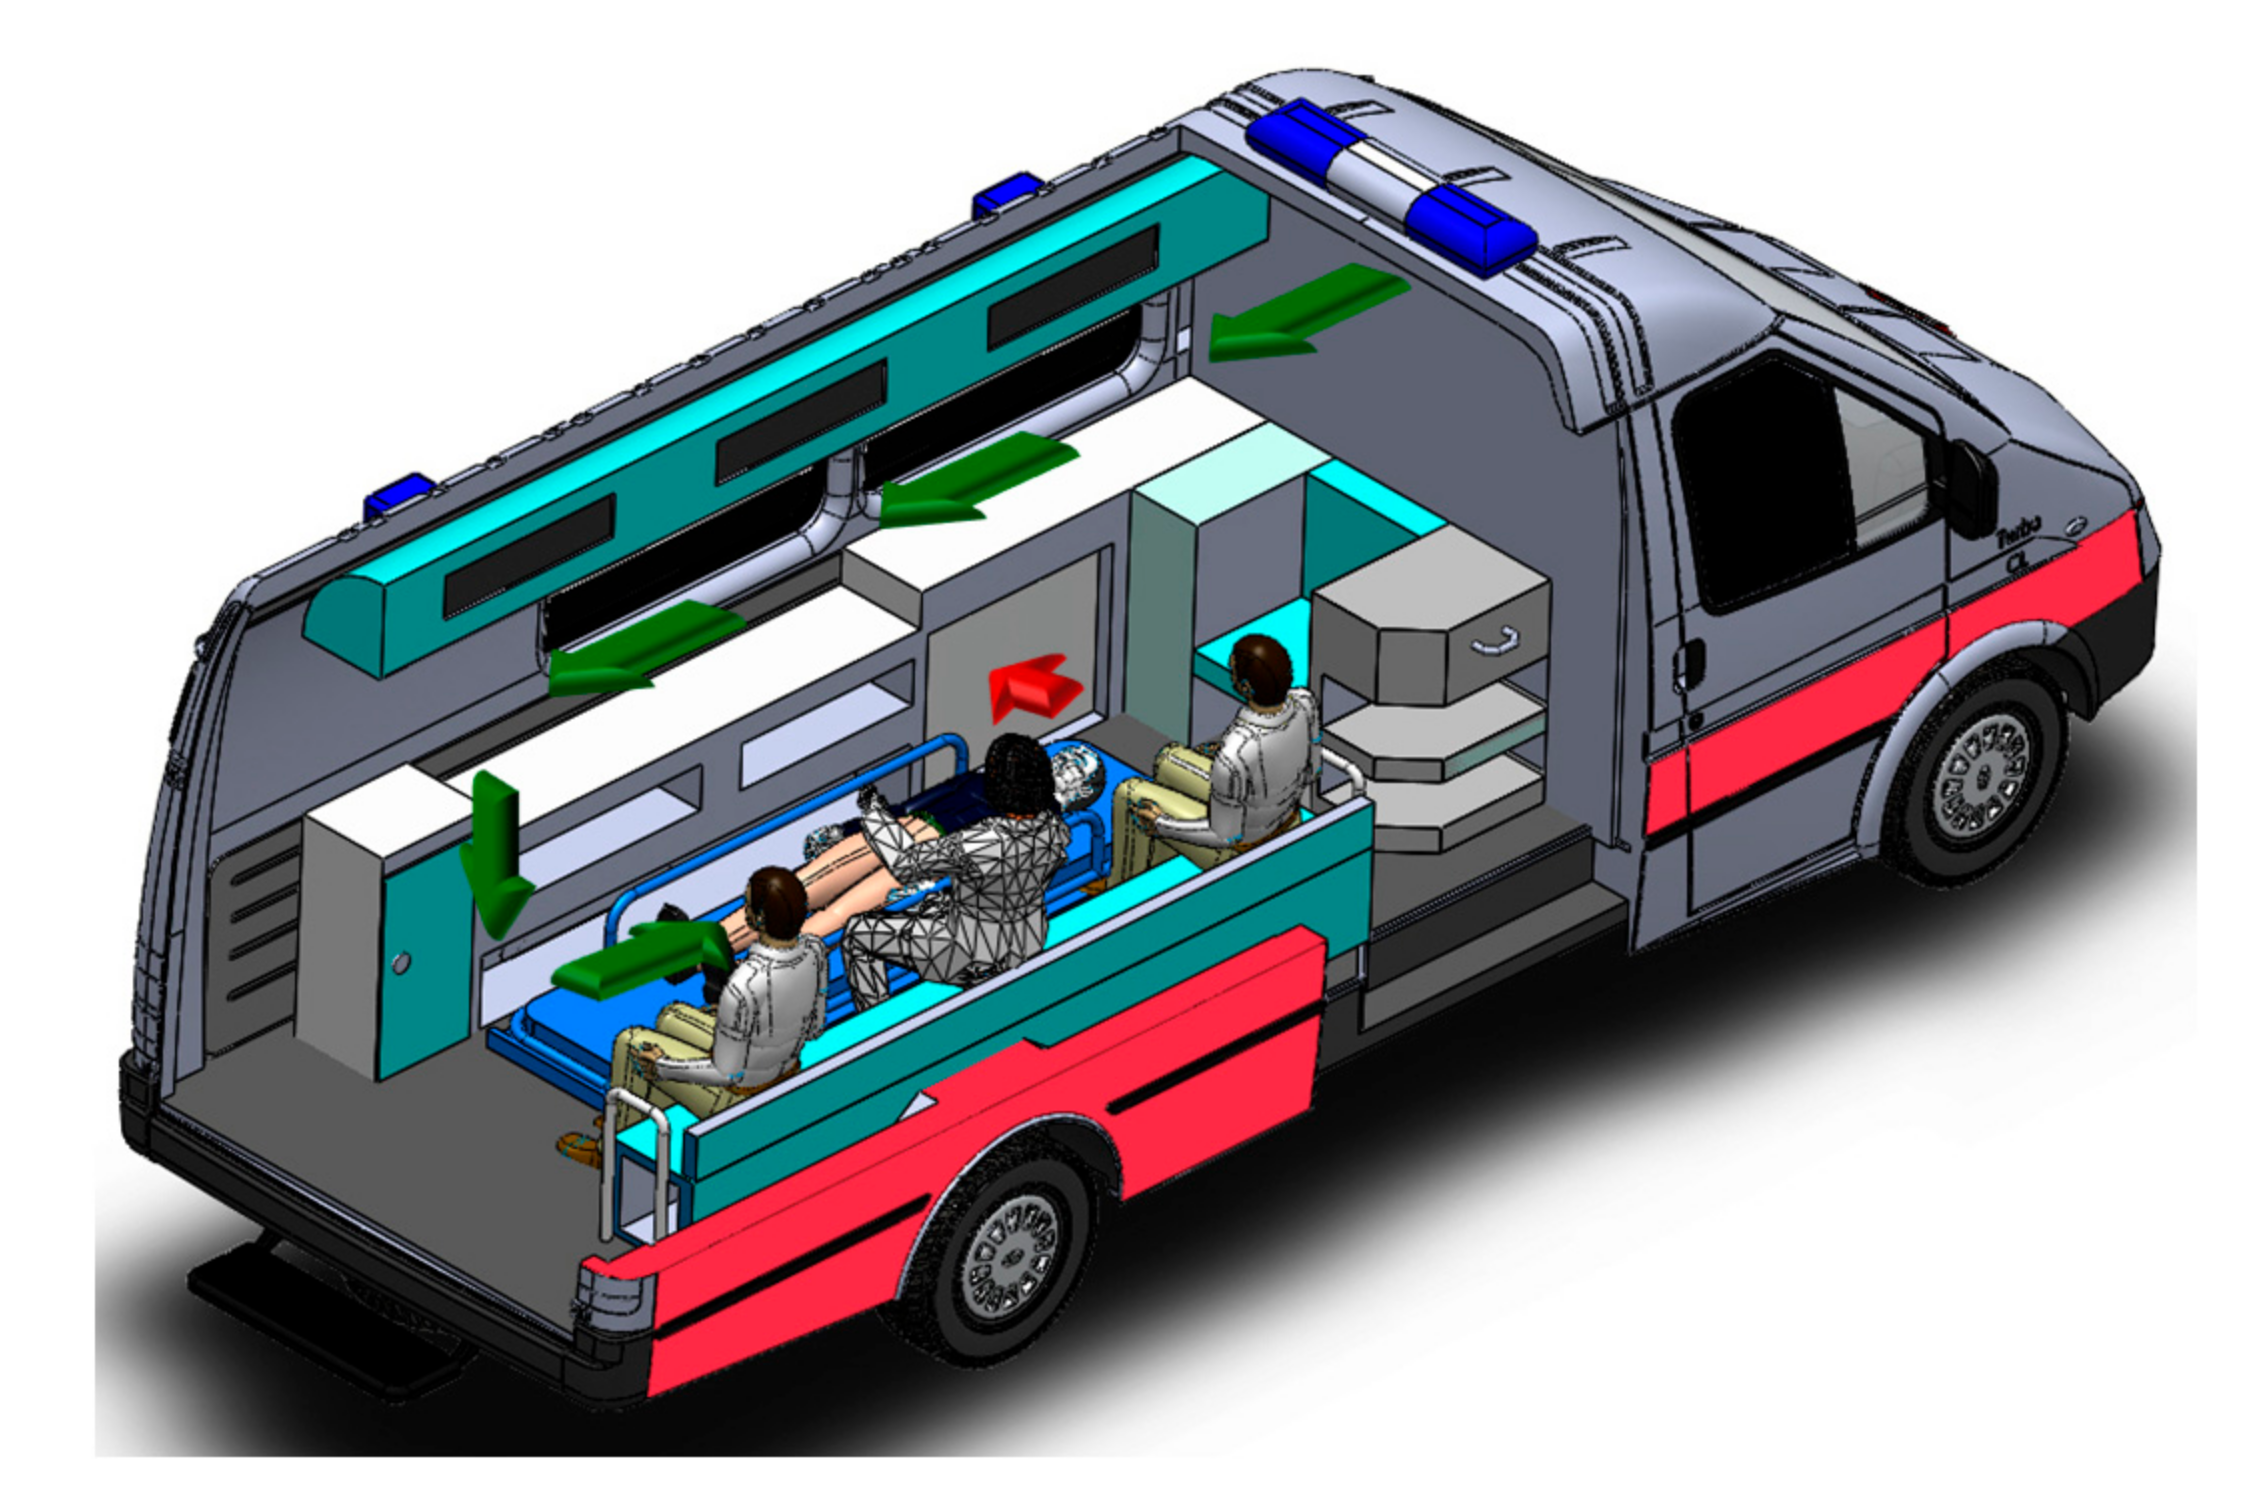
Health and anti-epidemic experts [5] have emphasized that the main transmission routes of new coronary pneumonia are direct transmission, aerosol transmission, and contact transmission [6]. When transporting patients with acute respiratory infectious diseases, in order to prevent the contagious disease virus exhaled by the patients from infecting the EMS workers in the vehicle and polluting the environment along the way, the best choice is to use a negative-pressure ambulance [7]. As shown in Figure 1, the negative-pressure ambulance uses a fan to filter the air in the medical cabin through a high-efficiency filtration device and discharge it out of the cabin, so that the airflow organization in the medical cabin moves in a directional manner [8]. It can minimize the frequency of viral infection of EMS workers and prevent the further spread of the epidemic [9]. However, current negative-pressure ambulances generally have disadvantages, such as unreasonable air supply inlets, excessively long airflow paths, and the inability to dynamically adapt to changes in the internal and external working conditions of the medical cabin, which pose a significant threat to the health and safety of EMS workers.
In addition to COVID-19, other respiratory infectious diseases, such as tuberculosis, also endanger the lives of EMS workers, who require special ambulances to protect them and transport patients. Although negative-pressure ambulances play a vital role in protecting EMS workers during the transfer of patients, there are some problems in structural optimization and safety, such as insufficient airflow path, uncertain distribution of droplet particles, low emission efficiency, and low security coefficient. Most importantly, the infection risk for EMS workers cannot be assessed. Especially when the patient has difficulty breathing, the EMS workers need to take off the patient’s mask to perform an aerosol-generating procedure. If the patient coughs or sneezes at this time, the risk of infection of the EMS workers will increase dramatically, especially in aerosol-generating operations [10]. This research mainly analyzes this dangerous situation and researches the problems of negative-pressure ambulances, as mentioned above.
2. Classification of Airflow Organization and Establishment of the Simulation Model
2.1. Classification of Airflow Organization
The airflow organization [11] is inseparable from the method that creates the air environment. Airflow organization refers to the temperature field, pressure field, velocity field, and droplet concentration field distribution, which organize the airflow direction and uniformity according to specific requirements. Good airflow organization design can quickly and effectively discharge contaminants in the medical cabin, prevent cross-infection, and ensure the safety of EMS workers [12].
In order to prevent virus-containing droplet particles [13] from being inhaled by EMS workers and causing new infections, the airflow organization design of the medical cabin needs to meet the following principles:
- (1)
- The air supply inlets and exhaust outlets should be distributed as far as possible at both ends of the medical cabin to ensure that the airflow in the cabin flows from the clean area to the contaminated area. That is, the clean air first flows through the main respiratory zone of the EMS workers, then flows to the patient, and finally to the exhaust outlet.
- (2)
- The air supply inlets should be arranged in an area with high air quality, and the exhaust outlets should be arranged in an area close to the pollution source. The air mixing between polluted and clean areas should be minimized.
- (3)
- It should avoid generating updrafts and prevent airflow dead zones.
According to the relative positional relationship between the air supply inlets, the exhaust outlets, and the airflow direction, the airflow organization of the medical cabin within negative-pressure ambulances can be divided into the following three types: front air supply, side air supply, and top air supply.
2.2. Establishment of Three Different Physical Models of Supply Airflow Organization
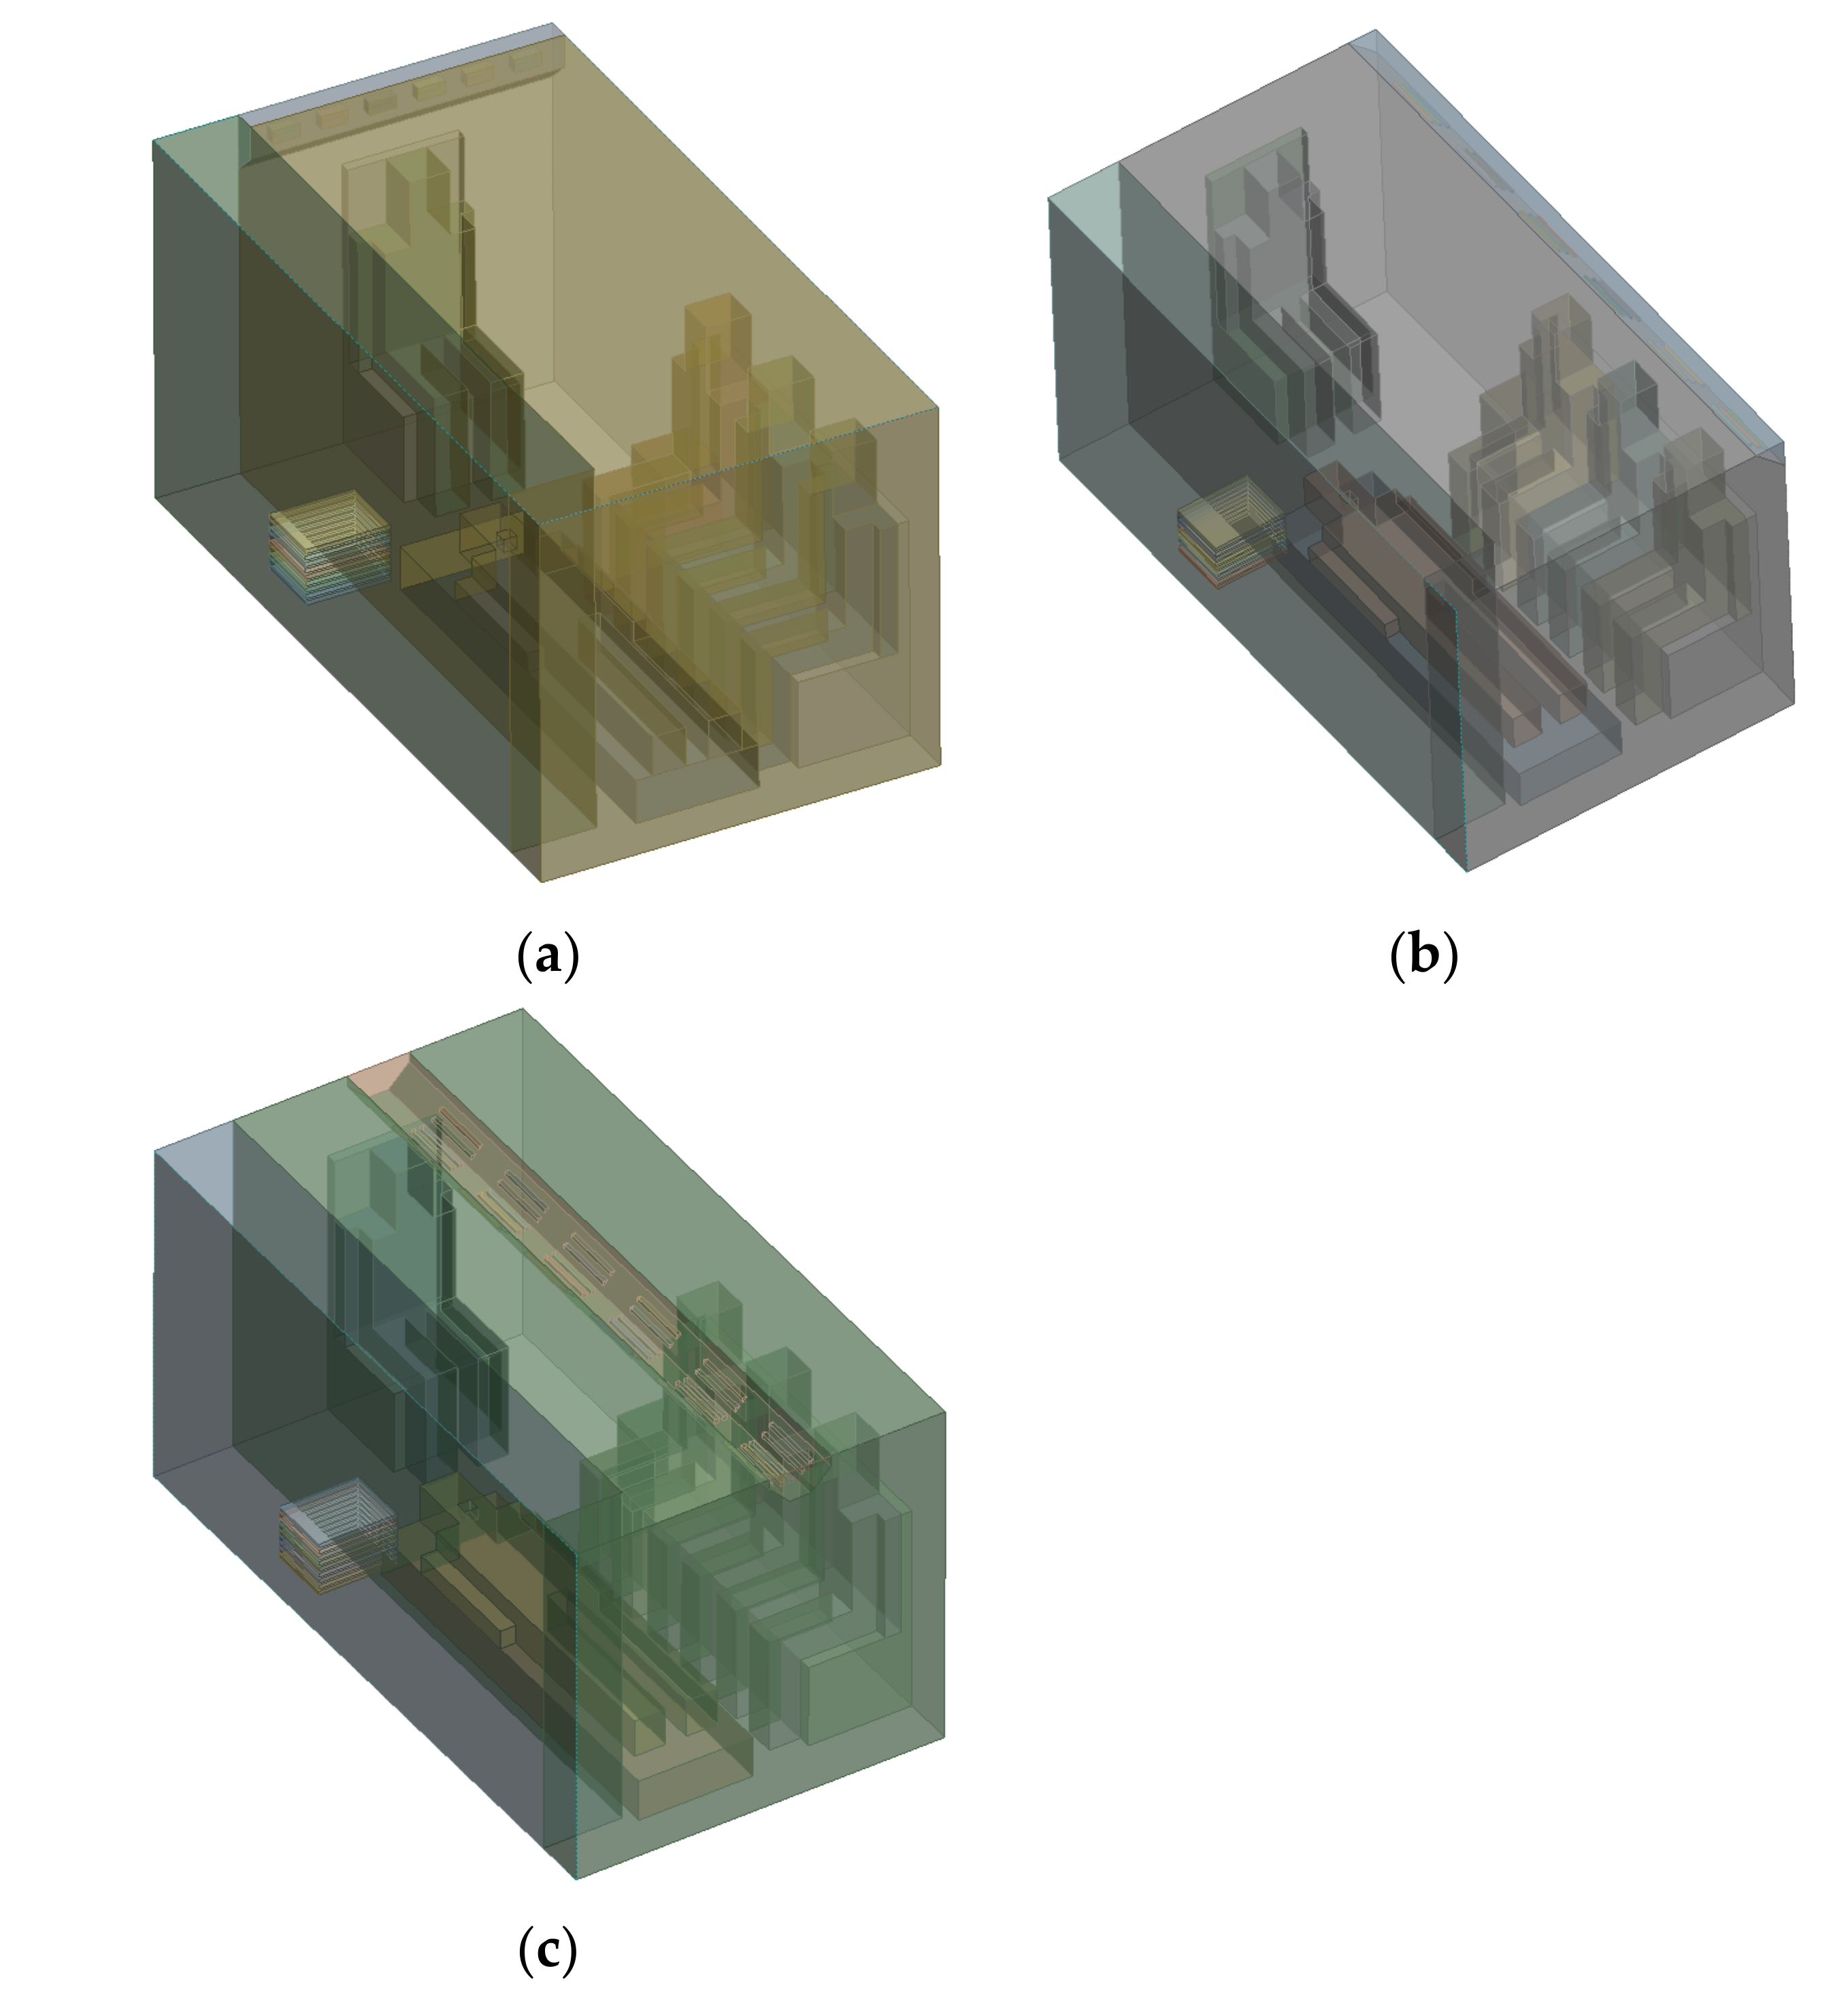
In this study, the medical cabin of a negative-pressure ambulance is selected as the research object. Generally speaking, the actual structure of the medical cabin itself and its many internal objects is relatively complex in shape. In order to improve the speed of the simulation calculation, reasonable simplifications can be made to the internal objects of the medical cabin, which do not only ensure the relative integrity of the medical cabin, but also reduce calculation time. Three types of medical cabin models of negative-pressure ambulances are established, which are the front SAOM, the side SAOM, and the top SAOM, as shown in Figure 2.
2.3. Establishment of Simulation Numerical Model
2.3.1. The Governing Equation of Fluid Flow
- (1)
- Continuity equation of fluid
Any fluid problem must satisfy the law of conservation of mass. This law can be expressed as the following: the increase in the mass of the fluid micro-element body in a unit of time is equal to the net mass of the in-flowing micro-element body within the same time interval. The mass conservation equation is as follows:
where represents the density of the fluid; and represents the velocity vector of the fluid.
- (2)
- Momentum conservation equation of fluid
The law of conservation of momentum is also the basic law of fluid flow, and its meaning is that the rate of change in the momentum of the fluid in a micro-element body with respect to time is equal to the sum of various forces acting on the micro-element body from the outside world.
where represents the static pressure; and and represent the gravitational volume force and the external volume force in the direction, respectively.
2.3.2. The Numerical Simulation Method
This research uses FLUENT software to simulate and analyze the medical cabin model. Since the gas flow field inside the medical cabin model is a turbulent flow, there are many turbulence models that can be applied in FLUENT. Choosing a reasonable turbulence model will affect the accuracy and convergence of the calculation results. Because the Standard model [14,15] has a wide range of applications and an appropriate calculation accuracy, this study uses this model to simulate the movement of droplet particles in the medical cabin in an unsteady state. The model needs to calculate and solve the turbulent kinetic energy equation and the dissipation rate equation. The transmission equation of the Standard model is as follows:
where represents the turbulent kinetic energy generated by the average velocity gradient; represents the turbulent flow energy due to buoyancy; represents the contribution of pulsation expansion in compressible turbulence; represent the empirical constant represents turbulent viscosity; and , respectively, represent the Prandtl numbers corresponding to and ; and represent user-defined source items.
2.3.3. The Discrete Phase
This article studies the movement of droplet particles in the medical cabin, and its movement can be described by using a discrete-phase random-trajectory model. The movement, diffusion, and deposition of droplet particles in the medical cabin can be studied by tracking the movement trajectory of the particles. When using FLUENT to simulate, the gas is a continuous phase, and the droplet particles are a discrete phase [16]. The DPM model [17] is suitable for gas-liquid two-phase flow with a particle volume fraction below 10%. The DPM model adopts Euler-Lagrangian calculation ideas, processing the continuous phase in Euler coordinates and the discrete phase in Lagrangian coordinates. This needs to consider the force of the particles. Inside the medical cabin, the forces on a single droplet particle mainly include gravity and fluid drag [18], as well as other additional forces, such as pressure gradient force, Saffman lift force, drag force, etc. Although the movement of droplet particles in the flow field is subject to many other additional forces, not all forces are important to their movement. This article mainly considers gravity, fluid drag, and Saffman lift force. Therefore, the force balance equation of a single droplet particle is as follows:
where represents the velocity of the particles, m/s; represents the gravity of the particles, m/s2; represents the drag force of the particles, m/s2; and represents the Saffman lift force of the particle, m/s2.
2.4. The Boundary Conditions
The medical cabin within the negative-pressure ambulance uses a negative-pressure exhaust outlet to discharge droplet particles. In the FLUENT software, the boundary condition of outlet is the pressure outlet, the gauge pressure value is −30 Pa, and its discrete phase boundary condition is ESCAPE. The air supply inlets are set to velocity inlet boundary condition, and its velocity is 2 m/s. The particle incidence is set to velocity inlet boundary condition. The heat flux of human is set to 60 W/m2. The discrete phase boundary condition of EMS workers is TRAP. The specific parameters of droplet particles are shown in Table 1.
3. The Influence of Three Airflow Organization Models on the Movement of Droplet Particles
3.1. The Distribution State of Droplet Particles of the Front SAOM
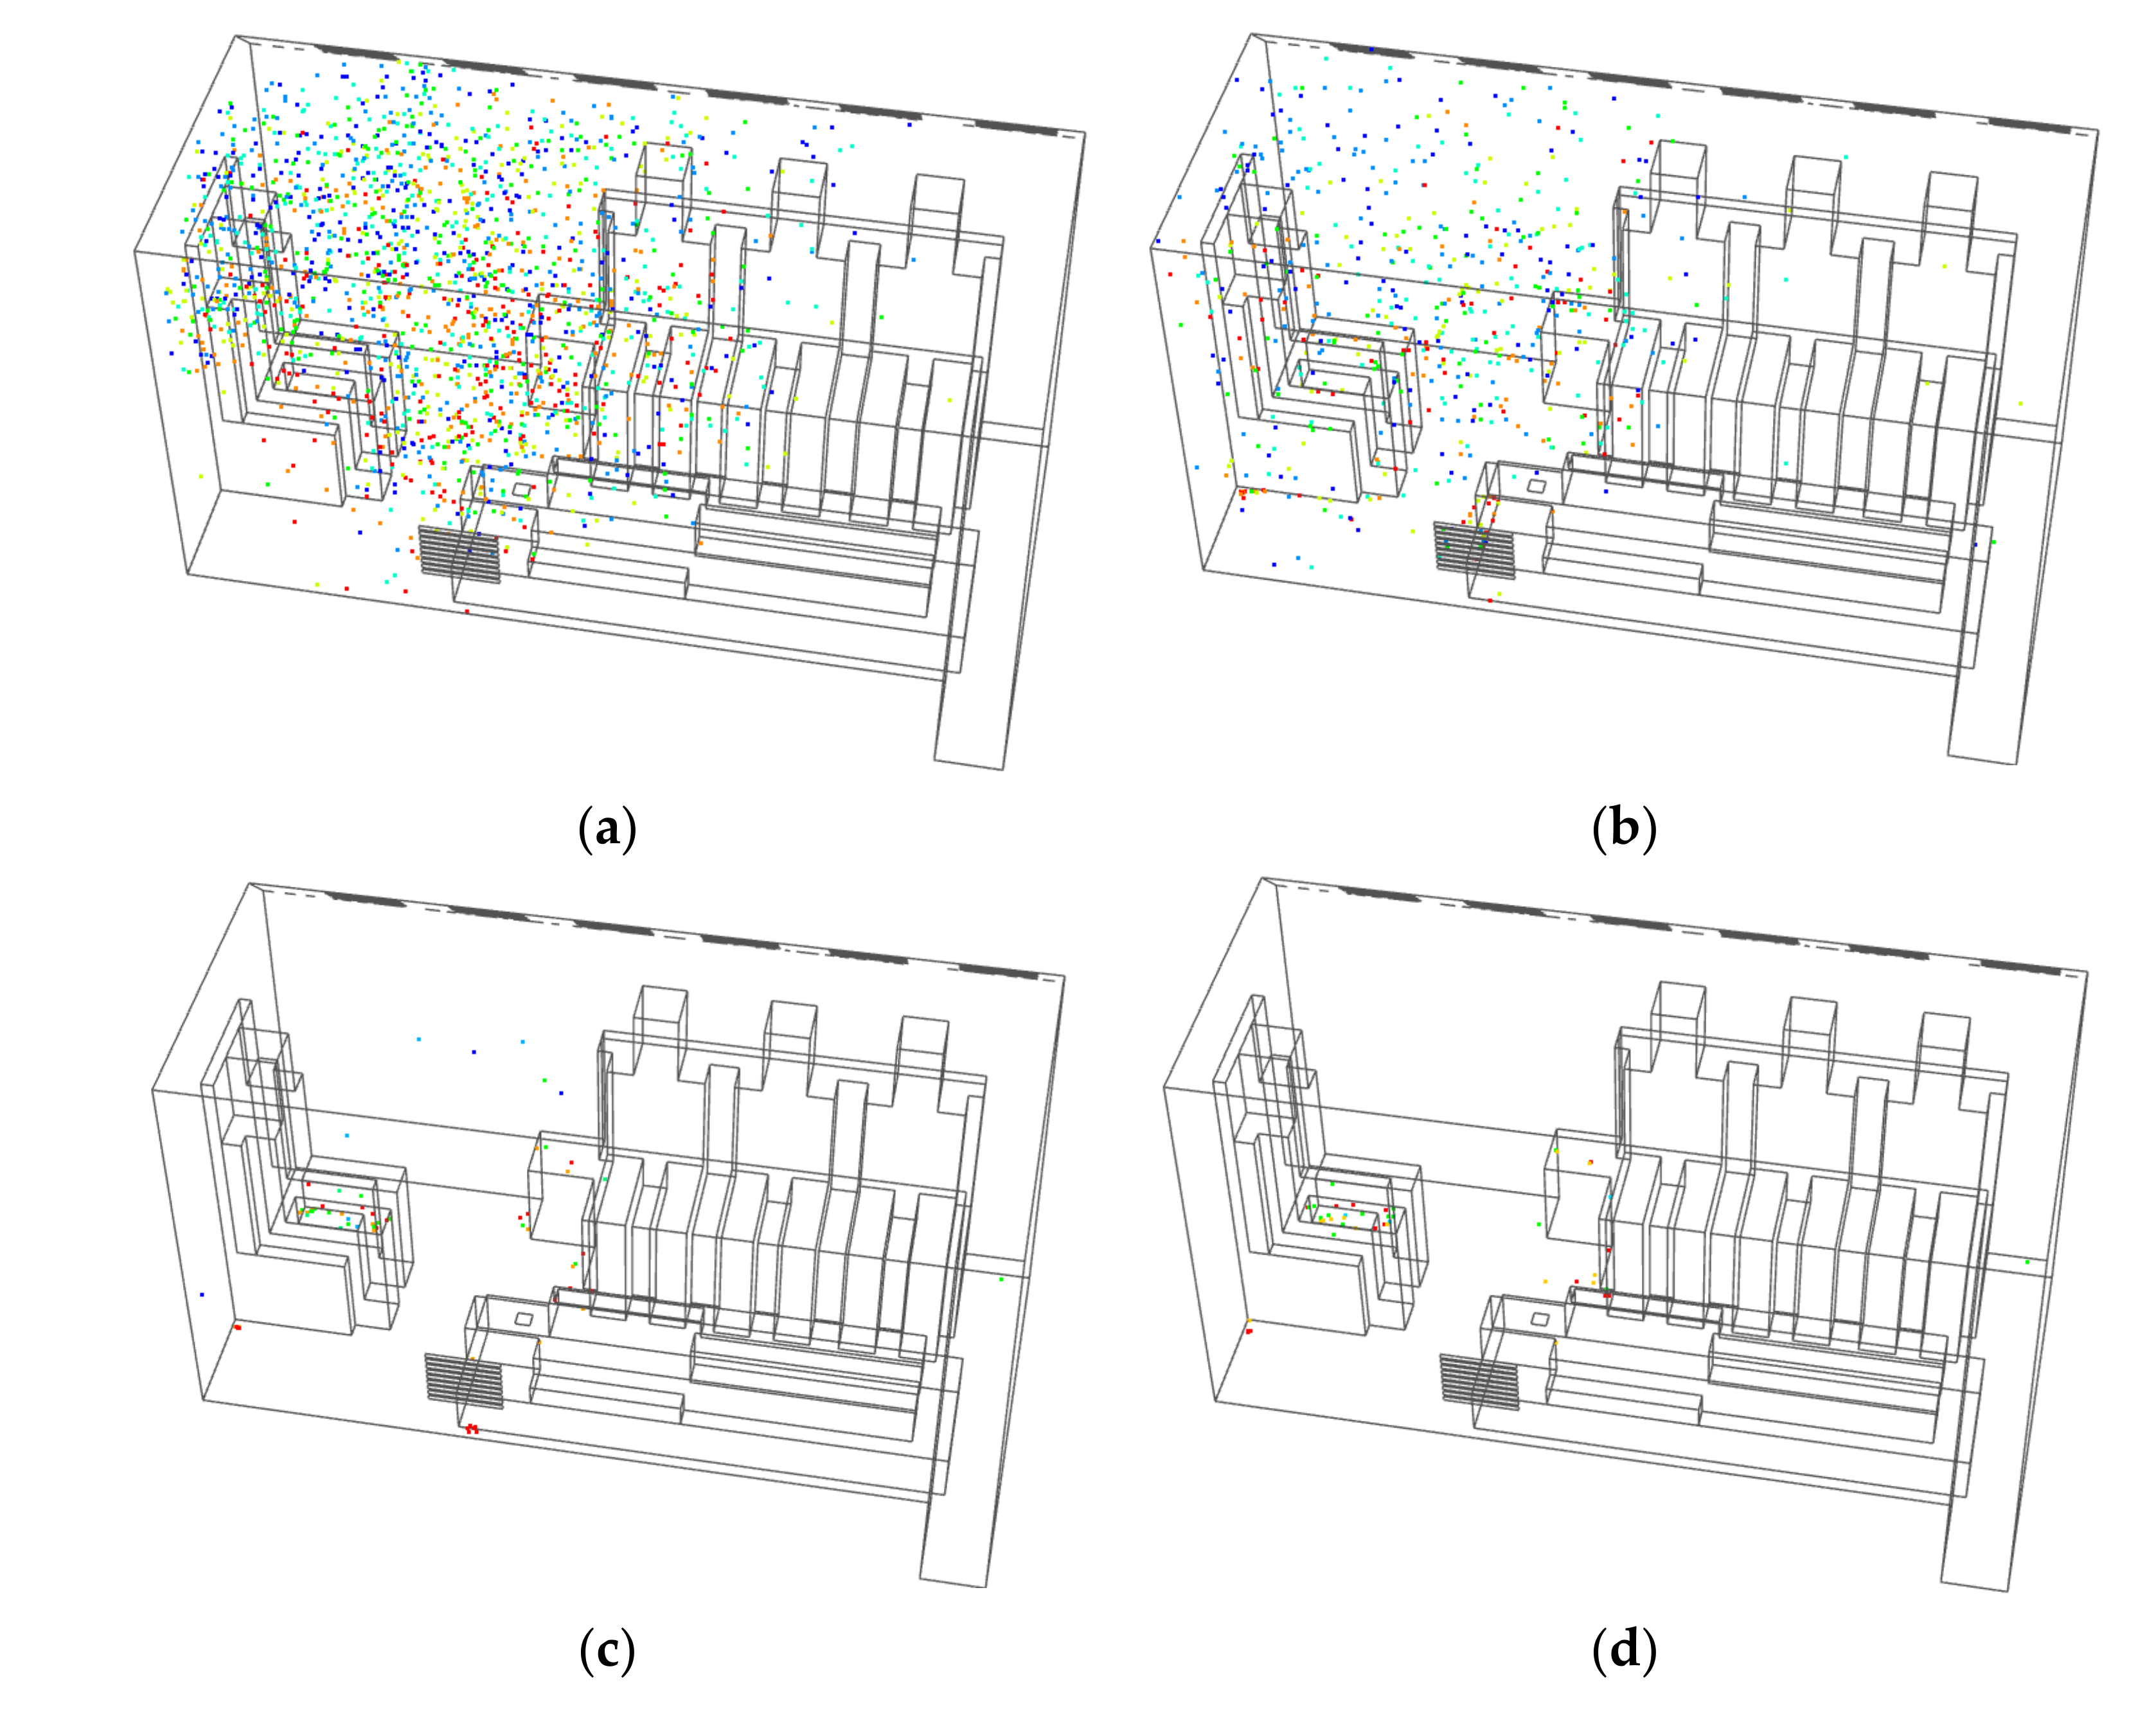
3.1.1. The Distribution State of Droplet Particles during Coughing
As shown in Figure 3, the droplet particles moved to the back of the medical cabin at 6 s, and the droplet particles began to be discharged from the medical cabin by the negative-pressure exhaust outlet. The droplet particles begin to accumulate in the turbulent vortex [19] with the movement of the airflow organization at 20 s [20]. A large number of droplet particles were discharged from the medical cabin by 80 s. During the interval between 80 s and 120 s, most of the droplet particles were discharged from the medical cabin, but there were still a few droplet particles in the turbulent vortex at 120 s.
3.1.2. The Distribution State of Droplet Particles during Sneezing
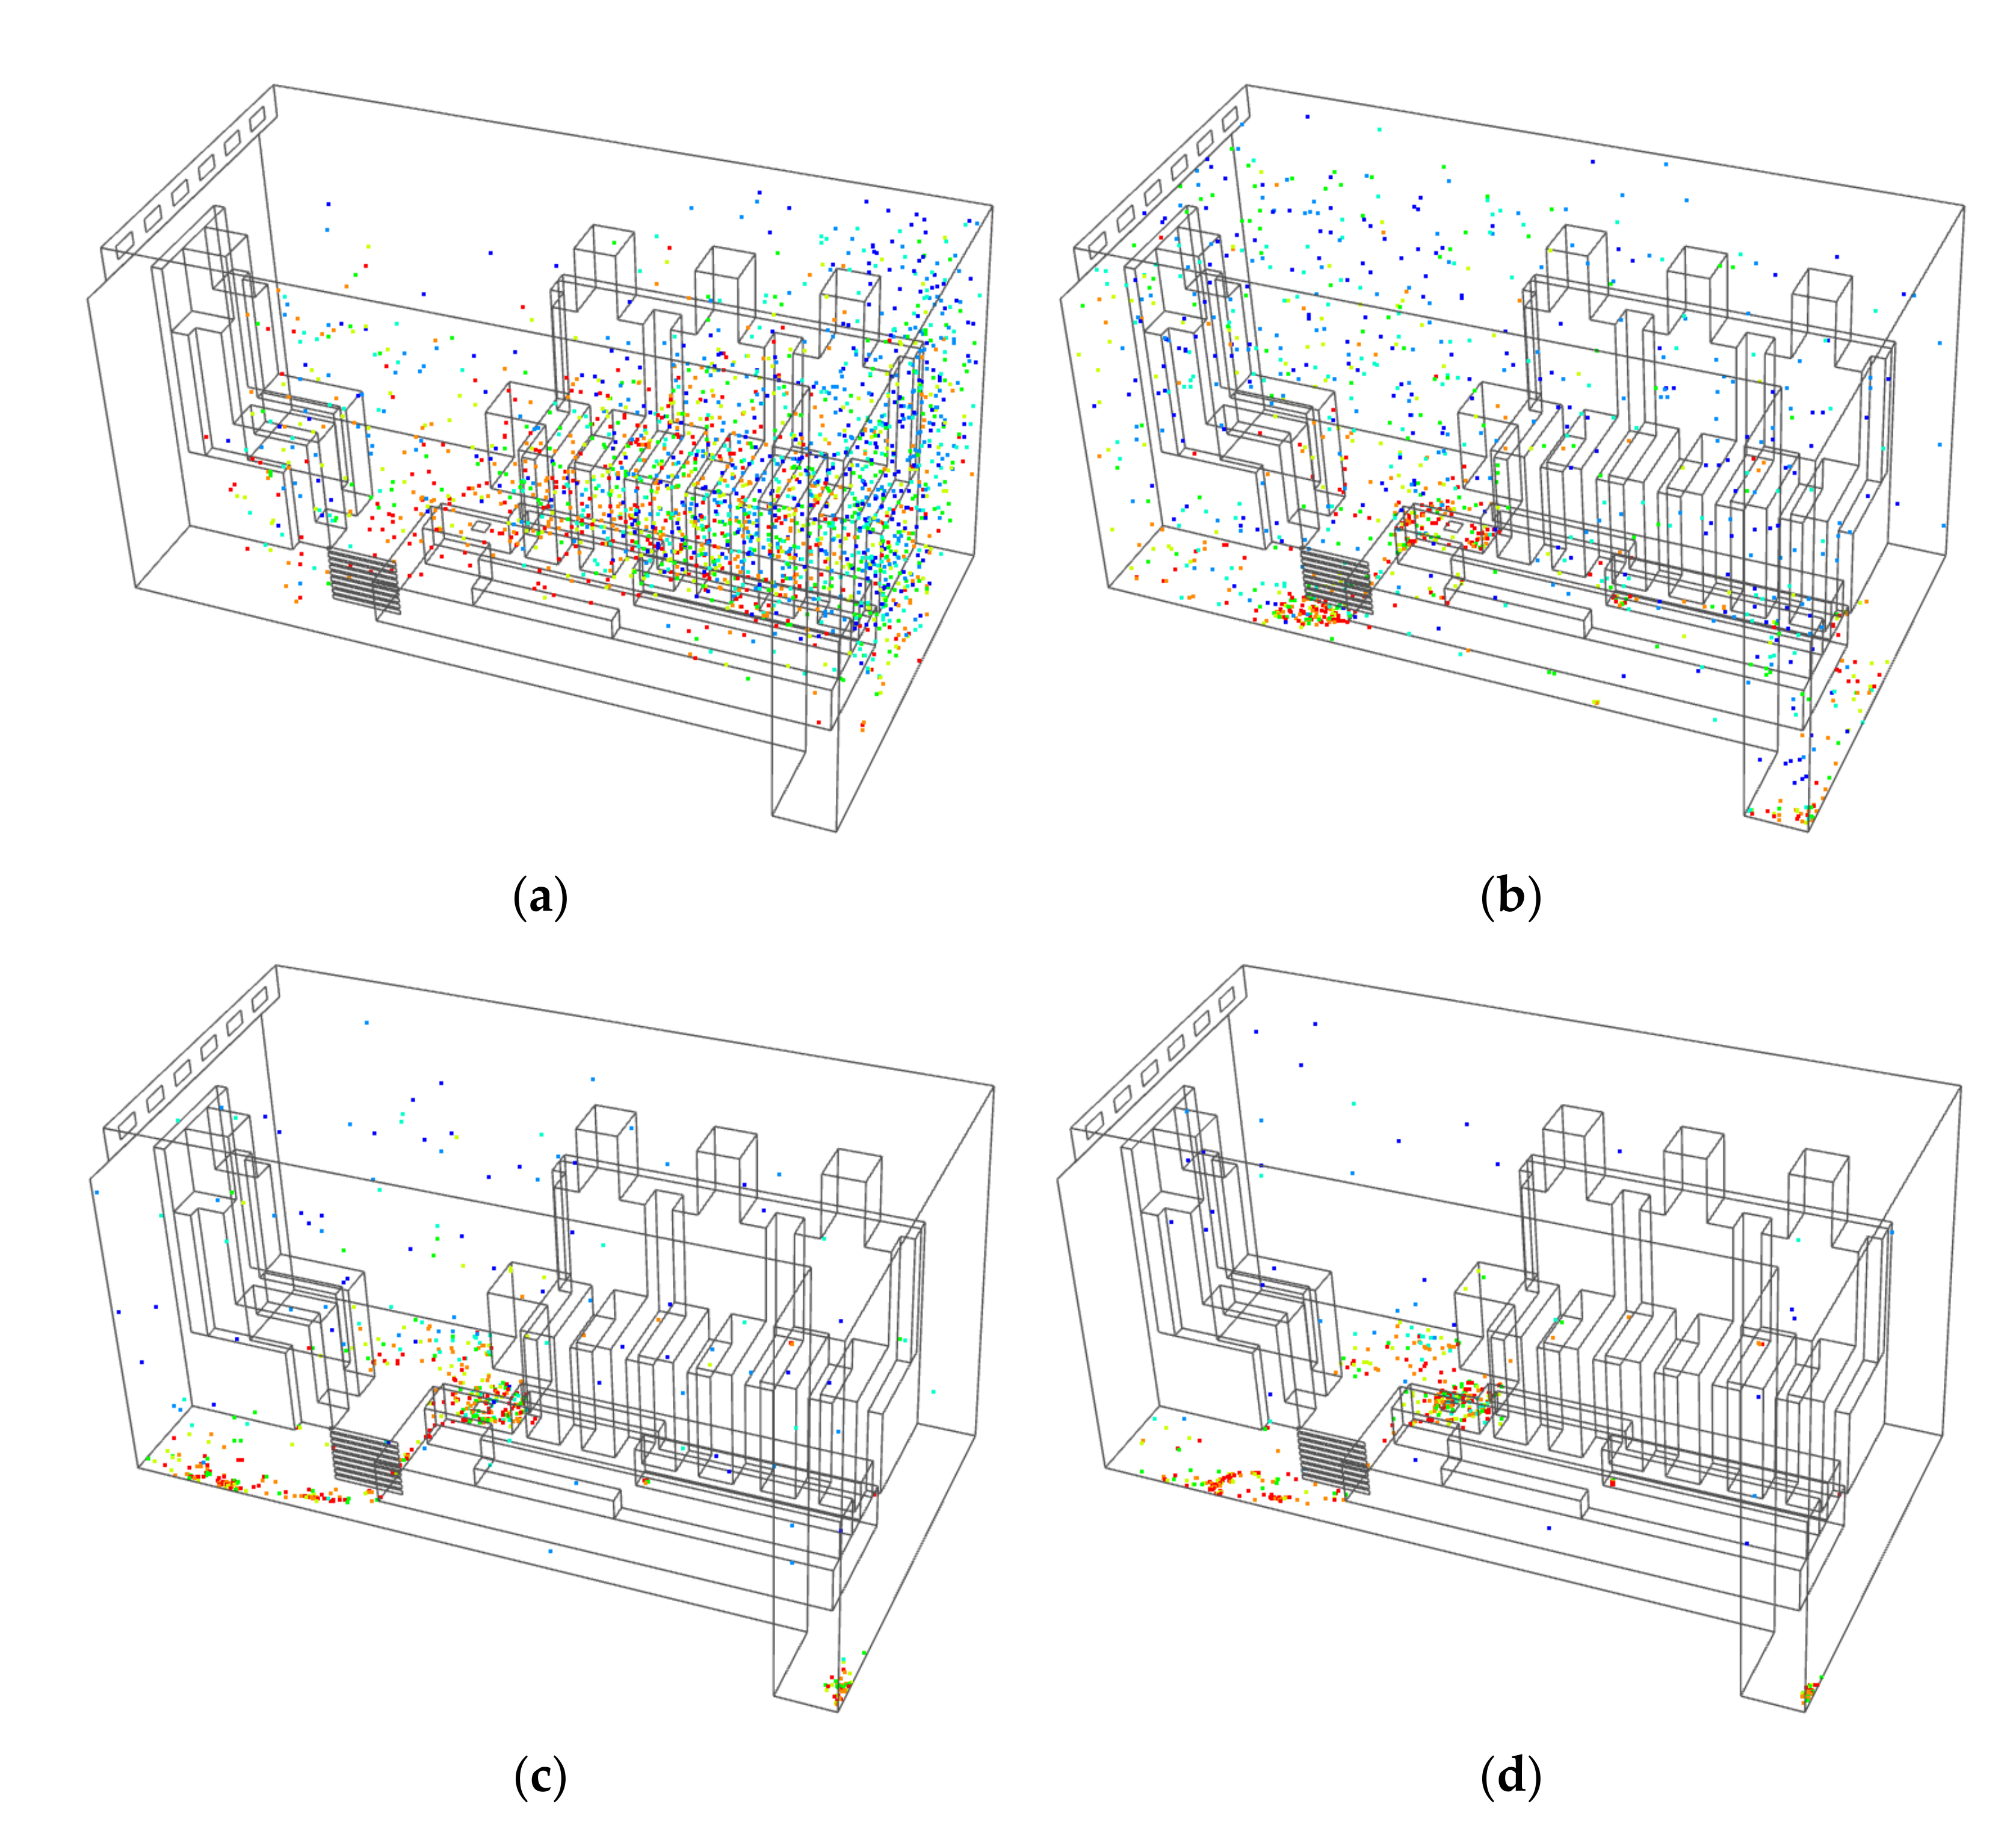
As shown in Figure 4, the droplet particles had spread to the entire medical cabin at 2 s. At 8 s, under the action of the airflow organization of the air-conditioning supply, the droplet particles began to gather in the turbulent vortex in the medical cabin, and a large number of droplet particles were discharged from the medical cabin. Due to the turbulent vortexes, the particles stayed for longer time. In the interval between 40 s and 120 s, a small number of the particles were retained in the turbulent vortex, and a large number of droplet particles were discharged from the medical cabin by 120 s.
3.2. The Distribution State of Droplet Particles of the Side SAOM
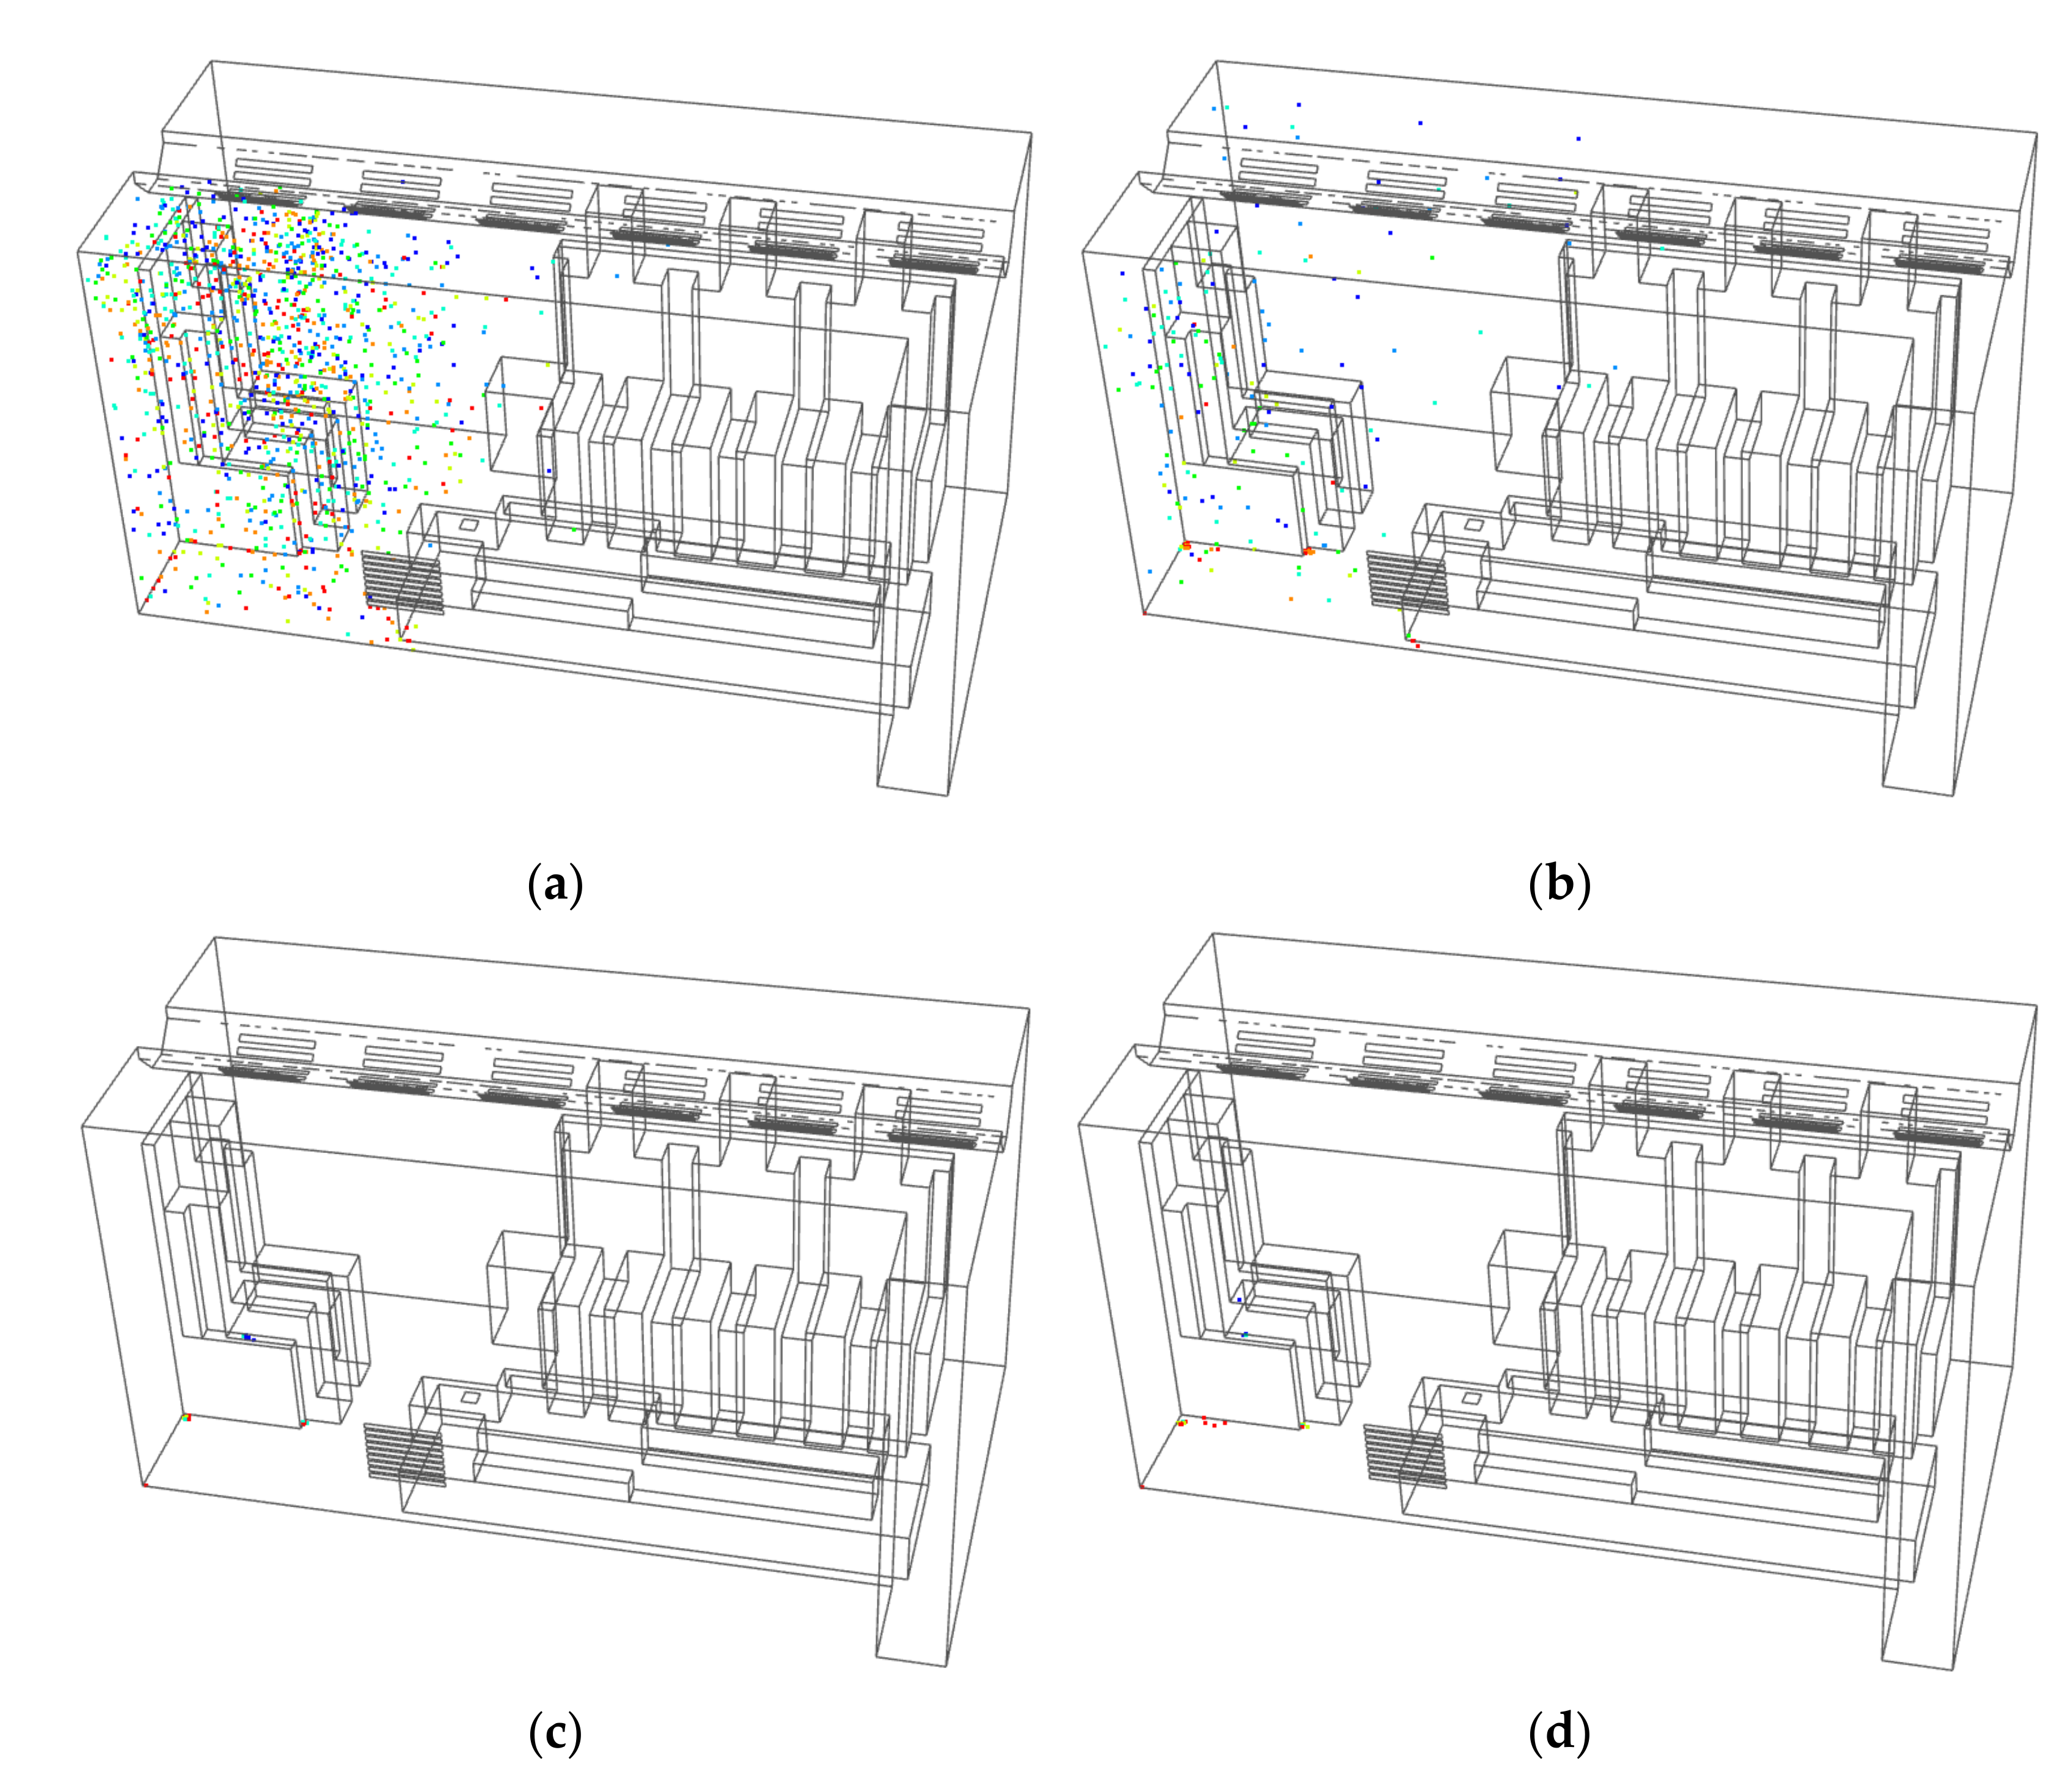
3.2.1. The Distribution State of Droplet Particles during Coughing
As shown in Figure 5, the droplet particles moved to the middle of the medical cabin at 6 s, and a small amount of droplet particles moved to the back of the medical cabin. However, most of the droplet particles moved in front of the medical cabin, and the droplet particles began to be discharged from the medical cabin by the negative-pressure exhaust outlet. The droplet particles began to gather in the turbulent vortex with the movement of the airflow organization at 20 s. The particles stayed in the turbulent vortex for a long time, but a large number of droplet particles were smoothly discharged from the medical cabin. In the interval between 80 s and 120 s, most of the droplet particles were discharged from the medical cabin, but there were still dozens of droplet particles in the turbulent vortex at 120 s.
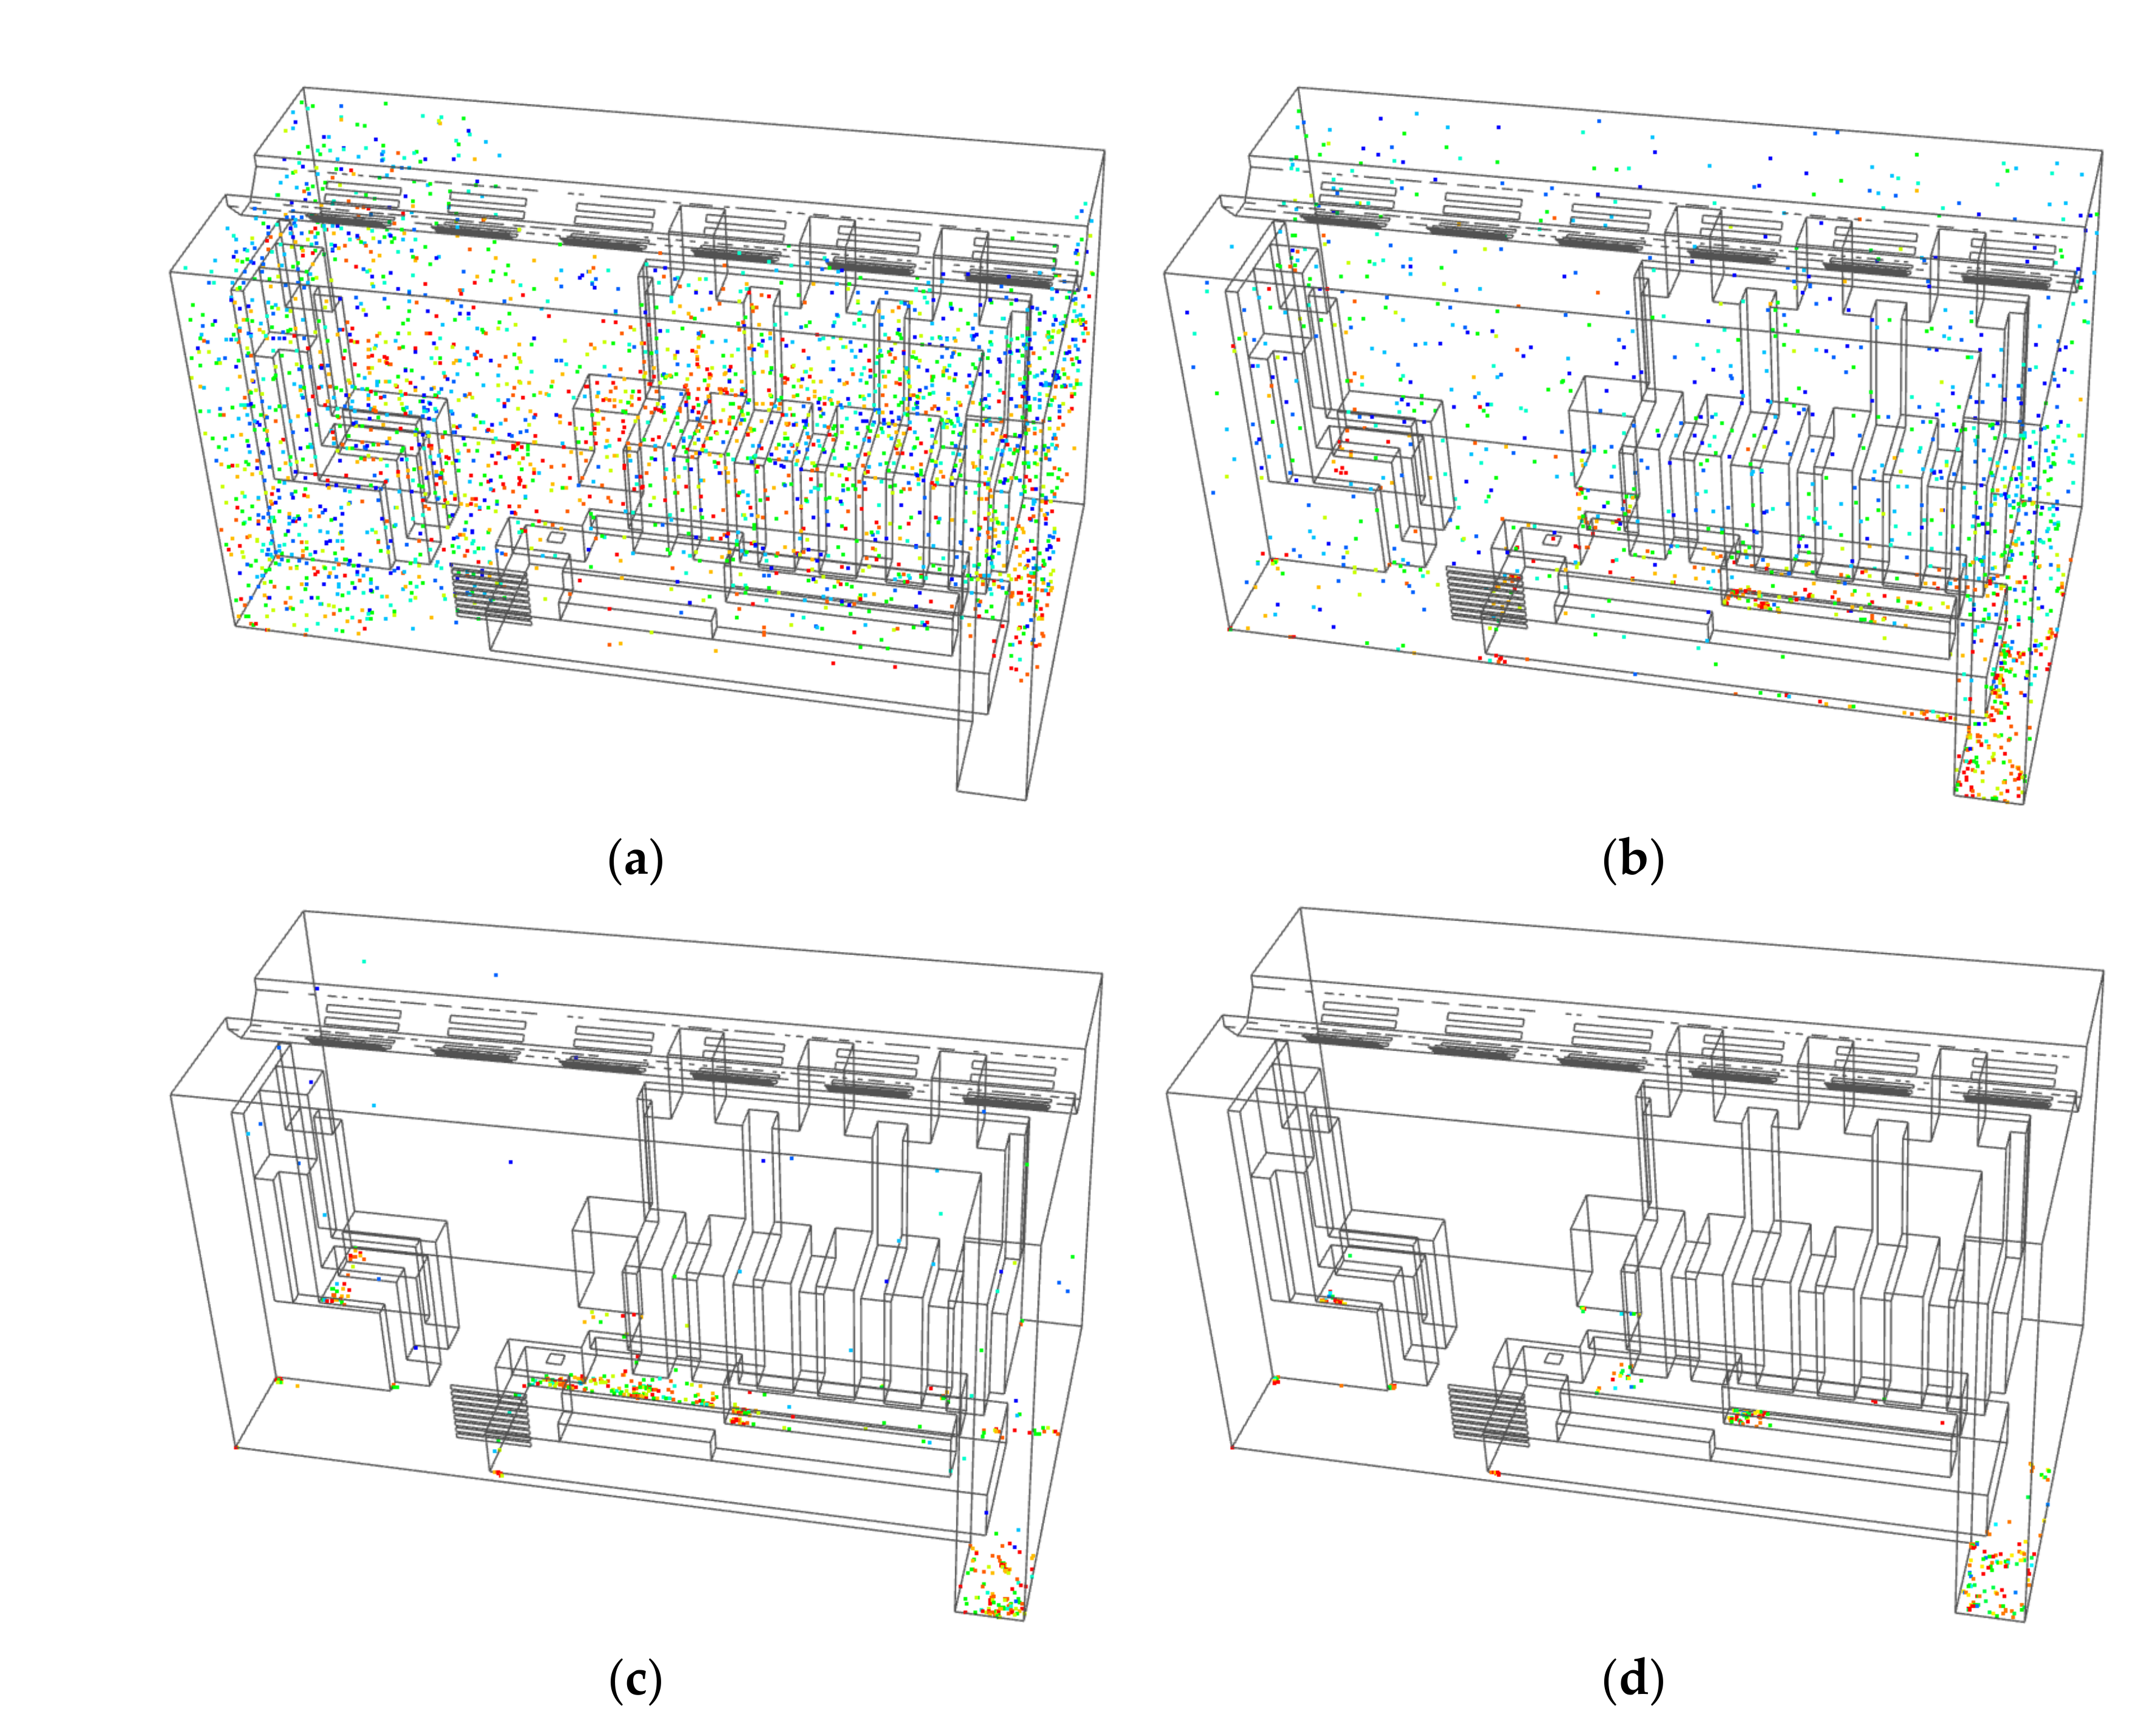
3.2.2. The Distribution State of Droplet Particles during Sneezing
As shown in Figure 6, the droplet particles had spread to the entire medical cabin at 2 s. At 8 s, under the influence of the airflow organization of the air-conditioning supply, the droplet particles began to gather in the turbulent vortex in the medical cabin, and a large number of droplet particles were discharged from the medical cabin. Although the number of droplet particles in the turbulent vortex decreased at 40 s, there were still a lot of droplet particles that remained. In the interval between 40 s and 120 s, droplet particles were still discharged from the medical cabin, but there were still a large number of droplet particles in the turbulent vortexes at 120 s, which were mostly distributed in the front and back of the medical cabin.
3.3. The Distribution State of Droplet Particles of the Top SAOM
3.3.1. The Distribution State of Droplet Particles during Coughing
As shown in Figure 7, the droplet particles moved to the middle of the medical cabin at 6 s, but most of the droplet particles only moved in the front of the medical cabin. A small amount of droplet particles stayed in the turbulent vortex for long time at 20 s, but a large number of droplet particles were smoothly discharged from the medical cabin. Almost all the droplet particles were discharged during the interval between 80 s and 120 s, but there were still some droplet particles in the turbulent vortexes at 120 s.
3.3.2. The Distribution State of Droplet Particles during Sneezing
As shown in Figure 8, the droplet particles had spread to the entire medical cabin at 2 s, and a small amount of droplet particles had begun to be discharged from the medical cabin. At 8 s, under the influence of the airflow organization of the air-conditioning, the droplet particles began to gather in the turbulent vortex in the medical cabin. The turbulent vortex is mainly distributed in the back of the medical cabin, and a large number of droplet particles are discharged from the medical cabin. Although the number of droplet particles in the turbulent vortex decreases during the interval between 40 s and 120 s, there were still a lot of droplet particles left in them. At 120 s, a small amount of droplet particles were mainly concentrated in the turbulent vortex at the back of the medical cabin.
3.4. Comparison and Analysis of the Influence of Three Airflow Organization Models on the Movement of Droplet Particles
FLUENT software was used to simulate the movement of droplet particles of the three airflow organization models, and the statistics of the droplet particles of these three models were obtained, as shown in Table 2 and Table 3.
3.4.1. Comparison and Analysis of Emission Efficiency
Emission efficiency is the ratio of the number of droplet particles discharged in a certain period of time to the total number of droplet particles produced, reflecting the purification effect of pollutants within a certain period of time. According to the data in Table 2 and Table 3, the comparison diagrams of the emission efficiency of the three models for coughing and sneezing are obtained, respectively, as shown in Figure 9.
In Figure 9a, it can be seen that the side SAOM has the highest emission efficiency when coughing, with an efficiency of 88.45%; in contrast, the front SAOM has the lowest emission efficiency, with an efficiency of 55.97%. The difference in the emission efficiency between the side SAOM and the top SAOM is very small, about 1%, and both are much higher than the emission efficiency of the front SAOM. In Figure 9b, it can be seen that the top SAOM has the highest emission efficiency when sneezing, with an efficiency of 67.35%; in contrast, the front SAOM has the lowest emission efficiency, with an efficiency of 28.68%. The difference in emission efficiency between the side SAOM and top SAOM is 15.23%, and the difference in emission efficiency between the front SAOM and top SAOM is 38.67%. All in all, the top SAOM has much higher emission efficiency than the other two models.
3.4.2. Comparison and Analysis of Security Coefficient
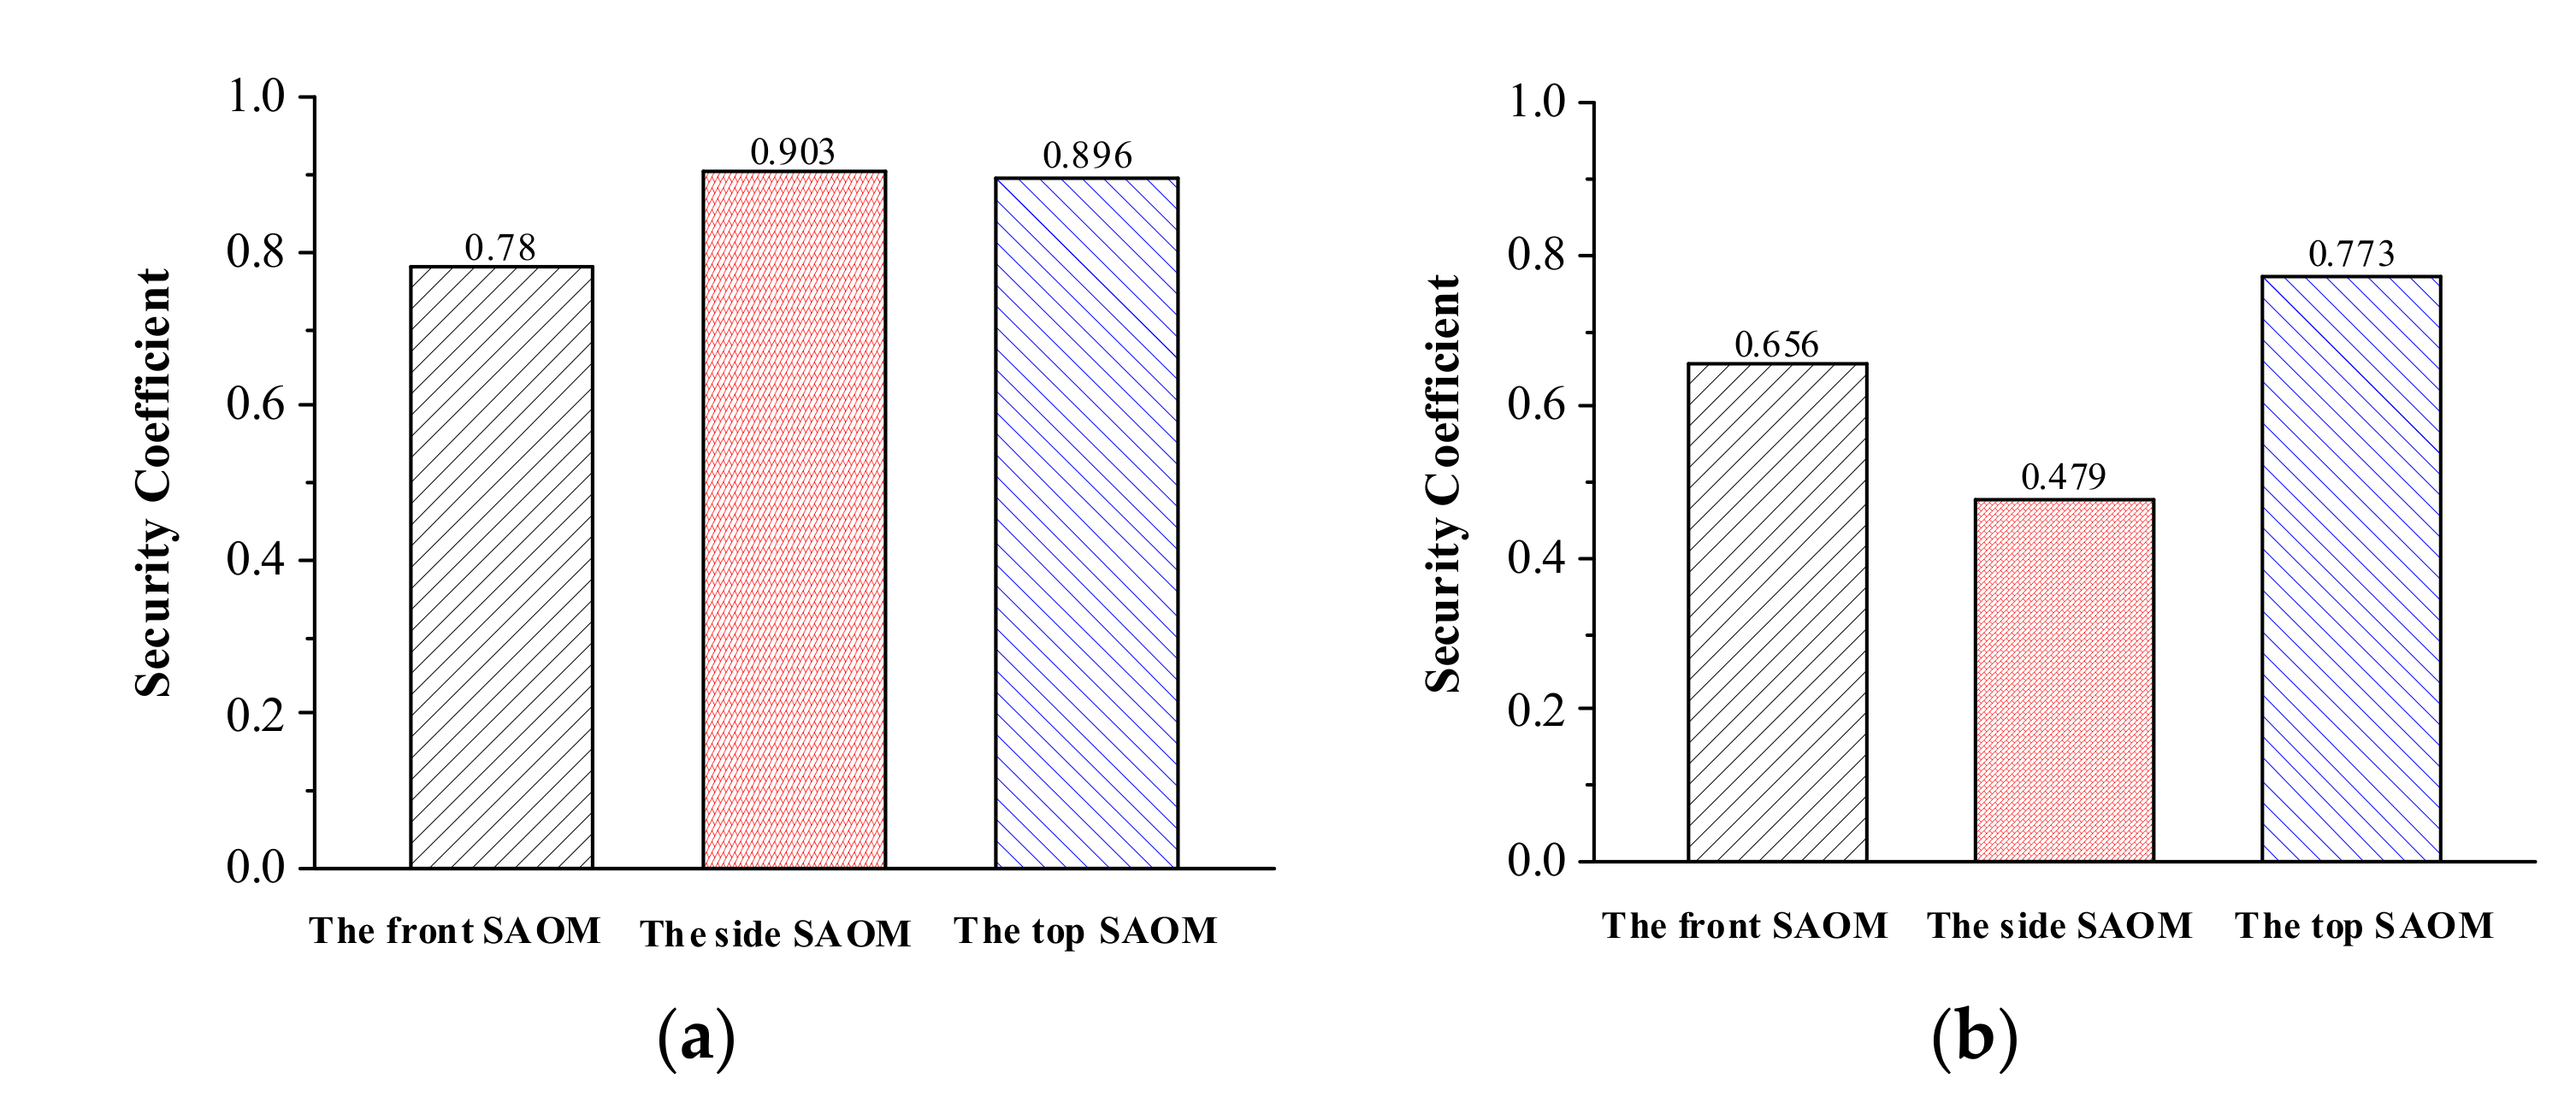
The security coefficient is the ratio of the number of droplet particles that are not trapped by EMS workers within a certain period of time to the total number of droplet particles produced, reflecting the safety impact on EMS workers within a certain period of time. According to the data in Table 2 and Table 3, the comparison diagrams of the security coefficient of the three models for coughing and sneezing are obtained, respectively, as shown in Figure 10.
According to Figure 10a, the security coefficient of the side SAOM is the highest when coughing at 0.903, and the security coefficient of the front SAOM is the lowest at 0.78. The security coefficient difference between the side air supply and the top SAOM is very small, and both of them are much higher than the security coefficient of the front SAOM. According to Figure 10b, the security coefficient of the top SAOM is the highest when sneezing at 0.773, and the security coefficient of the side SAOM is the lowest at 0.479. In contrast, the top SAOM has a much higher security coefficient than the other two models.
4. Response Surface Optimization
Through the comparison and analysis of the three airflow organization models, it can be seen that the emission efficiency and security coefficient of the top SAOM is better than those of the other two. Based on the comparative analysis in Section 3, this section considers that the velocity of the inlet airflow and the pressure of the negative-pressure exhaust outlet have a greater impact on the emission efficiency and security coefficient. The emission efficiency and security coefficient of the top SAOM when sneezing are optimized through the response surface method, and better inlet velocity and outlet pressure are obtained.
4.1. Response Surface Method and Parameter Design
The response surface method is a parameter optimization method that combines mathematical and statistical methods. It was first proposed by Box and Wilson [21] in 1951. Its principle is to build a surface through the actual values of many functions around a point. In the area sufficiently close to the point, the surface can replace the actual model. The second-order design method is used in this study, and the expression of the response function is as follows:
where represents the regression coefficient, represents the number of influencing factors, represents the error of the objective function, x is the independent variable, and y is the objective function.
In this study, the emission efficiency and security coefficient of the medical cabin within the negative-pressure ambulance is taken as the response function. Because the velocity of the inlet airflow and the pressure of the exhaust outlet have a greater impact on the emission efficiency and the security coefficient, these two factors are selected as the optimization parameters. The response surface method of the Central Composite second-order design method is used for optimization. There are 52 = 25 combinations of two factors and five levels of optimization variables, but by using the CCD design method, the number of test groups is 13, which reduces the workload by half. When designing using the CCD design method in the Design-Expert software, the two independent variables, the velocity of the inlet airflow and the pressure of the exhaust outlet, are represented by the letters X1 and X2, respectively, as shown in Table 4 below.
After the above scheme is determined, the emission efficiency and security coefficient are used as the dependent variables, and the values of the dependent variables under various conditions obtained by the FLUENT software are input into Design-Expert. Finally the results of the response surface experiments are obtained, as shown in Table 5.
4.2. Regression Analysis
4.2.1. Emission Efficiency
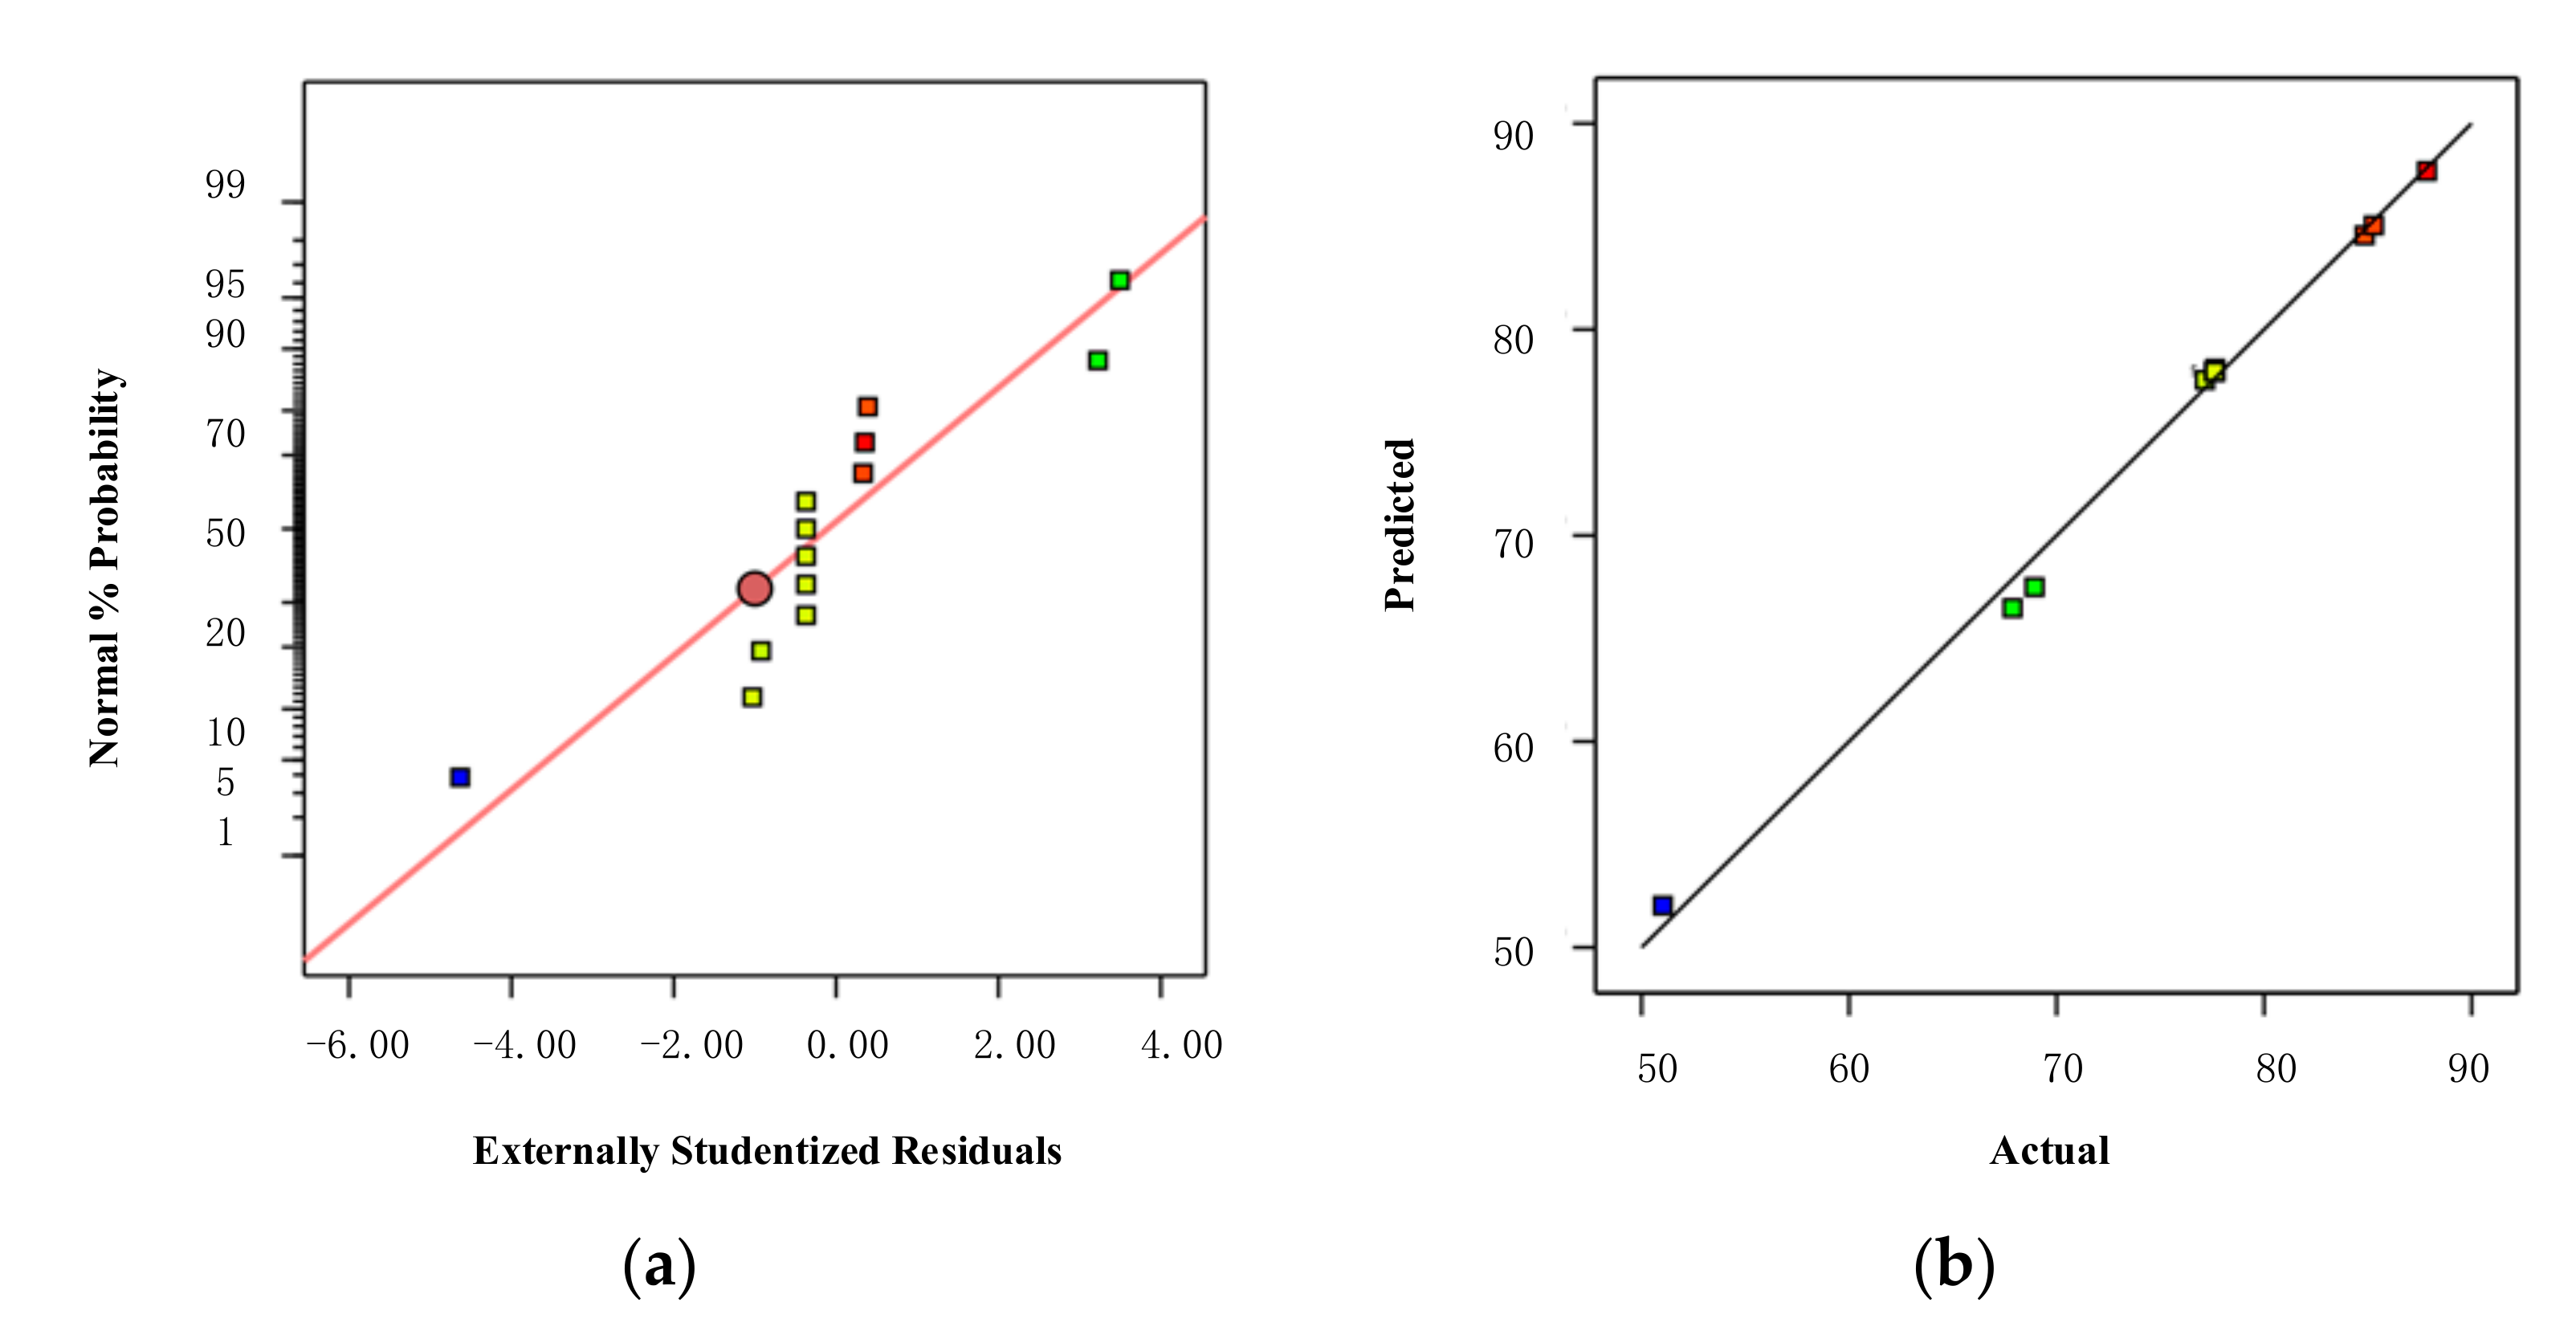
After importing the simulation results into Design-Expert, the results are fitted by the least squares method. Table 6 presents the analysis of variance for the quadratic equation. Table 6 shows that the p value of the model is less than 0.0001, which indicates that the model is extremely significant. The determination coefficient R2 = 0.9942 is greater than 0.95, which indicates that the model has a relatively high reliability. The adjusted R2 and predicted R2 are 0.9901 and 0.954, respectively; the two values are very close. The signal-to-noise ratio is much greater than 4. According to the above data analysis, it is shown that the quadratic function fits well.
Figure 11a is the Normal Plot of Residuals, and its residuals are normally distributed, indicating that the model fits well. Figure 11b is the relationship between the actual value and the predicted value. Additionally, the predicted value and the actual value are roughly distributed on a straight line, which indicates that the response value of the model can roughly reflect the actual value of the model.
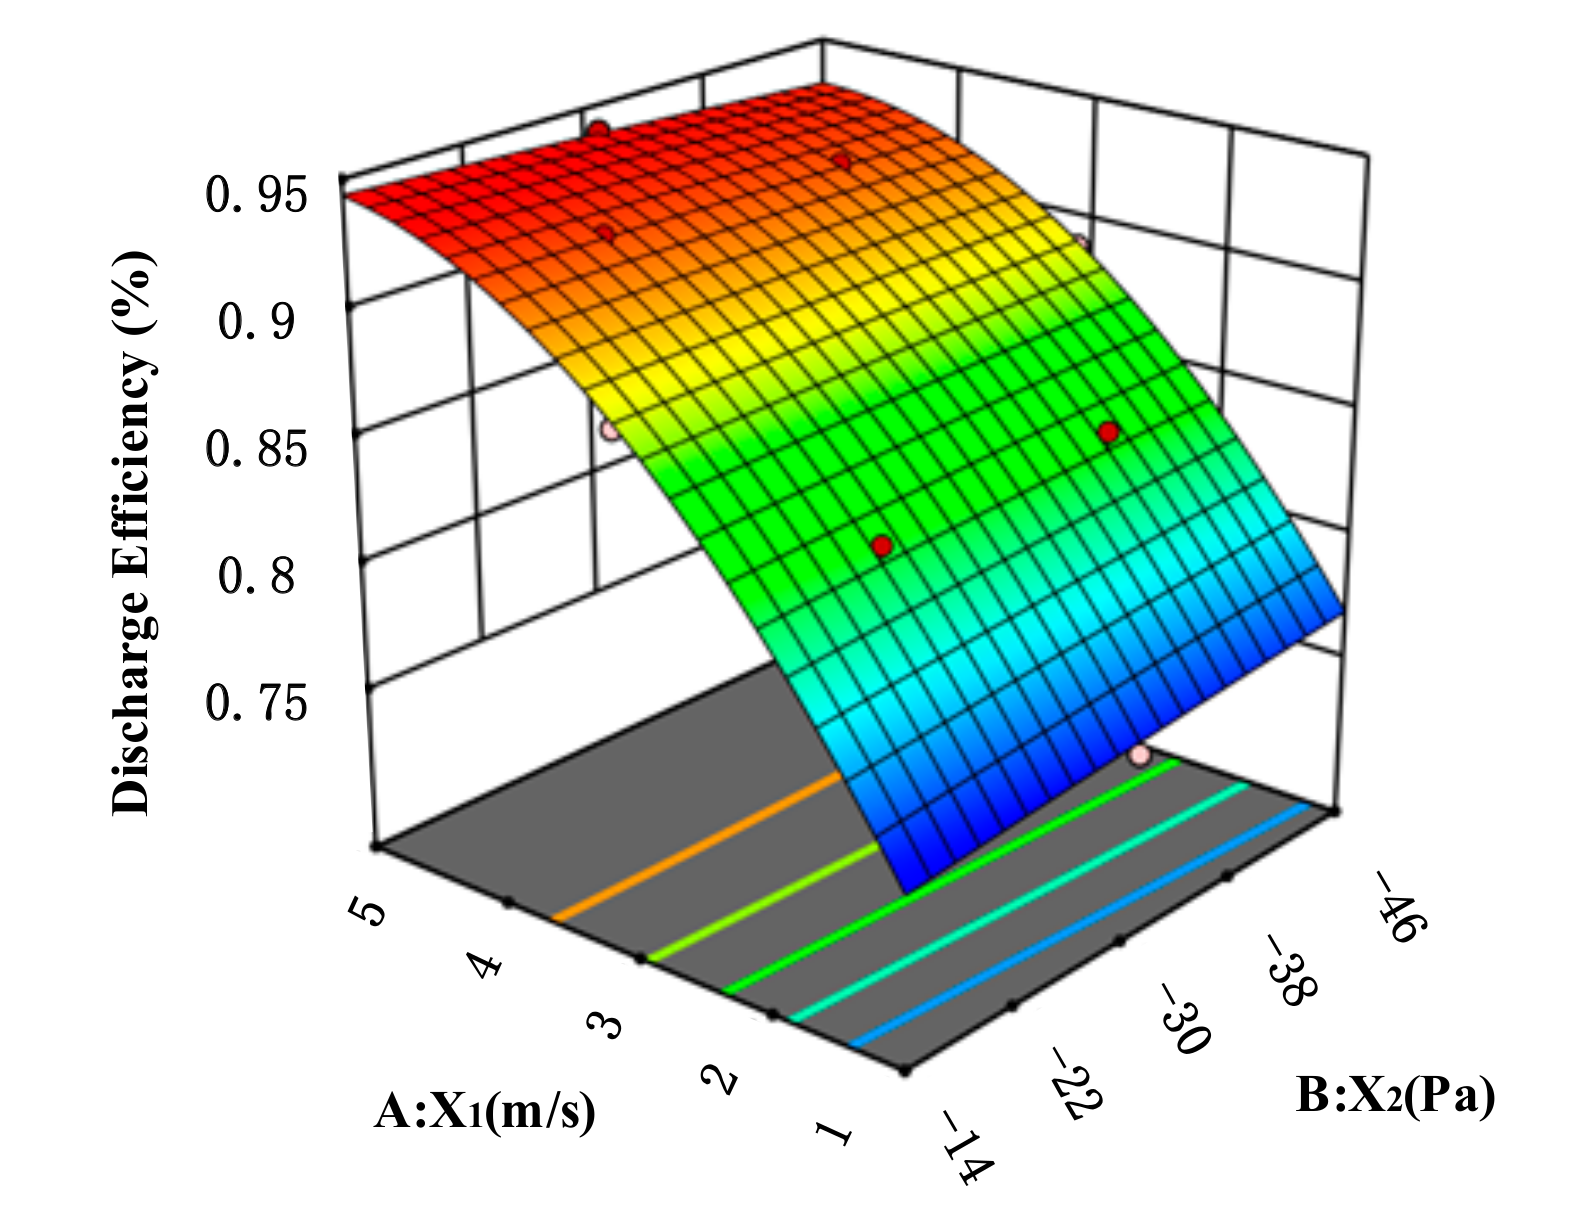
Figure 12 shows the influence of various factors on the emission efficiency. It can be seen from the figure that, as the velocity of the inlet airflow continues to increase, the emission efficiency continues to increase, but after the velocity exceeds 4 m/s, the effect on the emission efficiency becomes less and less obvious. When the velocity of the inlet airflow is low, the lower the pressure at the exhaust outlet and the higher the emission efficiency; but when the velocity is higher, the lower the pressure at the exhaust outlet and as a result, the emission efficiency gradually decreases, which clearly shows that pressure has a smaller effect on the emission efficiency than the velocity of the inlet airflow.
Through the above analysis, the model is suitable for the study, and the regression equation of the emission efficiency can be obtained as follows:
4.2.2. Security Coefficient
After importing the simulation results into Design-Expert, the results are fitted by the least squares method. Table 7 presents the analysis of variance for the quadratic equation. Table 7 shows that the p value of the model is less than 0.0001, which indicates that the model is extremely significant. The determination coefficient R2 = 0.9784 is greater than 0.95, which indicates that the model has a relatively high reliability. The values of adjusted R2 and predicted R2 are very close; the signal-to-noise ratio is much greater than 4. According to the above data analysis, it is shown that the quadratic function fits well.
Figure 13a is the Normal Plot of Residuals, and Figure 13b is the relationship between the actual value and the predicted value. Through analysis, it can be known that the regression equation fits well with the sample data.
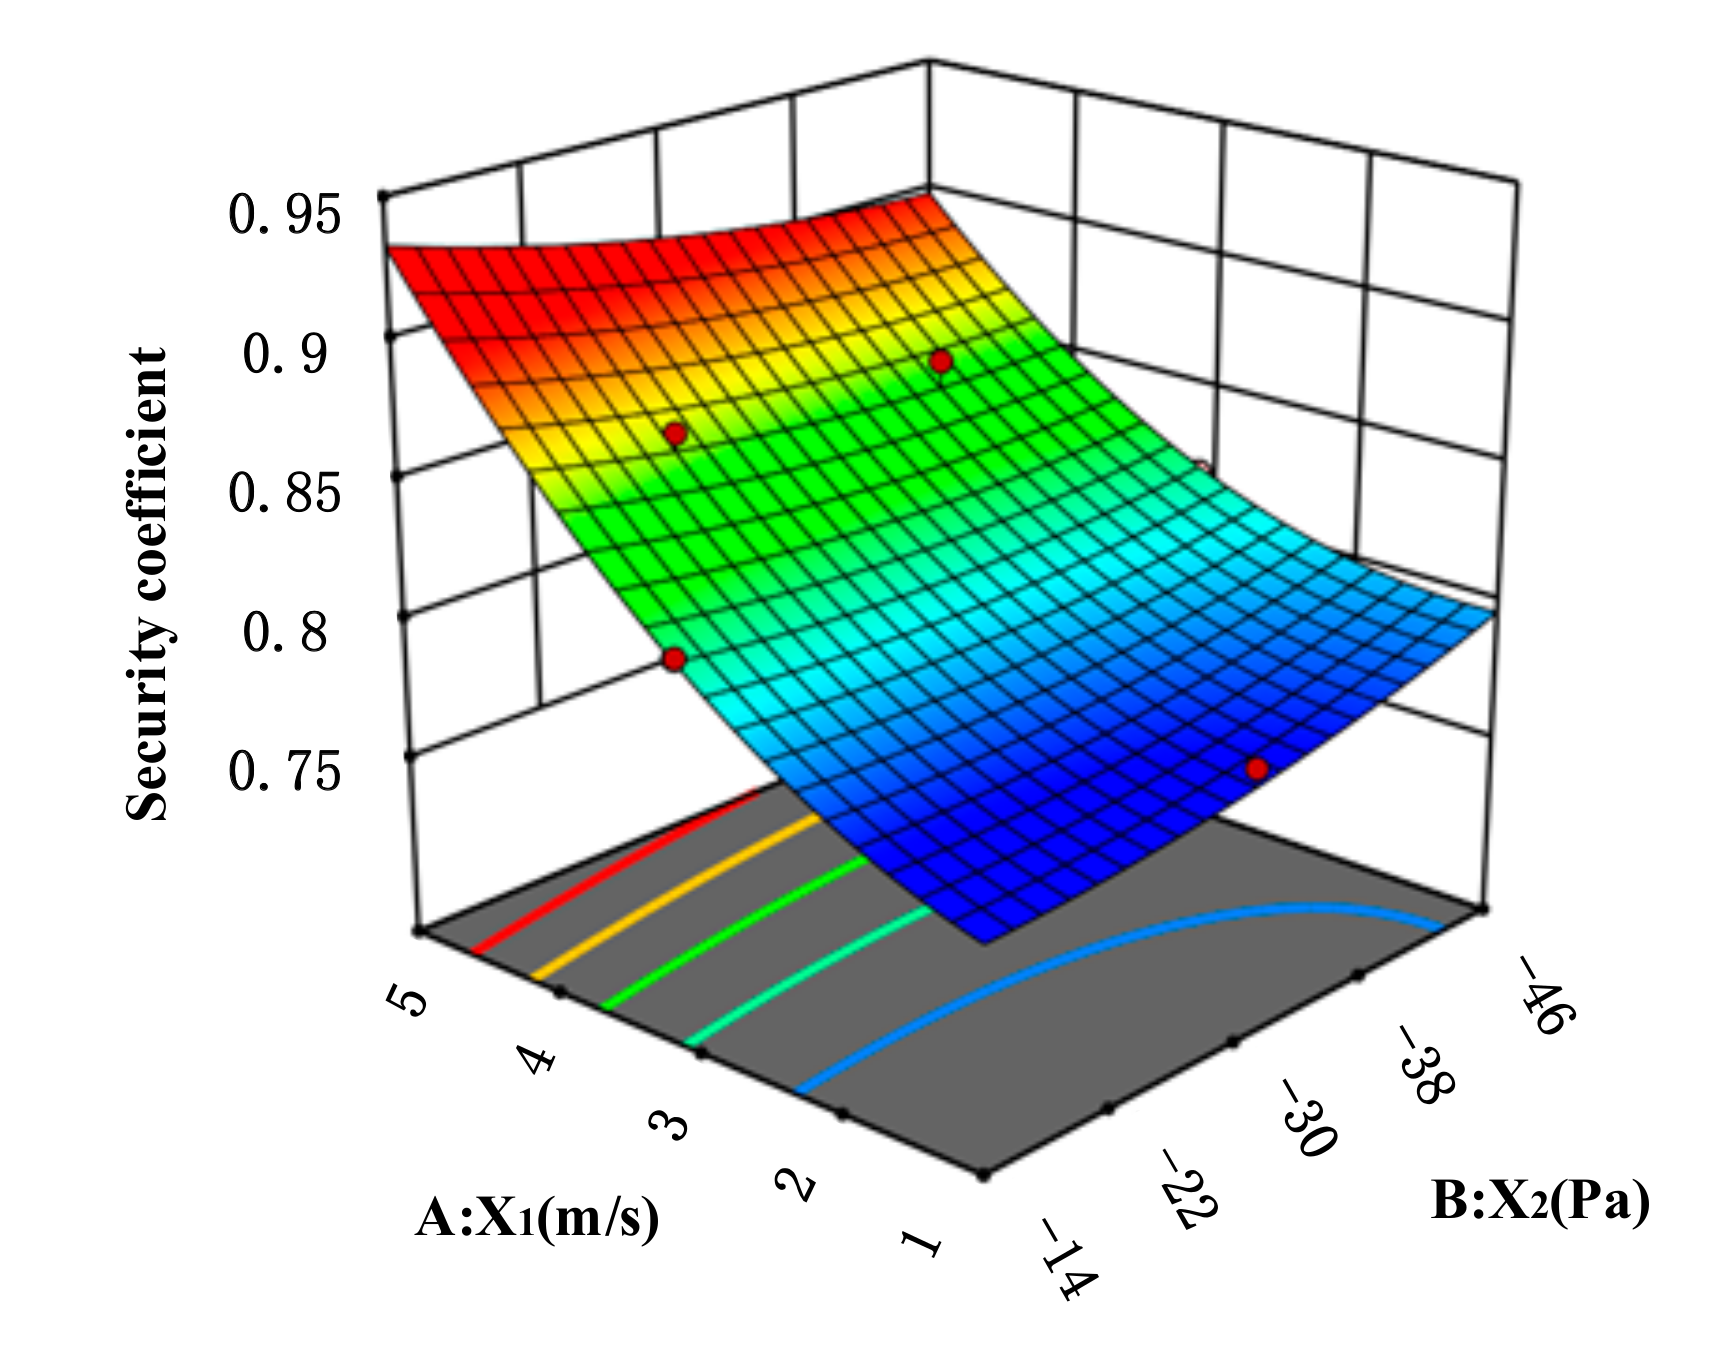
Figure 14 shows the influence of various factors on the security coefficient. It can be seen from the figure that, as the velocity of the inlet airflow continues to increase, the security coefficient continues to increase. When the velocity of the inlet airflow is low, the lower the pressure at the exhaust outlet and the higher the security coefficient; but when the velocity is higher, the lower the pressure at the exhaust outlet; as a result the security coefficient gradually decreases, which clearly shows that the velocity of the inlet airflow has a greater influence on the security coefficient than the pressure at the exhaust outlet.
Through the above analysis, the model is suitable for the study, and the regression equation of the security coefficient can be obtained as follows:
4.3. Optimization Results
Through the analysis of the above data in the Design-Expert software, the regression Equations (7) and (8) are solved for the maximum value. When the velocity of the inlet airflow is 5 m/s and the pressure of the negative-pressure exhaust outlet is −14 Pa, the emission efficiency and security coefficient of the medical cabin within the negative-pressure ambulance are 88.781% and 0.933, respectively, which are the optimal values in the data.
5. Infection Risk Assessment
Infection risk assessments [22,23] are very useful in understanding the transmission dynamics of infectious diseases and in predicting the risk of these diseases to the public. This study explored the use of the spatial distribution of exhaled droplet particles and the viability functions of airborne viruses to assess the infection risk of EMS workers in the medical cabin under imperfectly mixed conditions [24]. The Wells-Riley model [6] and the dose-response model [25] are two models that are widely used in the infection risk assessment of airborne diseases. Although the Wells-Riley model has been widely used in the quantitative infection risk assessment of indoor respiratory tract infectious diseases, the Wells-Riley model assumes that the air in the room is well mixed and relies on the infectiousness calculated in the reverse direction and the intensity of the source of infection, which leads to large errors in the infection risk assessment. Therefore, this study adopts a dose-response model to assess the infection risk of EMS workers in the medical cabin, which is more in line with the characteristics of incomplete mixing of droplet particles in the article.
5.1. Model of Infection Risk Assessment
In order to analyze the spatial distribution of exhaled droplet particles under the condition of incomplete mixing of indoor air, Sze-To et al. introduced the relevant factors of aerodynamic size in 2008; the mathematical model of the exposure level [25] is as follows:
where represents the initial concentration of virus/phage in respiratory fluid (pfu/mL); represents the pulmonary ventilation rate (l/min); represents exposure/sampling time interval (min); represents the volume concentration of droplet particles that change with time at place; and represents viability function of virus/phage (%).
Finally, a risk assessment model for the probability of infection in susceptible populations is formed. The dose-response model is as follows:
where represents the fitting parameter; represents the fraction of exposure dose reaching the target; and represents frequency of coughing/sneezing (min).
5.2. Establishment of Respiratory Zone and Prediction of Infection Probability
The infection risk for people in the medical cabin is mainly related to exposure level in the respiratory zone [26,27]. The infection risk of sitting EMS workers is mainly related to the concentration of droplet particles in the sitting respiratory zone, and the infection risk of EMS workers who bend over to work is mainly related to the concentration of droplet particles in the working respiratory zone. In this study, we determined that the space area with a height of 1.1 m is the sitting respiratory zone, and the space area with a height of 0.5 m is the working respiratory zone for EMS workers, focusing on the risk of infection in the respiratory zone.
The infection risk assessment and analysis are carried out on the top SAOM with a better emission efficiency and security coefficient, and a graph of the concentration of droplet particles in the respiratory zone over time during sneezing is obtained, as shown in Figure 15. By searching the literature [28,29], taking a patient suffering from influenza as an example, and are and 1, respectively, and the initial concentration is TCID50 in the infection risk assessment. Assuming that the pulmonary ventilation rate is 9.62 L/min and the sneeze frequency is 1, the volume concentration of droplet particles can be obtained by fitting the respiratory zone concentration-curve graph through MATLAB software. By consulting the data and summarizing the experimental data [30,31,32] in the literature, the equation of virus viability can be simplified as . The environmental parameters in the medical cabin in this study are relatively close to those in the literature, so can be set to a value of 0.2 and can be set to a value of 0.9. Substituting the above parameters into Equations (9) and (10), the infection probability diagrams of the standing respiratory zone and the working respiratory zone are obtained, respectively, as shown in Figure 16.
Through the comparison and analysis of Figure 16, combined with Figure 8 in the third section, due to the strong airflow when the patient sneezes, the infection probability of the sitting respiratory zone and the working respiratory zone rises sharply at 0–3 s. With the rapid spread of droplets in the medical cabin, the infection probability reaches its peak at about 5 s. Then, as the negative-pressure exhaust outlet discharges the droplets out of the medical cabin, the infection probability gradually decreases after 10 s and gradually approaches zero after 45 s. Since the height of the working respiratory zone is lower than that of the sitting respiratory zone, EMS workers will be exposed to more droplet particles when bending over to treat patients, and the risk of infection is higher than that of the sitting respiratory zone.
6. Conclusions
- (1)
- According to the classification and design principles of the airflow organization, the side SAOM and the top SAOM that meet the airflow path requirements are designed on the basis of the front SAOM. According to the simulation of the three airflow organization models, the distribution state diagrams of the droplet particles of different models when coughing and sneezing are obtained, and the influence of different supply airflow organization on the movement of the droplet particles is compared and analyzed. The simulation results show that the side SAOM and the top SAOM have a strong influence on the movement of droplet particles. Through statistical data on droplets particles, the emission efficiency and security coefficient of the three models are compared and analyzed, and it is concluded that the top SAOM has a high emission efficiency and a high security coefficient for EMS workers. Therefore, we can obtain the general principle of design of the medical cabin: the air supply inlets should be as close as possible to the EMS workers, and the negative-pressure exhaust outlet should be far away from the EMS workers and as close as possible to the mouth of the patient.
- (2)
- On the basis of the top SAOM, the response surface optimization of this model is carried out, taking into account that the velocity of the inlet airflow and the pressure of the negative-pressure exhaust outlet have a greater impact on the emission efficiency and security coefficient. Through response surface analysis, it is known that the optimal effect is achieved when the velocity of the inlet is 5 m/s and the pressure of the negative-pressure exhaust outlet is −14 Pa.
- (3)
- According to the characteristics of the medical cabin within the negative-pressure ambulance, a dose-response model is selected to assess the infection risk of EMS workers. First, we establish the sitting respiratory zone and working respiratory zone of EMS workers, then we predict the infection probability of the two respiratory zones of the top SAOM, and finally we obtain the infection probability diagrams of the respiratory zone of EMS workers. Through comparison and analysis, it is concluded that the infection probability of the working respiratory zone is higher than that of sitting respiratory zone. The research results are significant for improving the ability of negative-pressure ambulances to prevent cross-infection.
Author Contributions
Conceptualization, L.Z. and S.Z.; Methodology, L.Z. and S.Z.; Software, L.Z.; Validation, L.Z. and S.Z.; Formal Analysis, L.Z.; Investigation, L.Z. and S.Z.; Resources, S.Z.; Data Curation, L.Z.; Writing-Original Draft Preparation, L.Z.; Writing-Review & Editing, S.Z. and L.Z.; Visualization, L.Z.; Supervision, S.Z.; Project Administration, S.Z.; Funding Acquisition, S.Z. All authors have read and agreed to the published version of the manuscript.
Funding
The research is partially funded by National Key R&D Program of China (No. 2017YFC0804805).
Institutional Review Board Statement
Not applicable.
Informed Consent Statement
Not applicable.
Data Availability Statement
Not applicable.
Conflicts of Interest
The authors declare no conflict of interest.
References
- Cheema, Z.S. “It’s the Same Cause”: Climate Change and COVID-19 in the Perspectives of Environmental Feminist Activists. Fem. Stud. 2020, 46, 684–693. [Google Scholar] [CrossRef]
- Higginson, R.; Parry, A.; Williams, M.; Jones, B. Paramedics and pneumonia associated with COVID-19. J. Paramed. Pract. 2020, 12, 179–185. [Google Scholar] [CrossRef]
- Liao, J.; Wu, J. Development path and urgency of further strengthening construction of public hospitals based on novel coronavirus pneumonia treatment. Curr. Med. Sci. 2020, 40, 290–294. [Google Scholar] [CrossRef] [PubMed] [Green Version]
- Hao, W.D.; Li, M.X. Implications of infection prevention and control measures from a patient with atypical 2019 novel coronavirus pneumonia. Mayo Clin. Proc. Elsevier 2020, 95, 856–857. [Google Scholar] [CrossRef]
- Riley, R.L.; O’Grady, F. Airborne Infection: Transmission and Control; The Macmillan Company: New York, NY, USA, 1961. [Google Scholar]
- Wells, W.F. Airborne Contagion and Air Hygiene: An Ecological Study of Droplet Infection; Harvard University Press: Cambridge, MA, USA, 1955. [Google Scholar]
- Xu, X. Numerical Simulation and Experimental Research for Airflow inside Compartment of Emergency Ambulance with Negative-pressure Protection. Contam. Control Air Cond. Technol. 2009, 3, 41–46. [Google Scholar]
- Sun, J.G.; Liu, Y.J.; Xu, X.X.; Qi, J.C.; Liu, Z.G.; Tan, S.L. Negative air pressure and filter system in the ambulance for transferring infectious patients. Bull. Acad. Mil. Med. Sci. 2004, 28, 125–361. [Google Scholar]
- Lyng, J.W. Development of a Negative Pressure Isolation System for Containment, Filtration, and Disinfection of Airborne Diseases for Use in Hospitals, Ambulances, and Alternate Care Settings. In Proceedings of the 2021 Design of Medical Devices Conference, Minneapolis, MN, USA, 12–15 April 2021. [Google Scholar]
- Brown, A.; Schwarcz, L.; Counts, C.R.; Barnard, L.M.; Yang, B.Y.; Emert, J.M.; Latimer, A.; Drucker, C.; Lynch, J.; Kudenchuk, P.J.; et al. Risk for acquiring coronavirus disease illness among emergency medical service personnel exposed to aerosol-generating procedures. Emerg. Infect. Dis. 2021, 27, 2340–2348. [Google Scholar] [CrossRef]
- Hu, D.K.; Rong, X.C.; Luo, Y. Numerical simulation and thermal comfort analysis of indoor air distribution in large space buildings. Heat. Vent. Air Cond. 2006, 36, 12–16. [Google Scholar]
- Wang, J.X.; Cao, X.; Chen, Y.P. An air distribution optimization of hospital wards for minimizing cross-infection. J. Clean. Prod. 2021, 279, 123431. [Google Scholar] [CrossRef]
- Chen, S.C.; Chio, C.P.; Jou, L.J.; Liao, C.M. Viral kinetics and exhaled droplet size affect indoor transmission dynamics of influenza infection. Indoor Air 2009, 19, 401–413. [Google Scholar] [CrossRef]
- Zaheer, Q.; Masud, J. Comparison of Flow Field Simulation of Liquid Ejector Pump using Standard K-ε and Embedded LES Turbulence Modelling Techniques. J. Appl. Fluid Mech. 2018, 11, 385–395. [Google Scholar] [CrossRef]
- Pandey, K.M.; Baishya, A.; Singh, V.B. A Comparative Study of Cantilevered Ramp Injector with Standard k-ε and RNG k-ε Turbulence Models. Int. J. Chem. Eng. Appl. 2011, 2, 352–358. [Google Scholar] [CrossRef]
- Rashidi, S.; Esfahani, J.A.; Ellahi, R. Convective Heat Transfer and Particle Motion in an Obstructed Duct with Two Side by Side Obstacles by Means of DPM Model. Appl. Sci. 2017, 7, 431. [Google Scholar] [CrossRef] [Green Version]
- Adnan, M.; Sun, J.; Ahmad, N.; Wei, J.J. Comparative CFD modeling of a bubbling bed using a Eulerian–Eulerian two-fluid model (TFM) and a Eulerian-Lagrangian dense discrete phase model (DDPM). Powder Technol. 2021, 383, 418–442. [Google Scholar] [CrossRef]
- Li, Q.; Rudolph, V.; Wang, F.Y.; Horio, M. A Study of Particle Packing Compression under Fluid Drag Force by DEM Simulations. Dev. Chem. Eng. Miner. Processing 2005, 13, 693–708. [Google Scholar] [CrossRef]
- Arnold, O. Turbulent vortex rings in weakly turbulent and in turbulent ambient flow. J. Turbul. 2016, 17, 1179–1198. [Google Scholar] [CrossRef]
- Nikulin, V.V. Mass Exchange between the Atmosphere of Turbulent Vortex Ring and the Surrounding Medium. Fluid Dyn. 2021, 56, 473–480. [Google Scholar] [CrossRef]
- Box, G.E.P.; Wilson, K.B. On the experimental attainment of optimum conditions. J. R. Stat. Soc. Ser. B Methodol. 1951, 13, 1–38. [Google Scholar] [CrossRef]
- Wan, M.P.; Sze-To, G.N.; Chao, C.Y.H.; Fang, L.; Melikov, A.K. Modeling the Fate of Expiratory Aerosols and the Associated Infection Risk in an Aircraft Cabin Environment. Aerosol Sci. Technol. 2009, 43, 322–343. [Google Scholar] [CrossRef]
- Nicas, M.; Best, D. A study quantifying the hand-to-face contact rate and its potential application to predicting respiratory tract infection. J. Occup. Environ. Hyg. 2008, 5, 347–352. [Google Scholar] [CrossRef]
- Tung, Y.C.; Hu, S.C. Infection Risk of Indoor Airborne Transmission of Diseases in Multiple Spaces. Archit. Sci. Rev. 2008, 51, 14–20. [Google Scholar] [CrossRef]
- Sze-To, G.N.; Wan, M.P.; Chao, C.Y.H.; Wei, F.; Yu, S.C.; Kwan, J.K. A methodology for estimating airborne virus exposures in indoor environments using the spatial distribution of expiratory aerosols and virus viability characteristics. Indoor Air 2008, 18, 425–438. [Google Scholar] [CrossRef] [PubMed]
- Lu, F.; Shen, B.; Yuan, P.; Li, S.; Sun, Y.; Mei, X. The emission of PM2. 5 in respiratory zone from Chinese family cooking and its health effect. Sci. Total Environ. 2019, 654, 671–677. [Google Scholar] [CrossRef] [PubMed]
- Mehrifar, Y.; Zeverdegani, S.K.; Rismanchian, M. Chemical pollutants in the respiratory zone of welders: Determination of concentrations and hazard analysis. Work 2020, 67, 591–598. [Google Scholar] [CrossRef] [PubMed]
- Alford, R.H.; Kasel, J.A.; Gerone, P.J.; Knight, V. Human influenza resulting from aerosol inhalation. Proc. Soc. Exp. Biol. Med. 1966, 122, 800–804. [Google Scholar] [CrossRef] [PubMed]
- Kilbourne, E.D. The influenza viruses and influenza. Br. Med. J. 1976, 1, 465. [Google Scholar]
- Hemmes, J.H.; Winkler, K.C.; Kool, S.M. Virus survival as a seasonal factor in influenza and poliomyelitis. Antonie Van Leeuwenhoek 1962, 28, 221–233. [Google Scholar] [CrossRef]
- Schaffer, F.L.; Soergel, M.E.; Straube, D.C. Survival of airborne influenza virus: Effects of propagating host, relative humidity, and composition of spray fluids. Arch. Virol. 1976, 51, 263–273. [Google Scholar] [CrossRef]
- Yang, Y.; Sze-To, G.N.; Chao, C.Y.H. Estimation of the aerodynamic sizes of single bacterium-laden expiratory aerosols using stochastic modeling with experimental validation. Aerosol Sci. Technol. 2012, 46, 1–12. [Google Scholar] [CrossRef] [Green Version]
Figure 1.
Diagram of negative-pressure ambulance.

Figure 2.
Diagram of three types of supply airflow organization models. (a) The front SAOM; (b) The side SAOM; (c) The top SAOM.
Figure 2.
Diagram of three types of supply airflow organization models. (a) The front SAOM; (b) The side SAOM; (c) The top SAOM.

Figure 3.
Distribution diagram of droplet particles during coughing in the front SAOM. (a) 6 s; (b) 20 s; (c) 80 s; (d) 120 s.
Figure 3.
Distribution diagram of droplet particles during coughing in the front SAOM. (a) 6 s; (b) 20 s; (c) 80 s; (d) 120 s.

Figure 4.
Distribution diagram of droplet particles during sneezing in the front SAOM. (a) 2 s; (b) 8 s; (c) 40 s; (d) 120 s.
Figure 4.
Distribution diagram of droplet particles during sneezing in the front SAOM. (a) 2 s; (b) 8 s; (c) 40 s; (d) 120 s.


Figure 5.
Distribution diagram of droplet particles during coughing in the side SAOM. (a) 6 s; (b) 20 s; (c) 80 s; (d) 120 s.
Figure 5.
Distribution diagram of droplet particles during coughing in the side SAOM. (a) 6 s; (b) 20 s; (c) 80 s; (d) 120 s.

Figure 6.
Distribution diagram of droplet particles during sneezing in the side SAOM. (a) 2 s; (b) 8 s; (c) 40 s; (d) 120 s.
Figure 6.
Distribution diagram of droplet particles during sneezing in the side SAOM. (a) 2 s; (b) 8 s; (c) 40 s; (d) 120 s.

Figure 7.
Distribution diagram of droplet particles during coughing in the top SAOM. (a) 6 s; (b) 20 s; (c) 80 s; (d) 120 s.
Figure 7.
Distribution diagram of droplet particles during coughing in the top SAOM. (a) 6 s; (b) 20 s; (c) 80 s; (d) 120 s.

Figure 8.
Distribution diagram of droplet particles during sneezing in the top SAOM. (a) 2 s (b) 8 s; (c) 40 s (d) 120 s.
Figure 8.
Distribution diagram of droplet particles during sneezing in the top SAOM. (a) 2 s (b) 8 s; (c) 40 s (d) 120 s.

Figure 9.
The comparison of emission efficiency of the three models. (a) Coughing (b) Sneezing.

Figure 10.
The comparison of security coefficient of the three models. (a) Coughing (b) Sneezing.

Figure 11.
Schematic diagram of model reliability analysis. (a) Normal Plot of Residuals (b) Predicted vs. Actual.
Figure 11.
Schematic diagram of model reliability analysis. (a) Normal Plot of Residuals (b) Predicted vs. Actual.

Figure 12.
The influence of different factors on emission efficiency.

Figure 13.
Schematic diagram of model reliability analysis. (a) Normal Plot of Residuals (b) Predicted vs. Actual.
Figure 13.
Schematic diagram of model reliability analysis. (a) Normal Plot of Residuals (b) Predicted vs. Actual.

Figure 14.
The influence of different factors on the security coefficient.

Figure 15.
Concentration-time diagram of different respiratory zones. (a) Sitting respiratory zone (b) Working respiratory zone.
Figure 15.
Concentration-time diagram of different respiratory zones. (a) Sitting respiratory zone (b) Working respiratory zone.

Figure 16.
Infection probability diagram of different respiratory zones. (a) Sitting respiratory zone (b) Working respiratory zone.
Figure 16.
Infection probability diagram of different respiratory zones. (a) Sitting respiratory zone (b) Working respiratory zone.


Table 1.
Parameters of droplet particles.
| Parameter | Value of Number |
|---|---|
| Particle density (kg/m3) | 1000 |
| Particle diameter (μm) | 1–100 |
| Incident velocity of cough (m/s) | 10 |
| Incident velocity of sneeze (m/s) | 40 |
| Time of injection (s) | 1 |
Table 2.
The influence of three airflow organization models on the movement of droplets during coughing.
Table 2.
The influence of three airflow organization models on the movement of droplets during coughing.
| The Front SAOM | The Side SAOM | The Top SAOM | |
|---|---|---|---|
| Number of droplets left in the medical cabin | 525 | 50 | 38 |
| Number of droplets discharged from negative-pressure exhaust outlet | 1332 | 2084 | 2094 |
| Number of droplets trapped by EMS workers | 523 | 246 | 248 |
| The total number of droplets emitted by the patient when coughing | 2380 | 2380 | 2380 |
Table 3.
The influence of three airflow organization models on the movement of droplets during sneezing.
Table 3.
The influence of three airflow organization models on the movement of droplets during sneezing.
| The Front SAOM | The Side SAOM | The Top SAOM | |
|---|---|---|---|
| Number of droplets left in the medical cabin | 1254 | 428 | 338 |
| Number of droplets discharged from negative-pressure exhaust outlet | 975 | 1772 | 2290 |
| Number of droplets trapped by EMS workers | 1171 | 1200 | 772 |
| The total number of droplets emitted by the patient when sneezing | 3400 | 3400 | 3400 |
Table 4.
Factors and levels of response surface testing.
| Factor Level | −2 | −1 | 0 | 1 | 2 |
|---|---|---|---|---|---|
| Velocity of the inlet airflow X1(m/s) | 1 | 2 | 3 | 4 | 5 |
| Pressure of the exhaust outlet X2(Pa) | −46 | −38 | −30 | −22 | −14 |
Table 5.
Design and data of response surface experiments.
| Test Number | Velocity X1 (m/s) | Pressure X2 (Pa) | Emission Efficiency (%) | Security Coefficient |
|---|---|---|---|---|
| 1 | 3 | −46 | 77.65 | 0.817 |
| 2 | 2 | −22 | 67.88 | 0.775 |
| 3 | 4 | −22 | 85.29 | 0.866 |
| 4 | 3 | −30 | 77.62 | 0.812 |
| 5 | 5 | −30 | 87.85 | 0.901 |
| 6 | 3 | −30 | 77.62 | 0.812 |
| 7 | 1 | −30 | 51.03 | 0.779 |
| 8 | 4 | −38 | 84.85 | 0.861 |
| 9 | 3 | −14 | 77.15 | 0.821 |
| 10 | 2 | −38 | 68.94 | 0.787 |
| 11 | 3 | −30 | 77.62 | 0.812 |
| 12 | 3 | −30 | 77.62 | 0.812 |
| 13 | 3 | −30 | 77.62 | 0.812 |
Table 6.
ANOVA for the quadratic model.
| Source | Sum of Square | df | Mean Square | F-Value | p Value | |
|---|---|---|---|---|---|---|
| Model | 1055.30 | 5 | 211.06 | 240.23 | <0.0001 | significant |
| A-X1 | 953.37 | 1 | 953.37 | 1085.14 | <0.0001 | |
| B-X2 | 0.2187 | 1 | 0.2187 | 0.2489 | 0.6331 | |
| AB | 0.5625 | 1 | 0.5625 | 0.6402 | 0.4499 | |
| A2 | 93.86 | 1 | 93.86 | 106.84 | <0.0001 | |
| B2 | 0.0264 | 1 | 0.0264 | 0.0301 | 0.8672 | |
| Residual | 6.15 | 7 | 0.8786 | |||
| Cor Total | 1061.45 | 12 |
R2 = 0.9942, Adjusted R2 = 0.9901, Predicted R2 = 0.9540, Adeq Precision = 55.9896.
Table 7.
ANOVA for the quadratic model.
| Source | Sum of Square | df | Mean Square | F-Value | p Value | |
|---|---|---|---|---|---|---|
| Model | 0.0151 | 5 | 0.0030 | 63.38 | <0.0001 | significant |
| A-X1 | 0.0139 | 1 | 0.0139 | 291.69 | <0.0001 | |
| B-X2 | 8.333 × 10⁻⁸ | 1 | 8.333 × 10⁻⁸ | 0.0017 | 0.9679 | |
| AB | 0.0001 | 1 | 0.0001 | 1.51 | 0.2586 | |
| A2 | 0.0011 | 1 | 0.0011 | 23.67 | 0.0018 | |
| B2 | 0.0001 | 1 | 0.0001 | 1.51 | 0.2586 | |
| Residual | 0.0003 | 7 | 0.0000 | |||
| Cor Total | 0.0155 | 12 |
R2 = 0.9784, Adjusted R2 = 0.9630, Predicted R2 = 0.7813, Adeq Precision = 29.0284.
Publisher’s Note: MDPI stays neutral with regard to jurisdictional claims in published maps and institutional affiliations. |
© 2022 by the authors. Licensee MDPI, Basel, Switzerland. This article is an open access article distributed under the terms and conditions of the Creative Commons Attribution (CC BY) license (https://creativecommons.org/licenses/by/4.0/).
Share and Cite
MDPI and ACS Style
Zhou, S.; Zhang, L. Research on Airflow Optimization and Infection Risk Assessment of Medical Cabin of Negative-Pressure Ambulance. Sustainability 2022, 14, 4900. https://doi.org/10.3390/su14094900
AMA Style
Zhou S, Zhang L. Research on Airflow Optimization and Infection Risk Assessment of Medical Cabin of Negative-Pressure Ambulance. Sustainability. 2022; 14(9):4900. https://doi.org/10.3390/su14094900
Chicago/Turabian StyleZhou, Shuwen, and Liwei Zhang. 2022. "Research on Airflow Optimization and Infection Risk Assessment of Medical Cabin of Negative-Pressure Ambulance" Sustainability 14, no. 9: 4900. https://doi.org/10.3390/su14094900
Note that from the first issue of 2016, this journal uses article numbers instead of page numbers. See further details here.